Embed Size (px)
Citation preview

Tilburg University
2019 Corporate Venturing Report
Eckblad, Joshua; Gutmann, Tobias; Lindener, Christian
Document version:Publisher's PDF, also known as Version of record
Publication date:2019
Link to publication
Citation for published version (APA):Eckblad, J., Gutmann, T., & Lindener, C. (2019). 2019 Corporate Venturing Report. Corporate VenturingResearch Group, TiSEM, Tilburg University.
General rightsCopyright and moral rights for the publications made accessible in the public portal are retained by the authors and/or other copyright ownersand it is a condition of accessing publications that users recognise and abide by the legal requirements associated with these rights.
- Users may download and print one copy of any publication from the public portal for the purpose of private study or research - You may not further distribute the material or use it for any profit-making activity or commercial gain - You may freely distribute the URL identifying the publication in the public portal
Take down policyIf you believe that this document breaches copyright, please contact us providing details, and we will remove access to the work immediatelyand investigate your claim.
Download date: 13. Jun. 2020

Corporate Venturing 2019Report
All Rights Reserved. Copyright © 2019. Created by Joshua Eckblad, Academic Researcher at TiSEM in The Netherlands.
SUMMIT@RSM

All Rights Reserved. Copyright © 2019. Created by Joshua Eckblad, Academic Researcher at TiSEM in The Netherlands.
SUMMIT@RSM
The information contained herein is for general guidance on matters of interest, and intended for the personal use of the reader only. The analyses and conclusions are based on publicly available information, Pitchbook, CBInsights and information provided in the course of recent surveys with a sample of startups and corporate firms.
Wayra Germany GmbH (“Wayra”) accepts no liability for any actions taken as response hereto. Wayra does not make investment recommendations, and nothing in this report should be interpreted as an opinion by Wayra either on market forecasts or on
the prospects of specific companies. While every attempt has been made to ensure that the information contained in this report has been obtained and arranged with due care, Wayra is not responsible for any inaccuracies, errors or omissions contained in or relating to, this information. No information herein may be replicated without prior consent by Wayra.
Wayra Germany GmbH Kaufingerstraße 15 80331 München +49 89 414141 012 [email protected] http://de.wayra.co/
TABLE OF CONTENTS
03 Forewords 06 All Investors In External Startups 21 Corporate VC Investors 38 Accelerator Investors 43 2018 Global Startup Fundraising Survey (Our Results) 56 2019 Global Startup Fundraising Survey (Please Distribute)
LEAD AUTHORS
Joshua G. Eckblad
[email protected] https://www.corporateventuringresearch.org/ CentER PhD Candidate, Department of Management Tilburg School of Economics and Management (TiSEM) Tilburg University, The Netherlands
Dr. Tobias Gutmann
[email protected] https://www.corporateventuringresearch.org/ Post-Doctoral Researcher Dr. Ing. h.c. F. Porsche AG Chair of Strategic Management and Digital Entrepreneurship HHL Leipzig Graduate School of Management, Germany
Christian Lindener
[email protected] Managing Director Wayra Germany
LEGAL DISCLAIMER
Please distribute and cite our work: Eckblad, J., Gutmann, T., & Lindener, C. (2019, July 15). Report on Global Corporate Venturing Research Data. Retrieved from https://www.corporateventuringresearch.org/
2

When I set out to revamp Wayra Germany in 2017, I had no idea that the time for innovation vehicles being questioned had come — it was just common sense to build an innovation vehicle that impacts the Group. Since relaunching our vehicle towards an impact-driven approach, the innovation world has seen a brutal shift towards models that really pay into the growth and success of the mother company.
I am a practitioner — I have experience building and running corporate innovation programs. This report gives a reliable, data-driven view of how innovation vehicles are evolving and that investing in startup technologies has to be on every digital transformation agenda since this has become a valuable source for innovation.
I am very proud of what Joshua and Tobias have created with this report in terms of the quantity of data analyzed and the quality of insights based on real-world understanding. Thanks for pulling me in on this journey and for the opportunity to validate it from the practitioner’s perspective!
With innovation becoming more and more important, but also more and more complex for established companies, firms apply a seemingly simple tactic for success. Every year more and more firms set up separate innovation labs, hubs and accelerators to invest in start-ups or to set up their own ventures. These various modes are expected to offer companies new innovations, cultural changes and improved brand images by aligning the two worlds (corporates and startups).
But since both worlds are very different, and hardly anyone has an overview of what is needed on the one side and what is offered on the other, the achievement of these goals is far away. Of the more than 150 innovation hubs, perhaps 2 or 3 are actually successful.
„While Digital Innovation Units are becoming more mature, business traction is still very limited. “
That is not a surprise. Looking at the numbers, it is close to impossible to develop within a new unit the significant innovations that an established company needs to survive. By giving up the competitive advantages and strengths of the core business, corporate startups also face the same chances for success as every other startup out there. In a recent study, Bain & Company found that only 1 out of 17,000 startups in the US reach 500 million USD and profitable growth — these are the conditions of added value that an established firm actually needs.
Looking at these numbers, the operating model for innovation hubs seems dead, and I predict that the bubble will burst soon.
But innovation remains a number one priority for most companies. To increase the satisfaction with innovation performance that generates real business impact, a new operating model is required. Investing heavily in startups brings value to most firms, nevertheless orchestrating all innovation approaches: outside-in, inside-in and inside-out will help realize more of the potential. This is the first step towards the right direction as corporate firms continue to invest significantly in startups.
Christian Lindener Managing Director Wayra Germany [email protected]
THE SHIFT EVIDENCED
All Rights Reserved. Copyright © 2019. Created by Joshua Eckblad, Academic Researcher at TiSEM in The Netherlands.
SUMMIT@RSM
3

We are excited to share this data-driven report on corporate venturing with you, which sheds light on the state-of-the-art. This research presents meaningful insights using a broad coverage of data sources and data points.
I feel very privileged to be both a researcher and a practitioner of corporate venturing. Having seen numerous startups and companies ride the crest of the corporate venturing wave, I am breathing my passion for corporate firms’ search to spur future growth.
Some practitioners have been skeptical about corporate venturing, even going as far as describing this phenomenon as "corporate innovation theatre”. However, established companies engage in a multitude of activities to accelerate innovation and new business creation. Hence, corporate venturing activities are gaining more and more attention from researchers and practitioners – a phenomenon sometimes described as the resurgence of a ‘golden age’. Within just a few years, the corporate venturing landscape has changed: (1) more and more established companies invest increasing amounts of capital into corporate venturing activities, (2) new corporate venturing modes are becoming more prevalent, and (3) corporations are reflecting on the performance of their current venturing strategies.
The data presented in this report illustrate how there has been a sharp rise in the number of newly-founded corporate VCs since 2016. In addition, we found that 65 percent of active (engaged) corporate VCs were launched after 2010. This is a remarkable development, as the rapid rise of some corporate VC units suggests important differences between low and high performing corporate venturing units. High performing units are delivering value to startup ventures and may enjoy a competitive advantage.
In addition, my professional experience in corporate venturing was focused mainly on certain markets (e.g., US, Israel, and Europe), and so the data in this report on the rapid rise of Asia-based corporate VCs was particuarly surprsing to me. For example, six out of ten of the most active corporate VCs in 2018 are based in Asia. This signals high levels of available capital, vast numbers of startup ventures being created, and disproportionate access to enabling technologies.
Roughly two years ago, Joshua G. Eckblad and I joined forces with a long-term mission to…
• Build the leading insight engine into corporate venturing activities
• Bridge the gap between research and practice in corporate venturing
• Boost knowledge and provide valuable insights to practitioners engaged in corporate venturing
Dr. Tobias Gutmann Post-Doctoral Researcher [email protected]
LET THE DATA SPEAK!
All Rights Reserved. Copyright © 2019. Created by Joshua Eckblad, Academic Researcher at TiSEM in The Netherlands.
SUMMIT@RSM
4

The report delves into the most recent data on global investments in external startups, made by outside-in corporate venturing units. These units are on the rise and becoming increasingly active. US-based corporate VCs in 2018, for example, made the majority of total investments in external startups for the first time (PitchBook Analyst Note: The Golden Mean of Corporate Venture Capital, 2019).
The term “external corporate venturing” embodies a set of distinct modes that corporate firms use to engage with innovative, external startups. These modes, among others, include corporate venture capital (CVC), corporate accelerators, corporate innovation labs, and direct corporate minority investments.
The report covers two equity-based, outside-in corporate venturing modes: corporate VC and corporate accelerators. Also, given the interdependent investment relationship between corporate and private investors (i.e., private venture capital (VC) and private accelerators), we include an analysis of these investor classes in the first and last part of the report to provide context for external corporate venturing activities.
Significant discrepancies exist between various industry data sources on external corporate venturing, so every attempt is made to emphasize recent trends rather than absolute numerical datapoints. The fact that datasets differ is not so much an issue of quality, but more a reflection of complexity. Collecting sensitive, strategic data that is internal to corporate firms is sometimes incomplete in the first place.
Joshua G. Eckblad CentER PhD Candidate, Department of Management [email protected] https://www.corporateventuringresearch.org/
THE REPORT
Then, increasing the scope to a global scale exacerbates these gaps in data collection coverage. For this reason, our regression analyses are based on representative samples of active investors, for which we have complete data on all individual observations to ensure internal consistency and to reduce the chance of biased statistical estimates.
We present our analysis using seven parallel approaches:
• Population-level snapshot of investment behaviors • Longitudinal view of investment behaviors by year • Segmentation of investment behaviors by global region • Sample of top 1000 investors (all types) • Sample of 166 engaged corporate VCs • Sample of top 93 accelerators • Sample of 60 startups and portfolio companies
Main variables examined in the report:
• Capital invested ($USD) • Deal count • Deal type • Destination of capital invested • Investment count • Investor age • Investor HQ country
• Investor type • Investor year founded • Portfolio startup business stage • Portfolio startup count • Portfolio startup exit • Portfolio startup primary industry group • Portfolio startup primary industry sector • Startup evaluation of engagement with corporate investors • Startup perceptions of smart capital investors (all investor
classes) • Startup preferences for smart capital (all dimensions)
All Rights Reserved. Copyright © 2019. Created by Joshua Eckblad, Academic Researcher at TiSEM in The Netherlands.
SUMMIT@RSM
5

All Investor Classes in External Startups
01
All Rights Reserved. Copyright © 2019. Created by Joshua Eckblad, Academic Researcher at TiSEM in The Netherlands.
SUMMIT@RSM

Venture Financial Liquidity: Total Capital Invested & Deal Count (All Investor Types)
1999-2017
Deal
Cou
nt
0
10.000
20.000
30.000
Capi
tal I
nves
ted
(in b
illio
n US
dol
lars
)US$0B
US$233B
US$467B
US$700B
19992000
20012002
20032004
20052006
20072008
20092010
20112012
20132014
20152016
2017
Ascending Investments in External Startups
The two-axis figure depicts the rise in capital invested and deals made in external startups between 1999 2017and, by private and corporate investors around the globe.
There are numerous inflection points, but 2009 appears to be an important moment after which both capital invested and deal counts have intensified, rapidly.
7
All Rights Reserved. Copyright © 2019. Created by Joshua Eckblad, Academic Researcher at TiSEM in The Netherlands.
SUMMIT@RSM

Top 1000 Global Investors Past 5 Years
2014-2018
Investments are Precious
Very few of the Top Global Investors on our list made ~1,500 investments in external startups, whereas 72 percent of Top Investors made between 43 and 100 investments in external startups over the past 5 years (Power Law Distribution).
The four most active global investors in external startups during this period happen to be private accelerators: Y Combinator, 500 Startups, Plug and Play, and Techstars.
Deal
Cou
nt (P
ast 5
Yea
rs)
<100 Invest. 43 Invest.
72%
Top 1000 Global Investors (2014-2018)
1500 Investment Deals
8
All Rights Reserved. Copyright © 2019. Created by Joshua Eckblad, Academic Researcher at TiSEM in The Netherlands.
SUMMIT@RSM

78 Top Investors Founded in 2012
Top Investors are Fresh Entrants
The majority of the Top Global Investors on our list were founded after 2001. There are numerous inflection points over the course of history, but 2008 appears to be an important moment after which first-time investors in external startups rose rapidly to prominence. In fact, nearly 8 percent of Top Global Investors on our list were founded in 2012 alone.
Founded 20181924 2000
9
All Rights Reserved. Copyright © 2019. Created by Joshua Eckblad, Academic Researcher at TiSEM in The Netherlands.
SUMMIT@RSM

Share of Investment Count, by Investor Type
Corporate Venture Capital5,5 %
Private Venture Capital59 %
Accelerator/Incubator19,8 %
Private VCs Occupy a Privileged, Unique Position
Private venture capitalists (VCs) as a group made 59 percent of the total number of investment deals out of our list of top 1000 global investors, although four private accelerators made the greatest volume of investments in external startups over the past 5 years.
The dominant position of private VCs in capital markets reflects their priviledged and unique access to external startups. Private VCs may sometimes react to the signals of startup quality that emanate from prominent private accelerators (private acceleration typically precedes private VC investments). However, for the most part, private VCs rely on their own established, proprietary due diligence routines to source prospective high-quality startups. In contrast, corporate firms are routinely guided by prior private VC evaluations of a given external startup to source their deal pipelines for both corporate VCs and corporate accelerators. While private accelerator investments typically precede private VC investments in target startups, corporate VC investments are almost always made in partnership with a private VC in a later capital fundraising round.
This dynamic helps to explain, in part, the crucial role of private VCs within investment syndicates. The term “investment syndicates” refers to where multiple types of investors co-invest in a particular startup's capital fundraising round. Active, private VCs are more likely to attract the attention of high-quality startups and act as lead investor, which affords private VCs more bargaining power relative to other investor classes.
10
All Rights Reserved. Copyright © 2019. Created by Joshua Eckblad, Academic Researcher at TiSEM in The Netherlands.
SUMMIT@RSM

11
(571 Top Investors Based in the USA)
California-based Top Investors Made 39,991 Investments (2014-2018)
US-based Top Investors Made 67,159 Investments Between 2014-2018
NB: Each circle on the map indicates the location of a Top Investor’s HQ
All Rights Reserved. Copyright © 2019. Created by Joshua Eckblad, Academic Researcher at TiSEM in The Netherlands.
SUMMIT@RSM

(338 Top Investors Based in California)
12
California-based Top Investors Made 39,991 Investments (2014-2018)
Silicon Valley-based Top Investors Made 12,600 Investments Between 2014-2018
NB: Each circle on the map indicates the location of a Top Investor’s HQ
All Rights Reserved. Copyright © 2019. Created by Joshua Eckblad, Academic Researcher at TiSEM in The Netherlands.
SUMMIT@RSM

AlpInvest (267 investments) RockStart Accelerator (150 investments) KIC InnoEnergy (82 investments) Oost NL (67 investments) Brabantse Ontwikkelings Maatschappij (59 investments) Shell Ventures (49 investments) Merck Ventures (46 investments) Yes!Delft (45 investments) Life Sciences Partners (44 investments)
13
Top Investors HQ in The Netherlands Between 2014-2018
Berlin-based Top Investors Made 1,096 Investments (26 Top Investors Based in Germany)
London-based Top Investors Made 5,824 Investments (79 Top Investors Based in UK)
Amsterdam-based Top Investors Made 507 Investments (9 Top Investors Based in NL)
Paris-based Top Investors Made 4,550 Investments (56 Top Investors Based in France)
NB: Each circle on the map indicates the location of a Top Investor’s HQ
EUROPE
All Rights Reserved. Copyright © 2019. Created by Joshua Eckblad, Academic Researcher at TiSEM in The Netherlands.
SUMMIT@RSM

14
All Netherlands-based Investors (All Investor Types) / Primary Industry Sector Targets (Past 20 Years)
Amsterdam-based Top Investors Made 507 Investments (9 Top Investors Based in NL)
B2C13 %
Healthcare8 %
Energy19 %
Financial Services19 %
Materials & Resources11 %
B2B16 %
Information Technology14 %
B2C16 %
Healthcare12 %
Energy9 %
Financial Services5 %
Materials & Resources4 %
B2B28 %
Information Technology26 %
Global Capital
Investments
Global Deal
Count
EUROPE
All Rights Reserved. Copyright © 2019. Created by Joshua Eckblad, Academic Researcher at TiSEM in The Netherlands.
SUMMIT@RSM

15,130 Exits
IDG Capital Qiming Venture Partners Temasek Holdings Sequoia Capital China Matrix Partners China ZhenFund Sequoia Capital India 500 Startups (SE Asia) SAIF Partners East Ventures Northern Light Venture Capital Shunwei Capital Brand Capital
Hillhouse Capital Group Samsung Venture Investment Legend Capital Global Brain Horizons Ventures Morningside Group GSR Ventures Blume Venture Advisors Susquehanna Asia Investments Axilor Ventures Chiratae Ventures
15
(≳100 Investments Past 5 Years)
*Total capital invested by Asia-based investors has grown year-to-year since 2010. There are 102 Top Investors based in Asia with investment counts over the past 5 years that range between 43 and 333. There were 24 Asia-based Investors with 100 or more investment deals made between 2014 and 2018.
Beijing-based Top Investors Made 2,538 Investments (26 Top Investors Based in Beijing)
China-based Top Investors Made 4,694 Investments (51 Top Investors Based in China)
Singapore-based Top Investors Made 909 Investments (10 Top Investors Based in Singapore)
$2.90Tn Capital Invst.
30,420 Startups
40,690 Deals
Asia-based Investors (Past 20 years)
Top Investors HQ in Asia*
12,946 Investors
ASIA
All Rights Reserved. Copyright © 2019. Created by Joshua Eckblad, Academic Researcher at TiSEM in The Netherlands.
SUMMIT@RSM

Top Investors Headquartered in Asia
(Total Investments >46, Past 20 Years, Ordered)
16
IDG Capital Temasek Holdings Qiming Venture Partners Korea Investment Partners SAIF Partners Sequoia Capital China Brand Capital Matrix Partners China Samsung Venture Investment Northern Light Venture Capital Jafco (TKS: 8595) Sequoia Capital India ZhenFund Legend Capital Morningside Group East Ventures Susquehanna Asia Investments GSR Ventures 500 Startups (SE Asia) Horizons Ventures Blume Venture Advisors Shunwei Capital CDH Investments CyberAgent Ventures (TKS: 4751) Global Brain CITIC Capital Shenzhen Capital Group
Hillhouse Capital Group Cherubic Ventures SoftBank Ventures Asia Infinity Ventures EDBI Chiratae Ventures Indian Angel Network Innovation Network Corporation of Japan Nissay Capital UMC Capital Mumbai Angels Cowin Capital Gobi Ventures Fortune Capital Mitsubishi UFJ Capital China Growth Capital Mizuho Capital Partners SB China Venture Capital Kalaari Capital Kakao Ventures SMBC Venture Capital Lightspeed Venture Partners China Matrix Partners India Axilor Ventures Zone Startups India Singtel Innov8
Kae Capital Ceyuan Ventures QF Capital Morningside Venture Capital Digital Garage (TKS: 4819) Source Code Capital SparkLabs SBI Holdings (TKS: 8473) NTT Docomo Ventures Recruit Strategic Partners Beenext (Singapore) Baidu (NAS: BIDU) K2VC GMO VenturePartners GREE Ventures (TKS: 3632) Ping An Ventures Golden Gate Ventures Lilly Asia Ventures Jungle Ventures Gaorong Capital Fresco Capital Malaysia Venture Capital Management China Everbright (HKG: 00165) China Broadband Capital Partners Bertelsmann Asia Investments Chengwei Capital
Yunfeng Capital Vertex Ventures China Lanchi Ventures Baidu Ventures India Quotient SBI Investment Tisiwi Spiral Ventures Vive X Accelerator Legend Star Yunqi Partners The Malaysian Global Innovation and Creativity Centre - MaGIC DSC Investment (KRX: 241520) Linear Venture Vertex Ventures SE Asia & India Vectr Ventures Rakuten Capital China Media Capital Hatcher Plus Vision Capital (China) SPARX Group Company (TKS: 8739) 3one4 Capital Frees Fund Venture Catalysts (Mumbai) Fosun RZ Capital Ally Bridge Group
ASIA
All Rights Reserved. Copyright © 2019. Created by Joshua Eckblad, Academic Researcher at TiSEM in The Netherlands.
SUMMIT@RSM

Top Investors Headquartered in Asia
(Total Investments >46, Past 20 Years, Ordered)
17
IDG Capital Temasek Holdings Qiming Venture Partners Korea Investment Partners SAIF Partners Sequoia Capital China Brand Capital Matrix Partners China Samsung Venture Investment Northern Light Venture Capital Jafco (TKS: 8595) Sequoia Capital India ZhenFund Legend Capital Morningside Group East Ventures Susquehanna Asia Investments GSR Ventures 500 Startups (SE Asia) Horizons Ventures Blume Venture Advisors Shunwei Capital CDH Investments CyberAgent Ventures (TKS: 4751) Global Brain CITIC Capital Shenzhen Capital Group
Hillhouse Capital Group Cherubic Ventures SoftBank Ventures Asia Infinity Ventures EDBI Chiratae Ventures Indian Angel Network Innovation Network Corporation of Japan Nissay Capital UMC Capital Mumbai Angels Cowin Capital Gobi Ventures Fortune Capital Mitsubishi UFJ Capital China Growth Capital Mizuho Capital Partners SB China Venture Capital Kalaari Capital Kakao Ventures SMBC Venture Capital Lightspeed Venture Partners China Matrix Partners India Axilor Ventures Zone Startups India Singtel Innov8
Kae Capital Ceyuan Ventures QF Capital Morningside Venture Capital Digital Garage (TKS: 4819) Source Code Capital SparkLabs SBI Holdings (TKS: 8473) NTT Docomo Ventures Recruit Strategic Partners Beenext (Singapore) Baidu (NAS: BIDU) K2VC GMO VenturePartners GREE Ventures (TKS: 3632) Ping An Ventures Golden Gate Ventures Lilly Asia Ventures Jungle Ventures Gaorong Capital Fresco Capital Malaysia Venture Capital Management China Everbright (HKG: 00165) China Broadband Capital Partners Bertelsmann Asia Investments Chengwei Capital
Yunfeng Capital Vertex Ventures China Lanchi Ventures Baidu Ventures India Quotient SBI Investment Tisiwi Spiral Ventures Vive X Accelerator Legend Star Yunqi Partners The Malaysian Global Innovation and Creativity Centre - MaGIC DSC Investment (KRX: 241520) Linear Venture Vertex Ventures SE Asia & India Vectr Ventures Rakuten Capital China Media Capital Hatcher Plus Vision Capital (China) SPARX Group Company (TKS: 8739) 3one4 Capital Frees Fund Venture Catalysts (Mumbai) Fosun RZ Capital Ally Bridge Group
ASIA
All Rights Reserved. Copyright © 2019. Created by Joshua Eckblad, Academic Researcher at TiSEM in The Netherlands.
SUMMIT@RSM

500 Startups New Enterprise Associates Plug and Play Tech Center Intel Capital Kleiner Perkins 3i Group Accel Sequoia Capital Kohlberg Kravis Roberts Bessemer Venture Partners Warburg Pincus SOSV Greylock Partners Apax Partners Miscrosoft ScaleUp Advent International Ardian Startupbootcamp Bain Capital Village Capital Keiretsu Forum Norwest Venture Partners Scottish Enterprises Canaan Partners Mayfield Fund IDG Capital
Idinvest Partners Redpoint Ventures Alpinvest Partners Matrix Partners Insight Venture Partners Highland Capital Partners DCM Ventrures H.I>G Capital Caisse de depot et placement du Quebec General Atlantic Qualcomm Ventures Temasek Holdings OrbiMed Ontario Teachers’ Pension Plan GGV Capital Bain Capital Ventures Qiming Venture Partners Omidyar Network Korea Investment Partners Wavemaker Partners SAIF Partners Sequoia Capital China Cisco Investments Brand Capital Morgan Stanley
Tiger Global Management Permira Walden International Matrix Partners China VantagePoint Capital Partners JLABS Baird Capital Johnson&Johnson Innovation (JJDC) Next47 e.ventures Samsung Venture Investment TPG Growth Adam Street Partners Numa Northern Light Venture Capital Jafco Sequoia Capital India ZhenFund Eight Roads Foresight Group Legend Capital BlueRun Ventures Ventech Morningside Group
Amadeus Capital Partners Invesco L Catterton ACE & Company Mitsui Global Investment Nexus Venture Partners WI Harper Group Quilvest Private Equity Worldview Technology Partners Oxford Bioscience Partners East Ventures Susquehanna Asia Investments Altos Ventures GSR Ventures Google Developers Launchpad Mountain Partners Iris Capital 500 Startups (SE Asia) Horizons Ventures BlackRock Private Equity Partners EW Healthcare Partners Entrepreneur Venture
EurzeoVivo Capital Deerfield Management Blume Venture Advisors Entrepreneur First Oracle Rocket internet Bank of America Brookfield Asset Management Global Founders Capital Intel Formation 8 Artesian Capital Management Sinovation Ventures Shunwei Capital CDH Investments OurCrowd CyberAgent Ventures Global Brain Investec Shenzhen Capital Group ChinaRock Capital Management CITIC Capital UpHonest Capital Hillhouse Capital Group Cherubic Ventures Northgate Capital
Societe Generale JP Morgan Asset Management Softbank Ventures Asia Harbert Management Infinity Ventures FinTech Innovation Lab The D.E. Shaw Group EDBI Atomico CDC Group Oxford Technology Management Tianxing Capital Giza Venture Capital Chiratae Ventures Helion Venture Partners Indian Angel Network Nissay Capital Innovation Network Corporation of Japan Draper Nexus Artiman Ventures UMC Capital Wellington Management Harbert Credit Solutions Mumbai Angels Fenox Venture Capital Cowin Capital
Top Investors with an Asia Office
(Total Investments >100, Past 20 Years, Ordered)
18
ASIA
All Rights Reserved. Copyright © 2019. Created by Joshua Eckblad, Academic Researcher at TiSEM in The Netherlands.
SUMMIT@RSM

19
All Asia-based Investors (All Investor Types) / Destination of Capital (Past 20 Years)
Beijing-based Top Investors Made 2,538 Investments (26 Top Investors Based in Beijing)
Other Countries13 %
Malaysia4 %
South Korea4 %
Singapore5 %
Japan8 %
Europe8 %
USA15 %
India17 %
China26 %
Asia-based Investors'
Destination Deal Count
Other Regions12 %
Europe14 %
USA16 %
Asia58 %
ASIA
Other European18 %
Netherlands3 %
Ireland3 %
Italy3 %
Portugal4 %
Switzerland5 %
France5 %
Russia6 %
Germany8 %
UK44 %
Asia-based Investors’
Destination Capital
Investments
Asia-based Investors’
Capital Invested in Europe
All Rights Reserved. Copyright © 2019. Created by Joshua Eckblad, Academic Researcher at TiSEM in The Netherlands.
SUMMIT@RSM

Growth/Expansion6 %
LBO3 %
Other17 %
Angel3 %
Seed12 %
Later Stage17 %
Early Stage42 %
Asia-based Investors' Deal Count
20
All Asia-based Investors (All Investor Types) / Destination of Capital (Past 20 Years)Beijing-based Top Investors Made 2,538 Investments (26 Top Investors Based in Beijing)
ASIA
Growth/Expansion6 %
LBO21 %
Other45 %
Later Stage17 %
Early Stage10 %
Asia-based Investors’
Capital Invested
B2C21 %
Healthcare11 %
Energy2 %
Financial Services4 %
Materials & Resources1 %
B2B16 %
Information Technology45 %
Asia-based Investors'
Global Deal Count
B2C21 %
Healthcare10 %
Energy8 %
Financial Services15 %
Materials & Resources1 %
B2B12 %
Information Technology33 %
Asia-based Investors'
Global Capital Investments
By Deal Type
By Primary Industry Sector
All Rights Reserved. Copyright © 2019. Created by Joshua Eckblad, Academic Researcher at TiSEM in The Netherlands.
SUMMIT@RSM

Corporate Venture Capital(CVC) Investors
02
All Rights Reserved. Copyright © 2019. Created by Joshua Eckblad, Academic Researcher at TiSEM in The Netherlands.
SUMMIT@RSM

Corporate VC Investments As a Share of Total Investors’ Capital In 2018
Growing Corporate VC Investments
Corporate VCs as a group were involved in 23 percent of all investment deals made in external startups in 2018. This represents the highest rate of participation on record to date.
Please note that corporate VC investments in a given external startup are almost always made in partnership with at least one private VC, who typically takes the role as lead investor. The absolute numbers provided inside the figure vary based on the industry data sources used, but the trends toward higher levels of capital invested and higher volumes of investment deals are clearly visible and substantiated (see next page).
CVC Deal Participation23 %
22
All Rights Reserved. Copyright © 2019. Created by Joshua Eckblad, Academic Researcher at TiSEM in The Netherlands.
SUMMIT@RSM

Corporate VC Investor Trends 2013-2018
Growing Corporate VC Investments
The trends toward higher levels of capital invested and higher
volumes of investment deals are clearly visible. Between 2013
and 2018, corporate VCs increased capital expenditures
by at least 400 percent, and corporate VCs engaged in at
least 166 percent more deals in external startups.
23
1.029
1.390
1.581
1.705
2.068
2.740
20132014
20152016
20172018
$53,0B
$36,1B
$29,1B$31,3B
$18,4B
$10,6B
20132014
20152016
20172018
64 Newly-Founded Corporate VCs
264 Newly-Founded Corporate VCs
E.g., Coinbase Ventures, Maersk Growth, Porsche
Ventures
Sharp Rise in Fresh Corporate VC Entrants
There are numerous inflection points since 1960, but 2013 appears to be an important moment after which the number of first-time corporate VC investors rose rapidly. In 2018 alone, there were at least 264 newly-founded corporate VCs. This respresents the highest number of corporate VC entrants in a given year.
Corporate VC Investments New Corporate VCs Founded
All Rights Reserved. Copyright © 2019. Created by Joshua Eckblad, Academic Researcher at TiSEM in The Netherlands.
SUMMIT@RSM

Corporate VC Investors (All) 2000-2018 (Years Aggregated)
24
Deal Count Country
Other10 %
Sweden1,1%
South Korea1,5%
France1,9%
Spain2,0%
Israel2,1%
India2,4%
Japan3,0%
Canada3,9%
UK4,4%
China5,1%
Germany5,3%
USA56,8%
Other4,0%
Canada3,9%
Asia14,5%
Europe20,7%
USA56,8%
⬆(2018)
⬆(2018: 244-351)
Deal Count Region Deal Count Industry Deal Count Type
Other10,0%
Later Stage36,3%
Early Stage53,9%
Materials and Resources1,3%
Financial Services1,8%
Energy2,8%
B2B13,0%
B2C14,0%
Healthcare18,7%
Information Technology48,4%
All Rights Reserved. Copyright © 2019. Created by Joshua Eckblad, Academic Researcher at TiSEM in The Netherlands.
SUMMIT@RSM

Other9,5%
Later Stage44,9%
Early Stage25,5%
Materials and Resources1%
Financial Services3,1%
Energy6,5%
B2B10,1%
B2C19,0%
Healthcare19,2%
Information Technology41,0%
Other6,5%
Asia10,1%
Europe17,2%
USA66,4%
⬆(2018: 20.4—49.3%)
Other12%
France0,9%
Denmark1%
Israel1%
Japan1%
Canada1%
India2,5%
UK3,5%
Germany4,3%
China15,5%
USA57,6%
⬆(2018)
Corporate VC Investors (All) 2000-2018 (Years Aggregated)
25
Capital Invested Capital Invested Region Capital Invested Industry Capital Invested Type
All Rights Reserved. Copyright © 2019. Created by Joshua Eckblad, Academic Researcher at TiSEM in The Netherlands.
SUMMIT@RSM

Corporate VC Investments By Primary Industry Group/Sector
1999-2018
Rise of Investments in Artificial Intelligence (AI)
AI deals with Corporate VC participation continue to increase year-to-year, with Asia-based startups soon to receive greater investments than their US-based counterparts. Out of all AI invested capital by corporate VCs in 2018, 44 percent went to US-based startups, 42 percent went to Asia-based startups, and 13 percent went to Europe-based startups.
Whereas in 2013, corporate VCs invested virtually nothing in AI startups, by 2018 $5.1B was invested (~10 percent of all corporate VC investments). Baidu Ventures (China) was the most active corporate VC investor in AI startups in 2018.
26
Num
ber o
f Cor
pora
te V
C In
vest
men
ts
0
225
450
675
900
Com
mer
cial
Pro
duct
sCo
mm
erci
al S
ervic
esCo
mm
unic
atio
ns a
nd N
etw
orkin
gCo
mpu
ter H
ardw
are
Cons
umer
Dur
able
sCo
nsum
er N
on-D
urab
les
Expl
orat
ion,
Pro
duct
ion
and
Refin
ing
Heal
thca
re D
evic
es a
nd S
uppl
ies
Heal
thca
re S
ervic
esIT
Ser
vices
Med
iaOt
her C
onsu
mer
Pro
duct
s an
d Se
rvic
es
Othe
r Fin
anci
al S
ervic
esOt
her I
nfor
mat
ion
Tech
nolo
gy
Phar
mac
eutic
als
and
Biot
echn
olog
y
Rest
aura
nts,
Hote
ls a
nd L
eisu
reRe
tail
Sem
icon
duct
ors
Serv
ices
(Non
-Fin
anci
al)
Softw
are
Appa
rel a
nd A
cces
sorie
sCa
pita
l Mar
kets
/Inst
itutio
nsCh
emic
als
and
Gase
sCo
mm
erci
al B
anks
Ener
gy E
quip
men
tEn
ergy
Ser
vices
Heal
thca
re T
echn
olog
y Sy
stem
sIn
sura
nce
Othe
r Ene
rgy
Othe
r Mat
eria
lsTr
ansp
orta
tion
Agric
ultu
reCo
mm
erci
al T
rans
porta
tion
Cont
aine
rs a
nd P
acka
ging
Othe
r Bus
ines
s Pr
oduc
ts a
nd S
ervic
esFo
rest
ryOt
her H
ealth
care
Utilit
ies
Text
iles
Met
als,
Min
eral
s an
d M
inin
g
Internet / Software ($21.2B Capital Invested in 2018)
All Rights Reserved. Copyright © 2019. Created by Joshua Eckblad, Academic Researcher at TiSEM in The Netherlands.
SUMMIT@RSM

Netherlands-based Startups & Corporate VC Investors
(Netherlands only)
27
The Netherlands
10 percent of Netherlands-based startups that received private venture capital funding, also received corporate VC funding in 2018. 50 percent of the corporate VC funding that NL-based startups received in 2018 came from corporate VCs outside the Netherlands in.
NL-based corporate VCs made a median investment size of €4.65M in 2018, with 85 percent of all transactions made in early-stage capital fundraising rounds (i.e., Series A to Series B). 78 percent of NL-based corporate VCs investments were made in startups based outside The Netherlands.
Between 2010 and 2018, the number of NL-based corporate VCs more than doubled from 8 to 19. In 2018 alone, NL-based corporate VCs made 19 percent of the total investment deals since their existence (98 out of 517 investments).
Recommended Reading: Casey, M., Witteveen, D., Lufting, E., Nijs, J., Bax, M., & Beers, N. (2019). The next chapter for Corporate Venture Capital: "Future-proof" the Netherlands (pp. 1-32, Rep.). Netherlands: Deloitte.
Other72 %
Software5%
Manufacturing7%
FinTech7%
HealthTech9%
4,100 NL-based Startups in 2018
(Industries)
Other32 %
Food & Nutrition5 %
New Energies7 %
FinTech7 %
Networks & Cybersecurity7 %
Manufacturing8%
Digital Healthcare8%
Software13%
Biotech & Pharma13%
517 Investments Made 20 NL-based
Corporate VCs (All Years)
All Rights Reserved. Copyright © 2019. Created by Joshua Eckblad, Academic Researcher at TiSEM in The Netherlands.
SUMMIT@RSM
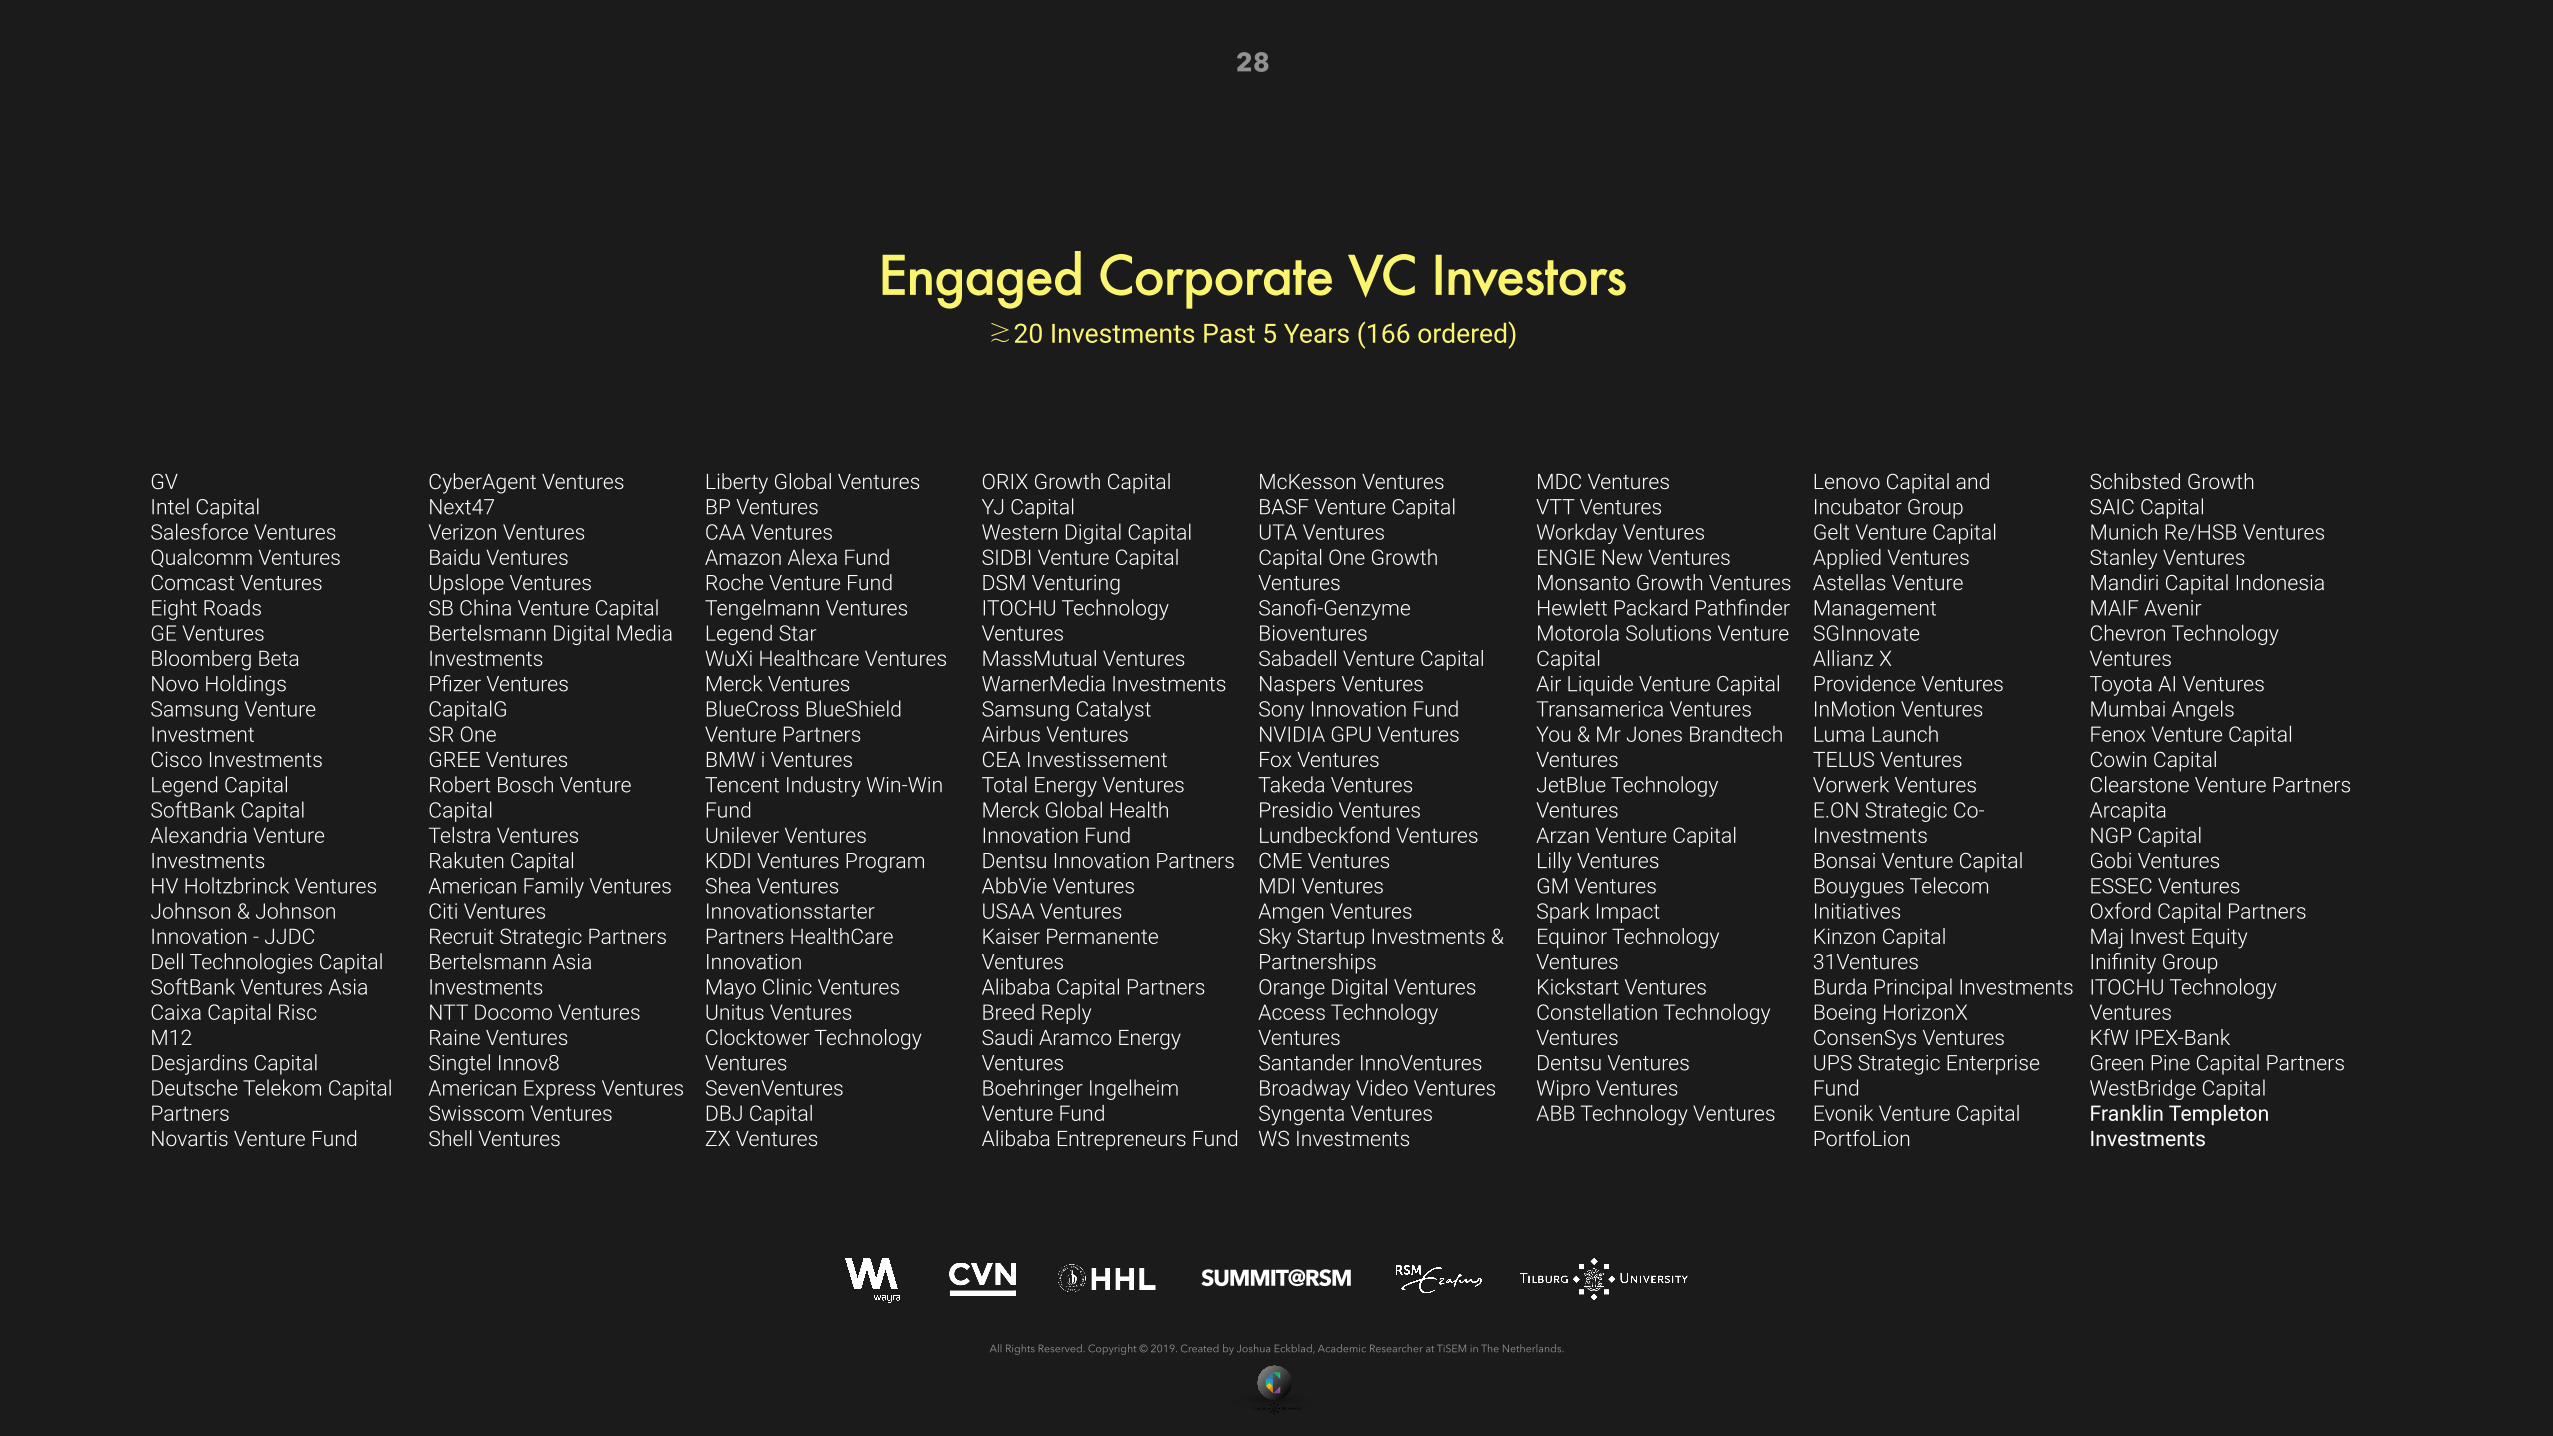
Engaged Corporate VC Investors ≳20 Investments Past 5 Years (166 ordered)
28
GV Intel Capital Salesforce Ventures Qualcomm Ventures Comcast Ventures Eight Roads GE Ventures Bloomberg Beta Novo Holdings Samsung Venture Investment Cisco Investments Legend Capital SoftBank Capital Alexandria Venture Investments HV Holtzbrinck Ventures Johnson & Johnson Innovation - JJDC Dell Technologies Capital SoftBank Ventures Asia Caixa Capital Risc M12 Desjardins Capital Deutsche Telekom Capital Partners Novartis Venture Fund
CyberAgent Ventures Next47 Verizon Ventures Baidu Ventures Upslope Ventures SB China Venture Capital Bertelsmann Digital Media Investments Pfizer Ventures CapitalG SR One GREE Ventures Robert Bosch Venture Capital Telstra Ventures Rakuten Capital American Family Ventures Citi Ventures Recruit Strategic Partners Bertelsmann Asia Investments NTT Docomo Ventures Raine Ventures Singtel Innov8 American Express Ventures Swisscom Ventures Shell Ventures
Liberty Global Ventures BP Ventures CAA Ventures Amazon Alexa Fund Roche Venture Fund Tengelmann Ventures Legend Star WuXi Healthcare Ventures Merck Ventures BlueCross BlueShield Venture Partners BMW i Ventures Tencent Industry Win-Win Fund Unilever Ventures KDDI Ventures Program Shea Ventures Innovationsstarter Partners HealthCare Innovation Mayo Clinic Ventures Unitus Ventures Clocktower Technology Ventures SevenVentures DBJ Capital ZX Ventures
ORIX Growth Capital YJ Capital Western Digital Capital SIDBI Venture Capital DSM Venturing ITOCHU Technology Ventures MassMutual Ventures WarnerMedia Investments Samsung Catalyst Airbus Ventures CEA Investissement Total Energy Ventures Merck Global Health Innovation Fund Dentsu Innovation Partners AbbVie Ventures USAA Ventures Kaiser Permanente Ventures Alibaba Capital Partners Breed Reply Saudi Aramco Energy Ventures Boehringer Ingelheim Venture Fund Alibaba Entrepreneurs Fund
McKesson Ventures BASF Venture Capital UTA Ventures Capital One Growth Ventures Sanofi-Genzyme Bioventures Sabadell Venture Capital Naspers Ventures Sony Innovation Fund NVIDIA GPU Ventures Fox Ventures Takeda Ventures Presidio Ventures Lundbeckfond Ventures CME Ventures MDI Ventures Amgen Ventures Sky Startup Investments & Partnerships Orange Digital Ventures Access Technology Ventures Santander InnoVentures Broadway Video Ventures Syngenta Ventures WS Investments
MDC Ventures VTT Ventures Workday Ventures ENGIE New Ventures Monsanto Growth Ventures Hewlett Packard Pathfinder Motorola Solutions Venture Capital Air Liquide Venture Capital Transamerica Ventures You & Mr Jones Brandtech Ventures JetBlue Technology Ventures Arzan Venture Capital Lilly Ventures GM Ventures Spark Impact Equinor Technology Ventures Kickstart Ventures Constellation Technology Ventures Dentsu Ventures Wipro Ventures ABB Technology Ventures
Lenovo Capital and Incubator Group Gelt Venture Capital Applied Ventures Astellas Venture Management SGInnovate Allianz X Providence Ventures InMotion Ventures Luma Launch TELUS Ventures Vorwerk Ventures E.ON Strategic Co-Investments Bonsai Venture Capital Bouygues Telecom Initiatives Kinzon Capital 31Ventures Burda Principal Investments Boeing HorizonX ConsenSys Ventures UPS Strategic Enterprise Fund Evonik Venture Capital PortfoLion
Schibsted Growth SAIC Capital Munich Re/HSB Ventures Stanley Ventures Mandiri Capital Indonesia MAIF Avenir Chevron Technology Ventures Toyota AI Ventures Mumbai Angels Fenox Venture Capital Cowin Capital Clearstone Venture Partners Arcapita NGP Capital Gobi Ventures ESSEC Ventures Oxford Capital Partners Maj Invest Equity Inifinity Group ITOCHU Technology Ventures KfW IPEX-Bank Green Pine Capital Partners WestBridge Capital Franklin Templeton Investments
All Rights Reserved. Copyright © 2019. Created by Joshua Eckblad, Academic Researcher at TiSEM in The Netherlands.
SUMMIT@RSM

51 percent of Engaged Corporate VCs are based in the USA
Exponential Rise of Asia-based Corporate VCs and Asia-based Startups Since 2013
Baidu Ventures, for example, is the 27th most active corporate VC over the past 5 years, but the 4th most active corporate VC in 2018.
In fact, 6 out of the 10 most active corporate VCs in 2018 are based in Asia. China-based corporate VCs invested between $10.8B in 2018 (~20 percent of total capital invested by corporate VCs) and $50B depending on the data source, and Asia-based startups received between 21-38 percent of all corporate VC deals, depending on the data source examined.
29
Other Countries12 %
Switzerland2 %
Spain2 %
Singapore2 %
Netherlands2 %
France4 %
China5 %
United Kingdom5 %
Japan7 %
Germany8 %
United States51 %
All Rights Reserved. Copyright © 2019. Created by Joshua Eckblad, Academic Researcher at TiSEM in The Netherlands.
SUMMIT@RSM

Engaged Corporate VC Investors ≳20 Investments Past 5 Years (166 ordered)
30
Investments by Corporate VCs are Precious Investments by Corporate VCs are Precious
Number of Engaged Corporate VC Investors
Deal
Cou
nt (A
ll Ye
ars)
<60 Investments
Intel
GV
52%
Out of the 166 Engaged Corporate VCs, 23 percent have made ≳100 investments in portfolio startups, while 52 percent of corporate VC investors have made between 0 and 60 investments during their entire existence.
Out of the 166 Engaged Corporate VCs, 9 percent of corporate VCs made ≳100 investments in portfolio startups over the past 5 years. 27 percent of corporate VCs made ≳50 investments in portfolio startups, while 58 percent of corporate VC investors made between 0 and 35 investments over the past 5 years.
Number of Engaged Corporate VC Investors
Dea
l Cou
nt (P
ast 5
Yea
rs)
Intel
GV
<35 Investments
58%
All Rights Reserved. Copyright © 2019. Created by Joshua Eckblad, Academic Researcher at TiSEM in The Netherlands.
SUMMIT@RSM

Engaged Corporate VC Investors 2014 -2018
≳20 Investments Past 5 Years
All Rights Reserved. Copyright © 2019. Created by Joshua Eckblad, Academic Researcher at TiSEM in The Netherlands.
SUMMIT@RSM
31

166 Engaged
CVCS
32
Sharp Rise in Young, Powerful Corporate VC Entrants
13 Avg. Age
Out of the 166 Engaged Corporate VCs, 65 percent of corporate VCs were founded after 2011. Only 20 percent of these corporate VCs were founded in the year 2000 or earlier.
19681969
1973
1978
1985
1986
1991
1993
1995
1996
1997
1998
1999
2000
20012002
20032004
2006
2007
2008
2009
2010
2011
2012
2013
2014
2015
2018
2016
2017
Corporate VC Year Founded (Engaged Corporate VCs Only)
Num
ber of Engaged Corporate VC Investors
19151969
19731979
1985 19911997
20182011
20152007
2000
Enga
ged
Corp
orat
e VC
Inve
stors
≳20
Inve
stm
ents
Pas
t 5 Y
ears
201
4-20
18
All Rights Reserved. Copyright © 2019. Created by Joshua Eckblad, Academic Researcher at TiSEM in The Netherlands.
SUMMIT@RSM

Prior Corporate VC Experience Does Not Predict Subsequent Investment Intensity
33
Based on our regression analysis of 136 Engaged Corporate VCs (outliers removed), we observe that many recently-founded corporate VCs seem to require almost three years to ramp up their investments.
The relationship between corporate VC age and subsequent investment levels over the past 5 years is positive, but extremely weak. Even when the full sample of 166 Engaged Corporate VCs are considered, the 10 highest levels of investments in external startups were made by corporate VCs founded at different moments in time between 1991 and 2013. As no particular pattern emerges, it suggests that the age of a corporate VC alone does not help us predict investment intensity, per se.
On the one hand, a possible explanation for the observed behavior is that some recently-founded corporate VCs may have learned vicariously from observing previous corporate VCs.
By implementing organizational mechanisms, for example, that ensure a steady stream of investment funding and autonomous decision-making, even young corporate VCs can become prolific in their investments within a short timeframe.
On the other hand, characteristics that lead to better corporate VC performance are already being practiced by the high-performing, older corporate VC units.
Therefore, what affects corporate VC performance is more a question of organizing corporate VC activities adaptively, and less a matter of what typically accompanies corporate VC experience such as established routines and familiar social capital networks. Alternatively, different mechanisms may be at play in fresh, versus established corporate VCs.
Corporate VC Age (outliers removed n=136; Age 1-34 coverage)
Deal
Cou
nt (P
ast 5
Yea
rs)
0 5 10 15 20 25 30
100
200
300
400
500
Enga
ged
Corp
orat
e VC
Inve
stors
≳20
Inve
stm
ents
Pas
t 5 Y
ears
201
4-20
18
All Rights Reserved. Copyright © 2019. Created by Joshua Eckblad, Academic Researcher at TiSEM in The Netherlands.
SUMMIT@RSM

34
Exits by Corporate VCs are PreciousOut of the 166 Engaged Corporate VCs, 18 percent have experienced ≳60 exits of portfolio startups, while 57 percent of corporate VC investors have
experienced between 0 and 20 exits during their entire existence.
Portfolio Startup Exits (All Years)
Num
ber o
f Eng
aged
Cor
pora
te V
C In
vest
ors
0 15 30 45 60 75 90 105 120 135 150 165 180 195 210 795 810
Cisco Invt.
GVSoftBank & Next47
Intel
Enga
ged
Corp
orat
e VC
Inve
stors
≳20
Inve
stm
ents
Pas
t 5 Y
ears
201
4-20
18
All Rights Reserved. Copyright © 2019. Created by Joshua Eckblad, Academic Researcher at TiSEM in The Netherlands.
SUMMIT@RSM

0
200 400 600 800 1000 1200
100
200
300
1600 1800 2000
400
500
600
700
800
900
Based on the 166 Engaged Corporate VCs, it first appears that the regressive relationship between deal count and the number of subsequent portfolio startup exits a corporate VC experiences, is linear and positive. The intuition is that to experience more portfolio startup exits, corporate VCs must place more ‘bets’ in uncertain, innovative external startups.
Volume of Bets as a Performance Strategy
35
Portf
olio
Sta
rtup
Exits
(All
Year
s)
Deal Count (All Years) (n=166 Engaged CVC Investors)
Intel (803 exits)
However, when we drop the Intel corporate VC datapoint from our regression analysis, the relationship between deal count and the number of subsequent portfolio startup exits, appears to weaken after some point. The insight is that the strategy of placing more bets works only up to a point, so that corporate VCs may increasingly have to focus on effectively delivering value-adding services to foster requisite growth in their portfolio startups.
NB: Next47 deal and exit counts include legacy investments from SIEMENS Venture Capital. GV encapsulates five distinct corporate VC units.
Limits to “More Bets” as a Performance Strategy
Portf
olio
Sta
rtup
Exits
(All
Year
s)
Deal Count (All Years) (n=165 Engaged CVC Investors; Intel dropped)
0
100 200 300 400 500 600
25
50
75
700 800 900
100
125
150
175
200
225
1000
GV (207 exits)
Next47 (176 exits)
Engaged Corporate VC Investors ≳20 Investments Past 5 Years
Enga
ged
Corp
orat
e VC
Inve
stors
≳20
Inve
stm
ents
Pas
t 5 Y
ears
201
4-20
18
All Rights Reserved. Copyright © 2019. Created by Joshua Eckblad, Academic Researcher at TiSEM in The Netherlands.
SUMMIT@RSM

100
200
300
400
500
600
700
800
900
36
The relative size of each circle indicates the age of an Engaged Corporate VC, where a smaller circle represents a more recent founding date and a larger circle represents an older founding date.
These corporate VCs are plotted according to deal count over the past five years and the number of portfolio startup exits since the founding of a corporate VC.
* Next47 and M12 deal and exit counts include legacy investments from SIEMENS Venture Capital and Microsoft Ventures, respectively. However, we use the recent founding dates for Next47 and M12, not the historic ones for previous structures. Please note that GV encapsulates five distinct corporate VC units.
Deal Count Past 5 Years (n=166)
Port
folio
Sta
rtup
Exi
ts (A
ll Ye
ars)
0 50 100 150 200 250 300 350 400 450
Qualcomm Ventures
19
Salesforce Ventures10
Intel28
GV*
10
Map of Corporate VCs
Enga
ged
Corp
orat
e VC
Inve
stors
≳20
Inve
stm
ents
Pas
t 5 Y
ears
201
4-20
18
All Rights Reserved. Copyright © 2019. Created by Joshua Eckblad, Academic Researcher at TiSEM in The Netherlands.
SUMMIT@RSM

0
22
44
67
89
111
133
156
178
37
The figure illustrates the extent to which active corporate VCs vary greatly in terms of deal counts over the past five years, portfolio startup exits, and age (experience). While holding any of these variables at a constant value, we still see a wide range of values across the other variables. For example, if we hold deal count and age (relatively) constant, there remains variance between Cisco Investments and Samsung Ventures in terms of portfolio startup exists. Similarly, if we hold portfolio startup exists and age (relatively) constant, there exists variance between Samsung Ventures and Comcast Ventures in terms of recent deal counts.
This variance is interesting for researchers and practitioners, because it suggests that there are multiple compositions to achieving high performing corporate VCs and that performance along any dimension is normally distributed (i.e., bell shape). In other words, there may be a complex, interactive set of requisite conditions and achieving any of these “successful” compositions certainly requires hard work and a bit of serendipity.
Deal Count Past 5 Years (n=164; GV and Intel dropped)Po
rtfo
lio S
tart
up E
xits
(All
Year
s)
0 33 67 100 133 167 200 233 267 300
Corporate VCs are Heterogeneous
200
The relative size of each circle indicates the age of an Engaged Corporate VC. These corporate VCs are plotted according to deal count over the past five years and the number of portfolio startup exits since the founding of a corporate VC.
* Next47 and M12 deal and exit counts include legacy investments from SIEMENS Venture Capital and Microsoft Ventures, respectively. However, we use the recent founding dates for Next47 and M12, not the historic ones for previous structures. Please note that GV encapsulates five distinct corporate VC units.
Map of Corporate VCs
Motorola Solutions Ventures
20Next47*
J&J46
Deutsche Telekom
22
M12*
Pfizer Ventures22 GE Ventures
Bloomberg Beta
6
6
Qualcomm Ventures19
Salesforce Ventures10
SoftBank Capital24
Novo20
Cisco Investments
Comcast Ventures
26
2120 Samsung Ventures
Enga
ged
Corp
orat
e VC
Inve
stors
≳20
Inve
stm
ents
Pas
t 5 Y
ears
201
4-20
18
All Rights Reserved. Copyright © 2019. Created by Joshua Eckblad, Academic Researcher at TiSEM in The Netherlands.
SUMMIT@RSM

Private & Corporate Accelerators
03
All Rights Reserved. Copyright © 2019. Created by Joshua Eckblad, Academic Researcher at TiSEM in The Netherlands.
SUMMIT@RSM

Accelerator Investors (All) 2000-2018 (Years Aggregated)
Deal Count Country Deal Count Region Deal Count Industry Deal Count Type
Other29,0%
Netherlands1%
Italy2%
Israel2%
Spain2%
Germany3%
Sweden3%
India3,5%
UK5,7%
Canada6,1%
France6,2%
USA42,4%
Other10,2%
Canada6,1%
Asia7,6%
Europe33,7%
USA42,4%
Other23,2%
Transportation0,5%
Biotechnology3,2%
Commercial Products3,6%
Media3,7%
Consumer Durables4,0%
Healthcare Devices4,3%
Commercial Services9,7%
Software47,8%
Other22,2%
Later Stage15,0%
Early Stage62,8%
39
All Rights Reserved. Copyright © 2019. Created by Joshua Eckblad, Academic Researcher at TiSEM in The Netherlands.
SUMMIT@RSM

Capital Invested Capital Invested Region Capital Invested Industry Capital Invested Type
Accelerator Investors (All) 2000-2018 (Years Aggregated)
Other14,0%
India1%
Israel2%
Canada2%
France2%
China2,5%
Indonesia2,8%
Germany3,1%
UK4,8%
USA66,4%
Other6,5%
Asia10,1%
Europe17,2%
USA66,4%
Other29,6%
Healthcare Devices5,2%
Transportation5,4%
Commercial Services7,5%
Biotechnology8,0%Software
45,3% Other11,5%
Later Stage43,8%
Early Stage44,7%
40
All Rights Reserved. Copyright © 2019. Created by Joshua Eckblad, Academic Researcher at TiSEM in The Netherlands.
SUMMIT@RSM

41
Top 93 Accelerator Investors Past 5 Years (2014-2018)
NB: Each circle on the map indicates the location of a Top Accelerator’s HQ . The size of the circle denotes the number of investments made in external startups.
We highlight in yellow the top 30 accelerators in the world. Data on China is unreliable and is not shown.
93 Top Global Acceleratos
63—1,560 Investments (2014-2018)
65—2,432 Investments (All Years)
10-557 Portfolio Startup Exits
(All Years)
Y Combinator, 500 Startups, Alchemist, Google Developers Launchpad, Founder Institute, Boost VC,
SkyDeck, C100 Association (Silicon Valley)
Microsoft ScaleUp (Seattle)
Techstars (Boulder)
Capital Factory (Austin), TMC Innovation (Houston)
JLABS (San Diego)
Parallel18 (San Juan)
Village Capital (D.C.)
DreamIt Ventures, German Accelerator (NYC)
MassChallenge (Boston) Wayra (Madrid)
Paris&Co., Numa (Paris)
Startupbootcamp, Seedcamp , Entrepreneur First, EIT Climate-KIC (London)
Venture Kick (Schlieren)
Rockstart (Amsterdam)
Foundation for Internet Development-Initiatives (Moscow)
Accelerace (Copenhagen)
FasterCapital (Dubai)
Start-Up Chile (Santiago)
NXTP Labs (Buenos Aires)
All Rights Reserved. Copyright © 2019. Created by Joshua Eckblad, Academic Researcher at TiSEM in The Netherlands.
SUMMIT@RSM

0 100 200 300 400 500 600
400
600
800
700 800 900
1000
1200
1400
1600
1800
Based on a regression analysis of the 93 Top Accelerators, the relationship between the number of total investments an accelerator has made before 2014 and its number of subsequent investments in portfolio startup exits in the past five years, is on average non-linear and positive.
The insight is that accelerators’ continuous adaptation improves efficiency and increases the number of cohort startup programs year-to-year. However, the age of an accelerator investor does not appear to be an important determinant of future investments or future exit performance, ceteris paribus.
Accelerators Exhibit Efficiency Gains
42
Dea
l Cou
nt (P
ast 5
Yea
rs)
Prior Deal Count (Before 2014) (n=93 Top Accelerator Investors)
Based on a regression analysis of the 90 Top Accelerators (the 3 outliers removed were 500 Startups, Y Combinator, and Techstars), the relationship between the number of total investments made by accelerators and the number of portfolio startup exits, becomes curvilinear (inverted U-shaped). This pattern is similar to what we found for corporate VC investors in the previous section.
There may be a limit to the number of portfolio startup exits that most accelerator investors can expect to achieve, even if more bets in uncertain startups are taken. Since there is considerable variance in the number of portfolio startup exits at almost any level of accelerator investor investment activity, this pattern might reflect differences in quality among even the most active accelerator investors, in terms of attracting high-quality startups and/or providing effective value-adding services to assist portfolio startups in their growth.
Limits to “More Bets” as a Performance Strategy
Portf
olio
Sta
rtup
Exits
Deal Count (All Years) (n=90 Top Accelerator Investors; 3 outliers removed)
0 200 400 600
25
50
75
800 1200
100
125
150
175
200
225
1000
Top 93 Accelerator Investors ≳63 Investments Past 5 Years (2014-2018)
200
MassChallenge
Techstars
500 Startups
Start-Up Chile
Wayra Microsoft ScaleUp
Startupbootcamp
MassChallenge
All Rights Reserved. Copyright © 2019. Created by Joshua Eckblad, Academic Researcher at TiSEM in The Netherlands.
SUMMIT@RSM

Global Startup Fundraising Survey
04
(Our Preliminary Results)
All Rights Reserved. Copyright © 2019. Created by Joshua Eckblad, Academic Researcher at TiSEM in The Netherlands.
SUMMIT@RSM

44
NB: Each circle on the map indicates the location of a participating startup’s HQ
MedTech HealthTech Software Artificial Intelligence Biotechnology FinTech EduTech IoT Robotics 3D Printers Additive Manufacturing
Advanced Materials Asset Management Chemical CleanTech Design Engineering Services E-commerce Enterprise Software Hospitality IIoT Service Provider IT
Mobility Power & RF Switching Power Electronics PropTech Semiconductors Smart Materials Telecom e-commerce Telecommunications Travel e-commerce Virtual Reality
Startups’ HQ & High-Tech IndustryHigh-Tech Industries (ordered)
All Rights Reserved. Copyright © 2019. Created by Joshua Eckblad, Academic Researcher at TiSEM in The Netherlands.
SUMMIT@RSM

45
Exited2 %
Profitable9 %
Early Stage9 %
Product Development23 %
Revenue57 %
Startup Age Startups’ Business Stage
Startups’ Age & Business Stage
(2018 Global Startup Fundraising Survey)
0 13
6yrs mean (Survey Second Wave)
3yrs mean (Survey First Wave)
All Rights Reserved. Copyright © 2019. Created by Joshua Eckblad, Academic Researcher at TiSEM in The Netherlands.
SUMMIT@RSM

Startups’ Drivers & Exit Strategies
TOP SOURCES OF COMPETITIVE ADVANTAGE(ordered: Highest to Least)
• Novel technologies • Unique positioning in niche markets • Establishment of new markets • Superior product or service qualities
TOP MOTIVATIONS FOR RAISING CAPITAL (ordered: Highest to Least)
• Product development • Sustain current operations • Increase sales with current product or service • Internationalization efforts
IPO9,6 %
No Preference26,9 %
Remain Independent28,8 %
Acquisition34,6 %
Startups’ Preferred Exit Strategy (2018 Global Startup Fundraising Survey)
46
All Rights Reserved. Copyright © 2019. Created by Joshua Eckblad, Academic Researcher at TiSEM in The Netherlands.
SUMMIT@RSM

Stro
ng fi
nanc
ial s
uppo
rt
Fair
equi
ty d
eal
No
boar
d re
pres
enta
tion
Stro
ng re
puta
tiona
l sig
nal
Stro
ng m
anuf
actu
ring
supp
ort
Inve
stor
as
first
cus
tom
er
Stro
ng S
ales
& M
arke
ting
supp
ort
Stro
ng IP
O ne
twor
k
Stro
ng R
&D s
uppo
rt
Stro
ng H
R su
ppor
t
Geog
raph
ic p
roxim
ity
Cultu
ral p
roxim
ity
Stro
ng c
omm
itmen
t tie
s
Stro
ng in
terp
erso
nal t
ies
Sim
ilar p
rior e
xper
ienc
e
Exte
nsive
indu
stry
exp
ertis
e
Com
patib
le e
xit p
refe
renc
e
Stro
ng m
anag
emen
t con
trol
Corporate VCs
Corporate/Private Accelerators
Private VCs
Business Angels
Crowdfunding
Friends, Family, and Fools
Startups’ Perceptions of Smart Capital NB: Each yellow circle indicates that surveyed startups, on average, considered those investor classes to be particularly well-suited to a given dimension
47
All Rights Reserved. Copyright © 2019. Created by Joshua Eckblad, Academic Researcher at TiSEM in The Netherlands.
SUMMIT@RSM

Unrealized Potential Startups’ Engagement With Corporates
Corporate—Startup Engagement
(2018 Global Startup Fundraising Survey)
48
Corporate VC
Vendor ID
Commercial T
ies
Corporate Accelerator
License
-Out
Spin-off
License
-In
45
78
1012
18
15 percent of all startups surveyed obtained more than two types of engagements to corporate firms (multiplex corporate-startup relationships). Of those startups that received investments from corporate VCs, they perceived corporate VCs’ focus as being close to the middle on the ‘Financial—Strategic’ continuum.
Engaged with a Corporate Firm58,5 %
No Engagement41,5 %
All Rights Reserved. Copyright © 2019. Created by Joshua Eckblad, Academic Researcher at TiSEM in The Netherlands.
SUMMIT@RSM

Investor Delivers Reputational Signal
According to our survey, startup co-founders stated that receiving an enhanced “reputational signal” from investors matters to them.
These co-founders perceive corporate VC and private VC investor classes as offering the strongest “reputational signal” among competing investor classes.
For those startups that received corporate VC funds, corporate VCs were evaluated by startup co-founders as having most succesfully delivered on the “reputational signal” dimension out of all measured dimensions.
49
Corporate VCs Deliver on Reputational Signal
-2
-1,75
-1,5
-1,25
-1
-0,75
-0,5
-0,25
0
0,25
0,5
0,75
1
1,25
1,5
1,75
2
Fina
ncia
l sup
port
Fair
equi
ty
No
boar
d re
pres
enta
tion
Repu
tatio
nal s
igna
l
Man
ufac
turin
g su
ppor
t
Firs
t cus
tom
er
Sale
s &
Mar
ketin
g
IPO
net
wor
k
R&D
supp
ort
HR
supp
ort
Geo
grap
hic
prox
imity
Cultu
ral p
roxi
mity
Com
mitm
ent t
ies
Inte
rper
sona
l tie
s
Prio
r exp
erie
nce
Indu
stry
exp
ertis
e
Com
patib
le e
xit p
refe
renc
e
Man
agem
ent c
ontro
l
Ope
ratio
nal s
uppo
rt
Stra
tegi
c ad
viso
ry
Stra
tegi
c al
lianc
e pa
rtne
rs
How Much This Dimension Matters to Startups (Survey 1)How Much This Dimension Matters to Startups (Survey 2)
All Rights Reserved. Copyright © 2019. Created by Joshua Eckblad, Academic Researcher at TiSEM in The Netherlands.
SUMMIT@RSM

-2
-1,75
-1,5
-1,25
-1
-0,75
-0,5
-0,25
0
0,25
0,5
0,75
1
1,25
1,5
1,75
2
Fina
ncia
l sup
port
Fair
equi
ty
No
boar
d re
pres
enta
tion
Repu
tatio
nal s
igna
l
Man
ufac
turin
g su
ppor
t
Firs
t cus
tom
er
Sale
s &
Mar
ketin
g
IPO
net
wor
k
R&D
supp
ort
HR
supp
ort
Geo
grap
hic
prox
imity
Cultu
ral p
roxi
mity
Com
mitm
ent t
ies
Inte
rper
sona
l tie
s
Prio
r exp
erie
nce
Indu
stry
exp
ertis
e
Com
patib
le e
xit p
refe
renc
e
Man
agem
ent c
ontro
l
Ope
ratio
nal s
uppo
rt
Stra
tegi
c ad
viso
ry
Stra
tegi
c al
lianc
e pa
rtne
rs
How Much This Dimension Matters to Startups (Survey 1)How Much This Dimension Matters to Startups (Survey 2)
Investor As First Customer
According to our survey, startup co-founders stated that having an investor become their “first customer” matters to them.
These co-founders perceive the corporate VC investor class as possessing the strongest likelihood of becoming the startup's “first customer” among competing investor classes.
For those startups that received corporate VC funds, corporate VCs were evaluated by startup co-founders as having under-delivered on the “first customer” dimension.
50
Corporate VCs Did Not Become Startups’ First Customer
All Rights Reserved. Copyright © 2019. Created by Joshua Eckblad, Academic Researcher at TiSEM in The Netherlands.
SUMMIT@RSM

-2
-1,75
-1,5
-1,25
-1
-0,75
-0,5
-0,25
0
0,25
0,5
0,75
1
1,25
1,5
1,75
2
Fina
ncia
l sup
port
Fair
equi
ty
No
boar
d re
pres
enta
tion
Repu
tatio
nal s
igna
l
Man
ufac
turin
g su
ppor
t
Firs
t cus
tom
er
Sale
s &
Mar
ketin
g
IPO
net
wor
k
R&D
supp
ort
HR
supp
ort
Geo
grap
hic
prox
imity
Cultu
ral p
roxi
mity
Com
mitm
ent t
ies
Inte
rper
sona
l tie
s
Prio
r exp
erie
nce
Indu
stry
exp
ertis
e
Com
patib
le e
xit p
refe
renc
e
Man
agem
ent c
ontro
l
Ope
ratio
nal s
uppo
rt
Stra
tegi
c ad
viso
ry
Stra
tegi
c al
lianc
e pa
rtne
rs
How Much This Dimension Matters to Startups (Survey 1)How Much This Dimension Matters to Startups (Survey 2)
Investor Support in Sales & Marketing
According to our survey, startup co-founders stated that receiving “sales & marketing support” from investors matters to them.
These co-founders perceive the corporate VC investor class as possessing the strongest “sales & marketing support” among competing investor classes.
For those startups that received corporate VC funds, corporate VCs were evaluated by startup co-founders as having under-delivered on the “sales & marketing support” dimension.
51
Corporate VCs Offered Inadequate Support in Sales & Marketing Activities
All Rights Reserved. Copyright © 2019. Created by Joshua Eckblad, Academic Researcher at TiSEM in The Netherlands.
SUMMIT@RSM

-2
-1,75
-1,5
-1,25
-1
-0,75
-0,5
-0,25
0
0,25
0,5
0,75
1
1,25
1,5
1,75
2
Fina
ncia
l sup
port
Fair
equi
ty
No
boar
d re
pres
enta
tion
Repu
tatio
nal s
igna
l
Man
ufac
turin
g su
ppor
t
Firs
t cus
tom
er
Sale
s &
Mar
ketin
g
IPO
net
wor
k
R&D
supp
ort
HR
supp
ort
Geo
grap
hic
prox
imity
Cultu
ral p
roxi
mity
Com
mitm
ent t
ies
Inte
rper
sona
l tie
s
Prio
r exp
erie
nce
Indu
stry
exp
ertis
e
Com
patib
le e
xit p
refe
renc
e
Man
agem
ent c
ontro
l
Ope
ratio
nal s
uppo
rt
Stra
tegi
c ad
viso
ry
Stra
tegi
c al
lianc
e pa
rtne
rs
How Much This Dimension Matters to Startups (Survey 1)How Much This Dimension Matters to Startups (Survey 2)
Investor Support in R&D
According to our survey, startup co-founders stated that receiving “R&D support” from investors matters to them.
These co-founders perceive the corporate VC investor class as possessing the strongest likelihood of providing “R&D support” among competing investor classes.
For those startups that received corporate VC funds, corporate VCs were evaluated by startup co-founders as having severely under-delivered on the “R&D support” dimension.
52
Corporate VCs Offered Inadequate Support in R&D Activities
All Rights Reserved. Copyright © 2019. Created by Joshua Eckblad, Academic Researcher at TiSEM in The Netherlands.
SUMMIT@RSM

-2
-1,75
-1,5
-1,25
-1
-0,75
-0,5
-0,25
0
0,25
0,5
0,75
1
1,25
1,5
1,75
2
Fina
ncia
l sup
port
Fair
equi
ty
No
boar
d re
pres
enta
tion
Repu
tatio
nal s
igna
l
Man
ufac
turin
g su
ppor
t
Firs
t cus
tom
er
Sale
s &
Mar
ketin
g
IPO
net
wor
k
R&D
supp
ort
HR
supp
ort
Geo
grap
hic
prox
imity
Cultu
ral p
roxi
mity
Com
mitm
ent t
ies
Inte
rper
sona
l tie
s
Prio
r exp
erie
nce
Indu
stry
exp
ertis
e
Com
patib
le e
xit p
refe
renc
e
Man
agem
ent c
ontro
l
Ope
ratio
nal s
uppo
rt
Stra
tegi
c ad
viso
ry
Stra
tegi
c al
lianc
e pa
rtne
rs
How Much This Dimension Matters to Startups (Survey 1)How Much This Dimension Matters to Startups (Survey 2)
Investor Support in HR
According to our survey, startup co-founders stated that receiving “HR support” from investors matters to them.
These co-founders perceive the private VC and corporate VC investor classes as providing the strongest “HR support” among competing investor classes.
For those startups that received corporate VC funds, corporate VCs were evaluated by startup co-founders as having severely under-delivered on the “HR support” dimension.
53
Corporate VCs Offered Inadequate Support in HR Support
All Rights Reserved. Copyright © 2019. Created by Joshua Eckblad, Academic Researcher at TiSEM in The Netherlands.
SUMMIT@RSM

-2
-1,75
-1,5
-1,25
-1
-0,75
-0,5
-0,25
0
0,25
0,5
0,75
1
1,25
1,5
1,75
2
Finan
cial s
uppo
rt
Fair e
quity
No bo
ard re
pres
entat
ion
Repu
tation
al sig
nal
Man
ufactu
ring s
uppo
rt
First
custo
mer
Sales
& M
arketi
ng
IPO ne
twor
k
R&D
supp
ort
HR su
ppor
t
Geog
raphic
prox
imity
Cultu
ral pr
oxim
ity
Com
mitm
ent ti
es
Interp
erson
al tie
s
Prior
expe
rienc
e
Indus
try ex
perti
se
Com
patib
le ex
it pref
erenc
e
Man
agem
ent c
ontro
l
Opera
tiona
l sup
port
Strate
gic ad
visor
y
Strate
gic al
lianc
e part
ners
How Much This Dimension Matters to Startups (Survey 1)How Much This Dimension Matters to Startups (Survey 2)
Investor Offers Strategic Advice
According to our survey, startup co-founders stated that receiving “strategic advice” from investors matters to them. Based on further interviews with startups, this dimension was added to the second wave of the Global Startup Fundraising Survey.
These co-founders perceive the private VC and corporate VC investor classes as possibly offering the strongest “strategic advice” among competing investor classes.
For those startups that received corporate VC funds, corporate VCs were evaluated by startup co-founders as having under-delivered on the “strategic advice” dimension.
54
Corporate VCs Offered Little to No Strategic Advice
All Rights Reserved. Copyright © 2019. Created by Joshua Eckblad, Academic Researcher at TiSEM in The Netherlands.
SUMMIT@RSM

Selection Criteria used by Startups to evaluate corporate VCs
Engagement Criteria & Success Factors
55
Success factors for working with corporate VCs
Communication modes between startups & Corporate VCs
(ordered: Highest to Least)
• Strategic fit • Deal terms • Relational compatibility • Corporate VC’s portfolio historical
performance • Industry expertise • Value-adding services • Corporate VC decision-making
speed • Corporate VC reputation for fair
treatment of startups • Compatible exit strategy • Operational support • Geographic proximity
(ordered: Highest to Least)
• Strategic fit • Relational compatibility • Interaction between the Startup and
Corporate business units • Constructive relationship between
the corporate VC and its corporate parent
• Representation of the corporate parent on the Startup’s board (exists in 26.3 percent of the cases; in 77.7% of the cases, the CVC sits on the startup’s board in some capacity)
• Operational support to the startup • Speed of the corporate VC team
(ordered: Highest to Least)
• Annual board meetings • Scheduled calls or meetings • Informal contact • Emails • Community/network events
NB: Communication frequency is typically monthly (similar to private VCs)
All Rights Reserved. Copyright © 2019. Created by Joshua Eckblad, Academic Researcher at TiSEM in The Netherlands.
SUMMIT@RSM

Please Distribute
https://www.corporateventuringresearch.org/2019-global-startup-fundraising-survey
56
Please communicate our 2019 survey to your portfolio companies !
All Rights Reserved. Copyright © 2019. Created by Joshua Eckblad, Academic Researcher at TiSEM in The Netherlands.
SUMMIT@RSM

Get Involvedin Evidence-based Research
(Startups, Corporates, & Private Intermediaries)
https://www.corporateventuringresearch.org/
All Rights Reserved. Copyright © 2019. Created by Joshua Eckblad, Academic Researcher at TiSEM in The Netherlands.
SUMMIT@RSM


![Springer,.Corporate Entrepreneurship and Venturing.[2005.ISBN0387249389]](https://img.pdfslide.net/doc/110x75/568c4b241a28ab49169b0952/springercorporate-entrepreneurship-and-venturing2005isbn0387249389.jpg)