Embed Size (px)
Citation preview
Corpus Linguistics and Linguistic Theory 8–2 (2012), 241 – 275 1613-7027/12/0008–0241DOI 10.1515/cllt-2012-0010 © Walter de Gruyter
Corpus frequency and acceptability judgments: A study of morphosyntactic
variants in Czech
Neil Bermel and ludek kNittl
Abstract
Using data from a 100-million-word representative corpus and a large-scale acceptability survey, we have investigated the relationship between corpus data and acceptability judgments. We conclude that the relative proportions of morphosyntactic variants in a corpus are the most significant predictor of a variant’s acceptability to native speakers, and that in particular high relative proportions of one variant in a corpus are reliable indicators of high accept-ability to native speakers. At the same time we note the limits of this predict-ability: low-frequency items, as noted elsewhere in the literature, often enjoy high levels of acceptability. Statistical preemption thus appears as a more lim-ited phenomenon than had heretofore been posited.
Keywords: morphosyntax, variation, preemption, entrenchment, Czech, grammaticality, paradigm
1. Introduction1
Corpora enable us to gather information about how often and in what contexts particular elements appear in a defined set of texts. A matter of more contro-versy is the extent to which corpus data clearly indicate anything about the structure of a particular language variety: for example, whether certain features found in a corpus are grammatical or not, or how acceptable they are, and conversely the extent to which we can expect to find documented in a corpus the full spread of features that native speakers consider grammatical and a cceptable.
For the empiricist, balanced and representative corpora dangle the t antalizing prospect that with a properly constructed cross-section of texts, we will gain an overview of the “totality” of a language’s (or variety’s) production. In other words, the frequency with which features appear in the corpus could mirror the
Brought to you by | Bibliotheque de l'Universite LavalAuthenticated | 132.203.227.63
Download Date | 7/13/14 6:18 PM
242 N. Bermel and L. Knittl
frequency with which native speakers produce them in ordinary speech or writ-ing situations.
However, if these texts comprehensively represent the textual environment surrounding the speakers of a language, then we might equally well ask w hether they influence native speakers’ apperception of linguistic forms. In experimental situations in which a native user is asked to insert a form into a context (so-called “forced-choice” tasks), he will normally choose one per i nstance, as he would do “in the wild”, even if multiple forms are possible. Although only one form is chosen, his evaluation of all the possible forms could be affected by the extent to which he sees and/or hears them in his l inguistic milieu. These “off-line” judgments as to the acceptability of forms might provide a clue as to why variation is so extensive and persistent in cer-tain aspects of language, and a properly structured survey could potentially uncover connections between the frequency of items and their acceptability to native speakers.
In the current contribution, we will first situate our study in the current d ebates over usage and structure (Section 2), outlining briefly the emergentist and nativist views on this issue. We then look briefly at the sort of information we can expect to gain from acceptability judgments (Section 3), and outline our hypotheses (Section 4). The following sections (5 and 6) give brief descrip-tions of Czech, the language from which we draw our data, and the corpus used. In Sections 7–10, we describe the survey design and implementation, and the results of our analysis of survey and corpus data are presented in Sections 11–13, which demonstrate consistent, significant correlations between corpus frequency and acceptability data, in particular, the strong predictive s ignificance of high relative proportions of a form in the corpus and of low acceptability in a survey. In the concluding sections (14 –15), we offer some proposals about what our results mean for emergentist models more generally.2
2. Therelationshipbetweenusageandstructure
Our immediate goal is to examine the relationship between corpus data and survey data, but we will briefly mention its potential links to the ongoing d ebates about usage and structure. To oversimplify greatly: stances on the role of usage in influencing or creating structure fall into one of two predictable camps. Either structure emerges based on usage experienced (the emergentist view), or structure is native (the nativist view) and usage only influences a small number of peripheral areas where “true” structure meets discourse and pragmatics (for emergentist perspectives on this dichotomy see e.g. Ellis [2005], Goldberg [2003: 222]).3
Brought to you by | Bibliotheque de l'Universite LavalAuthenticated | 132.203.227.63
Download Date | 7/13/14 6:18 PM
Corpus frequency and acceptability judgments 243
A unified, coherent case for the emergentist position has begun to take shape over the past two decades. We can trace to it the concept of entrenchment, which hypothesizes that forms and constructions are fixed through repeated exposure and usage, and that these entrenched items form the basis of our lin-guistic structure (see e.g. Ambridge et al. [2008] for one example of how e ntrenchment takes place in the argument structure of English verbs). Statis-tical preemption specifies that entities achieving predominance in usage over competing entities render potential competitors unacceptable to speakers (see Goldberg [2009: 102] on the success of statistical preemption in syntax).
Divjak (2008), however, points out a particular difficulty with this model: while it explains developmentally the mechanisms for suppressing certain con-structions, it cannot explain why some constructions continue to be used at low levels of frequency relative to more prosperous alternatives, when there is no obvious motivation for maintaining such variation. She also finds that low-frequency syntactic constructions often enjoyed high acceptability ratings from native speakers, which is a further puzzle.
If the preemption model is correct as it stands, it suggests that either such constructions are being maintained because acceptability ratings are not telling us anything useful about how speakers select among variants; or that the varia-tion is explained by something about the distribution of forms (e.g. syntactic environment, semantic groupings, user data). We will address the first possibil-ity below, and the second possibility will be taken up in the course of our analysis of the data. If neither is correct, then we will have to consider the pos-sibility that acceptability judgments are telling us something else about usage and structure that is not part of current models.
3. Theusefulnessofacceptabilityjudgments
In our study, respondents evaluated competing variant forms in Czech. The two terms used for these evaluations – grammaticality and acceptability – sometimes appear interchangeable, but a preference one or the other can carry theoretical implications, as noted in Schütze (1996), and subsequent r esearchers have justified their choices accordingly. Featherston (2005: 673– 674) chooses grammaticality, defining it as “atheoretical syntactic wellformedness”, while Bader and Häussler (2009: 4 – 6) use this term as well, while acknowledging that they are actually investigating a form of acceptability. The term gram-maticality is often seen to imply a binary choice (well-formed vs. ill-formed ), and researchers frequently take pains to define it as a gradation (e.g. Kempen and Harbusch 2008 employ the term gradient grammaticality ratings rather than acceptability judgments).
Brought to you by | Bibliotheque de l'Universite LavalAuthenticated | 132.203.227.63
Download Date | 7/13/14 6:18 PM
244 N. Bermel and L. Knittl
Our choice of acceptability is motivated by its focus on performance rather than competence (see Stefanowitsch [2006: 73]), its less binary character, and our desire to avoid labeling approval or lack thereof for one ending or another as a judgment of “syntactic wellformedness”, see e.g. studies like McKoon and Macfarland (2000), which employ the term acceptability in investigating the use of change of state verbs. The current study attempts to elucidate one as-pect of this question: What, if anything, do quantitative data from a large-scale representative corpus tell us about the way native speakers evaluate these forms?
Acceptability judgments occupy an uneasy place in linguistics between data- and intuition-driven methods, and they have often been accepted with reservations, if at all.
Empirical linguists have sometimes regarded acceptability judgment s urveys as an outgrowth of the sort of “armchair linguistics” that their work tries to avoid. On this account, a survey of one hundred people labeling sentences as acceptable or otherwise, and a “survey” in which a single linguist does this himself, are seen as equally flawed (e.g. Sampson [2007: 115], which warns off the use of intuitive judgments on principle).
A more moderate skepticism can be found in Wasow and Arnold (2004), who adduce a number of practical reasons why it is difficult to trust linguistic intuitions. Forced-choice or open-ended surveys may be seen as more reliable, as they give direct evidence of performance, rather than accepting at face value the contention that attitudes and performance are linked. Corpus linguistics, as a branch of empirical linguistics, has expressed a similar preference for gather-ing data that represents usage, rather than attitudes, although this may be d irected primarily against the reflexive use of individual judgments as a short-cut, rather than against large-scale studies (see Stefanowitsch [2006] for a case against individual acceptability judgments).4
Adherents of rationalist/mentalist models of language may reject the need for such surveys, as they are not necessary if data can be rapidly and accu-rately derived from a single researcher’s introspection. Newmeyer (2003), for example, exemplifies a modern justification for maintaining the strict divide between grammar and usage, whether it be corpus-based or survey-based; he wants a role for probability and frequency in language that is limited to syntag-matic applications of an innate grammar. While he does not outright dismiss the use of corpora or surveys, he strictly circumscribes the situations where he deems their use to be appropriate, as he feels that “[t]here is no way that one can draw conclusions about the grammar of an individual from usage facts about communities, particularly communities from which the individual r eceives no speech input” (2003: 696). This goes to an example where a corpus of New York Times texts is mined to explain why children, who presumably by and large do not read the Times, acquire items in a particular order. It would
Brought to you by | Bibliotheque de l'Universite LavalAuthenticated | 132.203.227.63
Download Date | 7/13/14 6:18 PM
Corpus frequency and acceptability judgments 245
appear to be a straw man: an outlying example that can be used as a target to discredit all such surveys.
The hesitance among some linguists to make use of acceptability surveys and online tasks has been a concern in the field. Gordon and Hendrick posit that the generally “surprising absence of systematic experimental studies of intuitions of syntactic well-formedness that meet even minimal standards of experimental rigor” is the result, in part, of “the sentiment of generative lin-guists that the trappings of experimentation reveal nothing not already avail-able to introspection” (1997: 334). The fact that Featherston (2007) echoes this concern ten years later shows that empiricism is far from being universally embraced by generative linguists.
Against these skeptical views, acceptability judgments are found by many to be a useful source of data (although, as with any source, they must be used carefully; see e.g. Sprouse [2007, 2008, 2009] for a discussion of the limits of acceptability judgments). Arppe and Järvikivi (2007) argue for including acceptability surveys in the empiricist’s arsenal, as does Hoffmann (2006). Some recent work has shown strong consistencies between different types of judgments and given renewed credence to the use of acceptability judgments. Bader and Häussler (2009) found that magnitude estimation, speeded binary grammaticality judgments and offline binary grammaticality judgments gave broadly similar results and on this basis made a plea for the reasonability of both sorts of tasks, noting that contrary to belief, non-linguist native speakers seem to have little difficulty judging abstract concepts like “grammaticality” (2009: 49–50). Featherston (2005) points to the relative consistency of judg-ment data gathered via magnitude estimation, showing that respondents’ r esponses are distributed fairly evenly across the scale, with little evidence of “bunching” of judgments.
4. Hypothesesanddiscussion
In a pilot study (Bermel [2010]), three hypotheses were formulated regarding the relationship between corpus data and acceptability judgments:
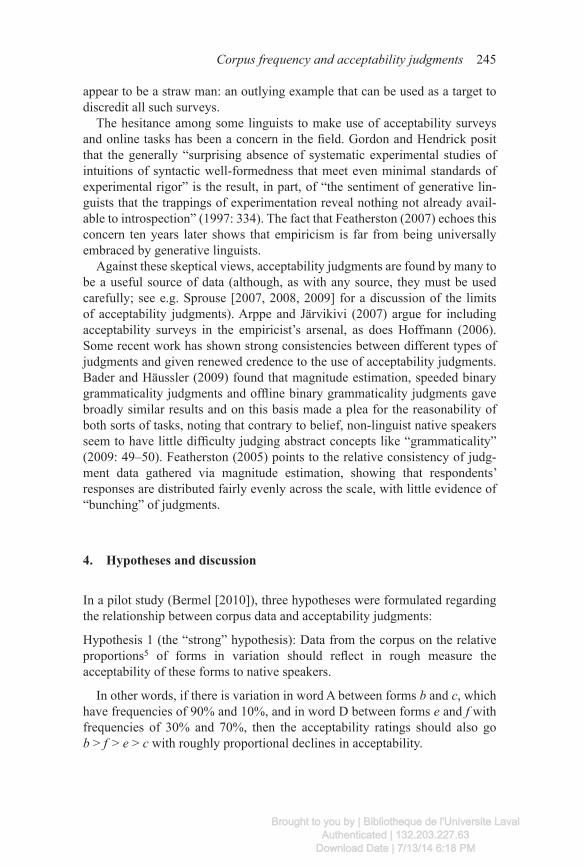
Hypothesis 1 (the “strong” hypothesis): Data from the corpus on the relative proportions5 of forms in variation should reflect in rough measure the acceptability of these forms to native speakers.
In other words, if there is variation in word A between forms b and c, which have frequencies of 90% and 10%, and in word D between forms e and f with frequencies of 30% and 70%, then the acceptability ratings should also go b > f > e > c with roughly proportional declines in acceptability.
Brought to you by | Bibliotheque de l'Universite LavalAuthenticated | 132.203.227.63
Download Date | 7/13/14 6:18 PM
246 N. Bermel and L. Knittl
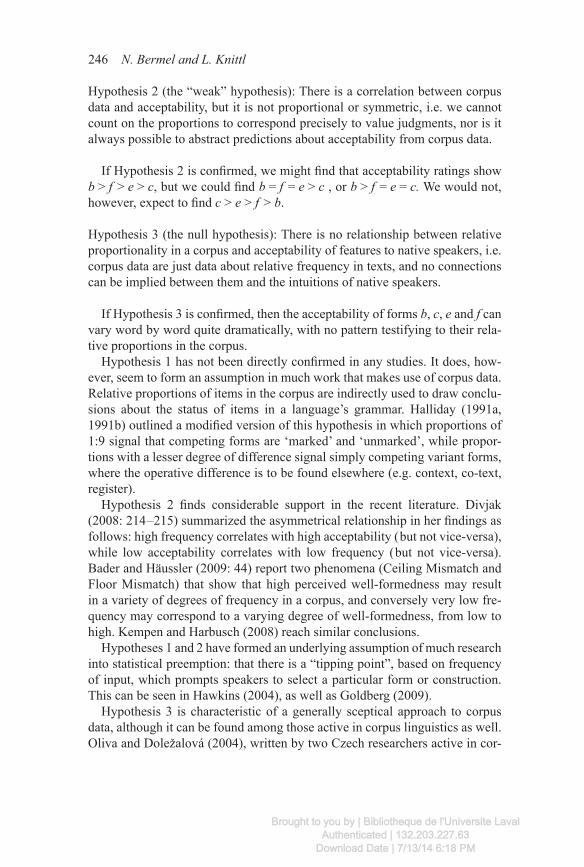
Hypothesis 2 (the “weak” hypothesis): There is a correlation between corpus data and acceptability, but it is not proportional or symmetric, i.e. we cannot count on the proportions to correspond precisely to value judgments, nor is it always possible to abstract predictions about acceptability from corpus data.
If Hypothesis 2 is confirmed, we might find that acceptability ratings show b > f > e > c, but we could find b = f = e > c , or b > f = e = c. We would not, however, expect to find c > e > f > b.
Hypothesis 3 (the null hypothesis): There is no relationship between relative proportionality in a corpus and acceptability of features to native speakers, i.e. corpus data are just data about relative frequency in texts, and no connections can be implied between them and the intuitions of native speakers.
If Hypothesis 3 is confirmed, then the acceptability of forms b, c, e and f can vary word by word quite dramatically, with no pattern testifying to their rela-tive proportions in the corpus.
Hypothesis 1 has not been directly confirmed in any studies. It does, how-ever, seem to form an assumption in much work that makes use of corpus data. Relative proportions of items in the corpus are indirectly used to draw conclu-sions about the status of items in a language’s grammar. Halliday (1991a, 1991b) outlined a modified version of this hypothesis in which proportions of 1:9 signal that competing forms are ‘marked’ and ‘unmarked’, while propor-tions with a lesser degree of difference signal simply competing variant forms, where the operative difference is to be found elsewhere (e.g. context, co-text, register).
Hypothesis 2 finds considerable support in the recent literature. Divjak (2008: 214 –215) summarized the asymmetrical relationship in her findings as follows: high frequency correlates with high acceptability ( but not vice-versa), while low acceptability correlates with low frequency ( but not vice-versa). Bader and Häussler (2009: 44) report two phenomena (Ceiling Mismatch and Floor Mismatch) that show that high perceived well-formedness may result in a variety of degrees of frequency in a corpus, and conversely very low fre-quency may correspond to a varying degree of well-formedness, from low to high. Kempen and Harbusch (2008) reach similar conclusions.
Hypotheses 1 and 2 have formed an underlying assumption of much r esearch into statistical preemption: that there is a “tipping point”, based on frequency of input, which prompts speakers to select a particular form or construction. This can be seen in Hawkins (2004), as well as Goldberg (2009).
Hypothesis 3 is characteristic of a generally sceptical approach to corpus data, although it can be found among those active in corpus linguistics as well. Oliva and Doležalová (2004), written by two Czech researchers active in cor-
Brought to you by | Bibliotheque de l'Universite LavalAuthenticated | 132.203.227.63
Download Date | 7/13/14 6:18 PM
Corpus frequency and acceptability judgments 247
pus creation, casts doubt on the conclusions that can reliably be drawn from corpus data, given that corpora attest ungrammatical structures and fail to a ttest many grammatical ones.
5. Czechmorphosyntax
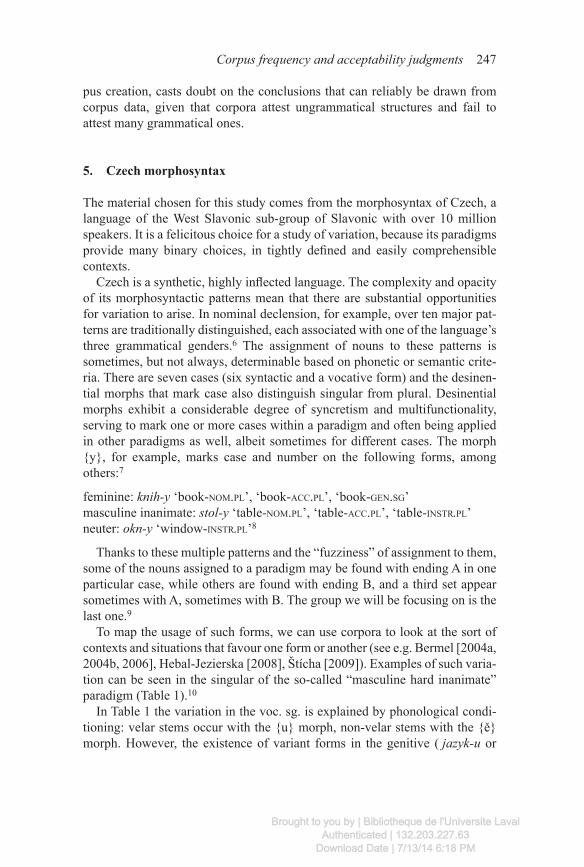
The material chosen for this study comes from the morphosyntax of Czech, a language of the West Slavonic sub-group of Slavonic with over 10 million speakers. It is a felicitous choice for a study of variation, because its paradigms provide many binary choices, in tightly defined and easily comprehensible contexts.
Czech is a synthetic, highly inflected language. The complexity and opacity of its morphosyntactic patterns mean that there are substantial opportunities for variation to arise. In nominal declension, for example, over ten major pat-terns are traditionally distinguished, each associated with one of the language’s three grammatical genders.6 The assignment of nouns to these patterns is sometimes, but not always, determinable based on phonetic or semantic crite-ria. There are seven cases (six syntactic and a vocative form) and the desinen-tial morphs that mark case also distinguish singular from plural. Desinential morphs exhibit a considerable degree of syncretism and multifunctionality, serving to mark one or more cases within a paradigm and often being applied in other paradigms as well, albeit sometimes for different cases. The morph {y}, for example, marks case and number on the following forms, among o thers:7
feminine: knih-y ‘book-nom.pl’, ‘book-acc.pl’, ‘book-gen.sg’masculine inanimate: stol-y ‘table-nom.pl’, ‘table-acc.pl’, ‘table-instr.pl’neuter: okn-y ‘window-instr.pl’8
Thanks to these multiple patterns and the “fuzziness” of assignment to them, some of the nouns assigned to a paradigm may be found with ending A in one particular case, while others are found with ending B, and a third set appear sometimes with A, sometimes with B. The group we will be focusing on is the last one.9
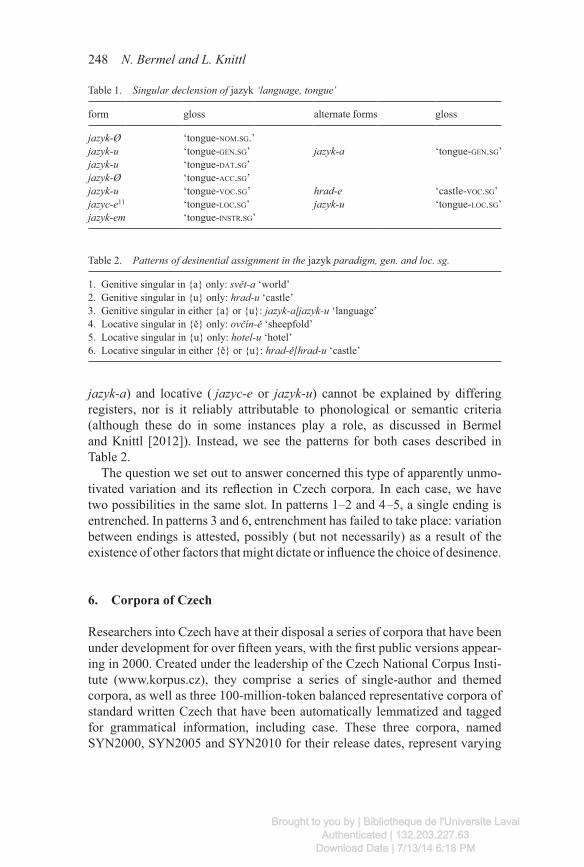
To map the usage of such forms, we can use corpora to look at the sort of contexts and situations that favour one form or another (see e.g. Bermel [2004a, 2004b, 2006], Hebal-Jezierska [2008], Štícha [2009]). Examples of such varia-tion can be seen in the singular of the so-called “masculine hard inanimate” paradigm (Table 1).10
In Table 1 the variation in the voc. sg. is explained by phonological condi-tioning: velar stems occur with the {u} morph, non-velar stems with the {ě} morph. However, the existence of variant forms in the genitive ( jazyk-u or
Brought to you by | Bibliotheque de l'Universite LavalAuthenticated | 132.203.227.63
Download Date | 7/13/14 6:18 PM
248 N. Bermel and L. Knittl
jazyk-a) and locative ( jazyc-e or jazyk-u) cannot be explained by differing registers, nor is it reliably attributable to phonological or semantic criteria (a lthough these do in some instances play a role, as discussed in Bermel and Knittl [2012]). Instead, we see the patterns for both cases described in Table 2.
The question we set out to answer concerned this type of apparently unmo-tivated variation and its reflection in Czech corpora. In each case, we have two possibilities in the same slot. In patterns 1–2 and 4 –5, a single ending is entrenched. In patterns 3 and 6, entrenchment has failed to take place: variation between endings is attested, possibly ( but not necessarily) as a result of the existence of other factors that might dictate or influence the choice of d esinence.
6. CorporaofCzech
Researchers into Czech have at their disposal a series of corpora that have been under development for over fifteen years, with the first public versions appear-ing in 2000. Created under the leadership of the Czech National Corpus Insti-tute (www.korpus.cz), they comprise a series of single-author and themed c orpora, as well as three 100-million-token balanced representative corpora of standard written Czech that have been automatically lemmatized and tagged for grammatical information, including case. These three corpora, named SYN2000, SYN2005 and SYN2010 for their release dates, represent varying
Table 1. Singular declension of jazyk ‘language, tongue’
form gloss alternate forms gloss
jazyk-Ø ‘tongue-nom.sg.’jazyk-u ‘tongue-gen.sg’ jazyk-a ‘tongue-gen.sg’jazyk-u ‘tongue-dat.sg’jazyk-Ø ‘tongue-acc.sg’jazyk-u ‘tongue-voc.sg’ hrad-e ‘castle-voc.sg’jazyc-e11 ‘tongue-loc.sg’ jazyk-u ‘tongue-loc.sg’jazyk-em ‘tongue-instr.sg’
Table 2. Patterns of desinential assignment in the jazyk paradigm, gen. and loc. sg.
1. Genitive singular in {a} only: svět-a ‘world’2. Genitive singular in {u} only: hrad-u ‘castle’3. Genitive singular in either {a} or {u}: jazyk-a/jazyk-u ‘language’4. Locative singular in {ě} only: ovčín-ě ‘sheepfold’5. Locative singular in {u} only: hotel-u ‘hotel’6. Locative singular in either {ě} or {u}: hrad-ě/ hrad-u ‘castle’
Brought to you by | Bibliotheque de l'Universite LavalAuthenticated | 132.203.227.63
Download Date | 7/13/14 6:18 PM
Corpus frequency and acceptability judgments 249
perspectives on representativity, although all are based on research into the reading habits of contemporary Czechs and are meant to give (three distinct) pictures of the printed world that surrounds the average Czech.12
For our research, we made use primarily of the SYN2005 corpus, which was the newest available at the time. It consists of 40% fiction and other literature (so-called “imaginative” prose that includes biography and popular history, for example), 33% journalistic texts, and 27% technical and specialist writing. As opposed to the older SYN2000, it has a minimum of texts from earlier than 1950, with most of the fiction and non-fiction coming from 1990 onwards, and the journalistic texts balanced between a variety of newspapers and popular magazines from 2000 –2004.
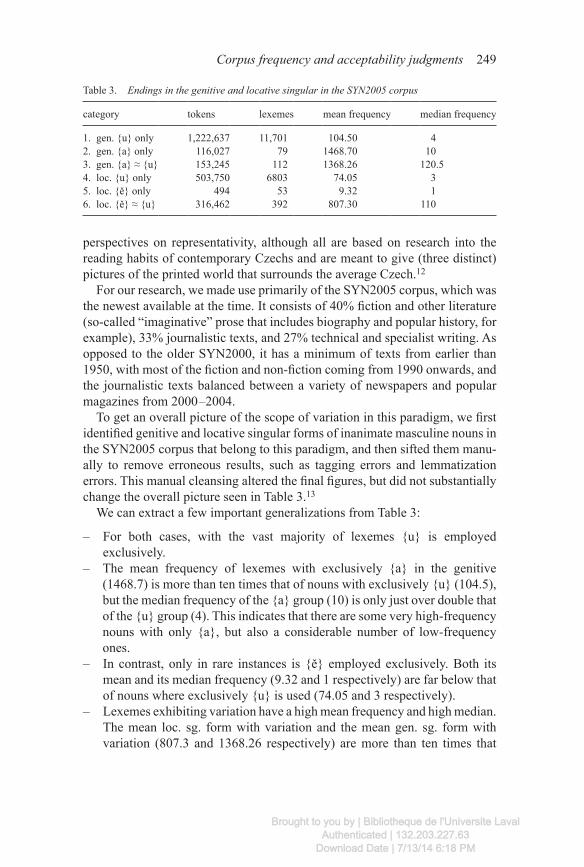
To get an overall picture of the scope of variation in this paradigm, we first identified genitive and locative singular forms of inanimate masculine nouns in the SYN2005 corpus that belong to this paradigm, and then sifted them manu-ally to remove erroneous results, such as tagging errors and lemmatization e rrors. This manual cleansing altered the final figures, but did not substantially change the overall picture seen in Table 3.13
We can extract a few important generalizations from Table 3:
– For both cases, with the vast majority of lexemes {u} is employed e xclusively.
– The mean frequency of lexemes with exclusively {a} in the genitive (1468.7) is more than ten times that of nouns with exclusively {u} (104.5), but the median frequency of the {a} group (10) is only just over double that of the {u} group (4). This indicates that there are some very high-frequency nouns with only {a}, but also a considerable number of low-frequency ones.
– In contrast, only in rare instances is {ě} employed exclusively. Both its mean and its median frequency (9.32 and 1 respectively) are far below that of nouns where exclusively {u} is used (74.05 and 3 respectively).
– Lexemes exhibiting variation have a high mean frequency and high m edian. The mean loc. sg. form with variation and the mean gen. sg. form with variation (807.3 and 1368.26 respectively) are more than ten times that
Table 3. Endings in the genitive and locative singular in the SYN2005 corpus
category tokens lexemes mean frequency median frequency
1. gen. {u} only 1,222,637 11,701 104.50 42. gen. {a} only 116,027 79 1468.70 103. gen. {a} ≈ {u} 153,245 112 1368.26 120.54. loc. {u} only 503,750 6803 74.05 35. loc. {ě} only 494 53 9.32 16. loc. {ě} ≈ {u} 316,462 392 807.30 110
Brought to you by | Bibliotheque de l'Universite LavalAuthenticated | 132.203.227.63
Download Date | 7/13/14 6:18 PM
250 N. Bermel and L. Knittl
of the exclusively {u} lexemes (74.05 and 104.5 respectively) and their median values (110 and 120.5 respectively) are 30 – 40 times the median values of the exclusively {u} lexemes (3 and 4 respectively).
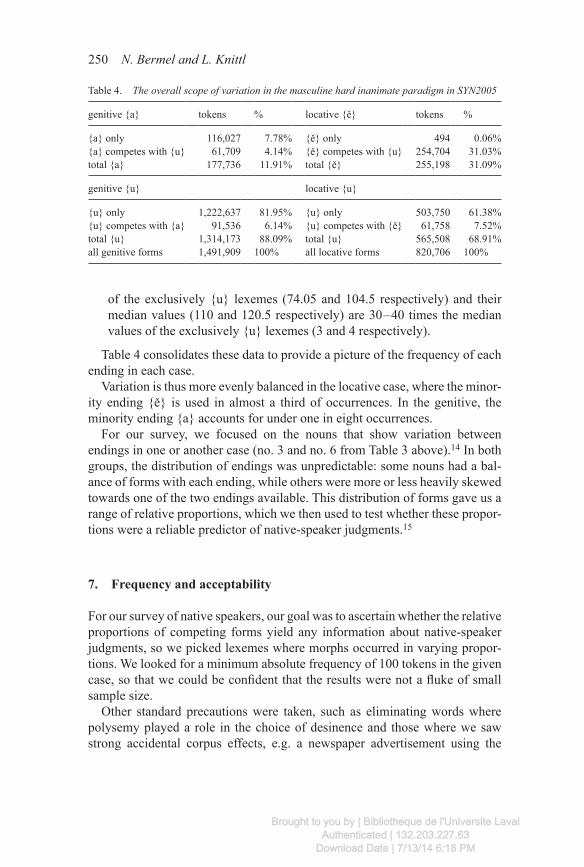
Table 4 consolidates these data to provide a picture of the frequency of each ending in each case.
Variation is thus more evenly balanced in the locative case, where the minor-ity ending {ě} is used in almost a third of occurrences. In the genitive, the minority ending {a} accounts for under one in eight occurrences.
For our survey, we focused on the nouns that show variation between e ndings in one or another case (no. 3 and no. 6 from Table 3 above).14 In both groups, the distribution of endings was unpredictable: some nouns had a bal-ance of forms with each ending, while others were more or less heavily skewed towards one of the two endings available. This distribution of forms gave us a range of relative proportions, which we then used to test whether these propor-tions were a reliable predictor of native-speaker judgments.15
7. Frequencyandacceptability
For our survey of native speakers, our goal was to ascertain whether the r elative proportions of competing forms yield any information about native-speaker judgments, so we picked lexemes where morphs occurred in varying propor-tions. We looked for a minimum absolute frequency of 100 tokens in the given case, so that we could be confident that the results were not a fluke of small sample size.
Other standard precautions were taken, such as eliminating words where polysemy played a role in the choice of desinence and those where we saw strong accidental corpus effects, e.g. a newspaper advertisement using the
Table 4. The overall scope of variation in the masculine hard inanimate paradigm in SYN2005
genitive {a} tokens % locative {ě} tokens %
{a} only 116,027 7.78% {ě} only 494 0.06%{a} competes with {u} 61,709 4.14% {ě} competes with {u} 254,704 31.03%total {a} 177,736 11.91% total {ě} 255,198 31.09%
genitive {u} locative {u}
{u} only 1,222,637 81.95% {u} only 503,750 61.38%{u} competes with {a} 91,536 6.14% {u} competes with {ě} 61,758 7.52%total {u} 1,314,173 88.09% total {u} 565,508 68.91%all genitive forms 1,491,909 100% all locative forms 820,706 100%
Brought to you by | Bibliotheque de l'Universite LavalAuthenticated | 132.203.227.63
Download Date | 7/13/14 6:18 PM
Corpus frequency and acceptability judgments 251
form in question that appeared e.g. 20 times during the sample period could influence the results considerably, while being only debatably 20 separate e xamples.
A further aid to this is the average reduced frequency (ARF), which is a measure of the distribution of the form throughout the corpus and is easily a ccessible with each search performed in the CNC. It is calculated by dividing the corpus into N equal-sized segments, where N is the number of tokens of the given feature found, and determining how many of these segments contain one or more tokens (Hlaváčová [2004]). If an item were to be distributed at per-fectly regular intervals through the corpus, its ARF would be the same as its absolute frequency. Because the corpus is structured genre by genre, with like texts near each other, forms characteristic for a single author or a particular style or genre will have a lower ARF compared to absolute frequency, because their examples will be clustered close to each other in the corpus. We looked for forms where the ARF is higher relative to its absolute frequency; a higher ARF indicates that the forms are more widely dispersed throughout the corpus, and are less likely to be judged as bound to a confounding feature such as genre or authorial idiolect.
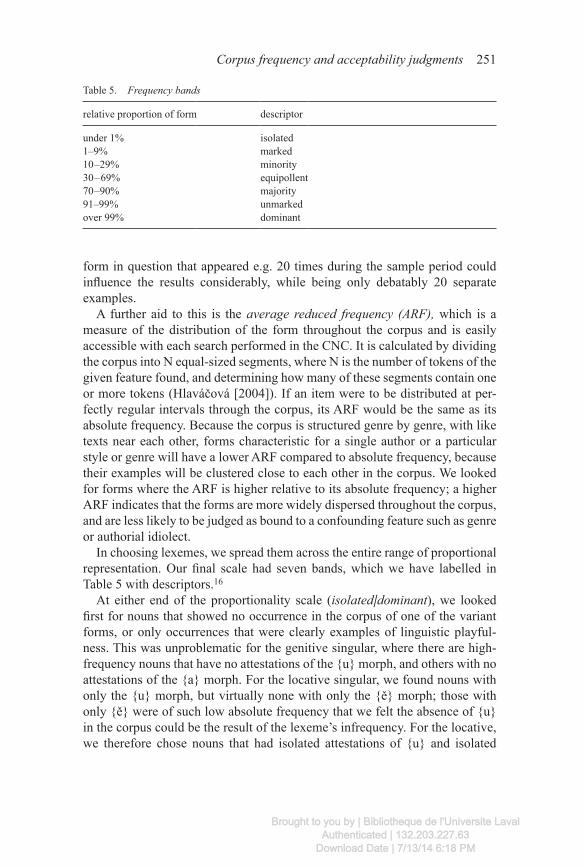
In choosing lexemes, we spread them across the entire range of proportional representation. Our final scale had seven bands, which we have labelled in Table 5 with descriptors.16
At either end of the proportionality scale (isolated/dominant), we looked first for nouns that showed no occurrence in the corpus of one of the variant forms, or only occurrences that were clearly examples of linguistic playful-ness. This was unproblematic for the genitive singular, where there are high-frequency nouns that have no attestations of the {u} morph, and others with no attestations of the {a} morph. For the locative singular, we found nouns with only the {u} morph, but virtually none with only the {ě} morph; those with only {ě} were of such low absolute frequency that we felt the absence of {u} in the corpus could be the result of the lexeme’s infrequency. For the locative, we therefore chose nouns that had isolated attestations of {u} and isolated
Table 5. Frequency bands
relative proportion of form descriptor
under 1% isolated1–9% marked10 –29% minority30 – 69% equipollent70 –90% majority91–99% unmarkedover 99% dominant
Brought to you by | Bibliotheque de l'Universite LavalAuthenticated | 132.203.227.63
Download Date | 7/13/14 6:18 PM
252 N. Bermel and L. Knittl
a ttestations of {ě}. A fuller description of our lexical choices is given in Ber-mel and Knittl (2012).
The marked/unmarked bands were an attempt to test Halliday’s hypothesis that ratios of 9:1 are significant in indicating markedness or unmarkedness of forms (1991b: 43– 45). We then divided the remaining area between 10% and 90% into three broader bands. The equipollent band, despite being the b roadest, proved problematic for the genitive singular, as very few lexemes fell into it. Those that did tend to show lexical effects, such as obvious polysemy, or were of such low absolute frequency that we had little confidence in the results.17
To test acceptability, we asked for scalar judgments rather than using a forced-choice model. This decision was driven by our assumption that the r elationship between passive/aesthetic judgments and information from cor-pora of published texts would be more straightforward than would any con-nection between passive reception of texts and active production of forms. Respondents were asked to answer according to their first instinct and not to revisit sentences later; it was emphasized that this was not a test of their knowl-edge of standard Czech.18
The scale had descriptors at the anchor points 1 and 7. There were no d escriptors for points 2– 6, allowing respondents to subdivide the scale as they saw fit.19
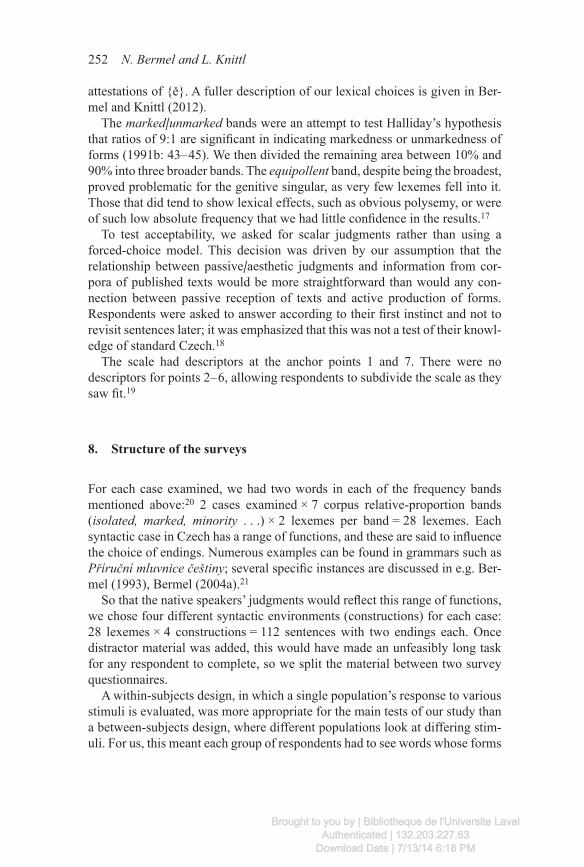
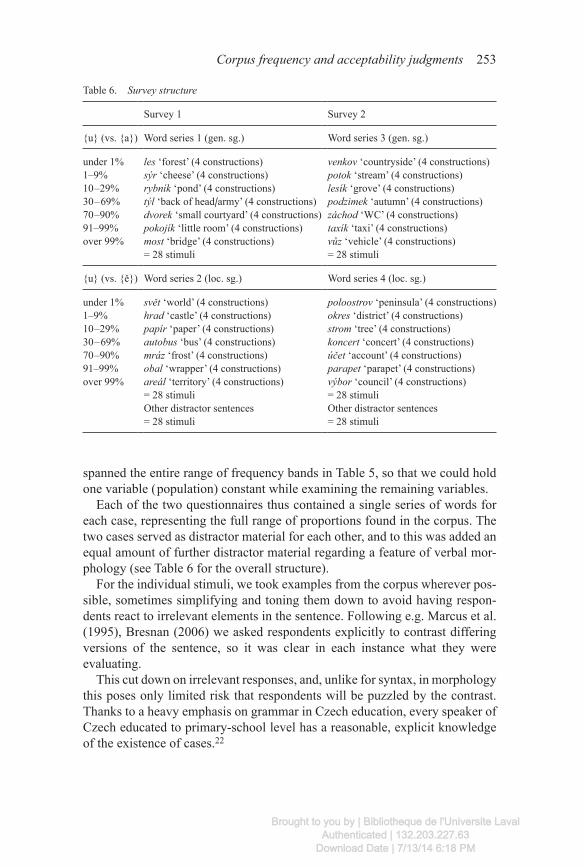
8. Structureofthesurveys
For each case examined, we had two words in each of the frequency bands mentioned above:20 2 cases examined × 7 corpus relative-proportion bands (isolated, marked, minority . . .) × 2 lexemes per band = 28 lexemes. Each s yntactic case in Czech has a range of functions, and these are said to influence the choice of endings. Numerous examples can be found in grammars such as Příruční mluvnice češtiny; several specific instances are discussed in e.g. Ber-mel (1993), Bermel (2004a).21
So that the native speakers’ judgments would reflect this range of functions, we chose four different syntactic environments (constructions) for each case: 28 lexemes × 4 constructions = 112 sentences with two endings each. Once distractor material was added, this would have made an unfeasibly long task for any respondent to complete, so we split the material between two survey questionnaires.
A within-subjects design, in which a single population’s response to various stimuli is evaluated, was more appropriate for the main tests of our study than a between-subjects design, where different populations look at differing stim-uli. For us, this meant each group of respondents had to see words whose forms
Brought to you by | Bibliotheque de l'Universite LavalAuthenticated | 132.203.227.63
Download Date | 7/13/14 6:18 PM
Corpus frequency and acceptability judgments 253
spanned the entire range of frequency bands in Table 5, so that we could hold one variable ( population) constant while examining the remaining variables.
Each of the two questionnaires thus contained a single series of words for each case, representing the full range of proportions found in the corpus. The two cases served as distractor material for each other, and to this was added an equal amount of further distractor material regarding a feature of verbal mor-phology (see Table 6 for the overall structure).
For the individual stimuli, we took examples from the corpus wherever pos-sible, sometimes simplifying and toning them down to avoid having respon-dents react to irrelevant elements in the sentence. Following e.g. Marcus et al. (1995), Bresnan (2006) we asked respondents explicitly to contrast differing versions of the sentence, so it was clear in each instance what they were e valuating.
This cut down on irrelevant responses, and, unlike for syntax, in m orphology this poses only limited risk that respondents will be puzzled by the contrast. Thanks to a heavy emphasis on grammar in Czech education, every speaker of Czech educated to primary-school level has a reasonable, explicit knowledge of the existence of cases.22
Table 6. Survey structure
Survey 1 Survey 2
{u} (vs. {a}) Word series 1 (gen. sg.) Word series 3 (gen. sg.)
under 1% les ‘forest’ (4 constructions) venkov ‘countryside’ (4 constructions)1–9% sýr ‘cheese’ (4 constructions) potok ‘stream’ (4 constructions)10 –29% rybník ‘pond’ (4 constructions) lesík ‘grove’ (4 constructions)30 – 69% týl ‘back of head/army’ (4 constructions) podzimek ‘autumn’ (4 constructions)70 –90% dvorek ‘small courtyard’ (4 constructions) záchod ‘WC’ (4 constructions)91–99% pokojík ‘little room’ (4 constructions) taxík ‘taxi’ (4 constructions)over 99% most ‘bridge’ (4 constructions) vůz ‘vehicle’ (4 constructions)
= 28 stimuli = 28 stimuli
{u} (vs. {ě}) Word series 2 (loc. sg.) Word series 4 (loc. sg.)
under 1% svět ‘world’ (4 constructions) poloostrov ‘peninsula’ (4 constructions)1–9% hrad ‘castle’ (4 constructions) okres ‘district’ (4 constructions)10 –29% papír ‘paper’ (4 constructions) strom ‘tree’ (4 constructions)30 – 69% autobus ‘bus’ (4 constructions) koncert ‘concert’ (4 constructions)70 –90% mráz ‘frost’ (4 constructions) účet ‘account’ (4 constructions)91–99% obal ‘wrapper’ (4 constructions) parapet ‘parapet’ (4 constructions)over 99% areál ‘territory’ (4 constructions) výbor ‘council’ (4 constructions)
= 28 stimuli = 28 stimuliOther distractor sentences Other distractor sentences= 28 stimuli = 28 stimuli
Brought to you by | Bibliotheque de l'Universite LavalAuthenticated | 132.203.227.63
Download Date | 7/13/14 6:18 PM
254 N. Bermel and L. Knittl
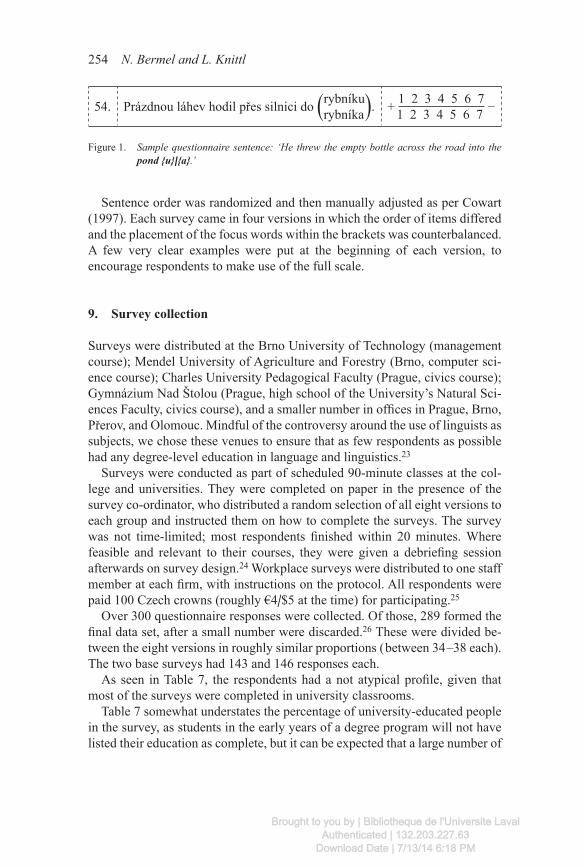
Sentence order was randomized and then manually adjusted as per Cowart (1997). Each survey came in four versions in which the order of items differed and the placement of the focus words within the brackets was counterbalanced. A few very clear examples were put at the beginning of each version, to e ncourage respondents to make use of the full scale.
9. Surveycollection
Surveys were distributed at the Brno University of Technology (management course); Mendel University of Agriculture and Forestry (Brno, computer sci-ence course); Charles University Pedagogical Faculty (Prague, civics course); Gymnázium Nad Štolou (Prague, high school of the University’s Natural Sci-ences Faculty, civics course), and a smaller number in offices in Prague, Brno, Přerov, and Olomouc. Mindful of the controversy around the use of linguists as subjects, we chose these venues to ensure that as few respondents as possible had any degree-level education in language and linguistics.23
Surveys were conducted as part of scheduled 90-minute classes at the col-lege and universities. They were completed on paper in the presence of the survey co-ordinator, who distributed a random selection of all eight versions to each group and instructed them on how to complete the surveys. The survey was not time-limited; most respondents finished within 20 minutes. Where f easible and relevant to their courses, they were given a debriefing session a fterwards on survey design.24 Workplace surveys were distributed to one staff member at each firm, with instructions on the protocol. All respondents were paid 100 Czech crowns (roughly €4/$5 at the time) for participating.25
Over 300 questionnaire responses were collected. Of those, 289 formed the final data set, after a small number were discarded.26 These were divided be-tween the eight versions in roughly similar proportions ( between 34 –38 each). The two base surveys had 143 and 146 responses each.
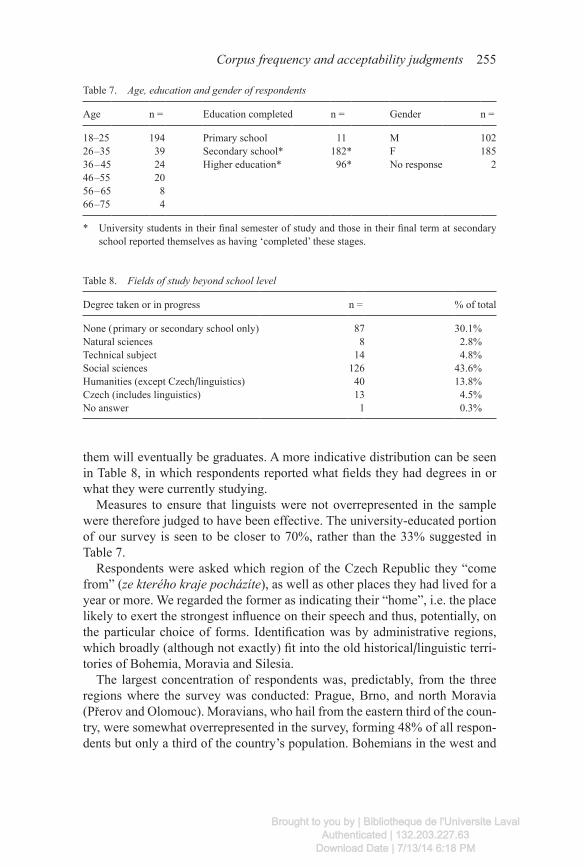
As seen in Table 7, the respondents had a not atypical profile, given that most of the surveys were completed in university classrooms.
Table 7 somewhat understates the percentage of university-educated people in the survey, as students in the early years of a degree program will not have listed their education as complete, but it can be expected that a large number of
Figure 1. Sample questionnaire sentence: ‘He threw the empty bottle across the road into the pond {u}/{a}.’
54. Prázdnou láhev hodil přes silnici do (rybníku).rybníka + 1 2 3 4 5 6 7 −1 2 3 4 5 6 7
Brought to you by | Bibliotheque de l'Universite LavalAuthenticated | 132.203.227.63
Download Date | 7/13/14 6:18 PM
Corpus frequency and acceptability judgments 255
them will eventually be graduates. A more indicative distribution can be seen in Table 8, in which respondents reported what fields they had degrees in or what they were currently studying.
Measures to ensure that linguists were not overrepresented in the sample were therefore judged to have been effective. The university-educated portion of our survey is seen to be closer to 70%, rather than the 33% suggested in Table 7.
Respondents were asked which region of the Czech Republic they “come from” (ze kterého kraje pocházíte), as well as other places they had lived for a year or more. We regarded the former as indicating their “home”, i.e. the place likely to exert the strongest influence on their speech and thus, potentially, on the particular choice of forms. Identification was by administrative regions, which broadly (although not exactly) fit into the old historical/linguistic terri-tories of Bohemia, Moravia and Silesia.
The largest concentration of respondents was, predictably, from the three regions where the survey was conducted: Prague, Brno, and north Moravia (Přerov and Olomouc). Moravians, who hail from the eastern third of the coun-try, were somewhat overrepresented in the survey, forming 48% of all respon-dents but only a third of the country’s population. Bohemians in the west and
Table 7. Age, education and gender of respondents
Age n = Education completed n = Gender n =
18–25 194 Primary school 11 M 10226 –35 39 Secondary school* 182* F 18536 – 45 24 Higher education* 96* No response 246 –55 2056 – 65 866 –75 4
* University students in their final semester of study and those in their final term at secondary school reported themselves as having ‘completed’ these stages.
Table 8. Fields of study beyond school level
Degree taken or in progress n = % of total
None ( primary or secondary school only) 87 30.1%Natural sciences 8 2.8%Technical subject 14 4.8%Social sciences 126 43.6%Humanities (except Czech/linguistics) 40 13.8%Czech (includes linguistics) 13 4.5%No answer 1 0.3%
Brought to you by | Bibliotheque de l'Universite LavalAuthenticated | 132.203.227.63
Download Date | 7/13/14 6:18 PM
256 N. Bermel and L. Knittl
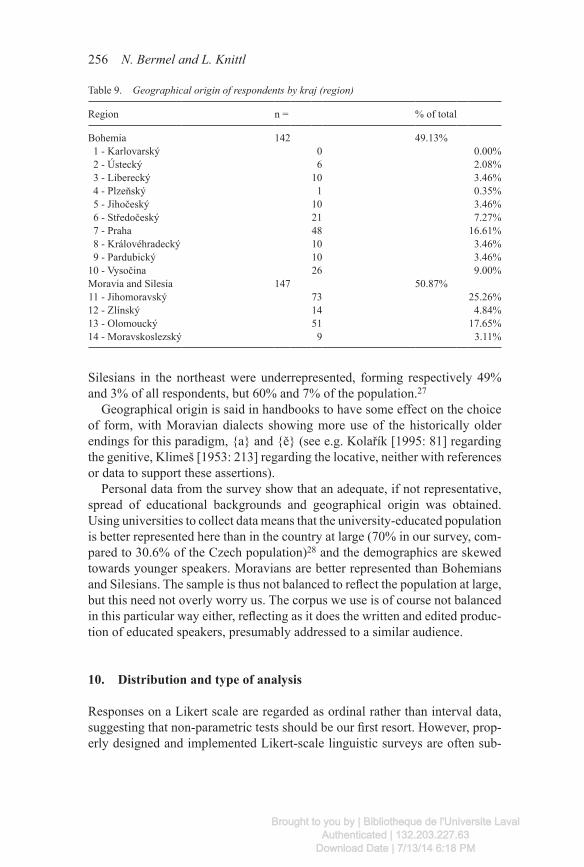
Silesians in the northeast were underrepresented, forming respectively 49% and 3% of all respondents, but 60% and 7% of the population.27
Geographical origin is said in handbooks to have some effect on the choice of form, with Moravian dialects showing more use of the historically older endings for this paradigm, {a} and {ě} (see e.g. Kolařík [1995: 81] regarding the genitive, Klimeš [1953: 213] regarding the locative, neither with references or data to support these assertions).
Personal data from the survey show that an adequate, if not representative, spread of educational backgrounds and geographical origin was obtained. U sing universities to collect data means that the university-educated p opulation is better represented here than in the country at large (70% in our survey, com-pared to 30.6% of the Czech population)28 and the demographics are skewed towards younger speakers. Moravians are better represented than Bohemians and Silesians. The sample is thus not balanced to reflect the population at large, but this need not overly worry us. The corpus we use is of course not balanced in this particular way either, reflecting as it does the written and edited produc-tion of educated speakers, presumably addressed to a similar audience.
10. Distributionandtypeofanalysis
Responses on a Likert scale are regarded as ordinal rather than interval data, suggesting that non-parametric tests should be our first resort. However, prop-erly designed and implemented Likert-scale linguistic surveys are often sub-
Table 9. Geographical origin of respondents by kraj (region)
Region n = % of total
Bohemia 142 49.13%1 - Karlovarský 0 0.00%2 - Ústecký 6 2.08%3 - Liberecký 10 3.46%4 - Plzeňský 1 0.35%5 - Jihočeský 10 3.46%6 - Středočeský 21 7.27%7 - Praha 48 16.61%8 - Královéhradecký 10 3.46%9 - Pardubický 10 3.46%
10 - Vysočina 26 9.00%Moravia and Silesia 147 50.87%11 - Jihomoravský 73 25.26%12 - Zlínský 14 4.84%13 - Olomoucký 51 17.65%14 - Moravskoslezský 9 3.11%
Brought to you by | Bibliotheque de l'Universite LavalAuthenticated | 132.203.227.63
Download Date | 7/13/14 6:18 PM
Corpus frequency and acceptability judgments 257
jected to parametric analysis, which can in many instances be more accurate and revealing. We took certain precautions to ensure that we would be justified in carrying out such tests.
The total number of usable results collected for our two parallel surveys ( N = 146 and N = 143) comfortably surpasses the 100 mark often cited as the point when non-parametric tests start to give less reliable results than paramet-ric ones.
Likert scales with named midpoints are clear instances of non-interval data, so we labelled only the endpoints of our scale (1 and 7). Points 2 through 6 had no descriptions. There is evidence (Cowart [1997], Featherston [2005, 2007]) that respondents are able to subdivide the scale more or less evenly and use it as such, and this can be checked by examining the overall results.
Normal distribution is considered a prerequisite for parametric tests. The mean ratings for each prompt were therefore analyzed using the Kolmogorov-Smirnov test and deviations from normal distribution were found to be non-significant ( p > 0.05). Our data were thus judged to be normally distributed.
We conducted two types of analysis to show how the different independent variables ( proportional frequency of corpus appearance, syntactic construction and ending) and quasi-variables (age, home region, gender) might have influ-enced the dependent variable (the rating). We used ANOVA and correlation tests, both of which are commonly used on experimental data to show relation-ships between the variables. The repeated-measures ANOVA was used because we had multiple data points (i.e. evaluations of individual sentences) from each respondent. Regression is usually performed on observational data but in this case could also have been used to similar effect.
11. ResultsofANOVA
A repeated-measures ANOVA was run to explore the effects of the between-subject variable of questionnaire version; and the within-subject variables of Construction (the details of which we report in Bermel and Knittl [2012]) and Frequency. There were four analyses in total (2×/cases, 2×/surveys). Our con-clusions were that the proportional frequency of a form in the corpus (F requency) and the syntactic construction of a form (Construction) were both significant in determining the desinence used, but Frequency was far more significant for determining this than was Construction.
As mentioned above, we used four counterbalanced versions of each survey to avoid potential order effects. Our analysis therefore first of all needed to confirm that responses obtained for each version were comparable. The results of the ANOVA for the between-subjects variable Version showed all of the p values to be far above the customary significance level of 0.05, and thus the
Brought to you by | Bibliotheque de l'Universite LavalAuthenticated | 132.203.227.63
Download Date | 7/13/14 6:18 PM
258 N. Bermel and L. Knittl
rather minor variances reported (F values between 0.87 and 1.68) are taken to be not significant. In other words, participants’ responses were not s ignificantly affected by the survey version they completed for any of the features under investigation.
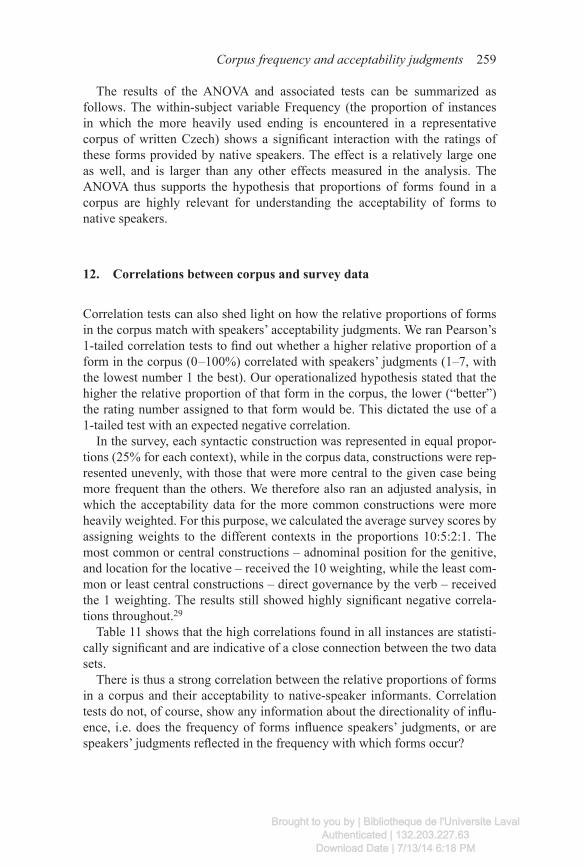
We now turn to the within-subjects variables whose analysis will help test our hypotheses. Repeated-measures ANOVA, where we examine multiple data points from each respondent, assumes equal variances of difference (s phericity) between the data from each participant (Field (2009): 458– 461). For our anal-yses of the within-subject variable Frequency, the data did not pass the spheric-ity test, and so the results of the conservative Greenhouse-Geisser corrected test were used. The ANOVA shows significant effects ( p < 0.001) for the vari-able Frequency in relationship to the ending used for all analyses, as seen in Table 10.
Even if a result is statistically significant, the effect could be a small one, and such situations are frequently encountered in larger data sets. The size of the effects of Frequency can be judged by reference to the F ratio, which tests the overall difference between group means in experimental data (Field [2009: 785–786]). The F ratio shows Frequency to have a relatively large effect (F values range from 57.45 to 161.98), especially for the genitive.
This effect can also be measured by the partial eta squared value, which can show what proportion of the variance is explained by a variable once other variables are excluded from the analysis; a result of 0.00 means no proportion whatsoever, and 1.00 means that all the variance can be explained by that vari-able (Field [2009: 415– 416]). This test concurs with the F ratios, showing that the effect of Frequency is relatively large ( partial η2 = 0.39 to 0.58).
To put this in perspective, much smaller effects are seen for, e.g. C onstruction, which, while also judged significant ( p < 0.001), has effects of F = 0.05, 0.08 for the genitive and F = 0.19, 0.23 for the locative, with the partial eta squared values also correspondingly lower (see Bermel and Knittl [2012]). ANOVA was also run on the between-subjects variables of Region (of origin), Age and Gender; this showed only sporadic significant effects on the ratings with a very small size of effect. Our judgment was that region of origin, age and gender were not significant factors in the ratings our respondents assigned.
Table 10. The variables Frequency (relative proportion of form in the corpus) and Ending
Data set Result Effect size
Word series 1; genitive {a}/{u} F(4.45, 546.94) = 155.33, p < 0.001 partial η2 = 0.56Word series 2; locative {ě}/{u} F(4.82, 587.37) = 94.39, p < 0.001 partial η2 = 0.44Word series 3; genitive {a}/{u} F(5.00, 589.81) = 161.98, p < 0.001 partial η2 = 0.58Word series 4; locative {ě}/{u} F(5.01, 616.67) = 57.45, p < 0.001 partial η2 = 0.39
Brought to you by | Bibliotheque de l'Universite LavalAuthenticated | 132.203.227.63
Download Date | 7/13/14 6:18 PM
Corpus frequency and acceptability judgments 259
The results of the ANOVA and associated tests can be summarized as f ollows. The within-subject variable Frequency (the proportion of instances in which the more heavily used ending is encountered in a representative c orpus of written Czech) shows a significant interaction with the ratings of these forms provided by native speakers. The effect is a relatively large one as well, and is larger than any other effects measured in the analysis. The A NOVA thus supports the hypothesis that proportions of forms found in a corpus are highly relevant for understanding the acceptability of forms to n ative speakers.
12. Correlationsbetweencorpusandsurveydata
Correlation tests can also shed light on how the relative proportions of forms in the corpus match with speakers’ acceptability judgments. We ran Pearson’s 1-tailed correlation tests to find out whether a higher relative proportion of a form in the corpus (0 –100%) correlated with speakers’ judgments (1–7, with the lowest number 1 the best). Our operationalized hypothesis stated that the higher the relative proportion of that form in the corpus, the lower (“better”) the rating number assigned to that form would be. This dictated the use of a 1-tailed test with an expected negative correlation.
In the survey, each syntactic construction was represented in equal propor-tions (25% for each context), while in the corpus data, constructions were rep-resented unevenly, with those that were more central to the given case being more frequent than the others. We therefore also ran an adjusted analysis, in which the acceptability data for the more common constructions were more heavily weighted. For this purpose, we calculated the average survey scores by assigning weights to the different contexts in the proportions 10:5:2:1. The most common or central constructions – adnominal position for the genitive, and location for the locative – received the 10 weighting, while the least com-mon or least central constructions – direct governance by the verb – received the 1 weighting. The results still showed highly significant negative correla-tions throughout.29
Table 11 shows that the high correlations found in all instances are statisti-cally significant and are indicative of a close connection between the two data sets.
There is thus a strong correlation between the relative proportions of forms in a corpus and their acceptability to native-speaker informants. Correlation tests do not, of course, show any information about the directionality of influ-ence, i.e. does the frequency of forms influence speakers’ judgments, or are speakers’ judgments reflected in the frequency with which forms occur?
Brought to you by | Bibliotheque de l'Universite LavalAuthenticated | 132.203.227.63
Download Date | 7/13/14 6:18 PM
260 N. Bermel and L. Knittl
13. Surveyvs.corpuschartsandpairwisecomparisonsofsurveydata
Further insight into the relationship between corpus frequency and a cceptability can be gained by looking at the matches between frequency and acceptability for individual forms. To do this, we first look at the pairwise comparisons for the survey data, which tell us which items in each scale have ratings that are significantly different.30 We then compare these to charts mapping both the survey data points and the data points from the corpus.31
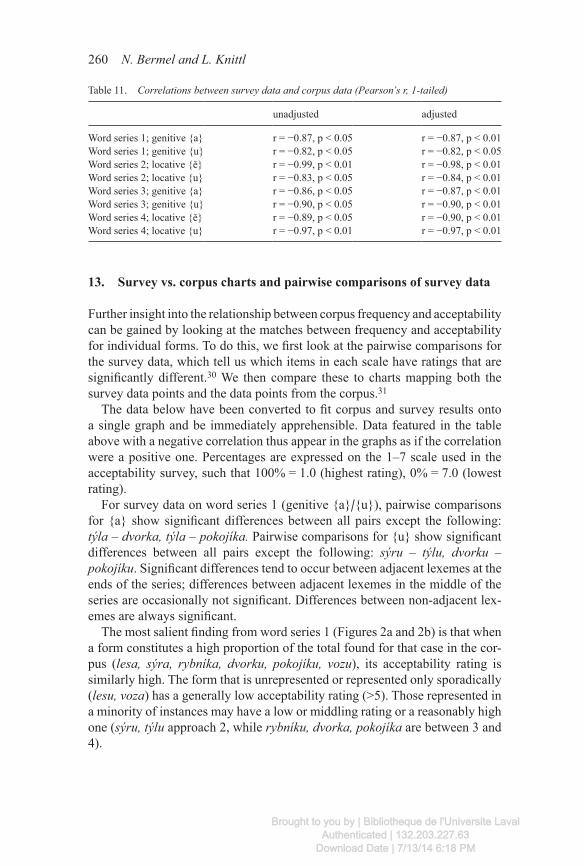
The data below have been converted to fit corpus and survey results onto a single graph and be immediately apprehensible. Data featured in the table above with a negative correlation thus appear in the graphs as if the correlation were a positive one. Percentages are expressed on the 1–7 scale used in the acceptability survey, such that 100% = 1.0 (highest rating), 0% = 7.0 (lowest rating).
For survey data on word series 1 (genitive {a}/{u}), pairwise comparisons for {a} show significant differences between all pairs except the following: týla – dvorka, týla – pokojíka. Pairwise comparisons for {u} show significant differences between all pairs except the following: sýru – týlu, dvorku – p okojíku. Significant differences tend to occur between adjacent lexemes at the ends of the series; differences between adjacent lexemes in the middle of the series are occasionally not significant. Differences between non-adjacent lex-emes are always significant.
The most salient finding from word series 1 (Figures 2a and 2b) is that when a form constitutes a high proportion of the total found for that case in the cor-pus (lesa, sýra, rybníka, dvorku, pokojíku, vozu), its acceptability rating is similarly high. The form that is unrepresented or represented only sporadically (lesu, voza) has a generally low acceptability rating (>5). Those represented in a minority of instances may have a low or middling rating or a reasonably high one (sýru, týlu approach 2, while rybníku, dvorka, pokojíka are between 3 and 4).
Table 11. Correlations between survey data and corpus data (Pearson’s r, 1-tailed)
unadjusted adjusted
Word series 1; genitive {a} r = −0.87, p < 0.05 r = −0.87, p < 0.01Word series 1; genitive {u} r = −0.82, p < 0.05 r = −0.82, p < 0.05Word series 2; locative {ě} r = −0.99, p < 0.01 r = −0.98, p < 0.01Word series 2; locative {u} r = −0.83, p < 0.05 r = −0.84, p < 0.01Word series 3; genitive {a} r = −0.86, p < 0.05 r = −0.87, p < 0.01Word series 3; genitive {u} r = −0.90, p < 0.05 r = −0.90, p < 0.01Word series 4; locative {ě} r = −0.89, p < 0.05 r = −0.90, p < 0.01Word series 4; locative {u} r = −0.97, p < 0.01 r = −0.97, p < 0.01
Brought to you by | Bibliotheque de l'Universite LavalAuthenticated | 132.203.227.63
Download Date | 7/13/14 6:18 PM
Corpus frequency and acceptability judgments 261
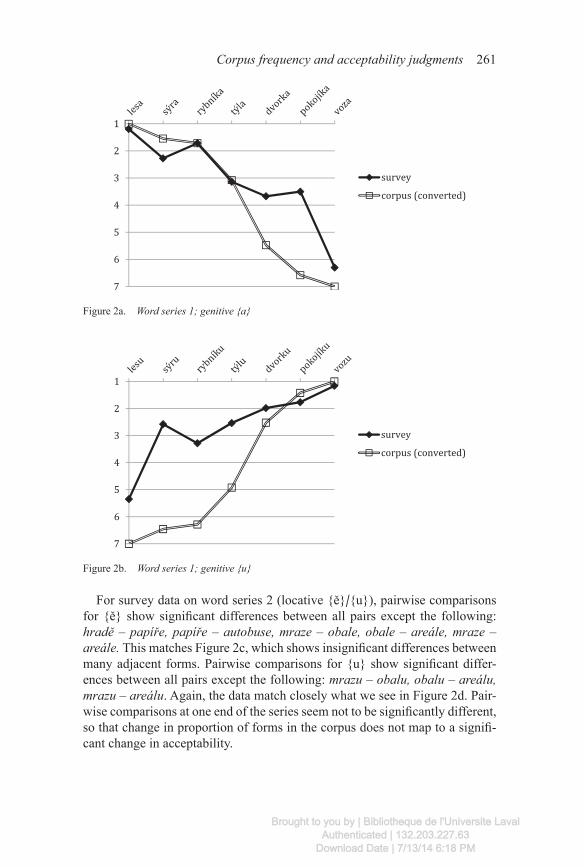
For survey data on word series 2 (locative {ě}/{u}), pairwise comparisons for {ě} show significant differences between all pairs except the following: hradě – papíře, papíře – autobuse, mraze – obale, obale – areále, mraze – areále. This matches Figure 2c, which shows insignificant differences between many adjacent forms. Pairwise comparisons for {u} show significant differ-ences between all pairs except the following: mrazu – obalu, obalu – areálu, mrazu – areálu. Again, the data match closely what we see in Figure 2d. Pair-wise comparisons at one end of the series seem not to be significantly different, so that change in proportion of forms in the corpus does not map to a signifi-cant change in acceptability.
Figure 2a. Word series 1; genitive {a}
Figure 2b. Word series 1; genitive {u}
Brought to you by | Bibliotheque de l'Universite LavalAuthenticated | 132.203.227.63
Download Date | 7/13/14 6:18 PM
262 N. Bermel and L. Knittl
Word series 2 shows similar results to word series 1. Notably, here the spo-radically attested form areále has middling acceptability, despite appearing only once in the corpus.
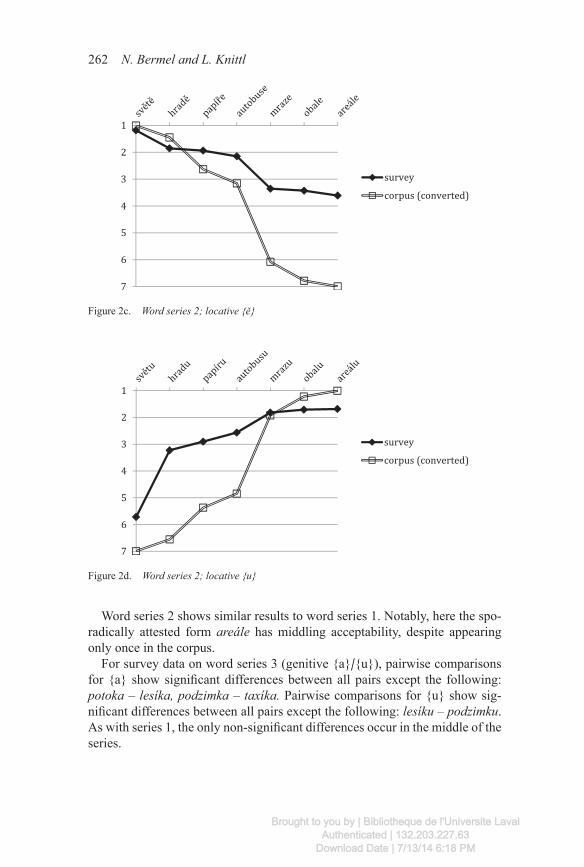
For survey data on word series 3 (genitive {a}/{u}), pairwise comparisons for {a} show significant differences between all pairs except the following: potoka – lesíka, podzimka – taxíka. Pairwise comparisons for {u} show sig-nificant differences between all pairs except the following: lesíku – podzimku. As with series 1, the only non-significant differences occur in the middle of the series.
Figure 2c. Word series 2; locative {ě}
Figure 2d. Word series 2; locative {u}
Brought to you by | Bibliotheque de l'Universite LavalAuthenticated | 132.203.227.63
Download Date | 7/13/14 6:18 PM
Corpus frequency and acceptability judgments 263
Word series 3 shows results that are consistent with the first two series. One particular form ( podzimka) seems to have a much lower rating than expected. It is notable that – despite some respondents’ concern about this word (see Bermel and Knittl [2012]) – the unusual result was not repeated for the a lternate form podzimku.
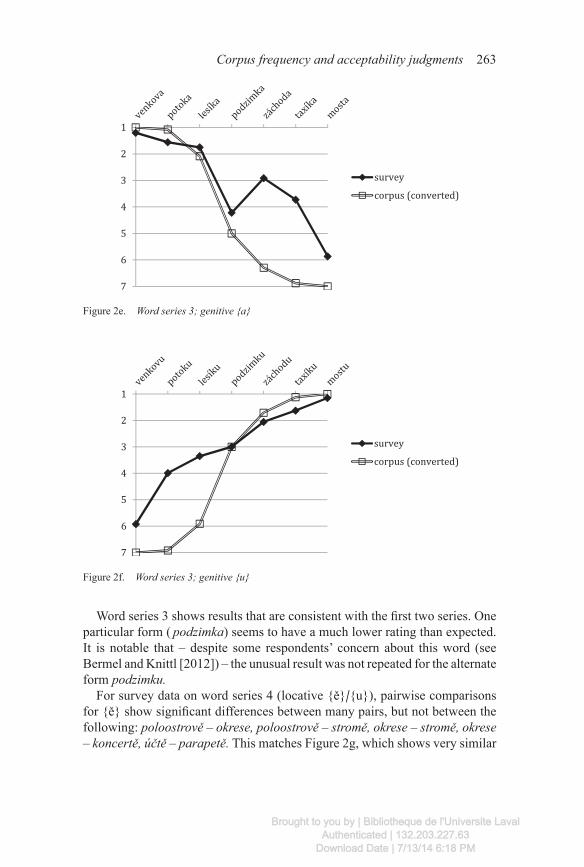
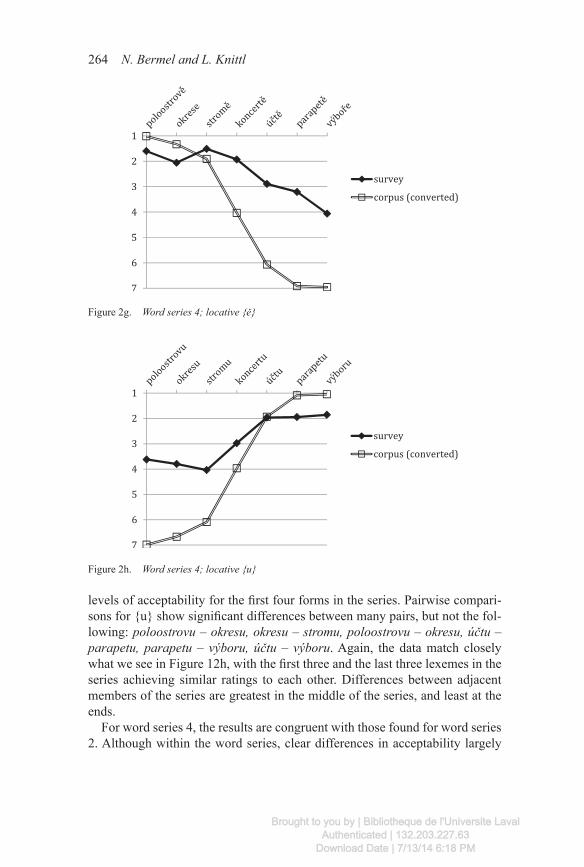
For survey data on word series 4 (locative {ě}/{u}), pairwise comparisons for {ě} show significant differences between many pairs, but not between the following: poloostrově – okrese, poloostrově – stromě, okrese – stromě, okrese – koncertě, účtě – parapetě. This matches Figure 2g, which shows very similar
Figure 2e. Word series 3; genitive {a}
Figure 2f. Word series 3; genitive {u}
Brought to you by | Bibliotheque de l'Universite LavalAuthenticated | 132.203.227.63
Download Date | 7/13/14 6:18 PM
264 N. Bermel and L. Knittl
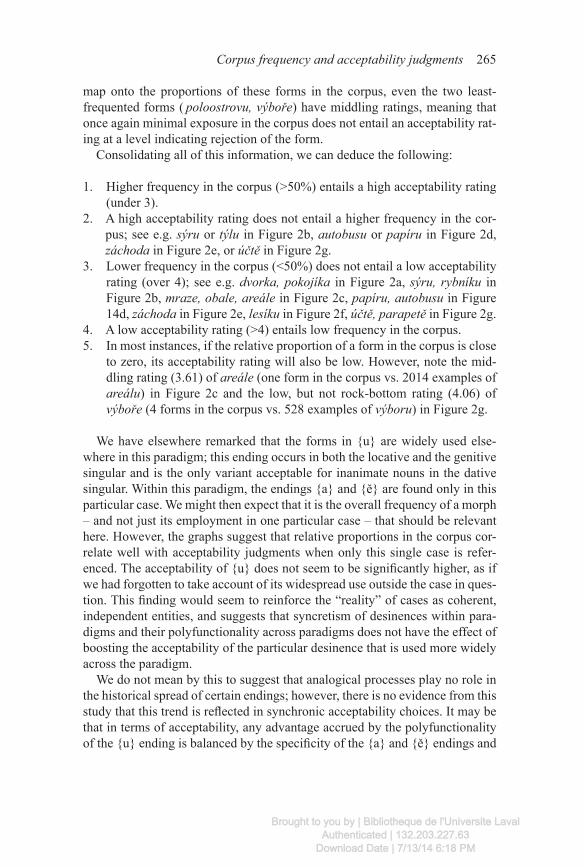
levels of acceptability for the first four forms in the series. Pairwise compari-sons for {u} show significant differences between many pairs, but not the fol-lowing: poloostrovu – okresu, okresu – stromu, poloostrovu – okresu, účtu – parapetu, parapetu – výboru, účtu – výboru. Again, the data match closely what we see in Figure 12h, with the first three and the last three lexemes in the series achieving similar ratings to each other. Differences between adjacent members of the series are greatest in the middle of the series, and least at the ends.
For word series 4, the results are congruent with those found for word series 2. Although within the word series, clear differences in acceptability largely
Figure 2g. Word series 4; locative {ě}
Figure 2h. Word series 4; locative {u}
Brought to you by | Bibliotheque de l'Universite LavalAuthenticated | 132.203.227.63
Download Date | 7/13/14 6:18 PM
Corpus frequency and acceptability judgments 265
map onto the proportions of these forms in the corpus, even the two least- frequented forms ( poloostrovu, výboře) have middling ratings, meaning that once again minimal exposure in the corpus does not entail an acceptability rat-ing at a level indicating rejection of the form.
Consolidating all of this information, we can deduce the following:
1. Higher frequency in the corpus (>50%) entails a high acceptability rating (under 3).
2. A high acceptability rating does not entail a higher frequency in the cor-pus; see e.g. sýru or týlu in Figure 2b, autobusu or papíru in Figure 2d, záchoda in Figure 2e, or účtě in Figure 2g.
3. Lower frequency in the corpus (<50%) does not entail a low acceptability rating (over 4); see e.g. dvorka, pokojíka in Figure 2a, sýru, rybníku in Figure 2b, mraze, obale, areále in Figure 2c, papíru, autobusu in Figure 14d, záchoda in Figure 2e, lesíku in Figure 2f, účtě, parapetě in Figure 2g.
4. A low acceptability rating (>4) entails low frequency in the corpus.5. In most instances, if the relative proportion of a form in the corpus is close
to zero, its acceptability rating will also be low. However, note the mid-dling rating (3.61) of areále (one form in the corpus vs. 2014 examples of areálu) in Figure 2c and the low, but not rock-bottom rating (4.06) of výboře (4 forms in the corpus vs. 528 examples of výboru) in Figure 2g.
We have elsewhere remarked that the forms in {u} are widely used else-where in this paradigm; this ending occurs in both the locative and the genitive singular and is the only variant acceptable for inanimate nouns in the dative singular. Within this paradigm, the endings {a} and {ě} are found only in this particular case. We might then expect that it is the overall frequency of a morph – and not just its employment in one particular case – that should be relevant here. However, the graphs suggest that relative proportions in the corpus cor-relate well with acceptability judgments when only this single case is refer-enced. The acceptability of {u} does not seem to be significantly higher, as if we had forgotten to take account of its widespread use outside the case in ques-tion. This finding would seem to reinforce the “reality” of cases as coherent, independent entities, and suggests that syncretism of desinences within para-digms and their polyfunctionality across paradigms does not have the effect of boosting the acceptability of the particular desinence that is used more widely across the paradigm.
We do not mean by this to suggest that analogical processes play no role in the historical spread of certain endings; however, there is no evidence from this study that this trend is reflected in synchronic acceptability choices. It may be that in terms of acceptability, any advantage accrued by the polyfunctionality of the {u} ending is balanced by the specificity of the {a} and {ě} endings and
Brought to you by | Bibliotheque de l'Universite LavalAuthenticated | 132.203.227.63
Download Date | 7/13/14 6:18 PM
266 N. Bermel and L. Knittl
the degree to which they are closely associated with a particular case and its functions.
14. Absolutefrequencyandpreemption
We have already seen that the Czech locative and genitive maintain significant levels of variation for a considerable number of lexemes. Previous studies of preemption have suggested that the absolute frequency of items is also critical to ensuring that less favoured competing variants are eliminated from usage.
There is some, albeit inconclusive evidence for this in our data. Our data had shown significant correlations between proportional representation in the c orpus and acceptability, with large effects (see Section 11). The correlation between absolute frequency of a feature and the rating of that feature was s ignificant, but with a medium level of effect (r = −0.32, p < 0.01). When we limited our analysis to the group of lexemes in our survey where one ending showed low absolute frequency (n < 50), the correlation remained significant and its effect increased (r = −0.64, p = 0.01).
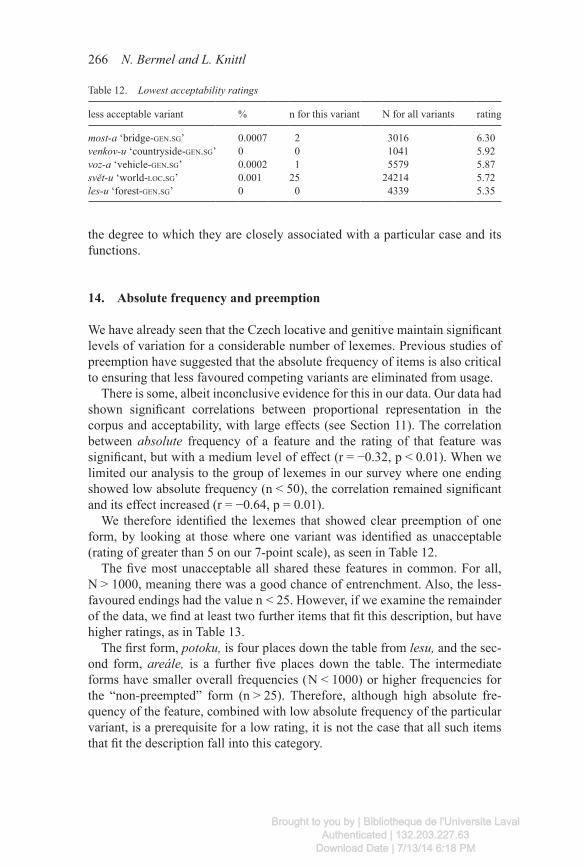
We therefore identified the lexemes that showed clear preemption of one form, by looking at those where one variant was identified as unacceptable (rating of greater than 5 on our 7-point scale), as seen in Table 12.
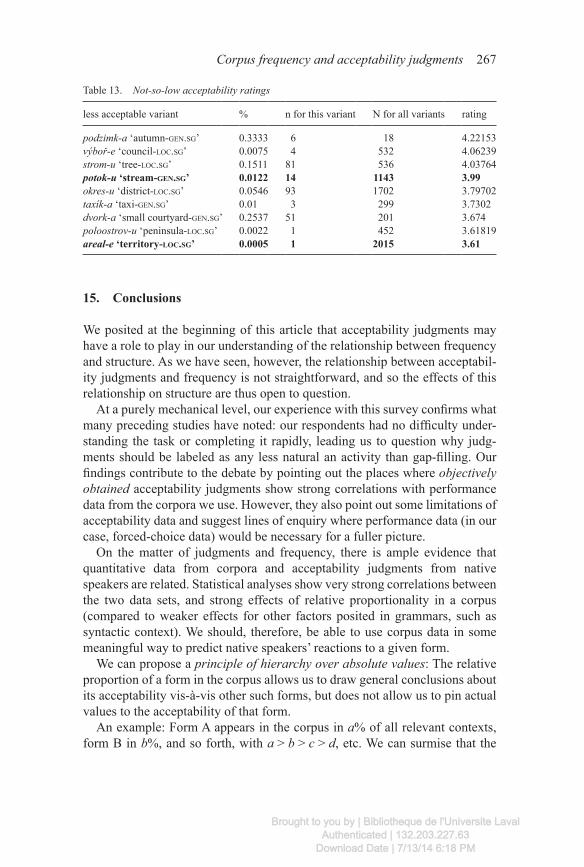
The five most unacceptable all shared these features in common. For all, N > 1000, meaning there was a good chance of entrenchment. Also, the less-favoured endings had the value n < 25. However, if we examine the remainder of the data, we find at least two further items that fit this description, but have higher ratings, as in Table 13.
The first form, potoku, is four places down the table from lesu, and the sec-ond form, areále, is a further five places down the table. The intermediate forms have smaller overall frequencies ( N < 1000) or higher frequencies for the “non-preempted” form (n > 25). Therefore, although high absolute fre-quency of the feature, combined with low absolute frequency of the particular variant, is a prerequisite for a low rating, it is not the case that all such items that fit the description fall into this category.
Table 12. Lowest acceptability ratings
less acceptable variant % n for this variant N for all variants rating
most-a ‘bridge-gen.sg’ 0.0007 2 3016 6.30venkov-u ‘countryside-gen.sg’ 0 0 1041 5.92voz-a ‘vehicle-gen.sg’ 0.0002 1 5579 5.87svět-u ‘world-loc.sg’ 0.001 25 24214 5.72les-u ‘forest-gen.sg’ 0 0 4339 5.35
Brought to you by | Bibliotheque de l'Universite LavalAuthenticated | 132.203.227.63
Download Date | 7/13/14 6:18 PM
Corpus frequency and acceptability judgments 267
15. Conclusions
We posited at the beginning of this article that acceptability judgments may have a role to play in our understanding of the relationship between frequency and structure. As we have seen, however, the relationship between acceptabil-ity judgments and frequency is not straightforward, and so the effects of this relationship on structure are thus open to question.
At a purely mechanical level, our experience with this survey confirms what many preceding studies have noted: our respondents had no difficulty under-standing the task or completing it rapidly, leading us to question why judg-ments should be labeled as any less natural an activity than gap-filling. Our findings contribute to the debate by pointing out the places where objectively obtained acceptability judgments show strong correlations with performance data from the corpora we use. However, they also point out some limitations of acceptability data and suggest lines of enquiry where performance data (in our case, forced-choice data) would be necessary for a fuller picture.
On the matter of judgments and frequency, there is ample evidence that quantitative data from corpora and acceptability judgments from native s peakers are related. Statistical analyses show very strong correlations between the two data sets, and strong effects of relative proportionality in a corpus (compared to weaker effects for other factors posited in grammars, such as syntactic context). We should, therefore, be able to use corpus data in some meaningful way to predict native speakers’ reactions to a given form.
We can propose a principle of hierarchy over absolute values: The relative proportion of a form in the corpus allows us to draw general conclusions about its acceptability vis-à-vis other such forms, but does not allow us to pin actual values to the acceptability of that form.
An example: Form A appears in the corpus in a% of all relevant contexts, form B in b%, and so forth, with a > b > c > d, etc. We can surmise that the
Table 13. Not-so-low acceptability ratings
less acceptable variant % n for this variant N for all variants rating
podzimk-a ‘autumn-gen.sg’ 0.3333 6 18 4.22153výboř-e ‘council-loc.sg’ 0.0075 4 532 4.06239strom-u ‘tree-loc.sg’ 0.1511 81 536 4.03764potok-u ‘stream-gen.sg’ 0.0122 14 1143 3.99okres-u ‘district-loc.sg’ 0.0546 93 1702 3.79702taxík-a ‘taxi-gen.sg’ 0.01 3 299 3.7302dvork-a ‘small courtyard-gen.sg’ 0.2537 51 201 3.674poloostrov-u ‘peninsula-loc.sg’ 0.0022 1 452 3.61819areal-e‘territory-loc.sg’ 0.0005 1 2015 3.61
Brought to you by | Bibliotheque de l'Universite LavalAuthenticated | 132.203.227.63
Download Date | 7/13/14 6:18 PM
268 N. Bermel and L. Knittl
acceptability of these forms will look as follows: A ≥ B ≥ C ≥ D, where the ≥ sign means ‘close to, equal to or greater than’. We can thus interpret corpus data as saying that B, C, and D cannot be significantly more acceptable to n ative speakers than A is, although we cannot use the values a, b, c and d to quantify this acceptability.
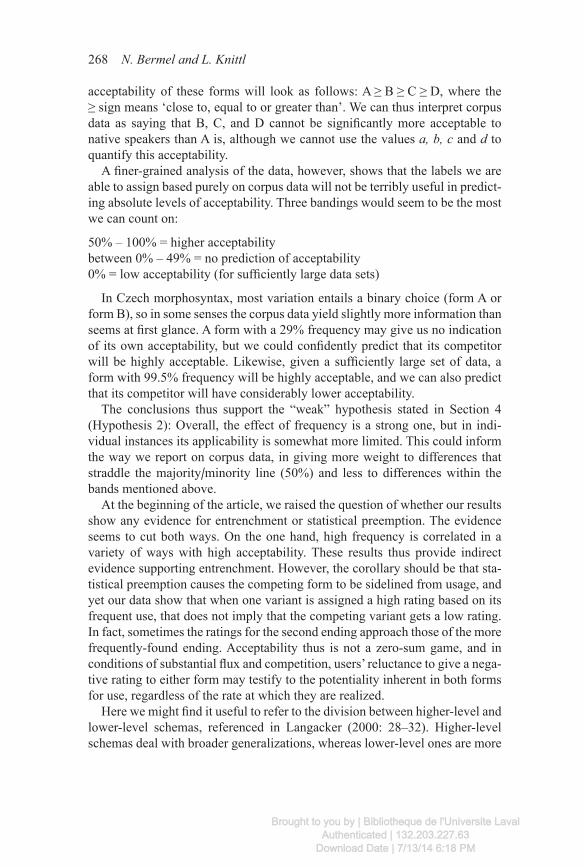
A finer-grained analysis of the data, however, shows that the labels we are able to assign based purely on corpus data will not be terribly useful in predict-ing absolute levels of acceptability. Three bandings would seem to be the most we can count on:
50% – 100% = higher acceptability between 0% – 49% = no prediction of acceptability 0% = low acceptability (for sufficiently large data sets)
In Czech morphosyntax, most variation entails a binary choice (form A or form B), so in some senses the corpus data yield slightly more information than seems at first glance. A form with a 29% frequency may give us no indication of its own acceptability, but we could confidently predict that its competitor will be highly acceptable. Likewise, given a sufficiently large set of data, a form with 99.5% frequency will be highly acceptable, and we can also predict that its competitor will have considerably lower acceptability.
The conclusions thus support the “weak” hypothesis stated in Section 4 (H ypothesis 2): Overall, the effect of frequency is a strong one, but in indi-vidual instances its applicability is somewhat more limited. This could inform the way we report on corpus data, in giving more weight to differences that straddle the majority/minority line (50%) and less to differences within the bands mentioned above.
At the beginning of the article, we raised the question of whether our results show any evidence for entrenchment or statistical preemption. The evidence seems to cut both ways. On the one hand, high frequency is correlated in a variety of ways with high acceptability. These results thus provide indirect evidence supporting entrenchment. However, the corollary should be that sta-tistical preemption causes the competing form to be sidelined from usage, and yet our data show that when one variant is assigned a high rating based on its frequent use, that does not imply that the competing variant gets a low rating. In fact, sometimes the ratings for the second ending approach those of the more frequently-found ending. Acceptability thus is not a zero-sum game, and in conditions of substantial flux and competition, users’ reluctance to give a nega-tive rating to either form may testify to the potentiality inherent in both forms for use, regardless of the rate at which they are realized.
Here we might find it useful to refer to the division between higher-level and lower-level schemas, referenced in Langacker (2000: 28–32). Higher-level schemas deal with broader generalizations, whereas lower-level ones are more
Brought to you by | Bibliotheque de l'Universite LavalAuthenticated | 132.203.227.63
Download Date | 7/13/14 6:18 PM
Corpus frequency and acceptability judgments 269
restricted in their scope. One possibility is that in these instances of lower-frequency items, respondents are at least in part failing to apply the lowest-level schema, perhaps because they do not have enough data to evaluate the specific form in question. Instead, they may be reaching for higher-level sche-mas that apply to the entire paradigm or some larger portion of it, where there is overall more support for the “recessive” ending. The continuing acceptabil-ity of the “recessive” variant thus testifies to its continued potentiality for use, and it is through acceptability tests that we see this mechanism at work.
In closing, we can ask whether preemption has seemed to work regularly because it has been tested in structures where variation is highly marked when found. When it is sought in structures where variation is widespread, unre-markable and seemingly stable, we find, in addition to examples of true pre-emption, also examples where preemption should have taken place but appears not to have done so. This calls into question whether the mechanisms that have been proposed for preemption are in fact the triggers for it, or whether they are instead effects of the fact that preemption has taken place.
Bionotes
Neil Bermel is Professor of Russian and Slavonic Studies at the University of Sheffield. Luděk Knittl is Tutor in Czech at the University of Sheffield. E-mail: [email protected]
Notes
1. Data collection and analysis for this article was funded under British Academy grant SG-50275. The authors are grateful to Ewa Dąbrowska, Dagmar Divjak, Jean Russell and Mar-cin Szczerbiński for their assistance and advice at various stages during this project.
2. The current article is the first of two, and focuses on this more global issue. A companion article (Bermel and Knittl ([2012]) examines the distribution of corpus data and survey data in greater detail, especially as regards the influence of syntactic constructions on these ratings.
3. It would be tempting, but inaccurate, to equate this division with the generativist/cognitivist schools of thought. In particular, the emergentist view is not limited to those who subscribe to the current cognitive linguistics framework.
4. “. . . [W]hile I argue against the use of acceptability judgments as a linguistic method, I do not argue against the use of interpretation. There is good reason for this distinction, which I am not the first to point out: interpreting utterances is a natural human activity, judging their acceptability is not” (Stefanowitsch [2006: 73]).
5. To avoid confusion, we use the term relative proportions rather than relative frequencies, as the latter has a specific meaning in corpus linguistics: a frequency compared to all forms in the corpus or to a fixed-size subset, such as per million words.
Brought to you by | Bibliotheque de l'Universite LavalAuthenticated | 132.203.227.63
Download Date | 7/13/14 6:18 PM
270 N. Bermel and L. Knittl
6. Cvrček et al. (2010: 144) lists twelve types; Příruční mluvnice češtiny (1995: 244 –267) gives thirteen.
7. This is an oversimplification of the extent and nature of syncretism, but it will do for illustra-tive purposes. A system similar in its complexity (albeit different in most details) is described for Polish in Dąbrowska (2008: 935).
8. In general we will use standard Czech spellings here, rather than transcriptions; this allows us to speak of a morph {y}, which has the same phonemic value as {i}, but appears in differ-ent paradigms and with a different effect on the preceding consonant, i.e. the final consonant of the stem.
9. For our purposes, it does not matter whether we accept the traditional Czech definition of paradigm, or whether we prefer a stricter definition that splits each paradigm into two or more: i.e. one paradigm with nouns using morph {A} in case x, and one with nouns using morph {B} in case x. Even with this stricter definition, we still find examples of nouns that show varia-tion between the two morphs, such that it constitutes variation between paradigms rather than within one paradigm. In any event, Czech seems to be an excellent test case for Langacker’s contention that lower-level schemas “may on balance be more essential to language structure than high-level schemas representing the broadest generalizations” (2000: 29).
10. All three examples of variation in this paradigm arise from the merging of two older para-digms, which had begun already by the end of the proto-Slavonic period. A fuller account of this process is given in Janda (1996).
11. The loc. sg. morph {ě} is written as either ⟨e⟩ or ⟨ě⟩, depending on the character of the pre-ceding consonant (after labial and dental stops and after nasals, ⟨ě⟩ is written, indicating certain mutations in the pronunciation of the consonant).
12. There are four subcorpora of spoken Czech available; they were not judged suitable for this study because three out of four make no claims to balance or representativity, and all, at <1 m tokens, are too small to provide sufficient data at the required level of detail on the morpho-syntactic features studied.
13. A full account of this process is given in Bermel and Knittl (2012). In brief, tagging errors such as incorrect case assignment are infrequent in the locative case, which is clearly marked by the presence of a preceding preposition, but are more frequent in the genitive. We searched for tokens with particular endings whose lemma was marked as a common noun, i.e. its head form begins with a small letter, and whose tag marked it as belonging to the relevant gender, number, and case. This included reconciling forms under one lemma that had been mistak-enly spread over several, often but not always due to misspellings in the source texts, as well as weeding out foreign words mistakenly assigned a Czech grammatical form (e.g. château is analyzed as a gen. sg. form of the non-existent lexeme châtea with the ending {u}). As an example, our corrections reduced the total number of lexemes in this paradigm found with {u} in the gen. sg. from 13,018 to 11,701. This is a decrease of 1317 or 10.1%. The average number of tokens per lemma rose from 91.70 to 104.50, an increase of 14%, and the median went from 3 to 4. The number of tokens climbed from 1,193,709 to 1,222,637, an increase of 28,928 or 2.4%. This represented roughly a month’s worth of work. The next steps would have been to examine manually every gen. sg. token to weed out misclassified forms and then to look at all remaining forms in the corpus ending in {u} to see whether they should have been tagged as gen. sg. forms belonging to this paradigm, including those tagged as fem. or neut. nouns (this morph does occur in both paradigms, albeit for the feminine gender in a different case). This would have represented another 3– 6 months of full-time work and would have brought us somewhere closer to an ideally accurate count, but given our pre-vious experience weeding forms, we judged it highly unlikely that the picture would have altered substantially enough to change our conclusions. The indicative figures thus stand as in Table 3.
Brought to you by | Bibliotheque de l'Universite LavalAuthenticated | 132.203.227.63
Download Date | 7/13/14 6:18 PM
Corpus frequency and acceptability judgments 271
14. A fuller account of these data is given in Bermel & Knittl (2012). 15. A further, purely morphological approach to the problem, which we considered and dis-
carded, would have been to take into account all appearances of a form regardless of its func-tion, e.g. we do not compare the form hradě, which appears only in the loc. sg., to all forms of hradu, including the loc., dat. and gen. sg. We return to this issue at the end of the paper.
16. By coincidence, a new popular-scholarly grammar by Cvrček et al. (2010) uses a remarkably similar scale to categorize relative proportions of forms in the corpus. It uses seven bands: nikdy/skoro nikdy ‘never/almost never’ (0 –1%), zřídka ‘rarely’ (1–10%), někdy ‘sometimes’ (10 –35%), stejně ‘the same’ (35– 65%), často ‘frequently’ (65–90%), zpravidla ‘as a rule’ (90 –99%), vždycky/skoro vždycky ‘always/almost always’ (over 99%). There is no scholarly justification advanced in the grammar for this particular scale, but its similarity to ours is evidence that this sort of division has an appeal to native-speaker linguists.
17. For a discussion of the items chosen in this band (týl and podzimek), see Bermel and Knittl (2012).
18. Czech is frequently cited as an example of a language that lacks a neutral standard code that would correspond closely to the spoken variety of the majority of the population. Its standard code, used in this study, shows significant differences in morphology and phonology from those of Czech dialects, and strictly speaking there are no “native speakers” of Standard Czech. It is thus frequently cited as an example of a language that is diglossic (Janda and Townsend 2000: 4) or more often, having some features of diglossia Daneš [1999 (1988): 292–295], Bermel [2010: 27], Dickins [1995: 22], Sgall et al. [1992: 215–216]), although in Moravia spoken forms of the standard are more common in certain circumstances. This sur-vey tested variations that are found in both the standard and non-standard varieties of Czech, so we believe that – inasmuch as any written code can be said to have “native speakers” – the results will be as valid as those performed on any other written data.
19. The full instructions for responding were in Czech and read as follows (translation ours): “Read the sentences and mark the forms in brackets as more or less acceptable, based on your native intuition. Use the scale from 1 to 7 in the right-hand column: (1) = completely normal (in the given context I’d definitely write it this way); (7) unacceptable (in the given context something feels wrong; I don’t regard it as normal Czech). As you evaluate the sen-tences, please act on your first instinct and don’t use dictionaries or other manuals. You are not evaluating [the] literary quality [of the examples]; you’re evaluating how you use the language.” The use of an ascending scale from best to worst is deeply encoded in Czech culture; it is pervasive in the educational system and in metaphor as well. Due to the length of the survey, we were hesitant to use a magnitude estimation model, as it would have length-ened the survey considerably and possibly led to fatigue.
20. The pilot survey had used only one word per band. We added the second after feedback from Czech colleagues, who were concerned that with one word, too much was thus riding on i ndividual lexemes as representatives of a class, when there could be unforeseen semantic or syntactic peculiarities associated with that lexeme.
21. The genitive case has a high frequency and encodes a range of morphosyntactic features. The “bare” or adnominal genitive can mark, among other things, possession and inherent charac-teristics, and can serve as the direct object of the verb. As the object of a preposition, the genitive can mark internal destination (do ‘to’), starting point (od, z ‘from’), location (uprostřed ‘amidst’) and various aspects of the path (kolem ‘by’, podél ‘along’). The locative is much less frequent and is found only as the object of a limited number of prepositions, including basic prepositions of location (v ‘in’, na ‘on’) but also others (o ‘about’, po ‘across/about’, při ‘during/in the presence of’).
22. This approach has the drawback of being less naturalistic; Wasow and Arnold (2004: 1484), for example, warn that respondents “should be ignorant of the hypotheses being tested,
Brought to you by | Bibliotheque de l'Universite LavalAuthenticated | 132.203.227.63
Download Date | 7/13/14 6:18 PM
272 N. Bermel and L. Knittl
p referably with doubleblind presentation of stimuli”, although Featherston (2009) suggests that it is the plausibility, clarity and simplicity of the stimuli that are of primary impor-tance, rather than the precise methodology. Dąbrowska, who has shown in recent works that education, reading habits and familiarity with linguistics affect certain responses to l inguistic stimuli, found nonetheless that for Polish, a closely related language, performance on declension of real nouns from core vocabulary (as opposed to nonce words) was un-affected by educational level (2008: 946). This suggests that a basic ability to insert correct morphological forms in context is not an arcane skill or one requiring a great deal of meta-knowledge.
23. The jury is still out on the use of linguists; Chomsky’s well-known opinions aside, see e.g. Devitt, who argues that “the intuitions that linguistics should mostly rely on are those of the linguists themselves, because the linguists are the most expert” (2006: 499) vs. Dąbrowska, whose recent work shows consistent differences between the intuitions of linguists and those of non-linguists, suggesting that “linguists’ judgments of the same sentences differ in sys-tematic ways from those of naive informants, even when they are asked to behave like ordi-nary language users” (2010: 21). Gordon & Hendrick came to the similar conclusion that [academic –NB] linguists’ training, which invites the consideration of borderline g rammatical constructions, makes linguists more accepting of marginal utterances, and that this tendency is most pronounced “with linguists interested in Principle C of the Binding Theory” (1997: 359–360). It may be, however, that, as Culbertson & Gross (2009) suggest, the relevant d ivide is not between linguists and non-linguists, but between those who have some task-specific understanding and those who do not.
24. In the de-briefing session, most of the participants’ questions centred on the distractor sen-tences, which had clearly served their purpose; speakers seem to have been less interested in the two features that were actually under examination.
25. Anecdotal evidence suggests that the payment was an important motivating factor, making participants feel that their participation was valued; the debriefing sessions were also posi-tively received and the connection thus created between researcher and participant may have given students a more personal incentive to take the exercise seriously.
26. There were a small number of spoiled questionnaires (where informants had e.g. reversed the order of the Likert scale) and some taken by non-native speakers of Czech, most frequently Slovaks, which we felt could not be counted.
27. The modern regions do not exactly respect the ancient divisions; there is at least one signifi-cant simplification in our data as a result. For the purpose of the descriptive statistics, the 26 respondents from Kraj Vysočina were assigned to Bohemia; although the historical boundary between Bohemia and Moravia bisects this region, linguistically Bohemian features are nowadays said to predominate in this region.
28. Over 96% of our sample completed secondary education, but this is not out of proportion to the Czech population in general, as in 2004/5 over 89% of the population had completed secondary education (UNESCO [2007: 22–26]).
29. A justification of these weightings based on corpus data is provided in greater detail in Ber-mel & Knittl (2012).
30. Data for the within-subjects variable Frequency did not pass the sphericity test and are thus reported with the Bonferroni correction.
31. The data given here are derived from survey data that have not been weighted based on the frequency of the syntactic environment, but as can be seen from Table 11, there is minimal difference even once the weighting is factored in.
Brought to you by | Bibliotheque de l'Universite LavalAuthenticated | 132.203.227.63
Download Date | 7/13/14 6:18 PM
Corpus frequency and acceptability judgments 273
References
Ambridge, Ben, Julian M. Pine, Caroline F. Rowland & Chris R. Young. 2008. The effect of verb semantic class and verb frequency (entrenchment) on children’s and adults’ graded judgements of argument-structure overgeneralization errors. Cognition 106(1). 87–129.
Arppe, Antte & Juhani Järvikivi. 2007. Take empiricism seriously! In support of methodological diversity in linguistics. Corpus linguistics and linguistic theory 3(1). 99–109.
Bader, Markus & Jana Häussler. 2009. Toward a model of grammaticality judgments. Journal of Linguistics 45. 1–58.
Bermel, Neil. 1993. Sémantické rozdíly v tvarech českého lokálu. Naše řeč 76. 192–198.Bermel, Neil. 2004a. V korpuse nebo v korpusu? Co nám řekne (a neřekne) ČNK o morfologické
variaci v tvarech lokálu. In Zdena Hladková & Petr Karlík (eds.), Čeština – univerzália a specifika 5, 163–171. Prague: Nakladatelství Lidové Noviny.
Bermel, Neil. 2004b. Standard and standardized verb forms in the Czech National Corpus. In R enata Blatná & Vladimír Petkevič (eds.), Jazyky a jazykověda: Sborník k 65. narozeninám prof. Františka Čermáka, 487–502. Prague: Filozofická fakulta Univerzity Karlovy.
Bermel, Neil. 2006. Tvary minulého příčestí v Českém národním korpusu: táh, táhl, či táhnul? In František Čermák & Renata Blatná (eds.), Korpusová lingvistika: stav a modelové přístupy, 487–502. Prague: Karolinum, 2006.
Bermel, Neil & Luděk Knittl. 2012. Morphosyntactic variation and syntactic environments in Czech nominal declension: Corpus frequency and native-speaker judgments. Russian Linguis-tics 36(1). 91–119.
Bresnan, Joan. 2006. Is knowledge of syntax probabilistic? Experiments with the English dative alternation. In Featherston, Sam & Wolfgang Sternefeld (eds.), Roots: Linguistics in search of its evidential base, 77–96. Berlin and New York: Mouton de Gruyter.
Brooks, Patricia J. & Michael Tomasello. 1999. How children constrain their argument structure constructions. Language 75(4). 720 –738.
Cowart, Wayne. 1997. Experimental syntax: Applying objective methods to sentence judgments. Thousand Oaks, CA: Sage Publications.
Culbertson, Jennifer & Steven Gross. 2009. Are linguists better subjects? British Journal for the Philosophy of Science 60. 721–736.
Czech National Corpus – Český národní korpus – SYN2000, SYN2005. Available on the web: www.korpus.cz
Dąbrowska, Ewa. 2008. The effects of frequency and neighbourhood density on adult speakers’ productivity with Polish case inflections: An empirical test of usage-based approaches to mor-phology. Journal of Memory and Language 58(4). 931–951.
Dąbrowska, Ewa. 2010. Naive v. expert intuitions: An empirical study of acceptability judgments. The Linguistic Review 27. 1–24.
Daneš, František. 1999 [1988]. Pojem „spisovného jazyka“ v dnešních společenských pod-mínkách. In Daneš, František, Jazyk a text: výbor z lingvistického díla Františka Daneše, část 2, 289–296. Prague: Filozofická fakulta Univerzity Karlovy.
Dickins, Tom. 1995. Linguistic varieties in Czech: Problems of the spoken language. Slavonica 1. 20 – 46.
Divjak, Dagmar. 2008. On (in)frequency and (un)acceptability. In Barbara Lewandowska- Tomaszczyk (ed.), Corpus linguistics, computer tools and applications – State of the art, 213–233. Frankfurt: Peter Lang.
Featherston, Samuel. 2005. The decathlon model of empirical syntax. In Stephan Kepser & Marga Reis (eds.), Linguistic evidence: Empirical, theoretical, and computational perspectives, 187–208. Berlin and New York: Mouton de Gruyter.
Brought to you by | Bibliotheque de l'Universite LavalAuthenticated | 132.203.227.63
Download Date | 7/13/14 6:18 PM
274 N. Bermel and L. Knittl
Ellis, Nick C. 2005. At the interface: Dynamic interactions of explicit and implicit knowledge. Studies in Second Language Acquisition 27(2). 305–352.
Featherston, Samuel. 2007. Data in generative grammar: The stick and the carrot. Theoretical Linguistics 33(3). 269–318.
Featherston, Samuel. 2009. Relax, lean back, and be a linguist. Zeitschrift für Sprachwissenschaft 28(1). 127–132.
Goldberg, Adele E. 2003. Constructions: A new theoretical approach to language. Trends in Cogni-tive Science 7(5). 219–224.
Goldberg, Adele E. 2009. The nature of generalization in language. Cognitive Linguistics 20(1). 93–127.
Gordon, Peter & Randall Hendrick. 1997. Intuitive knowledge of linguistic co-reference. Cogni-tion 62(3). 325–370.
Halliday, Michael Alexander Kirkwood. 1991a. Corpus studies and probabilistic grammar. In Karin Aijmer & Bengt Altenberg (eds.), English corpus linguistics, 30 – 43. New York and Lon-don: Longman.
Halliday, Michael Alexander Kirkwood. 1991b. Towards probabilistic interpretations. In Eija Ven-tola (ed.), Functional and systemic linguistics: Approaches and uses, 39– 61. Berlin and New York: Mouton de Gruyter.
Halliday, Michael Alexander Kirkwood. 1992. Language as system and language as instance. In Jan Svartvig (ed.), The corpus as a theoretical construct: Directions in corpus linguistics, 61–77. Berlin and New York: Mouton de Gruyter.
Hawkins, John A. 2004. Efficiency and complexity in grammars. Oxford: Oxford University Press.Hebal-Jezierska, Milena. 2008. Wariantywność końcówek fleksyjnych rzeczowników męskich
żywotnych w języku czeskim. Warsaw: Wydawnictwo Wydziału Polonistyki Uniwersytetu Warszawskiego.
Hlaváčová, Jaroslava. 2004. Průměrná redukovaná frekvence. In František Čermák et al., Frekvenční slovník češtiny, 15. Prague: Nakladatelství Lidové noviny.
Hoffmann, Thomas. 2006. Corpora and introspection as corroborating evidence: The case of prep-osition placement in English relative clauses. Corpus Linguistics and Linguistic Theory 2(2). 165–195.
Janda, Laura. 1996. Back from the brink: A study of how relic forms in languages serve as source material for analogical extension. Munich: Lincom Europa.
Janda, Laura & Charles Townsend. 2000. Czech. Munich: Lincom Europa.Kempen, Gerard & Karin Harbusch. 2005. The relationship between grammaticality ratings and
corpus frequencies: A case study into word order variability in the midfield of German clauses. In Stephan Kepser & Marga Reis (eds.), Linguistic evidence: Empirical, theoretical and compu-tational perspectives, 329–349. Berlin and New York: Mouton de Gruyter.
Kempen, Gerard & Karin Harbusch. 2008. Comparing linguistic judgments and corpus f requencies as windows on grammatical competence: A study of argument linearization in German clauses. In Anita Steube (ed.), The discourse potential of underspecified structures, 179–192. Berlin: Walter de Gruyter.
Klimeš, Lumír. 1953. Lokál singuláru a plurálu vzoru „hrad“ a „město“. Naše řeč 36. 212–219.Kolařík, Josef. 1995. Dynamika ve flexi substantiv běžně mluveného jazyka ve Zlíně. In Dana
Davidová (ed.), K diferenciaci současného mluveného jazyka: sborník z mezinárodní konfer-ence v Ostravě ve dnech 21.–22. září 1994, 79–83. Ostrava: Filozofická fakulta Ostravské u niverzity.
Langacker, Ronald. 2000. A dynamic usage-based model. In Michael Barlow & Suzanne Kemmer (eds.), Usage-based models of language, 1– 63. Stanford, CA: CSLI Publications.
Marcus, Gary F., Ursula Brinkmann, Harald Clahsen, Richard Wiese & Steven Pinker. 1995. Ger-man inflection: The exception that proves the rule. Cognitive Psychology 29(3). 189–256.
Brought to you by | Bibliotheque de l'Universite LavalAuthenticated | 132.203.227.63
Download Date | 7/13/14 6:18 PM
Corpus frequency and acceptability judgments 275
McKoon, Gail & Talke Macfarland. 2000. Externally and internally caused change of state verbs. Language 76(4). 833–858.
Mluvnice češtiny. 1986. Jan Petr (ed.). Prague: Academia.Newmeyer, Frederick. 2003. Grammar is grammar and usage is usage. Language 79(4). 682–707.Oliva, Karel & Drahomíra Doležalová. 2004. O korpusu jako o zdroji jazykových dat. In Petr
Karlík (ed.), Korpus jako zdroj dat o češtině, 7–10. Brno: Masarykova univerzita.Příruční mluvnice češtiny. 1995. Petr Karlík, Marek Nekula & Zdenka Rusínová (eds.). Prague:
Nakladatelství Lidové Noviny.Schütze, Carson. 1996. The empirical base of linguistics: Grammaticality judgments and linguis-
tic methodology. Chicago: University of Chicago Press.Sgall, Petr, Jiří Hronek, Alexandr Stich & Ján Horecký. 1992. Variation in language: Code switch-
ing in Czech as a challenge for sociolinguistics. Amsterdam and Philadelphia: John Benjamins.Sprouse, Jon. 2007. Continuous acceptability, categorical grammaticality, and experimental syn-
tax. Biolinguistics 1. 118–129.Sprouse, Jon. 2008. The differential sensitivity of acceptability judgments to processing effects.
Linguistic Inquiry 39(4). 686 – 694.Sprouse, Jon. 2009. Revisiting satiation: Evidence for an equalization response strategy. Linguistic
Inquiry 40(2). 329–341.Stefanowitsch, Anatol. 2006. Negative evidence and the raw frequency fallacy. Corpus Linguistics
and Linguistic Theory 2(1). 61–77.Štícha, František. 2009. Lokál singuláru tvrdých neživotných maskulin (ve vlaku vs. v potoce):
úzus a gramatičnost. Slovo a slovesnost 70. 193–220.UNESCO. 2007. Education counts: Benchmarking progress in 19 WEI countries ( World Educa-
tion Indicators – 2007). Montreal: UNESCO Institute for Statistics. http://www.uis.unesco.org/ Library/ Documents/wei2007.pdf (13 July 2011).
Wasow, Thomas & Jennifer Arnold. 2004. Intuitions in linguistic argumentation. Lingua 115(11). 1481–1496.
Brought to you by | Bibliotheque de l'Universite LavalAuthenticated | 132.203.227.63
Download Date | 7/13/14 6:18 PM

Brought to you by | Bibliotheque de l'Universite LavalAuthenticated | 132.203.227.63
Download Date | 7/13/14 6:18 PM