Embed Size (px)
Citation preview
Corpus Linguistics 2 Keyword Analysis
Dubrovnik Fall School in Linguistic Methods 20–26 October 2013
Costas Gabrielatos
Edge Hill University
Based on Gabrielatos & Marchi (2011, 2012)
Keyword analysis: The basics
• Keyword analysis
– The comparison of word frequencies between two corpora (through word frequency lists).
• Study corpus
– The corpus we want to investigate.
• Reference corpus:
– The corpus we compare the study corpus to.
• Keyword
– A word that is significantly more frequent in the study corpus than in the reference corpus.
• Utility: Reveals lexical differences topic
Background (1)
• Keyword analysis is one of the most widely
used techniques in corpus studies.
• The vast majority of studies do not examine
all keywords, but the top X (usually the top
100).
The ranking criterion becomes very
important.
The criterion is termed keyness.
Background (2)
Manual examination of frequency differences
of particular sets of words has shown large
discrepancies between ranking by normalised
frequency difference (%DIFF) and ranking by
statistical significance (LL) (Gabrielatos 2007a,b; Gabrielatos & McEnery, 2005)
Questions and Aims
• What is a keyword?
• What is keyness?
• How is it measured?
Examination of definitions of the terms
keyword and keyness.
Comparison of metrics.
Definitions: Keywords
• “Key words are those whose frequency is unusually high in comparison with some norm” (Scott, 1996: 53).
• “A key word may be defined as a word which occurs with unusual frequency in a given text. This does not mean high frequency but unusual frequency, by comparison with a reference corpus of some kind” (Scott, 1997: 236).
Keywords are defined in relation to frequency difference.
The metric of keyness would be expected to represent
the extent of the frequency difference.
However ...
Definitions: Keyness
• “The keyness of a keyword represents the value of log-likelihood or Chi-square statistics; in other words it provides an indicator of a keyword’s importance as a content descriptor for the appeal. The significance (p value) represents the probability that this keyness is accidental” (Biber et al., 2007: 138).
• “A word is said to be "key" if [...] its frequency in the text when compared with its frequency in a reference corpus is such that the statistical probability as computed by an appropriate procedure is smaller than or equal to a p value specified by the user” (Scott, 2011).
Keyword vs. Keyness: Contradictions
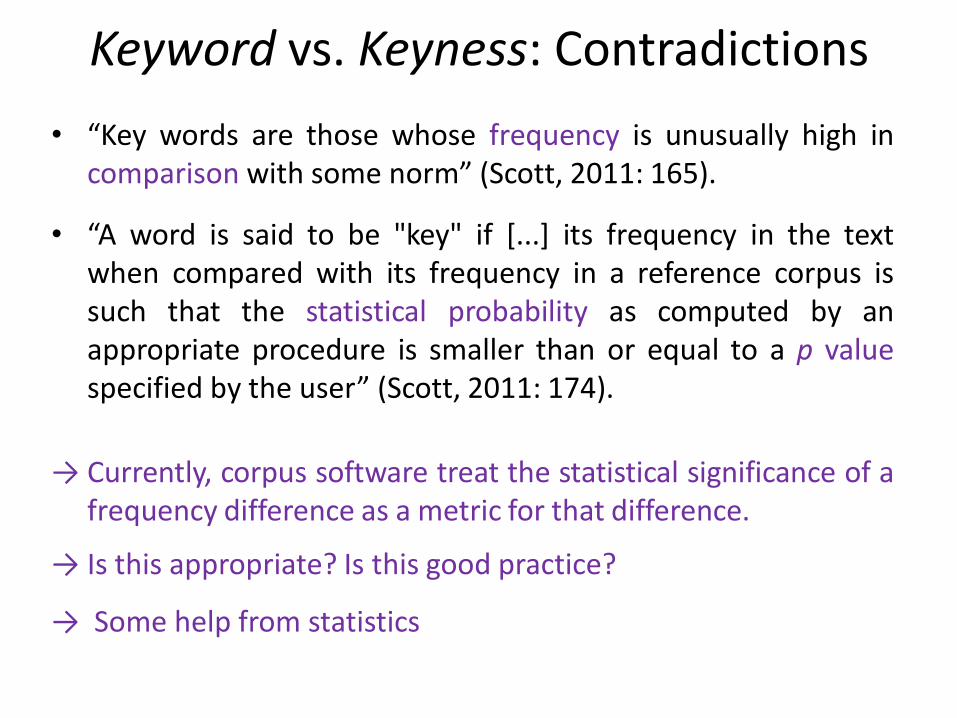
• “Key words are those whose frequency is unusually high in comparison with some norm” (Scott, 2011: 165).
• “A word is said to be "key" if [...] its frequency in the text when compared with its frequency in a reference corpus is such that the statistical probability as computed by an appropriate procedure is smaller than or equal to a p value specified by the user” (Scott, 2011: 174).
→ Currently, corpus software treat the statistical significance of a frequency difference as a metric for that difference.
→ Is this appropriate? Is this good practice?
→ Some help from statistics
Effect size vs. Statistical Significance
What do they measure?
Statistical Significance: p-value
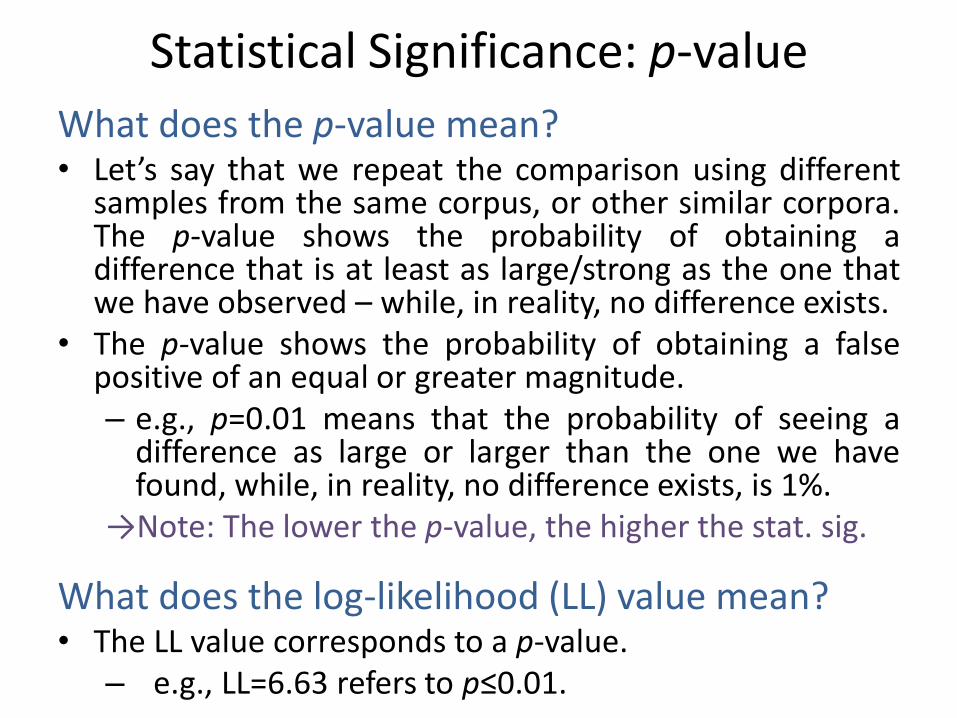
What does the p-value mean? • Let’s say that we repeat the comparison using different
samples from the same corpus, or other similar corpora. The p-value shows the probability of obtaining a difference that is at least as large/strong as the one that we have observed – while, in reality, no difference exists.
• The p-value shows the probability of obtaining a false positive of an equal or greater magnitude. – e.g., p=0.01 means that the probability of seeing a
difference as large or larger than the one we have found, while, in reality, no difference exists, is 1%.
→Note: The lower the p-value, the higher the stat. sig.
What does the log-likelihood (LL) value mean? • The LL value corresponds to a p-value.
– e.g., LL=6.63 refers to p≤0.01.
Statistical Significance: Thresholds?
• If the p-value is no higher than the one we have set as a threshold, then we accept the result as statistically significant.
• In CL, the usual maximum p-value is 0.01.
• How do we calculate statistical significance? – When using corpus software …
• a measure of stat. sig. is produced automatically → Always check the default statistic and threshold!
• we can usually set our own statistic and threshold.
– Manually, using online calculators: • Stefan Evert, Paul Rayson
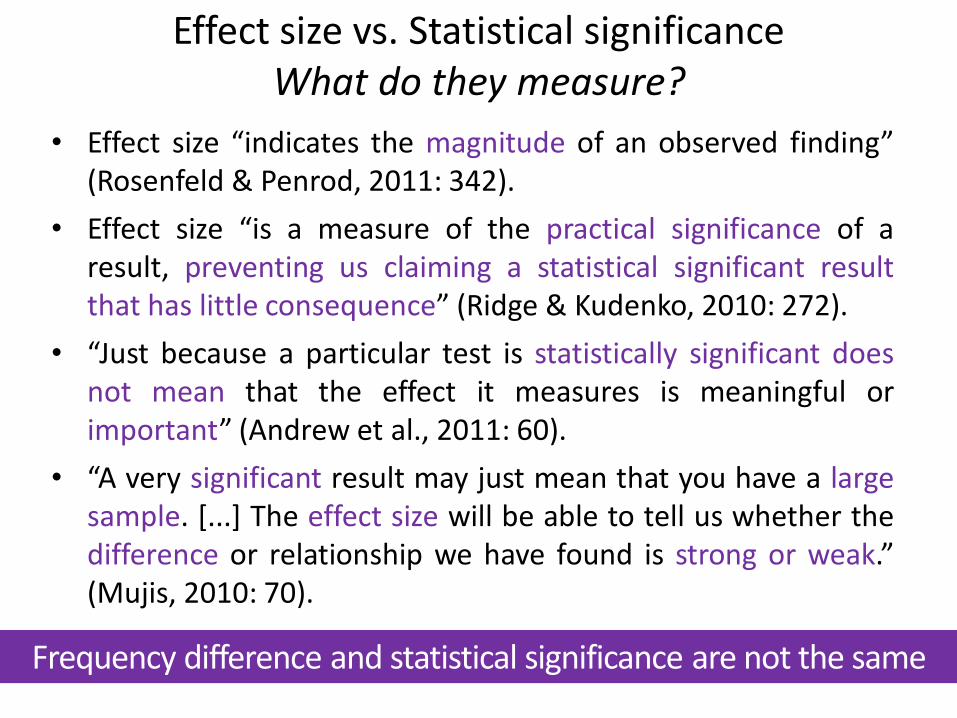
Effect size vs. Statistical significance What do they measure?
• Effect size “indicates the magnitude of an observed finding” (Rosenfeld & Penrod, 2011: 342).
• Effect size “is a measure of the practical significance of a result, preventing us claiming a statistical significant result that has little consequence” (Ridge & Kudenko, 2010: 272).
• “Just because a particular test is statistically significant does not mean that the effect it measures is meaningful or important” (Andrew et al., 2011: 60).
• “A very significant result may just mean that you have a large sample. [...] The effect size will be able to tell us whether the difference or relationship we have found is strong or weak.” (Mujis, 2010: 70).
Frequency difference and statistical significance are not the same
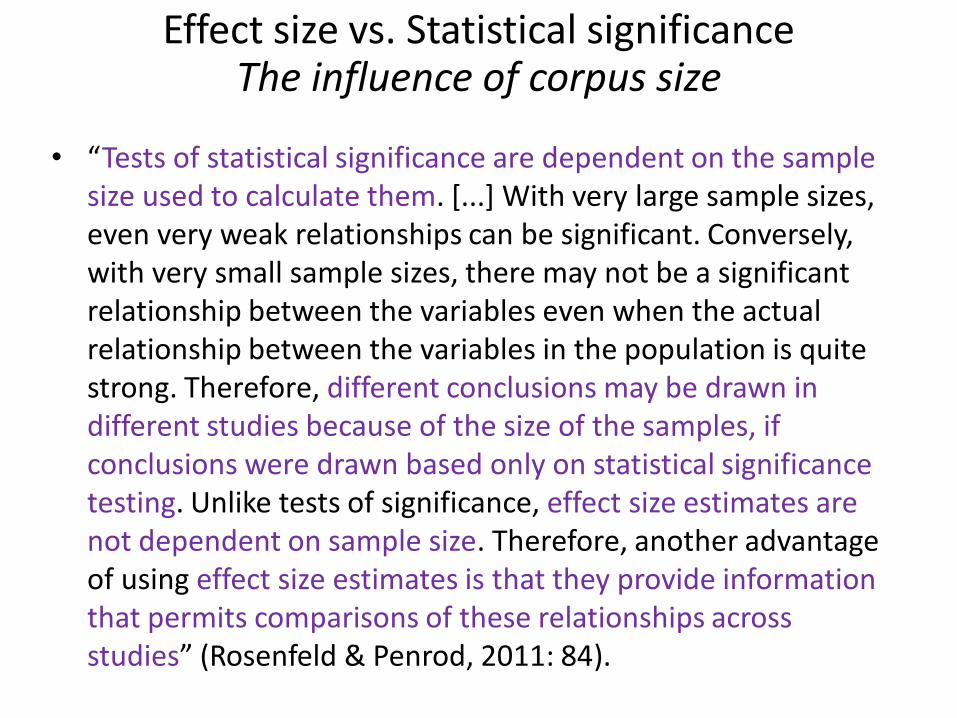
• “Tests of statistical significance are dependent on the sample size used to calculate them. [...] With very large sample sizes, even very weak relationships can be significant. Conversely, with very small sample sizes, there may not be a significant relationship between the variables even when the actual relationship between the variables in the population is quite strong. Therefore, different conclusions may be drawn in different studies because of the size of the samples, if conclusions were drawn based only on statistical significance testing. Unlike tests of significance, effect size estimates are not dependent on sample size. Therefore, another advantage of using effect size estimates is that they provide information that permits comparisons of these relationships across studies” (Rosenfeld & Penrod, 2011: 84).
Effect size vs. Statistical significance The influence of corpus size
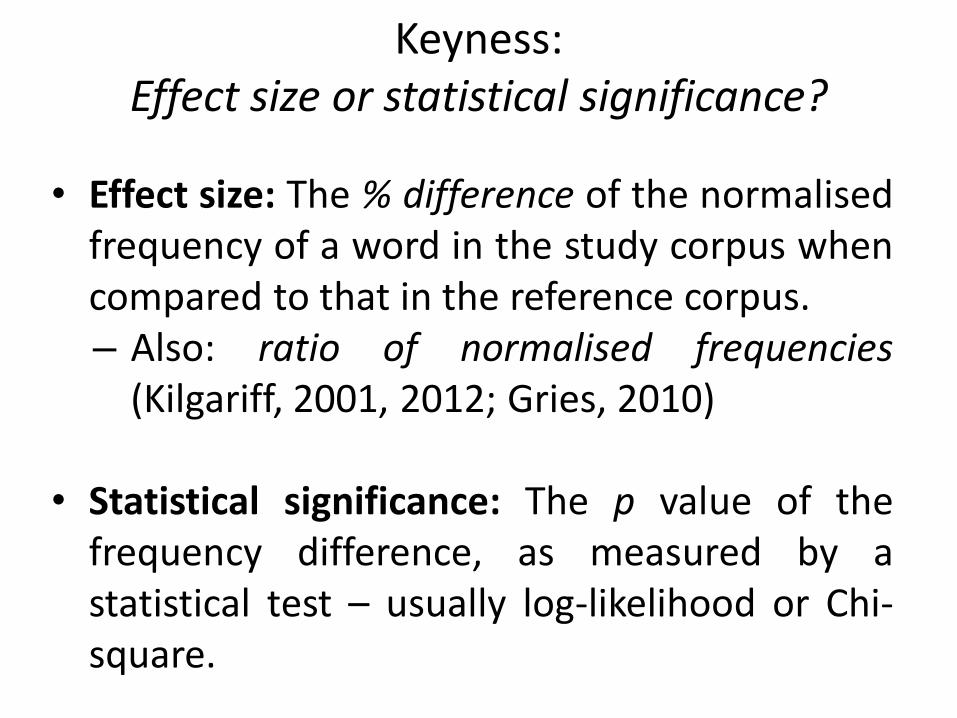
Keyness: Effect size or statistical significance?
• Effect size: The % difference of the normalised frequency of a word in the study corpus when compared to that in the reference corpus. – Also: ratio of normalised frequencies
(Kilgariff, 2001, 2012; Gries, 2010)
• Statistical significance: The p value of the frequency difference, as measured by a statistical test – usually log-likelihood or Chi-square.
Keyness: Effect size or statistical significance?
Does the choice of metric make a difference ...
… when all (candidate) KWs are examined?
… when only the top X (candidate) keywords are examined?
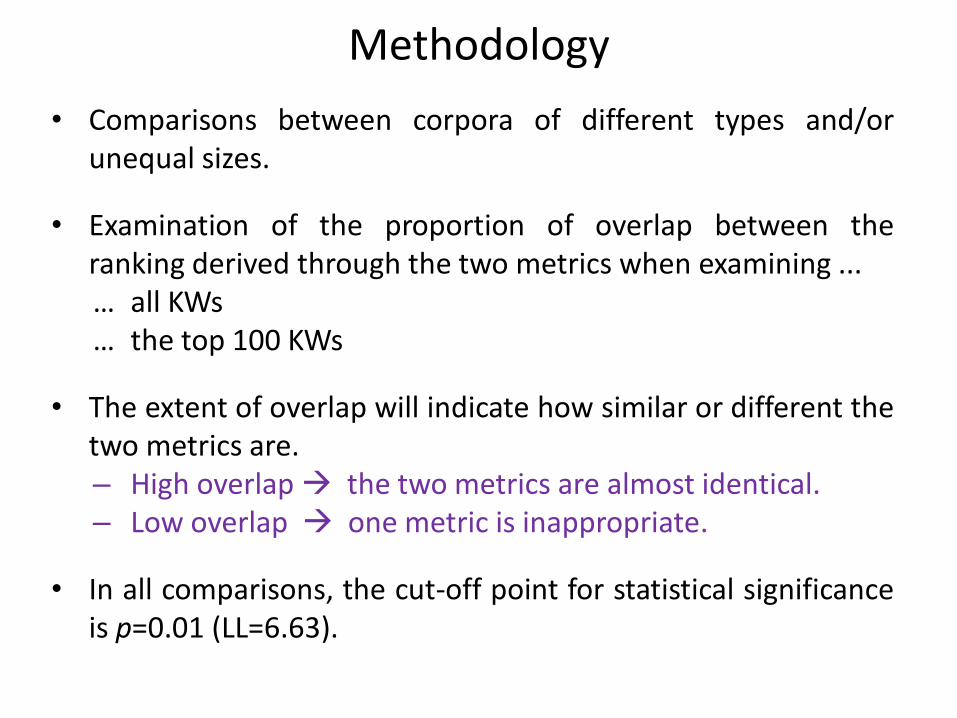
Methodology
• Comparisons between corpora of different types and/or unequal sizes.
• Examination of the proportion of overlap between the ranking derived through the two metrics when examining ... … all KWs … the top 100 KWs
• The extent of overlap will indicate how similar or different the two metrics are. – High overlap the two metrics are almost identical. – Low overlap one metric is inappropriate.
• In all comparisons, the cut-off point for statistical significance is p=0.01 (LL=6.63).
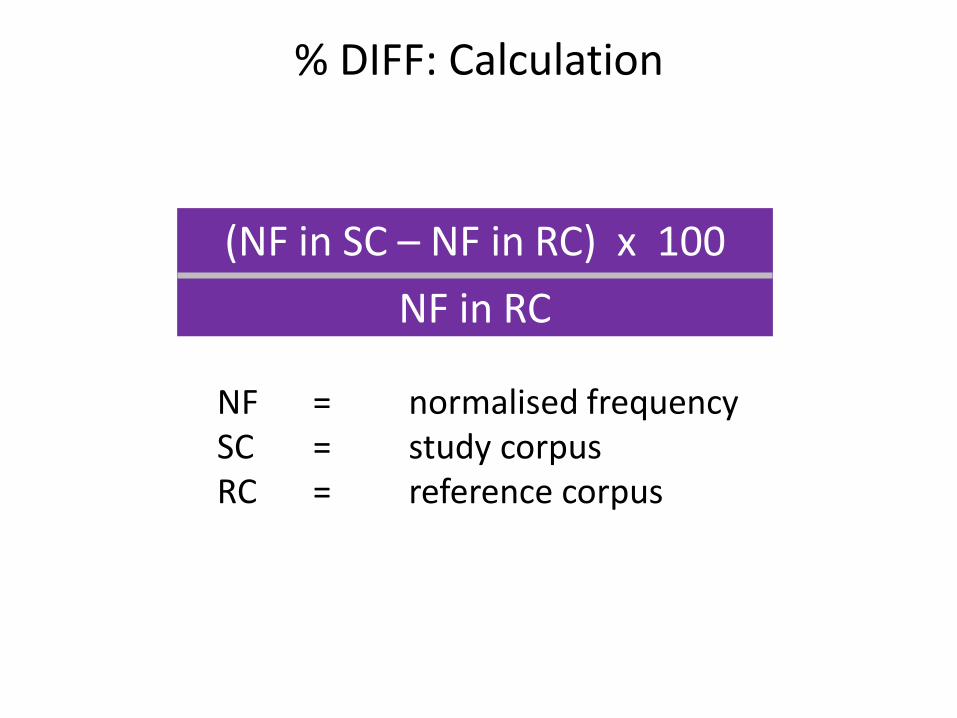
(NF in SC – NF in RC) x 100
NF in RC
% DIFF: Calculation
NF = normalised frequency SC = study corpus RC = reference corpus

LL and %DIFF ranking: Visualisation of putative full overlap
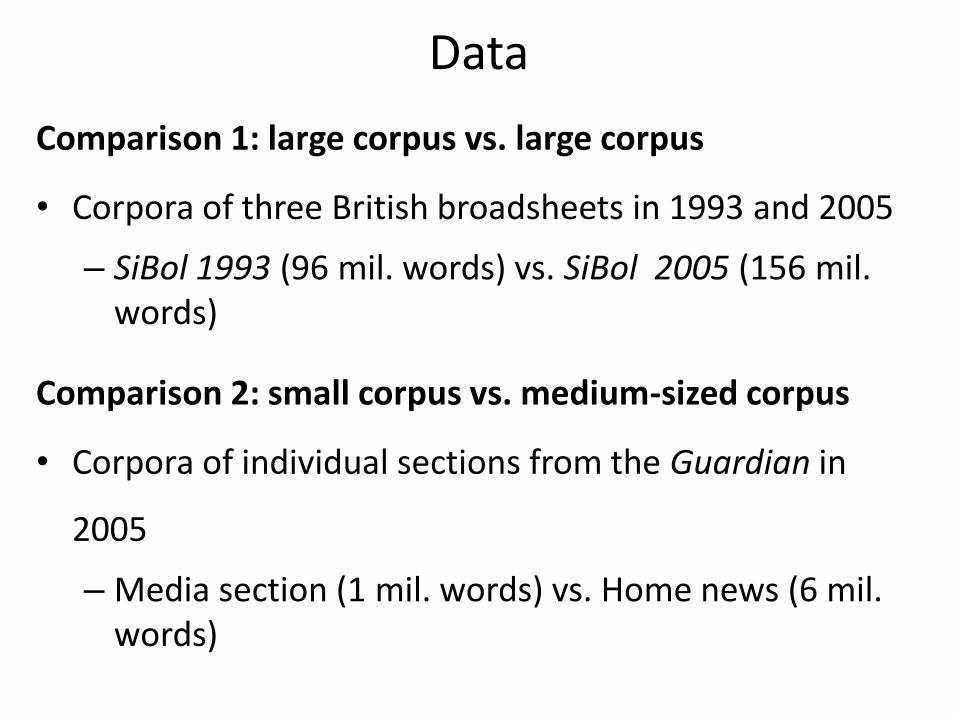
Comparison 1: large corpus vs. large corpus
• Corpora of three British broadsheets in 1993 and 2005
– SiBol 1993 (96 mil. words) vs. SiBol 2005 (156 mil. words)
Comparison 2: small corpus vs. medium-sized corpus
• Corpora of individual sections from the Guardian in
2005
– Media section (1 mil. words) vs. Home news (6 mil. words)
Data
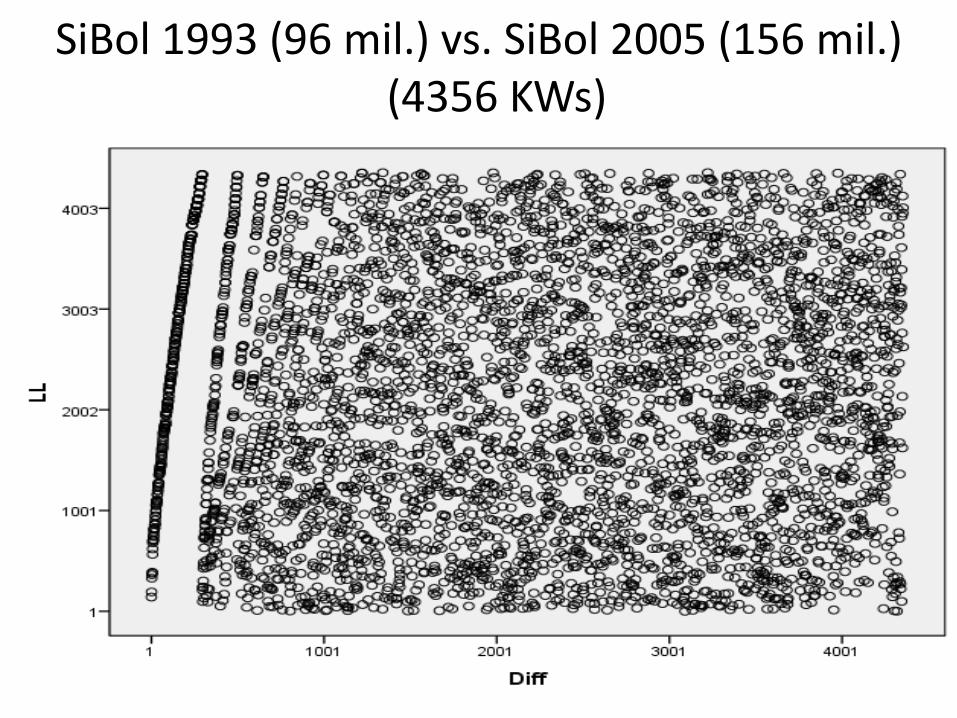
SiBol 1993 (96 mil.) vs. SiBol 2005 (156 mil.) (4356 KWs)
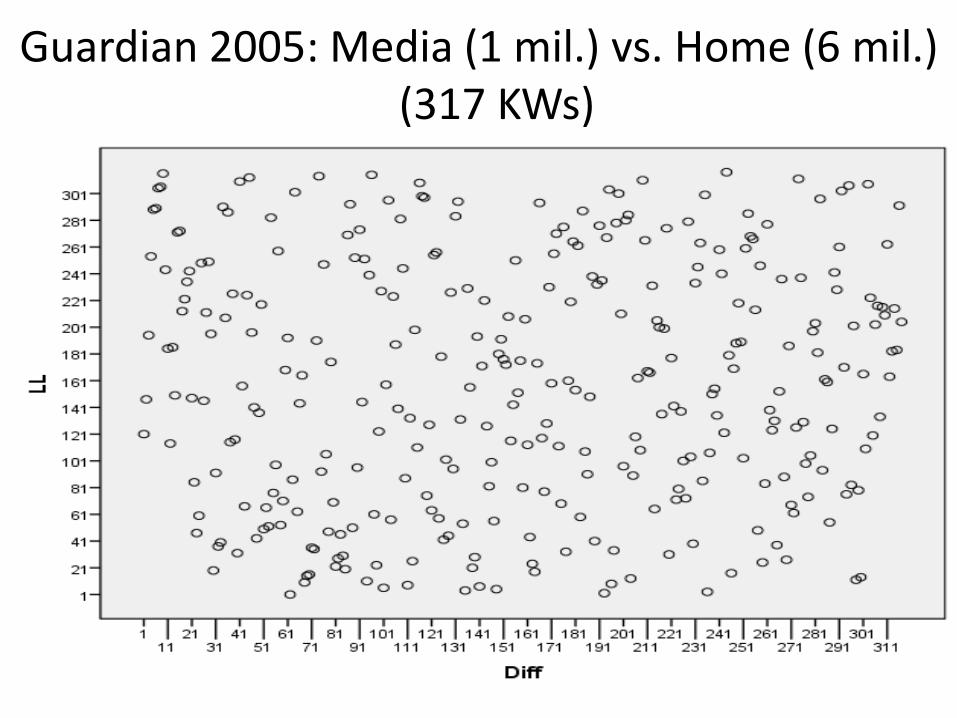
Guardian 2005: Media (1 mil.) vs. Home (6 mil.) (317 KWs)
Absolute and relative size of compared corpora doesn’t seem to make a difference
But all four corpora compared so far contain newspaper articles
What about comparisons between specialised and general corpora?
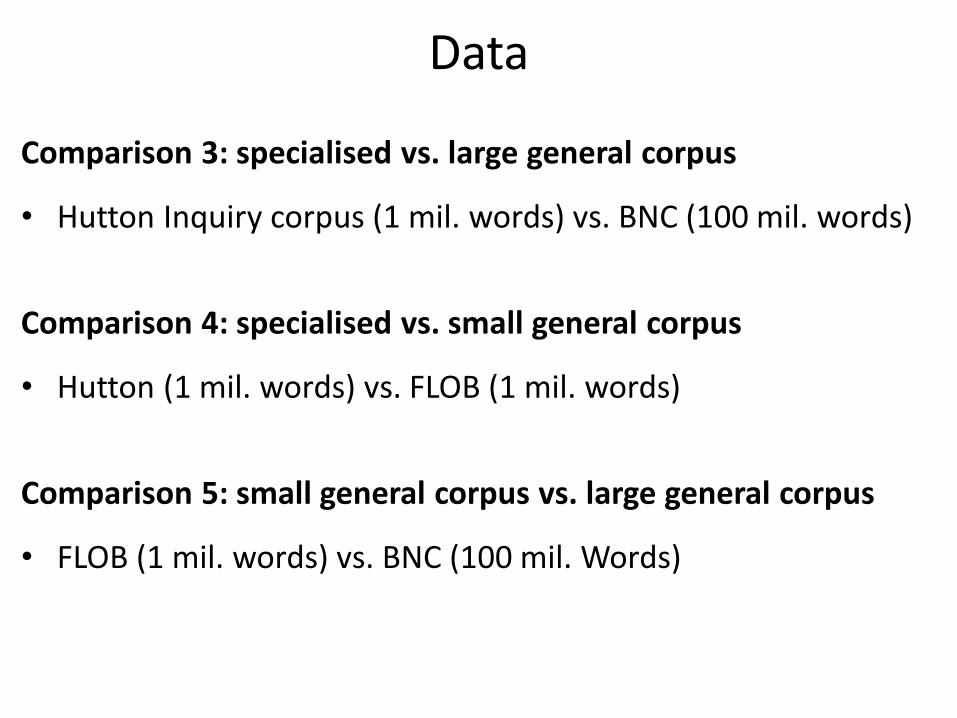
Comparison 3: specialised vs. large general corpus
• Hutton Inquiry corpus (1 mil. words) vs. BNC (100 mil. words)
Comparison 4: specialised vs. small general corpus
• Hutton (1 mil. words) vs. FLOB (1 mil. words)
Comparison 5: small general corpus vs. large general corpus
• FLOB (1 mil. words) vs. BNC (100 mil. Words)
Data
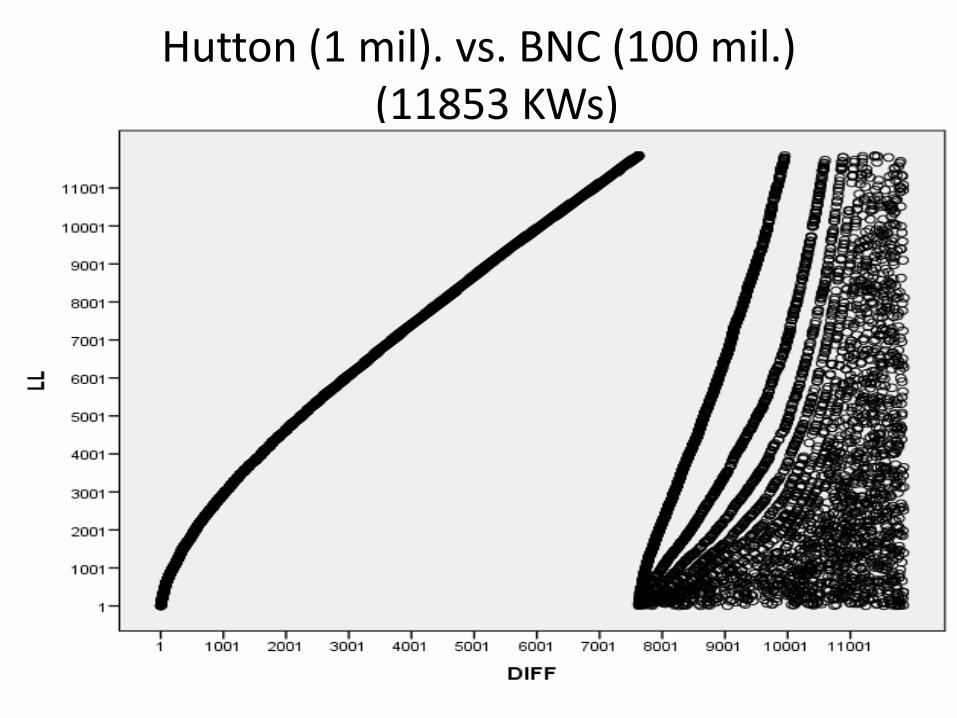
Hutton (1 mil). vs. BNC (100 mil.) (11853 KWs)
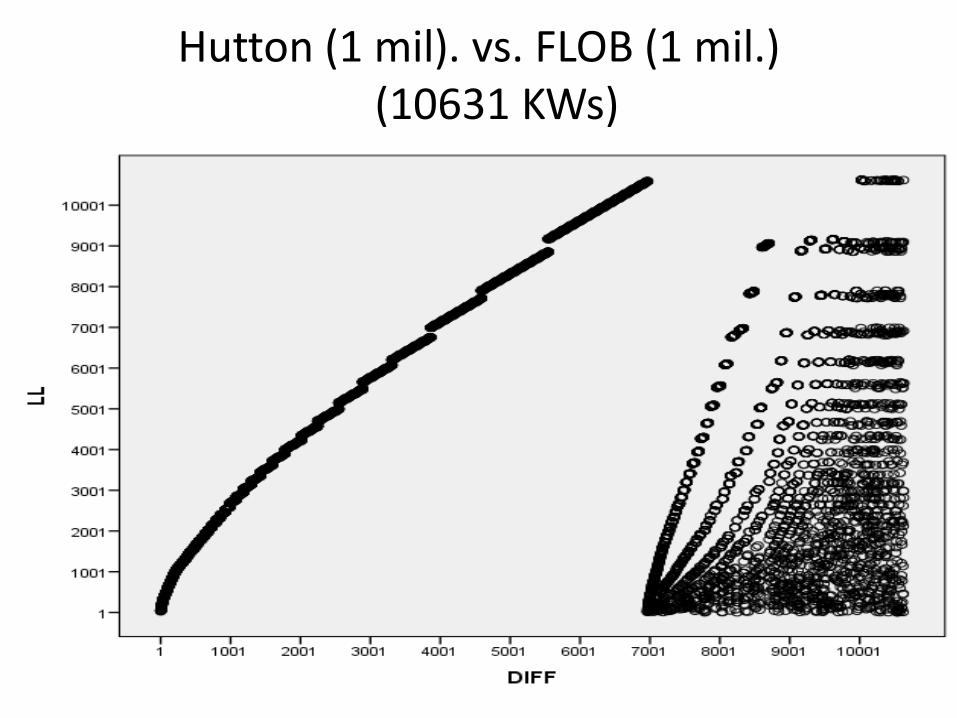
Hutton (1 mil). vs. FLOB (1 mil.) (10631 KWs)
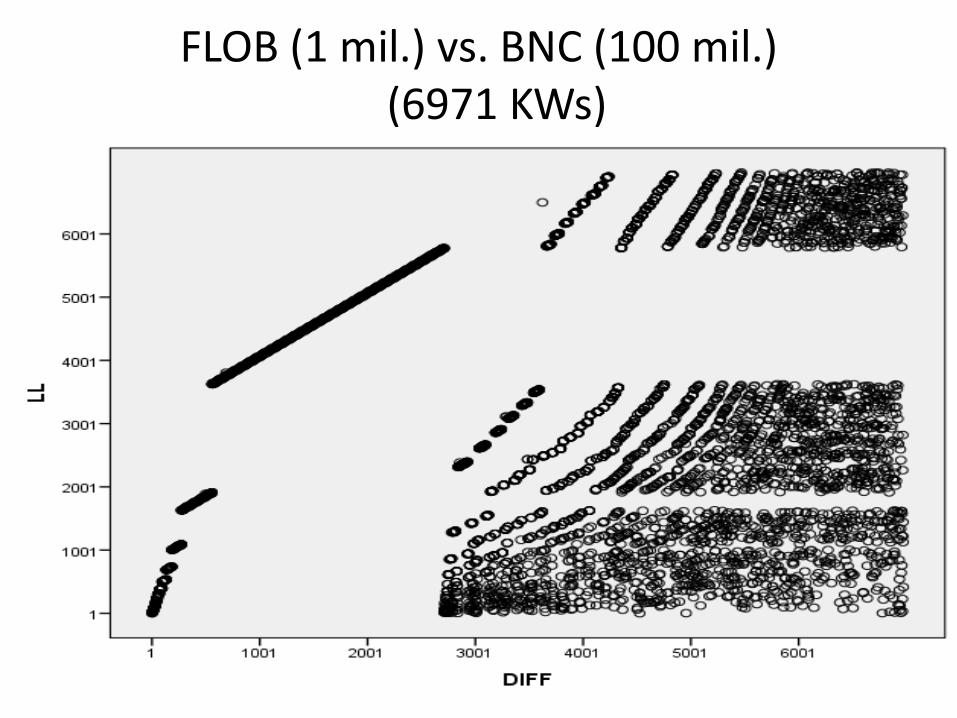
FLOB (1 mil.) vs. BNC (100 mil.) (6971 KWs)

However, this very low overlap may be misleading:
differences in the ranking of KWs may be very small
Examination of overlap in the top 100 KWs by LL and %DIFF
e.g.
A word may be at position 25 in one ranking and 27 in the other
The two metrics show
very low overlap in ranking
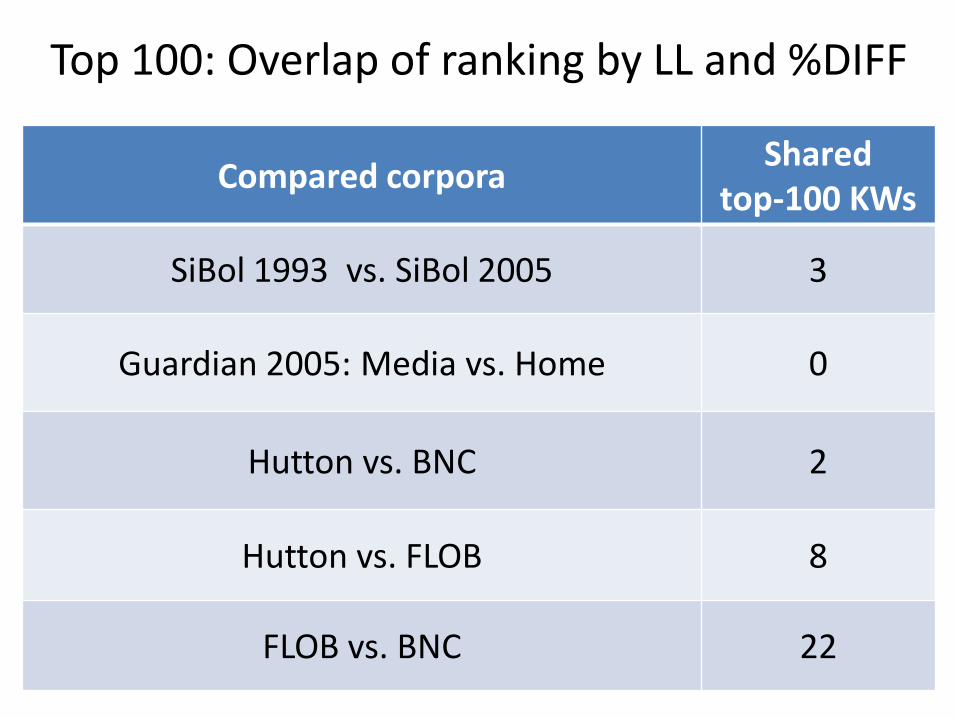
Top 100: Overlap of ranking by LL and %DIFF
Compared corpora Shared
top-100 KWs
SiBol 1993 vs. SiBol 2005 3
Guardian 2005: Media vs. Home 0
Hutton vs. BNC 2
Hutton vs. FLOB 8
FLOB vs. BNC 22
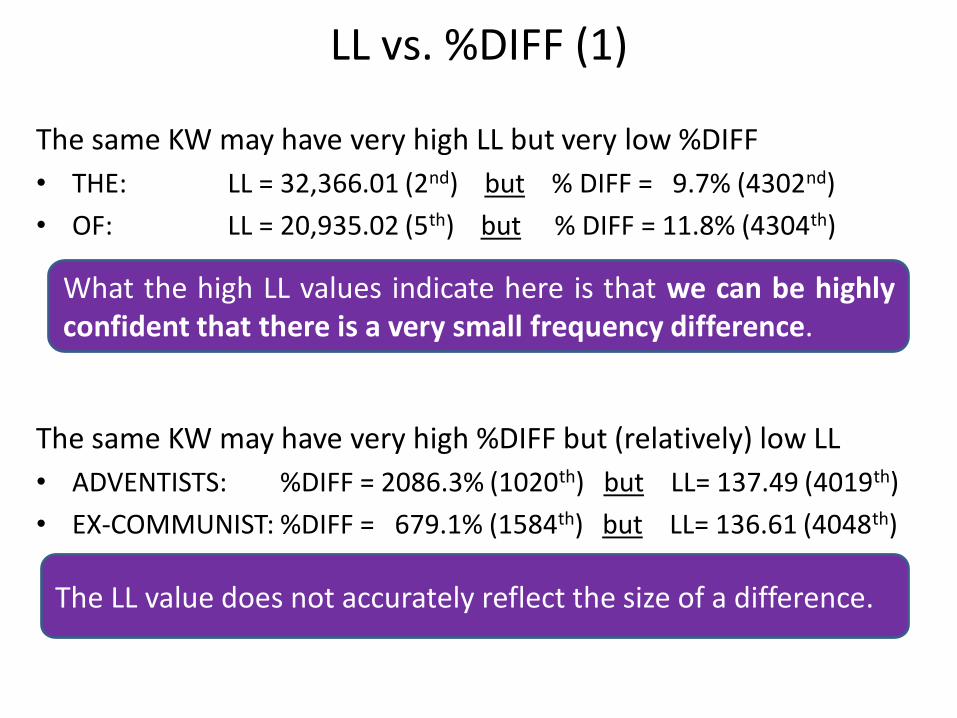
The same KW may have very high LL but very low %DIFF
• THE: LL = 32,366.01 (2nd) but % DIFF = 9.7% (4302nd)
• OF: LL = 20,935.02 (5th) but % DIFF = 11.8% (4304th)
The same KW may have very high %DIFF but (relatively) low LL
• ADVENTISTS: %DIFF = 2086.3% (1020th) but LL= 137.49 (4019th)
• EX-COMMUNIST: %DIFF = 679.1% (1584th) but LL= 136.61 (4048th)
LL vs. %DIFF (1)
What the high LL values indicate here is that we can be highly confident that there is a very small frequency difference.
The LL value does not accurately reflect the size of a difference.
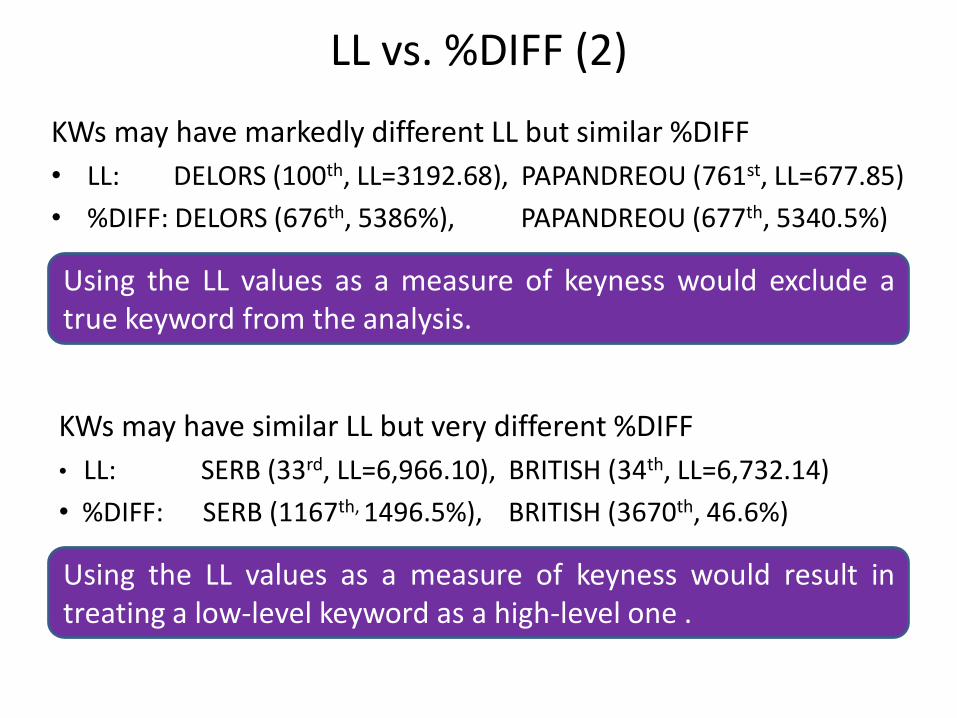
KWs may have markedly different LL but similar %DIFF
• LL: DELORS (100th, LL=3192.68), PAPANDREOU (761st, LL=677.85)
• %DIFF: DELORS (676th, 5386%), PAPANDREOU (677th, 5340.5%)
LL vs. %DIFF (2)
Using the LL values as a measure of keyness would exclude a true keyword from the analysis.
Using the LL values as a measure of keyness would result in treating a low-level keyword as a high-level one .
KWs may have similar LL but very different %DIFF
• LL: SERB (33rd, LL=6,966.10), BRITISH (34th, LL=6,732.14)
• %DIFF: SERB (1167th, 1496.5%), BRITISH (3670th, 46.6%)
• High LL does not necessarily correlate with high %DIFF.
• LL and %DIFF result in different rankings.
Conclusions (1)
Why?
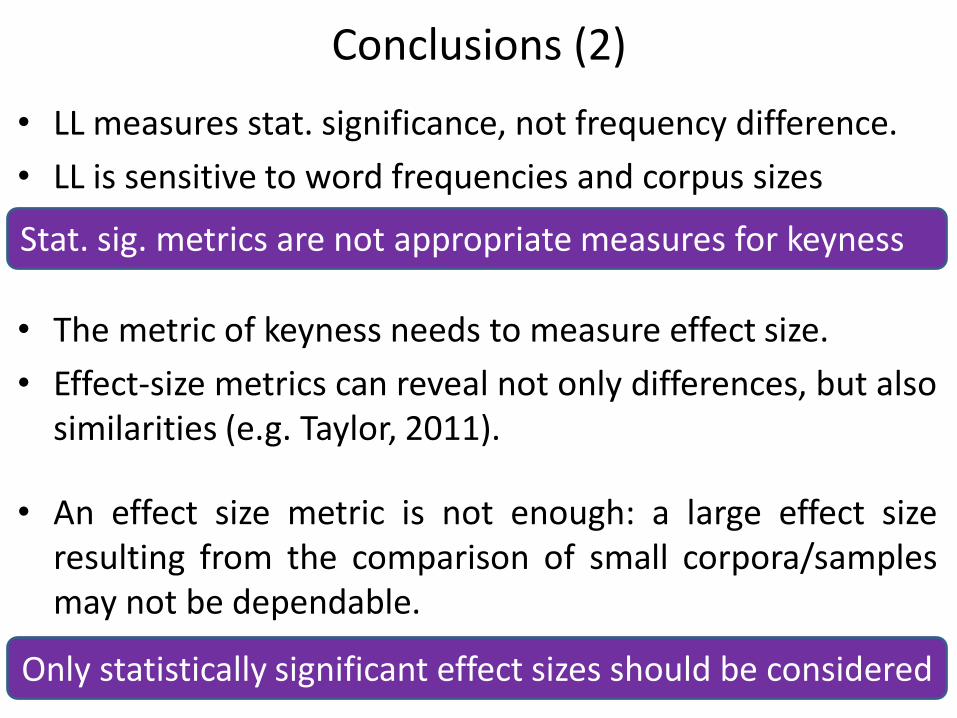
• LL measures stat. significance, not frequency difference.
• LL is sensitive to word frequencies and corpus sizes
• The metric of keyness needs to measure effect size.
• Effect-size metrics can reveal not only differences, but also similarities (e.g. Taylor, 2011).
• An effect size metric is not enough: a large effect size resulting from the comparison of small corpora/samples may not be dependable.
Conclusions (2)
Only statistically significant effect sizes should be considered
Stat. sig. metrics are not appropriate measures for keyness
Expanding keyword analysis
• (Additional) examination of groups of notionally related low-frequency keywords
– Words are grouped according to meaning (Baker, 2004).
• Key semantic domain analysis (Rayson, 2008)
– The frequency comparison of semantic categories between two corpora.
– Words are tagged for semantic domain.
– Corpus tool: Wmatrix (Rayson, 2009)
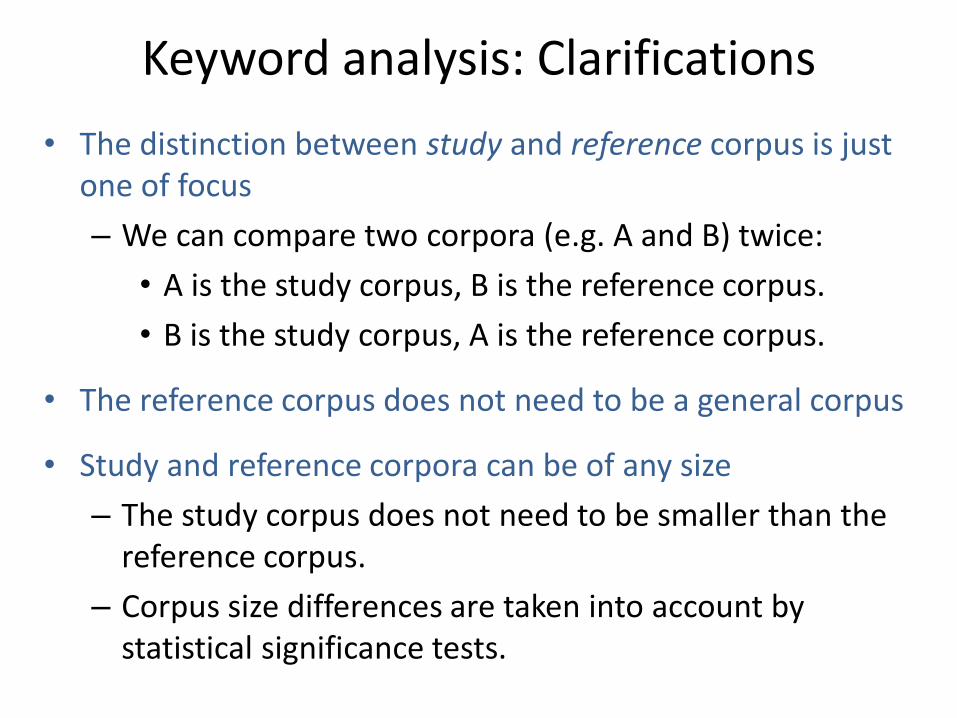
Keyword analysis: Clarifications
• The distinction between study and reference corpus is just one of focus
– We can compare two corpora (e.g. A and B) twice:
• A is the study corpus, B is the reference corpus.
• B is the study corpus, A is the reference corpus.
• The reference corpus does not need to be a general corpus
• Study and reference corpora can be of any size
– The study corpus does not need to be smaller than the reference corpus.
– Corpus size differences are taken into account by statistical significance tests.

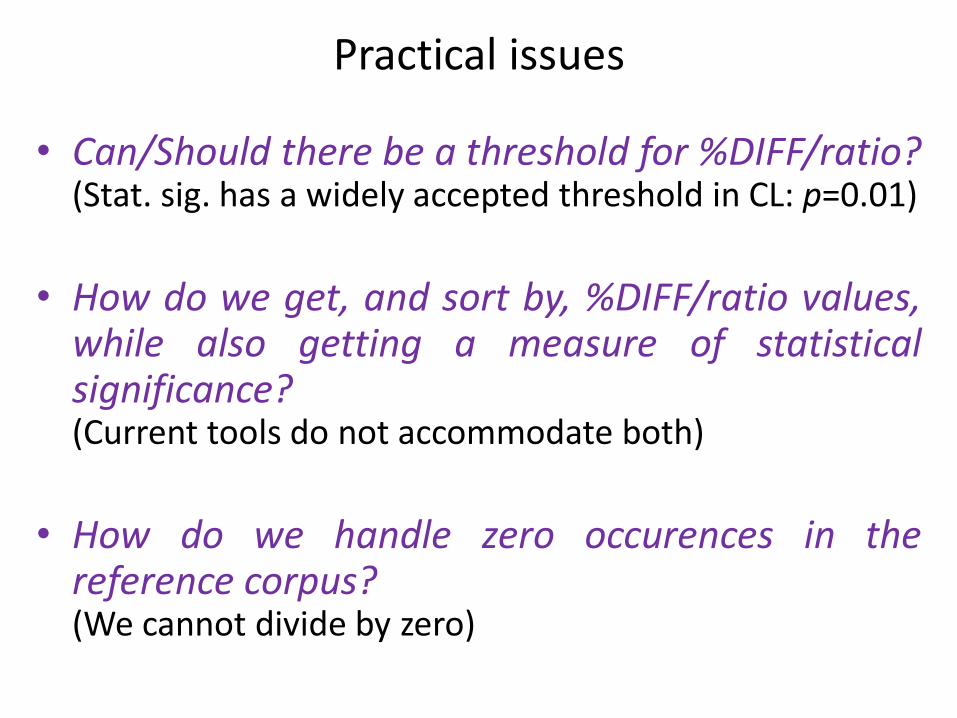
• Can/Should there be a threshold for %DIFF/ratio? (Stat. sig. has a widely accepted threshold in CL: p=0.01)
• How do we get, and sort by, %DIFF/ratio values, while also getting a measure of statistical significance? (Current tools do not accommodate both)
• How do we handle zero occurences in the reference corpus? (We cannot divide by zero)
Practical issues
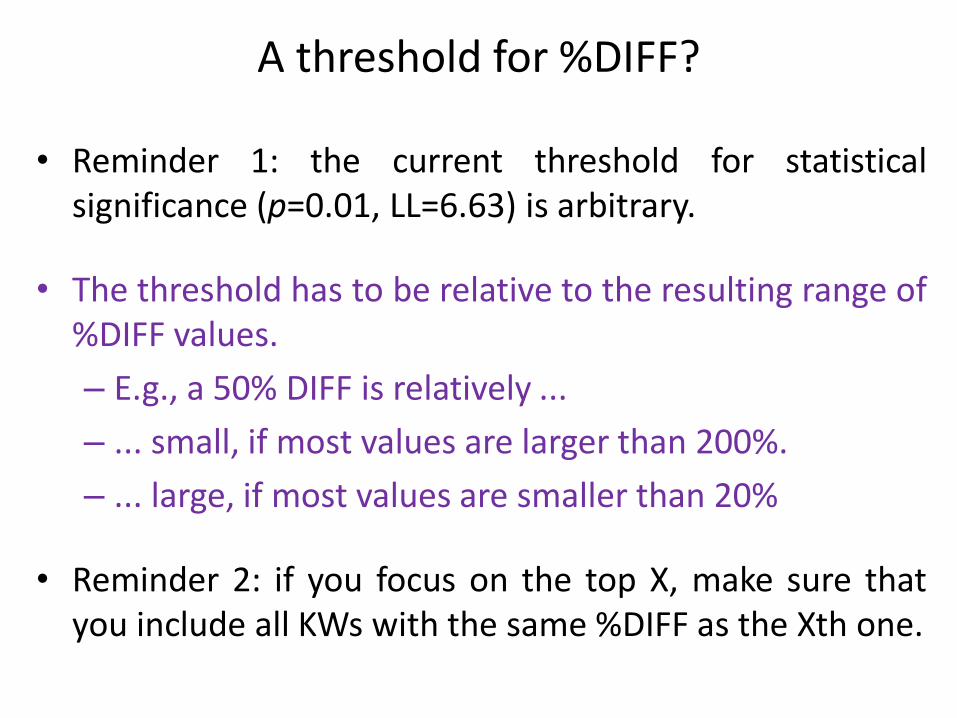
• Reminder 1: the current threshold for statistical significance (p=0.01, LL=6.63) is arbitrary.
• The threshold has to be relative to the resulting range of %DIFF values.
– E.g., a 50% DIFF is relatively ...
– ... small, if most values are larger than 200%.
– ... large, if most values are smaller than 20%
• Reminder 2: if you focus on the top X, make sure that you include all KWs with the same %DIFF as the Xth one.
A threshold for %DIFF?
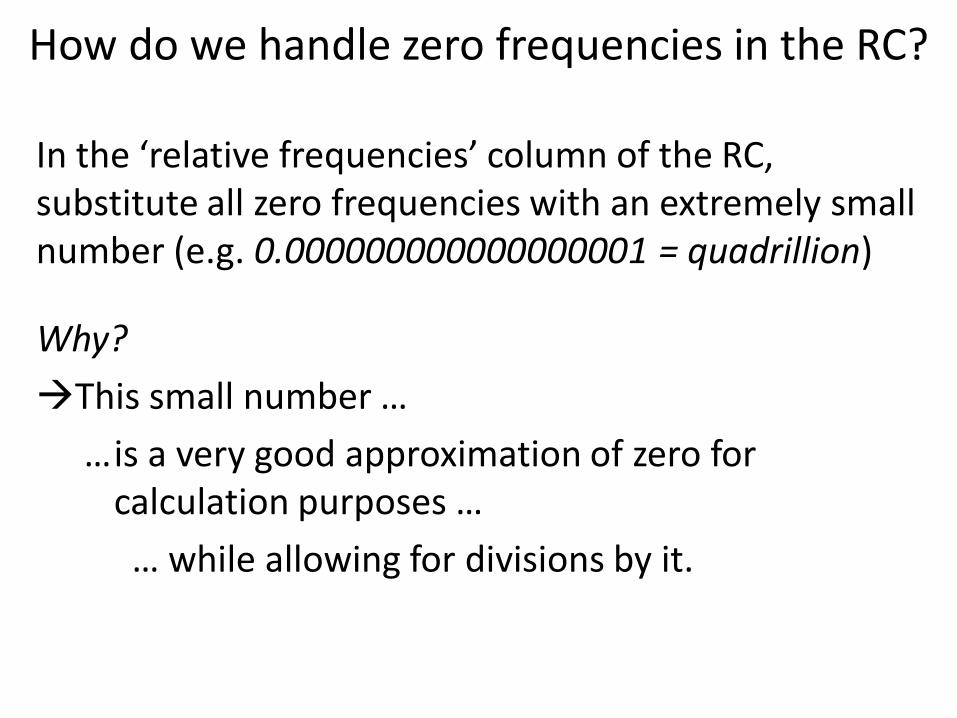
In the ‘relative frequencies’ column of the RC, substitute all zero frequencies with an extremely small number (e.g. 0.000000000000000001 = quadrillion)
Why?
This small number …
…is a very good approximation of zero for calculation purposes …
… while allowing for divisions by it.
How do we handle zero frequencies in the RC?
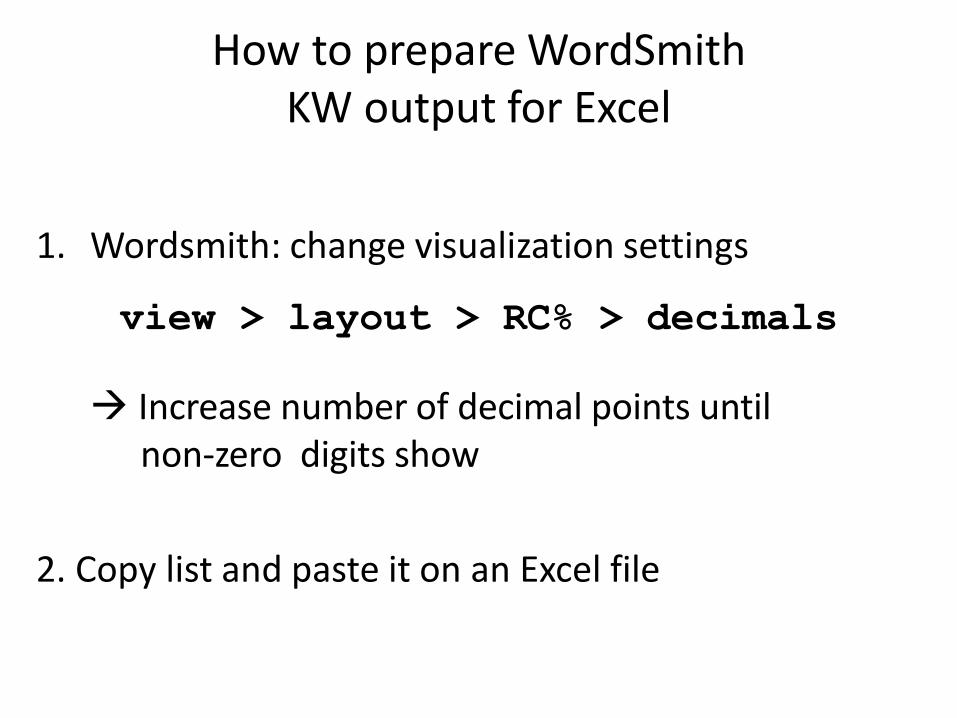
1. Wordsmith: change visualization settings
view > layout > RC% > decimals
Increase number of decimal points until non-zero digits show
2. Copy list and paste it on an Excel file
How to prepare WordSmith KW output for Excel
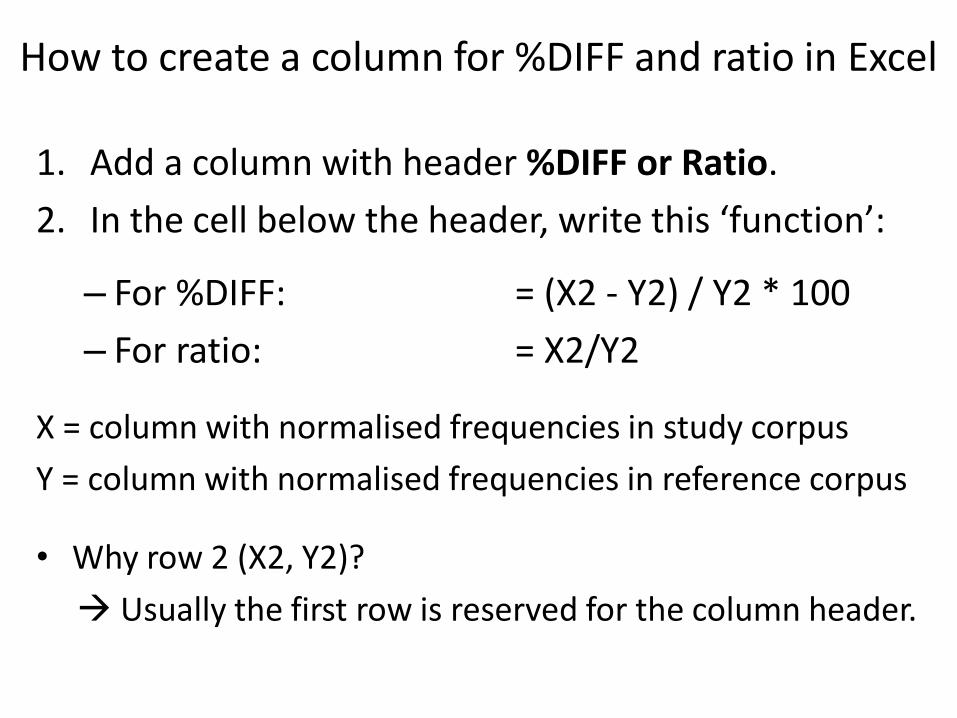
1. Add a column with header %DIFF or Ratio.
2. In the cell below the header, write this ‘function’:
– For %DIFF: = (X2 - Y2) / Y2 * 100
– For ratio: = X2/Y2
X = column with normalised frequencies in study corpus
Y = column with normalised frequencies in reference corpus
• Why row 2 (X2, Y2)?
Usually the first row is reserved for the column header.
How to create a column for %DIFF and ratio in Excel
References and further reading (1)
• Andrew, D.P.S., Pedersen, P.M. & McEvoy, C.D. (2011). Research Methods and Design in Sport Management. Human Kinetics.
• Biber, D., Connor, U. & Upton, A. with Anthony, M. & Gladkov, K. (2007). Rhetorical appeals in fundraising. In D. Biber, U. Connor & A. Upton. Discourse on the Move: Using corpus analysis to describe discourse structure. (121-151). Amsterdam: John Benjamin.
• Gabrielatos, C. (2007a). Selecting query terms to build a specialised corpus from a restricted-access database. ICAME Journal, 31: 5-43. [http://icame.uib.no/ij31/ij31-page5-44.pdf]
• Gabrielatos, C. (2007b). If-conditionals as modal colligations: A corpus-based investigation. In M. Davies, P. Rayson, S. Hunston & P. Danielsson (eds.), Proceedings of the Corpus Linguistics Conference: Corpus Linguistics 2007. Birmingham: University of Birmingham.
[http://ucrel.lancs.ac.uk/publications/CL2007/paper/256_Paper.pdf]
• Gabrielatos, C. & Marchi, A. (2012). Keyness: Appropriate metrics and practical issues. CADS International Conference, Bologna, Italy, 13-15 September 2012. [http://repository.edgehill.ac.uk/4196/]

References and further reading (2)
• Gabrielatos, C. & Marchi, A. (2011). Keyness: Matching metrics to definitions. Corpus Linguistics in the South: Theoretical-methodological challenges in corpus approaches to discourse studies - and some ways of addressing them. University of Portsmouth, 5 November 2011. [http://eprints.lancs.ac.uk/51449/]
• Gabrielatos, C. & McEnery, T. (2005). Epistemic modality in MA dissertations. In Fuertes Olivera, P.A. (ed.), Lengua y Sociedad: Investigaciones recientes en lingüística aplicada. Lingüística y Filología no. 61. (311-331). Valladolid: Universidad de Valladolid. [http://repository.edgehill.ac.uk/4137]
• Gries, S.Th. (2010). Useful statistics for corpus linguistics. In Sánchez, A. & Almela, M. (eds.) A Mosaic of Corpus Linguistics: Selected approaches. (269-291). Frankfurt am Main: Peter Lang.
• Kilgariff, A. (2012). Getting to know your corpus. In Sojka, P., Horak, A., Kopecek, I. & Pala, K. (eds). Proceedings of Text, Speech, Dialogue (TSD 2012). Springer.
• Kilgarriff, A. (2009). Simple maths for keywords. In Mahlberg, M., González-Díaz, V. & Smith, C. (eds.) Proceedings of the Corpus Linguistics Conference, CL2009. University of Liverpool, UK, 20-23 July 2009. [http://ucrel.lancs.ac.uk/publications/CL2009/171_FullPaper.doc]
References and further reading (3) • Kilgariff, A. (2005). Language is never ever ever random. Corpus Linguistics and
Linguistic Theory, 1(2), 263-276. [http://www.kilgarriff.co.uk/Publications/2005-K-lineer.pdf]
• Kilgariff, A. (2001). Comparing Corpora. International Journal of Corpus Linguistics, 6(1), 1-37. [http://www.kilgarriff.co.uk/Publications/2001-K-CompCorpIJCL.pdf]
• Mujis, D. (2010). Doing Quantitative Research in Education with SPSS. Sage.
• Ridge, E. & Kudenko, D. (2010). Tuning an algorithm using design of experiments. In Batz-Beiselstein, T., Chiarandini, M., Paquette, L. & Preuss, M. (eds.), Experimental Methods for the Analysis of Optimization Algorithms (265-286). Springer.
• Rosenfeld, B. & Penrod, S.D. (2011). Research Methods in Forensic Psychology. John Wiley and Sons.
• Scott, M. (1996). WordSmith Tools Manual. Oxford: Oxford University Press.
• Scott, M. (1997). PC analysis of key words - and key key words. System, 25(2), 233-45.
• Scott, M. (2011). WordSmith Tools Manual, Version 6. Lexical Analysis Software Ltd.
• Taylor, C. (2011). Searching for similarity: The representation of boy/s and girl/s in the UK press in 1993, 2005, 2010. Paper given at Corpus Linguistics 2011, University of Birmingham, 20-22 July 2011.
![JUDGING CORPUS LINGUISTICS...2020] JUDGING CORPUS LINGUISTICS 15 determines in part whether corpus linguistics should displace other interpretive sources. In that light, perhaps the](https://img.pdfslide.net/doc/110x75/6137f1e90ad5d2067648f402/judging-corpus-linguistics-2020-judging-corpus-linguistics-15-determines-in.jpg)