Embed Size (px)
Citation preview
CORRECTIONS IN THE UNITED STATES
U.S. Department of JusticeOffice of Justice Programs
Trends in correctional populations,
common perceptions of incarceration,
and the role of corrections in society
Presented by
James P. Lynch, Ph.D.Director
Bureau of Justice StatisticsMay 4, 2012
www. .gov

2
Figure 1. Adult correctional population on probation, in jail or prison, or on parole, 1980–2010
0
1,000,000
2,000,000
3,000,000
4,000,000
5,000,000
6,000,000
7,000,000
8,000,000
Total
Prison
Jail
Parole
Probation
'10'09'08'07'06'05'04'03'02'01'00'99'98'97'96'95'94'93'92'91'90'89'88'87'86'85'84'83'82'81'80
Number
Note: Prison data based on custody counts. Includes inmates held in privately operated facilities.Source: Bureau of Justice Statistics, Annual Parole Survey, Annual Probation Survey, Annual Survey of Jails,Census of Jails, and National Prisoner Statistics Program.
www. .gov
3
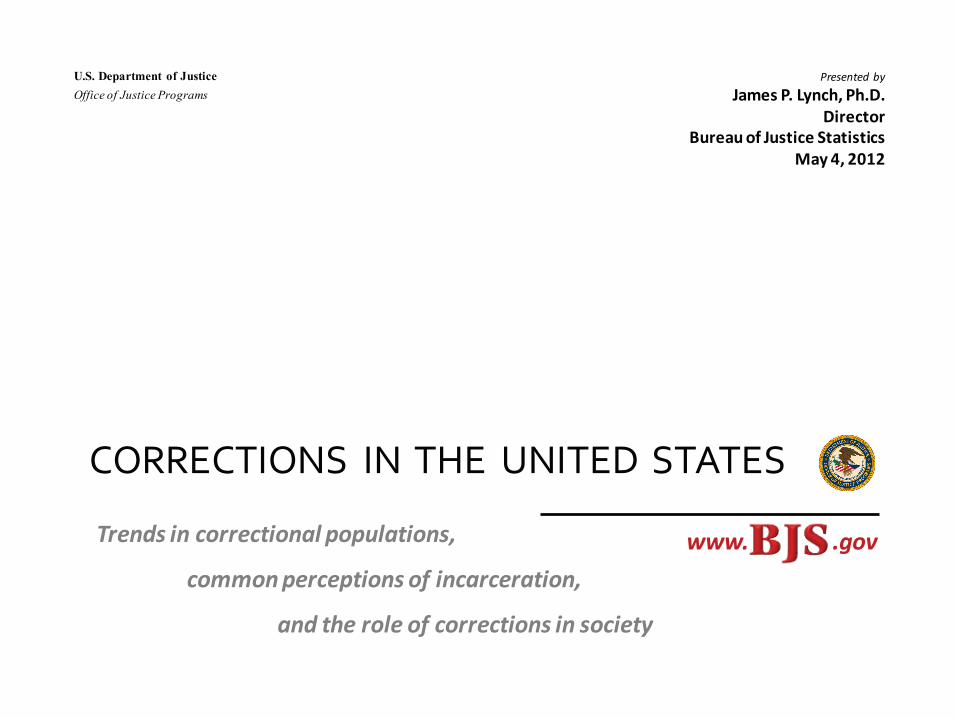
Figure 2. Adult correctional population and annual percent change, 1980–2010
0
1,000,000
2,000,000
3,000,000
4,000,000
5,000,000
6,000,000
7,000,000
8,000,000
-2%
0%
2%
4%
6%
8%
10%
12%
14%
2010200520001995199019851980
Annual percent change
Annual percent change
Number
16%
20%
Source: Bureau of Justice Statistics, Annual Parole Survey, Annual Probation Survey,Annual Survey of Jails, Census of Jails, and National Prisoner Statistics Program. www. .gov
4
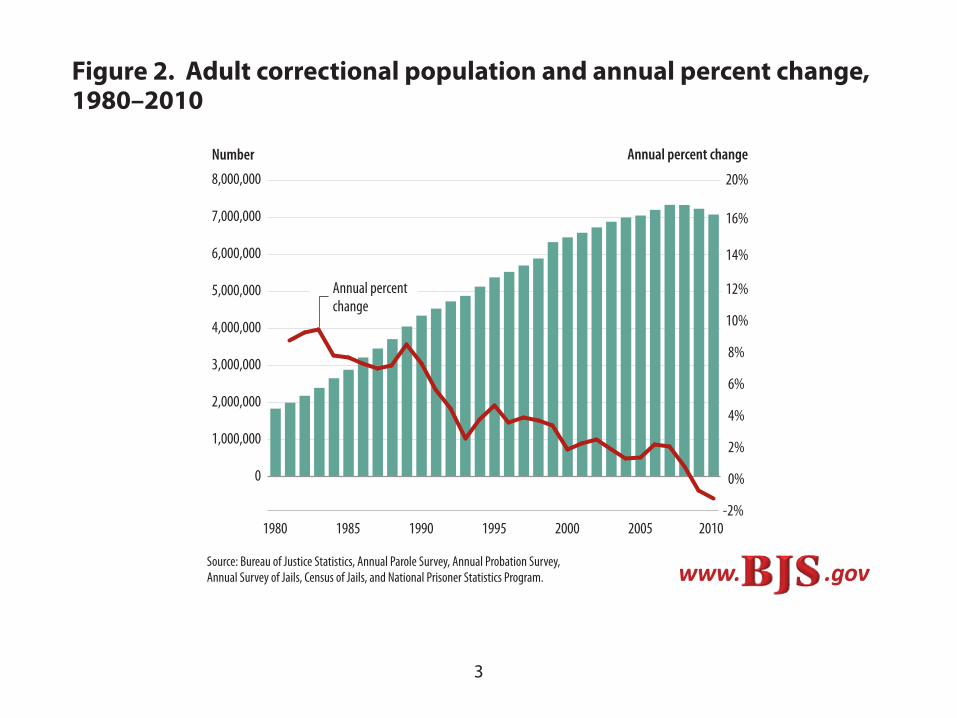
Figure 3. Incarcerated adult correctional population in state or federal prison or local jail,1980–2010
0
250,000
500,000
750,000
1,000,000
1,250,000
1,500,000
Federal prison
State prison
Jail
'10'09'08'07'06'05'04'03'02'01'00'99'98'97'96'95'94'93'92'91'90'89'88'87'86'85'84'83'82'81'80
Number
Note: Prison custody counts are for December 31 within the reporting year; jail population counts are for June 30.Source: Bureau of Justice Statistics, Annual Survey of Jails, Census of Jails,and National Prisoner Statistics Program.
www. .gov
5
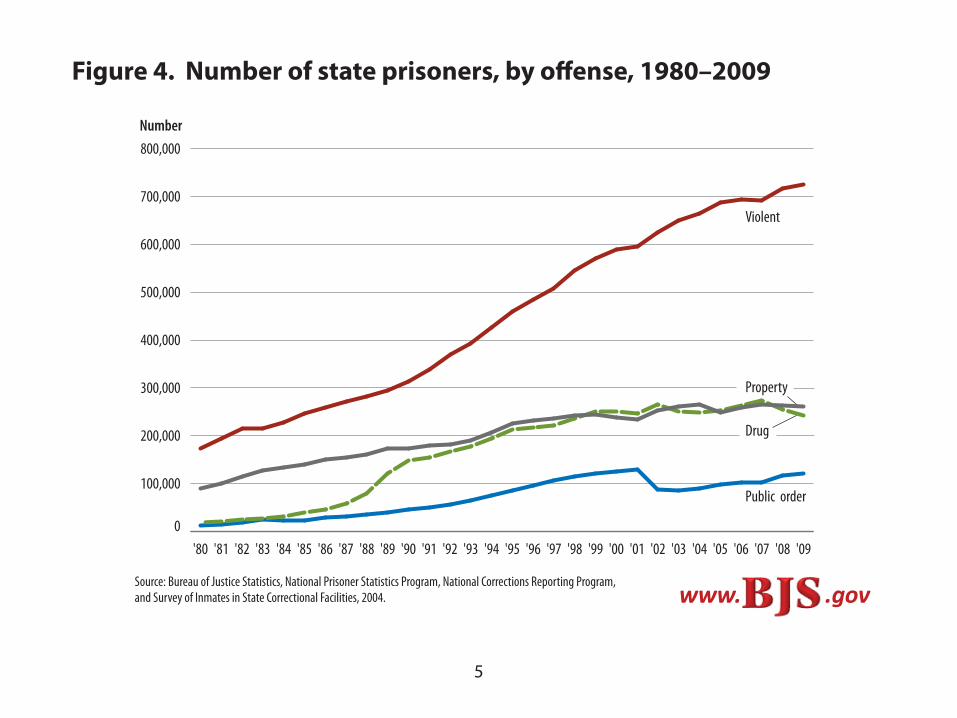
Figure 4. Number of state prisoners, by offense, 1980–2009
0
100,000
200,000
300,000
400,000
500,000
600,000
700,000
800,000
Public order
Drug
Property
Violent
'09'08'07'06'05'04'03'02'01'00'99'98'97'96'95'94'93'92'91'90'89'88'87'86'85'84'83'82'81'80
Number
Source: Bureau of Justice Statistics, National Prisoner Statistics Program, National Corrections Reporting Program, and Survey of Inmates in State Correctional Facilities, 2004. www. .gov

6
Figure 5. Violent offenders in state prison, by admissions and releases, 1980–2009
0
100,000
200,000
300,000
400,000
500,000
600,000
700,000
800,000
Releases
Admissions
Total violent o�enders
'09'08'07'06'05'04'03'02'01'00'99'98'97'96'95'94'93'92'91'90'89'88'87'86'85'84'83'82'81'80
Number
Source: Bureau of Justice Statistics, National Corrections Reporting Programand National Prisoner Statistics Program. www. .gov

7
Figure 6. Drug offenders in state prison, by admissions and releases, 1980–2009
0
50,000
100,000
150,000
200,000
250,000
300,000
Releases
Admissions
Total drug o�enders
'09'08'07'06'05'04'03'02'01'00'99'98'97'96'95'94'93'92'91'90'89'88'87'86'85'84'83'82'81'80
Number
Source: Bureau of Justice Statistics, National Corrections Reporting Programand National Prisoner Statistics Program. www. .gov
8
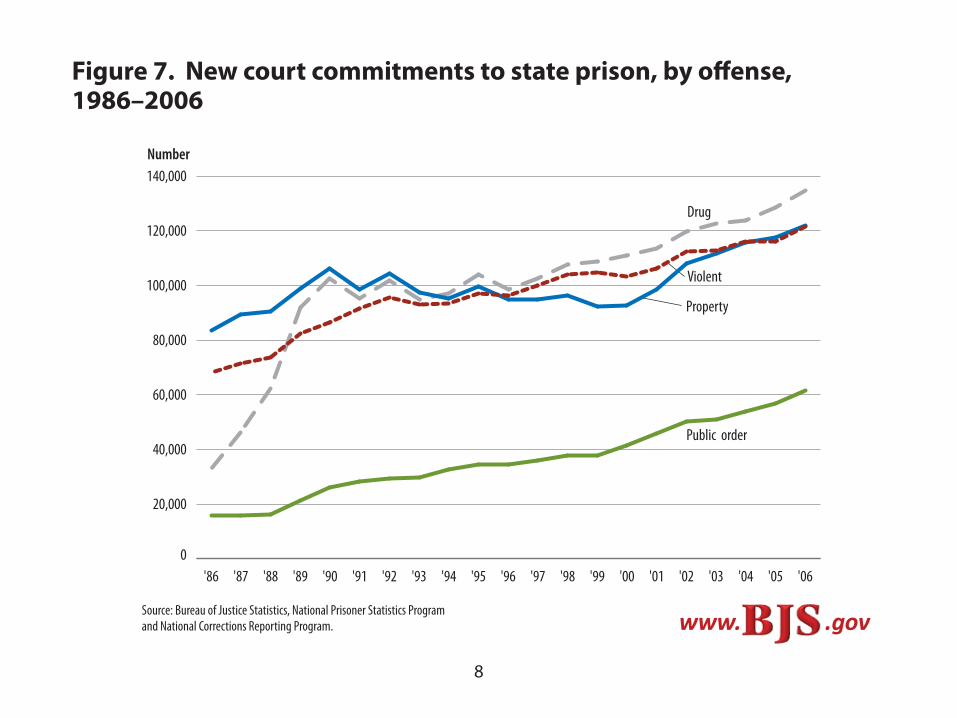
Figure 7. New court commitments to state prison, by offense, 1986–2006
0
20,000
40,000
60,000
80,000
100,000
120,000
140,000
Public order
Drug
Property
Violent
'06'05'04'03'02'01'00'99'98'97'96'95'94'93'92'91'90'89'88'87'86
Number
Source: Bureau of Justice Statistics, National Prisoner Statistics Programand National Corrections Reporting Program. www. .gov
9
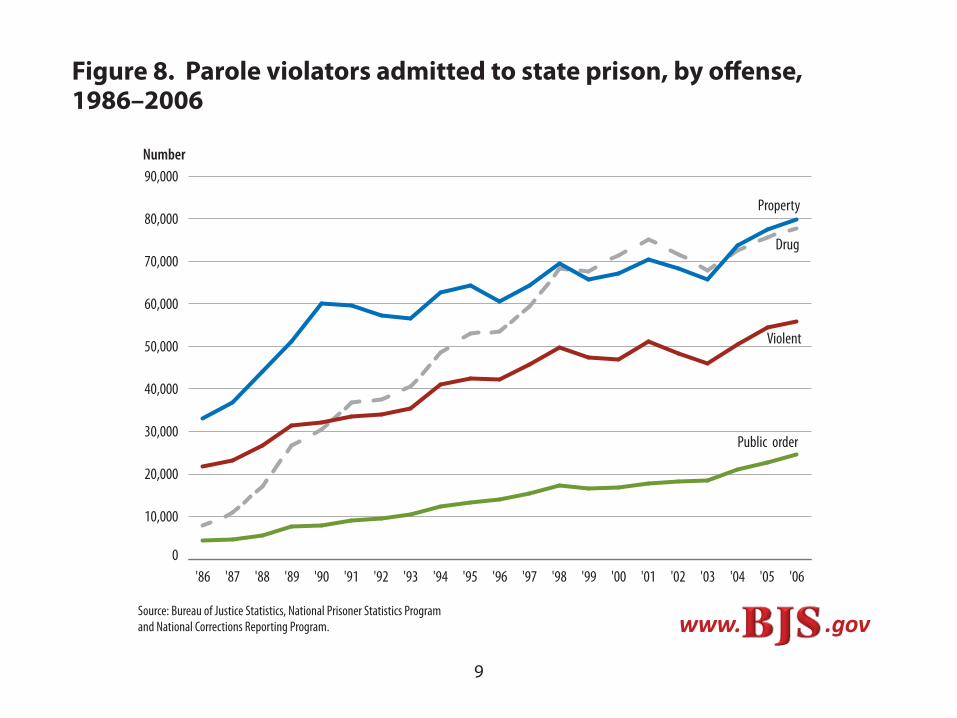
Figure 8. Parole violators admitted to state prison, by offense, 1986–2006
0
10,000
20,000
30,000
40,000
50,000
60,000
70,000
80,000
90,000
Public order
Drug
Property
Violent
'06'05'04'03'02'01'00'99'98'97'96'95'94'93'92'91'90'89'88'87'86
Number
Source: Bureau of Justice Statistics, National Prisoner Statistics Programand National Corrections Reporting Program. www. .gov

10
Figure 9. Sentenced male prisoners under state or federal jurisdiction per 100,000 residents, by race and Hispanic origin, 1980–2010
0
500
1,000
1,500
2,000
2,500
3,000
3,500
4,000
Hispanic males
Black non-Hispanic males
White non-Hispanic males
'10'09'08'07'06'05'04'03'02'01'00'99'98'97'96'95'94'93'92'91'90'89'88'87'86'85'84'83'82'81'80
Rate per 100,000 population
Note: Data for whites and blacks from 1980 through 1999 include persons of Hispanic origin.Source: Bureau of Justice Statistics, National Prisoner Statistics Program andSurvey of Inmates in State Correctional Facilities, 2004.
www. .gov

11
Figure 10. Sentenced female prisoners under state or federal jurisdiction per 100,000 residents, by race and Hispanic origin, 1980–2010
0
50
100
150
200
250
Hispanic females
Black non-Hispanic females
White non-Hispanic females
'10'09'08'07'06'05'04'03'02'01'00'99'98'97'96'95'94'93'92'91'90'89'88'87'86'85'84'83'82'81'80
Rate per 100,000 population
Note: Data for whites and blacks from 1980 through 1999 include persons of Hispanic origin.Source: Bureau of Justice Statistics, National Prisoner Statistics Programand Survey of Inmates in State Correctional Facilities, 2004.
www. .gov
12
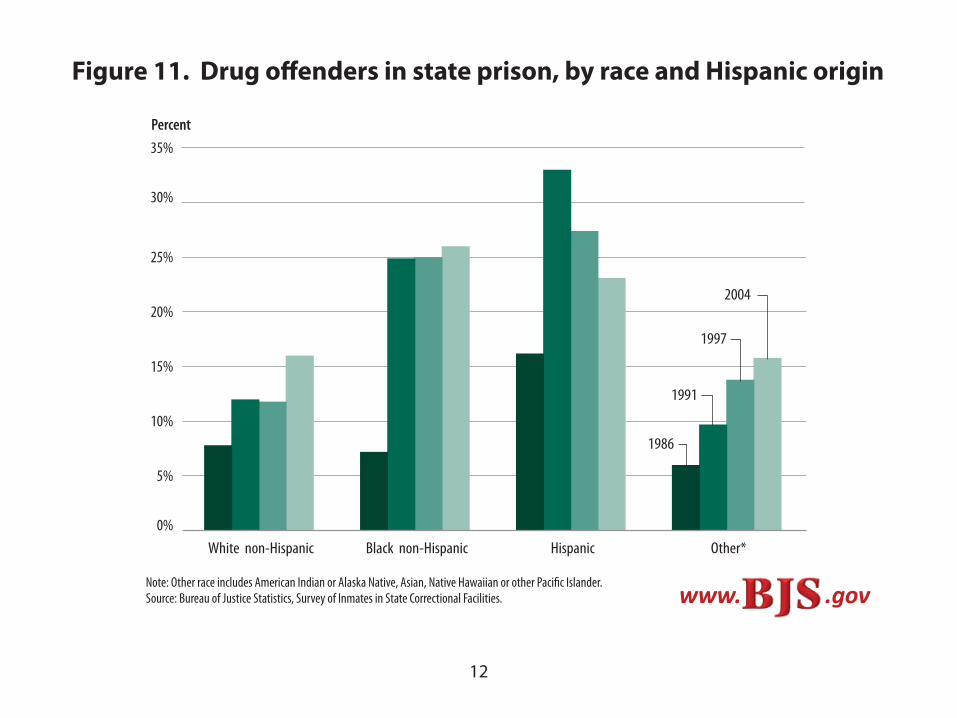
Figure 11. Drug offenders in state prison, by race and Hispanic origin
Note: Other race includes American Indian or Alaska Native, Asian, Native Hawaiian or other Pacific Islander.Source: Bureau of Justice Statistics, Survey of Inmates in State Correctional Facilities. www. .gov
0%
5%
10%
15%
20%
25%
30%
35%
2004
1997
1991
1986
Other*HispanicBlack non-HispanicWhite non-Hispanic
Percent

13
Figure 12. Number of federal prisoners, by offense, 1988–2010
0
25,000
50,000
75,000
100,000
125,000
150,000
175,000
200,000
Public order
Drug
Property
Violent
Total
'10'09'08'07'06'05'04'03'02'01'00'99'98'97'96'95'94'93'92'91'90'89'88
Number
Source: Bureau of Justice Statistics, Federal Justice Statistics Program. www. .gov

14
Figure 13. Sentenced male prisoners, by age
0
500
1,000
1,500
2,000
2,500
3,000
55 or older45–5440–4435–3930–3425–2920–2418–19
Rate per 100,000 population
2010
200520001996
Source: Bureau of Justice Statistics, National Prisoner Statistics Program,Survey of Inmates in State and Federal Correctional Facilities,National Inmate Survey, and Federal Justice Statistics Program.
www. .gov

15
Figure 14. State prison inmate deaths in custody, by age, 2001–2009
Age 54 or younger
Age 55 or older
200920082007200620052004200320022001
2,877 2,942
3,165 3,129 3,1723,239
3,392 3,452 3,408
972 1,055 1,171 1,204 1,237 1,302 1,550 1,628 1,624
1,900 1,885 1,989 1,923 1,934 1,936 1,824 1,7831,842
Total
Note: Detail may not sum to total due to missing data.Source: Bureau of Justice Statistics, Deaths in Custody Reporting Program, 2001–2009. www. .gov
16
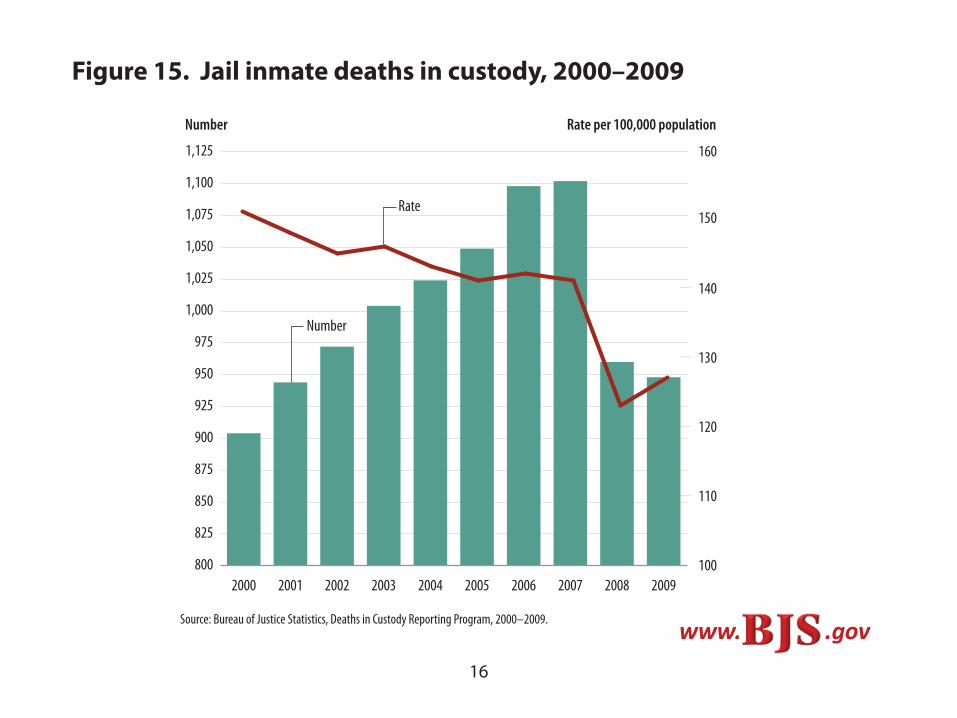
Figure 15. Jail inmate deaths in custody, 2000–2009
Number Rate per 100,000 population
800
825
850
875
900
925
950
975
1,000
1,025
1,050
1,075
1,100
1,125
Number
2009200820072006200520042003200220012000100
110
120
130
140
150
160
Rate
Source: Bureau of Justice Statistics, Deaths in Custody Reporting Program, 2000–2009.www. .gov

17
Figure 16. Parents in state prison and their children under age 18
0
500,000
1,000,000
1,500,000
2,000,000
Number of childrenNumber of parents
20072004199919971991
Number
Source: Bureau of Justice Statistics, Survey of Inmates in State Correctional Facilities, 2004. www. .gov

18
Figure 17. State expenditures, by function, 1982–2010
Percent
20%
24%
28%
32%
36%
Public welfare
Education
0%
2%
4%
6%
8%
10%
Corrections
Highway
Health and hospitals
'10'09'08'07'06'05'04'03'02'01'00'99'98'97'96'95'94'93'92'91'90'89'88'87'86'85'84'83'82
Note: Interpret with caution. Scale has been adjusted to show subtle changes in data.Source: Bureau of Justice Statistics, Justice Expenditures and Employment Extract Tables. www. .gov