Embed Size (px)
Citation preview

Correlate
February 19, 2010
Sam Gross, Balasubramanian Narasimhan, Robert Tibshirani, and Daniela Witten
A method for the integrative analysis
of two genomic data sets

• Introduction
• Sparse Canonical Correlation Analysis
• Correlate: an Excel add-in that implements sparse CCA

A world of data

A world of data

A world of data

Statistical analyses
There are great statistical methods for the analysis of gene expression, DNA copy number, and SNP data sets.

An integrative approach• But what if we have access to multiple types of
data (for instance, gene expression and DNA
copy number data) on a single set of samples?

An integrative approach• But what if we have access to multiple types of
data (for instance, gene expression and DNA
copy number data) on a single set of samples?
• The data types can be apples and oranges: for
instance, imaging data and gene expression data

An integrative approach• But what if we have access to multiple types of
data (for instance, gene expression and DNA
copy number data) on a single set of samples?
• The data types can be apples and oranges: for
instance, imaging data and gene expression data

Introduction
• In this talk, we’ll consider the case of DNA copy
number and gene expression measurements on a
single set of samples.

Introduction
• In this talk, we’ll consider the case of DNA copy
number and gene expression measurements on a
single set of samples.
• Sparse CCA gives us a tool that can be used to
answer the question:Can we identify a small set of gene expression measurements that is correlated with a region of DNA copy number gain/loss?
• Correlate provides an easy way to apply that
method using Microsoft Excel

Canonical Correlation Analysis (CCA)
• CCA is a classical statistical method
• Suppose we have n samples and p+q features for each sample– Let the sample be a group of n kids– Let the first p features be their scores on a set of p
tests: reading comprehension, Latin, math…– Let the next q features be the amount of time they
spend on certain activities per week: team sports, watching TV, reading…

CCA
• The question: How are the q activities associated with scores on the p exams?
• Maybe
– More Reading ⇔ Better Reading Comprehension Scores
– More Reading And Less TV ⇔ Even Better Reading Comprehension Scores
– More Reading, More team sports, More Homework, and Less TV ⇔ Good Scores on all tests

CCA
• Canonical correlation analysis allows us to discover relationships like this between the sets of variables.
• For instance, perhaps
0.6*ReadingComp + 0.8*Math + .743*Latin
is highly correlated with
2*TeamSports − 11*TV + 8*Reading + 234*Homework

CCA• CCA looks for linear combinations of variables in the
two groups that are highly correlated with each other.
• Let X be a matrix with n columns - one for each student - and p = 3 rows, one for each test (Reading Comprehension, Math, Latin).
• And let Y be a matrix with n columns and q = 4 rows, one for each activity (Team Sports, TV, Reading, Homework).
• Statistically, we seek vectors u and v such that Cor(X’u, Y’v) is big. We can think of the components of u and v as weights for each variable.

CCA
• Thus, the output tell us that
0.6*ReadingComp + 0.8*Math + .743*Latin
is highly correlated with
2*TeamSports − 11*TV + 8*Reading + 234*Homework
• Here, – u = (0.6, 0.8, 0.743)’
– v = (2, −11, 8, 234)’

Why is it useful?
• How does this apply to genomics and bioinformatics?

Why is it useful?
• How does this apply to genomics and bioinformatics?
• If we have copy number and gene expression measurements on the same set of samples, we can ask:

Why is it useful?
• How does this apply to genomics and bioinformatics?
• If we have copy number and gene expression measurements on the same set of samples, we can ask: Which genes have
expression that is associated with which regions of DNA gain or loss?

Sparse CCA
• This is almost the question that CCA answers for us... – But, CCA will give us a linear combination of
genes that is associated with a linear combination of DNA copy number measurements
– These linear combinations will involve every gene expression measurement and every copy number measurement
• What we really want is this: – A short list of genes that are associated with a
particular region of DNA gain/loss
Sparse CCA
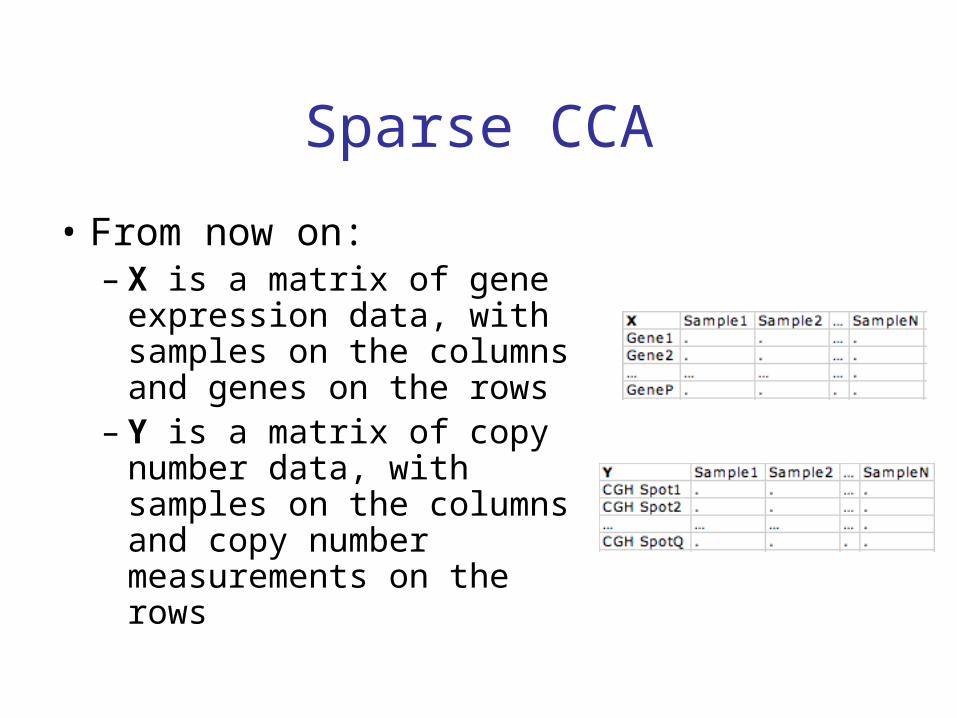
• From now on:– X is a matrix of gene
expression data, with samples on the columns and genes on the rows
– Y is a matrix of copy number data, with samples on the columns and copy number measurements on the rows

Sparse CCA• CCA seeks weights u, v such that
Cor(X’u, Y’v) is big

Sparse CCA• CCA seeks weights u, v such that
Cor(X’u, Y’v) is big• Sparse CCA seeks weights u, v such that
Cor(X’u, Y’v) is big, and most of the weights are zero

Sparse CCA• CCA seeks weights u, v such that
Cor(X’u, Y’v) is big• Sparse CCA seeks weights u, v such that
Cor(X’u, Y’v) is big, and most of the weights are zero
• u contains weights for the gene expression data, and v contains weights for the copy number data

Sparse CCA• CCA seeks weights u, v such that
Cor(X’u, Y’v) is big• Sparse CCA seeks weights u, v such that
Cor(X’u, Y’v) is big, and most of the weights are zero
• u contains weights for the gene expression data, and v contains weights for the copy number data
• Since the columns of Y are copy number measurements along the chromosome, then we want the weights in v to be smooth (not jumpy)
Sparse CCA
• By imposing the right penalty on u and v, we can ensure that– The elements of u are sparse– The elements of v are sparse and smooth– (Remember: u contains weights for the
gene expression data, and v contains weights for the copy number data)

Sparse CCA
• By imposing the right penalty on u and v, we can ensure that– The elements of u are sparse– The elements of v are sparse and smooth– (Remember: u contains weights for the gene
expression data, and v contains weights for the copy number data)
• We can also constrain u and v such that their weights are positive or negative

Sparse CCA, mathematically
We choose weights u and v to maximize
Cor(X’u, Y’v) subject to ∑i |ui|≤ c1,
∑j (|vj| + |vj+1 - vj|) ≤ c2
This is a lasso constraint on u and a fused lasso constraint on v.
For small values of c1 and c2, some elements of u and v are exactly zero, and v is smooth.

For the statisticians: the criterion
maximizeu,v u’XY’v
subject to u’u ≤ 1, v’v ≤ 1, P1(u) ≤ c1, P2(v) ≤ c2
Assume that the features are standardized to have mean 0 and standard deviation 1.
Here, P1 and P2 are convex penalties on the elements of u and v.

For the statisticians: biconvexity
• With u fixed, the criterion is convex in v, and with v fixed, it’s convex in u.• This suggests a simple iterative optimization strategy: 1. Hold u fixed and optimize with respect to v. 2. Hold v fixed and optimize with respect to u.
maximizeu,v u’XY’v
subject to u’u ≤ 1, v’v ≤ 1, P1(u) ≤ c1, P2(v) ≤ c2

For the statisticians: the algorithm
• Initialize v.• Iterate until convergence:
1. Hold v fixed, and optimize: maximizeu u’XY’v subject to u’u ≤ 1, P1(u) ≤ c1. 2. Hold u fixed, and optimize: maximizev u’XY’v subject to v’v ≤ 1, P2(v) ≤ c2.
maximizeu,v u’XY’v
subject to u’u ≤ 1, v’v ≤ 1, P1(u) ≤ c1, P2(v) ≤ c2

For the statisticians: the penalties
maximizeu,v u’XY’v
subject to u’u ≤ 1, v’v ≤ 1, P1(u) ≤ c1, P2(v) ≤ c2
If P1 is a lasso or L1 penalty, P1(u)=||u||1, then to update u:
u=S(XY’v, d)/||S(XY’v,d)||2,
where d≥0 is chosen such that ||u||1=c1.
Here, S is the soft-thresholding operator: S(a,c)=sign(a)(|a|-c)+.

For the statisticians: the penalties
maximizeu,v u’XY’v
subject to u’u ≤ 1, v’v ≤ 1, P1(u) ≤ c1, P2(v) ≤ c2
If P2 is a fused lasso penalty:
P2(v)=∑j (|vj| + |vj+1 - vj|) ≤ c2,
then the update is a little harder and requires software for fused lasso regression.
Sparse CCA results
• So what do we end up with?– A set of genes that is associated with a region (or
regions) of DNA gain/loss – Weights for the gene expression measurements
(can be constrained to all have the same sign)– Weights for the DNA copy number measurements,
which will be smooth– We can get multiple (gene set, DNA gain/loss) pairs

Sparse CCA results• So what do we end up with?
– A set of genes that is associated with a region (or regions) of DNA gain/loss
– Weights for the gene expression measurements (can be constrained to all have the same sign)
– Weights for the DNA copy number measurements, which will be smooth
– We can get multiple (gene set, DNA gain/loss) pairs
• We use a permutation approach to get a p-value for the significance of the results

Permutation approach
Dataset 1 X
1 2 … n
1 2 … n
1
p
1
q
Dataset 2
Y

Permutation approach
Dataset 1 X
1 2 … n
1 2 … n
1
p
1
q
Dataset 2
Y
Cor(X’u, Y’v)

Permutation approach
Dataset 1 X
1 2 … n1
p
1
q
Permuted
Dataset 2
Y*
1 2 … n

Permutation approach
Dataset 1 X
1 2 … n1
p
1
q
Permuted
Dataset 2
Y*
Cor(X’u*, Y*’v*)
1 2 … n

Permutation approach
Dataset 1 X
1 2 … n
1 2 … n
1
p
1
q
Permuted
Dataset 2
Y*
Cor(X’u*, Y*’v*)
1. Repeat 100 times.
2. Compare Cor(X’u, Y’v) to {Cor(X’u*, Y*’v*)}.

Extensions
These ideas have been extended to the following cases:– More than two data sets– A supervising outcome (e.g. survival time
or tumor subtype) for each sample

Data• Applied to breast cancer data:
– n = 89 tissue samples – p = 19672 gene expression measurements – q = 2149 DNA copy number measurements– Chin, DeVries, Fridlyand, et al. (2006) Cancer Cell
10, 529-541.
• Look for a region of copy number change on chromosome 20 that’s correlated with the expression of some set of genes

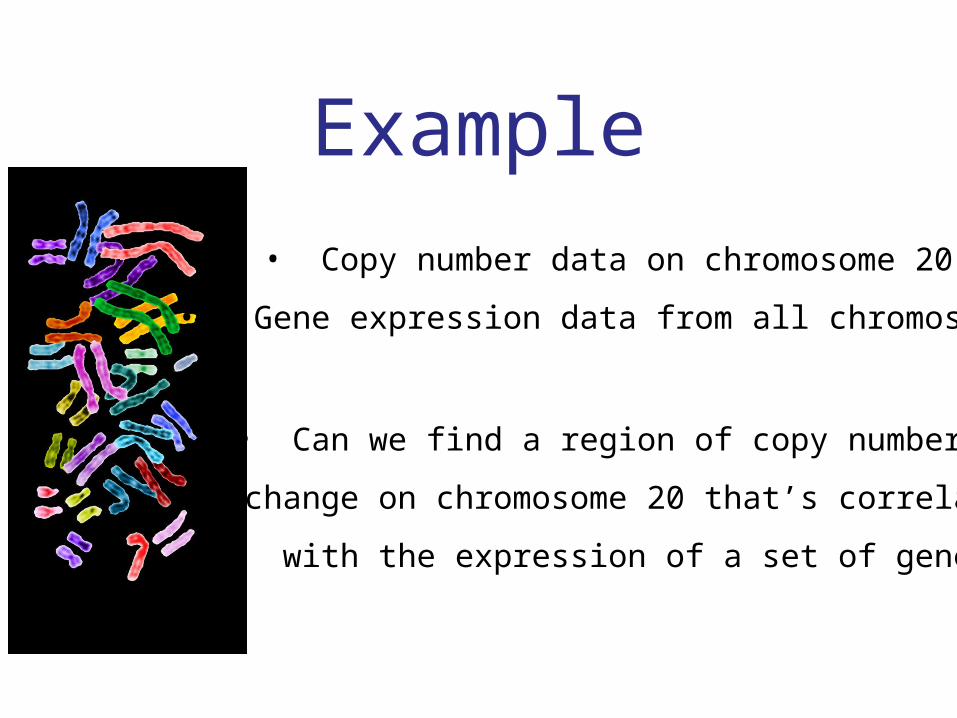
Example
• Copy number data on chromosome 20
• Gene expression data from all chromosomes
• Can we find a region of copy number
change on chromosome 20 that’s correlated
with the expression of a set of genes?

Correlate

Correlate

Correlate

Correlate
Example
• Copy number data on chromosome 20
• Gene expression data from all chromosomes
• Can we find a region of copy number
change on chromosome 20 that’s correlated
with the expression of a set of genes?
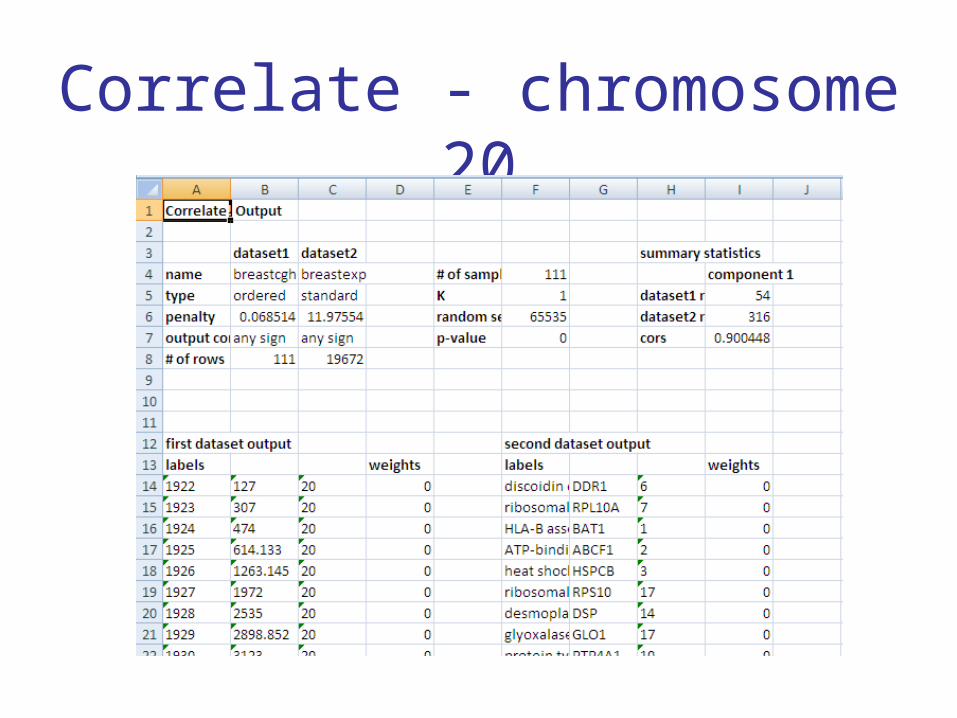
Correlate - chromosome 20

Correlate - chromosome 20

Correlate - chromosome 20

Correlate - chromosome 20
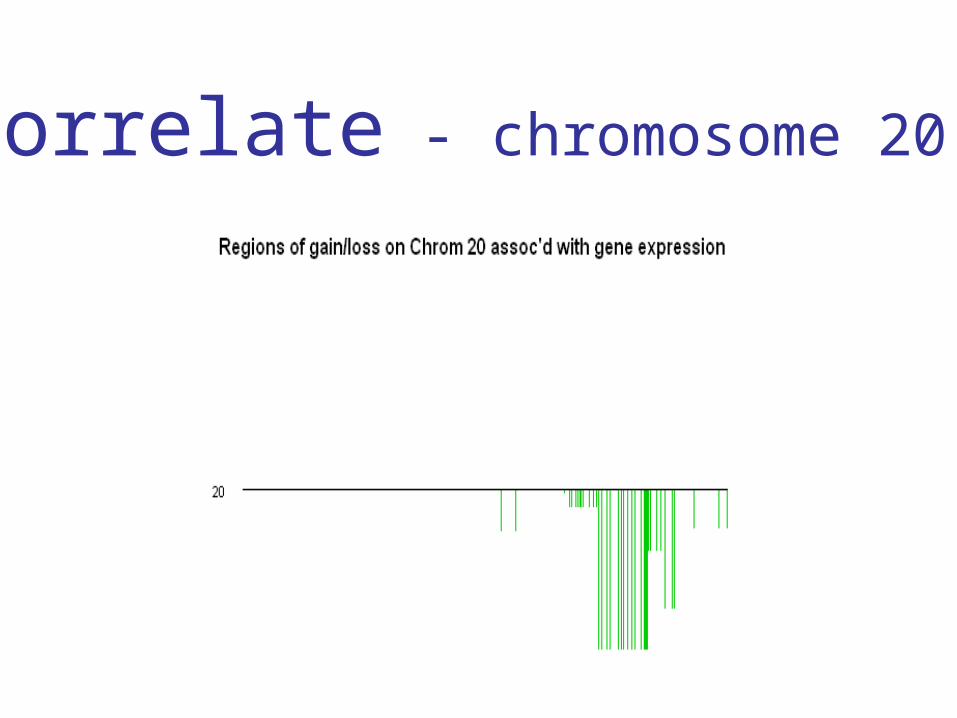
Correlate - chromosome 20

Correlate - chromosome 20
Non-zero gene expression weights by chromosome
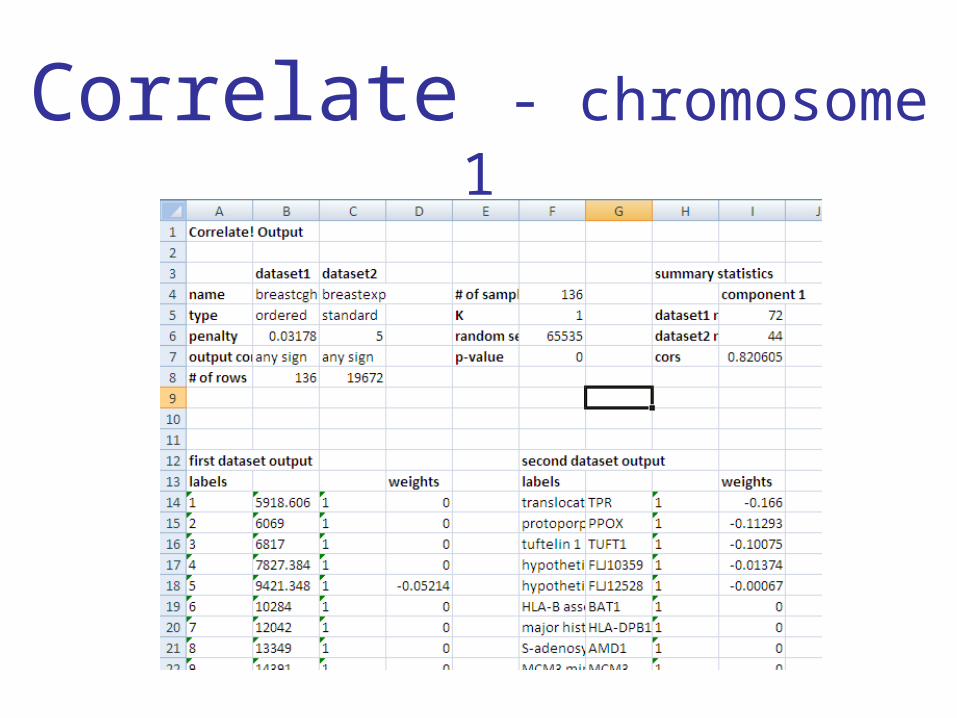
Correlate - chromosome 1

Correlate - chromosome 1
• All 44 non-zero gene expression weights are on chromosome 1
• Top 10:– splicing factor 3b, subunit 4, 49kD– HSPC003 protein – rab3 GTPase-activating protein, non-catalytic subunit (150kD) – hypothetical protein My014 – UDP-Gal:betaGlcNAc beta 1,4- galactosyltransferase, polypeptide 3– glyceronephosphate O-acyltransferase– NADH dehydrogenase (ubiquinone) Fe-S protein 2 (49kD) (NADH-
coenzyme Q reductase)– hypothetical protein FLJ12671 – mitochondrial ribosomal protein L24 – CGI-78 protein

Correlate – Conclusions
• Can be applied to any pair of data sets: SNP, methylation, microRNA expression data, and more….

Correlate – Conclusions
• Can be applied to any pair of data sets: SNP, methylation, microRNA expression data, and more….
• Think broadly… a collaborator is using it to correlate image data and gene expression data in cancer. Linear combination of image features is highly predictive of survival!

Correlate – Conclusions
• Can be applied to any pair of data sets: SNP, methylation, microRNA expression data, and more….
• Think broadly… a collaborator is using it to correlate image data and gene expression data in cancer. Linear combination of image features is highly predictive of survival!
• A principled way to discover associations and perform an integrative analysis of two data sets.
Try it out!
http://www-stat.stanford.edu/~tibs/Correlate/
Or, for R users: package PMA on CRAN
Or google “Tibshirani”

Sam Gross (Harvard), Balasubramanian Narasimhan (Stanford),
and Robert Tibshirani (Stanford)
Acknowledgments

References
• Witten DM, Tibshirani R, and T Hastie (2009) A penalized matrix decomposition, with applications to sparse principal components and canonical correlation analysis. Biostatistics 10(3): 515-534.
• Witten DM and R Tibshirani (2009) Extensions of sparse canonical correlation analysis, with applications to genomic data. Statistical Applications in Genetics and Molecular Biology 8(1): Article 28.