Embed Size (px)
Citation preview
Correlates of Calcium Supplement Use in Older
Community-Dwelling Ontario Women
by
Mary N. Elias
A thesis submitted in conformity with the requirements
for the degree of Masters of Science
Graduate Department of Pharmaceutical Sciences University of Toronto
© Copyright by Mary N. Elias 2011
ii
Correlates of Calcium Supplement Use in Older Community-
Dwelling Ontario Women
Mary N. Elias
Masters of Science
Graduate Department of Pharmaceutical Science
University of Toronto
2011
Abstract
Background: Older Canadian women are not meeting recommended calcium intake levels
and therefore require calcium supplementation to maintain bone mass. Objective: To
examine factors associated with calcium supplementation among older community-dwelling
women, using the Health Belief Model (HBM) as a conceptual framework. Methods: Data
previously collected from Ontario community-dwelling women aged 65 to 90 years (n=798)
were analyzed. Multivariable logistic regression was utilized to determine HBM factors
associated with calcium supplement use. Results: About half (54%) of women reported
taking calcium supplements. Positive correlates of calcium supplementation included:
perceived osteoporosis susceptibility, perceived calcium benefits, natural health product use,
residing in Toronto and general osteoporosis management factors (discussion with a
physician or pharmacist, osteoporosis screening, falls history and preventive health check-
ups); a negative correlate included: use of etidronate therapy. Conclusion: Only half of older
women were taking calcium supplements. Discussions with healthcare practitioners may help
to improve recommended calcium intake levels.
iii
Acknowledgements
I dedicate this thesis to my late grandmother Angel N. Abdelmassih. Being a wise woman,
she taught me that the most important things in life come not by pen and paper but from the
human heart. You are greatly missed Teta but your love and kindness continues to live on
and touches my life each and every day. I miss and love you very much!
To my supervisor, Dr. Suzanne M. Cadarette, I cannot begin to thank you enough for all your
invaluable guidance throughout my MSc training. You have taught me how to effectively set
and meet goals and have continuously encouraged me to strive to become a better researcher.
You have always advised me to be open to opportunities and most importantly you have
shared my philosophy that every experience is a learning opportunity. I will always look
back at the vast amount of skills and knowledge I have gained through my experience with
you.
To my committee members Dr. Heather Boon, Dr. Linda MacKeigan and Dr. Thomas
Brown, thank you for all your expertise and guidance throughout my thesis work. Your
insights have shaped my thesis project and have helped me “think outside the box”.
A special thanks to my colleagues Andrea Burden, Milica Nikitovic and Mina Tadrous. We
have shared many laughs in the CG office and will always embrace the friendship that has
developed among us. Teresa Tsui, thank you for your expertise on Natural Health Product
classification.
Last but definitely not least, to my parents and my brothers, I thank you for your continuous
support and encouragement throughout my MSc education. Throughout you have ensured me
of my end goal. To my father, thank you for always teaching me that an education is vital to
my success and being my example of persistence and perseverance. To my mother, you have
always taught me to approach things with an open heart and mind and to never take for
granted all the wonderful opportunities that have come my way. To both of my brothers, on
the most difficult of days, you have always reminded me that “tomorrow will be another day”
and that I can achieve whatever I set my mind to.
I would also like to acknowledge funding sources that supported my graduate training:
Canadian Institute of Health Research (CIHR) Frederick Banting and Charles Best Canada
Graduate Scholarship MSc Award, CIHR Institute of Health Services and Policy Research Travel
Award, and the Leslie Dan Faculty of Pharmacy, University of Toronto Student Experience Fund
Travel Award. This research was also supported by two grants awarded to Dr. Cadarette:
CIHR Catalyst Grant and Ontario Ministry of Research and Innovation Early Researcher
Award.
Sep`hmot `ntotk Vnou paiwt.
Mary Elias
iv
Table of Contents
Abstract .......................................................................................................................................... ii
Acknowledgements ..................................................................................................................... iii
List of Tables ................................................................................................................................ vi
List of Figures ............................................................................................................................. vii List of Appendices ..................................................................................................................... viii
List of Acronyms .......................................................................................................................... ix
Chapter 1: Introduction ................................................................................................................ 1
1.1 Epidemiology of Osteoporosis in Canada................................................................................. 1 1.2 Calcium Intake, Bone Mass and Osteoporosis ......................................................................... 2
1.3 Statement of the Problem .......................................................................................................... 2
1.4 Overview of Thesis ................................................................................................................... 3
Chapter 2: Literature Review and Conceptual Framework ................................................... 4 2.1 Search Strategy and Inclusion/Exclusion Criteria for Studies .................................................. 4 2.2 Individual-Level Health Behaviour Conceptual Frameworks .................................................. 5
2.2.1 Conceptual Frameworks Used in Previous Studies to Examine Calcium Intake ...............5 2.2.2 Conceptual Frameworks Used In Literature to Examine Individual-level Health
Behaviour .....................................................................................................................................7
2.3 Conceptual Framework: The Health Belief Model (HBM) ...................................................... 8 2.4 Factors Associated with Calcium Intake: Evidence from Previous Studies ........................... 11
2.5 Chapter Summary ................................................................................................................... 19
Chapter 3: Methods ................................................................................................................... 21 3.1 Study Objective ....................................................................................................................... 21
3.2 Overview of Study Sample and Reanalysis of Data from CSOFT ......................................... 21 3.3 Data Source: CSOFT .............................................................................................................. 22
3.3.1 CSOFT Study Objectives ..................................................................................................22 3.3.2 CSOFT Sampling Frame...................................................................................................22 3.3.3 CSOFT Web-Tracing Feasibility Study............................................................................23 3.3.4 CSOFT Sample Size Estimate ..........................................................................................23 3.3.5 CSOFT Study Sample .......................................................................................................24
3.3.6 CSOFT Questionnaire .......................................................................................................26
3.4 Dependent Variable: Calcium Supplement Use ..................................................................... 26
3.4.1 Understanding Association Between Calcium, Vitamin D and Multivitamin Users ........27 3.4.2 Understanding Calcium Users ..........................................................................................27
3.5 Independent Variables ............................................................................................................ 28 3.5.1 Perceived Susceptibility to Osteoporosis ..........................................................................29 3.5.2 Perceived Seriousness to Osteoporosis .............................................................................30
3.5.3 Self-Efficacy .....................................................................................................................30 3.5.4 Personal Factors ................................................................................................................30 3.5.5 Cues to Action...................................................................................................................35
v
3.5.6 Perceived Benefits of Calcium Supplementation .............................................................38
3.5.7 Perceived Barriers to Calcium Supplementation ..............................................................38 3.6 Statistical Analyses ................................................................................................................. 38
3.6.1 Descriptive Statistics .........................................................................................................39
3.6.2 Multi-item Scale Reliability ..............................................................................................39 3.6.3 Logistic Regression Model Building Strategy ..................................................................39
3.7 Study Power and Type I/ Type II Error .................................................................................. 46 3.8 Ethical Considerations ............................................................................................................ 46
Chapter 4: Results ..................................................................................................................... 47 4.1 Sample Characteristics ............................................................................................................ 47 4.2 Internal Consistency................................................................................................................ 48 4.3 Regression Model Diagnostics ............................................................................................... 49
4.3.1 Examination of Nominal and Ordinal Variables ..............................................................49 4.3.2 Examination of Continuous Variables ..............................................................................49
4.3.3 Correlations .......................................................................................................................51 4.4 Logistic Regression Model Building ...................................................................................... 52
4.4.1 Bivariate Analyses ............................................................................................................52 4.4.2 Multivariable Analysis ......................................................................................................53
4.5 Chapter Summary ................................................................................................................... 56
Chapter 5: Discussion ............................................................................................................... 70
5.1 Main Thesis Findings .............................................................................................................. 70 5.2 Generalizability of Findings ................................................................................................... 71
5.3 Comparing of Study Results to Prior Research ...................................................................... 72 5.3.1 Perceived Susceptibility to Osteoporosis ..........................................................................73
5.3.2 Perceived Seriousness of Osteoporosis .............................................................................73 5.3.3 Personal Factors ................................................................................................................74
5.3.4 Cues to Action...................................................................................................................78 5.3.5 Perceived Benefits and Barriers of Calcium .....................................................................81
5.4 Using the HBM to Examine Factors Associated with Calcium Supplement Use .................. 82
5.5 Limitations and Strengths ....................................................................................................... 83 5.6 Recent Controversies of Calcium Supplement Use ................................................................ 86
5.7 Recommendations for Clinical Practice.................................................................................. 88 5.8 Recommendations for Future Research .................................................................................. 90 5.9 Conclusions ............................................................................................................................. 91
References .................................................................................................................................. 93
Appendices ................................................................................................................................ 100

vi
List of Tables
Table 1. Osteoporosis susceptibility domain of the OHBS in CSOFT ................................... 29
Table 2. Osteoporosis seriousness domain of the OHBS in CSOFT ...................................... 30
Table 3. General health motivation items ............................................................................... 32
Table 4. Osteoporosis knowledge items CSOFT .................................................................... 34
Table 5. Calcium benefits domain of OHBS in CSOFT questionnaire .................................. 38
Table 6. Correlation coefficients ............................................................................................. 42
Table 7. Descriptive characteristics of study sample (n=798) ................................................ 57
Table 8. Ten largest correlations between predictor variables ............................................... 58
Table 9. Descriptive statistics and odds ratio estimates for bivariate analyses ...................... 59
Table 10. Multivariable odds ratio estimates for calcium supplement users and non-users ... 62
Table B 1. 3x3 Table for calcium and vitamin D supplement use (n=871) .......................... 101
Table B 2. 3x3 Table for calcium and multivitamin supplement use (n=871) ..................... 101
Table C 1. Comparison of current and past calcium supplement users and non-users ......... 102
Table D 1. List of CSOFT variables not examined in this study .......................................... 106
Table E 1. Independent variables examined ......................................................................... 107
Table F 1. Item response frequency of osteoporosis seriousness items in CSOFT .............. 110
Table H 1. Physical Functioning Score: composite score comprised of scores for each of the
SF-36v2 scales ...................................................................................................................... 112
Table H 2. Mental Functioning Score: composite score comprised of scores for each of the
SF-36v2 scales ...................................................................................................................... 112
Table I 1. Item response frequency of general health motivation items in CSOFT ............. 113
Table L 1. List of chronic health conditions ......................................................................... 116
vii
List of Figures
Figure 1. Adaption of Health Belief Model (HBM) for calcium supplement use.....................9
Figure 2. CSOFT participant selection flow diagram ............................................................. 25
Figure 3. Study sample flowchart ........................................................................................... 64
Figure 4. Histogram and box-and-whisker plot of perceived susceptibility to osteoporosis
scores (n=798) ......................................................................................................................... 65
Figure 5. Pearson residual plot of perceived susceptibility to osteoporosis scores (n=798) .. 65
Figure 6. Histogram and box-and-whisker plot of perceived calcium benefits scores (n=798)
................................................................................................................................................. 66
Figure 7. Pearson residual plot of perceived calcium benefits scores (n=798) ...................... 66
Figure 8. Histogram and box-and-whisker plot of perceived calcium benefits scores with
removed influential observations (n=776) .............................................................................. 67
Figure 9. Pearson residual plot of perceived calcium benefits scores with removed influential
observations (n=776) .............................................................................................................. 67
Figure 10. Histogram and box-and-whisker plot of SF-36v2 physical functioning composite
scores (n=798) ......................................................................................................................... 68
Figure 11. Pearson residual plot of SF-36v2 physical functioning composite scores (n=798)
................................................................................................................................................. 68
Figure 12. Histogram and box-and-whisker plot of SF-36v2 mental functioning composite
scores (n=798) ......................................................................................................................... 69
Figure 13. Pearson residual plot of SF-36v2 mental functioning composite scores (n=798) . 69
Figure A 1. Flow chart of literature search strategy ............................................................. 100
Figure G 1. Frequency distribution of study sample’s age ................................................... 111
Figure J 1. Coding sheet for use of NHPs other than calcium/vitamin D/multivitamins ..... 114
Figure K 1. Coding sheet for level of physical activity ........................................................ 115
Figure L 1. Frequency distribution of chronic health conditions .......................................... 116
viii
List of Appendices
Appendix A- Flow Chart of Literature Search Strategy ....................................................... 100
Appendix B- Study Participants Reporting Calcium, Vitamin D and Multivitamin Use ..... 101
Appendix C- Characteristics of Current, Never and Past Calcium Supplement Users ........ 102
Appendix D- CSOFT Variables Not Examined in This Study ............................................. 106
Appendix E- Independent Variables in This Study .............................................................. 107
Appendix F- Osteoporosis Seriousness Items ....................................................................... 110
Appendix G- Frequency Distribution of Age ....................................................................... 111
Appendix H- SF-36v2 Multi-Item Scales ............................................................................. 112
Appendix I- General Health Motivation Items ..................................................................... 113
Appendix J - Coding Sheet for CSOFT Participants’ Intake of NHPs ................................. 114
Appendix K- Coding Sheet for CSOFT Participants’ Level of Physical Activity ............... 115
Appendix L- Chronic Health Conditions .............................................................................. 116
ix
List of Acronyms
BMD- Bone Mineral Density
CSOFT- Community Study of Osteoporosis Fracture and Treatment
HBM- Health Belief Model
OHBS- Osteoporosis Health Belief Scale
OTC- Over-the-counter
NHP- Natural Health Product
NPHS- National Population Health Survey
RCT- Randomized Controlled Trial
ROC- Receiver Operating Characteristic
SAYC- Study of Arthritis in Your Community
SAS- Statistical Analysis System
SF-36v2- Short Form36 Health Survey version 2
Chapter 1: Introduction
1
Chapter 1: Introduction
This introductory chapter describes the research problem. The chapter begins by
describing the epidemiology of osteoporosis in Canada. The importance of calcium for
maintaining bone mass is then explained. The chapter concludes with a statement of the
research problem and an overview of the thesis content.
1.1 Epidemiology of Osteoporosis in Canada
Osteoporosis is a chronic asymptomatic skeletal disease characterized by micro-architectural
deterioration of bone tissue and low bone mass, that increases the risk for fracture [1]. About
25% of Canadian women and 13% of men over 50 years of age have osteoporosis [1], and
the prevalence of the disease increases with age [2]. Osteoporosis is diagnosed through the
measurement of bone mineral density (BMD), yet often remains undiagnosed until the
experience of a fracture [1]. Older individuals, especially women, are at highest risk for
osteoporosis related fracture due to increased muscular weakness, visual decline and age-
related bone loss [3]. The most common types of fracture attributed to osteoporosis include
forearm or wrist, vertebral and hip. Vertebral fractures can lead to chronic back pain,
deformity, height loss, decreased mobility and reduced pulmonary function [4]. Hip fractures
cause chronic pain, disability and increased morbidity and mortality [5, 6], with about 20%
of women dying and about 50% becoming functionally dependent within one year after a hip
fracture [7]. As our population ages, it is projected that more Canadians will suffer from
fractures related to this debilitating disease [8, 9], and therefore osteoporotic fracture
prevention is currently the main focus of osteoporosis management [1].
Chapter 1: Introduction 2
1.2 Calcium Intake, Bone Mass and Osteoporosis
Bone mass contains a high amount of calcium and maintaining adequate calcium
intake can reduce age-related bone loss [10]. With older age, both passive calcium absorption
and active transport of calcium become less efficient [10, 11]. Calcium supplementation is
considered a first-line over-the-counter (OTC) therapeutic option for preventing osteoporosis,
either alone or in combination with bone-building therapies, and is especially important for
individuals with low dietary calcium intake [1, 12-14]. Recent data from a meta-analysis has
shown that calcium supplementation is associated with a decreased risk of fracture [15].
According to the 2010 Canadian osteoporosis guidelines, individuals are encouraged
to use calcium supplementation in combination with vitamin D supplementation, because of
the role of vitamin D in optimizing calcium absorption [1, 14, 16, 17]. The guidelines
recommend a total daily intake of 1200 mg of elemental calcium from diet and supplements
for individuals over the age of 50 years [1]. However, Canadian national and provincial data
show that most Canadian women are deficient in dietary calcium intake levels [16, 18, 19].
About 94% of Canadian women 50 years and older are not meeting the recommended
calcium levels of (1200 mg/day) from diet alone, and 69% are not meeting these levels from
a combination of diet and supplements [19]. As a result, current guidelines recommend that
older Canadian women regularly use calcium supplements to help meet recommended
calcium intake levels, maintain healthy bones and decrease risk for fracture [1].
1.3 Statement of the Problem
Osteoporotic fractures result in considerable morbidity and shortened survival [1].
Adequate calcium intake can help reduce age-related bone loss and fracture risk.
Chapter 1: Introduction 3
Postmenopausal women are at high risk for fracture [1] and are not meeting adequate calcium
intake levels [19, 20]. The regular use of calcium supplements is thus important for helping
reduce fracture risk related to inadequate calcium intake [10, 15]. A better understanding of
the factors associated with calcium supplement use among older women may help inform
health promotion programs targeted at improving calcium supplementation and ultimately
reducing fracture risk. The work of this thesis sought to identify factors associated with
calcium supplement use among older community-dwelling women.
1.4 Overview of Thesis
This thesis is organized into five chapters. This chapter, Chapter 1, reviewed the
importance of adequate calcium intake to reducing osteoporotic fracture risk among older
Canadian women and introduced the research problem. Chapter 2 covers the conceptual
framework chosen and literature review used to inform the thesis. The study objective, data
source, variables and statistical analyses used for this project are then outlined in Chapter 3.
Results are presented in Chapter 4, and findings of the thesis and implications are discussed
in Chapter 5.
Chapter 2: Literature Review and Conceptual Framework
4
Chapter 2: Literature Review and Conceptual Framework
This chapter begins with a summary of the search strategy used to identify prior
studies that examined factors associated with calcium supplement use among older women.
This is followed by a summary of the main conceptual frameworks in the literature that
explain individual-level health behaviour. Justification for the choice of the conceptual
framework chosen to guide the work of this thesis is then provided, followed by a summary
of the factors associated with dietary calcium intake and/or calcium supplement use from the
identified studies. This chapter concludes with a summary of the gaps in previous research
and an explanation of how this study will address those limitations.
2.1 Search Strategy and Inclusion/Exclusion Criteria for Studies
The EMBASE, HealthStar, Health and Psychosocial Instruments, International
Pharmaceutical Abstracts, MEDLINE and PsycINFO databases were searched from database
development to July 2011, to identify previous research that has examined factors associated
with dietary calcium intake or supplement use1 (Appendix A). A total of 479 individual
references resulted from the search. Abstracts, commentaries, letters, news articles, and
review papers were excluded. Papers were also excluded if factors associated with dietary
calcium intake and/or supplement use in older women were not examined. After exclusion
based on title, 109 articles remained and after review of abstracts, 26 eligible articles were
remaining for detailed review.
1 Preliminary searches indicated few studies when the search was limited to calcium supplement use and
therefore the search was extended to include general calcium intake.
Chapter 2: Literature Review and Conceptual Framework 5
After detailed review, 17 of the 26 identified articles were excluded: nine articles did
not examine factors associated with dietary calcium intake and/or supplement use [21-29];
seven did not examine dietary calcium intake and/or supplement use as separate from general
osteoporosis prevention behaviour [12, 30-35]; and one study only examined the association
between dietary calcium intake and specific nutrients consumed (e.g., magnesium and zinc)
[36]. Thus, nine articles remained and each was examined for the conceptual frameworks
used, as well as factors found to be associated with dietary calcium intake and/or calcium
supplement use.
2.2 Individual-Level Health Behaviour Conceptual Frameworks
2.2.1 Conceptual Frameworks Used in Previous Studies to Examine Calcium Intake
Calcium supplementation is considered an osteoporosis prevention health behaviour
[1] and therefore individual-level health behaviour conceptual frameworks were examined to
determine a framework most suitable for the examination of factors associated with calcium
supplement use among older women.
Four of the nine eligible studies identified from the literature search used conceptual
frameworks to guide the investigation of factors associated with dietary calcium intake
and/or supplement use. One study used the Stages of Change Model to explain a woman’s
motivation and readiness to change milk intake, by assessing five different stages of
readiness: 1) precontemplation, 2) contemplation, 3) decision, 4) action and 5) maintenance
[37]. According to the Stages of Change Model, in order for an individual to modify a
prevention behaviour, he/she is required to move from one stage of readiness to the other.
This model, however, was less applicable to examining factors associated with calcium
Chapter 2: Literature Review and Conceptual Framework 6
supplement use because it focuses on explaining an individual’s “stage of change” in relation
to a health behaviour, rather than explaining general factors associated with health behaviour.
Another study used the Health Promotion Model to examine the relationship between
calcium intake and estrogen/hormone therapy in postmenopausal women 50 years of age or
older [38]. The Health Promotion Model attempts to explain health behaviour as the result of
an individual’s motivation to increase his/her well-being [39]. The major assumption of this
model is that individuals take an active role in managing their health, and change behaviour
as a result of knowledge regarding the benefit of the behaviour change [39]. However, most
older women have knowledge deficits regarding osteoporosis prevention, treatment and
consequences [40], and thus the assumption of the Health Promotion Model that focuses on
knowledge may be inadequate to examine calcium supplement use among older women.
The two other studies that have examined factors associated with calcium intake used
the Health Belief Model (HBM) to guide the research [41, 42]. In brief, the HBM suggests
that health behaviour is directly influenced by health beliefs, and indirectly influenced by
personal characteristics as well as experiences that may modify the health beliefs. The HBM
is more comprehensive in scope compared to the Health Promotion Model or Stages of
Change Model and therefore appeared to be suitable to examine correlates of calcium
supplement use among older women. However, it was possible that another conceptual
framework, not previously used in the studies related to calcium intake may have been even
more useful. Thus a broader literature review was initiated.
Chapter 2: Literature Review and Conceptual Framework 7
2.2.2 Conceptual Frameworks Used In Literature to Examine Individual-level Health
Behaviour
We broadened the search to examine review articles investigating other individual-
level health behaviour conceptual frameworks, and therefore identified other commonly used
conceptual frameworks. This led to the identification of two additional conceptual
frameworks: the Precaution Adoption Process Model and the Theory of Planned Behaviour.
The Precaution Adoption Process Model explains an individual’s journey from lack of
awareness to action and maintenance of the behaviour through seven stages: 1) being
unaware of the issue, 2) being aware of the issue but not personally engaged, 3) being
engaged and deciding what to do, 4) planning to act but not yet having acted, 5) having
decided not to act, 6) acting, and 7) maintenance [43]. This model would be appropriate for
examining women’s awareness of the benefits of calcium supplement use in osteoporosis
management, but not appropriate to determining factors associated with the action- calcium
supplement use.
Lastly, the Theory of Planned Behaviour explains an individual’s attitude towards a
behaviour by measuring behavioural intention, attitude, subjective norms and perceived
behavioural control [43]. The theory considers an individual's intention to perform a
behaviour as the most important predictor of his/her actual behaviour and does not account
for demographic or environmental factors that may possibly influence behaviour. A woman’s
decision to use calcium supplements, however, may not only be dependent on personal
intention and can be influenced by external factors such as BMD testing. Thus, this theory
was deemed less relevant to studying factors of association to calcium supplement use.
Chapter 2: Literature Review and Conceptual Framework 8
Therefore, after review of possible conceptual frameworks explaining individual-
level health behaviour, from both the research related to calcium intake and/or supplement
use and the general literature, the HBM was deemed most appropriate for use in this thesis to
examine factors associated with calcium supplement use among older community-dwelling
women. A description and critique of the HBM follows.
2.3 Conceptual Framework: The Health Belief Model (HBM)
The HBM was developed by social psychologists in the 1950s and has been widely
used in the field of psychology to explain and predict individuals’ preventive health
behaviours based on health beliefs, as well as personal factors and experiences [44, 45]
(Figure 1). The underlying premise of the HBM is that individuals who perceive a threat
from a disease and perceive greater benefits than barriers towards taking preventive action
against the disease, will be more likely to engage in preventive health behaviour to avoid
undesirable consequences of the disease. Key to the HBM is understanding of how personal
characteristics and experience modify a patient’s: a) perceived threat of disease and b)
benefit to barrier ratio of the health behaviour. The HBM consists of seven main components
that seek to define an individual’s likelihood of engaging in preventive behaviour [45, 46].
These can be grouped into three main categories.
Chapter 2: Literature Review and Conceptual Framework 9
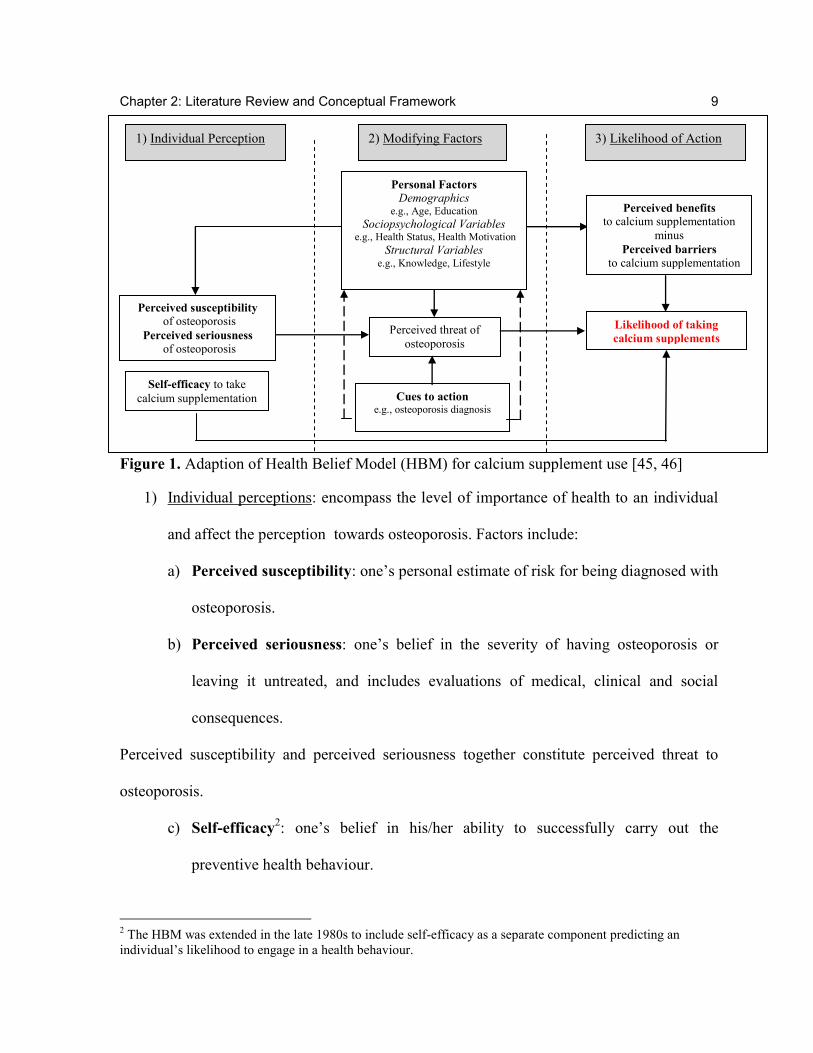
Figure 1. Adaption of Health Belief Model (HBM) for calcium supplement use [45, 46]
1) Individual perceptions: encompass the level of importance of health to an individual
and affect the perception towards osteoporosis. Factors include:
a) Perceived susceptibility: one’s personal estimate of risk for being diagnosed with
osteoporosis.
b) Perceived seriousness: one’s belief in the severity of having osteoporosis or
leaving it untreated, and includes evaluations of medical, clinical and social
consequences.
Perceived susceptibility and perceived seriousness together constitute perceived threat to
osteoporosis.
c) Self-efficacy2: one’s belief in his/her ability to successfully carry out the
preventive health behaviour.
2 The HBM was extended in the late 1980s to include self-efficacy as a separate component predicting an
individual’s likelihood to engage in a health behaviour.
1) Individual Perception 2) Modifying Factors 3) Likelihood of Action
Personal Factors
Demographics e.g., Age, Education
Sociopsychological Variables e.g., Health Status, Health Motivation
Structural Variables e.g., Knowledge, Lifestyle
Perceived threat of
osteoporosis
Cues to action e.g., osteoporosis diagnosis
Perceived benefits
to calcium supplementation
minus
Perceived barriers to calcium supplementation
Likelihood of taking
calcium supplements
Perceived susceptibility
of osteoporosis
Perceived seriousness of osteoporosis
Self-efficacy to take
calcium supplementation
Chapter 2: Literature Review and Conceptual Framework 10
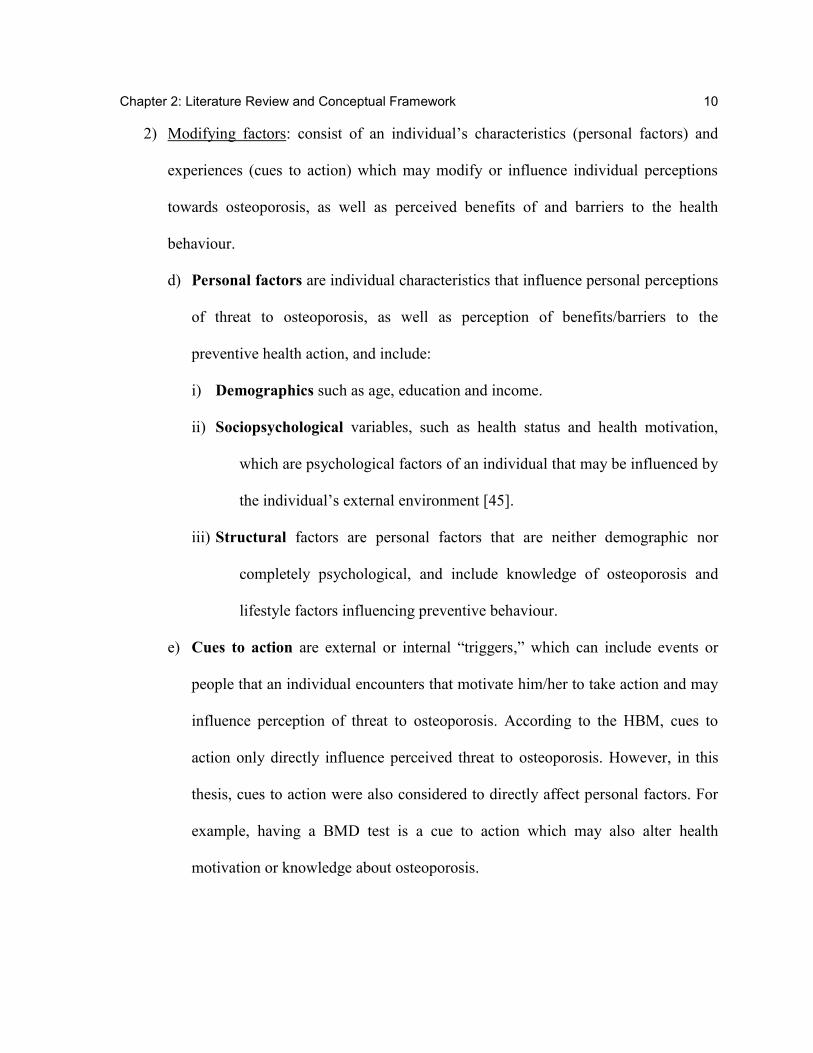
2) Modifying factors: consist of an individual’s characteristics (personal factors) and
experiences (cues to action) which may modify or influence individual perceptions
towards osteoporosis, as well as perceived benefits of and barriers to the health
behaviour.
d) Personal factors are individual characteristics that influence personal perceptions
of threat to osteoporosis, as well as perception of benefits/barriers to the
preventive health action, and include:
i) Demographics such as age, education and income.
ii) Sociopsychological variables, such as health status and health motivation,
which are psychological factors of an individual that may be influenced by
the individual’s external environment [45].
iii) Structural factors are personal factors that are neither demographic nor
completely psychological, and include knowledge of osteoporosis and
lifestyle factors influencing preventive behaviour.
e) Cues to action are external or internal “triggers,” which can include events or
people that an individual encounters that motivate him/her to take action and may
influence perception of threat to osteoporosis. According to the HBM, cues to
action only directly influence perceived threat to osteoporosis. However, in this
thesis, cues to action were also considered to directly affect personal factors. For
example, having a BMD test is a cue to action which may also alter health
motivation or knowledge about osteoporosis.
Chapter 2: Literature Review and Conceptual Framework 11
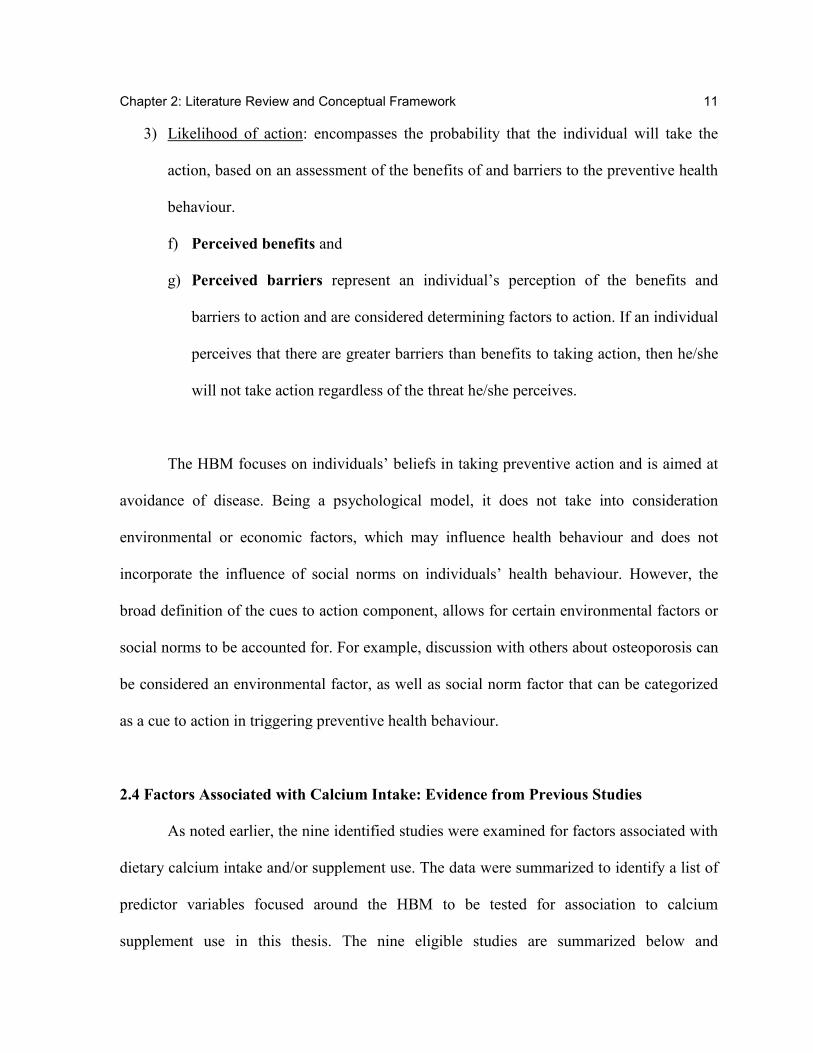
3) Likelihood of action: encompasses the probability that the individual will take the
action, based on an assessment of the benefits of and barriers to the preventive health
behaviour.
f) Perceived benefits and
g) Perceived barriers represent an individual’s perception of the benefits and
barriers to action and are considered determining factors to action. If an individual
perceives that there are greater barriers than benefits to taking action, then he/she
will not take action regardless of the threat he/she perceives.
The HBM focuses on individuals’ beliefs in taking preventive action and is aimed at
avoidance of disease. Being a psychological model, it does not take into consideration
environmental or economic factors, which may influence health behaviour and does not
incorporate the influence of social norms on individuals’ health behaviour. However, the
broad definition of the cues to action component, allows for certain environmental factors or
social norms to be accounted for. For example, discussion with others about osteoporosis can
be considered an environmental factor, as well as social norm factor that can be categorized
as a cue to action in triggering preventive health behaviour.
2.4 Factors Associated with Calcium Intake: Evidence from Previous Studies
As noted earlier, the nine identified studies were examined for factors associated with
dietary calcium intake and/or supplement use. The data were summarized to identify a list of
predictor variables focused around the HBM to be tested for association to calcium
supplement use in this thesis. The nine eligible studies are summarized below and
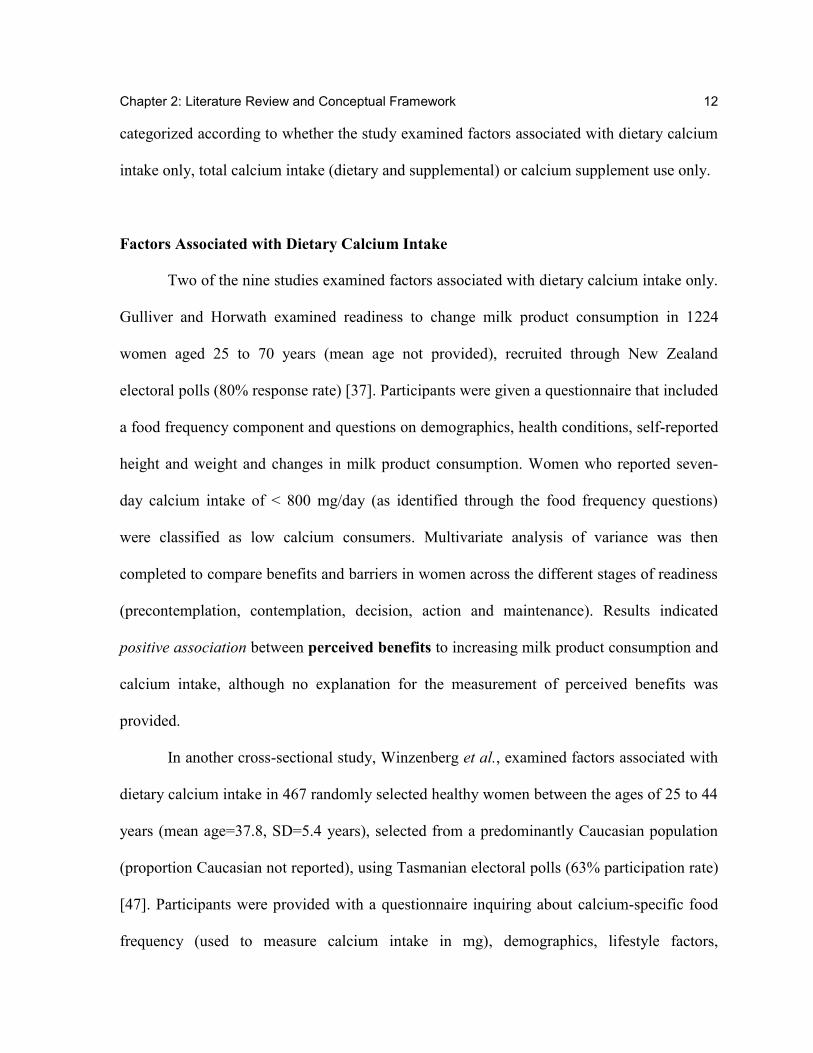
Chapter 2: Literature Review and Conceptual Framework 12
categorized according to whether the study examined factors associated with dietary calcium
intake only, total calcium intake (dietary and supplemental) or calcium supplement use only.
Factors Associated with Dietary Calcium Intake
Two of the nine studies examined factors associated with dietary calcium intake only.
Gulliver and Horwath examined readiness to change milk product consumption in 1224
women aged 25 to 70 years (mean age not provided), recruited through New Zealand
electoral polls (80% response rate) [37]. Participants were given a questionnaire that included
a food frequency component and questions on demographics, health conditions, self-reported
height and weight and changes in milk product consumption. Women who reported seven-
day calcium intake of < 800 mg/day (as identified through the food frequency questions)
were classified as low calcium consumers. Multivariate analysis of variance was then
completed to compare benefits and barriers in women across the different stages of readiness
(precontemplation, contemplation, decision, action and maintenance). Results indicated
positive association between perceived benefits to increasing milk product consumption and
calcium intake, although no explanation for the measurement of perceived benefits was
provided.
In another cross-sectional study, Winzenberg et al., examined factors associated with
dietary calcium intake in 467 randomly selected healthy women between the ages of 25 to 44
years (mean age=37.8, SD=5.4 years), selected from a predominantly Caucasian population
(proportion Caucasian not reported), using Tasmanian electoral polls (63% participation rate)
[47]. Participants were provided with a questionnaire inquiring about calcium-specific food
frequency (used to measure calcium intake in mg), demographics, lifestyle factors,
Chapter 2: Literature Review and Conceptual Framework 13
osteoporosis risk factors, knowledge and self-efficacy. Although the study reports that 2.1%
of the study sample used calcium supplements, measurement of calcium supplementation is
not provided and it is unclear whether calcium levels from supplementation were included
when calculating calcium intake. Multiple linear regression was used to identify factors
associated with daily calcium intake (in mg), and logistic regression analysis was used to
identify factors associated with meeting Australian recommended dietary calcium intake
levels (800 mg from dietary sources). Results from linear regression showed that calcium-
specific knowledge, calcium-specific osteoporosis self-efficacy and education after grade
10 were positively associated with daily calcium intake. No association was found between
daily calcium intake and cues to action (i.e., personal history of fracture), or lifestyle factors
(such as hours of employment or having ever breast fed). Odds for achieving the
recommended calcium intake level also increased with greater calcium-specific self-
efficacy and knowledge, but decreased among smokers and those with low income.
Factors Associated with Dietary and Supplemental Calcium Intake
Four studies examined factors associated with total calcium intake (dietary and
supplemental). Ali et al. conducted a cross-sectional study of 100 Caucasian women between
the ages of 52 to 99 years (mean age=74.2 years), who were recruited from seven meal
centers in urban communities within an American midwestern state [48]. Calcium intake was
measured by 24-hour recall of dietary intake of milk, yogurt and calcium-rich foods, as well
as by type and amount of calcium supplement consumed. Calcium intake scores (in mg) were
calculated for each source of intake (i.e., milk, yogurt, calcium rich foods and calcium
supplements). A total summated score (in mg) of intake from all sources was also calculated.
Chapter 2: Literature Review and Conceptual Framework 14
Participants were categorized into two groups: high and low dietary calcium intake (cut-off
value for categorization was not provided). Perceptions of benefits and barriers to calcium
intake were measured by the Calcium Barriers/Benefits Scale, which consisted of 17 Likert-
scale items (11 of which addressed perceptions of barriers and six addressed perceptions of
benefits). Chi-square analysis and t-tests were calculated and results indicated that on
average those with high calcium intake perceived fewer barriers to calcium intake than
those with low calcium intake.
Researchers from the previous study also conducted a similar cross-sectional study, in
which they examined the effectiveness of variables related to the Health Promotion Model in
predicting total calcium intake [38]. The study sample consisted of a convenience sample of
100 women aged 50 to 88 years (mean age=66.7 years), identified from three churches in a
midwestern American state. Participants were provided with a questionnaire, inquiring about
calcium intake, exercise participation, hormone therapy usage, osteoporosis health beliefs,
demographics and personal characteristics. Calcium intake was categorized as high or low,
yet specifics were not provided in this study. Multivariable logistic regression analysis was
utilized to predict total calcium intake. Women with greater calcium intake had better
perceived health status and general self-efficacy (i.e., belief in general abilities to perform
life activities), as well as greater perceived benefits and fewer perceived barriers to
calcium intake.
A third cross-sectional study used the HBM to examine the association between
osteoporosis health beliefs, demographics and personal risk factors for osteoporosis, to
calcium intake among postmenopausal women [42]. One-hundred and eighty-seven women
aged 65 to 95 years (mean age=75.4, SD=6.5), were recruited from a community pharmacy
Chapter 2: Literature Review and Conceptual Framework 15
and senior nutrition program in two Texan cities and asked to complete a questionnaire. A
total measure of calcium intake was determined from a quantitative food frequency scale and
self-reported calcium supplement use (although details regarding measurement of
supplementation was not provided). Hierarchical multiple linear regression was utilized to
examine factors associated with calcium intake. Osteoporosis health beliefs (i.e., perceived
susceptibility to osteoporosis, perceived seriousness to osteoporosis, health motivation,
benefits of calcium intake, barriers to calcium intake and self-efficacy of calcium intake),
were included as the first block and demographics (age, race/ethnicity, education, income),
lifestyle factors (weight, height change, smoking, alcohol consumption) and cues to action
(family history) were added as the second block. The study found that only self-efficacy of
calcium intake contributed positively and significantly to calcium intake. Personal factors
(i.e., race/ethnicity, education, income, weight, height change, smoking, alcohol
consumption) and cues to action (family history) were not significantly associated with
calcium intake.
A Canadian focus group study by French et al., sought to determine factors
preventing postmenopausal women (i.e., 50 years and older) with low BMD (i.e., t-score ≤-
1.0) from meeting calcium recommendations of 1500 mg/day (based on the 2002 Canadian
guidelines) [49]. A random sample of women who had attended a multidisciplinary
osteoporosis treatment program in an urban city were invited to participate. Thirty (29%
response rate) postmenopausal women (mean age=67.4, SD=10.1) participated, of which
96% were Caucasian, 43% were diagnosed with osteopenia and 57% with osteoporosis.
Three major barriers to adequate dietary calcium intake were identified: insufficient
knowledge, self-efficacy to follow the dietary calcium recommendations and impeding

Chapter 2: Literature Review and Conceptual Framework 16
lifestyle factors (i.e., shift-work and lactose intolerance). Forgetfulness was noted as
especially hindering participants from regularly consuming calcium supplements. Lastly,
women were also concerned about weight-gain from calcium-rich foods and not tolerating
the side effects of calcium supplements.
Factors Associated with Supplemental Calcium Intake
Three studies examined factors associated with calcium intake only from
supplements. A pilot study by Hseih et al. was conducted to determine the association
between osteoporosis preventive behaviours and health beliefs among 60 English-speaking
women 40 to 95 years (20 patients in each age group: 40-55 years, 56-70 years and 71-95
years), who were recruited from an urban academic family practice and retirement
community [41]. Osteoporosis preventive behaviour was defined based on a composite of:
weight-bearing exercise, the use of hormone replacement therapy, and calcium and/or
vitamin D supplement use. Correlations were calculated to determine the association between
demographic variables (i.e., age, race and education), osteoporosis health beliefs (i.e.,
motivation, barriers, active participant in health care, frustration and benefits) and other
selected non-health belief items to osteoporosis preventive behaviour. Behaviours to prevent
osteoporosis were not associated with demographics or any osteoporosis health beliefs.
Furthermore, the study reported that although women perceived high seriousness to
osteoporosis, the majority did not perceive personal susceptibility to the disease.
The study by Cline and Worsley examined associations between osteoporosis health
beliefs and calcium/vitamin D/soy supplement use [50]. The study sample consisted of 990
community-dwelling women aged 45 years and older, who were recruited via a commercial
Chapter 2: Literature Review and Conceptual Framework 17
mailing list in Minnesota (61% response rate). Hierarchical agglomerative cluster analysis
was completed to determine whether certain subgroups existed with regards to osteoporosis
health beliefs and calcium/vitamin D/soy supplement use. Three clusters were identified:
Cluster 1 consisted of women who had greater perceived susceptibility to osteoporosis and
also greater perceived benefits but lower perceived barriers to the use of OTC products.
Women in this cluster were also more likely to have experienced cues to action (i.e., BMD
testing and osteoporosis diagnosis) and more likely to have been using calcium
supplements. Cluster 2 consisted of women that perceived high susceptibility and
seriousness to osteoporosis but believed that there were greater barriers than benefits to
using OTC products. Members of this cluster were the least educated compared to the other
two clusters and more likely to smoke and exercise (greater than three times per week).
Lastly, cluster 3 consisted of women who perceived little susceptibility and seriousness to
osteoporosis and had a strong belief in health promoting behaviours, but perceived less
benefits to taking OTC products. Participants who belonged to this cluster were also the least
likely out of the other two clusters to have had a family history of osteoporosis.
Tyler et al., sought to identify predictors of calcium supplement use compared to non-
use and understand barriers to calcium supplementation [51]. They surveyed 185 women
(95% participation rate) aged 20 to 64 years (mean age=43 years) from six suburban
community-based family medicine practices in Cleveland. Associations between calcium
supplement use and demographics as well as health-related items were determined using
logistic regression. Bivariate results indicated that calcium supplement users were older,
better educated, had higher health motivation (were twice as likely to take daily
multivitamins and more frequently scheduled physical exams), and had a greater number of
Chapter 2: Literature Review and Conceptual Framework 18
cues to action (i.e., higher rates of family history and personal risk for osteoporosis). Results
from the multivariable logistic regression indicated that only greater health motivation
(measured through multivitamin use), older age, and self-rated risk for osteoporosis were
significantly associated with calcium supplement use.
Summary of Prior Research
In summary, prior research identified that dietary calcium intake and/or supplement
use was more likely among those who perceived greater benefits of calcium [37, 38, 50]
and fewer barriers to calcium intake [38, 48, 50]. In addition, although greater perceived
susceptibility to osteoporosis was not related to calcium supplement use in a small
convenience sample (n=60) [41], results from a large randomly selected sample (n=990)
identified a positive association between greater perceived susceptibility and calcium
supplement use [50]. One study identified no association between perceived seriousness of
osteoporosis and calcium supplement use [41], while another study identified that those
perceiving that osteoporosis was more serious were also more likely to perceive greater
benefits to OTC product use [50]. Self-efficacy for taking calcium [42, 47] and general self-
efficacy [38] were both positively associated with dietary calcium intake [47], as well as total
calcium intake [38, 42], but no study examined the association between self-efficacy and
calcium supplement use only. Results differed with regards to associations between cues to
action and dietary and/or supplemental calcium intake. A study focusing on supplementation
reported greater odds of BMD testing and osteoporosis diagnosis among calcium supplement
users [50], yet a study examining dietary calcium intake reported no association between
personal fracture history and dietary calcium intake [47]. Some studies reported no
Chapter 2: Literature Review and Conceptual Framework 19
association between personal factors (such as race, education, income and smoking status)
and calcium intake [41, 42]. Yet, other studies reported positive association between dietary
calcium intake and education [47], older age and calcium supplement use [51], perceived
health status and total calcium intake [38]; as well as between health motivation and dietary
calcium intake [38] and calcium supplement use [51].
Limitations of Previous Studies
The generalizability of results from the nine identified studies is limited. Most did not
focus on the population at highest risk for osteoporosis-- postmenopausal women aged 65
years and older and/or did not use sampling techniques to capture a generalizable sample of
older women. Five studies examined convenience samples [38, 41, 42, 48, 52] such as
recruited from churches [38] or urban medical centres [41]. Furthermore, none of the nine
studies examined a comprehensive list of predictor variables related to calcium intake. The
one study that came close to having a comprehensive list did not calculate measures of
association between predictors and calcium supplement use, but instead examined total
calcium intake [42]. Lastly, most studies did not explain how calcium supplement use was
measured and/or collected, and when explained, the validity of the measurement was not
assessed.
2.5 Chapter Summary
A review of the literature ascertains that a study focused on postmenopausal women
and examining the simultaneous effect of a comprehensive list of validated predictor
variables is required for developing a better understanding of factors associated with calcium
Chapter 2: Literature Review and Conceptual Framework 20
supplement use among postmenopausal women. Of prior research examining factors
associated with dietary calcium intake and/or supplement use, only one study examined
correlates of calcium supplement use specifically, yet studied women who were younger than
65 years of age. In general, previous studies examining dietary calcium intake and/or
supplement use often had one or more of the following limitations: 1) study samples that are
not generalizable to older women, 2) no theory driven identification or examination of
variables, 3) a limited number of independent variables considered, and/or 4) little to no
information on the validity or reliability of outcome measures or predictor variables. Lastly, a
review of prior research and general health behaviour literature, ascertained that the HBM
was the most suitable individual-level health behaviour model for examining calcium
supplement use among older women.
Chapter 3: Methods
21
Chapter 3: Methods
This chapter summarizes the methods used to investigate the research problem
introduced in this thesis. First, the study objective, study design and data source are
presented. The study measures are then described and organized according to the components
of the HBM. A description of statistical analyses, study power and ethical considerations
complete the chapter.
3.1 Study Objective
The objective of this thesis was to identify factors associated with calcium
supplement use in a cohort of older community-dwelling women in Ontario, using the HBM
as a conceptual framework.
3.2 Overview of Study Sample and Reanalysis of Data from CSOFT
The Community Study of Osteoporosis Fracture and Treatment (CSOFT) was a
cross-sectional study that sampled women 65 years and older via standardized telephone
interview from May 2003 to 2004 and collected data on osteoporosis risk factors, health
beliefs and osteoporosis management. The study sample for this thesis was comprised of
participants from CSOFT. Data from CSOFT were analyzed using multivariable logistic
regression to determine factors associated with calcium supplement use.
Chapter 3: Methods 22
3.3 Data Source: CSOFT
3.3.1 CSOFT Study Objectives
CSOFT had two main objectives: 1) estimate the proportion of community-dwelling
women aged 65 years and older who were: a) being investigated for osteoporosis by BMD
testing, and b) being treated for fracture prevention; as well as 2) identify the barriers and
facilitators to BMD testing and osteoporosis treatment through the use of a health services
utilization framework [53]. CSOFT utilized Anderson’s behavioural model of medical access
and health services use as the conceptual framework to identify barriers and facilitators to
BMD testing and osteoporosis treatment [54]. Anderson’s model focuses on identifying
factors facilitating or impeding health services utilization by proposing that the behaviour
(health services use) is influenced by the environment and population or individual
characteristics [54]. This model was not suitable to guide the work of this thesis because the
behaviour under examination (calcium supplement use) is not a health service, but an
individual-level health behaviour.
3.3.2 CSOFT Sampling Frame
The sampling frame for CSOFT was obtained from a list of individuals who
completed a screener questionnaire between 1995 and 1997, as part of another study entitled
the Study of Arthritis in Your Community (SAYC). The SAYC screener was essentially a
census of all residents aged 55 years and older, based on 1994 tax records. The purpose of
the screener was to obtain an estimate of osteoarthritis prevalence among residents aged 55
years and older in two regions of Ontario: Oxford Country (southwestern rural Ontario) and
East York (borough of Toronto); and identify adults with moderate to severe osteoarthritis
Chapter 3: Methods 23
who were eligible for longitudinal follow-up [55]. The two regions were chosen based on 3
criteria: 1) rate of knee and hip arthroplasty (low and high), 2) proximity to study center (3-
hour driving time from Toronto) and 3) at least 2000 people in each age group: 55-64, 65-74
and >75 years within each region [56]. Of 27,745 women identified, 16,521 participated in
the SAYC screener and 2,358 were identified to have moderate to severe osteoarthritis and
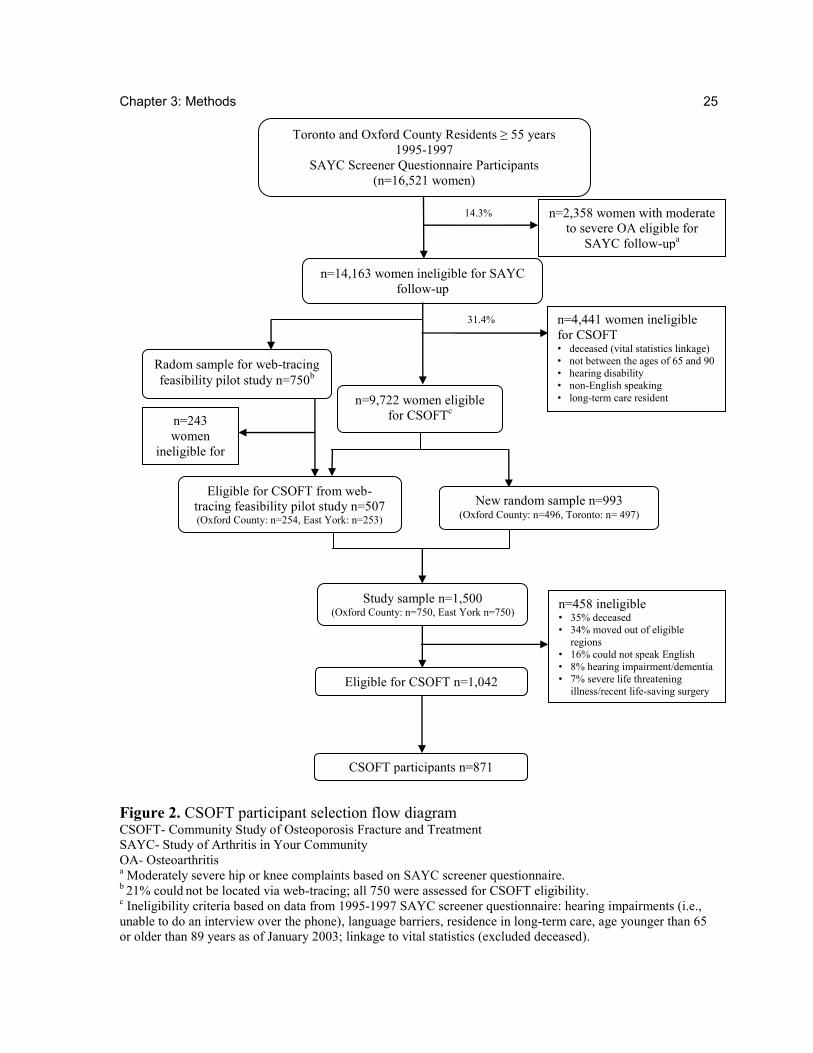
thus were eligible for SAYC longitudinal follow-up [57]. The CSOFT study sample was
selected from the subset of women ineligible for SAYC longitudinal follow-up (i.e.,
n=14,163; the 86% who did not have moderate to severe osteoarthritis between 1995-1997)
(Figure 2).
3.3.3 CSOFT Web-Tracing Feasibility Study
First, the practicality of locating women using the SAYC list as a sampling frame,
was determined by a web-tracing feasibility study. A random sample of 750 women from the
14,163 ineligible for SAYC, was selected for the web-tracing feasibility study. City and web
directories were searched to identify telephone numbers and current addresses, but women
were not contacted during this feasibility study. The web-tracing study located 79% of
women, suggesting that the sampling frame was useful for CSOFT [58]. These data were
used to inform the CSOFT sample size by estimating that 21% of women may not be located.
3.3.4 CSOFT Sample Size Estimate
Two methods were utilized to identify CSOFT eligibility: vital statistics linkage and
SAYC screener data abstraction. The 14,163 women potentially eligible for CSOFT were
linked to vital statistics at Cancer Care Ontario, and 1,575 (11%) were identified as deceased
Chapter 3: Methods 24
[58]. The SAYC screener data were then used to exclude women who did not meet CSOFT
eligibility criteria: age younger than 65 years or older than 89 years (as of January 2003),
non-English speaking, had a hearing disability or lived in long-term care3. A total of 9,722
women were eligible for CSOFT after exclusion based on vital statistics linkage and SAYC
screener information [58]. Among these, 507 (n=254 Oxford County, n=253 East York) were
part of the web-tracing feasibility study and were included in CSOFT. The sample of 5074
[58] was then supplemented with a stratified random sample of 993 women (Oxford County
n=496, East York n=497), for a total study sample size of 1,500 (n=750 from each region)
[58]. A sample size of 1,500 was estimated based on a required minimum of 384 participants
(for each region), estimating 21% would not be located (due to being unable to determine
address), and 8% would be ineligible [58].
3.3.5 CSOFT Study Sample
Of the 1,500 women sampled in CSOFT, 1,042 (69%) were deemed eligible, and 871
participated in the study (participation rate=84%) [53] (Figure 2. ). Based on responses from
the SAYC screener questionnaire, CSOFT participants were similar to individuals who
refused to participate, but significantly younger than women who were not contacted or were
ineligible [53]. The proportion of CSOFT participants self-reporting a diagnosis of
osteoporosis, body mass index, and use of etidronate and hormone therapy on the SAYC
screener was similar to CSOFT non-respondents [53].
3 Non-English speakers and those with a hearing disability were excluded because the data collection method
for CSOFT was a telephone interview. 4Traced from the web-tracing feasibility study and alive based on vital statistics linkage and eligible by SAYC
screener data.
Chapter 3: Methods 25
Figure 2. CSOFT participant selection flow diagram CSOFT- Community Study of Osteoporosis Fracture and Treatment
SAYC- Study of Arthritis in Your Community
OA- Osteoarthritis a Moderately severe hip or knee complaints based on SAYC screener questionnaire.
b 21% could
not be located via web-tracing; all 750 were assessed for CSOFT eligibility.
c Ineligibility criteria based on data from 1995-1997 SAYC screener questionnaire: hearing impairments (i.e.,
unable to do an interview over the phone), language barriers, residence in long-term care, age younger than 65
or older than 89 years as of January 2003; linkage to vital statistics (excluded deceased).
Toronto and Oxford County Residents ≥ 55 years
1995-1997
SAYC Screener Questionnaire Participants
(n=16,521 women)
n=14,163 women ineligible for SAYC
follow-up
n=2,358 women with moderate
to severe OA eligible for
SAYC follow-upa
n=9,722 women eligible
for CSOFTc
n=4,441 women ineligible
for CSOFT • deceased (vital statistics linkage)
• not between the ages of 65 and 90
• hearing disability
• non-English speaking
• long-term care resident
Study sample n=1,500 (Oxford County: n=750, East York n=750)
Eligible for CSOFT from web-
tracing feasibility pilot study n=507 (Oxford County: n=254, East York: n=253)
New random sample n=993 (Oxford County: n=496, Toronto: n= 497)
14.3%
31.4%
n=458 ineligible • 35% deceased
• 34% moved out of eligible
regions
• 16% could not speak English
• 8% hearing impairment/dementia
• 7% severe life threatening
illness/recent life-saving surgery
CSOFT participants n=871
Eligible for CSOFT n=1,042
Radom sample for web-tracing
feasibility pilot study n=750b
n=243
women
ineligible for
CSOFT
Chapter 3: Methods 26
3.3.6 CSOFT Questionnaire
The CSOFT questionnaire collected information on participants’ sociodemographics,
personal and family history of osteoporosis, health services use, chronic health conditions,
health status, medication and supplement use, as well as health beliefs. Health beliefs were
measured using different scales, including: the Osteoporosis Health Belief Scale (OHBS)5
[59], the osteoporosis drug treatment benefits and barriers scale [60], and an osteoporosis
knowledge scale [40]. General health status was measured by the Canadian English Short
Form 36 version 2 (SF-36v2) Health Survey [61]. Data collected via the CSOFT
questionnaire were used to inform this thesis.
3.4 Dependent Variable: Calcium Supplement Use
A single question in the CSOFT questionnaire addressed whether participants were
taking calcium supplements, vitamin D supplements or multivitamins -“Have you ever taken
calcium/vitamin D/multivitamins regularly (i.e., most days)?”. The response options available
were: “never,” “past,” and “now.” Four-hundred thirty-four participants reported current use
of calcium supplements, 364 reported never having used calcium supplements and 73
reported using calcium supplements in the past.
5 CSOFT included a 43-item OHBS scale. The OHBS is a validated scale developed based on the HBM and
measures osteoporosis-related health beliefs under the domains of: 1) osteoporosis susceptibility, 2)
osteoporosis seriousness, 3) exercise benefits, 4) exercise barriers, 5) calcium benefits, 6) calcium barriers and
7) general health motivation. Each of the items were measured on a 5-point Likert scale from strongly disagree
to strongly agree.
Chapter 3: Methods 27
3.4.1 Understanding Association Between Calcium, Vitamin D and Multivitamin Users
In an effort to better understand the relationship between calcium supplement use and
vitamin D and/or multivitamins, frequency tables comparing calcium supplementation with
vitamin D and multivitamin use were examined, in a preliminary analysis (Appendix B).
This analysis identified high correlation between calcium and vitamin D (r=0.85), suggesting
that calcium users were taking vitamin D concurrently. Indeed, of the 434 reporting current
use of calcium supplements, 389 (90%) were also taking vitamin D. The association with
multivitamins was also high, yet not as prominent with 247 out of 434 calcium supplement
users also reporting regular multivitamin use. We therefore suspected that correlates of
calcium supplement use will be similar for vitamin D and/or multivitamin use.
3.4.2 Understanding Calcium Users
To guide our analytical plan, we sought to better understand the characteristics of
current, past and never users by comparing characteristics between the three groups
(Appendix C). Multinomial logistic regression may have been an appropriate approach to
examine three different categories of use as: current, past or never. However, past users did
not seem to be a distinct group but had similar characteristics to both current and never users.
For example, the proportion of past users self-reporting osteoporosis diagnosis (30%) was
similar to current users (30%), but different from those who reported to have never used
calcium supplements (11%). Yet, the proportion of past users who reported having a
postsecondary education (16%) was similar to those who had never used calcium
supplements (18%) and different from those who reported current use of calcium
supplements (27%). Furthermore, the CSOFT questionnaire did not clarify the length of time
Chapter 3: Methods 28
since stopping calcium supplementation.. However, given the challenge of mapping
characteristics of past users to either current or never users and the unknown length of time
since participants had used calcium supplements in the past, past users were excluded from
the analysis, and only participants reporting current use and those reporting to have never
used calcium supplements were included. Current use of calcium supplements was used as
the dependent (yes/no) variable in this thesis.
A literature search identified two studies that examined the validity or reliability of
self-reported calcium supplement use among older women [62, 63]. One study found that the
one week test-retest reliability of self-reported calcium supplement use in women 65 years
and older was high (r=0.88) [62], based on a single question inquiring about the frequency of
current calcium supplement use (every day, 4-6 days/week, 1-3 days/week, 1-3 days/month,
less than 1 day/month). Given that the CSOFT question inquiring about calcium supplement
use contained broader response options, the reliability of the CSOFT self-report question
about current usage of calcium supplements was expected to be similarly high. Another study
examined the validity of self-reported daily intake of calcium supplements among individuals
aged 50 to 75 years. The study identified moderate correlation (r=0.69, 95% CI=0.60-0.77)
between self-reported daily intake level of calcium from supplements and calculated intake
level from supplement bottle label transcriptions [63]. These data provide support for the
validity of self-reported calcium supplement use.
3.5 Independent Variables
A total of 46 independent variables were chosen from those available in the CSOFT
dataset, based on evidence from prior research and compatibility with the HBM. CSOFT data
Chapter 3: Methods 29
collected yet not examined are summarized in Appendix D. We strategically focused on
variables related to the HBM as logical factors that may be associated with calcium
supplementation in an effort to base our analysis on prior evidence, to maximize study power
and to reduce potential chance findings. Including all variables without thoughtful
examination would have increased the potential for type I error (i.e., identifying statistically
significant correlates by chance alone). The independent variables of this study were chosen
and grouped under the HBM categories by the author and based on consensus from the full
thesis committee including Drs. Boon, Brown, Cadarette and MacKeigan. Independent
variables were grouped according to the seven main components of the HBM: 1) perceived
susceptibility to osteoporosis, 2) perceived seriousness to osteoporosis, 3) self-efficacy, 4)
personal factors, 5) cues to action, 6) perceived benefits to calcium, and 7) perceived
barriers to calcium (Appendix E).
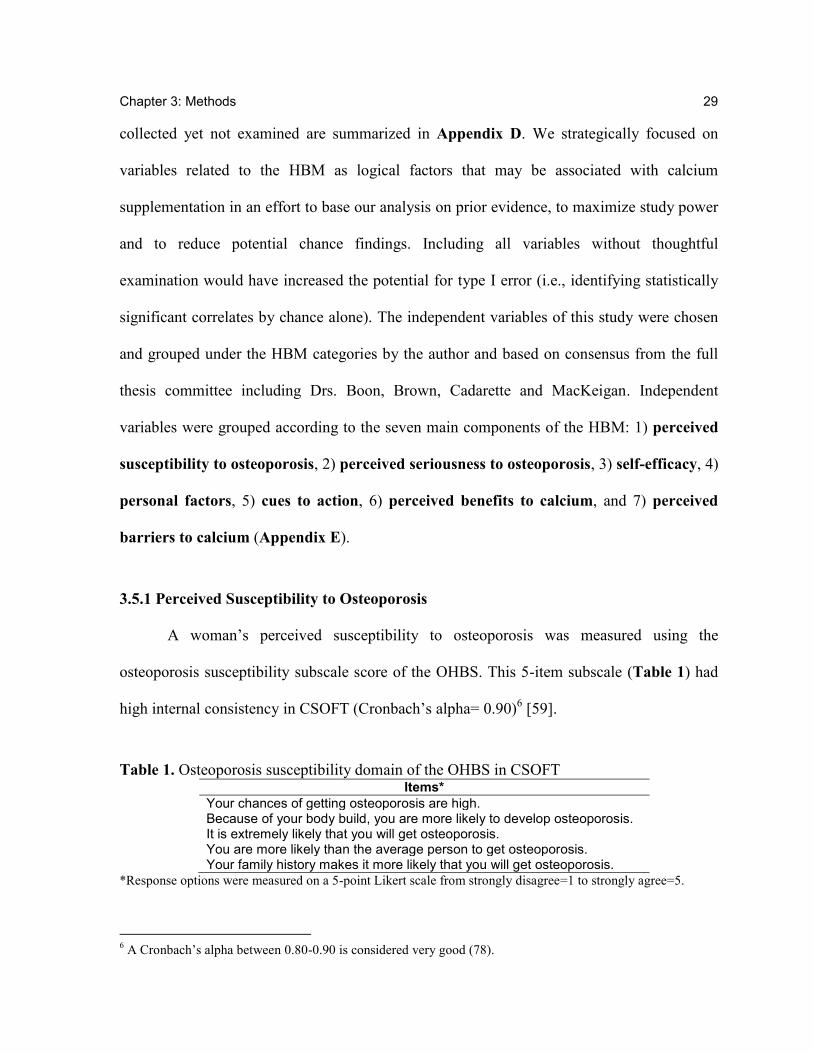
3.5.1 Perceived Susceptibility to Osteoporosis
A woman’s perceived susceptibility to osteoporosis was measured using the
osteoporosis susceptibility subscale score of the OHBS. This 5-item subscale (Table 1) had
high internal consistency in CSOFT (Cronbach’s alpha= 0.90)6 [59].
Table 1. Osteoporosis susceptibility domain of the OHBS in CSOFT Items*
Your chances of getting osteoporosis are high. Because of your body build, you are more likely to develop osteoporosis. It is extremely likely that you will get osteoporosis. You are more likely than the average person to get osteoporosis. Your family history makes it more likely that you will get osteoporosis.
*Response options were measured on a 5-point Likert scale from strongly disagree=1 to strongly agree=5.
6 A Cronbach’s alpha between 0.80-0.90 is considered very good (78).
Chapter 3: Methods 30
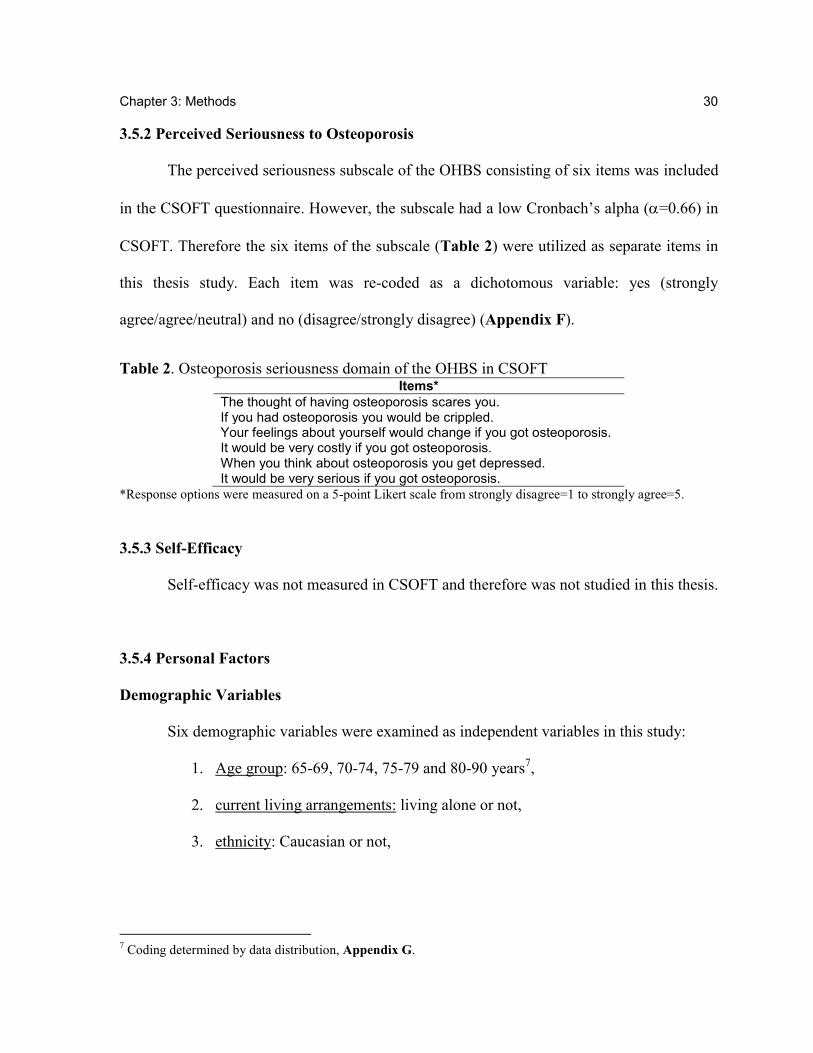
3.5.2 Perceived Seriousness to Osteoporosis
The perceived seriousness subscale of the OHBS consisting of six items was included
in the CSOFT questionnaire. However, the subscale had a low Cronbach’s alpha (=0.66) in
CSOFT. Therefore the six items of the subscale (Table 2) were utilized as separate items in
this thesis study. Each item was re-coded as a dichotomous variable: yes (strongly
agree/agree/neutral) and no (disagree/strongly disagree) (Appendix F).
Table 2. Osteoporosis seriousness domain of the OHBS in CSOFT Items*
The thought of having osteoporosis scares you. If you had osteoporosis you would be crippled. Your feelings about yourself would change if you got osteoporosis. It would be very costly if you got osteoporosis. When you think about osteoporosis you get depressed. It would be very serious if you got osteoporosis.
*Response options were measured on a 5-point Likert scale from strongly disagree=1 to strongly agree=5.
3.5.3 Self-Efficacy
Self-efficacy was not measured in CSOFT and therefore was not studied in this thesis.
3.5.4 Personal Factors
Demographic Variables
Six demographic variables were examined as independent variables in this study:
1. Age group: 65-69, 70-74, 75-79 and 80-90 years7,
2. current living arrangements: living alone or not,
3. ethnicity: Caucasian or not,
7 Coding determined by data distribution, Appendix G.
Chapter 3: Methods 31
4. highest level of education: low: <high school, mid: at least some high school,
or high: post-secondary,
5. income: <$30000, $30000-$49999, $50000, or missing, and
6. metropolitan region of residence: Toronto8 or not (Oxford County).
Sociopsychological Variables
Health Status
Health status was measured using the SF-36v2 and three variables were used as
indicators of health status:
1) General perceived health status: The item: “In general, would you say your health
is excellent, very good, good, fair or poor?”, has been shown to have good
reliability [64] and to be as effective as the complete SF-36v2 in predicting general
health status [65, 66]. The item was used as a measure of general perceived health
status and coded as dichotomous: excellent/very good or good/poor/fair.
2) SF-36v2 physical functioning composite score: This summated score is comprised of
scores from four scales within the SF-36v2 (physical functioning, role-physical,
bodily pain and general heath) and has high reliability=0.92 [67] (Appendix H). It
measures an individual’s perceived physical health status.
3) SF-36v2 mental functioning composite score: This summated score is comprised of
scores from four scales within the SF-36v2 (vitality, social functioning, role-
emotional and mental health) and has high reliability=0.88 [67] (Appendix H). It
measures an individual’s perceived mental health status.
8 Specifically, residence in East York, a borough of Toronto.
Chapter 3: Methods 32
Health Motivation
Five categories of health motivation were used in this study: 1) general health
motivation, 2) preventive health check-ups 3) natural health product (NHP) use (other than
calcium/vitamin D/multivitamins), 4) level of physical activity, and 5) smoking status.
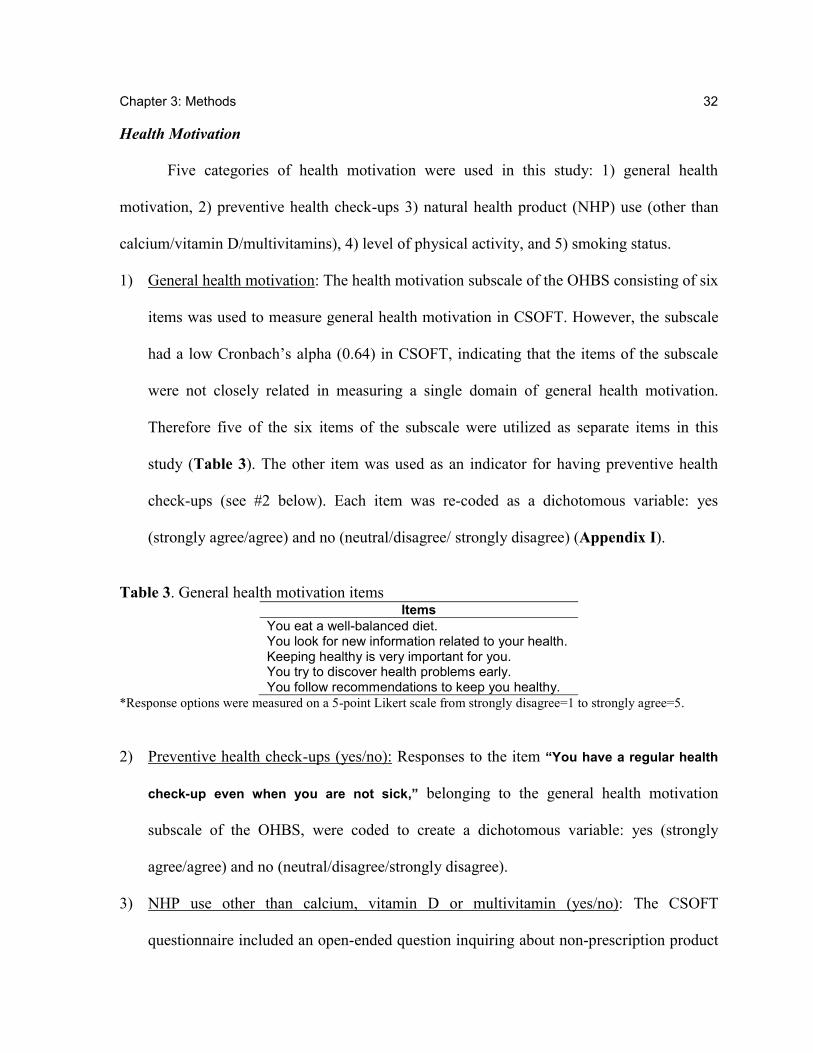
1) General health motivation: The health motivation subscale of the OHBS consisting of six
items was used to measure general health motivation in CSOFT. However, the subscale
had a low Cronbach’s alpha (0.64) in CSOFT, indicating that the items of the subscale
were not closely related in measuring a single domain of general health motivation.
Therefore five of the six items of the subscale were utilized as separate items in this
study (Table 3). The other item was used as an indicator for having preventive health
check-ups (see #2 below). Each item was re-coded as a dichotomous variable: yes
(strongly agree/agree) and no (neutral/disagree/ strongly disagree) (Appendix I).
Table 3. General health motivation items Items
You eat a well-balanced diet. You look for new information related to your health. Keeping healthy is very important for you. You try to discover health problems early. You follow recommendations to keep you healthy.
*Response options were measured on a 5-point Likert scale from strongly disagree=1 to strongly agree=5.
2) Preventive health check-ups (yes/no): Responses to the item “You have a regular health
check-up even when you are not sick,” belonging to the general health motivation
subscale of the OHBS, were coded to create a dichotomous variable: yes (strongly
agree/agree) and no (neutral/disagree/strongly disagree).
3) NHP use other than calcium, vitamin D or multivitamin (yes/no): The CSOFT
questionnaire included an open-ended question inquiring about non-prescription product
Chapter 3: Methods 33
use: “Are you currently taking any other supplement (other than calcium, vitamin D or
multivitamin), over-the-counter product or health food store preparation on most days of
the week?”. Responses to this question were not evaluated in CSOFT. For this thesis
study, responses were coded by the author according to the Canadian Natural Health
Products Regulations9 definition of NHPs [68]. The coding sheet was developed in
consultation with a naturopathic doctor (Appendix J). Only NHP use was examined and
products included were: chondroitin, glucosamine, methylsulfonylmethane, vitamins A-
C and E, iron, magnesium, potassium and zinc [69]. NHP use was coded as a
dichotomous variable: NHP use or not.
4) Level of physical activity: Three questions in the CSOFT questionnaire addressed
physical activity: a) “How many city blocks or their equivalent do you normally walk each
day?”, b) “What is your usual pace of walking?”, and c) “Please list any sports,
recreational or activities that you have actively participated in during the past year. Please
remember seasonal sports or events, and include use of self-propelled wheelchair,
walking, gardening, chores, etc.” Responses to these questions were also not evaluated in
CSOFT. For this study physical activity was coded by the author according to Canada’s
Physical Activity Guide to Healthy Active Living for Older Adults [70]. Type of
physical activity was grouped by the author as one of three categories: endurance,
strength/balance or flexibility; and the level of activity was coded as: target, moderate or
none (Appendix K). For this thesis, a single categorical variable was then created based
on the level and type of activity: 1) none (having no activity), moderate (meeting
9 NHPs were defined as OTC products that do not require a prescription and include vitamins and minerals,
herbal remedies, homeopathic medicines, traditional medicines (such as traditional Chinese medicines),
probiotics and other products (i.e., amino acids and essential fatty acids).
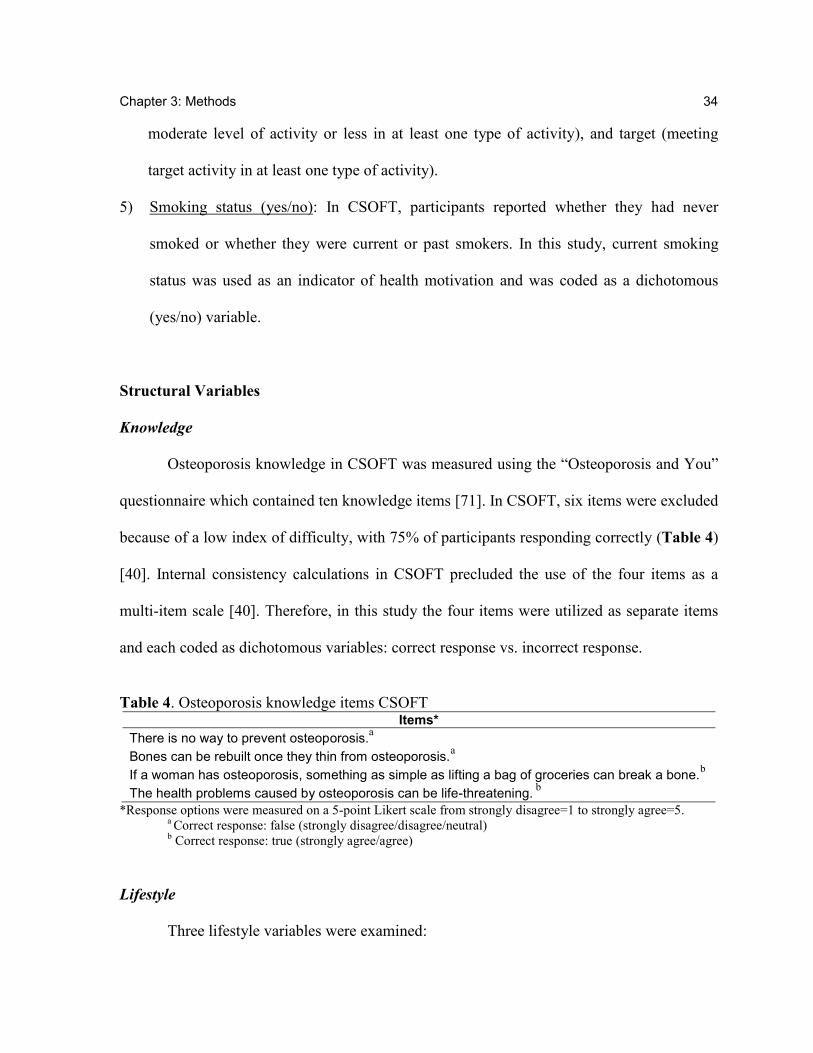
Chapter 3: Methods 34
moderate level of activity or less in at least one type of activity), and target (meeting
target activity in at least one type of activity).
5) Smoking status (yes/no): In CSOFT, participants reported whether they had never
smoked or whether they were current or past smokers. In this study, current smoking
status was used as an indicator of health motivation and was coded as a dichotomous
(yes/no) variable.
Structural Variables
Knowledge
Osteoporosis knowledge in CSOFT was measured using the “Osteoporosis and You”
questionnaire which contained ten knowledge items [71]. In CSOFT, six items were excluded
because of a low index of difficulty, with 75% of participants responding correctly (Table 4)
[40]. Internal consistency calculations in CSOFT precluded the use of the four items as a
multi-item scale [40]. Therefore, in this study the four items were utilized as separate items
and each coded as dichotomous variables: correct response vs. incorrect response.
Table 4. Osteoporosis knowledge items CSOFT Items*
There is no way to prevent osteoporosis.a
Bones can be rebuilt once they thin from osteoporosis.a
If a woman has osteoporosis, something as simple as lifting a bag of groceries can break a bone.b
The health problems caused by osteoporosis can be life-threatening. b
*Response options were measured on a 5-point Likert scale from strongly disagree=1 to strongly agree=5. a Correct response: false (strongly disagree/disagree/neutral)
b Correct response: true (strongly agree/agree)
Lifestyle
Three lifestyle variables were examined:
Chapter 3: Methods 35
1) Lactose intolerance (yes/no): Self-reported lactose intolerance was coded as a
dichotomous (yes/no) variable.
2) Adequate dietary calcium intake: In CSOFT, total dietary calcium intake (mg/day) was
calculated using the calcium calculator [72], based on responses regarding the amount of
milk, cheese and yogurt consumed. For this thesis, adequate dietary calcium intake was
coded as a dichotomous variable: met the recommended 2002 Canadian osteoporosis
guidelines daily calcium intake level of 1500 mg/day for postmenopausal women or not.
We also examined dietary calcium intake based on the 2010 recommended calcium
intake level. This variable was coded: met recommended 1200 mg/day or not. However,
this variable was not considered in regression modeling and was only used for
descriptive characteristics when examining the study sample, in order to better
understand whether the study sample was meeting current recommended calcium intake
levels.
3) Competing health conditions: The number of chronic conditions being treated by a
physician was categorized as none, one, or two or more conditions, based on data
frequency (Appendix L).
3.5.5 Cues to Action
Three categories of cues to action were considered: 1) osteoporosis risk factors, 2)
prior osteoporosis management, and 3) discussion with others about osteoporosis.
Osteoporosis Risk Factors
Five measures of risk factors related to osteoporosis were included:
Chapter 3: Methods 36
1) Maternal history (yes/no): of osteoporosis, osteopenia, low bone mass, stooping,
excessive height loss, kyphosis or any adult fracture.
2) Fall history (yes/no): Any self-reported fall in the past year.
3) Low trauma fracture history (yes/no): Fractures after the age of 40 years - coded as low
trauma fractures based on consensus by CSOFT investigators [53].
4) Height loss > 4 cm (yes/no): Self-reported height loss greater than 4cm, after the age of
25 years [73].
5) Early menopause (yes/no): Stop of menstruation before 45 years of age.
Prior Osteoporosis Management
Four measures of prior osteoporosis management were studied:
1) Osteoporosis diagnosis (yes/no): Based on responses to the CSOFT question “Has a
doctor ever told you that you have osteoporosis?”
2) Previous BMD test (yes/no): Self-reported BMD testing measured as a dichotomous
(yes/no) variable was used in this study as an indicator of prior osteoporosis management.
Validation studies in CSOFT identified that self-report of having had a BMD test is very
good (positive predictive value=93%, 95% CI=90.6-95.7; sensitivity=98%, 95%
CI=95.9-99.1; specificity=93%, 95% CI=89.8-95.4) [74, 75].
3) Current osteoporosis treatment: self-reported use of osteoporosis treatment was
considered. A recent linkage study identified very good agreement (kappa=0.81, 95%
CI=0.76-0.86) between self-reported osteoporosis pharmacotherapy and Ontario
pharmacy claims data [75]. In particular, etidronate therapy was the only prescription
drug available as a combination therapy with calcium during the period of CSOFT data
Chapter 3: Methods 37
collection [76]. Indeed, a validation study of CSOFT found that women reporting use of
etidronate therapy were using cyclical etidronate therapy (i.e., combination therapy with
calcium supplementation) -- high validity (kappa statistic=0.86, 95% CI=0.80-0.92) [76].
To differentiate between women treated for osteoporosis and receiving calcium from
those not taking combination calcium supplementation, the data were coded as a
categorical variable: no osteoporosis treatment, cyclical etidronate, or other osteoporosis
treatment (alendronate, risedronate, calcitonin and/or raloxifene).
4) Hormone therapy use (yes/no): Hormone therapy may be used as first-line therapy for the
prevention of hip, nonvertebral and vertebral fractures in menopausal women requiring
treatment of osteoporosis and vasomotor systems [1]. For this study, current hormone
therapy use was coded as a dichotomous (yes/no) variable.
Discussion with Others about Osteoporosis
Three variables were used to measure discussions about osteoporosis:
1) One CSOFT question asked whether participants had talked to family, friends, or health
care professionals about osteoporosis. For this study, responses to this question were
coded as two separate variables:
a. Talked with a pharmacist in the past year about osteoporosis (yes/no).
b. Talked to family or friends in the past year about osteoporosis (yes/no).
2) Another CSOFT question inquired about whether participants had discussed the
importance of calcium for bones or joints with a physician. Responses to this question
were coded as a dichotomous (yes/no) variable.
Chapter 3: Methods 38
3.5.6 Perceived Benefits of Calcium Supplementation
The calcium benefits subscale of the OHBS was used to measure a woman’s
perceived benefits to calcium intake in CSOFT. In CSOFT, the 5-item subscale (Table 5)
had high internal consistency with a Cronbach’s alpha value of 0.89 [59].
Table 5. Calcium benefits domain of OHBS in CSOFT questionnaire Items*
Taking in enough calcium prevents problems from osteoporosis. You have lots to gain from taking in enough calcium to prevent osteoporosis. Taking in enough calcium cuts down on your chances of broken bones. You feel good about yourself when you take in enough calcium to prevent osteoporosis. Taking in enough calcium cuts down the chances of getting osteoporosis.
*Response options were measured on a 5-point Likert scale from strongly disagree=1 to strongly agree=5.
3.5.7 Perceived Barriers to Calcium Supplementation
No items in CSOFT were direct measures of perceived barriers to calcium
supplementation. As a proxy, two items from the CSOFT questionnaire that inquired about
barriers to medications were included in this thesis: “You are taking too many medications”
and “You have stomach problems that limit your ability to take drug treatment.” Responses to
these two items were categorized dichotomously: yes (strongly agree/agree) or no
(neutral/disagree/strongly disagree). Since these two items are related to medication rather
than supplementation, they were flagged as being potentially poor measures of perceived
barriers to calcium supplementation.
3.6 Statistical Analyses
All analyses were performed using SAS (Statistical Analysis System) version 9.2
[77]. Descriptive statistics were used to describe the study sample, multi-item scale reliability
Chapter 3: Methods 39
was calculated to measure internal consistency of multi-item scales used in this thesis and
logistic regression modelling was completed to determine factors associated with calcium
supplement use. A detail of statistical analyses methods follows.
3.6.1 Descriptive Statistics
Descriptive characteristics summarized for the study sample included demographics,
dietary calcium intake and use of osteoporosis therapy. Categorical variables were
summarized as counts and proportions. Continuous variables were summarized as means and
standard deviations.
3.6.2 Multi-item Scale Reliability
The internal consistency of multi-item scales used in this study was assessed.
Cronbach’s alpha is a measure of internal consistency (reliability) for multi-item scales and
determines if items of the multi-item scale are measuring the same construct [78]. A
Cronbach’s alpha value between 0.65 and 0.70 is considered minimally acceptable, between
0.70 and 0.80 is considered respectable, greater than 0.80 is considered very good [78].
Although Cronbach’s alpha values were determined in CSOFT, the values were also
calculated in this study to account for the different study sample size since women reporting
past use of calcium supplements were excluded.
3.6.3 Logistic Regression Model Building Strategy
Several preliminary analyses were completed to inform the multivariable regression
model building. Regression diagnostics were examined to confirm that assumptions of
Chapter 3: Methods 40
logistic regression were being met. This included examining the frequency of nominal and
ordinal variables and the distribution of continuous variables in relation to the outcome
variable of calcium supplement use. Correlations between independent variables were also
determined to ensure collinearity was not present in the final logistic regression model.
Bivariate logistic regression was then utilized to examine the association between each
independent variable and the dependent variable, and determine variables to include in the
multivariable regression model.
3.6.3.1 Regression Model Diagnostics
3.6.3.1.1 Examination of Nominal and Ordinal Variables
Logistic regression analysis requires that at least one case be present for the possible
combinations between each nominal or ordinal variable and the dichotomous outcome
variable. That is, in a contingency table of the independent variable versus the outcome, no
zero cell should be present. A zero cell is problematic because it yields a point estimate of
either zero or infinity for the odds ratio of the variable in question, once in the regression
model [79]. Contingency tables were examined for each nominal and ordinal variables versus
the dichotomous outcome variable, to determine if any table resulted in a zero cell. Variables
with zero cells were excluded from the regression analysis.
3.6.3.1.2 Examination of Continuous Variables
Logistic regression analysis requires that continuous data fit the logit of the model
and that no influential observations exist in the data [80]. Including influential observations
biases coefficient estimates and can result in very large standard errors associated with the
Chapter 3: Methods 41
effect estimates, which may lead to invalid statistical inferences. Thus, the data distribution
for the four continuous variables (perceived susceptibility to osteoporosis score, perceived
benefits to calcium score, SF-36v2 physical functioning composite score and SF-36v2 mental
functioning composite score) were examined. Histograms, box-and-whisker and Pearson
residual plots were plotted. Histogram and box-and-whisker plots were examined to
determine kurtosis and skewness values and whether outliers were present in the data. The
Pearson residual plot, however, provides the most accurate evaluation of fit to the logit model
and identifies influential observations10
[81]. The residuals in the Pearson plot are the
difference between the observed and fitted values for the logit model. No pattern in the
Pearson residual plot indicates that the data fit the logit model and do not require
transformation. Residuals outside the range of ±3 are considered influential observations and
should be removed [81]. The Pearson residual plots were examined to determine whether
continuous data fit the logit and whether any influential observations were present in the
data.
3.6.3.2 Correlations Between Independent Variables
Logistic regression modeling assumes that collinearity does not exist in the
multivariable model [79]. Collinearity exists when there is high correlation between two or
more predictor variables in the multivariable model and can lead to large standard errors and
therefore an increase in type II error [81]. To avoid potential collinearity in the multivariable
model, the strengths of associations between independent variables were examined prior to
10
Influential observations are those that if removed substantially change the estimate of regression coefficients
in the output of the regression model.
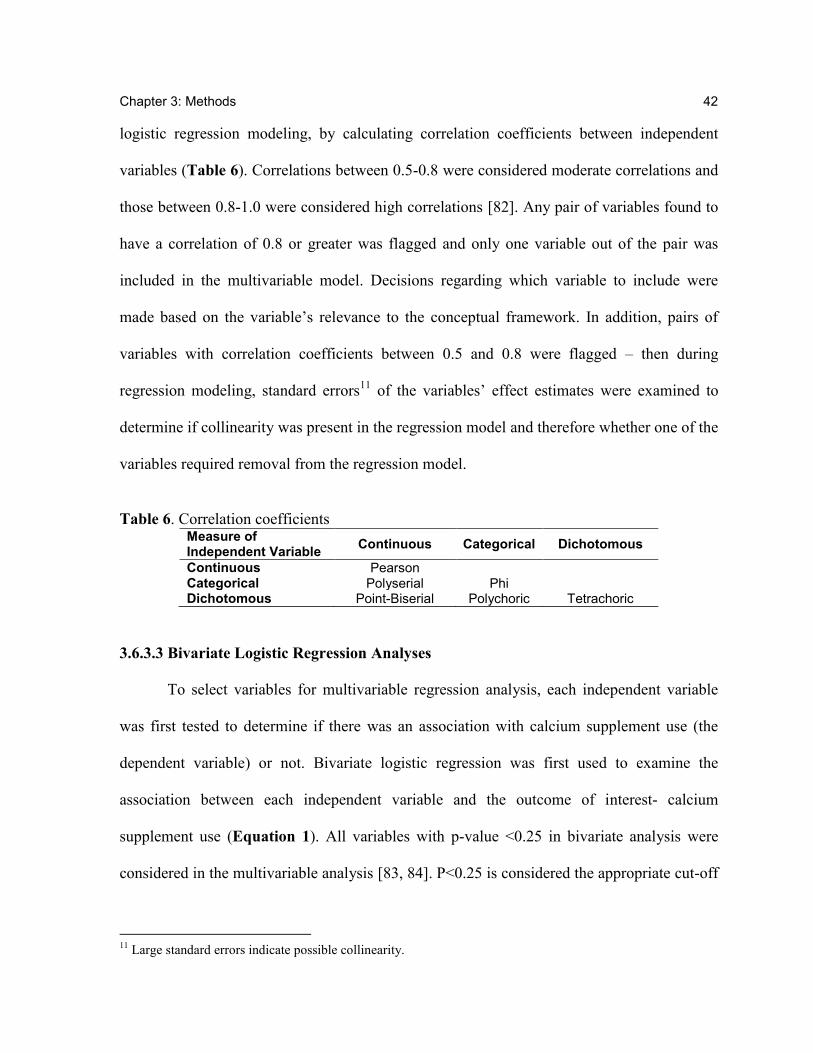
Chapter 3: Methods 42
logistic regression modeling, by calculating correlation coefficients between independent
variables (Table 6). Correlations between 0.5-0.8 were considered moderate correlations and
those between 0.8-1.0 were considered high correlations [82]. Any pair of variables found to
have a correlation of 0.8 or greater was flagged and only one variable out of the pair was
included in the multivariable model. Decisions regarding which variable to include were
made based on the variable’s relevance to the conceptual framework. In addition, pairs of
variables with correlation coefficients between 0.5 and 0.8 were flagged – then during
regression modeling, standard errors11
of the variables’ effect estimates were examined to
determine if collinearity was present in the regression model and therefore whether one of the
variables required removal from the regression model.
Table 6. Correlation coefficients Measure of Independent Variable
Continuous Categorical Dichotomous
Continuous Pearson Categorical Polyserial Phi Dichotomous Point-Biserial Polychoric Tetrachoric
3.6.3.3 Bivariate Logistic Regression Analyses
To select variables for multivariable regression analysis, each independent variable
was first tested to determine if there was an association with calcium supplement use (the
dependent variable) or not. Bivariate logistic regression was first used to examine the
association between each independent variable and the outcome of interest- calcium
supplement use (Equation 1). All variables with p-value <0.25 in bivariate analysis were
considered in the multivariable analysis [83, 84]. P<0.25 is considered the appropriate cut-off
11
Large standard errors indicate possible collinearity.
Chapter 3: Methods 43
value for considering variables into a multivariable regression analysis, leading to the best
predictive multivariable model [83, 84].
Equation 1: Logistic regression equation that examines the association between an
independent variable and calcium supplement use ca*- calcium supplement use (1=yes, 0=no)
3.6.3.4 Multivariable Logistic Regression Analysis
Multivariable logistic regression was used to estimate the probability of using calcium
supplements, given a woman’s perceptions of osteoporosis susceptibility and seriousness,
personal factors, cues to action, and perceptions of calcium benefits and barriers to calcium
supplement use. The regression diagnostics, correlations and bivariate analyses were used to
inform a theory-driven manual backward stepwise approach, in order to find the best reduced
model that explained the data [81]. The following steps were applied:
1) All variables with a p-value <0.25 associated with the regression coefficient, from the
bivariate analyses were considered in the multivariable model. In addition, it was
important that at least one variable from each of the five main HBM components12
was
included in the multivariable model: perceived susceptibility, perceived seriousness,
personal factors (demographics or sociopsychological or lifestyle factors), cues to action
and perceived benefits (Equation 2). If no variable from one or more of the five main
HBM components had a p<0.25 for the regression coefficient from bivariate results, then
the variable with the closest level of significance was included (forced) in the
12
As explained earlier, the self-efficacy component of the HBM was not examined because no variables were
available as a measure of the component. The two items used as proxies for the perceived barriers component
were not forced into the model because it was determined a priori that the items may not be good measures for
the HBM component.
logit(ca*) = β0 + β1(independent variable)1
Chapter 3: Methods 44
multivariable regression model regardless of statistical significance level. These variables
constituted the preliminary multivariable model.
Equation 2: Example preliminary multivariable logistic regression model for
analysis of calcium supplement users vs. non-users ca*- calcium supplement use (1=yes, 0=no)
2) A manual backward stepwise elimination method was then utilized to determine the
final main effects model based on exclusion criteria outlined in steps 2a and 2b, which
were used concurrently:
a. Statistical significance of regression coefficient. The statistical significance of
each variable in the multivariable model was examined and variables were
removed in sequence starting with the largest associated p-value, until only
statistically significant variables (p<0.05) remained. The only exception was that
a minimum of one variable for each of the five main HBM components (other
than self-efficacy and perceived barriers) was required in the final regression
model.
b. Level of relevance to the HBM. If two variables had similar p-values, the one less
relevant to the HBM was eliminated first. Similarly, if a variable’s regression
coefficient had an associated p-value on the borderline of statistical significance
(i.e., close to p=0.05), the variable’s relevance to the HBM was assessed to
determine whether it should be removed from the model or not.
A stepwise approach was also used, by which variables at the borderline of
significance were placed back into the regression model, once other variables were removed
logit(ca*) = β0 + β1(susceptibility)1 + β2(seriousness)2 + β3(personal factor)3 + β4(cues to action)4 + β5(calcium benefits)5 + p<0.25 variables from bivariate analyses
Chapter 3: Methods 45
to determine if significance was reached. If the variable did not reach the significance level,
once placed back into the regression model then the variable was removed.
To determine the predictive ability of the logistic regression model, the c-statistic was
examined. In logistic regression, the c-statistic is equivalent to the area under the receiver
operating characteristic (ROC) curve. The ROC curve is a plot of sensitivity vs. 1-specificity,
and the area under this curve (c-statistic) quantifies the logistic regression model’s power to
discriminate between calcium supplement users and non-users [85]. The c-statistic ranges
from 0.5-1, where a value of 0.5 indicates that the discriminating power is no better than
random chance, and a value of 1 indicates perfect discriminating power [85].
The variance explained by the model was also examined. In logistic regression,
several pseudo-R2
values can be calculated to determine the variance explained by the model
[86]. The pseudo-R2 calculated by the statistical software used, SAS, is the Nagelkerke’s R
2.
When comparing two logistic regression models, the model with the higher Nagelkerke’s R2
is the model that better predicts the outcome [86]. Nagelkerke’s R2 was used to compare the
preliminary multivariable model to the final main effects multivariable model.
3.6.3.4.1 Sensitivity Analysis
A sensitivity analysis was completed to determine if any possible HBM factors
associated with calcium supplement use were lost significance when building the model
based on the HBM (as per step 2b). A second logistic multivariable regression model was
constructed using steps 1 and 2a above, but relevance of the variables to the HBM was not
considered. Variables were removed in sequence starting with variables having the largest
Chapter 3: Methods 46
statistically non-significant regression coefficients, regardless of representation of the HBM
components.
3.7 Study Power and Type I/ Type II Error
Study power was calculated to minimize type II error. To ensure adequate study
power when using logistic regression, a 10:1 ratio of number of responses to number of
variables [87, 88] is required. Data were available on 364 “never users” and 434 “current
users.” Therefore, based on the smaller group (never users) and the 10:1 ratio, there was
enough study power to identify 36 predictors in the final main effects regression model.
Furthermore, our careful consideration of variables based on the conceptual framework
helped reduce the potential to find statistical significance by chance alone, that may
otherwise have occurred by including all variables in a model without effort to restrict to
those with conceptual plausibility.
3.8 Ethical Considerations
Ethical approval for the original CSOFT project was granted by the Sunnybrook and
Women’s College Health Science Research Ethics Board (Research Ethics Board project
identification #: 087-2003). Anonymous data are now stored on a password-protected secure
server at the Leslie L. Dan Pharmacy building at the University of Toronto. Ethics approval
for this thesis study was granted by the Health Sciences Research Ethics Board at the
University of Toronto (Protocol Reference # 25661).
Chapter 4: Results
47
Chapter 4: Results
The results for this thesis work are presented in this chapter. The chapter begins with
a description of the study sample and internal consistency of multi-item scales. Regression
diagnostics, including the examination of independent variables in meeting logistic
regression assumptions are then presented. The last part of the chapter includes the regression
results, with a presentation of results from the bivariate analyses followed by results from the
multivariable and sensitivity analyses.
4.1 Sample Characteristics
The CSOFT dataset consisted of 871 community-dwelling women from Ontario.
After excluding women that reported use of calcium supplements in the past but not currently
using calcium supplements (n=73), the total sample size for this study was 798 (mean
age=75.4, SD=6.1) (Figure 3). The study sample was 96% Caucasian, with 48% residing in
Toronto at the time of data collection. Fifty-four percent of the study sample reported to have
been living alone and 45% were married or in a common law relationship. Only 23% of the
total study sample reported having a post-secondary education.
Of the 798 respondents, 434 reported regular use of calcium supplements (54%)
(Table 7). Only 2.5% of the study sample reported dietary calcium intake that was calculated
as meeting the 2002 recommended calcium intake level of 1500 mg/day from dietary calcium
intake alone, while 9% of the study sample reported dietary calcium intake that met the 2010
recommended calcium intake level of 1200 mg/day (Table 7).

Chapter 4: Results 48
48
4.2 Internal Consistency
Internal consistency, measured by Cronbach’s alpha, determines the reliability of the
items of a multi-item scale in measuring the same concept [78]. Although internal
consistency was examined for the multi-item scales in CSOFT, it was important to also
examine internal consistency in this thesis, given the change in sample size (i.e., after
excluding the 73 past calcium supplement users for a total sample size of n=798). Four multi-
item scales were examined in this study: perceived susceptibility to osteoporosis subscale of
the OHBS, perceived benefits to calcium subscale of the OHBS, SF-36v2 physical health
functioning multi-item scales and the SF-36v2 mental health functioning multi-item scales.
The perceived susceptibility to osteoporosis subscale of the OHBS had a Cronbach
alpha value of 0.90 in this study (n=798), which was equivalent to the Cronbach alpha value
of 0.90 determined in CSOFT (n=871). Therefore, this scale had very good internal
consistency and was a reliable measure for perceived susceptibility to osteoporosis.
Similarly, the perceived benefits to calcium subscale of the OHBS had a Cronbach’s alpha
value of 0.90 in this study (compared to 0.89 in CSOFT), and thus was determined to be a
very good measure of perceived benefits to calcium.
Items of the multi-item scales comprising the physical functioning composite score
have been shown to have very good reliability (Cronbach’s alpha=0.92) [67], as well as those
comprising the mental functioning composite score (Cronbach’s alpha=0.88) [67] (Appendix
H).
Thus, the perceived susceptibility to osteoporosis subscale of the OHBS, perceived
benefits to calcium subscale of the OHBS, SF-36v2 physical health functioning multi-item
Chapter 4: Results 49
49
scales and the SF-36v2 mental health functioning multi-items scales were deemed
sufficiently reliable to be used in this thesis as multi-item scales.
4.3 Regression Model Diagnostics
Independent variable distribution and frequency was examined and correlations
between independent variables were calculated to determine if logistic regression
assumptions were met.
4.3.1 Examination of Nominal and Ordinal Variables
An examination of contingency tables for the outcome versus each nominal and
ordinal variable in this study resulted in no table yielding a zero cell. Therefore, all 42
nominal and ordinal variables of this study were acceptable for use in the regression
analyses.
4.3.2 Examination of Continuous Variables
The distribution of data was examined for the four continuous variables: perceived
susceptibility to osteoporosis score, perceived benefits to calcium score, SF-36v2 physical
health functioning composite score and SF-36v2 mental health functioning composite score.
The histogram and box-and-whisker plots for the perceived susceptibility to
osteoporosis scores indicated mild skewness in the data (skewness=0.74) and no presence of
outliers (Figure 4). The residuals in the Pearson residual plot lay in a horizontal band with no
indication of a curvature pattern and therefore suggested that the scores were appropriate to
use in logistic regression. In addition, all the residuals in the Pearson residual plot were
Chapter 4: Results 50
50
between -3 and +2 (Figure 5) and therefore no data points were considered influential
observations. It was thus concluded that the perceived susceptibility to osteoporosis scores
did not require transformation to fit the logit model and did not contain any influential
observations.
The distribution of the perceived benefits to calcium scores was mildly skewed
(skewness=-1.25) (Figure 6). The Pearson residual plot of the perceived benefits to calcium
scores showed that there were influential observations in the data, with residuals ranging
from +7 to -4 (Figure 7). Influential observations (n=22), were removed and this was
deemed appropriate because the influential observations comprised less than 5% of the total
data. The resulting Pearson residual plot with removed influential observations yielded all
residuals within the range of -3 to +3. (Figure 8 and Figure 9).
The SF-36v2 physical composite score had a kurtosis value of -1.0 and skewness
value of 0.44, indicating slight negative skewness in the data (Figure 10). The histogram and
box-and-whisker plots, did not indicate any outliers in the data. The Pearson residual plot for
the SF-36v2 physical composite score had residuals between -2 and +1 with no indication of
curvature, indicating no presence of influential observations or need to transform the scores
(Figure 11).
The SF-36v2 mental functioning composite score had slight negative skewness
(skewness=-0.4), and the histogram and box-and-whisker plots indicated the presence of
outliers in the data (Figure 12). However, the Pearson residual plot (Figure 13) showed that
there were no influential observations in the data (with all residuals being within the range of
-2 and +2), and no indication of curvature. Therefore, the SF-36v2 mental functioning
Chapter 4: Results 51
51
composite score fit the logit transformation of logistic regression and had no observations
that would substantially change the estimate of the regression coefficient.
Hence, all four scores were suitable to use with the logit transformation given in
logistic regression modeling (i.e., no curvature in Pearson residual plots). Only the perceived
benefits to calcium score had influential data points that required removal, and the other three
scores were appropriate for use in regression analyses, without requiring removal of data
points.
4.3.3 Correlations
To minimize the existence of collinearity in the final multivariable model,
correlations between independent variables were examined prior to bivariate and
multivariable analyses. The largest correlation was found between perceived susceptibility to
osteoporosis and self-report of osteoporosis diagnosis (point-biseral correlation
coefficient=0.88) (Table 8), and was deemed to be a high correlation. It was therefore
important to only include one of the two variables in the multivariable regression model.
Perceived susceptibility to osteoporosis was the only variable in this study representing the
perceived susceptibility component of the HBM, and was therefore required for inclusion in
the multivariable model, as per the a priori regression model building strategy proposed in
this thesis (see section 3.6.3.4). In addition, a CSOFT validation study identified that self-
reported osteoporosis diagnosis was poor, with only 60% confirmed to have osteoporosis as
identified through BMD patient reports of women reporting osteoporosis diagnosis [74].
Hence, the self-reported osteoporosis diagnosis variable was not considered in regression
analyses because of concerns about its validity.
Chapter 4: Results 52
52
Correlations greater than or equal to 0.5 included:
current osteoporosis treatment and:
o i) previous BMD testing (r=0.73),
o ii) discussion with a physician about the importance of calcium for bone
(r=0.65); and
ethnicity and residence in Toronto (r=-0.70);
previous BMD testing and a discussion with a physician about the importance of
calcium for bone (r=0.70);
preventive health check-ups and the general health motivation item “Keeping healthy
is important to you” (r=0.64);
the two proxy items for perceived barriers to calcium: stomach problems and
perception of taking too many medications (r=0.52).
4.4 Logistic Regression Model Building
4.4.1 Bivariate Analyses
The bivariate results identified factors associated with calcium supplement use (Table
9). Calcium supplement users were similar to non-users with regards to age, primary spoken
language, annual income and living arrangements. A greater proportion of calcium
supplement users had a post-secondary education and significantly more users resided in
Toronto (the metropolitan region).
At least one variable from each of the five main HBM components was found to be a
significant correlate of calcium supplement use (p<0.25). Effect estimates for twelve
variables were found to have p>0.25 and therefore were not considered in the multivariable
Chapter 4: Results 53
53
regression model: the osteoporosis seriousness items: “If you had osteoporosis you would be
crippled,” “Your feelings about yourself would change if you got osteoporosis,” and “It
would be serious if you got osteoporosis”; current living arrangements; general perceived
health status; SF-36v2 physical functioning composite score; SF-36v2 mental functioning
composite score; smoking status, meeting calcium intake level of 1500 mg/day, early
menopause; competing health conditions; and perception of taking too many medications.
The 33 variables that had significant association (p<0.25) with calcium supplement use from
the bivariate analyses were considered in the multivariable regression model.
4.4.2 Multivariable Analysis
Given that 22 influential observations were identified for the perceived benefits to
calcium score, these participants were excluded from the multivariable model, leaving 776
participants in the final model. Contingency tables of each nominal and ordinal variable
versus the outcome were again examined to determine if any table yielded a zero cell; and the
general health motivation item “Keeping healthy is important to you,” was thus removed. The
preliminary effects model therefore consisted of 32 independent variables.
After backward stepwise regression analysis, the final effects model consisted of ten
predictor variables (Table 10). Eight variables were positively associated with calcium
supplement use: perceived susceptibility to osteoporosis, perceived benefits of calcium,
residence in Toronto, NHP use, self-reported previous BMD test, fall in the past year,
discussion with the physician about importance of calcium for bone and a discussion with a
pharmacist about osteoporosis in the past year. Current treatment with etidronate was
negatively associated with calcium supplement use. The perceived seriousness to
Chapter 4: Results 54
54
osteoporosis item “It would be very costly if you got osteoporosis,” was the only HBM
variable not significantly associated with calcium supplement use. The final regression model
had a c-statistic of 0.88, and therefore had outstanding discriminatory power [79] in
differentiating calcium supplement users from non-users.
Individuals perceiving a greater susceptibility to osteoporosis were more likely to
take calcium supplements, with women about 1.1 times more likely to use calcium
supplements for every one unit increase in the perceived susceptibility to osteoporosis score.
The only demographic variable associated with calcium supplement use was region of
residence, with women residing in Toronto 1.5 times more likely to use calcium supplements,
although this association was on the borderline of significance with a p=0.048. The only
sociopsychological variable that was associated with calcium supplement use was the use of
NHPs other than calcium/vitamin D/multivitamins (OR=1.8).
Cues to action variables were important to calcium supplement use, with five out of
the nine statistically significant variables in the final regression model being cues to action
variables. Women who had experienced a fall in the past year were 1.6 times more to use
calcium supplements than those who did not experience the fall, and those who had a
previous BMD test had about 1.7 times greater odds of being users of calcium supplements.
Women being treated for osteoporosis with etidronate were less likely (OR=0.16) than those
not taking treatment to use calcium supplements. The likelihood of this decreased drastically
from bivariate results, compared to the multivariable result (i.e., bivariate OR=0.98,
multivariable OR=0.16). Furthermore, women who had a discussion with a physician about
the importance of calcium for bone were 3.6 times more likely to be using calcium
supplements, compared to those who did not have the discussion with their physician.
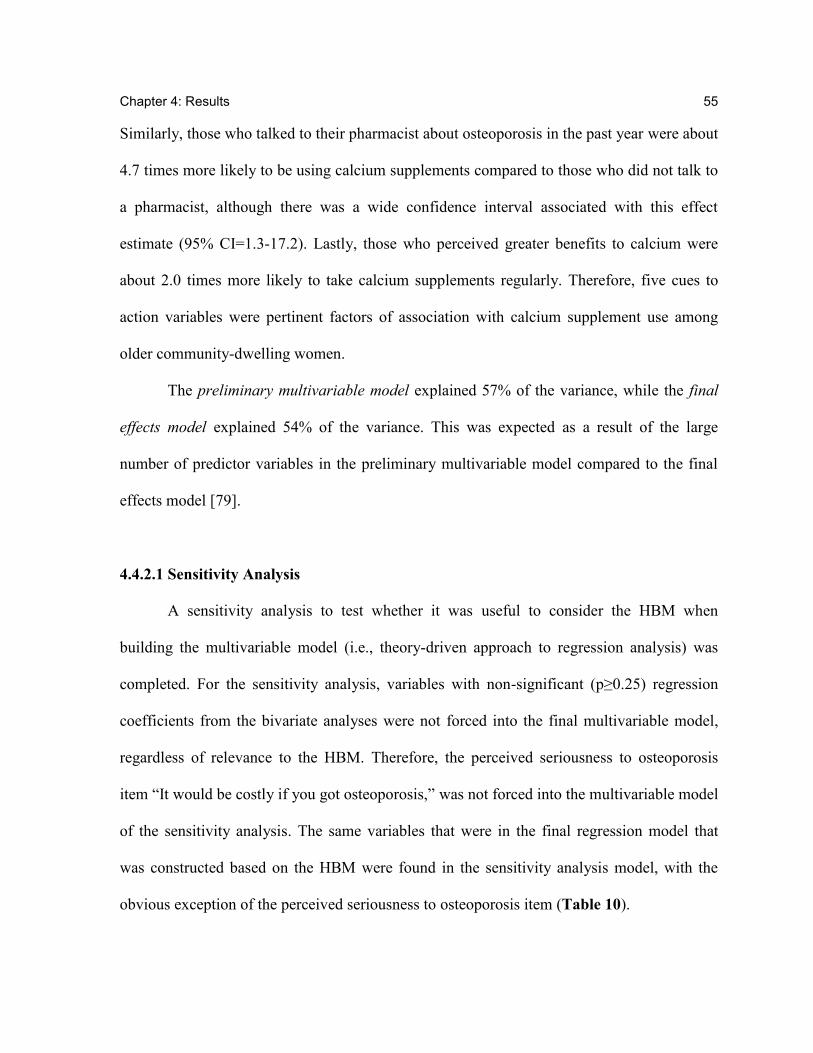
Chapter 4: Results 55
55
Similarly, those who talked to their pharmacist about osteoporosis in the past year were about
4.7 times more likely to be using calcium supplements compared to those who did not talk to
a pharmacist, although there was a wide confidence interval associated with this effect
estimate (95% CI=1.3-17.2). Lastly, those who perceived greater benefits to calcium were
about 2.0 times more likely to take calcium supplements regularly. Therefore, five cues to
action variables were pertinent factors of association with calcium supplement use among
older community-dwelling women.
The preliminary multivariable model explained 57% of the variance, while the final
effects model explained 54% of the variance. This was expected as a result of the large
number of predictor variables in the preliminary multivariable model compared to the final
effects model [79].
4.4.2.1 Sensitivity Analysis
A sensitivity analysis to test whether it was useful to consider the HBM when
building the multivariable model (i.e., theory-driven approach to regression analysis) was
completed. For the sensitivity analysis, variables with non-significant (p≥0.25) regression
coefficients from the bivariate analyses were not forced into the final multivariable model,
regardless of relevance to the HBM. Therefore, the perceived seriousness to osteoporosis
item “It would be costly if you got osteoporosis,” was not forced into the multivariable model
of the sensitivity analysis. The same variables that were in the final regression model that
was constructed based on the HBM were found in the sensitivity analysis model, with the
obvious exception of the perceived seriousness to osteoporosis item (Table 10).
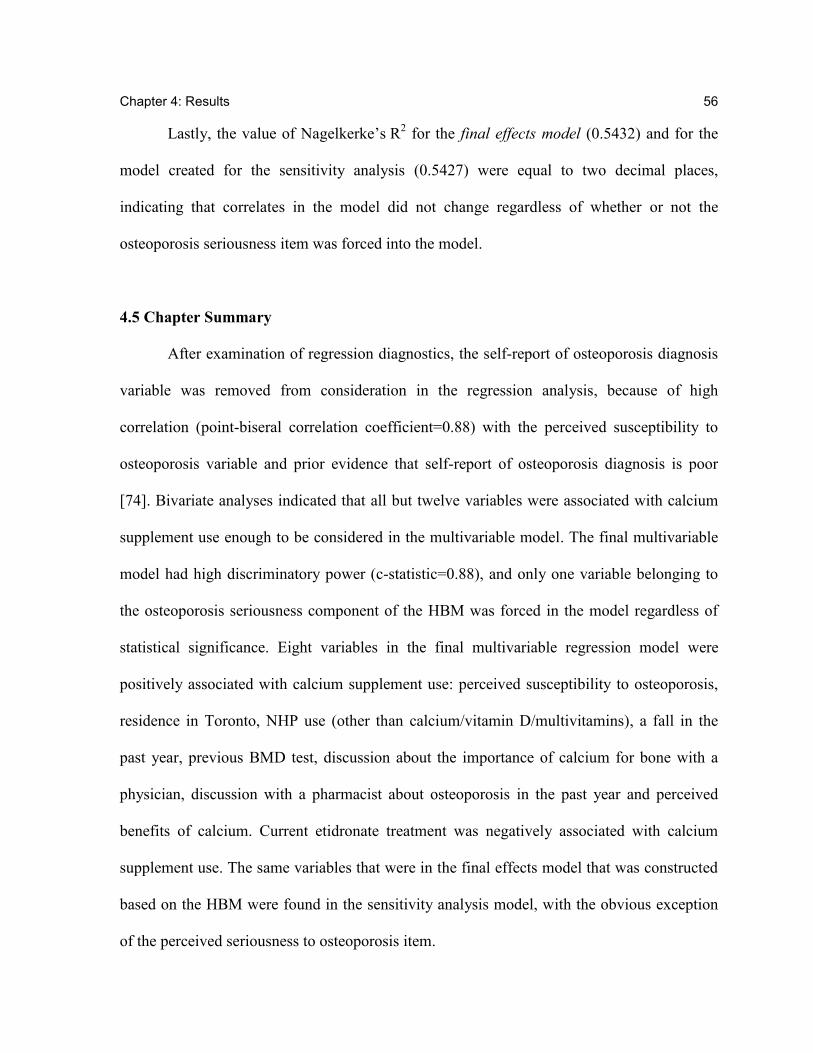
Chapter 4: Results 56
56
Lastly, the value of Nagelkerke’s R2 for the final effects model (0.5432) and for the
model created for the sensitivity analysis (0.5427) were equal to two decimal places,
indicating that correlates in the model did not change regardless of whether or not the
osteoporosis seriousness item was forced into the model.
4.5 Chapter Summary
After examination of regression diagnostics, the self-report of osteoporosis diagnosis
variable was removed from consideration in the regression analysis, because of high
correlation (point-biseral correlation coefficient=0.88) with the perceived susceptibility to
osteoporosis variable and prior evidence that self-report of osteoporosis diagnosis is poor
[74]. Bivariate analyses indicated that all but twelve variables were associated with calcium
supplement use enough to be considered in the multivariable model. The final multivariable
model had high discriminatory power (c-statistic=0.88), and only one variable belonging to
the osteoporosis seriousness component of the HBM was forced in the model regardless of
statistical significance. Eight variables in the final multivariable regression model were
positively associated with calcium supplement use: perceived susceptibility to osteoporosis,
residence in Toronto, NHP use (other than calcium/vitamin D/multivitamins), a fall in the
past year, previous BMD test, discussion about the importance of calcium for bone with a
physician, discussion with a pharmacist about osteoporosis in the past year and perceived
benefits of calcium. Current etidronate treatment was negatively associated with calcium
supplement use. The same variables that were in the final effects model that was constructed
based on the HBM were found in the sensitivity analysis model, with the obvious exception
of the perceived seriousness to osteoporosis item.
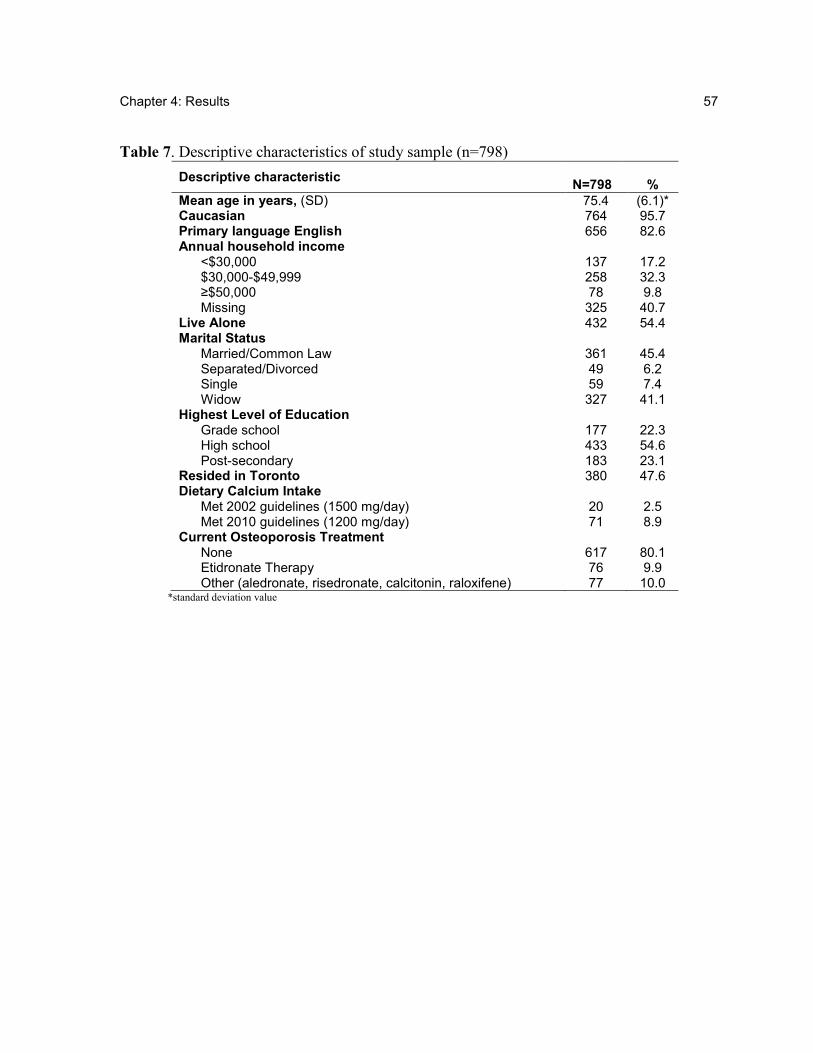
Chapter 4: Results 57
57
Table 7. Descriptive characteristics of study sample (n=798)
Descriptive characteristic
N=798 %
Mean age in years, (SD) 75.4 (6.1)* Caucasian 764 95.7 Primary language English 656 82.6 Annual household income
<$30,000 137 17.2 $30,000-$49,999 258 32.3 ≥$50,000 78 9.8 Missing 325 40.7
Live Alone 432 54.4 Marital Status
Married/Common Law 361 45.4 Separated/Divorced 49 6.2 Single 59 7.4 Widow 327 41.1
Highest Level of Education Grade school 177 22.3 High school 433 54.6 Post-secondary 183 23.1
Resided in Toronto 380 47.6 Dietary Calcium Intake
Met 2002 guidelines (1500 mg/day) 20 2.5 Met 2010 guidelines (1200 mg/day) 71 8.9
Current Osteoporosis Treatment None 617 80.1 Etidronate Therapy 76 9.9 Other (aledronate, risedronate, calcitonin, raloxifene) 77 10.0
*standard deviation value
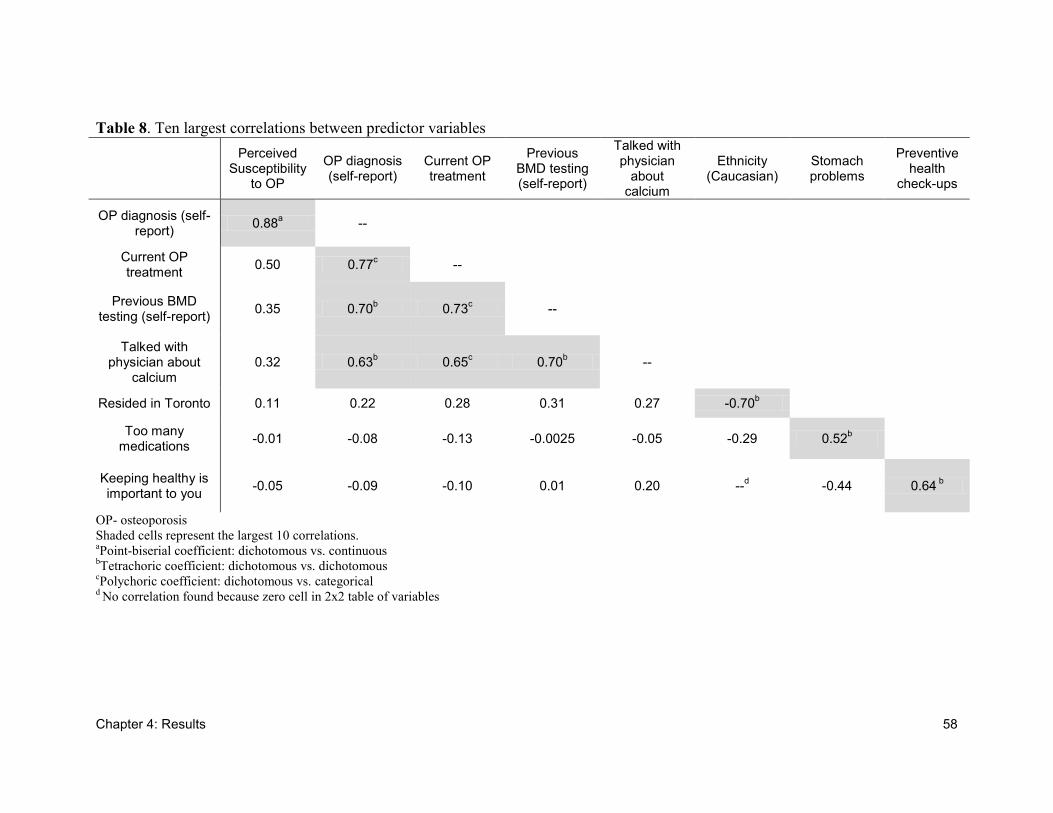
Chapter 4: Results 58
Table 8. Ten largest correlations between predictor variables
Perceived
Susceptibility to OP
OP diagnosis (self-report)
Current OP treatment
Previous BMD testing (self-report)
Talked with physician
about calcium
Ethnicity (Caucasian)
Stomach problems
Preventive health
check-ups
OP diagnosis (self-report)
0.88a --
Current OP treatment
0.50 0.77c --
Previous BMD testing (self-report)
0.35 0.70b 0.73
c --
Talked with physician about
calcium 0.32 0.63
b 0.65
c 0.70
b --
Resided in Toronto 0.11 0.22 0.28 0.31 0.27 -0.70b
Too many medications
-0.01 -0.08 -0.13 -0.0025 -0.05 -0.29 0.52b
Keeping healthy is important to you
-0.05 -0.09 -0.10 0.01 0.20 --d -0.44 0.64
b
OP- osteoporosis
Shaded cells represent the largest 10 correlations. aPoint-biserial coefficient: dichotomous vs. continuous
bTetrachoric coefficient: dichotomous vs. dichotomous
cPolychoric coefficient: dichotomous vs. categorical
d No correlation found because zero cell in 2x2 table of variables
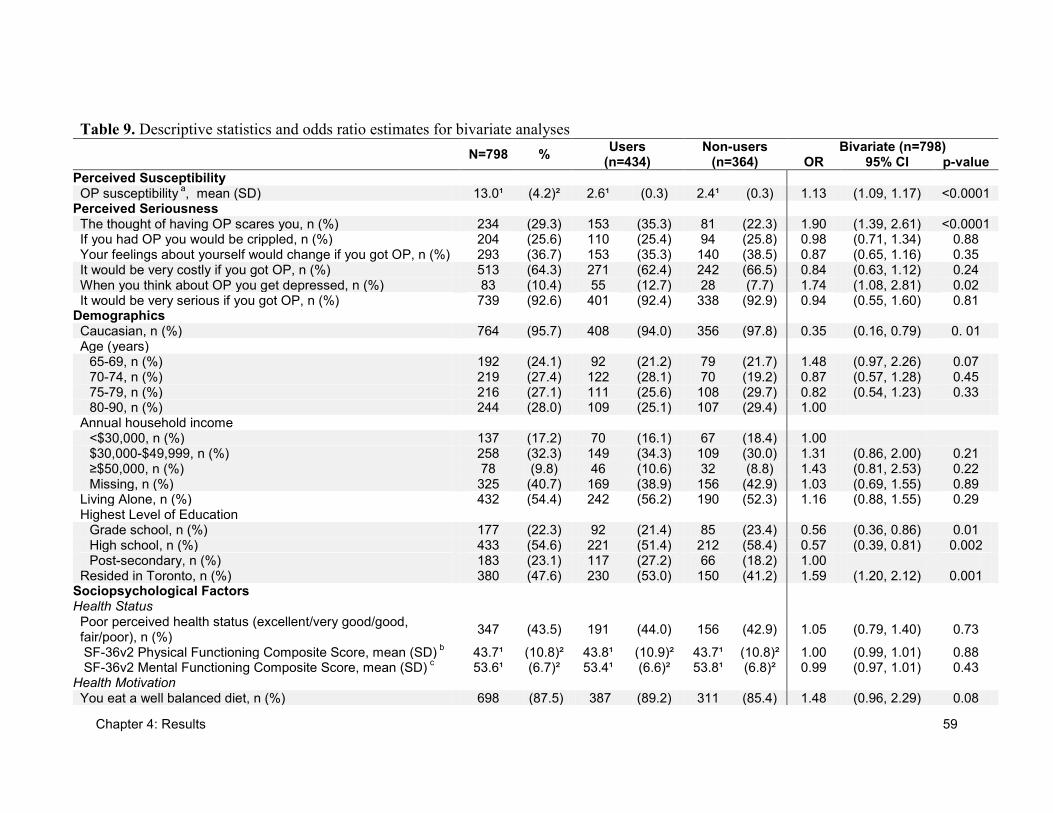
Chapter 4: Results 59
Table 9. Descriptive statistics and odds ratio estimates for bivariate analyses
N=798 % Users
(n=434) Non-users
(n=364) Bivariate (n=798)
OR 95% CI p-value
Perceived Susceptibility OP susceptibility
a, mean (SD) 13.0¹ (4.2)² 2.6¹ (0.3) 2.4¹ (0.3) 1.13 (1.09, 1.17) <0.0001
Perceived Seriousness The thought of having OP scares you, n (%) 234 (29.3) 153 (35.3) 81 (22.3) 1.90 (1.39, 2.61) <0.0001 If you had OP you would be crippled, n (%) 204 (25.6) 110 (25.4) 94 (25.8) 0.98 (0.71, 1.34) 0.88 Your feelings about yourself would change if you got OP, n (%) 293 (36.7) 153 (35.3) 140 (38.5) 0.87 (0.65, 1.16) 0.35 It would be very costly if you got OP, n (%) 513 (64.3) 271 (62.4) 242 (66.5) 0.84 (0.63, 1.12) 0.24 When you think about OP you get depressed, n (%) 83 (10.4) 55 (12.7) 28 (7.7) 1.74 (1.08, 2.81) 0.02 It would be very serious if you got OP, n (%) 739 (92.6) 401 (92.4) 338 (92.9) 0.94 (0.55, 1.60) 0.81
Demographics Caucasian, n (%) 764 (95.7) 408 (94.0) 356 (97.8) 0.35 (0.16, 0.79) 0. 01 Age (years)
65-69, n (%) 192 (24.1) 92 (21.2) 79 (21.7) 1.48 (0.97, 2.26) 0.07 70-74, n (%) 219 (27.4) 122 (28.1) 70 (19.2) 0.87 (0.57, 1.28) 0.45 75-79, n (%) 216 (27.1) 111 (25.6) 108 (29.7) 0.82 (0.54, 1.23) 0.33 80-90, n (%) 244 (28.0) 109 (25.1) 107 (29.4) 1.00
Annual household income <$30,000, n (%) 137 (17.2) 70 (16.1) 67 (18.4) 1.00 $30,000-$49,999, n (%) 258 (32.3) 149 (34.3) 109 (30.0) 1.31 (0.86, 2.00) 0.21 ≥$50,000, n (%) 78 (9.8) 46 (10.6) 32 (8.8) 1.43 (0.81, 2.53) 0.22 Missing, n (%) 325 (40.7) 169 (38.9) 156 (42.9) 1.03 (0.69, 1.55) 0.89
Living Alone, n (%) 432 (54.4) 242 (56.2) 190 (52.3) 1.16 (0.88, 1.55) 0.29 Highest Level of Education
Grade school, n (%) 177 (22.3) 92 (21.4) 85 (23.4) 0.56 (0.36, 0.86) 0.01 High school, n (%) 433 (54.6) 221 (51.4) 212 (58.4) 0.57 (0.39, 0.81) 0.002 Post-secondary, n (%) 183 (23.1) 117 (27.2) 66 (18.2) 1.00
Resided in Toronto, n (%) 380 (47.6) 230 (53.0) 150 (41.2) 1.59 (1.20, 2.12) 0.001 Sociopsychological Factors Health Status Poor perceived health status (excellent/very good/good, fair/poor), n (%)
347 (43.5) 191 (44.0) 156 (42.9) 1.05 (0.79, 1.40) 0.73
SF-36v2 Physical Functioning Composite Score, mean (SD) b 43.7¹ (10.8)² 43.8¹ (10.9)² 43.7¹ (10.8)² 1.00 (0.99, 1.01) 0.88
SF-36v2 Mental Functioning Composite Score, mean (SD) c 53.6¹ (6.7)² 53.4¹ (6.6)² 53.8¹ (6.8)² 0.99 (0.97, 1.01) 0.43
Health Motivation You eat a well balanced diet, n (%) 698 (87.5) 387 (89.2) 311 (85.4) 1.48 (0.96, 2.29) 0.08
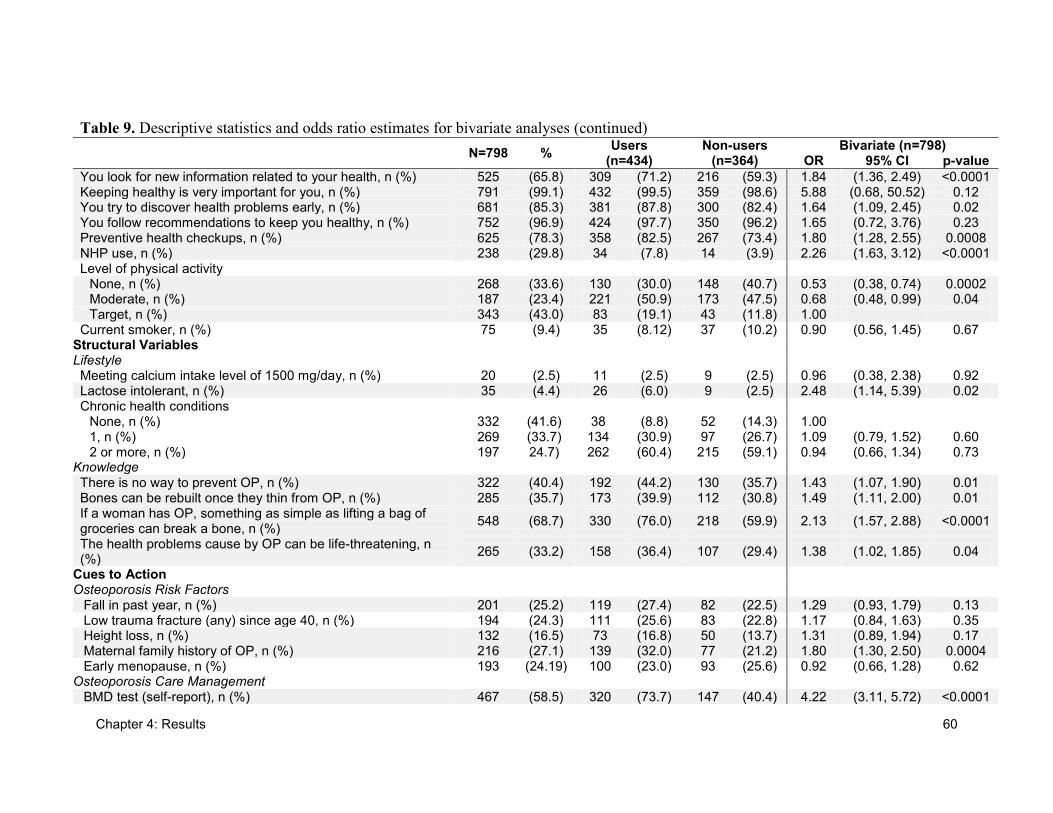
Chapter 4: Results 60
Table 9. Descriptive statistics and odds ratio estimates for bivariate analyses (continued)
N=798 %
Users (n=434)
Non-users (n=364)
Bivariate (n=798) OR 95% CI p-value
You look for new information related to your health, n (%) 525 (65.8) 309 (71.2) 216 (59.3) 1.84 (1.36, 2.49) <0.0001 Keeping healthy is very important for you, n (%) 791 (99.1) 432 (99.5) 359 (98.6) 5.88 (0.68, 50.52) 0.12 You try to discover health problems early, n (%) 681 (85.3) 381 (87.8) 300 (82.4) 1.64 (1.09, 2.45) 0.02 You follow recommendations to keep you healthy, n (%) 752 (96.9) 424 (97.7) 350 (96.2) 1.65 (0.72, 3.76) 0.23 Preventive health checkups, n (%) 625 (78.3) 358 (82.5) 267 (73.4) 1.80 (1.28, 2.55) 0.0008 NHP use, n (%) 238 (29.8) 34 (7.8) 14 (3.9) 2.26 (1.63, 3.12) <0.0001 Level of physical activity
None, n (%) 268 (33.6) 130 (30.0) 148 (40.7) 0.53 (0.38, 0.74) 0.0002 Moderate, n (%) 187 (23.4) 221 (50.9) 173 (47.5) 0.68 (0.48, 0.99) 0.04 Target, n (%) 343 (43.0) 83 (19.1) 43 (11.8) 1.00
Current smoker, n (%) 75 (9.4) 35 (8.12) 37 (10.2) 0.90 (0.56, 1.45) 0.67 Structural Variables Lifestyle Meeting calcium intake level of 1500 mg/day, n (%) 20 (2.5) 11 (2.5) 9 (2.5) 0.96 (0.38, 2.38) 0.92 Lactose intolerant, n (%) 35 (4.4) 26 (6.0) 9 (2.5) 2.48 (1.14, 5.39) 0.02 Chronic health conditions
None, n (%) 332 (41.6) 38 (8.8) 52 (14.3) 1.00 1, n (%) 269 (33.7) 134 (30.9) 97 (26.7) 1.09 (0.79, 1.52) 0.60 2 or more, n (%) 197 24.7) 262 (60.4) 215 (59.1) 0.94 (0.66, 1.34) 0.73
Knowledge There is no way to prevent OP, n (%) 322 (40.4) 192 (44.2) 130 (35.7) 1.43 (1.07, 1.90) 0.01 Bones can be rebuilt once they thin from OP, n (%) 285 (35.7) 173 (39.9) 112 (30.8) 1.49 (1.11, 2.00) 0.01 If a woman has OP, something as simple as lifting a bag of groceries can break a bone, n (%)
548 (68.7) 330 (76.0) 218 (59.9) 2.13 (1.57, 2.88) <0.0001
The health problems cause by OP can be life-threatening, n (%)
265 (33.2) 158 (36.4) 107 (29.4) 1.38 (1.02, 1.85) 0.04
Cues to Action Osteoporosis Risk Factors
Fall in past year, n (%) 201 (25.2) 119 (27.4) 82 (22.5) 1.29 (0.93, 1.79) 0.13 Low trauma fracture (any) since age 40, n (%) 194 (24.3) 111 (25.6) 83 (22.8) 1.17 (0.84, 1.63) 0.35 Height loss, n (%) 132 (16.5) 73 (16.8) 50 (13.7) 1.31 (0.89, 1.94) 0.17 Maternal family history of OP, n (%) 216 (27.1) 139 (32.0) 77 (21.2) 1.80 (1.30, 2.50) 0.0004 Early menopause, n (%) 193 (24.19) 100 (23.0) 93 (25.6) 0.92 (0.66, 1.28) 0.62
Osteoporosis Care Management BMD test (self-report), n (%) 467 (58.5) 320 (73.7) 147 (40.4) 4.22 (3.11, 5.72) <0.0001
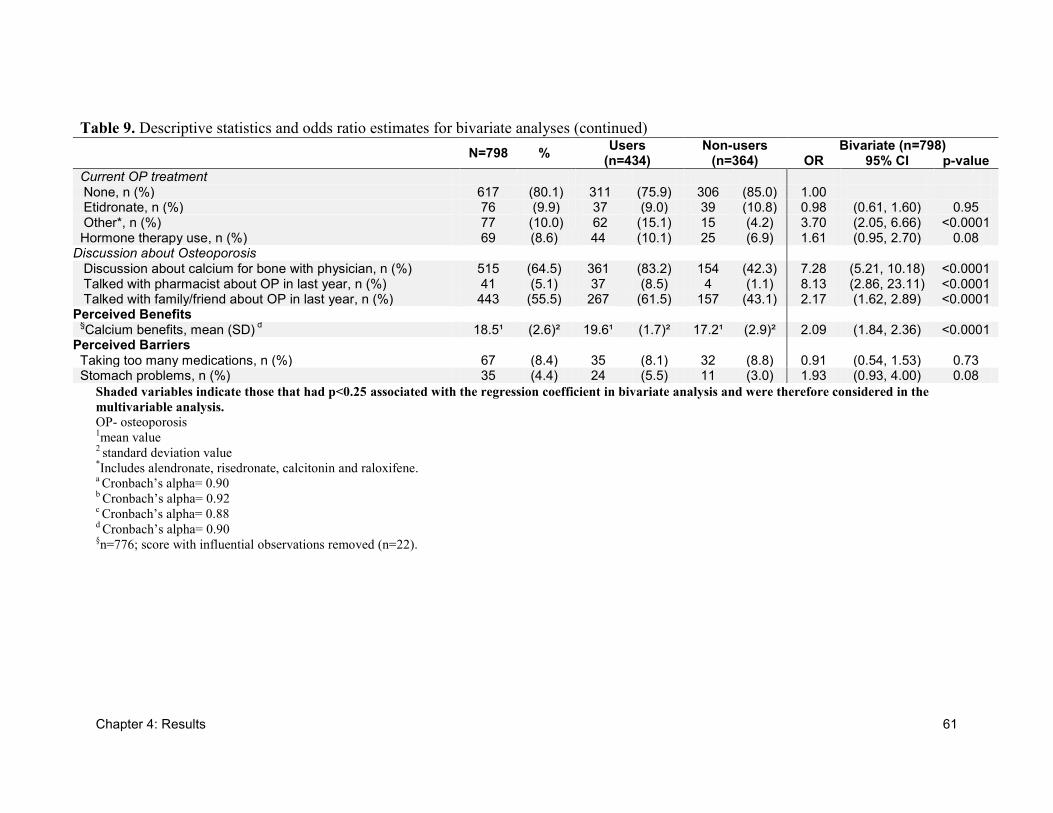
Chapter 4: Results 61
Shaded variables indicate those that had p<0.25 associated with the regression coefficient in bivariate analysis and were therefore considered in the
multivariable analysis.
OP- osteoporosis 1mean value
2 standard deviation value
*Includes alendronate, risedronate, calcitonin and raloxifene.
a Cronbach’s alpha= 0.90
b Cronbach’s alpha= 0.92
c Cronbach’s alpha= 0.88
d Cronbach’s alpha= 0.90
§n=776; score with influential observations removed (n=22).
Table 9. Descriptive statistics and odds ratio estimates for bivariate analyses (continued)
N=798 % Users
(n=434) Non-users
(n=364) Bivariate (n=798)
OR 95% CI p-value
Current OP treatment None, n (%) 617 (80.1) 311 (75.9) 306 (85.0) 1.00 Etidronate, n (%) 76 (9.9) 37 (9.0) 39 (10.8) 0.98 (0.61, 1.60) 0.95 Other*, n (%) 77 (10.0) 62 (15.1) 15 (4.2) 3.70 (2.05, 6.66) <0.0001 Hormone therapy use, n (%) 69 (8.6) 44 (10.1) 25 (6.9) 1.61 (0.95, 2.70) 0.08
Discussion about Osteoporosis
Discussion about calcium for bone with physician, n (%) 515 (64.5) 361 (83.2) 154 (42.3) 7.28 (5.21, 10.18) <0.0001 Talked with pharmacist about OP in last year, n (%) 41 (5.1) 37 (8.5) 4 (1.1) 8.13 (2.86, 23.11) <0.0001 Talked with family/friend about OP in last year, n (%) 443 (55.5) 267 (61.5) 157 (43.1) 2.17 (1.62, 2.89) <0.0001
Perceived Benefits §Calcium benefits, mean (SD)
d 18.5¹ (2.6)² 19.6¹ (1.7)² 17.2¹ (2.9)² 2.09 (1.84, 2.36) <0.0001
Perceived Barriers Taking too many medications, n (%) 67 (8.4) 35 (8.1) 32 (8.8) 0.91 (0.54, 1.53) 0.73 Stomach problems, n (%) 35 (4.4) 24 (5.5) 11 (3.0) 1.93 (0.93, 4.00) 0.08
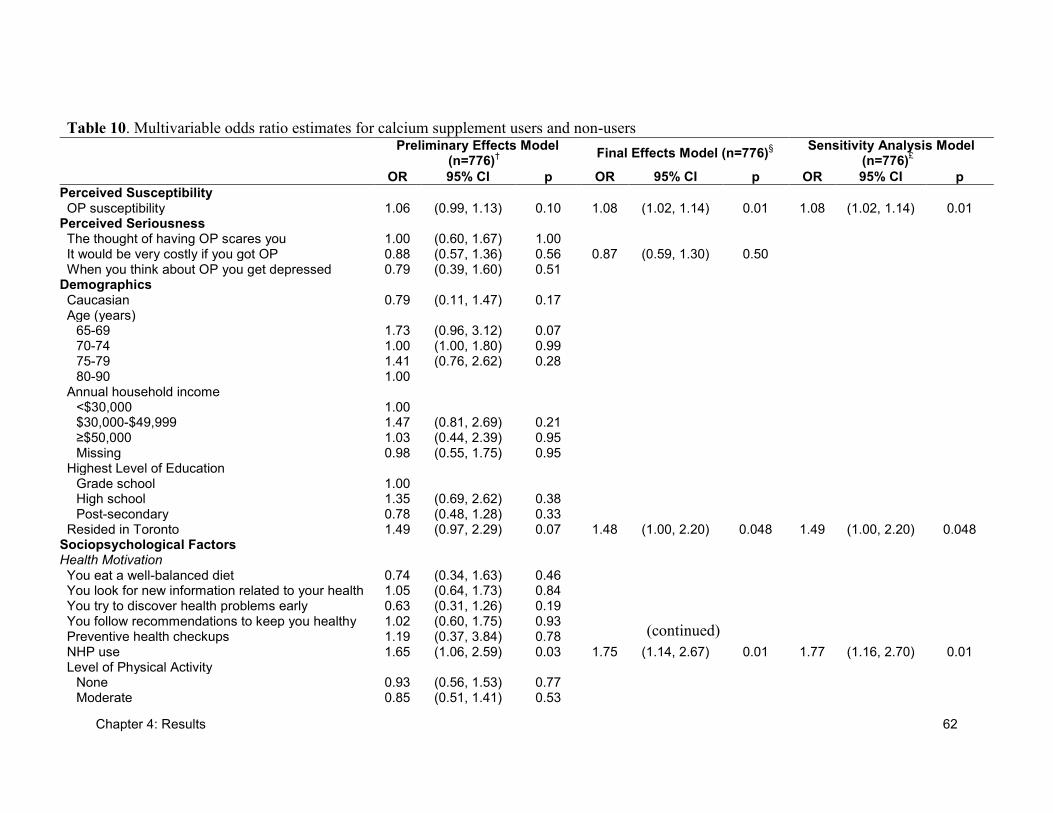
Chapter 4: Results 62
(continued)
Table 10. Multivariable odds ratio estimates for calcium supplement users and non-users
Preliminary Effects Model (n=776)
†
Final Effects Model (n=776)§
Sensitivity Analysis Model (n=776)
£
OR 95% CI p OR 95% CI p OR 95% CI p
Perceived Susceptibility OP susceptibility 1.06 (0.99, 1.13) 0.10 1.08 (1.02, 1.14) 0.01 1.08 (1.02, 1.14) 0.01
Perceived Seriousness The thought of having OP scares you 1.00 (0.60, 1.67) 1.00 It would be very costly if you got OP 0.88 (0.57, 1.36) 0.56 0.87 (0.59, 1.30) 0.50 When you think about OP you get depressed 0.79 (0.39, 1.60) 0.51
Demographics Caucasian 0.79 (0.11, 1.47) 0.17 Age (years)
65-69 1.73 (0.96, 3.12) 0.07 70-74 1.00 (1.00, 1.80) 0.99 75-79 1.41 (0.76, 2.62) 0.28 80-90 1.00
Annual household income <$30,000 1.00 $30,000-$49,999 1.47 (0.81, 2.69) 0.21 ≥$50,000 1.03 (0.44, 2.39) 0.95 Missing 0.98 (0.55, 1.75) 0.95
Highest Level of Education Grade school 1.00 High school 1.35 (0.69, 2.62) 0.38 Post-secondary 0.78 (0.48, 1.28) 0.33
Resided in Toronto 1.49 (0.97, 2.29) 0.07 1.48 (1.00, 2.20) 0.048 1.49 (1.00, 2.20) 0.048 Sociopsychological Factors Health Motivation You eat a well-balanced diet 0.74 (0.34, 1.63) 0.46 You look for new information related to your health 1.05 (0.64, 1.73) 0.84 You try to discover health problems early 0.63 (0.31, 1.26) 0.19 You follow recommendations to keep you healthy 1.02 (0.60, 1.75) 0.93 Preventive health checkups 1.19 (0.37, 3.84) 0.78 NHP use 1.65 (1.06, 2.59) 0.03 1.75 (1.14, 2.67) 0.01 1.77 (1.16, 2.70) 0.01 Level of Physical Activity
None 0.93 (0.56, 1.53) 0.77 Moderate 0.85 (0.51, 1.41) 0.53
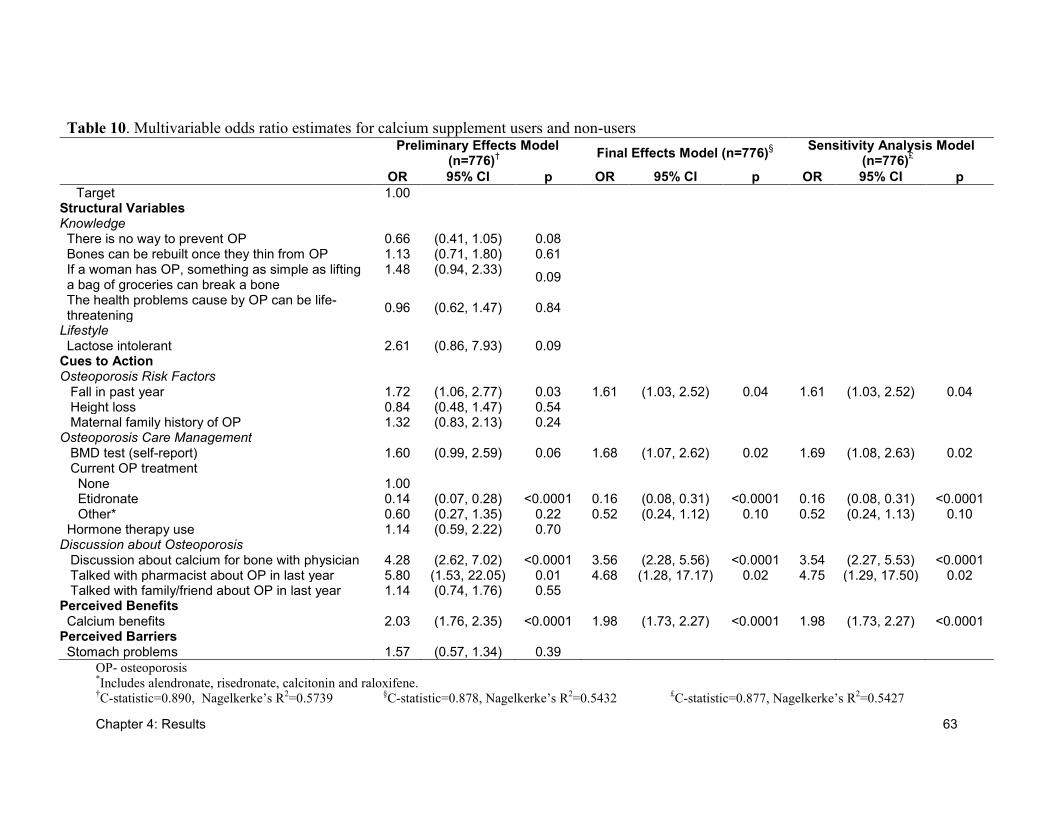
Chapter 4: Results 63
Table 10. Multivariable odds ratio estimates for calcium supplement users and non-users
Preliminary Effects Model (n=776)
†
Final Effects Model (n=776)§
Sensitivity Analysis Model (n=776)
£
OR 95% CI p OR 95% CI p OR 95% CI p
Target 1.00 Structural Variables Knowledge There is no way to prevent OP 0.66 (0.41, 1.05) 0.08 Bones can be rebuilt once they thin from OP 1.13 (0.71, 1.80) 0.61 If a woman has OP, something as simple as lifting a bag of groceries can break a bone
1.48 (0.94, 2.33) 0.09
The health problems cause by OP can be life-threatening
0.96 (0.62, 1.47) 0.84
Lifestyle Lactose intolerant 2.61 (0.86, 7.93) 0.09
Cues to Action Osteoporosis Risk Factors
Fall in past year 1.72 (1.06, 2.77) 0.03 1.61 (1.03, 2.52) 0.04 1.61 (1.03, 2.52) 0.04 Height loss 0.84 (0.48, 1.47) 0.54 Maternal family history of OP 1.32 (0.83, 2.13) 0.24
Osteoporosis Care Management BMD test (self-report) 1.60 (0.99, 2.59) 0.06 1.68 (1.07, 2.62) 0.02 1.69 (1.08, 2.63) 0.02 Current OP treatment
None 1.00 Etidronate 0.14 (0.07, 0.28) <0.0001 0.16 (0.08, 0.31) <0.0001 0.16 (0.08, 0.31) <0.0001 Other* 0.60 (0.27, 1.35) 0.22 0.52 (0.24, 1.12) 0.10 0.52 (0.24, 1.13) 0.10
Hormone therapy use 1.14 (0.59, 2.22) 0.70 Discussion about Osteoporosis
Discussion about calcium for bone with physician 4.28 (2.62, 7.02) <0.0001 3.56 (2.28, 5.56) <0.0001 3.54 (2.27, 5.53) <0.0001 Talked with pharmacist about OP in last year 5.80 (1.53, 22.05) 0.01 4.68 (1.28, 17.17) 0.02 4.75 (1.29, 17.50) 0.02 Talked with family/friend about OP in last year 1.14 (0.74, 1.76) 0.55
Perceived Benefits Calcium benefits 2.03 (1.76, 2.35) <0.0001 1.98 (1.73, 2.27) <0.0001 1.98 (1.73, 2.27) <0.0001
Perceived Barriers Stomach problems 1.57 (0.57, 1.34) 0.39
OP- osteoporosis *Includes alendronate, risedronate, calcitonin and raloxifene.
†C-statistic=0.890, Nagelkerke’s R
2=0.5739
§C-statistic=0.878, Nagelkerke’s R
2=0.5432
£C-statistic=0.877, Nagelkerke’s R
2=0.5427
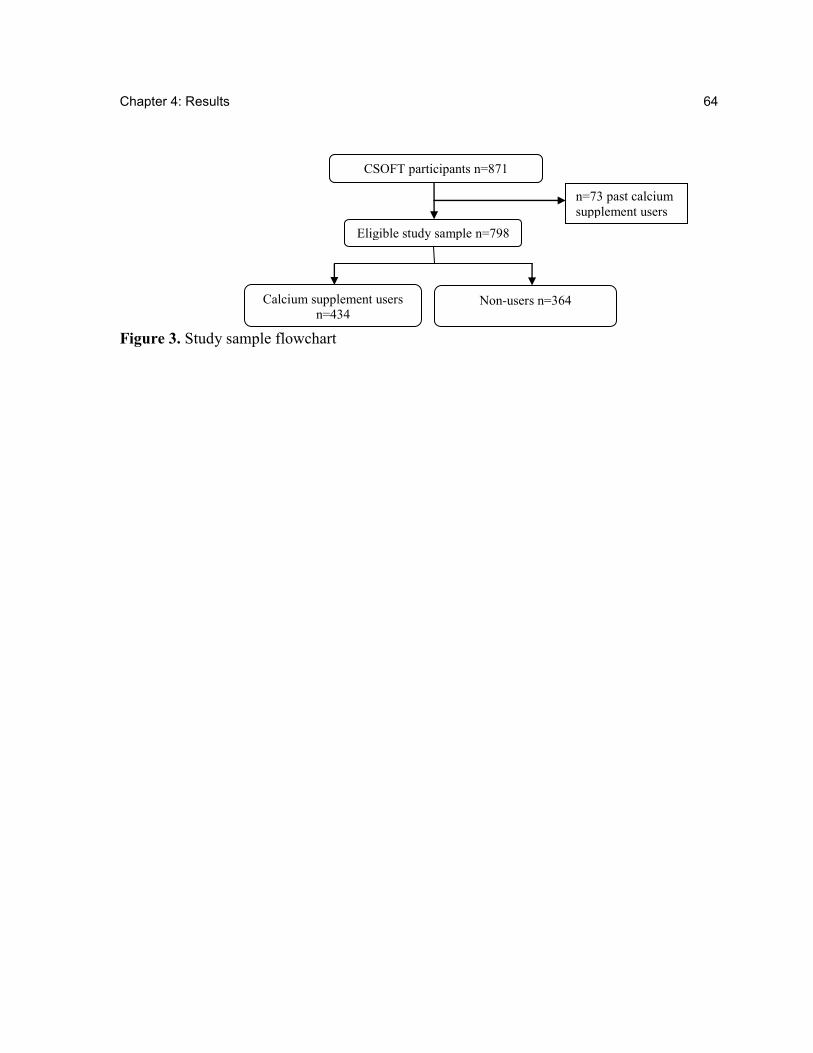
Chapter 4: Results 64
Figure 3. Study sample flowchart
Eligible study sample n=798
Calcium supplement users
n=434
Non-users n=364
n=73 past calcium
supplement users
CSOFT participants n=871
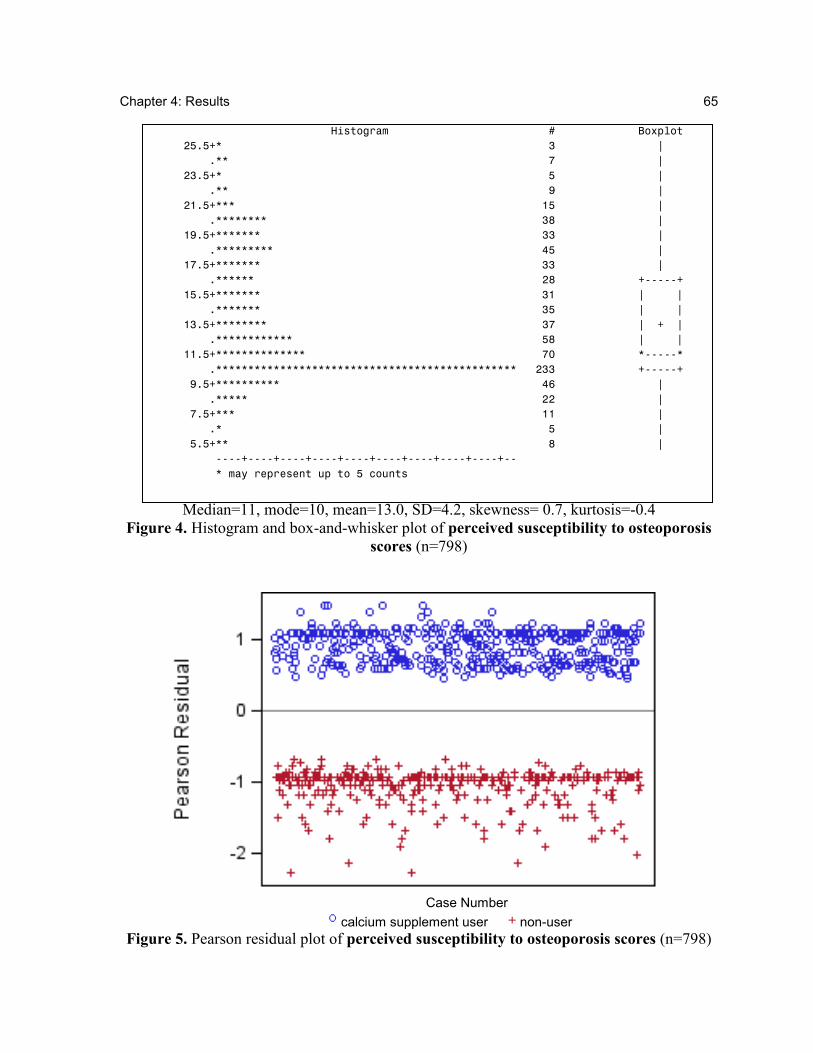
Chapter 4: Results 65
Histogram # Boxplot
25.5+* 3 |
.** 7 |
23.5+* 5 |
.** 9 |
21.5+*** 15 |
.******** 38 |
19.5+******* 33 |
.********* 45 |
17.5+******* 33 |
.****** 28 +-----+
15.5+******* 31 | |
.******* 35 | |
13.5+******** 37 | + |
.************ 58 | |
11.5+************** 70 *-----*
.*********************************************** 233 +-----+
9.5+********** 46 |
.***** 22 |
7.5+*** 11 |
.* 5 |
5.5+** 8 |
----+----+----+----+----+----+----+----+----+--
* may represent up to 5 counts
Median=11, mode=10, mean=13.0, SD=4.2, skewness= 0.7, kurtosis=-0.4
Figure 4. Histogram and box-and-whisker plot of perceived susceptibility to osteoporosis
scores (n=798)
Case Number
calcium supplement user non-user
Figure 5. Pearson residual plot of perceived susceptibility to osteoporosis scores (n=798)
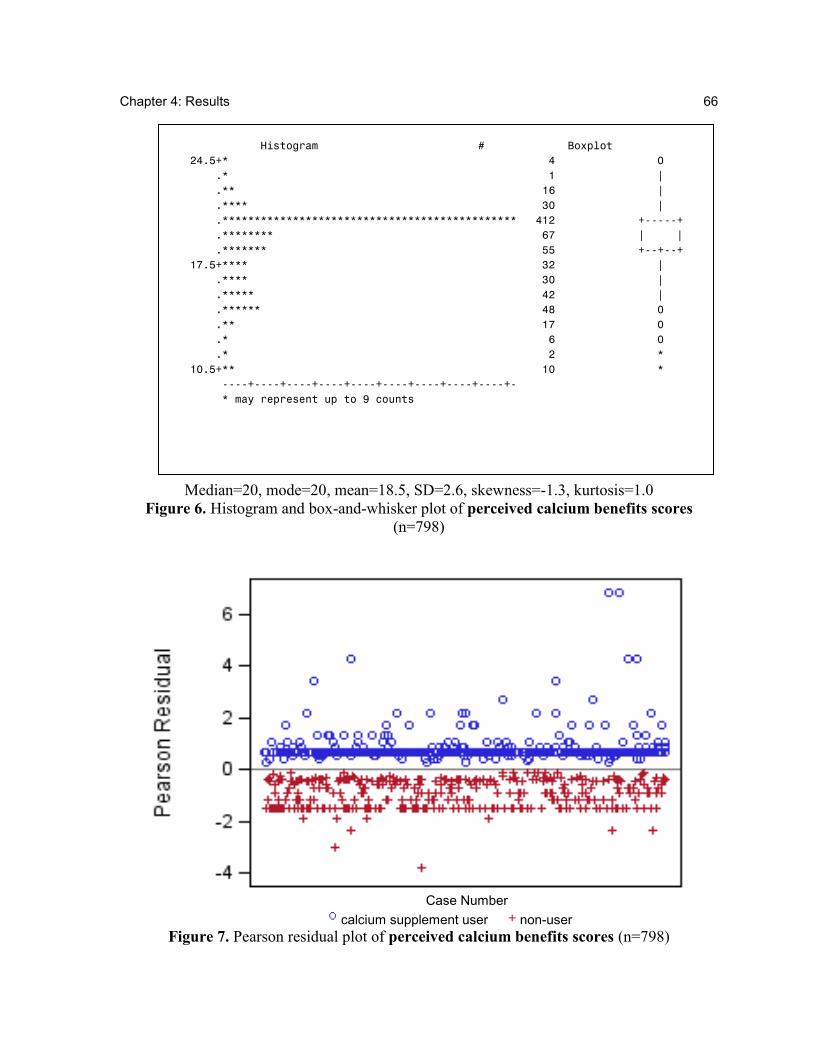
Chapter 4: Results 66
Histogram # Boxplot
24.5+* 4 0
.* 1 |
.** 16 |
.**** 30 |
.********************************************** 412 +-----+
.******** 67 | |
.******* 55 +--+--+
17.5+**** 32 |
.**** 30 |
.***** 42 |
.****** 48 0
.** 17 0
.* 6 0
.* 2 *
10.5+** 10 *
----+----+----+----+----+----+----+----+----+-
* may represent up to 9 counts
Median=20, mode=20, mean=18.5, SD=2.6, skewness=-1.3, kurtosis=1.0
Figure 6. Histogram and box-and-whisker plot of perceived calcium benefits scores
(n=798)
Case Number
calcium supplement user non-user
Figure 7. Pearson residual plot of perceived calcium benefits scores (n=798)
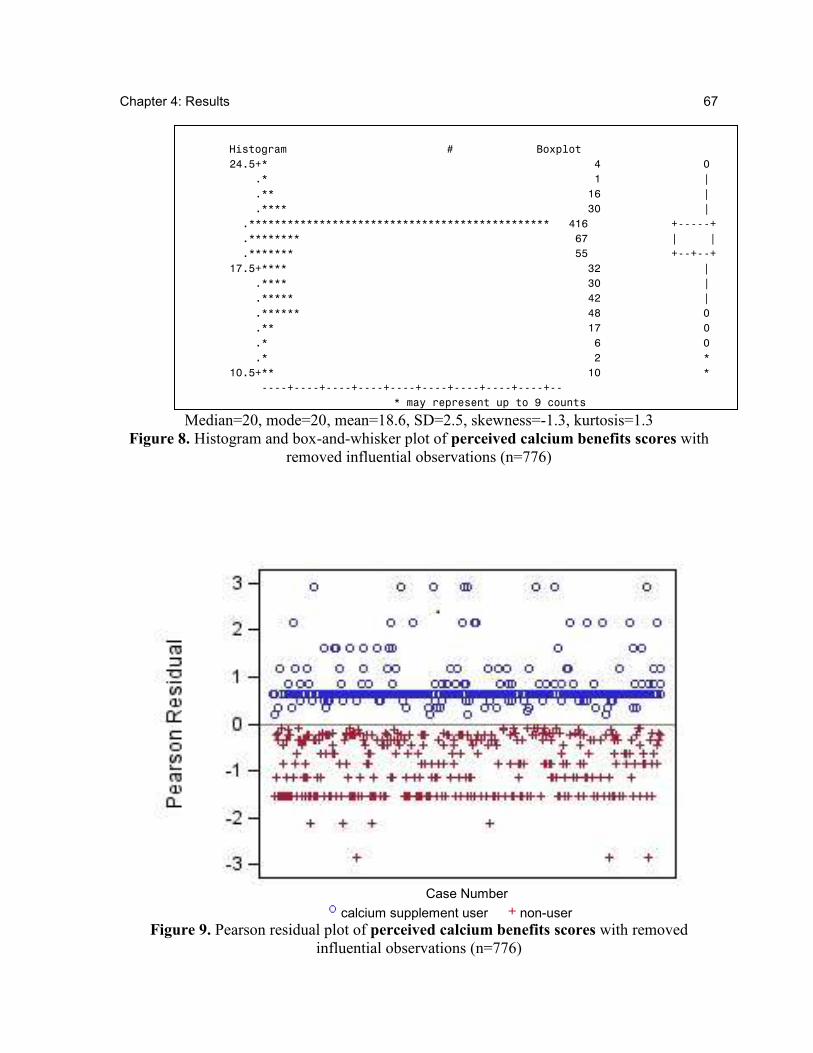
Chapter 4: Results 67
Histogram # Boxplot
24.5+* 4 0
.* 1 |
.** 16 |
.**** 30 |
.*********************************************** 416 +-----+
.******** 67 | |
.******* 55 +--+--+
17.5+**** 32 |
.**** 30 |
.***** 42 |
.****** 48 0
.** 17 0
.* 6 0
.* 2 *
10.5+** 10 *
----+----+----+----+----+----+----+----+----+--
* may represent up to 9 counts
Median=20, mode=20, mean=18.6, SD=2.5, skewness=-1.3, kurtosis=1.3
Figure 8. Histogram and box-and-whisker plot of perceived calcium benefits scores with
removed influential observations (n=776)
Case Number
calcium supplement user non-user
Figure 9. Pearson residual plot of perceived calcium benefits scores with removed
influential observations (n=776)
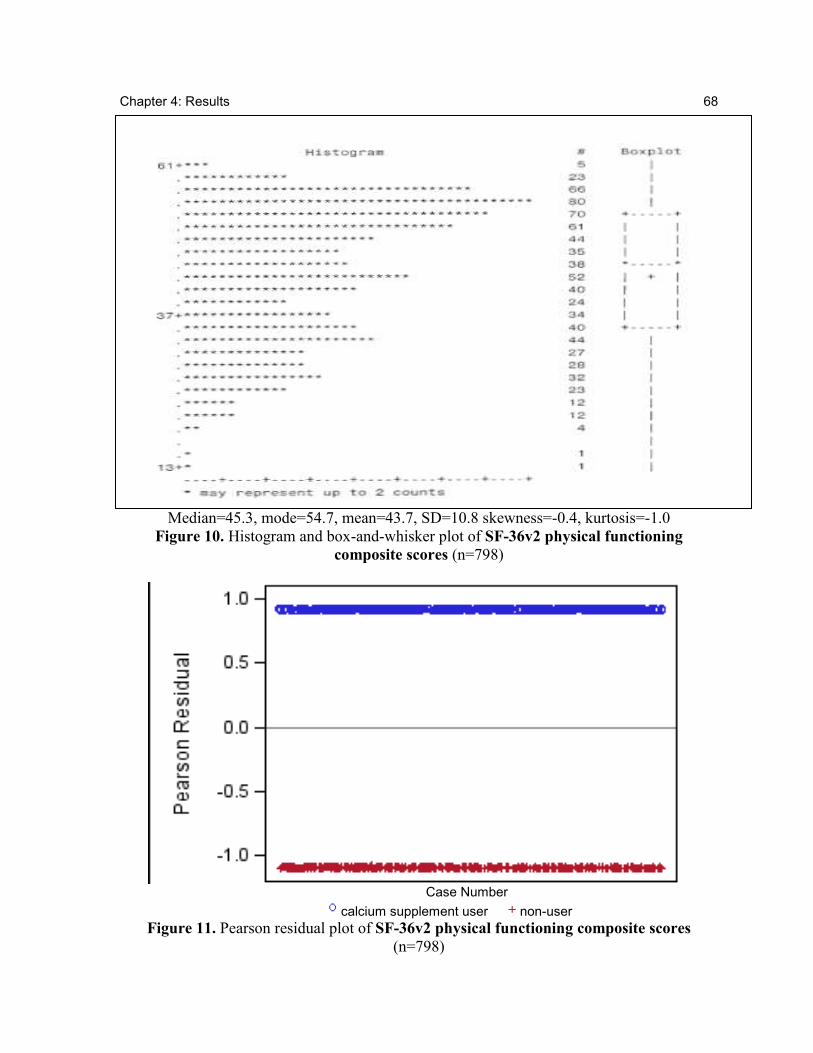
Chapter 4: Results 68
Median=45.3, mode=54.7, mean=43.7, SD=10.8 skewness=-0.4, kurtosis=-1.0
Figure 10. Histogram and box-and-whisker plot of SF-36v2 physical functioning
composite scores (n=798)
Case Number
calcium supplement user non-user
Figure 11. Pearson residual plot of SF-36v2 physical functioning composite scores
(n=798)
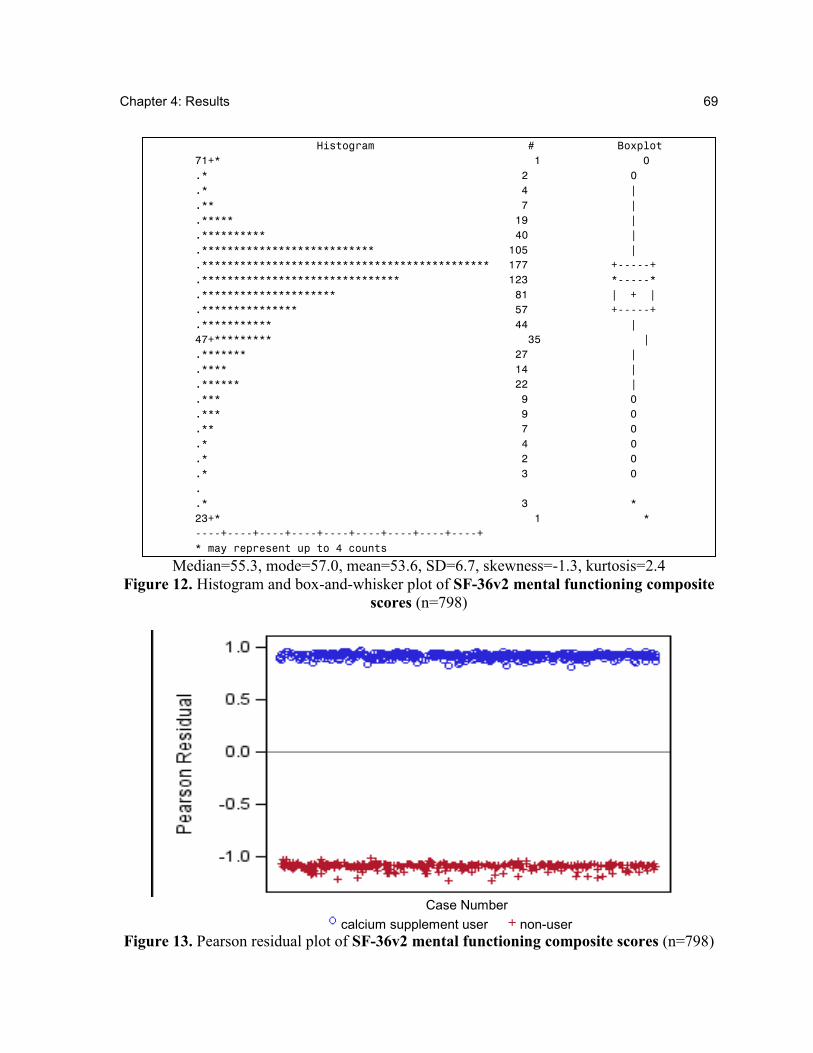
Chapter 4: Results 69
Histogram # Boxplot
71+* 1 0
.* 2 0
.* 4 |
.** 7 |
.***** 19 |
.********** 40 |
.*************************** 105 |
.********************************************* 177 +-----+
.******************************* 123 *-----*
.********************* 81 | + |
.*************** 57 +-----+
.*********** 44 |
47+********* 35 |
.******* 27 |
.**** 14 |
.****** 22 |
.*** 9 0
.*** 9 0
.** 7 0
.* 4 0
.* 2 0
.* 3 0
.
.* 3 *
23+* 1 *
----+----+----+----+----+----+----+----+----+
* may represent up to 4 counts
Median=55.3, mode=57.0, mean=53.6, SD=6.7, skewness=-1.3, kurtosis=2.4
Figure 12. Histogram and box-and-whisker plot of SF-36v2 mental functioning composite
scores (n=798)
Case Number
calcium supplement user non-user
Figure 13. Pearson residual plot of SF-36v2 mental functioning composite scores (n=798)
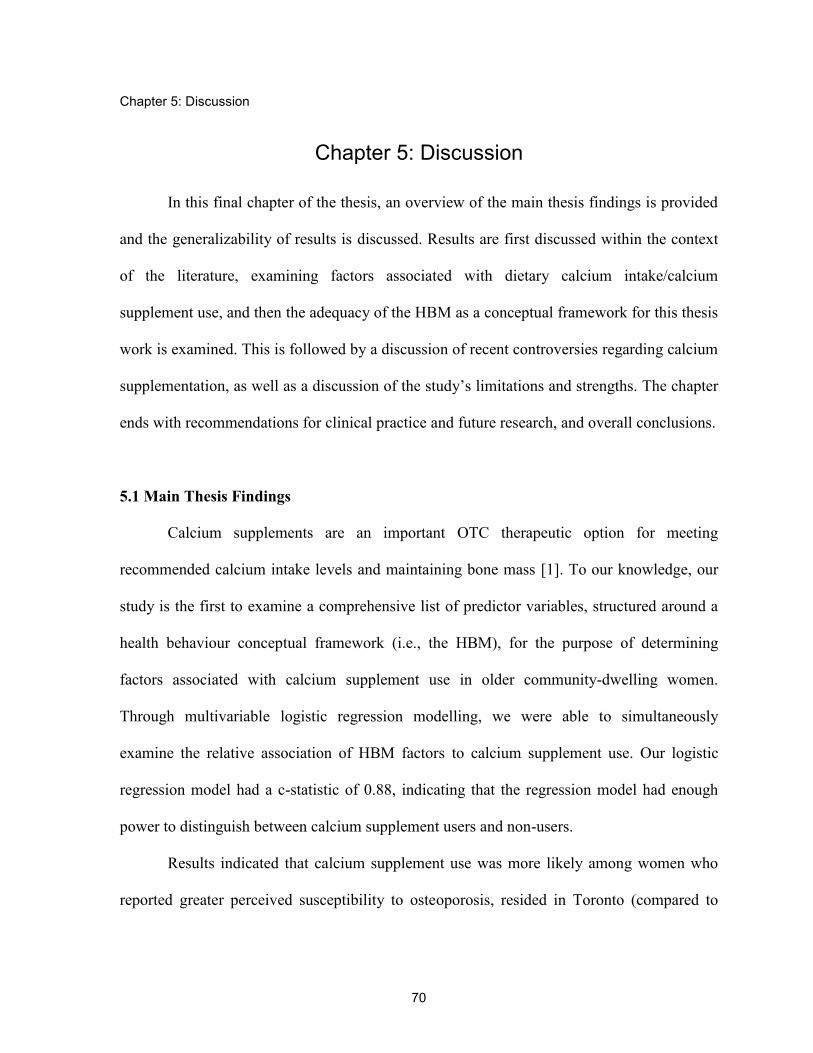
Chapter 5: Discussion
70
Chapter 5: Discussion
In this final chapter of the thesis, an overview of the main thesis findings is provided
and the generalizability of results is discussed. Results are first discussed within the context
of the literature, examining factors associated with dietary calcium intake/calcium
supplement use, and then the adequacy of the HBM as a conceptual framework for this thesis
work is examined. This is followed by a discussion of recent controversies regarding calcium
supplementation, as well as a discussion of the study’s limitations and strengths. The chapter
ends with recommendations for clinical practice and future research, and overall conclusions.
5.1 Main Thesis Findings
Calcium supplements are an important OTC therapeutic option for meeting
recommended calcium intake levels and maintaining bone mass [1]. To our knowledge, our
study is the first to examine a comprehensive list of predictor variables, structured around a
health behaviour conceptual framework (i.e., the HBM), for the purpose of determining
factors associated with calcium supplement use in older community-dwelling women.
Through multivariable logistic regression modelling, we were able to simultaneously
examine the relative association of HBM factors to calcium supplement use. Our logistic
regression model had a c-statistic of 0.88, indicating that the regression model had enough
power to distinguish between calcium supplement users and non-users.
Results indicated that calcium supplement use was more likely among women who
reported greater perceived susceptibility to osteoporosis, resided in Toronto (compared to
Chapter 5: Discussion 71
Oxford County), used NHPs (other than calcium/vitamin D/multivitamins), had a fall in the
past year, had a prior BMD test, talked to a physician about the importance of calcium, talked
to a pharmacist about osteoporosis in the past year and had greater perceived benefits of
calcium. In contrast, women reporting current use of etidronate treatment were less likely to
use calcium supplements.
Our study also illustrated the low levels of dietary calcium intake among older
community-dwelling Canadian women. Surprisingly, low dietary calcium intake was not
associated with calcium supplement use. Only 8.9% of women in our study sample reported
dairy product intake that met the 2010 recommended calcium intake levels of 1200 mg/day,
while only 2.5% met the 200213
recommendation of 1500 mg/day.
5.2 Generalizability of Findings
To ascertain generalizability (external validity) of study findings, the study sample
characteristics were compared to those of the general Canadian population of older women.
Compared to the general Canadian population of older individuals, this study’s sample
included a larger proportion of women in the older age group (80 to 90 years), [89]. Our
study sample also consisted of a greater proportion of women reporting to have had a post-
secondary education (23%), compared to the general population of older Canadian women
reporting some high school education or greater (18%) [90].
When compared to data from the 1998/1999, National Population Health Survey
(NPHS), participants in this thesis study were similar to older Canadian women with regards
13
Taking into consideration that CSOFT data used in this were collected during 2003-2004, it is important to
consider whether women were meeting the recommended calcium intake levels for that time period (i.e., the
2002 recommended levels of 1500 mg/day).
Chapter 5: Discussion 72
to marital status (45% of this study’s participants reporting being married or in a common
law relationship compared with 45% reported from NPHS data), and smoking status (9% of
study participants reporting being current smokers compared to 13% reported by NPHS).
Participants also were similar with regards to self-reported prevalence of chronic conditions,
such as arthritis (50% reported arthritis in this study compared to 48% from NPHS
estimates), diabetes (8% vs. 10%) and lung problems (14% vs. 13%).
Fifty-four percent of women in this study sample reported using calcium
supplements. To our knowledge, the only other Canadian study, published in 2006, that has
estimated calcium supplement use in older women, has reported that 64% of healthy
postmenopausal women were users of calcium supplements [91]. However, its study sample
was recruited via convenience sampling and was younger (mean age=61.9 years) compared
to the random sample of women in this thesis (mean age=75.4 years).
Although this thesis study sample excluded women who had moderate to severe
osteoarthritis between 1995 to 1997 and those who reported using calcium supplements in
the past, we suggest that results obtained from our study sample may be generalizable to the
general Ontario population of English-speaking women 65 years and older who are healthy
enough to complete a lengthy telephone interview. We acknowledge that older women with
cognitive or hearing impairments, language barriers, or living in a long-term care residence
may be different and therefore our results are not generalizable to that population.
5.3 Comparing of Study Results to Prior Research
This section discusses the thesis findings in relation to prior research and is organized
according to the components of the HBM.
Chapter 5: Discussion 73
5.3.1 Perceived Susceptibility to Osteoporosis
This study identified a significant positive association between perceived
susceptibility to osteoporosis and calcium supplement use. Only one prior study identified
from the literature search for this thesis, that examined 990 randomly selected women 45
years and older, found a significant positive association (through the use of cluster analysis),
between calcium supplement use and perceived susceptibility to osteoporosis (measured
using the OHBS subscale for perceived susceptibility to osteoporosis) [50]. Another study
found no association between perceived susceptibility to osteoporosis and calcium
supplement use but examined a smaller convenience sample (n=60) of women 40 to 95 years
of age and did not use a validated measure for perceived susceptibility to osteoporosis [41].
The HBM states that greater perceived susceptibility to a disease is more likely to lead to
preventive action against the condition. Thus, the positive association found in our study is
consistent with the HBM and prior work based on a large generalizable sample and a
validated measure of perceived susceptibility to osteoporosis.
5.3.2 Perceived Seriousness of Osteoporosis
In this study sample, the perception of osteoporosis as a serious disease did not
significantly increase a woman’s likelihood of using calcium supplements. This lack of
association could be attributed to several factors. First, this finding agrees with results from
previous studies. One previous study identified no association between perceived seriousness
and calcium/vitamin D/soy supplement use among 185 women aged 20 to 64 years [51]. In
support of this finding are data from a Canadian focus group study, which found that the
majority of women do not take preventive measures against osteoporosis despite their belief
Chapter 5: Discussion 74
that osteoporosis is a serious disease. Second, general research examining the HBM identifies
the perceived seriousness component as the least predictive for determining health behaviour
[92], possibly explaining the lack of association to calcium supplement use found in this
study and others. However, in this thesis, the collapse of response options into a dichotomy
for the perceived seriousness to osteoporosis items could have led to a decrease in possible
association and therefore resulted in our finding that there was no significant association to
calcium supplement use. Only 1-item measuring perceived seriousness of osteoporosis
remained in the final regression model in this study: “It would be very costly if you got
osteoporosis.” Yet, the perceived seriousness component of the HBM is intended to evaluate
a combination of medical, clinical and social consequences influencing perception to
seriousness of the disease [46]. The 1-item measurement of osteoporosis seriousness used in
this study may not have captured medical and clinical consequences. Thus, although we did
not find perceived seriousness of osteoporosis to be associated with calcium supplement use,
it is the weakest predictor variable in the HBM and we acknowledge limitations of its
measurement in this thesis study. Further research may be warranted to clarify the
relationship between perceived seriousness of osteoporosis and calcium supplement use in
older community-dwelling women.
5.3.3 Personal Factors
Demographics
Analyses indicated that none of the demographic variables (age, income, level of
education and current living arrangements), with the exception of residence in Toronto, were
associated with calcium supplement use. Residence in Toronto was associated with calcium
Chapter 5: Discussion 75
supplement use although the significance of this association was borderline (p=0.048). An
examination of the 2001 Ontario census data showed that the only significant difference
between residents of these two regions was the proportion of residents who were immigrants:
89% of the female population of East York (borough in Toronto examined in this study) was
foreign-born [93], while only 46% of females in Oxford County were foreign-born [94]. To
our knowledge, no studies have identified an association between being foreign-born and
using calcium supplements, limiting our discussion on this factor. The association between
region of residence identified in this study, however, may also be attributed to access to care.
Indeed, inequities in access to care for fracture prevention between the two regions have been
identified [53], possibly affecting a community-dwelling women’s likelihood to use calcium
supplements.
With regards to the association between age and calcium supplement use, our results
are not consistent with a prior study of women 25 years and older, recruited from six
suburban community-based family medicine practices in Cleveland [51]. Using multivariable
regression analysis, the study suggested that older age was more common among calcium
supplement users than non-users. Discrepancy between the findings and ours could be
attributed to differences in the mean ages of the study samples (mean age=43 years for the
latter study vs. mean age=75 years for this thesis). A younger age group is more likely to
capture those individuals who are relatively healthy and taking calcium supplements in order
to meet recommended calcium intake levels, while the older age group studied in this thesis
focuses on those at risk for osteoporosis who may be using calcium supplements for the
purpose of fracture prevention, as is recommended by Canadian guidelines for osteoporosis
prevention among older women 65 years and older [1].
Chapter 5: Discussion 76
The HBM categorizes demographic factors as modifying characteristics that may
influence health beliefs, but are not directly linked to the health behaviour. Indeed, our
results suggest that demographic factors may have a less contributory independent effect on
calcium supplement use in older community-dwelling women, compared to health beliefs
such as perceived susceptibility to osteoporosis.
Sociopsychological Variables
In this study, none of the variables measuring health status (i.e., general perceived
health status, SF-36v2 physical functioning composite score and the SF-36v2 mental
functioning composite score) were associated with calcium supplement use. The only other
study identified through the literature search that examined this also found no significant
association between health status and calcium supplement use [51]. Data from the Canadian
NPHS also suggest that in multivariable analysis, health status is of less importance to NHP
use compared to other factors [95]. We therefore propose that health status may not be an
important contributory factor to calcium supplement use in a generally healthy group of older
community-dwelling women able to complete a lengthy telephone interview.
When explaining health behaviour related to chronic disease prevention, the HBM
proposes that an individual’s health motivation is an important factor influencing the
likelihood of action. In this study, we did not identify a significant association with general
health motivation items. Given that the majority of study participants reported strongly agree
or agree with each of the general health motivation items, these items may have poor
discriminatory power and therefore may not be good measures of general health motivation.
In addition, each item was dichotomized and the items measured general health motivation as
Chapter 5: Discussion 77
opposed to specific bone health motivation, possibly contributing to the lack of association
with calcium supplement use, once other factors were adjusted for in the multivariable
analysis.
However, health motivation specific to the use of NHPs (other than calcium, vitamin
D or multivitamins) was found to be positively associated with calcium supplement use. This
result was anticipated based on multivariable results from a prior study that examined the use
of multivitamins as an indicator of health motivation [51] and the understanding that women
who use other NHPs are generally more inclined to use calcium supplements [91].
Other measures of health motivation examined in this thesis included smoking status
and level of physical activity. Consistent with another study [47], smoking status was not
indicative of calcium supplement use, and once other factors were adjusted for, level of
physical activity showed no association. To our knowledge, only one other study has
examined physical activity as a possible correlate of supplement use [50]. However, this
study did not examine calcium supplement use separately and used cluster analysis, reporting
that women who perceived greater susceptibility and seriousness to osteoporosis were less
likely to exercise greater than three times per week. Our study, however, was thorough in
determining the type and level of physical activity and our physical activity variable was
coded based on three levels of activity (target, moderate, none) rather than frequency of
activity. Our coding of the physical activity variable thus allowed us to differentiate between
women who exercised for the purpose of maintaining health (i.e., target level of activity), and
those who were sedentary and possibly had physical limitations. Regardless, we identified
little association between exercise and calcium supplementation.
Chapter 5: Discussion 78
Structural Variables
When other factors, such as perceived benefits to calcium were accounted for,
osteoporosis knowledge was not associated with a woman’s likelihood of using calcium
supplements. However, we acknowledge data were restricted to two items that measured
knowledge about osteoporosis prevention and two that measured knowledge about
osteoporosis consequences. These items did not tap into calcium-specific knowledge and
may not have captured osteoporosis knowledge well enough to be able to detect an
association. Research shows that women report uncertainty regarding calcium knowledge,
and confusion with understanding dosage and formulations of calcium supplements [49].
More research is needed to clarify the association between knowledge and calcium
supplementation.
In this study, lactose intolerance was the only lifestyle factor positively associated
with calcium supplement use in bivariate analyses, however, this association was non-
significant in multivariable results. A focus group study identified that lactose intolerance
impeded dietary calcium intake [49]. Thus, although lactose intolerance may not be
associated with calcium supplement use at the population-level (4.4% reported lactose
intolerance in this study), it may be an important factor of association at the individual-level.
5.3.4 Cues to Action
We considered risk factors for osteoporotic fracture and osteoporosis management as
potential cues to calcium supplementation. In the multivariable analysis of this study,
maternal family history of osteoporosis and height loss were not contributing factors to
calcium supplement use. A previous study among 185 women aged 20 to 64 years of age,
Chapter 5: Discussion 79
found that calcium supplement use was more prevalent among those with a family history of
osteoporosis [51]. Our finding suggests that maternal family history of osteoporosis may not
be an important factor in influencing calcium supplement use among older women (i.e., 65
years and older) as it is in younger women. This point is further supported by other research
that has found younger women to more frequently attribute their risk for osteoporosis to their
family history, compared to older women [41].
The only osteoporosis risk factor found to be indicative of calcium supplement use
was a fall in the past year. The cross-sectional data used in this thesis, however, do not allow
us to ascertain whether women started using calcium supplements after their fall or whether
they were using the supplements prior to the fall.
Osteoporosis management variables including: previous BMD testing, current
osteoporosis treatment and discussion with health care providers were associated with
calcium supplement use. The positive association found between calcium supplement use and
previous BMD testing is consistent with results from several pre-post intervention studies
that have identified a positive association between BMD testing and calcium intake [96-101].
Surprisingly, treatment with etidronate was negatively associated with calcium
supplement use, yet women on osteoporosis treatment other than etidronate therapy (i.e.,
alendronate, risedronate, calcitonin and raloxifene), were not more likely to use calcium
supplements than those on no treatment for osteoporosis. At the time of CSOFT data
collection, cyclical etidronate was available and was dispensed as 14 days of etidronic acid
(prescription drug) and 76 days of calcium supplementation. Women consuming an average
amount of dietary calcium (i.e., 700 mg/day) or higher and on cyclical etidronate (including
500 mg from calcium supplement as part of therapy) may still not have been meeting the
Chapter 5: Discussion 80
recommended calcium intake levels at the time of data collection (i.e., 1500 mg/day) and
therefore required additional supplementation. Today, however, given the lower
recommendations for calcium levels (i.e., 1200 mg/day), women consuming an average
amount of dietary calcium and on cyclical etidronate may be meeting the recommended
calcium intake levels. However, since the time of CSOFT data collection, other
bisphosphonates have been open listed in Ontario (i.e., alendronate and risedronate), which
do not include calcium and therefore fewer women are being treated with etidronate therapy
[76]. Women taking these other bisphosphonates still require calcium supplementation if they
are not meeting the recommended targets from diet alone. A recent study involving clinically
diagnosed osteoporotic women 65 years and older, identified the need for clearer information
regarding osteoporosis and its treatment, including information on diagnosis, implications of
diagnosis, treatment options and efficacy [102]. This indicates a potential role for health care
professionals to help improve patients’ knowledge of calcium supplementation and
osteoporosis treatment.
Finally, women who had a conversation with a physician about the importance of
calcium had greater odds of using calcium supplements. Those who had a conversation with
a pharmacist in the past year about osteoporosis were also more likely to be using calcium
supplements, although only 37 women of the study sample reported speaking with a
pharmacist, indicating less certainty in the accuracy of the odds ratio estimate (95% CI=1.4-
17.4). The cross-sectional nature of our data limits us in discerning whether or not women
talked to a pharmacist after talking with a physician about the importance of calcium.
Regardless, these results emphasize the importance of discussions with health care providers
in increasing the likelihood of calcium supplementation. Indeed, research has found that
Chapter 5: Discussion 81
pharmacists interventions may improve bone mineral density testing and calcium intake
among patients at high risk for osteoporosis [103].
5.3.5 Perceived Benefits and Barriers of Calcium
Our study also found that perceived calcium benefits were significantly associated
with calcium supplement use. This was consistent with results from most prior research [38,
48, 50] and is consistent with the HBM concept that perceived benefits directly affect the
likelihood to take action. However, our study was not able to determine whether perceived
barriers to calcium were associated with calcium supplement use. Our proxy items were
likely poor measures of perceived barriers to calcium because the two items were related to
medication use rather than supplement use. Previous research has reported a negative
association between perceived barriers and calcium intake [38, 48, 50] and has emphasized
the importance of the perceived barriers component of the HBM in predicting health
behaviour [92]. Therefore, we hypothesize that perceived barriers to calcium supplement use
would be an important factor related to a woman’s likelihood of using calcium supplements
and therefore should be examined in future research. Appropriate measures for perceived
barriers to calcium supplement use would include perception of the risks of calcium
supplements, including perceptions about side-effects (i.e., constipation and nausea), and
issues with swallowing based on the size of the supplement tablet.
Summary
Results of this project identified cues to action variables as the strongest correlates of
the likelihood to calcium supplement use. Health beliefs of perceived susceptibility to
Chapter 5: Discussion 82
osteoporosis and perceived benefits to calcium were of importance, but perceived seriousness
of osteoporosis was not associated with calcium supplement use. Lastly, most demographic
factors were not associated with calcium supplement use among this sample of women, with
only residence in a metropolitan region (i.e., Toronto) having a significant association with
calcium supplement use once all factors were adjusted for.
5.4 Using the HBM to Examine Factors Associated with Calcium Supplement Use
We considered calcium supplement use to be a health behaviour that is influenced by
underlying health beliefs, personal factors, as well as experiences, and therefore rationalized
that the HBM was useful for examining calcium supplement use in older community-
dwelling women. Our use of a conceptual framework was important to compiling a
comprehensive list of predictors possibly associated with calcium supplement use and
guiding regression modelling. Indeed, measures of major HBM components (i.e., perceived
susceptibility to osteoporosis and perceived benefits to calcium) were found to be correlates
of calcium supplement use in the final regression model, indicating the value of using the
model as a conceptual framework to identifying correlates of calcium supplement use.
Several cues to action variables were associated with a woman’s likelihood to use
calcium supplements. To date, no study has systematically studied or defined the cues to
action component of the HBM, making it difficult to determine which variables (of the
CSOFT dataset) should have been categorized as part of this component. Furthermore, the
HBM models personal factors and cues to action as each directly influencing perceived threat
to the disease, but does not illustrate a direct relationship between cues to action and personal
factors. It seems, however, that in addition to influencing perceived threat, personal factors
Chapter 5: Discussion 83
and cues to action may also have a synergistic relationship. For example, a cue to action such
as BMD testing has been shown to affect osteoporosis knowledge [100, 101] (a structural
variable of the personal factor component of the HBM), suggesting an association between
the cues to action component and the personal factors component of the HBM.
Our results identify that the perceived seriousness component of the HBM was of
little importance in predicting calcium supplement use among older community-dwelling
women in Ontario. This thus supports the notion that the perceived seriousness component of
the HBM is the least predictive of health behaviour [92].
Overall, use of the HBM was important to identifying a comprehensive list of factors
possibly associated with the health behaviour (calcium supplement use). However, we
acknowledge the limitations of the HBM with regards to a lack of the structured definition of
the cues to action component and the poor predictive ability of the perceived seriousness
component. We were also limited by previously collected data that did not enable us to
examine perceived barriers to calcium or self-efficacy.
5.5 Limitations and Strengths
We note several study limitations and discuss these limitations here. First, the study
was cross-sectional in design and therefore causal relationships could not be established. For
example, we cannot ascertain whether cues to action such as having talked with a health care
provider, influenced a woman’s decision to take calcium supplements, or whether women
who were already taking calcium broached the subject of osteoporosis/calcium with health
care providers.
Chapter 5: Discussion 84
Second, the study was largely based on self-report data collected through a telephone
interview. Possible response bias could have been introduced, with women completing the
questionnaire based on what they thought the interviewer wanted to hear.
Third, our outcome measure of calcium supplement use was based on self-report and
excluded women reporting past use of calcium supplements. Although calcium supplement
use was self-reported, data suggest that self-report of calcium supplement use via telephone
interview has high test-retest reliability [62] and there is moderate correlation (r=0.69,
95%CI=0.60-0.77) between self-reported daily intake of calcium supplements and calcium
intake level as calculated from transcriptions of supplement bottle labels [63]. However, the
CSOFT question inquiring about calcium supplement use could have been susceptible to
recall bias, since older women sampled may have forgotten that they had used calcium
supplements in the past and instead reported that they had never used calcium supplements.
Even more so, women taking calcium as part of a multivitamin might not have been captured
as current calcium supplement users. Therefore, we may have misclassified some past users
as never users and some current calcium users obtaining calcium via multivitamins as non-
users. We expect that recall bias is more likely among women who used calcium
supplements in the distant past, and therefore possibly miscoded as “never users”. However,
we also expect that women who forgot about past calcium supplement use in the distant past
would respond more similarly as never users and thus expect little impact on our model. In
addition, although some women may have adequate calcium intake via multivitamins, they
could be taking multivitamins for several reasons that are not specific to bone health and we
therefore believe that despite potential misclassification of users, our results have good
internal validity to identify correlates of current calcium supplement use in contrast to never
Chapter 5: Discussion 85
users. This is evidenced by the very high c-statistic calculated for the regression model (c-
statistic=0.88).
Fourth, we were restricted to data previously collected and thus could not measure
self-efficacy or perceived barriers to calcium supplementation. It is difficult to determine
what the effects of self-efficacy would have been on calcium supplement use in older
community-dwelling women, since to our knowledge no other study has examined the
association between self-efficacy and calcium supplement use specifically. However, we
hypothesize a positive association based on results from previous studies indicating a positive
association between self-efficacy and dietary or total calcium intake [38, 42]. In addition, the
CSOFT dataset only contained a measure for perceived barriers to dietary calcium intake (the
perceived barriers to calcium subscale of the OHBS) and not perceived barriers to
supplement use. As a result, two proxy items were used to measure perceived barriers to
calcium supplementation in this study. The validity of the two items is questionable because
the items were used in CSOFT to measure perceived barriers to osteoporosis prescription
drugs rather than perceived barriers to supplements. Evidence from Ontario indicates that
postmenopausal women perceive NHPs, including calcium, as different from prescription
medications [91], highlighting the limitations of the proxy items.
Lastly, our study focused on examining correlates of calcium supplement use, yet
vitamin D is another supplement used in osteoporosis management. However, given that the
majority of women who reported using calcium supplements were also taking vitamin D
(90%), we expect that the correlates associated with calcium supplement use may be similar
to correlates of vitamin D use. Verification of this would require further investigation.
Chapter 5: Discussion 86
Despite these limitations our study has many strengths. First, the use of a
multivariable regression model allowed us to examine the simultaneous relative associations
of different variables related to the HBM. The final logistic regression model had high
discriminatory performance (c=0.88), adding to the strength of the study. Second, this study
examined a comprehensive list of possible correlates to calcium supplement use including
several validated measures. In particular, unlike other studies, we examined several cues to
action variables, which were validated measures (e.g., previous BMD testing [74],
osteoporosis treatment [75]). Third, in addition to its comprehensive nature, our study used
the HBM to guide the selection of variables. This is of importance because the combination
of multiple factors such as knowledge, health beliefs and cues to action simultaneously
influence health behaviour [43]. Fourth, this study involved the careful selection of variables
from a dataset based on the HBM, enabling enough study power to detect significant
associations for the 32 variables that were considered for the multivariable logistic regression
model. Lastly, our study examined a large randomly selected sample of postmenopausal
women in two regions of Ontario, increasing generalizability of our results to older English-
speaking community-dwelling women in Ontario, healthy enough to complete a lengthy
telephone interview.
5.6 Recent Controversies of Calcium Supplement Use
Recent controversies have emerged regarding the adverse effects of high doses of
calcium supplements [104, 105]. First, a meta-analysis of randomized controlled trials
(RCTs) concluded that calcium supplements, without the use of vitamin D, increased the risk
of myocardial infarction (OR=1.25 95% CI=1.08-1.45, p=0.003) and raised concern that
Chapter 5: Discussion 87
calcium supplementation might be more harmful than beneficial [104, 106]. In contrast, a
recent 5-year RCT (n=1460) has contradicted the findings of the meta-analysis, reporting that
calcium supplementation of 1200 mg/day does not lead to significant increased
cardiovascular risk in older women (mean age=75.1 ± 2.7 years ) [105]. The authors of the
RCT argue several points as to why their results are more accurate than those of the meta-
analysis and speficially of the RCTs making up the meta-analysis. First, there was poor
concordance between self-reported events and validated events in the RCTs. Second, the
trials included in the meta-analysis did not include cardiovascular risk as a primary outcome.
Third, atherosclerotic vascular disease consists of several categories of diseases and therefore
when combined (as was done in the meta-analysis), the low frequency of events within each
of the categories of disease could have led to statistical differences between groups in the
RCTs of the meta-analysis, thereby leading to an overestimation of risk of myocardial
infarction associated with calcium supplement use. Fourth, the wide confidence intervals
around the effect size lead to concerns regarding the significance of the results. The authors
suggest that all four limitations were overcome in their RCT and therefore there is no
significant increased cardiovascular risk associated with 1200 mg/day of calcium
supplementation.
In addition, the American Society of Bone and Mineral Research has issued a
statement after publication of the meta-analysis, concluding that numerous large studies have
not shown an increased risk for cardiovascular events as a result of calcium supplementation
and further studies are required to ascertain a link between calcium supplements and
cardiovascular events because of contradictions in the available literature [107]. The Institute
of Medicine, on behalf of the Canadian and United States governments, has recently reported
Chapter 5: Discussion 88
that risk of harm with calcium supplements only increases when calcium intake levels
surpass 2000 mg/day [108]. Therefore, despite recent concern regarding potential harm with
high dosage of calcium supplements, the current recommended calcium intake level of 1200
mg/day is below the risk of harm level, and given that the average older women only
consumes about 700 mg/day of calcium from her diet and about 500 mg/day from calcium
supplements, it is concluded that calcium supplements are needed to help prevent bone loss
and osteoporosis fracture [1].
5.7 Recommendations for Clinical Practice
Results of this thesis highlight the association between a discussion with health care
professional and calcium supplement use among older postmenopausal community-dwelling
women. A previous cohort study reported that 90% of postmenopausal women believed that
recommendations from their physicians were an important factor in taking preventive action
against osteoporosis [41]. However, prior data also suggest that health care professionals do
not discuss osteoporosis with about 49% of women aged 40 to 69 years, with those women
having more risk factors for osteoporosis not more likely than other women to be counselled
about osteoporosis prevention [109]. Given the recent controversies regarding calcium
supplementation, physician-patient discussions about the importance of calcium for bone
health may be even more important.
This study also found that individuals who had a discussion with a pharmacist about
osteoporosis were more likely to take calcium supplements. This result coincides well with
pharmacy practice research. A recent systematic review of three RCTs has reported that
pharmacists’ interventions, including discussions about osteoporosis, risk factors,
Chapter 5: Discussion 89
consequences of the disease and the importance of calcium for increasing BMD, increase
calcium intake among patients at-risk for osteoporosis [103]. Women have reported that they
are misinformed [41] and confused [49] about calcium supplementation and given their
knowledge about pharmaceuticals, pharmacists can therefore help educate patients on the
importance of calcium supplementation as prophylaxis for osteoporosis or in conjunction
with other bone-building treatment.. Furthermore, non-adherence to calcium supplementation
appears to be at least partially attributable to the side effects caused by the supplements, as
well as the difficulty in taking the supplements due to tablet size [110]. Pharmacists may be
able to help with recommending other forms of calcium that may be more suitable to
patients’ needs. As pharmacists’ scope of practice continues to broaden in Ontario,
community pharmacists may be very well placed to help with osteoporosis prevention and
management.
Greater awareness regarding the importance of calcium supplements is important.
Based on current recommended calcium intake levels, patients on etidronate therapy may be
getting enough calcium from their diet and supplementation that is part of their therapy. Yet,
it is still important for health care providers to discuss the importance of calcium for bone
and recommend supplementation for those taking other types of bisphosphonates and those
with low dietary calcium intake. Communication should be tailored towards women’s
specific information needs and misconceptions regarding calcium for bone health, especially
given the recent controversies regarding calcium supplementation in the media. Even more
so, Canadian recommendations for calcium have changed from 1500 mg/day in 2002 to 1200
mg/day in 2010. This change in calcium intake recommendations can also add to the
confusion regarding calcium supplement use. The health care practitioner therefore has a role
Chapter 5: Discussion 90
in educating the patient about the change in recommendations and helping clarify whether
patients require calcium supplements and the level of supplementation.
5.8 Recommendations for Future Research
This thesis work raises several questions that should be examined further in future
research. First, this study identified a low proportion of calcium supplement users among a
population of women that should be regularly using calcium supplements because of low
dietary calcium intake and increased risk for osteoporosis. The current Canadian osteoporosis
guidelines recommend that individuals at risk for osteoporosis implement changes to their
lifestyle to prevent fractures, including maintaining recommended levels of calcium intake
[1]. However, the general Canadian population of women 50 years and older do not meet the
2010 daily calcium intake recommendation of 1200 mg/day, increasing their susceptibility to
osteoporotic fracture [19]. Negative media attention as a result of recent controversies
regarding calcium supplement use may further reduce calcium intake and supplement use.
Future studies can address the effect of negative media attention with regards to calcium use.
For example, a time-series analysis can be done to examine the possible changes in calcium
supplement use among older Canadian postmenopausal women using NHPS data, and
highlighting the years that Canadian osteoporosis guidelines changed recommended calcium
intake levels and publications of controversial RCT or meta-analysis data regarding calcium
supplement safety.
This study also highlights the importance of cues to action variables in influencing
health behaviour. Given that the cues to action component of the HBM has not been
systematically studied, future research should focus on structurally defining this component
Chapter 5: Discussion 91
and examining its influence on chronic disease prevention. For example, longitudinal studies
can be conducted in women at-risk for osteoporosis to identify if cues to actions (such as
physician visits and BMD tests) predict supplement use.
Given the importance of the knowledge variable in the HBM and the lack of calcium
supplement use in women on osteoporosis treatment, future studies should further examine
the association between knowledge and calcium supplement use specifically. To our
knowledge no prior study has done this and our knowledge measures led to inconclusive
results.
5.9 Conclusions
This study adds to knowledge regarding correlates of calcium supplement use.
Previous studies regarding health behaviour and dietary calcium intake and/or supplement
use have included small study samples that are not generalizable to older women. Our study,
however, consisted of a large random-stratified sample of community-dwelling older Ontario
women, who were demographically similar to the general population of older Ontario
women. In addition, most previous studies did not use theory driven identification or
examination of variables, possibly limiting the number of independent variables studied. The
work of this thesis was framed by the conceptual framework of the HBM, thereby providing
a rationale for the choice of predictor variables.
Greater perceived susceptibility to osteoporosis, greater perceived benefits towards
calcium, NHP use, a fall within the past year, a previous BMD test and residence in a
metropolitan region were factors associated with calcium supplement use. As well, women
who had discussed the importance of calcium for bone with a physician and discussed
Chapter 5: Discussion 92
osteoporosis with a pharmacist were more likely to use calcium supplements. Therefore,
health care practitioners, especially pharmacists who are experts on therapeutics and on the
front-line of patient care, are in a unique position to educate patients about the importance of
calcium and osteoporosis prevention.
Lastly, our results indicated that women were not achieving recommended calcium
intake levels through diet alone, yet most were not taking calcium supplements. Those on
cyclical etidronate therapy were less likely to take calcium supplements, highlighting the
importance and need for women to be given clear messages from their health care
professionals about the role of calcium supplementation in osteoporosis prevention and
management.
References
93
References
1. Papaioannou, A, Morin S, Cheung AM, Atkinson S, Brown JP, et al. 2010 clinical
practice guidelines for the diagnosis and management of osteoporosis in Canada:
summary. CMAJ 2010; 182: p. 1864-73.
2. Looker, AC, Orwoll ES, Johnston CC, Jr., Lindsay RL, Wahner HW, et al.
Prevalence of low femoral bone density in older U.S. adults from NHANES III. J
Bone Miner Res 1997; 12: p. 1761-8.
3. Bringhurst FR, Demay MB, and HM K, Mineral metabolism: In Williams Textbook
of Endocrinology. 2003, Elsevier: Amsterdam. p. 1317–1320.
4. Fechtenbaum, J, Cropet C, Kolta S, Horlait S, Orcel P, et al. The severity of vertebral
fractures and health-related quality of life in osteoporotic postmenopausal women.
Osteoporos Int 2005; 16: p. 2175-9.
5. Beringer, TR. Mortality and morbidity after hip fractures. BMJ 1994; 308: p. 343.
6. Elinge, E, Stenvall M, von Heideken Wagert P, Lofgren B, Gustafson Y, et al. Daily
life among the oldest old with and without previous hip fractures. Scand J Occup
Ther 2005; 12: p. 51-8.
7. Cadarette, SM and Burden AM. Measuring and improving adherence to osteoporosis
pharmacotherapy. Curr Opin Rheumatol 2010; 22: p. 397-403.
8. Papadimitropoulos, EA, Coyte PC, Josse RG, and Greenwood CE. Current and
projected rates of hip fracture in Canada. CMAJ 1997; 157: p. 1357-63.
9. Kmetic, A, Joseph L, Berger C, and Tenenhouse A. Multiple imputation to account
for missing data in a survey: estimating the prevalence of osteoporosis. Epidemiology
2002; 13: p. 437-44.
10. Boonen, S, Vanderschueren D, Haentjens P, and Lips P. Calcium and vitamin D in
the prevention and treatment of osteoporosis - a clinical update. J Intern Med 2006;
259: p. 539-52.
11. Chandra, RK, Imbach A, Moore C, Skelton D, and Woolcott D. Nutrition of the
elderly. CMAJ 1991; 145: p. 1475-87.
12. Chang, S, Chen C, Chen P, and Chung U. Predictors of community women's
osteoporosis prevention intention--a pilot study. J Nurs Res 2003; 11: p. 231-240.
13. Jackson, RD, LaCroix AZ, Gass M, Wallace RB, Robbins J, et al. Calcium plus
vitamin D supplementation and the risk of fractures. N Engl J Med 2006; 354: p. 669-
83.
14. Tang, BM, Eslick GD, Nowson C, Smith C, and Bensoussan A. Use of calcium or
calcium in combination with vitamin D supplementation to prevent fractures and
bone loss in people aged 50 years and older: a meta-analysis. Lancet 2007; 370: p.
657-66.
15. Spangler, M, Phillips BB, Ross MB, and Moores KG. Calcium supplementation in
postmenopausal women to reduce the risk of osteoporotic fractures. Am J Health Syst
Pharm 2011; 68: p. 309-18.
16. Johnson-Down, L, L'Abbe MR, Lee NS, and Gray-Donald K. Appropriate calcium
fortification of the food supply presents a challenge. J Nutr 2003; 133: p. 2232-8.
References 94
17. Rucker, D, Allan JA, Fick GH, and Hanley DA. Vitamin D insufficiency in a
population of healthy western Canadians. CMAJ 2002; 166: p. 1517-24.
18. Gray-Donald, K, Jacobs-Starkey L, and Johnson-Down L. Food habits of Canadians:
reduction in fat intake over a generation. Can J Public Health 2000; 91: p. 381-385.
19. Vatanparast, H, Dolega-Cieszkowski JH, and Whiting SJ. Many adult Canadians are
not meeting current calcium recommendations from food and supplement intake.
Appl Physiol Nutr Metab 2009; 34: p. 191-6.
20. Poliquin, S, Joseph L, and Gray-Donald K. Calcium and vitamin D intakes in an adult
Canadian population. Can J Diet Pract Res 2009; 70: p. 21-7.
21. Gerend, M, Erchull M, Aiken L, and Maner J. Reasons and risk: Factors underlying
women's perceptions of susceptibility to osteoporosis. Maturitas 2006; 55: p. 227-
237.
22. Hammond, G, Chapman G, and Barr S. Healthy midlife Canadian women: how bone
health is considered in their food choice systems. J Hum Nutr Diet 2011; 24: p. 61-67.
23. Hernandez-Rauda, R and Martinez-Garcia S. Osteoporosis-related life habits and
knowledge about osteoporosis among women in El Salvador: a cross-sectional study.
BMC Musculoskelet Disord 2004; 5: p. 26.
24. Mojtahedi, M, Plawecki K, Chapman-Novakofski K, McAuley E, and Evans E. Older
Black Women Differ in Calcium Intake Source Compared to Age- and
Socioeconomic Status-Matched White Women. J Am Diet Assoc 1102; 106: p. 1102-
1107.
25. Nahin, R, Fitzpatrick A, Williamson J, Burke G, DeKosky S, et al. Use of herbal
medicine and other dietary supplements in community-dwelling older people:
Baseline data from the Ginkgo Evaluation of Memory study. J Am Geriatr Soc 1725;
54: p. 1725-1735.
26. Sandison, R, Gray M, and Reid D. Lifestyle factors for promoting bone health in
older women. J Adv Nurs 2004; 45: p. 603-610.
27. Saw, S, Hong C, Lee J, Wong M, Chan M, et al. Awareness and health beliefs of
women towards osteoporosis. Osteoporos Int 2003; 14: p. 595-601.
28. von Hurst, PR and Wham CA. Attitudes and knowledge about osteoporosis risk
prevention: a survey of New Zealand women. Public Health Nutrition 2007; 10: p.
747-53.
29. Youssefi, F, Youssefi A, and Delkhosh M. The knowledge of Iranian menopausal
women about preventive factors of osteoporosis. J Obstet Gynaecol 2011; 31: p. 42.
30. Yu, S and Huang Y. Knowledge of, attitudes toward, and activity to prevent
osteoporosis among middle-aged and elderly women. J Nurs Res 2003; 11: p. 65-72.
31. Ali, NS and Bennett SJ. Postmenopausal women: Factors in osteoporosis preventive
behaviors. J Gerontol Nurs 1992; 18: p. 23-32.
32. Chang, S. Knowledge, health beliefs, and behaviours in first-degree relatives of
women suffering from osteoporosis. J Clin Nurs 2006; 15: p. 227-229.
33. Chang, S, Hong C, and Yang R. Cross-sectional survey of women in Taiwan with
first-degree relatives with osteoporosis: knowledge, health beliefs, and preventive
behaviors. J Nurs Res 2007; 15: p. 224-232.
References 95
34. Hsieh, C, Wang C, McCubbin M, Zhang S, and Inouye J. Factors influencing
osteoporosis preventive behaviours: Testing a path model. J Adv Nurs 2008; 62: p.
336-345.
35. Werner, P, Olchovsky D, and Vered I. Osteoporosis health-related behavior among
healthy peri-menopausal and post-menopausal Israeli Jewish and Arab women. Aging
Clinical and Experimental Research 2005; 17: p. 100-107.
36. Holbrook, TL and Barrett-Connor E. Calcium intake: covariates and confounders. Am
J Clin Nutr 1991; 53: p. 741-4.
37. Gulliver, P and Horwath CC. Assessing women's perceived benefits, barriers, and
stage of change for meeting milk product consumption recommendations. J Am Diet
Assoc 2001; 101: p. 1354-7.
38. Ali, NS and Twibell RK. Health promotion and osteoporosis prevention among
postmenopausal women. Prev Med 1995; 24: p. 528-34.
39. Pender, NJ, Murdaugh CL, and Parsons MA. Health promotion in nursing
practice.2006: Prentice Hall.
40. Cadarette, SM, Gignac MA, Beaton DE, Jaglal SB, and Hawker GA. Psychometric
properties of the "Osteoporosis and You" questionnaire: osteoporosis knowledge
deficits among older community-dwelling women. Osteoporos Int 2007; 18: p. 981-9.
41. Hsieh, C, Novielli KD, Diamond JJ, and Cheruva D. Health beliefs and attitudes
toward the prevention of osteoporosis in older women. Menopause 2001; 8: p. 372-6.
42. Swaim, RA, Barner JC, and Brown CM. The relationship of calcium intake and
exercise to osteoporosis health beliefs in postmenopausal women. Res Social Adm
Pharm 2008; 4: p. 153-63.
43. Glanz, K, Rimer BK, and Viswanath K. Health behavior and health education: theory,
research, and practice.2008: Jossey-Bass.
44. Hochbaum, G. Public participation in medical screening programs: a
sociopsychological study.1958, Washington, D.C.: Government Printing Office.
45. Janz, NK, Champion V, and Strecher V, The health belief model, in Health behavior
and health education: theory, research, and practice K. Glanz, B. Rimer, and F.
Lewis, Editors. 2002, Jossey-Bass.
46. Rosenstock, IM, Strecher VJ, and Becker MH. Social learning theory and the Health
Belief Model. Health Educ Q 1988; 15: p. 175-83.
47. Winzenberg, TM, Riley M, Frendin S, Oldenburg B, and Jones G. Sociodemographic
factors associated with calcium intake in premenopausal women: a cross-sectional
study. Eur J Clin Nutr 2005; 59: p. 463-6.
48. Ali, NS and Twibell KR. Barriers to osteoporosis prevention in perimenopausal and
elderly women. Geriatr Nurs 1994; 15: p. 201-5; quiz 206.
49. French, MR, Moore K, Vernace-Inserra F, and Hawker GA. Factors that influence
adherence to calcium recommendations. Can J Diet Pract Res 2005; 66: p. 25-9.
50. Cline, RR and Worley MM. Osteoporosis health beliefs and self-care behaviors: an
exploratory investigation. J Am Pharm Assoc (2003) 2006; 46: p. 356-63.
51. Tyler, CV, Werner JJ, Panaite V, Snyder SM, Ford DB, et al. Barriers to
supplemental calcium use among women in suburban family practice: a report from
the Cleveland Clinic Ambulatory Research Network (CleAR-eN). J Am Board Fam
Med 2008; 21: p. 293-9.
References 96
52. French, MR, Vernace-Inserra F, and Hawker GA. A prospective study to identify
factors affecting adherence to recommended daily calcium intake in women with low
bone mineral density. J Am Coll Nutr 2008; 27: p. 88-95.
53. Cadarette, SM, Gignac MA, Jaglal SB, Beaton DE, and Hawker GA. Access to
osteoporosis treatment is critically linked to access to dual-energy x-ray
absorptiometry testing. Med Care 2007; 45: p. 896-901.
54. Andersen, RM. Revisiting the behavioral model and access to medical care: does it
matter? J Health Soc Behav 1995; 36: p. 1-10.
55. Hawker, GA, Wright JG, Badley EM, and Coyte PC. Perceptions of, and willingness
to consider, total joint arthroplasty in a population-based cohort of individuals with
disabling hip and knee arthritis. Arthritis Rheum 2004; 51: p. 635-41.
56. Hawker, GA, Wright JG, Coyte PC, Williams JI, Harvey B, et al. Determining the
need for hip and knee arthroplasty: the role of clinical severity and patients'
preferences. Med Care 2001; 39: p. 206-16.
57. Hawker, GA, Wright JG, Coyte PC, Williams JI, Harvey B, et al. Differences
between men and women in the rate of use of hip and knee arthroplasty. N Engl J
Med 2000; 342: p. 1016-22.
58. Cadarette, SM, Dickson L, Gignac MA, Beaton DE, Jaglal SB, et al. Predictors of
locating women six to eight years after contact: internet resources at recruitment may
help to improve response rates in longitudinal research. BMC Med Res Methodol
2007; 7: p. 22.
59. Cadarette, SM, Beaton DE, and Hawker GA. Osteoporosis health belief scale: minor
changes were required after telephone administration among women. J Clin
Epidemiol 2004; 57: p. 154-66.
60. Cadarette, SM, Gignac MA, Jaglal SB, Beaton DE, and Hawker GA. Measuring
patient perceptions about osteoporosis pharmacotherapy. BMC Res Notes 2009; 2: p.
133.
61. Ware, J, Kosinski M, and Dewey J. How to score version 2 of the SF-36 health
survey (standard and acute forms).2000, Lincoln, RI: QualityMetric Incorporated.
62. Fan, T, Bolge SC, Nocea G, and Sen SS. Validity and reproducibility of questionnaire
about preventive behaviors among French and Spanish post-menopausal women with
osteoporosis in the calcium and vitamin intake (CAVIT) study. Calcif Tissue Int
2008; 82: p. S188.
63. Satia-Abouta, J, Patterson RE, King IB, Stratton KL, Shattuck AL, et al. Reliability
and validity of self-report of vitamin and mineral supplement use in the vitamins and
lifestyle study. Am J Epidemiol 2003; 157: p. 944-54.
64. McCallum, J. The SF-36 in an Australian sample: validating a new, generic health
status measure. Aust J Public Health 1995; 19: p. 160-6.
65. Keller, SD, WareJr JE, Bentler PM, Aaronson NK, Alonso J, et al. Use of Structural
Equation Modeling to Test the Construct Validity of the SF-36 Health Survey in Ten
Countries: Results from the IQOLA Project. J Clin Epidemiol 1998; 51: p. 1179-
1188.
66. Ware, JE, Jr. The status of health assessment 1994. Annu Rev Public Health 1995; 16:
p. 327-54.
References 97
67. Ware, J, Kosinski M, and Keller S. SF-36 Physical and Mental Health Summary
Scales: A User's Manual.1994, Boston, MA: The Health Institute.
68. Health Canada. Drug and Health Products http://www.hc-sc.gc.ca/dhp-
mps/prodnatur/legislation/acts-lois/prodnatur/index-eng.php. [cited 2008 November
28].
69. Whelan, AM, Jurgens TM, and Bowles SK. Natural health products in the prevention
and treatment of osteoporosis: systematic review of randomized controlled trials. Ann
Pharmacother 2006; 40: p. 836-49.
70. Health Canada Public Health Agency of Canada. Canada's Physical Activity Guide
for Older Adults http://www.phac-aspc.gc.ca/hp-ps/hl-mvs/pag-gap/pdf/guide-older-
eng.pdf. [cited 2008 November 26].
71. Brenneman, S, Blau E, Chen Y, and Abbott T. Validation of a patient questionnaire,
'Osteoporosis and You', designed to assess osteoporosis-related attitudes, knowledge
and behavior [abstract]. J Bone Miner Res 2002; 17: p. S466.
72. Osteoporosis Canada. Calculate My Calcium. [December 16, 2010]; Available from:
http://www.osteoporosis.ca/index.php/ci_id/5355/la_id/1.htm.
73. Siminoski, K, Jiang G, Adachi JD, Hanley DA, Cline G, et al. Accuracy of height loss
during prospective monitoring for detection of incident vertebral fractures.
Osteoporos Int 2005; 16: p. 403-10.
74. Cadarette, SM, Beaton DE, Gignac MA, Jaglal SB, Dickson L, et al. Minimal error in
self-report of having had DXA, but self-report of its results was poor. J Clin
Epidemiol 2007; 60: p. 1306-11.
75. Cadarette, SM, Jaglal SB, Raman-Wilms L, Beaton DE, and Paterson JM.
Osteoporosis quality indicators using healthcare utilization data. Osteoporos Int 2011;
22: p. 1335-42.
76. Cadarette, SM, Carney G, Baek D, Gunraj N, Paterson JM, et al. Osteoporosis
medication prescribing in British Columbia and Ontario: impact of public drug
coverage. Osteoporos Int 2011.
77. SAS Institute Inc., Statistical Analysis Software. 2008: Cary, NC.
78. DeVellis, R. Scale development: theory and applications.2003: Sage Publications,
Inc.
79. Hosmer, DW and Lemeshow S. Applied logistic regression.2000: Wiley.
80. Hilbe, J. Logistic regression models.2009: CRC Press.
81. Kleinbaum, D, Kupper L, Muller K, and Nizam A. Applied Regression Analysis and
Other Multivariable Methods, 3 rd Edition 1998, Pacific Grove: Duxbury Press.
82. Moore, D, McCabe G, and Craig B. Introduction to the practice of statistics.2009:
W.H. Freeman.
83. Bendel, RB and Afifi AA. Comparison of Stopping Rules in Forward "Stepwise"
Regression.
84. Mickey, RM and Greenland S. The impact of confounder selection criteria on effect
estimation. Am J Epidemiol 1989; 129: p. 125-37.
85. Pampel, FC. Logistic regression: a primer.2000: Sage Publications.
86. Long, JS. Regression models for categorical and limited dependent variables.1997:
Sage Publications.
References 98
87. Peduzzi, P, Concato J, Kemper E, Holford TR, and Feinstein AR. A simulation study
of the number of events per variable in logistic regression analysis. J Clin Epidemiol
1996; 49: p. 1373-9.
88. Agresti, A, An introduction to categorical data analysis. 2007, Wiley-Interscience.
89. Statistics Canada, A portrait of seniors in Canada. 2006.
90. Wilkins, K. Social support and mortality in seniors. Health Rep 2003; 14: p. 21-34.
91. Daoust, JL, Mercer LC, and Duncan AM. Prevalence of natural health product use in
healthy postmenopausal women. Menopause 2006; 13: p. 241-50.
92. Harrison, JA, Mullen PD, and Green LW. A meta-analysis of studies of the Health
Belief Model with adults. Health Educ Res 1992; 7: p. 107-16.
93. Statistics Canada. Community Highlights for East York- Census 2001. 2001;
Available from:
http://www12.statcan.ca/english/Profil01/CP01/Details/Page.cfm?Lang=E&Geo1=CS
D&Code1=3520006&Geo2=PR&Code2=35&Data=Count&SearchText=East%20Yo
rk&SearchType=Begins&SearchPR=01&B1=All&Custom=.
94. Statistics Canada. Community Highlights for Oxford County- Census 2001. 2001
[cited 2011 August 10]; Available from:
http://www12.statcan.ca/english/profil01/CP01/Details/Page.cfm?Lang=E&Geo1=C
D&Code1=3532&Geo2=PR&Code2=35&Data=Count&SearchText=oxford%20coun
ty&SearchType=Begins&SearchPR=35&B1=All&Custom=.
95. Singh, SR and Levine MA. Natural health product use in Canada: analysis of the
National Population Health Survey. Can J Clin Pharmacol 2006; 13: p. e240-50.
96. Estok, PJ, Sedlak CA, Doheny MO, and Hall R. Structural model for osteoporosis
preventing behavior in postmenopausal women. Nurs Res 2007; 56: p. 148-58.
97. Jamal, SA, Ridout R, Chase C, Fielding L, Rubin LA, et al. Bone mineral density
testing and osteoporosis education improve lifestyle behaviors in premenopausal
women: a prospective study. J Bone Miner Res 1999; 14: p. 2143-9.
98. Marci, CD, Anderson WB, Viechnicki MB, and Greenspan SL. Bone mineral
densitometry substantially influences health-related behaviors of postmenopausal
women. Calcif Tissue Int 2000; 66: p. 113-8.
99. McLeod, KM, McCann SE, Horvath PJ, and Wactawski-Wende J. Predictors of
change in calcium intake in postmenopausal women after osteoporosis screening. J
Nutr 2007; 137: p. 1968-73.
100. Sedlak, CA, Doheny MO, Estok PJ, Zeller RA, and Winchell J. DXA, health beliefs,
and osteoporosis prevention behaviors. J Aging Health 2007; 19: p. 742-56.
101. Winzenberg, T, Oldenburg B, Frendin S, De Wit L, Riley M, et al. The effect on
behavior and bone mineral density of individualized bone mineral density feedback
and educational interventions in premenopausal women: a randomized controlled trial
[NCT00273260]. BMC Public Health 2006; 6: p. 12.
102. Mazor, KM, Velten S, Andrade SE, and Yood RA. Older women's views about
prescription osteoporosis medication: a cross-sectional, qualitative study. Drugs
Aging 2010; 27: p. 999-1008.
103. Elias, MN, Burden AM, and Cadarette SM. The impact of pharmacist interventions
on osteoporosis management: a systematic review. Osteoporos Int 2011; 22: p. 2587-
96.
References 99
104. Bolland, MJ, Avenell A, Baron JA, Grey A, MacLennan GS, et al. Effect of calcium
supplements on risk of myocardial infarction and cardiovascular events: meta-
analysis. BMJ 2010; 341: p. c3691.
105. Lewis, JR, Calver J, Zhu K, Flicker L, and Prince RL. Calcium supplementation and
the risks of atherosclerotic vascular disease in older women: results of a 5-year RCT
and a 4.5-year follow-up. J Bone Miner Res 2011; 26: p. 35-41.
106. Reid, IR, Bolland MJ, Avenell A, and Grey A. Cardiovascular effects of calcium
supplementation. Osteoporos Int 2011; 22: p. 1649-58.
107. American Society of Bone and Mineral Research, American Society for Bone and
Mineral Research Statement on Potential Cardiovascular Risks Associated with
Calcium Supplements. 2010.
108. Institute of Medicine. Dietary Reference Intakes for Calcium and Vitamin D.2011,
Washington, DC: The National Academic Press.
109. Gallagher, TC, Geling O, and Comite F. Missed opportunities for prevention of
osteoporotic fracture. Arch Intern Med 2002; 162: p. 450-6.
110. Sunyecz, JA. The use of calcium and vitamin D in the management of osteoporosis.
Ther Clin Risk Manag 2008; 4: p. 827-36.
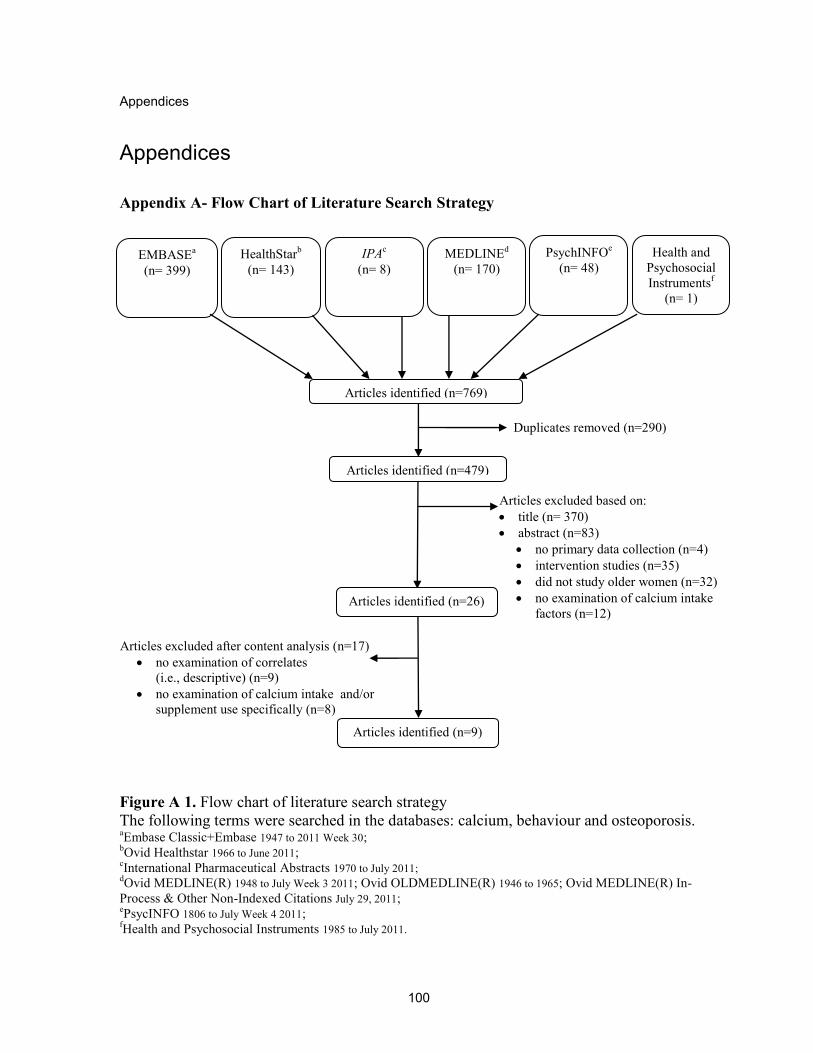
Appendices
100
Appendices
Appendix A- Flow Chart of Literature Search Strategy
Figure A 1. Flow chart of literature search strategy
The following terms were searched in the databases: calcium, behaviour and osteoporosis. aEmbase Classic+Embase 1947 to 2011 Week 30;
bOvid Healthstar 1966 to June 2011;
cInternational Pharmaceutical Abstracts 1970 to July 2011;
dOvid MEDLINE(R) 1948 to July Week 3 2011; Ovid OLDMEDLINE(R) 1946 to 1965; Ovid MEDLINE(R) In-
Process & Other Non-Indexed Citations July 29, 2011; ePsycINFO 1806 to July Week 4 2011;
fHealth and Psychosocial Instruments 1985 to July 2011.
Articles excluded based on:
title (n= 370)
abstract (n=83)
no primary data collection (n=4)
intervention studies (n=35)
did not study older women (n=32)
no examination of calcium intake
factors (n=12)
Articles excluded after content analysis (n=17)
no examination of correlates
(i.e., descriptive) (n=9)
no examination of calcium intake and/or
supplement use specifically (n=8)
Duplicates removed (n=290)
Articles identified (n=769)
EMBASEa
(n= 399)
HealthStarb
(n= 143)
IPAc
(n= 8)
MEDLINEd
(n= 170)
PsychINFOe
(n= 48)
Articles identified (n=26)
Health and
Psychosocial
Instrumentsf
(n= 1)
Articles identified (n=479)
Articles identified (n=9)
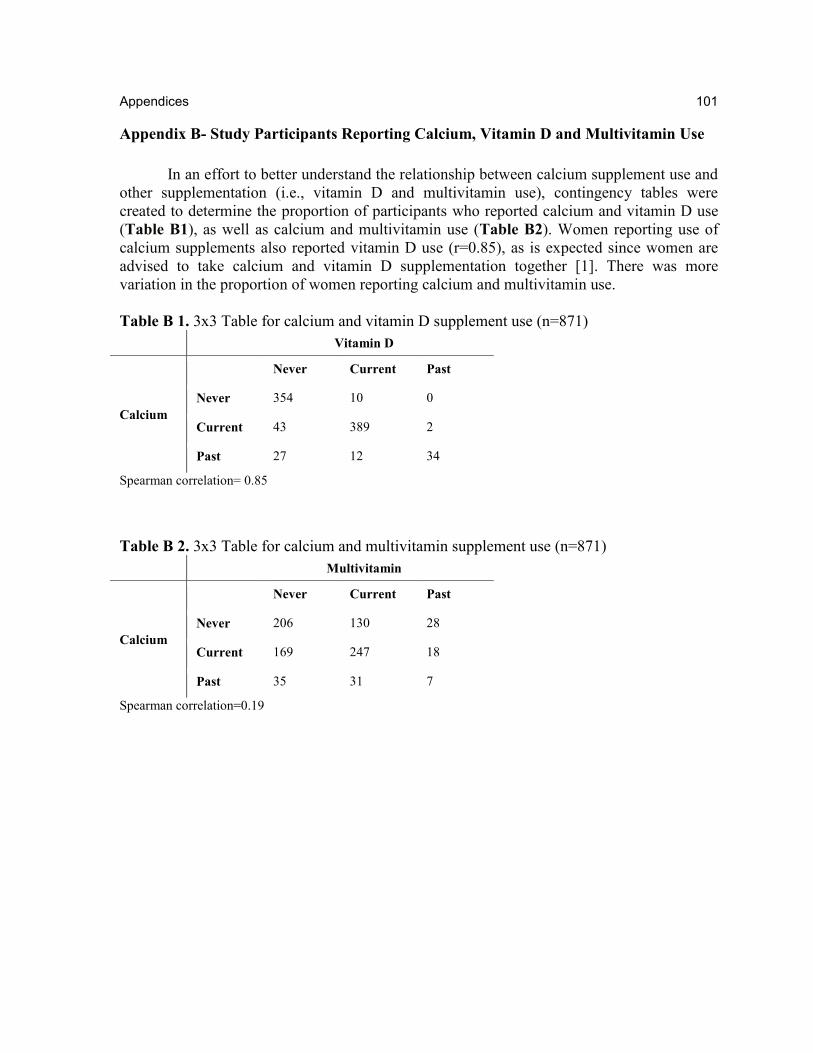
Appendices 101
Appendix B- Study Participants Reporting Calcium, Vitamin D and Multivitamin Use
In an effort to better understand the relationship between calcium supplement use and
other supplementation (i.e., vitamin D and multivitamin use), contingency tables were
created to determine the proportion of participants who reported calcium and vitamin D use
(Table B1), as well as calcium and multivitamin use (Table B2). Women reporting use of
calcium supplements also reported vitamin D use (r=0.85), as is expected since women are
advised to take calcium and vitamin D supplementation together [1]. There was more
variation in the proportion of women reporting calcium and multivitamin use.
Table B 1. 3x3 Table for calcium and vitamin D supplement use (n=871)
Vitamin D
Calcium
Never Current Past
Never 354 10 0
Current 43 389 2
Past 27 12 34
Spearman correlation= 0.85
Table B 2. 3x3 Table for calcium and multivitamin supplement use (n=871)
Multivitamin
Calcium
Never Current Past
Never 206 130 28
Current 169 247 18
Past 35 31 7
Spearman correlation=0.19
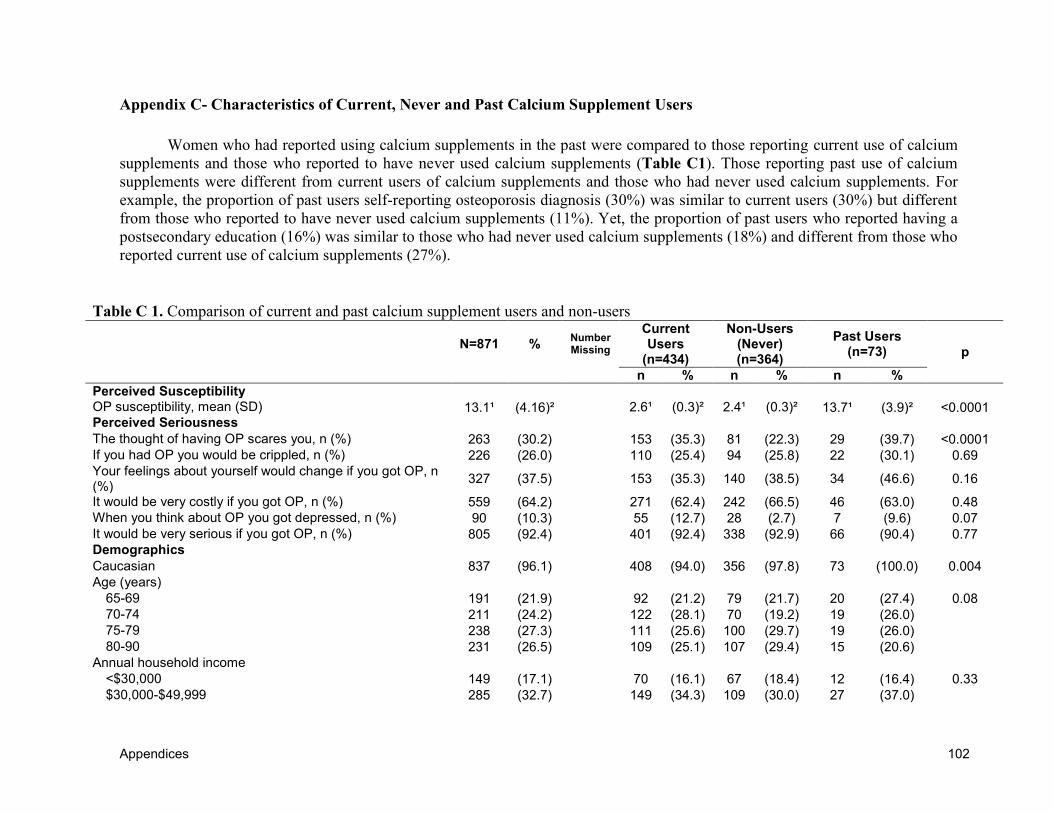
Appendices 102
Appendix C- Characteristics of Current, Never and Past Calcium Supplement Users
Women who had reported using calcium supplements in the past were compared to those reporting current use of calcium
supplements and those who reported to have never used calcium supplements (Table C1). Those reporting past use of calcium
supplements were different from current users of calcium supplements and those who had never used calcium supplements. For
example, the proportion of past users self-reporting osteoporosis diagnosis (30%) was similar to current users (30%) but different
from those who reported to have never used calcium supplements (11%). Yet, the proportion of past users who reported having a
postsecondary education (16%) was similar to those who had never used calcium supplements (18%) and different from those who
reported current use of calcium supplements (27%).
Table C 1. Comparison of current and past calcium supplement users and non-users
N=871 %
Number Missing
Current Users
(n=434)
Non-Users (Never) (n=364)
Past Users (n=73) p
n % n % n %
Perceived Susceptibility OP susceptibility, mean (SD) 13.1¹ (4.16)² 2.6¹ (0.3)² 2.4¹ (0.3)² 13.7¹ (3.9)² <0.0001 Perceived Seriousness
The thought of having OP scares you, n (%) 263 (30.2) 153 (35.3) 81 (22.3) 29 (39.7) <0.0001
If you had OP you would be crippled, n (%) 226 (26.0) 110 (25.4) 94 (25.8) 22 (30.1) 0.69
Your feelings about yourself would change if you got OP, n (%)
327 (37.5) 153 (35.3) 140 (38.5) 34 (46.6) 0.16
It would be very costly if you got OP, n (%) 559 (64.2) 271 (62.4) 242 (66.5) 46 (63.0) 0.48
When you think about OP you got depressed, n (%) 90 (10.3) 55 (12.7) 28 (2.7) 7 (9.6) 0.07
It would be very serious if you got OP, n (%) 805 (92.4) 401 (92.4) 338 (92.9) 66 (90.4) 0.77 Demographics
Caucasian 837 (96.1) 408 (94.0) 356 (97.8) 73 (100.0) 0.004
Age (years)
65-69 191 (21.9) 92 (21.2) 79 (21.7) 20 (27.4) 0.08
70-74 211 (24.2) 122 (28.1) 70 (19.2) 19 (26.0)
75-79 238 (27.3) 111 (25.6) 100 (29.7) 19 (26.0)
80-90 231 (26.5) 109 (25.1) 107 (29.4) 15 (20.6)
Annual household income
<$30,000 149 (17.1) 70 (16.1) 67 (18.4) 12 (16.4) 0.33
$30,000-$49,999 285 (32.7) 149 (34.3) 109 (30.0) 27 (37.0)

Appendices 103
Table C1. Comparison of current and past calcium supplement users and non-users (continued)
N=871 % Number Missing
Current Users (n=434)
Non-Users (Never) (n=364)
Past Users (n=73)
p
n % n % n %
≥$50,000 89 (10.2) 46 (10.6) 32 (8.8) 11 (15.1)
Missing 348 (40.0) 169 (38.9) 156 (42.9) 23 (31.5)
Live Alone 473 (54.6) 4 242 (56.2) 190 (52.3) 41 (56.2) 0.54
Marital Status 2 0.24
Married/Common Law 397 (45.7) 209 (48.4) 152 (41.8) 36 (49.3)
Separated/Divorced 52 (6.0) 30 (6.9) 19 (5.2) 3 (4.1)
Single 62 (7.1) 32 (7.4) 27 (7.4) 3 (4.1)
Widow 358 (41.2) 161 (37.3) 166 (45.6) 31 (42.5)
Highest Level of Education 5 0.01
Grade school 190 (21.9) 92 (21.4) 85 (23.4) 13 (21.9)
High school 481 (55.5) 221 (51.4) 212 (58.4) 48 (55.5)
Post-secondary 195 (22.5) 117 (27.2) 66 (18.2) 12 (16.4)
Resided in Toronto 411 (47.2) 230 (53.0) 150 (41.2) 31 (42.5) 0.0028
Sociopsychological Factors
Health Status
Poor perceived health status (excellent/very good/good, fair/poor), n (%)
375 (43.1) 191 (44.0) 156 (42.9) 28 (38.4) 0.66
SF-36v2 Physical Functioning Composite Score, mean (SD) 43.7¹ (10.9)² 2 43.8¹ (10.9)² 43.7¹ (10.8)² 43.0¹ (11.7)² <0.0001
SF-36v2 Mental Functioning Composite Score, mean (SD) 53.6¹ (6.8)² 2 53.4¹ (6.6)² 53.8¹ (6.8)² 53.6¹ (7.3)² <0.0001
Health Motivation
You eat a well balanced diet, n (%) 769 (88.3) 387 (89.2) 311 (85.4) 71 (97.3) 0.01
You look for new information related to your health, n (%) 581 (66.7) 309 (71.2) 216 (59.3) 56 (76.7) 0.0003
Keeping healthy is very important for you, n (%) 864 (99.2) 432 (99.5) 359 (98.6) 73 (100.0) 0.21
You try to discover health problems early, n (%) 745 (85.5) 381 (87.8) 300 (82.4) 64 (87.7) 0.09
You follow recommendations to keep you healthy, n (%) 683 (78.4) 424 (97.7) 350 (96.2) 58 (79.5) 0.01
Preventive health checkups, n (%) 847 (97.2) 358 (82.5) 267 (73.4) 73 (100.0) 0.13
NHP use, n (%) 259 (29.7) 34 (7.8) 14 (3.9) 21 (28.8) <0.0001
Level of physical activity 0.0004
None, n (%) 283 (32.5) 130 (30.0) 148 (40.7) 15 (20.6)
Moderate, n (%) 205 (23.5) 221 (50.9) 173 (47.5) 18 (24.7)
Target, n (%) 383 (44.0) 83 (19.1) 43 (11.8) 40 (54.8)
Current smoker, n (%)
83 (9.5) 35 (8.12) 37 (10.2) 8 (11.0) 0.72
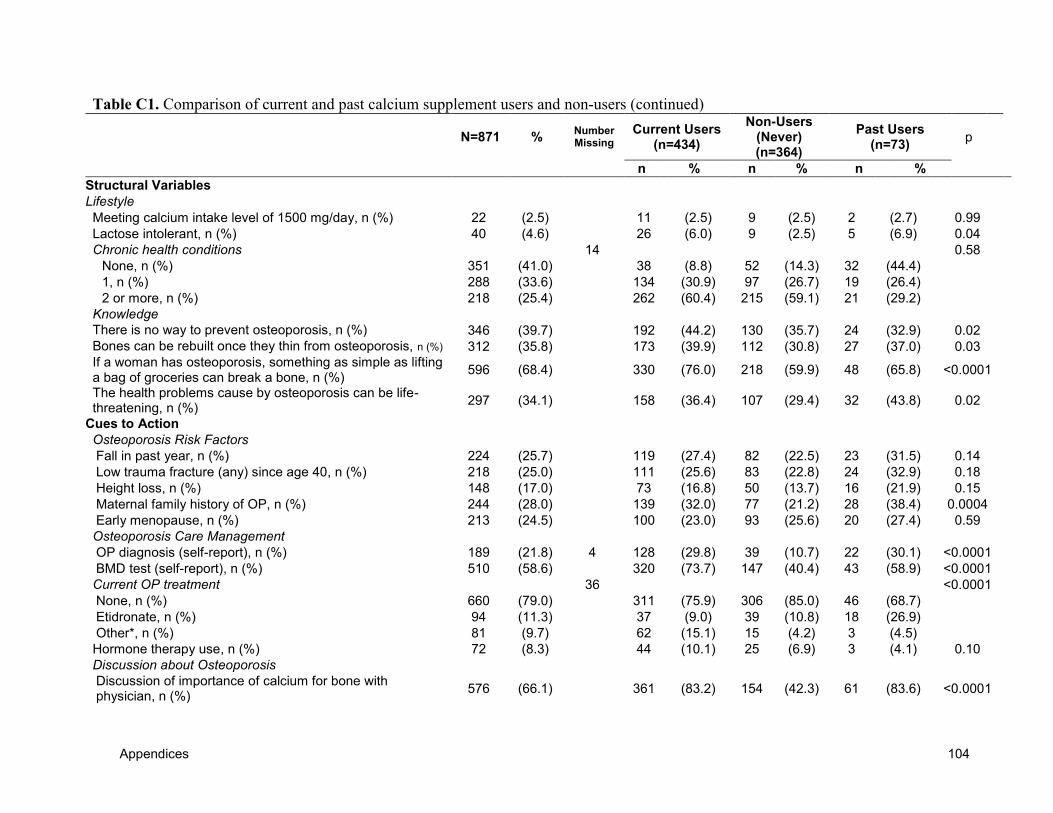
Appendices 104
Table C1. Comparison of current and past calcium supplement users and non-users (continued)
N=871 % Number Missing
Current Users (n=434)
Non-Users (Never) (n=364)
Past Users (n=73)
p
n % n % n %
Structural Variables
Lifestyle
Meeting calcium intake level of 1500 mg/day, n (%) 22 (2.5) 11 (2.5) 9 (2.5) 2 (2.7) 0.99
Lactose intolerant, n (%) 40 (4.6) 26 (6.0) 9 (2.5) 5 (6.9) 0.04
Chronic health conditions 14 0.58
None, n (%) 351 (41.0) 38 (8.8) 52 (14.3) 32 (44.4)
1, n (%) 288 (33.6) 134 (30.9) 97 (26.7) 19 (26.4)
2 or more, n (%) 218 (25.4) 262 (60.4) 215 (59.1) 21 (29.2)
Knowledge
There is no way to prevent osteoporosis, n (%) 346 (39.7) 192 (44.2) 130 (35.7) 24 (32.9) 0.02
Bones can be rebuilt once they thin from osteoporosis, n (%) 312 (35.8) 173 (39.9) 112 (30.8) 27 (37.0) 0.03
If a woman has osteoporosis, something as simple as lifting a bag of groceries can break a bone, n (%)
596 (68.4) 330 (76.0) 218 (59.9) 48 (65.8) <0.0001
The health problems cause by osteoporosis can be life-threatening, n (%)
297 (34.1) 158 (36.4) 107 (29.4) 32 (43.8) 0.02
Cues to Action
Osteoporosis Risk Factors
Fall in past year, n (%) 224 (25.7) 119 (27.4) 82 (22.5) 23 (31.5) 0.14
Low trauma fracture (any) since age 40, n (%) 218 (25.0) 111 (25.6) 83 (22.8) 24 (32.9) 0.18
Height loss, n (%) 148 (17.0) 73 (16.8) 50 (13.7) 16 (21.9) 0.15
Maternal family history of OP, n (%) 244 (28.0) 139 (32.0) 77 (21.2) 28 (38.4) 0.0004
Early menopause, n (%) 213 (24.5) 100 (23.0) 93 (25.6) 20 (27.4) 0.59
Osteoporosis Care Management
OP diagnosis (self-report), n (%) 189 (21.8) 4 128 (29.8) 39 (10.7) 22 (30.1) <0.0001
BMD test (self-report), n (%) 510 (58.6) 320 (73.7) 147 (40.4) 43 (58.9) <0.0001
Current OP treatment 36 <0.0001
None, n (%) 660 (79.0) 311 (75.9) 306 (85.0) 46 (68.7)
Etidronate, n (%) 94 (11.3) 37 (9.0) 39 (10.8) 18 (26.9)
Other*, n (%) 81 (9.7) 62 (15.1) 15 (4.2) 3 (4.5)
Hormone therapy use, n (%) 72 (8.3) 44 (10.1) 25 (6.9) 3 (4.1) 0.10
Discussion about Osteoporosis
Discussion of importance of calcium for bone with physician, n (%)
576 (66.1) 361 (83.2) 154 (42.3) 61 (83.6) <0.0001
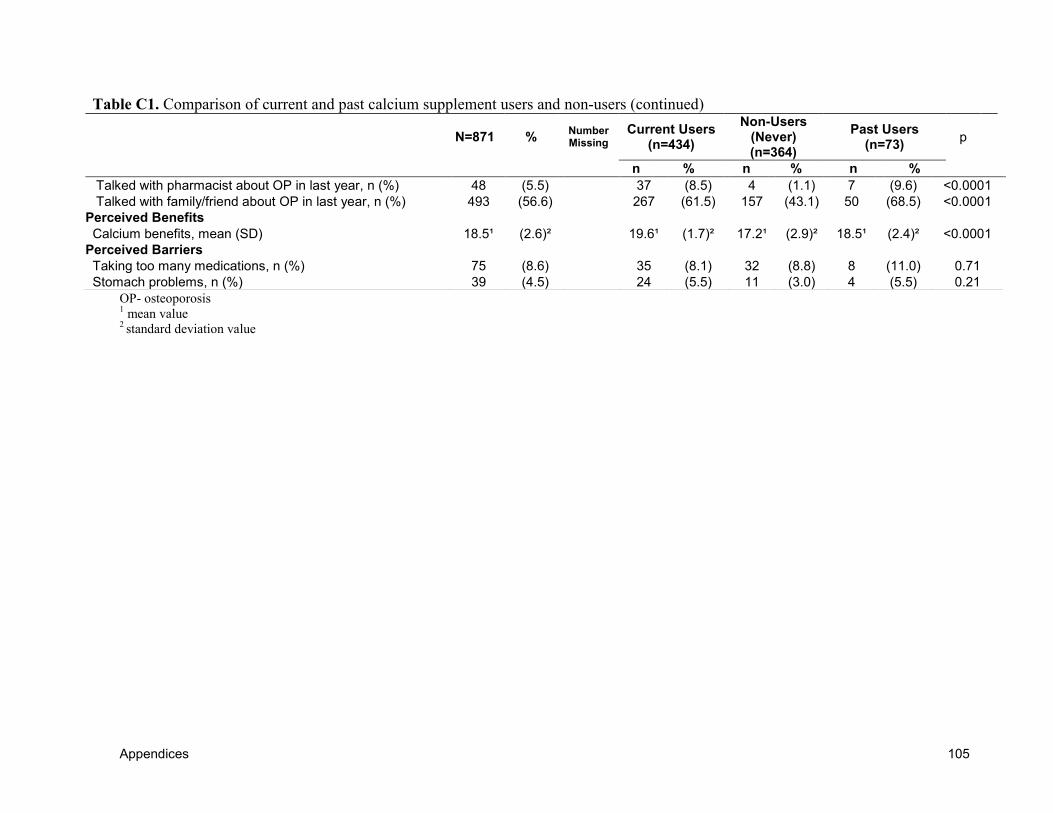
Appendices 105
OP- osteoporosis 1 mean value
2 standard deviation value
Table C1. Comparison of current and past calcium supplement users and non-users (continued)
N=871 % Number Missing
Current Users (n=434)
Non-Users (Never) (n=364)
Past Users (n=73)
p
n % n % n %
Talked with pharmacist about OP in last year, n (%) 48 (5.5) 37 (8.5) 4 (1.1) 7 (9.6) <0.0001
Talked with family/friend about OP in last year, n (%) 493 (56.6) 267 (61.5) 157 (43.1) 50 (68.5) <0.0001
Perceived Benefits
Calcium benefits, mean (SD) 18.5¹ (2.6)² 19.6¹ (1.7)² 17.2¹ (2.9)² 18.5¹ (2.4)² <0.0001
Perceived Barriers
Taking too many medications, n (%) 75 (8.6) 35 (8.1) 32 (8.8) 8 (11.0) 0.71
Stomach problems, n (%) 39 (4.5) 24 (5.5) 11 (3.0) 4 (5.5) 0.21
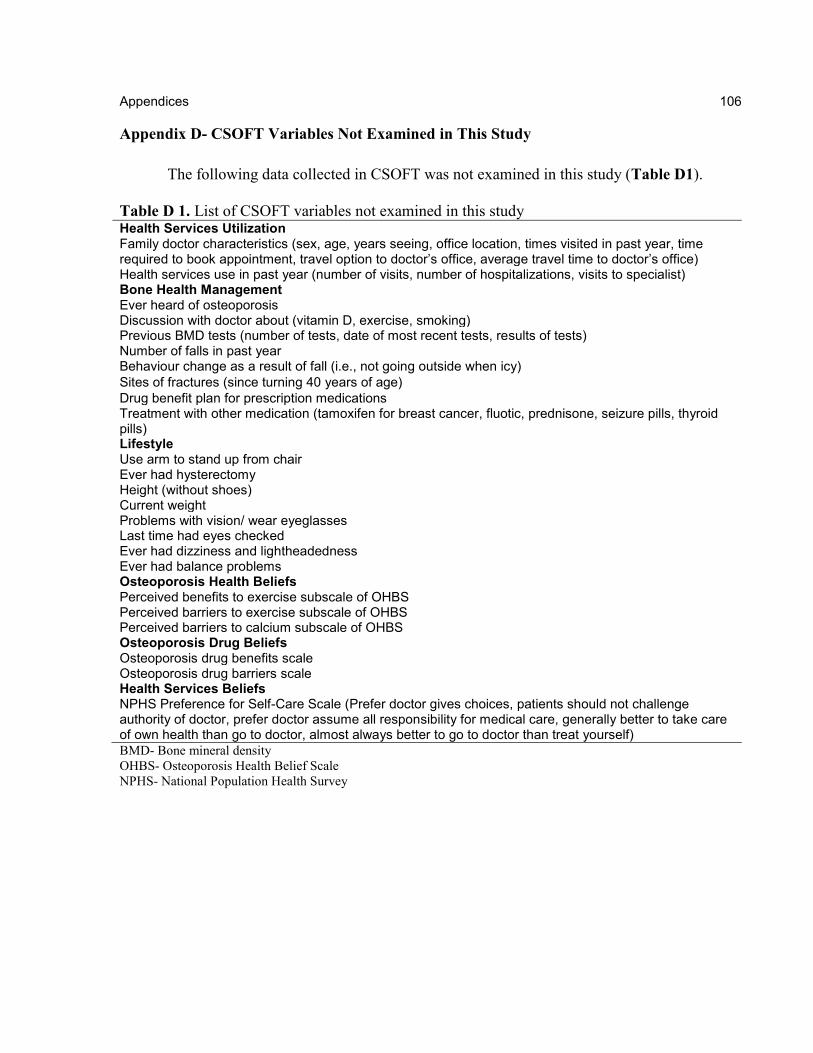
Appendices 106
106
Appendix D- CSOFT Variables Not Examined in This Study
The following data collected in CSOFT was not examined in this study (Table D1).
Table D 1. List of CSOFT variables not examined in this study Health Services Utilization Family doctor characteristics (sex, age, years seeing, office location, times visited in past year, time required to book appointment, travel option to doctor’s office, average travel time to doctor’s office) Health services use in past year (number of visits, number of hospitalizations, visits to specialist) Bone Health Management Ever heard of osteoporosis Discussion with doctor about (vitamin D, exercise, smoking) Previous BMD tests (number of tests, date of most recent tests, results of tests) Number of falls in past year Behaviour change as a result of fall (i.e., not going outside when icy)
Sites of fractures (since turning 40 years of age)
Drug benefit plan for prescription medications Treatment with other medication (tamoxifen for breast cancer, fluotic, prednisone, seizure pills, thyroid pills) Lifestyle Use arm to stand up from chair Ever had hysterectomy Height (without shoes) Current weight Problems with vision/ wear eyeglasses Last time had eyes checked Ever had dizziness and lightheadedness Ever had balance problems Osteoporosis Health Beliefs Perceived benefits to exercise subscale of OHBS Perceived barriers to exercise subscale of OHBS Perceived barriers to calcium subscale of OHBS Osteoporosis Drug Beliefs Osteoporosis drug benefits scale Osteoporosis drug barriers scale Health Services Beliefs NPHS Preference for Self-Care Scale (Prefer doctor gives choices, patients should not challenge authority of doctor, prefer doctor assume all responsibility for medical care, generally better to take care of own health than go to doctor, almost always better to go to doctor than treat yourself)
BMD- Bone mineral density
OHBS- Osteoporosis Health Belief Scale
NPHS- National Population Health Survey
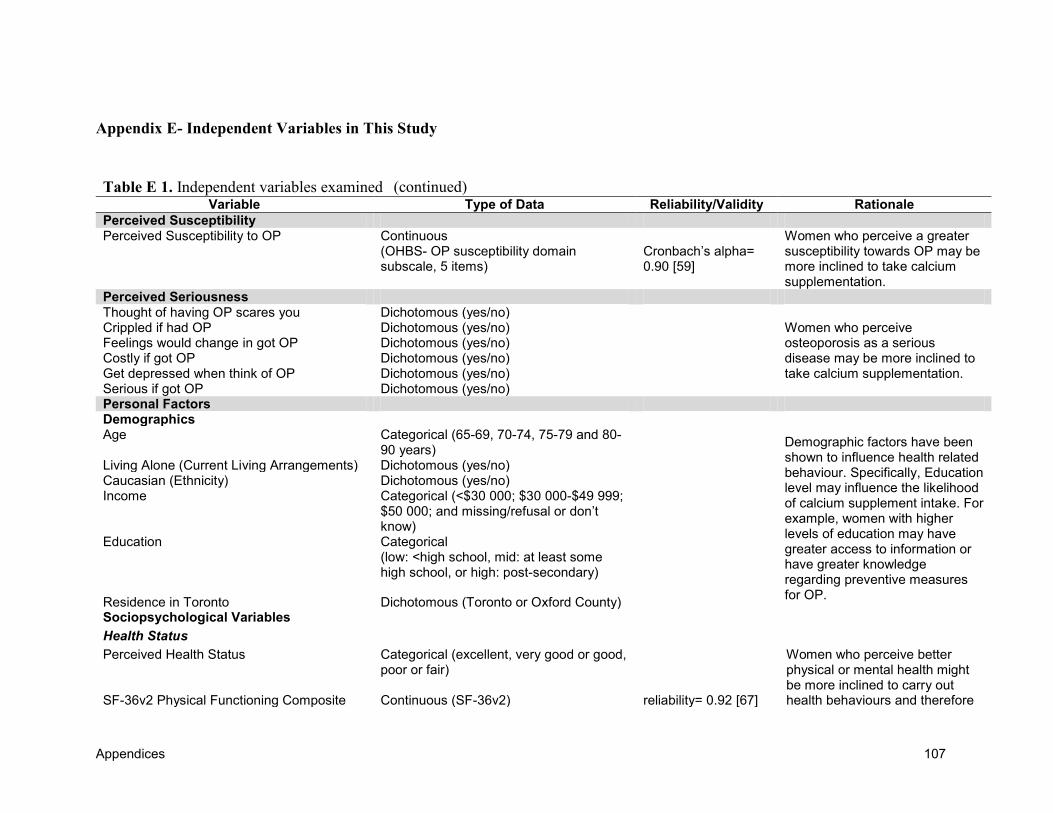
Appendices 107
(continued)
Appendix E- Independent Variables in This Study
Table E 1. Independent variables examined Variable Type of Data Reliability/Validity Rationale
Perceived Susceptibility Perceived Susceptibility to OP Continuous
(OHBS- OP susceptibility domain subscale, 5 items)
Cronbach’s alpha= 0.90 [59]
Women who perceive a greater susceptibility towards OP may be more inclined to take calcium supplementation.
Perceived Seriousness Thought of having OP scares you Crippled if had OP Feelings would change in got OP Costly if got OP Get depressed when think of OP Serious if got OP
Dichotomous (yes/no)
Women who perceive osteoporosis as a serious disease may be more inclined to take calcium supplementation.
Dichotomous (yes/no) Dichotomous (yes/no) Dichotomous (yes/no) Dichotomous (yes/no) Dichotomous (yes/no)
Personal Factors Demographics Age Categorical (65-69, 70-74, 75-79 and 80-
90 years)
Demographic factors have been shown to influence health related behaviour. Specifically, Education level may influence the likelihood of calcium supplement intake. For example, women with higher levels of education may have greater access to information or have greater knowledge regarding preventive measures for OP.
Living Alone (Current Living Arrangements) Dichotomous (yes/no) Caucasian (Ethnicity) Dichotomous (yes/no) Income Categorical (<$30 000; $30 000-$49 999;
$50 000; and missing/refusal or don’t know)
Education Categorical (low: <high school, mid: at least some high school, or high: post-secondary)
Residence in Toronto Dichotomous (Toronto or Oxford County) Sociopsychological Variables
Health Status
Perceived Health Status
Categorical (excellent, very good or good, poor or fair)
Women who perceive better physical or mental health might be more inclined to carry out health behaviours and therefore SF-36v2 Physical Functioning Composite Continuous (SF-36v2) reliability= 0.92 [67]
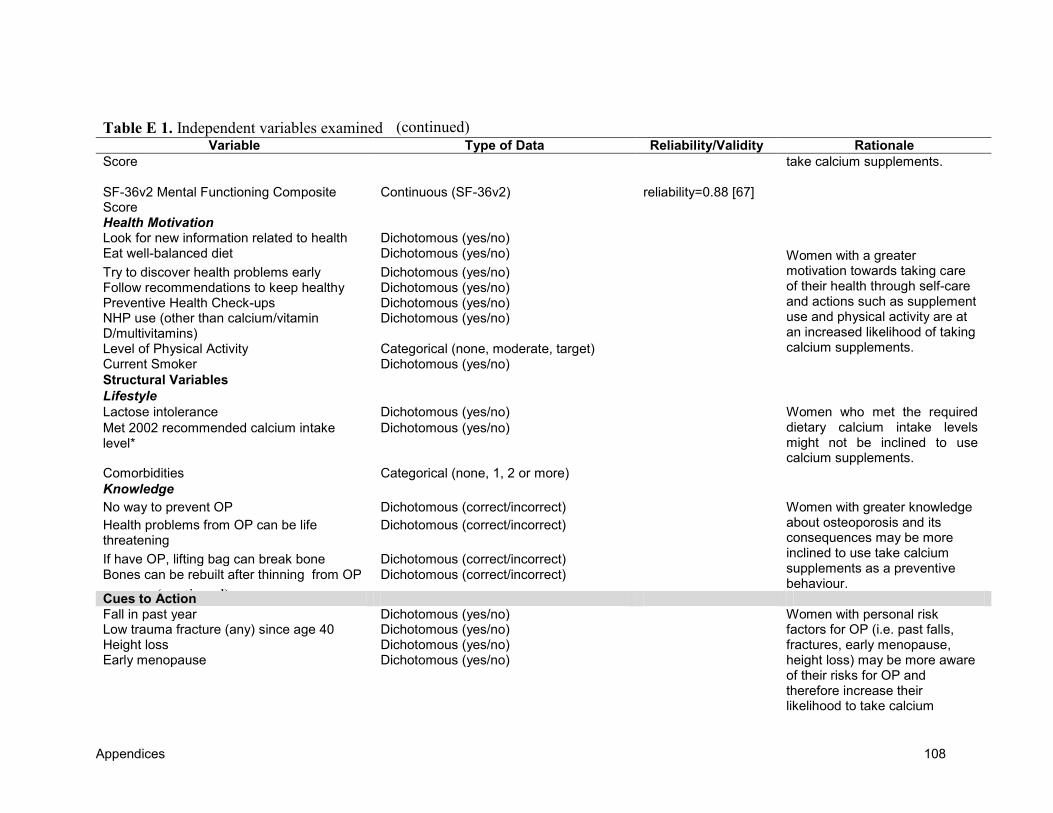
Appendices 108
(continued)
(continued) Table E 1. Independent variables examined Variable Type of Data Reliability/Validity Rationale
Score
take calcium supplements.
SF-36v2 Mental Functioning Composite Score
Continuous (SF-36v2) reliability=0.88 [67]
Health Motivation Look for new information related to health Dichotomous (yes/no)
Women with a greater motivation towards taking care of their health through self-care and actions such as supplement use and physical activity are at an increased likelihood of taking calcium supplements.
Eat well-balanced diet Dichotomous (yes/no)
Try to discover health problems early Dichotomous (yes/no) Follow recommendations to keep healthy Dichotomous (yes/no) Preventive Health Check-ups Dichotomous (yes/no) NHP use (other than calcium/vitamin D/multivitamins)
Dichotomous (yes/no)
Level of Physical Activity Categorical (none, moderate, target) Current Smoker Dichotomous (yes/no)
Structural Variables
Lifestyle
Lactose intolerance Dichotomous (yes/no) Women who met the required dietary calcium intake levels might not be inclined to use calcium supplements.
Met 2002 recommended calcium intake level*
Dichotomous (yes/no)
Comorbidities Categorical (none, 1, 2 or more)
Knowledge
No way to prevent OP Dichotomous (correct/incorrect) Women with greater knowledge about osteoporosis and its consequences may be more inclined to use take calcium supplements as a preventive behaviour.
Health problems from OP can be life threatening
Dichotomous (correct/incorrect)
If have OP, lifting bag can break bone Dichotomous (correct/incorrect) Bones can be rebuilt after thinning from OP Dichotomous (correct/incorrect)
Cues to Action Fall in past year Dichotomous (yes/no) Women with personal risk
factors for OP (i.e. past falls, fractures, early menopause, height loss) may be more aware of their risks for OP and therefore increase their likelihood to take calcium
Low trauma fracture (any) since age 40 Dichotomous (yes/no) Height loss Dichotomous (yes/no) Early menopause Dichotomous (yes/no)
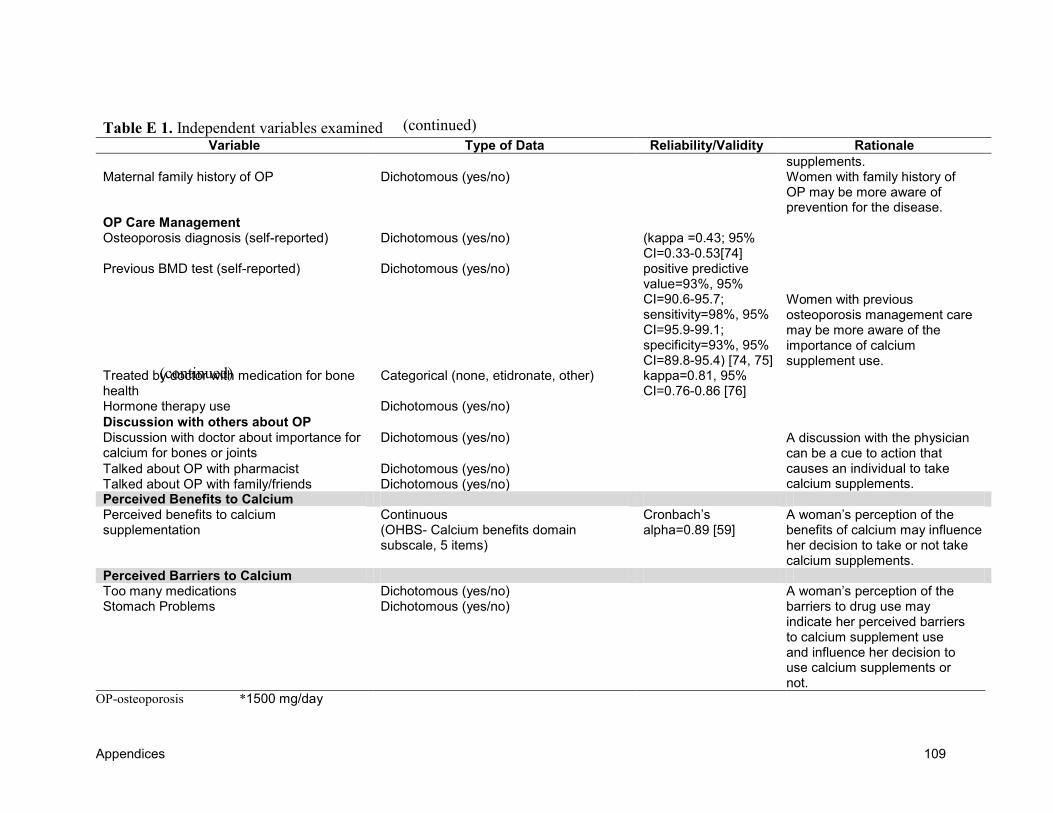
Appendices 109
(continued)
(continued) Table E 1. Independent variables examined Variable Type of Data Reliability/Validity Rationale
supplements. Maternal family history of OP Dichotomous (yes/no) Women with family history of
OP may be more aware of prevention for the disease.
OP Care Management Osteoporosis diagnosis (self-reported) Dichotomous (yes/no) (kappa =0.43; 95%
CI=0.33-0.53[74]
Women with previous osteoporosis management care may be more aware of the importance of calcium supplement use.
Previous BMD test (self-reported) Dichotomous (yes/no) positive predictive value=93%, 95% CI=90.6-95.7; sensitivity=98%, 95% CI=95.9-99.1; specificity=93%, 95% CI=89.8-95.4) [74, 75]
Treated by doctor with medication for bone health
Categorical (none, etidronate, other) kappa=0.81, 95% CI=0.76-0.86 [76]
Hormone therapy use Dichotomous (yes/no)
Discussion with others about OP Discussion with doctor about importance for calcium for bones or joints
Dichotomous (yes/no) A discussion with the physician can be a cue to action that causes an individual to take calcium supplements.
Talked about OP with pharmacist Dichotomous (yes/no) Talked about OP with family/friends Dichotomous (yes/no) Perceived Benefits to Calcium Perceived benefits to calcium supplementation
Continuous (OHBS- Calcium benefits domain subscale, 5 items)
Cronbach’s alpha=0.89 [59]
A woman’s perception of the benefits of calcium may influence her decision to take or not take calcium supplements.
Perceived Barriers to Calcium Too many medications Dichotomous (yes/no) A woman’s perception of the
barriers to drug use may indicate her perceived barriers to calcium supplement use and influence her decision to use calcium supplements or not.
Stomach Problems Dichotomous (yes/no)
OP-osteoporosis *1500 mg/day
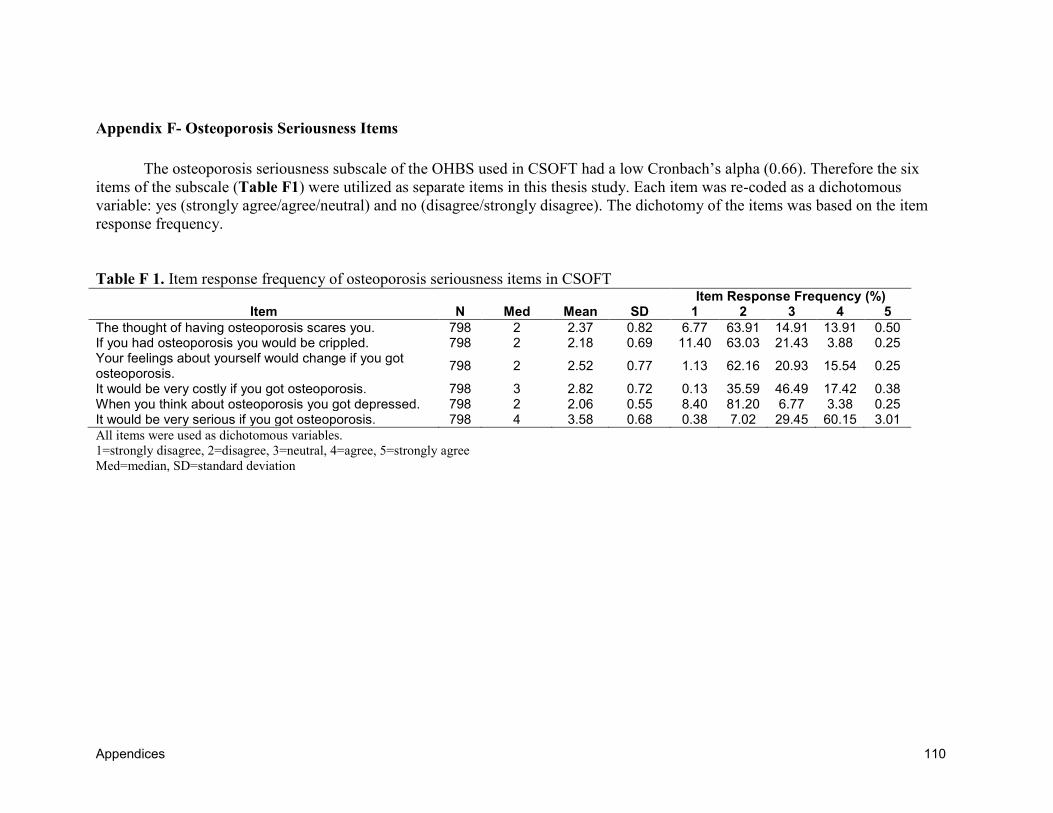
Appendices 110
Appendix F- Osteoporosis Seriousness Items
The osteoporosis seriousness subscale of the OHBS used in CSOFT had a low Cronbach’s alpha (0.66). Therefore the six
items of the subscale (Table F1) were utilized as separate items in this thesis study. Each item was re-coded as a dichotomous
variable: yes (strongly agree/agree/neutral) and no (disagree/strongly disagree). The dichotomy of the items was based on the item
response frequency.
Table F 1. Item response frequency of osteoporosis seriousness items in CSOFT
Item Item Response Frequency (%)
N Med Mean SD 1 2 3 4 5
The thought of having osteoporosis scares you. 798 2 2.37 0.82 6.77 63.91 14.91 13.91 0.50 If you had osteoporosis you would be crippled. 798 2 2.18 0.69 11.40 63.03 21.43 3.88 0.25 Your feelings about yourself would change if you got osteoporosis.
798 2 2.52 0.77 1.13 62.16 20.93 15.54 0.25
It would be very costly if you got osteoporosis. 798 3 2.82 0.72 0.13 35.59 46.49 17.42 0.38 When you think about osteoporosis you got depressed. 798 2 2.06 0.55 8.40 81.20 6.77 3.38 0.25 It would be very serious if you got osteoporosis. 798 4 3.58 0.68 0.38 7.02 29.45 60.15 3.01
All items were used as dichotomous variables.
1=strongly disagree, 2=disagree, 3=neutral, 4=agree, 5=strongly agree
Med=median, SD=standard deviation
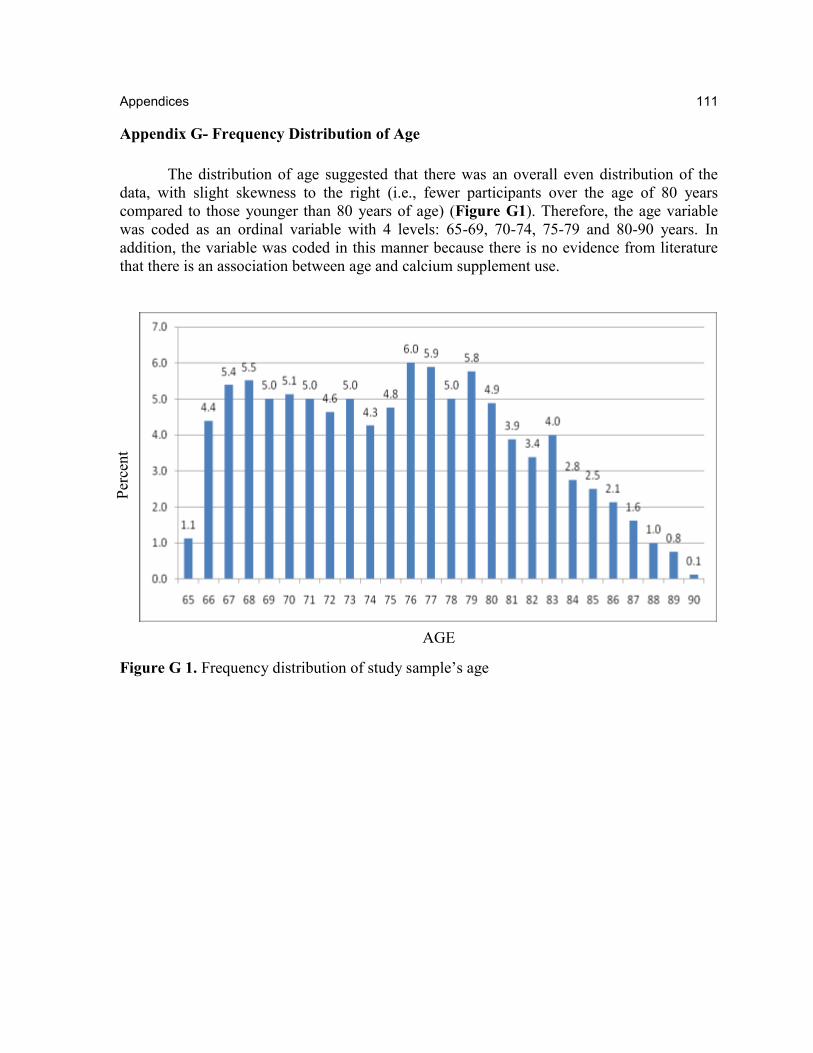
Appendices 111
111
Appendix G- Frequency Distribution of Age
The distribution of age suggested that there was an overall even distribution of the
data, with slight skewness to the right (i.e., fewer participants over the age of 80 years
compared to those younger than 80 years of age) (Figure G1). Therefore, the age variable
was coded as an ordinal variable with 4 levels: 65-69, 70-74, 75-79 and 80-90 years. In
addition, the variable was coded in this manner because there is no evidence from literature
that there is an association between age and calcium supplement use.
Figure G 1. Frequency distribution of study sample’s age
AGE
Per
cent
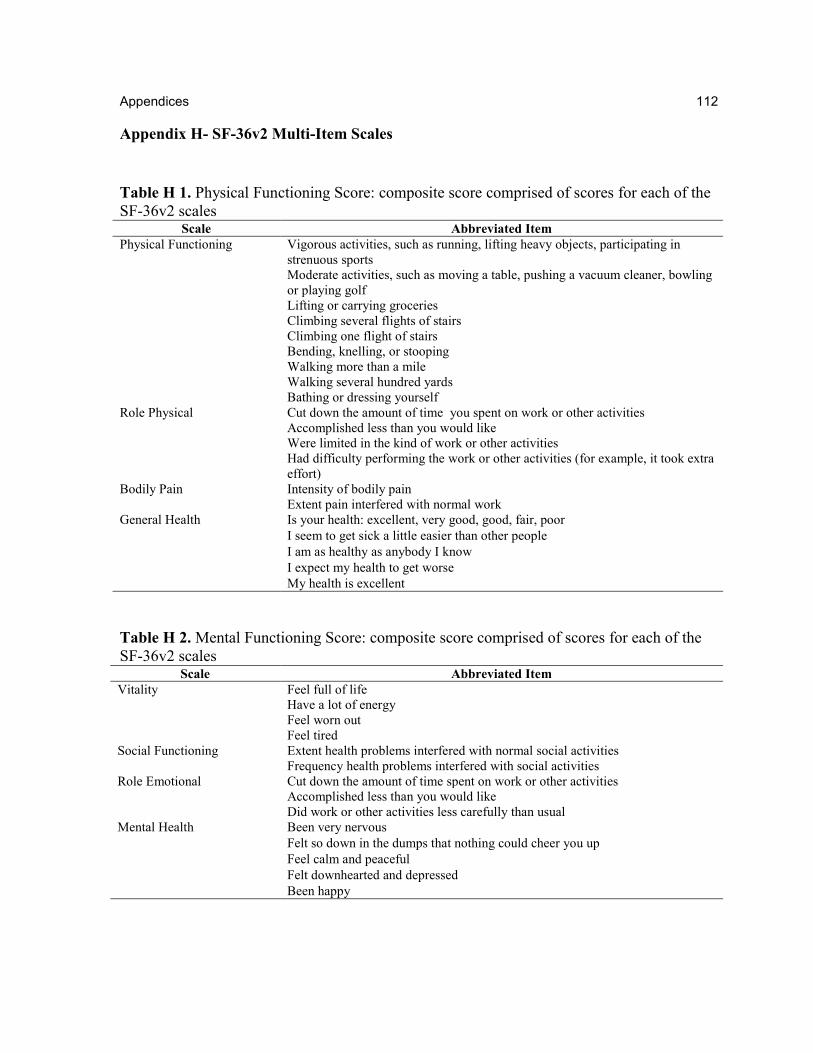
Appendices 112
112
Appendix H- SF-36v2 Multi-Item Scales
Table H 1. Physical Functioning Score: composite score comprised of scores for each of the
SF-36v2 scales Scale Abbreviated Item
Physical Functioning Vigorous activities, such as running, lifting heavy objects, participating in
strenuous sports
Moderate activities, such as moving a table, pushing a vacuum cleaner, bowling
or playing golf
Lifting or carrying groceries
Climbing several flights of stairs
Climbing one flight of stairs
Bending, knelling, or stooping
Walking more than a mile
Walking several hundred yards
Bathing or dressing yourself
Role Physical Cut down the amount of time you spent on work or other activities
Accomplished less than you would like
Were limited in the kind of work or other activities
Had difficulty performing the work or other activities (for example, it took extra
effort)
Bodily Pain Intensity of bodily pain
Extent pain interfered with normal work
General Health Is your health: excellent, very good, good, fair, poor
I seem to get sick a little easier than other people
I am as healthy as anybody I know
I expect my health to get worse
My health is excellent
Table H 2. Mental Functioning Score: composite score comprised of scores for each of the
SF-36v2 scales Scale Abbreviated Item
Vitality Feel full of life
Have a lot of energy
Feel worn out
Feel tired
Social Functioning Extent health problems interfered with normal social activities
Frequency health problems interfered with social activities
Role Emotional Cut down the amount of time spent on work or other activities
Accomplished less than you would like
Did work or other activities less carefully than usual
Mental Health Been very nervous
Felt so down in the dumps that nothing could cheer you up
Feel calm and peaceful
Felt downhearted and depressed
Been happy
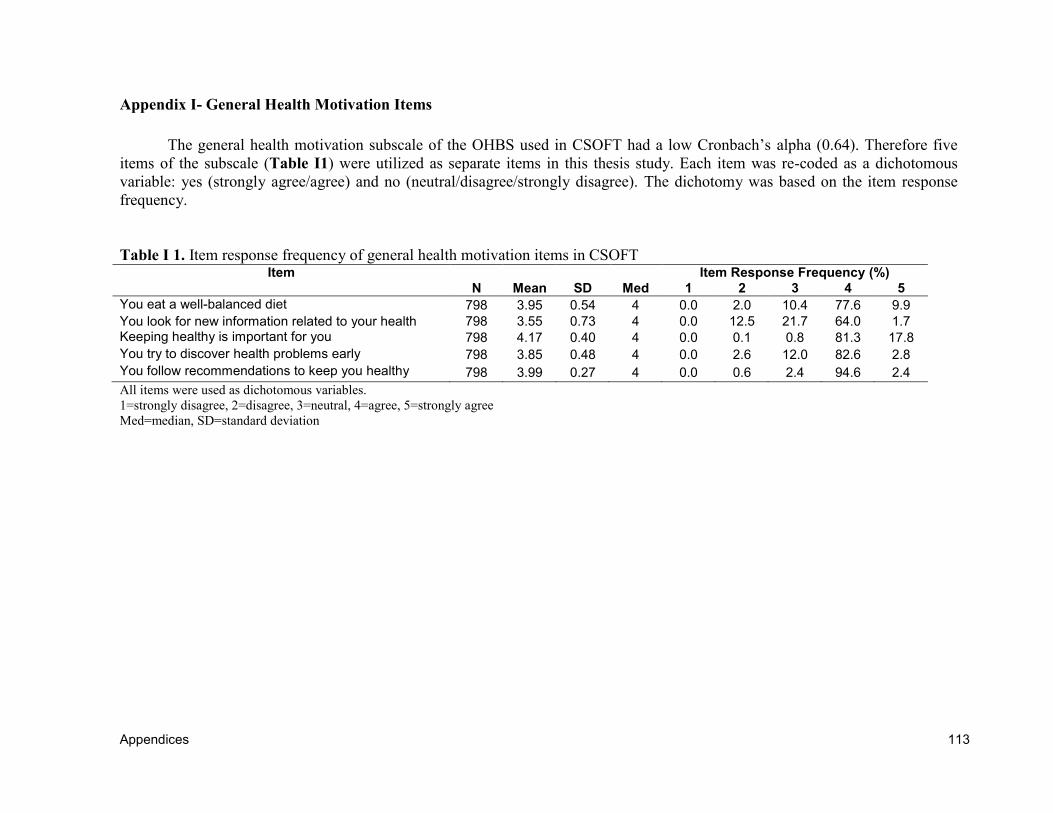
Appendices 113
Appendix I- General Health Motivation Items
The general health motivation subscale of the OHBS used in CSOFT had a low Cronbach’s alpha (0.64). Therefore five
items of the subscale (Table I1) were utilized as separate items in this thesis study. Each item was re-coded as a dichotomous
variable: yes (strongly agree/agree) and no (neutral/disagree/strongly disagree). The dichotomy was based on the item response
frequency.
Table I 1. Item response frequency of general health motivation items in CSOFT Item Item Response Frequency (%)
N Mean SD Med 1 2 3 4 5
You eat a well-balanced diet 798 3.95 0.54 4 0.0 2.0 10.4 77.6 9.9
You look for new information related to your health 798 3.55 0.73 4 0.0 12.5 21.7 64.0 1.7 Keeping healthy is important for you 798 4.17 0.40 4 0.0 0.1 0.8 81.3 17.8
You try to discover health problems early 798 3.85 0.48 4 0.0 2.6 12.0 82.6 2.8
You follow recommendations to keep you healthy 798 3.99 0.27 4 0.0 0.6 2.4 94.6 2.4
All items were used as dichotomous variables.
1=strongly disagree, 2=disagree, 3=neutral, 4=agree, 5=strongly agree
Med=median, SD=standard deviation
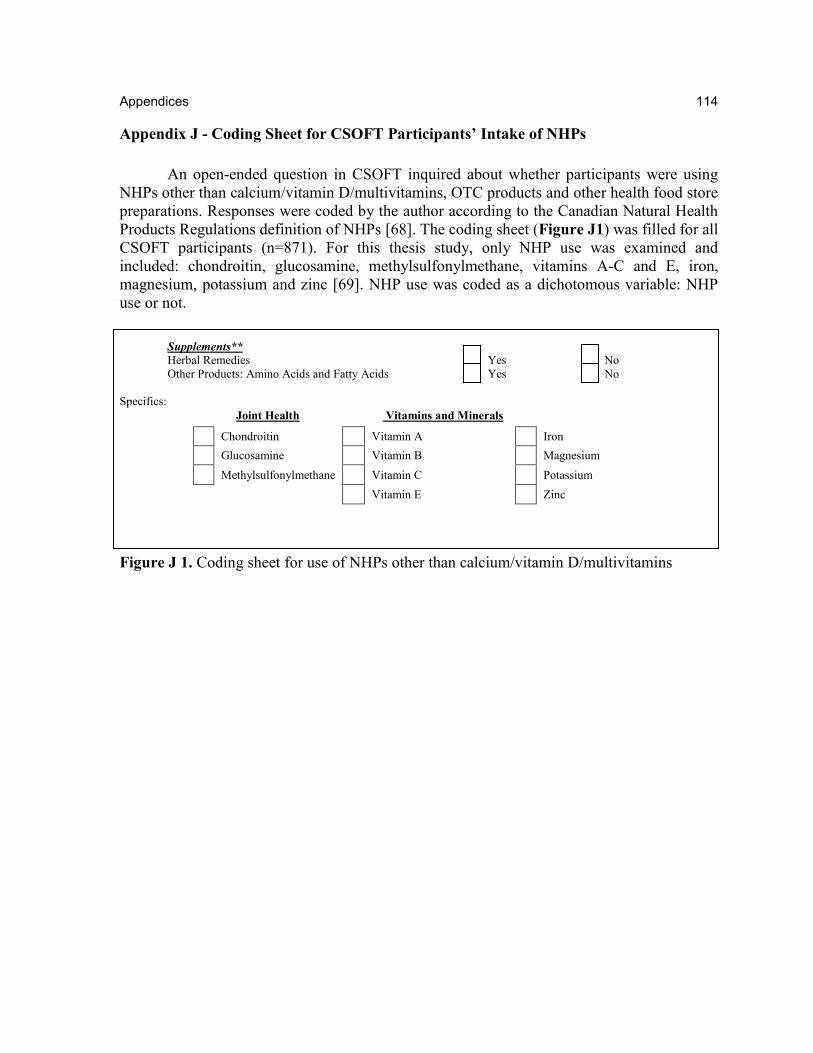
Appendices 114
114
Appendix J - Coding Sheet for CSOFT Participants’ Intake of NHPs
An open-ended question in CSOFT inquired about whether participants were using
NHPs other than calcium/vitamin D/multivitamins, OTC products and other health food store
preparations. Responses were coded by the author according to the Canadian Natural Health
Products Regulations definition of NHPs [68]. The coding sheet (Figure J1) was filled for all
CSOFT participants (n=871). For this thesis study, only NHP use was examined and
included: chondroitin, glucosamine, methylsulfonylmethane, vitamins A-C and E, iron,
magnesium, potassium and zinc [69]. NHP use was coded as a dichotomous variable: NHP
use or not.
Supplements** Herbal Remedies Yes No
Other Products: Amino Acids and Fatty Acids Yes No
Specifics:
Joint Health Vitamins and Minerals
Chondroitin Vitamin A Iron
Glucosamine Vitamin B Magnesium
Methylsulfonylmethane Vitamin C Potassium
Vitamin E Zinc
Figure J 1. Coding sheet for use of NHPs other than calcium/vitamin D/multivitamins
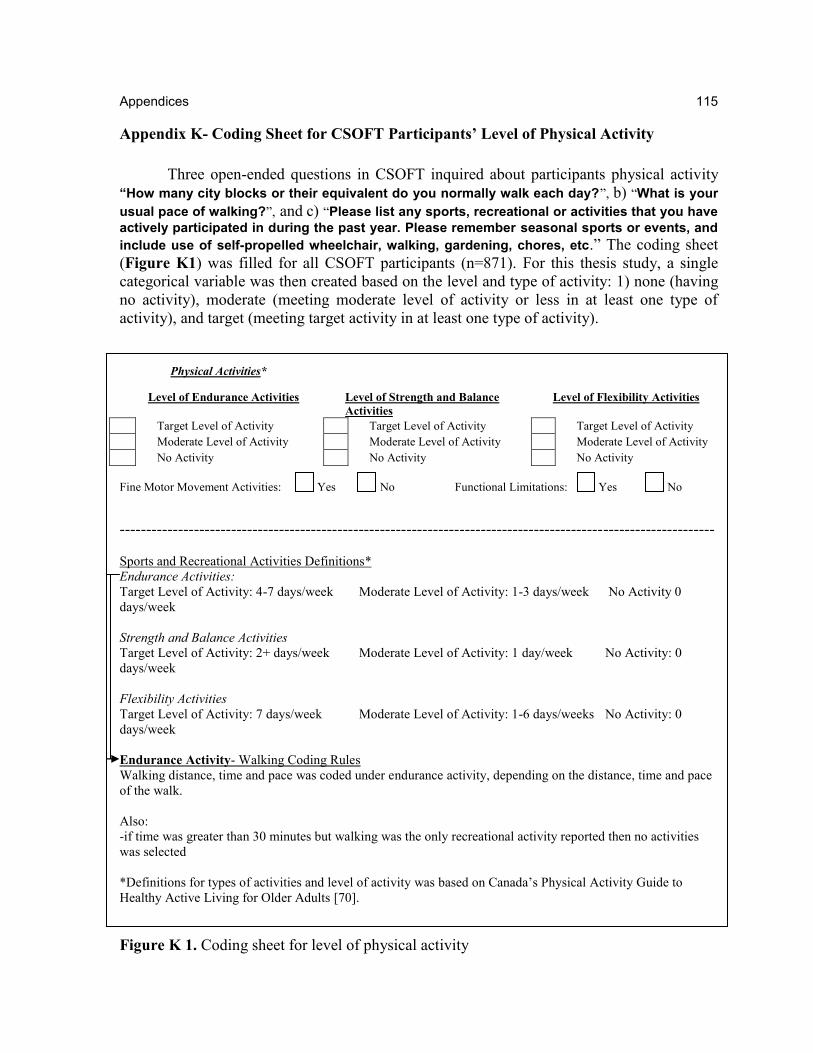
Appendices 115
115
Appendix K- Coding Sheet for CSOFT Participants’ Level of Physical Activity
Three open-ended questions in CSOFT inquired about participants physical activity
“How many city blocks or their equivalent do you normally walk each day?”, b) “What is your
usual pace of walking?”, and c) “Please list any sports, recreational or activities that you have
actively participated in during the past year. Please remember seasonal sports or events, and
include use of self-propelled wheelchair, walking, gardening, chores, etc.” The coding sheet
(Figure K1) was filled for all CSOFT participants (n=871). For this thesis study, a single
categorical variable was then created based on the level and type of activity: 1) none (having
no activity), moderate (meeting moderate level of activity or less in at least one type of
activity), and target (meeting target activity in at least one type of activity).
Physical Activities*
Level of Endurance Activities
Level of Strength and Balance
Activities
Level of Flexibility Activities
Target Level of Activity Target Level of Activity Target Level of Activity
Moderate Level of Activity Moderate Level of Activity Moderate Level of Activity
No Activity No Activity No Activity
Fine Motor Movement Activities: Yes No Functional Limitations: Yes No
----------------------------------------------------------------------------------------------------------------
Sports and Recreational Activities Definitions*
Endurance Activities:
Target Level of Activity: 4-7 days/week Moderate Level of Activity: 1-3 days/week No Activity 0
days/week
Strength and Balance Activities
Target Level of Activity: 2+ days/week Moderate Level of Activity: 1 day/week No Activity: 0
days/week
Flexibility Activities
Target Level of Activity: 7 days/week Moderate Level of Activity: 1-6 days/weeks No Activity: 0
days/week
Endurance Activity- Walking Coding Rules
Walking distance, time and pace was coded under endurance activity, depending on the distance, time and pace
of the walk.
Also:
-if time was greater than 30 minutes but walking was the only recreational activity reported then no activities
was selected
*Definitions for types of activities and level of activity was based on Canada’s Physical Activity Guide to
Healthy Active Living for Older Adults [70].
Figure K 1. Coding sheet for level of physical activity
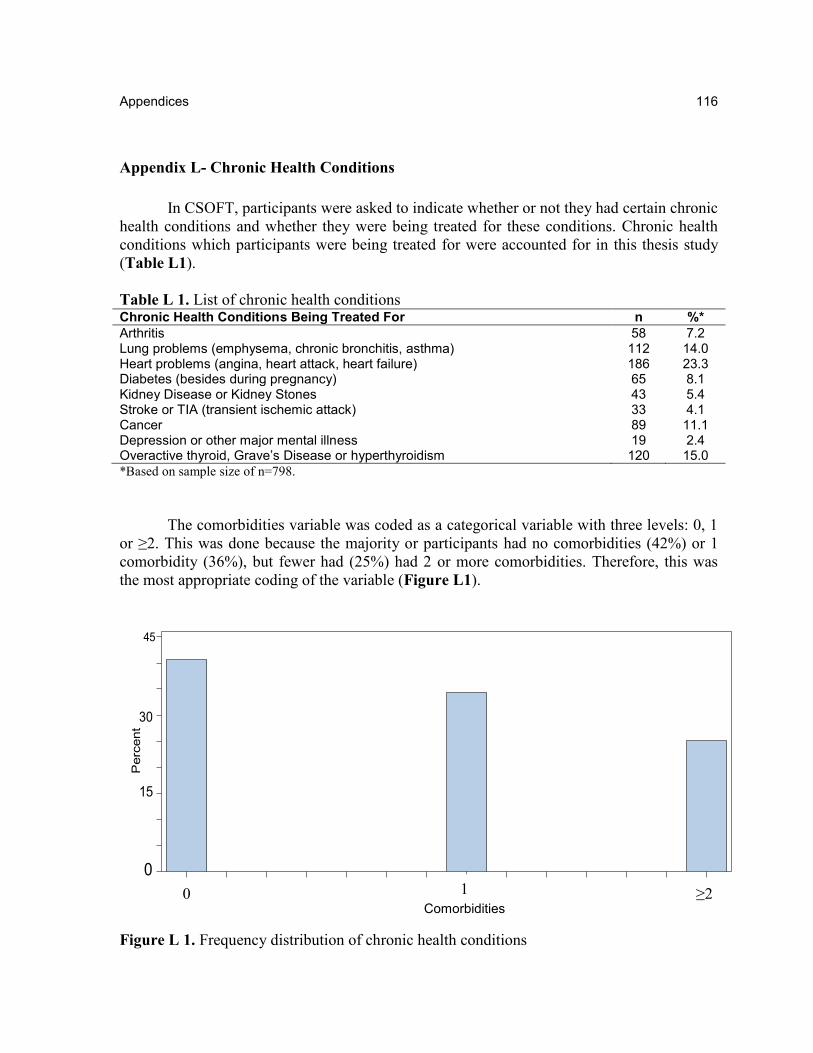
Appendices 116
116
Appendix L- Chronic Health Conditions
In CSOFT, participants were asked to indicate whether or not they had certain chronic
health conditions and whether they were being treated for these conditions. Chronic health
conditions which participants were being treated for were accounted for in this thesis study
(Table L1).
Table L 1. List of chronic health conditions Chronic Health Conditions Being Treated For n %*
Arthritis 58 7.2 Lung problems (emphysema, chronic bronchitis, asthma) 112 14.0 Heart problems (angina, heart attack, heart failure) 186 23.3 Diabetes (besides during pregnancy) 65 8.1 Kidney Disease or Kidney Stones 43 5.4 Stroke or TIA (transient ischemic attack) 33 4.1 Cancer 89 11.1 Depression or other major mental illness 19 2.4 Overactive thyroid, Grave’s Disease or hyperthyroidism 120 15.0
*Based on sample size of n=798.
The comorbidities variable was coded as a categorical variable with three levels: 0, 1
or ≥2. This was done because the majority or participants had no comorbidities (42%) or 1
comorbidity (36%), but fewer had (25%) had 2 or more comorbidities. Therefore, this was
the most appropriate coding of the variable (Figure L1).
0 1.05 1.95
0
15
30
40
45
Percent
COMORBCAT
Figure L 1. Frequency distribution of chronic health conditions
0 1
Comorbidities ≥2