Embed Size (px)
Citation preview
International Journal of Scientific & Engineering Research Volume 8, Issue 6, June-2017 357 ISSN 2229-5518
IJSER © 2017 http://www.ijser.org
Correlation Between Compaction Characteristics and Atterberg
Limits of Fine Grained Soil found in Addis Ababa
Tesfamichael Tsegaye, Dr.Henok Fikre, Tadesse Abebe
Abstract: Compaction is a way of eliminating air out of the voids of a soil by mechanical means. Compaction is mandatory in different fields of civil engineering such as in highway, airfield, embankments, and dams; to reduce compressibility and permeability of a soil hence increases the shear strength and bearing capacity of a soil. A laboratory tests called standard Proctor and modified proctor tests were advanced to determine the maximum dry density and optimum moisture content of a soil. In this study standard compaction is used. However, in huge projects, conducting laboratory tests by using proctor tests consume time, money, a lot of effort or energy and required a large quantity of samples. An effort to make a correlation between compaction characteristics and Atterberg limits of fine grained soil found in Addis Ababa, which allows us to estimate the compaction parameters of fine grained soils from Atterberg limits were done in this thesis.To develop the correlation, a total 10 test pits has been excavated and a total of 20 disturbed samples (primary data) was collected from different places, 2 samples from each test pit at different depths ranging from 1.00m to 3.00m. And 36 secondary data (laboratory results) were collected from AACRA. After the samples were collected, they were transported to the Gondwana engineering laboratory and different laboratory tests (Atterberg limits, Grain size analysis, Specific gravity and compaction tests) has been conducted. After the tests were conducted, the recorded data were analyzed using descriptive and analytical methods, and then the correlation between compaction characteristics and Atterberg limits of fine grained soil using regression analysis has been done. Regression analysis was conducted by using EXCEL and SPSS software. From the statistical analysis part one can observe that there is a relatively good correlation between OMC and PL and similarly a good correlation is observed between MDD and LL, PL and PI together. The equations found are listed below. 1. OMC = 0.916 * PL - 0.030 * PI - 0.875, R2 = 0.807 2. MDD = - 0.18* PL - 0.027 * PI + 21.182, R2 = 0.835
Index Terms— Atterberg limits, compaction characteristics, and Fine grained soils —————————— ——————————
1 INTRODUCTION
ost of the time Geotechnical engineers are confronted to handle large volumes of soil, where
the soil itself is used as a construction material. The importance of compaction as a practical means of achieving the desired strength, compressibility and permeability characteristics of soils has been appreciated since the time early earth structures were built [1].
Compaction of soil has applications in almost every field of civil engineering involving soil. Thus, for a civil engineer, it is very essential to know the compaction characteristics of natural soils, and thereby assess their suitability. In such situations, to obtain compaction characteristics such as maximum dry density and optimum moisture content, one has to carry out a laboratory compaction test. But laboratory compaction test requires sufficient time and effort. For a preliminary assessment of the suitability of soils required for large project, it is desirable to develop correlations of engineering properties with simple physical properties, namely Atterberg limits, which are obtained through simple tests known as index tests. Correlations making use of the Atterberg limits are fairly common in soil mechanics literature, and can be quite useful [1].
2 RESEARCH METHODOLOGY 2.1 Study Area
The research is conducted at different places in the Addis Ababa city. Addis Ababa is the capital city of Ethiopia Founded in 1886; it is the largest city in Ethiopia. The city is populated by people from different regions of Ethiopia with a population of 3,384,469 according to the 2007 census with an annual growth rate of 3.8%. This city is found at the elevation of 2355m and at a coordinate of 901”48’N, 38044”24’E on a well-watered plateau surrounded by hills and mountains. It is a grassland biome located at the foot of mount “Entoto” and forms part of the watershed for “Awash” river. It has sub-tropical highland climate with temperature differences up to 100C. Daily maximum temperatures don‟t usually exceed 23 0C during dry seasons [2].
The selection of sites for excavation was
purposive, they are selected based on Addis Ababa‟s soil classification map, secondary data that are collected from different organizations and from previous researches that are done on investigation of engineering properties of Addis Ababa soils.
M IJSER
International Journal of Scientific & Engineering Research Volume 8, Issue 6, June-2017 358 ISSN 2229-5518
IJSER © 2017 http://www.ijser.org
Accordingly soil classified under A-7 is chosen for the study. And to make the sample representative the researcher takes two samples from each Sub Cities and a total of twenty samples are collected.
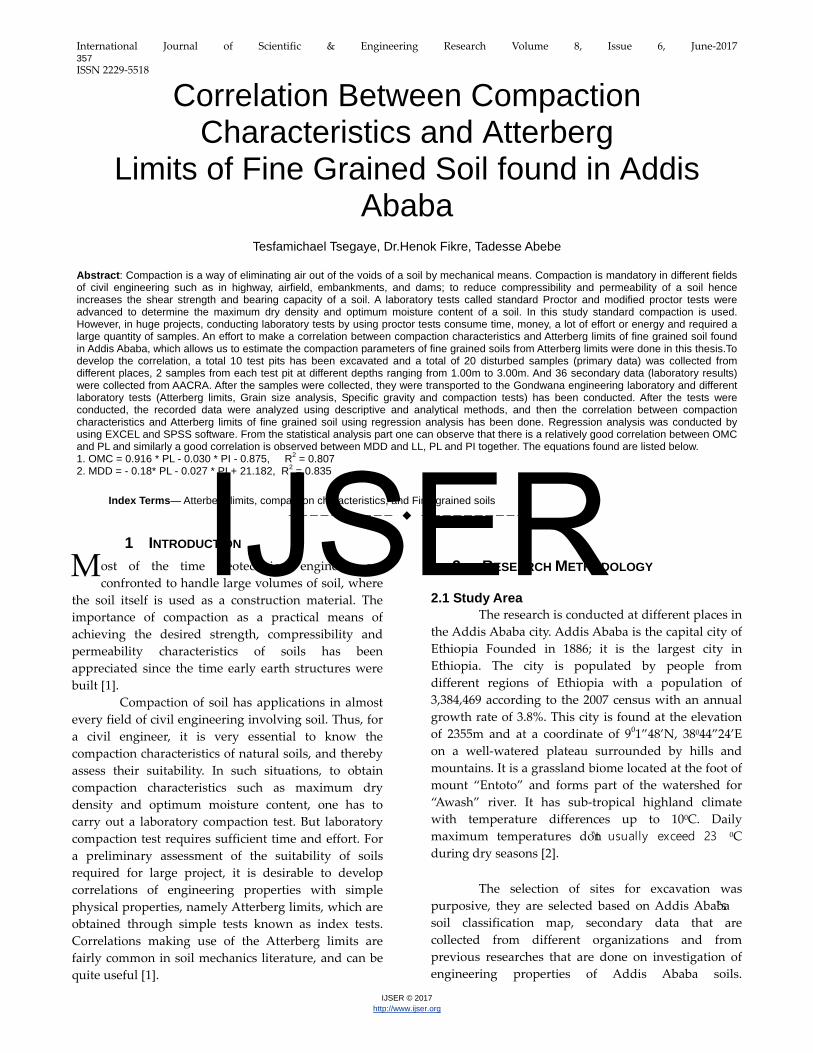
The specific locations of sampling are AKAKI, BOLE, MEGENAGNA, JEMO, LIDETA,MEXICO, KOLFE, ASKO, MESALEMIA, SHIROMEDA (Fig.3). One test pit was opened at each site and disturbed samples About 50 kg were collected from each pit at a depth ranging from 1.00m to 3.00m. After extracting, the samples were transported to at Gondwana eng. plc. Geotechnical laboratory and different laboratory tests are done.
Figure 2.1: Locations of sampling areas [3]
2.2 Data collection process The data needed for this research were collected from:- Primary sources: - samples were collected from each test pit, then different laboratory tests were conducted and the results were recorded. Secondary sources are: AACRA, different journals, previous thesis, books and websites.
2.3 Laboratory Tests and Results Based on the samples retrieved from the sites, laboratory tests on the twenty one samples were conducted at Gondwana eng. plc. Geotechnical laboratory. Accordingly, the following different kinds of tests have been performed.
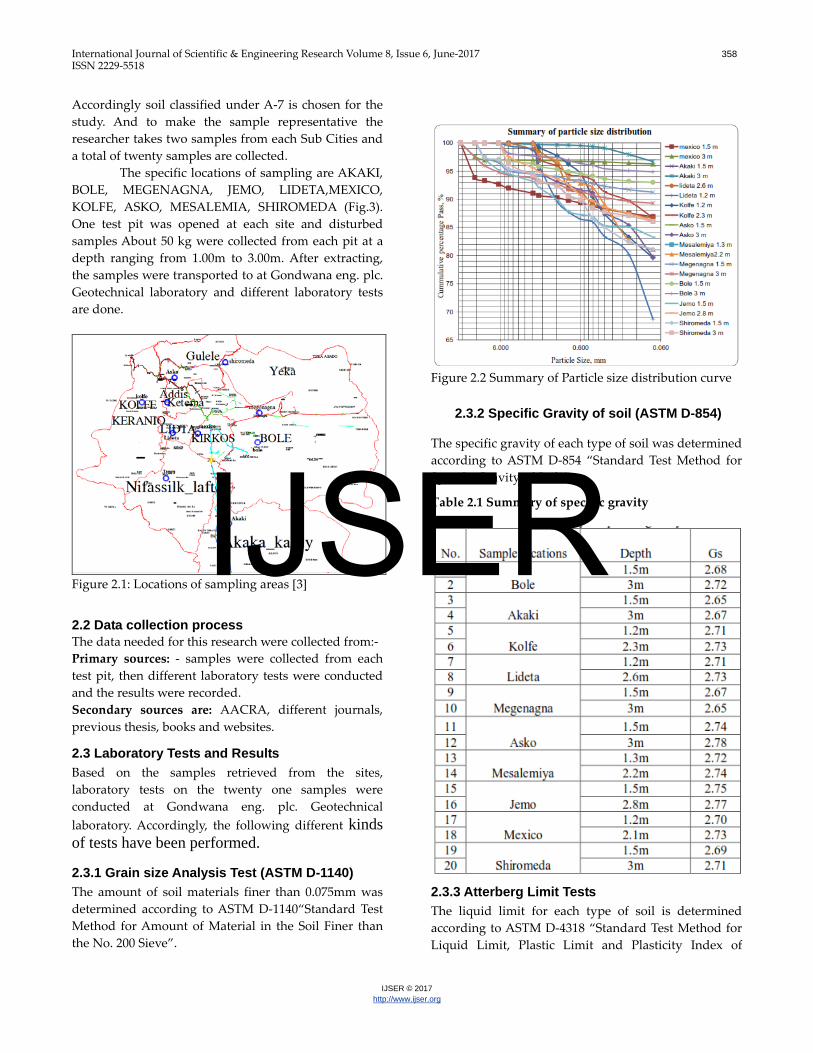
2.3.1 Grain size Analysis Test (ASTM D-1140) The amount of soil materials finer than 0.075mm was determined according to ASTM D-1140“Standard Test Method for Amount of Material in the Soil Finer than the No. 200 Sieve”.
Figure 2.2 Summary of Particle size distribution curve
2.3.2 Specific Gravity of soil (ASTM D-854)
The specific gravity of each type of soil was determined according to ASTM D-854 “Standard Test Method for Specific Gravity of Soils”.
Table 2.1 Summary of specific gravity
2.3.3 Atterberg Limit Tests The liquid limit for each type of soil is determined according to ASTM D-4318 “Standard Test Method for Liquid Limit, Plastic Limit and Plasticity Index of
IJSER
International Journal of Scientific & Engineering Research Volume 8, Issue 6, June-2017 359 ISSN 2229-5518
IJSER © 2017 http://www.ijser.org
Soils”.
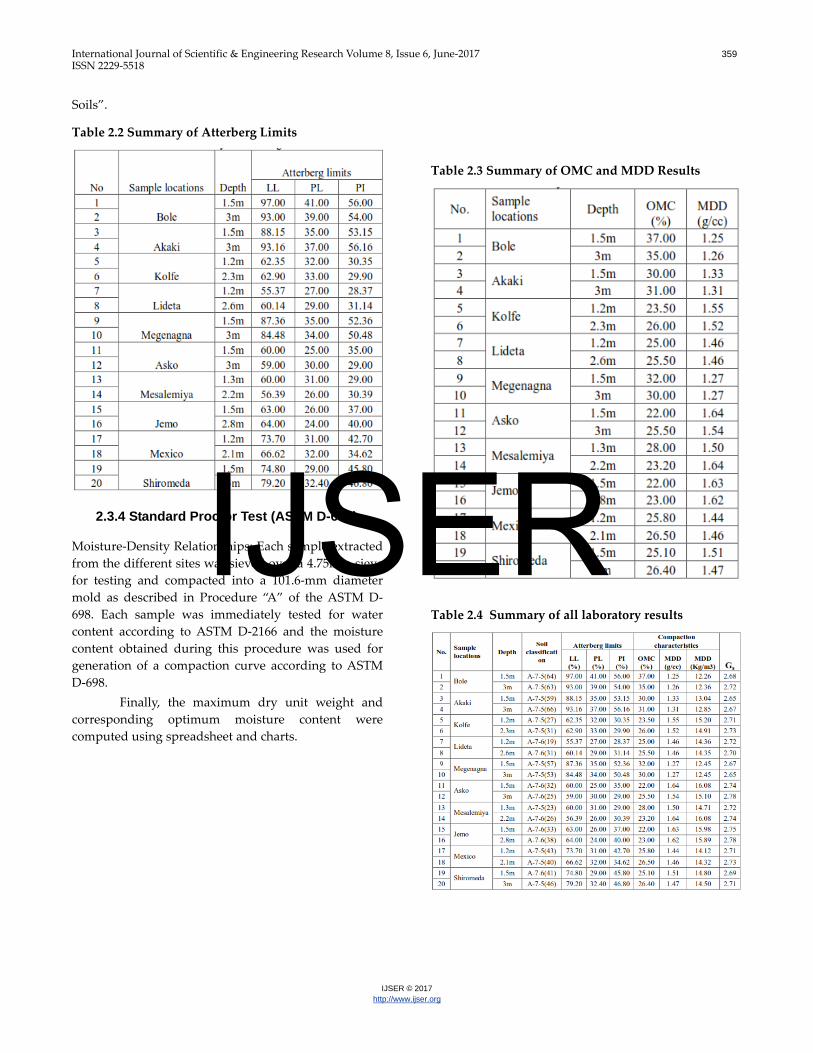
Table 2.2 Summary of Atterberg Limits
2.3.4 Standard Proctor Test (ASTM D-698)
Moisture-Density Relationships: Each sample extracted from the different sites was sieved over a 4.75mm sieve for testing and compacted into a 101.6-mm diameter mold as described in Procedure “A” of the ASTM D-698. Each sample was immediately tested for water content according to ASTM D-2166 and the moisture content obtained during this procedure was used for generation of a compaction curve according to ASTM D-698.
Finally, the maximum dry unit weight and corresponding optimum moisture content were computed using spreadsheet and charts.
Table 2.3 Summary of OMC and MDD Results
Table 2.4 Summary of all laboratory results
IJSER
International Journal of Scientific & Engineering Research Volume 8, Issue 6, June-2017 360 ISSN 2229-5518
IJSER © 2017 http://www.ijser.org
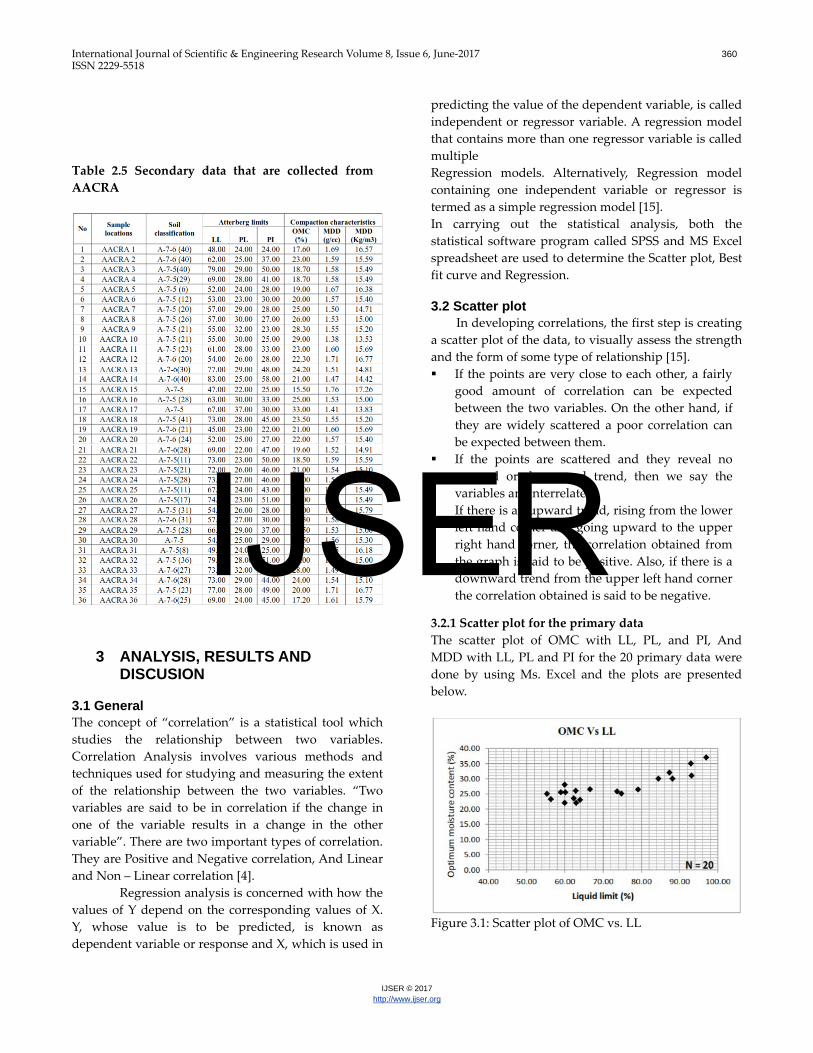
Table 2.5 Secondary data that are collected from AACRA
3 ANALYSIS, RESULTS AND DISCUSION
3.1 General The concept of “correlation” is a statistical tool which studies the relationship between two variables. Correlation Analysis involves various methods and techniques used for studying and measuring the extent of the relationship between the two variables. “Two variables are said to be in correlation if the change in one of the variable results in a change in the other variable”. There are two important types of correlation. They are Positive and Negative correlation, And Linear and Non – Linear correlation [4].
Regression analysis is concerned with how the values of Y depend on the corresponding values of X. Y, whose value is to be predicted, is known as dependent variable or response and X, which is used in
predicting the value of the dependent variable, is called independent or regressor variable. A regression model that contains more than one regressor variable is called multiple Regression models. Alternatively, Regression model containing one independent variable or regressor is termed as a simple regression model [15]. In carrying out the statistical analysis, both the statistical software program called SPSS and MS Excel spreadsheet are used to determine the Scatter plot, Best fit curve and Regression. 3.2 Scatter plot In developing correlations, the first step is creating a scatter plot of the data, to visually assess the strength and the form of some type of relationship [15]. If the points are very close to each other, a fairly
good amount of correlation can be expected between the two variables. On the other hand, if they are widely scattered a poor correlation can be expected between them.
If the points are scattered and they reveal no upward or downward trend, then we say the variables are interrelated.
If there is an upward trend, rising from the lower left hand corner and going upward to the upper right hand corner, the correlation obtained from the graph is said to be positive. Also, if there is a downward trend from the upper left hand corner the correlation obtained is said to be negative.
3.2.1 Scatter plot for the primary data The scatter plot of OMC with LL, PL, and PI, And MDD with LL, PL and PI for the 20 primary data were done by using Ms. Excel and the plots are presented below.
Figure 3.1: Scatter plot of OMC vs. LL
IJSER
International Journal of Scientific & Engineering Research Volume 8, Issue 6, June-2017 361 ISSN 2229-5518
IJSER © 2017 http://www.ijser.org
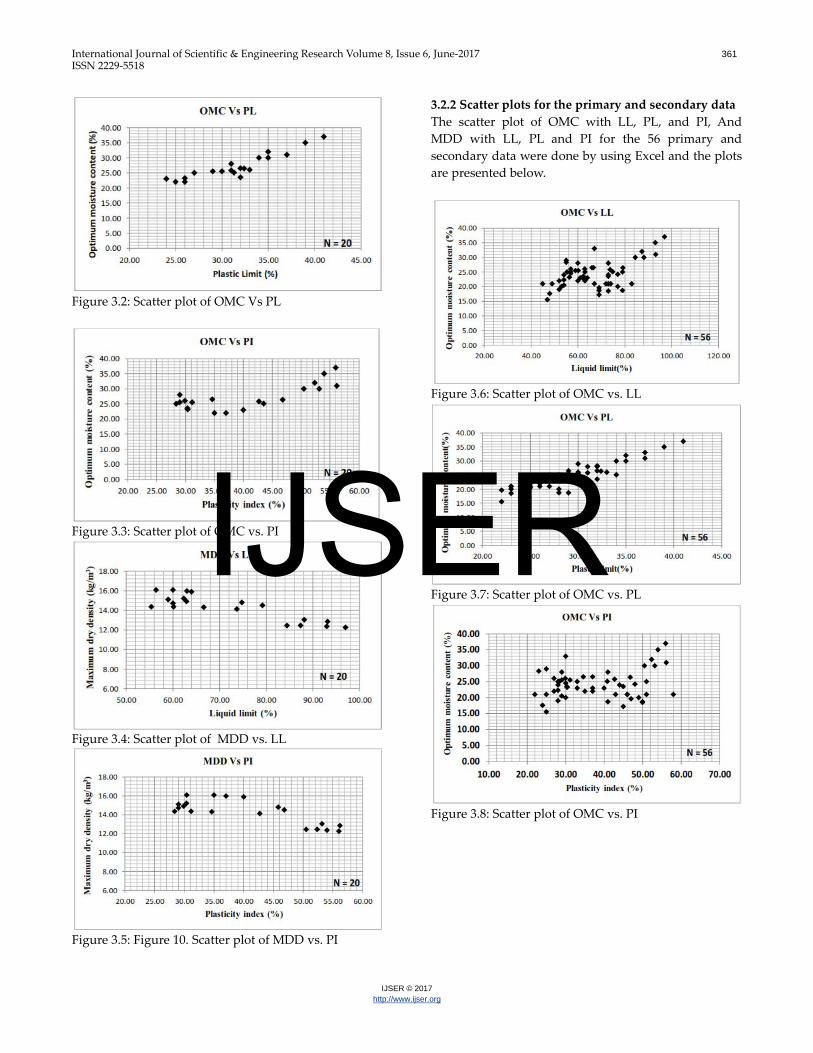
Figure 3.2: Scatter plot of OMC Vs PL
Figure 3.3: Scatter plot of OMC vs. PI
Figure 3.4: Scatter plot of MDD vs. LL
Figure 3.5: Figure 10. Scatter plot of MDD vs. PI
3.2.2 Scatter plots for the primary and secondary data The scatter plot of OMC with LL, PL, and PI, And MDD with LL, PL and PI for the 56 primary and secondary data were done by using Excel and the plots are presented below.
Figure 3.6: Scatter plot of OMC vs. LL
Figure 3.7: Scatter plot of OMC vs. PL
Figure 3.8: Scatter plot of OMC vs. PI
IJSER
International Journal of Scientific & Engineering Research Volume 8, Issue 6, June-2017 362 ISSN 2229-5518
IJSER © 2017 http://www.ijser.org
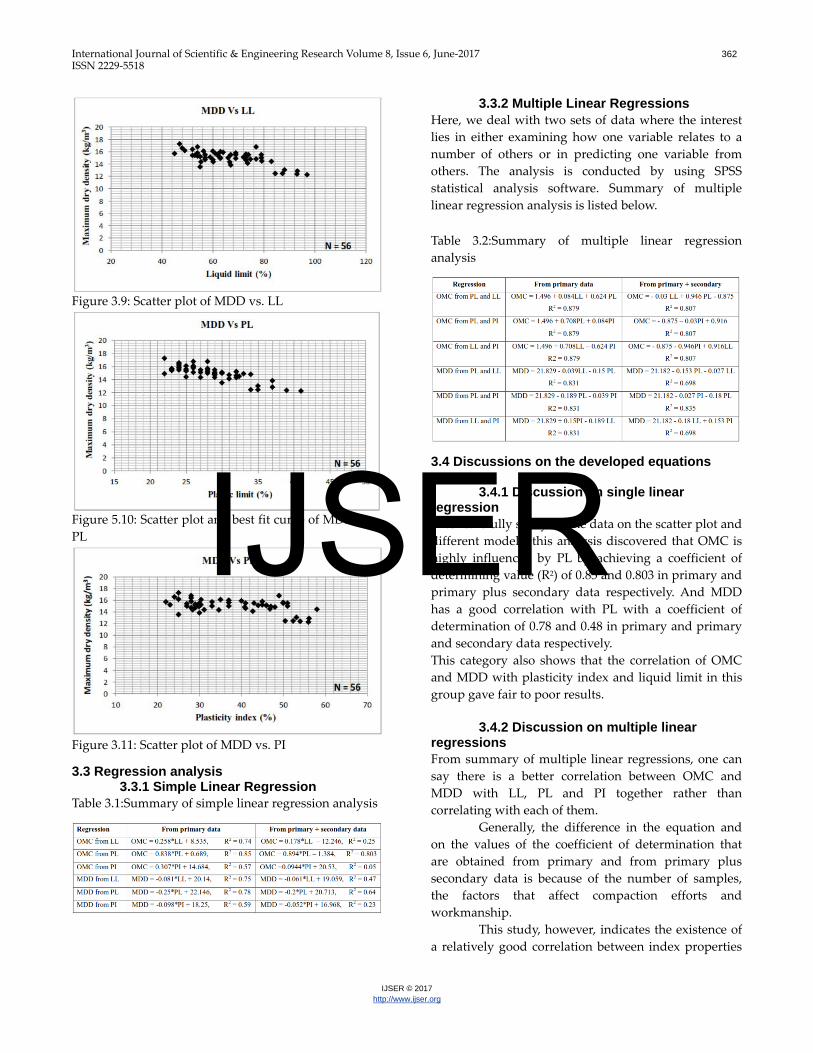
Figure 3.9: Scatter plot of MDD vs. LL
Figure 5.10: Scatter plot and best fit curve of MDD vs. PL
Figure 3.11: Scatter plot of MDD vs. PI
3.3 Regression analysis 3.3.1 Simple Linear Regression
Table 3.1:Summary of simple linear regression analysis
3.3.2 Multiple Linear Regressions Here, we deal with two sets of data where the interest lies in either examining how one variable relates to a number of others or in predicting one variable from others. The analysis is conducted by using SPSS statistical analysis software. Summary of multiple linear regression analysis is listed below. Table 3.2:Summary of multiple linear regression analysis
3.4 Discussions on the developed equations
3.4.1 Discussion on single linear regression After carefully studying the data on the scatter plot and different models, this analysis discovered that OMC is highly influenced by PL by achieving a coefficient of determining value (R2) of 0.85 and 0.803 in primary and primary plus secondary data respectively. And MDD has a good correlation with PL with a coefficient of determination of 0.78 and 0.48 in primary and primary and secondary data respectively. This category also shows that the correlation of OMC and MDD with plasticity index and liquid limit in this group gave fair to poor results.
3.4.2 Discussion on multiple linear regressions From summary of multiple linear regressions, one can say there is a better correlation between OMC and MDD with LL, PL and PI together rather than correlating with each of them.
Generally, the difference in the equation and on the values of the coefficient of determination that are obtained from primary and from primary plus secondary data is because of the number of samples, the factors that affect compaction efforts and workmanship.
This study, however, indicates the existence of a relatively good correlation between index properties
IJSER
International Journal of Scientific & Engineering Research Volume 8, Issue 6, June-2017 363 ISSN 2229-5518
IJSER © 2017 http://www.ijser.org
(LL, PL and PI) and compaction characteristics (OMC and MDD).
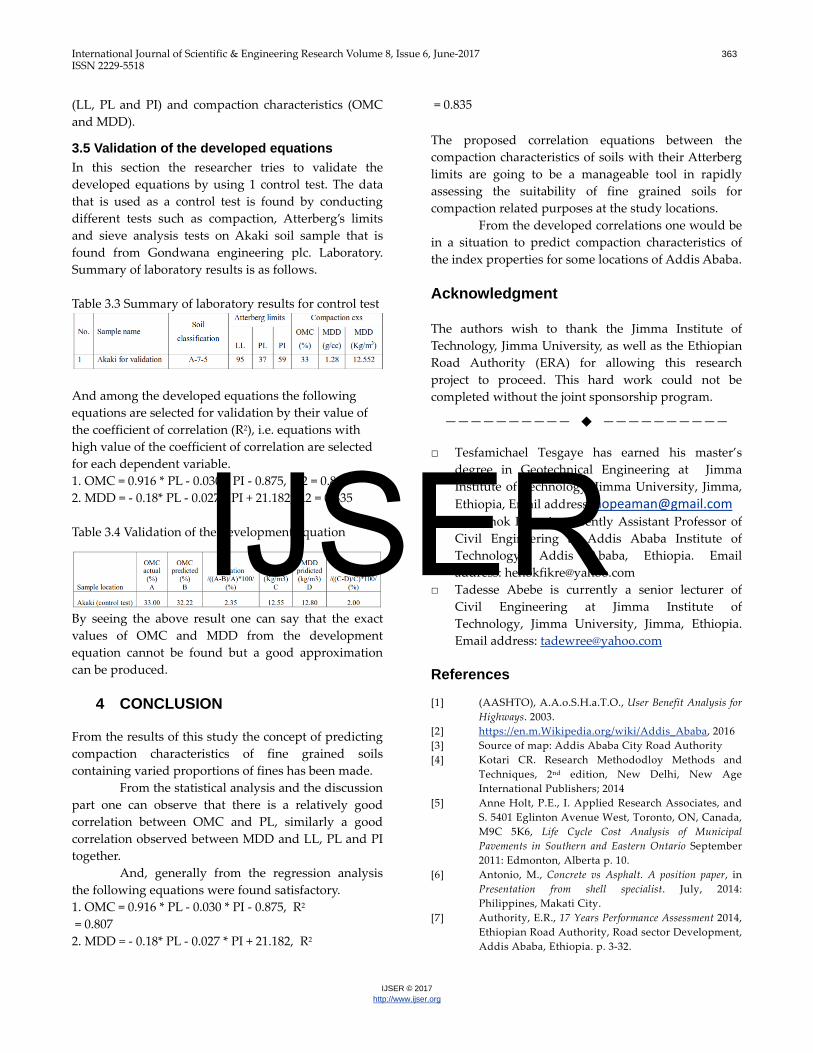
3.5 Validation of the developed equations In this section the researcher tries to validate the developed equations by using 1 control test. The data that is used as a control test is found by conducting different tests such as compaction, Atterberg’s limits and sieve analysis tests on Akaki soil sample that is found from Gondwana engineering plc. Laboratory. Summary of laboratory results is as follows. Table 3.3 Summary of laboratory results for control test
And among the developed equations the following equations are selected for validation by their value of the coefficient of correlation (R2), i.e. equations with high value of the coefficient of correlation are selected for each dependent variable. 1. OMC = 0.916 * PL - 0.030 * PI - 0.875, R2 = 0.807 2. MDD = - 0.18* PL - 0.027 * PI + 21.182, R2 = 0.835 Table 3.4 Validation of the development equation
By seeing the above result one can say that the exact values of OMC and MDD from the development equation cannot be found but a good approximation can be produced.
4 CONCLUSION
From the results of this study the concept of predicting compaction characteristics of fine grained soils containing varied proportions of fines has been made.
From the statistical analysis and the discussion part one can observe that there is a relatively good correlation between OMC and PL, similarly a good correlation observed between MDD and LL, PL and PI together.
And, generally from the regression analysis the following equations were found satisfactory. 1. OMC = 0.916 * PL - 0.030 * PI - 0.875, R2 = 0.807 2. MDD = - 0.18* PL - 0.027 * PI + 21.182, R2
= 0.835 The proposed correlation equations between the compaction characteristics of soils with their Atterberg limits are going to be a manageable tool in rapidly assessing the suitability of fine grained soils for compaction related purposes at the study locations.
From the developed correlations one would be in a situation to predict compaction characteristics of the index properties for some locations of Addis Ababa. Acknowledgment The authors wish to thank the Jimma Institute of Technology, Jimma University, as well as the Ethiopian Road Authority (ERA) for allowing this research project to proceed. This hard work could not be completed without the joint sponsorship program.
—————————— ——————————
□ Tesfamichael Tesgaye has earned his master’s degree in Geotechnical Engineering at Jimma Institute of Technology, Jimma University, Jimma, Ethiopia, Email address: [email protected]
□ Dr.Henok Fikre is currently Assistant Professor of Civil Engineering at Addis Ababa Institute of Technology, Addis Ababa, Ethiopia. Email address: [email protected]
□ Tadesse Abebe is currently a senior lecturer of Civil Engineering at Jimma Institute of Technology, Jimma University, Jimma, Ethiopia. Email address: [email protected]
References [1] (AASHTO), A.A.o.S.H.a.T.O., User Benefit Analysis for
Highways. 2003. [2] https://en.m.Wikipedia.org/wiki/Addis_Ababa, 2016 [3] Source of map: Addis Ababa City Road Authority [4] Kotari CR. Research Methododloy Methods and
Techniques, 2nd edition, New Delhi, New Age International Publishers; 2014
[5] Anne Holt, P.E., I. Applied Research Associates, and S. 5401 Eglinton Avenue West, Toronto, ON, Canada, M9C 5K6, Life Cycle Cost Analysis of Municipal Pavements in Southern and Eastern Ontario September 2011: Edmonton, Alberta p. 10.
[6] Antonio, M., Concrete vs Asphalt. A position paper, in Presentation from shell specialist. July, 2014: Philippines, Makati City.
[7] Authority, E.R., 17 Years Performance Assessment 2014, Ethiopian Road Authority, Road sector Development, Addis Ababa, Ethiopia. p. 3-32.
IJSER
International Journal of Scientific & Engineering Research Volume 8, Issue 6, June-2017 364 ISSN 2229-5518
IJSER © 2017 http://www.ijser.org
[8] Authority, E.R., Road, Sector Development Program (1997-2007) report. 2007, Ethiopian Road Authority: Addis Ababa,Ethiopia. p. 65-66.
[9] Authority, E.R., Technical Specification for Road Maintenance works,2nd Edition. 2003, Ethiopian Road Authority: Addis Ababa. p. III-1-III-2, V1-V22.
[10] Design, S.o.C.D.o.T.P.S.T.a.D.o., Life -Cycle Cost Analysis Procedures Manual. 2010. p. 14.
[11] Development, O. F. E. C. -o. (2005) Economic Evaluation of Long -Life pavements-Phase I.
[12] ENGINEER, J.N.V.C., Pavement Life-Cycle Cost Studies Using Actual Cost Data. 2005. p. 4.
[13] Openion, E. www.ethiopianopenion.com. 2014 [cited 2014].
[14] PLC, C.C.E., Engineering Design Report Chancho-Derba. 2012, ERA: Addis Ababa, Ethiopia.
[15] Smith, J.W.I.a.M.R., Life-Cycle Cost Analysis in Pavement Design 1998. p. 9.
IJSER