Embed Size (px)
Citation preview
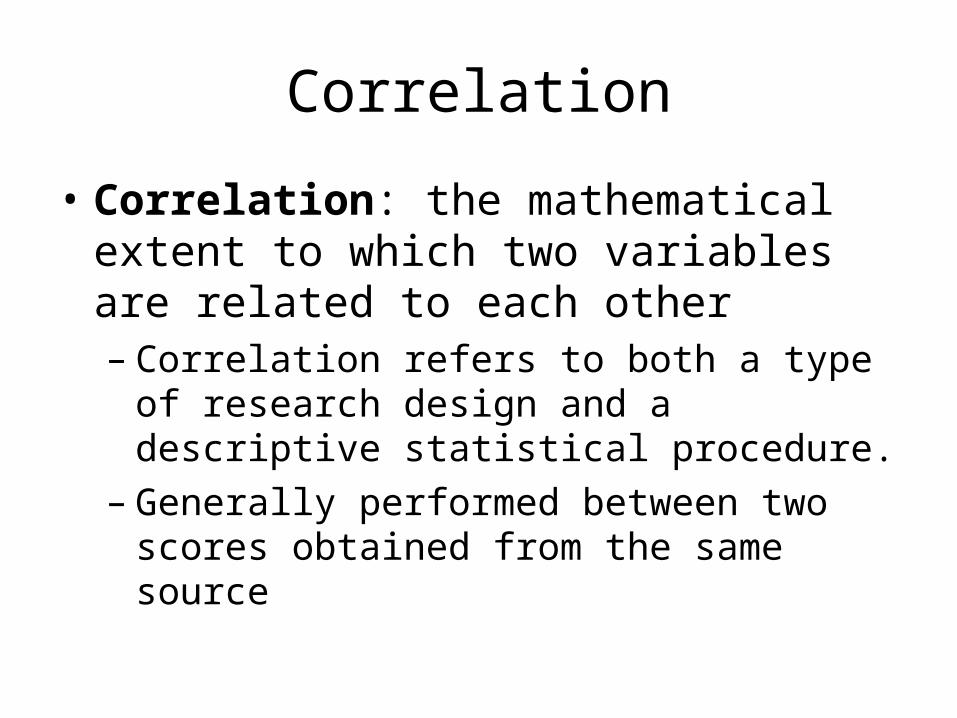
Correlation
• Correlation: the mathematical extent to which two variables are related to each other– Correlation refers to both a type of research design and
a descriptive statistical procedure.– Generally performed between two scores obtained from
the same source
Correlation Coefficient
• Correlation Coefficient: number between +1 and -1 that represents the strength and direction of the relationship between two variables
• Correlations that are closer to +1 and –1 are stronger and are better able to accurately predict
Types of Correlation Coefficients
• Pearson r: both variables are measured at an interval/ratio level
• Spearman rho: used when the measurement of at least one variable is ordinal (scores on the other variable must be converted to ranks)
Positive Correlations
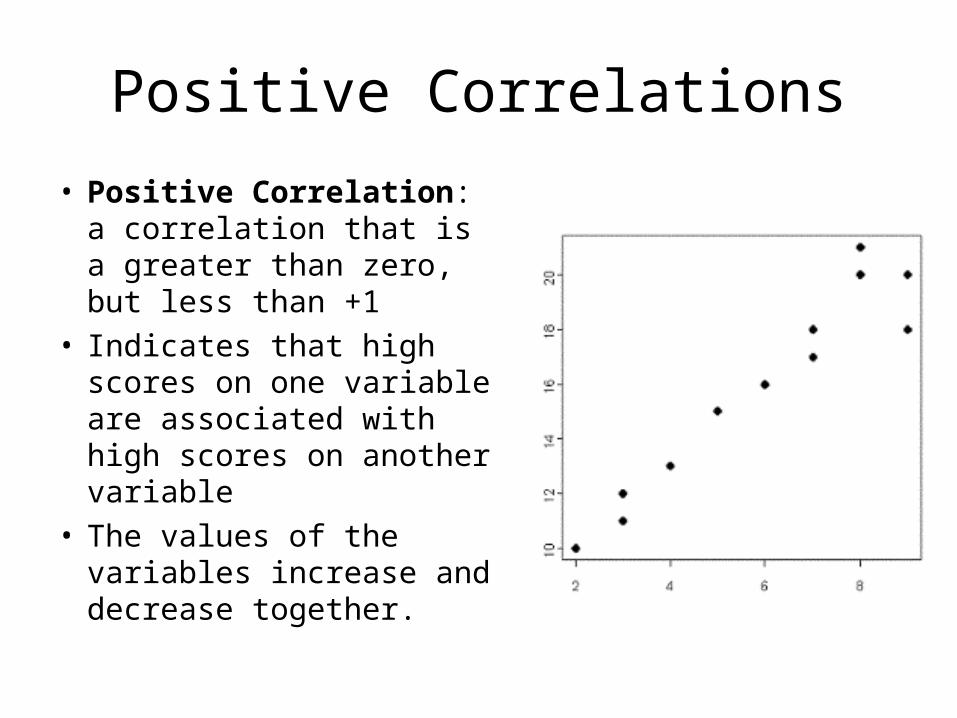
• Positive Correlation: a correlation that is a greater than zero, but less than +1
• Indicates that high scores on one variable are associated with high scores on another variable
• The values of the variables increase and decrease together.
Negative Correlations
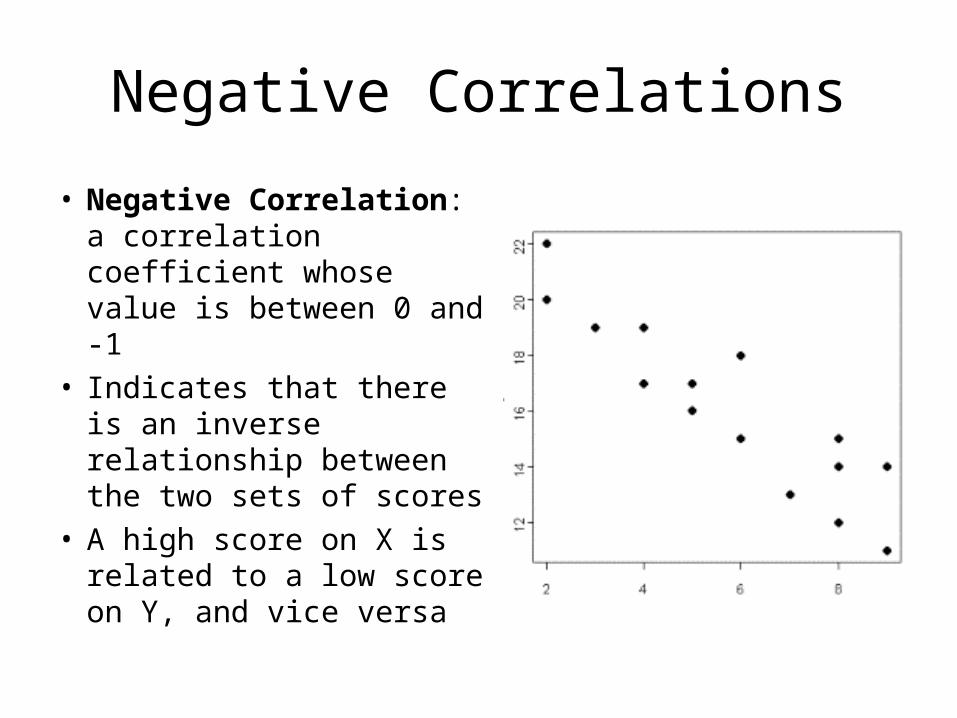
• Negative Correlation: a correlation coefficient whose value is between 0 and -1
• Indicates that there is an inverse relationship between the two sets of scores
• A high score on X is related to a low score on Y, and vice versa
Linear Relationships
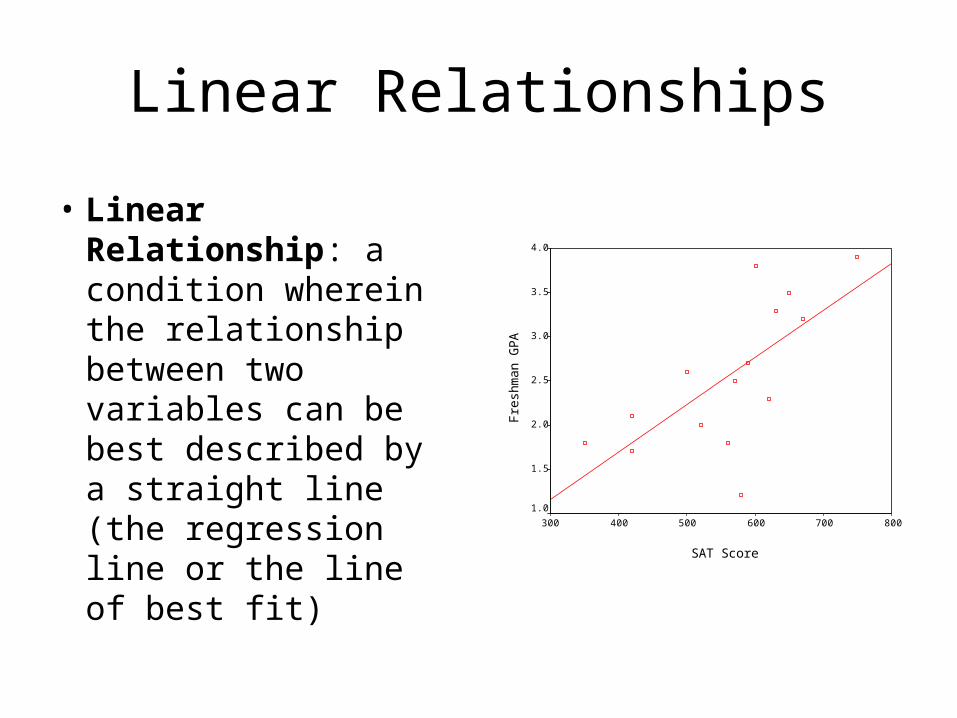
• Linear Relationship: a condition wherein the relationship between two variables can be best described by a straight line (the regression line or the line of best fit)
SAT Score
800700600500400300F
resh
man
GP
A
4.0
3.5
3.0
2.5
2.0
1.5
1.0

Scatterplots• Scatterplot: provides a visual representation of the
relationship between variables• Each point represents paired measurements on two
variables for a specific individual

Understanding the Pearson Product Moment Correlation Coefficient
• Pearson r: represents the extent to which individuals occupy the same relative position in two distributions
• Definitional Equation:
• Important Reminder: – Σz2 = N
Σz x z yN
r =
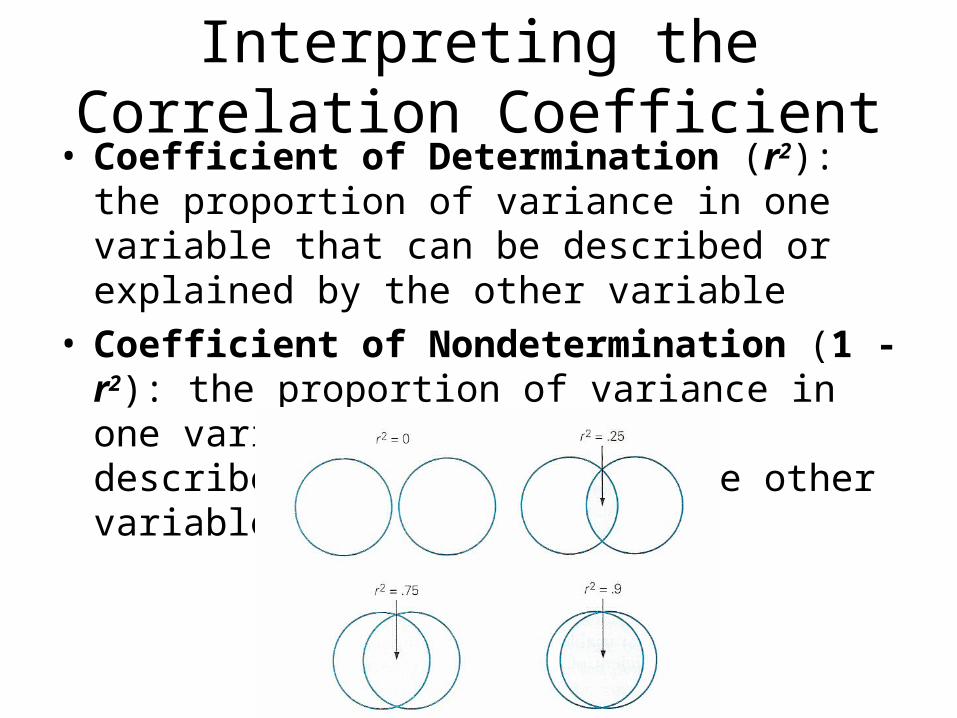
Interpreting the Correlation Coefficient• Coefficient of Determination (r2): the proportion of
variance in one variable that can be described or explained by the other variable
• Coefficient of Nondetermination (1 - r2): the proportion of variance in one variable that cannot be described or explained by the other variable
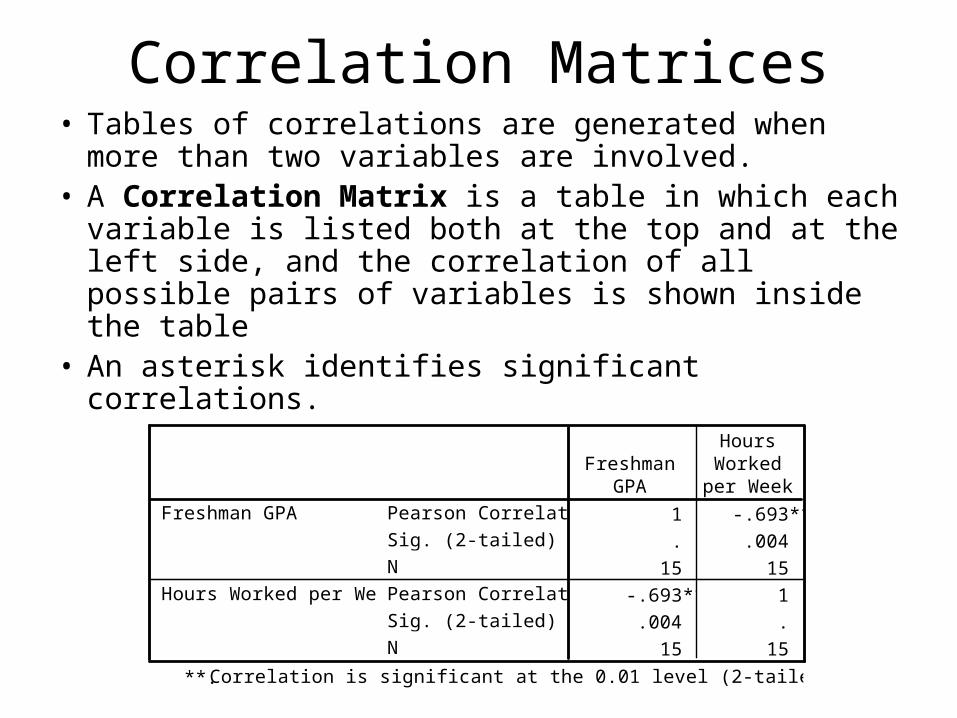
Correlation Matrices• Tables of correlations are generated when more than two
variables are involved.• A Correlation Matrix is a table in which each variable is
listed both at the top and at the left side, and the correlation of all possible pairs of variables is shown inside the table
• An asterisk identifies significant correlations. Correlations
1 -.693**
. .004
15 15
-.693** 1
.004 .
15 15
Pearson Correlation
Sig. (2-tailed)
N
Pearson Correlation
Sig. (2-tailed)
N
Freshman GPA
Hours Worked per Week
FreshmanGPA
HoursWorked
per Week
Correlation is significant at the 0.01 level (2-tailed).**.
Caution: Spurious Correlations• Spurious Correlations: a correlation coefficient
that is artificially high or low because of the nature of the data or method for collecting the data
• Common Causes of Spurious Correlations:– A nonlinear relationship– Truncated range– Sample Size– Outliers– Multiple Populations– Extreme Scores
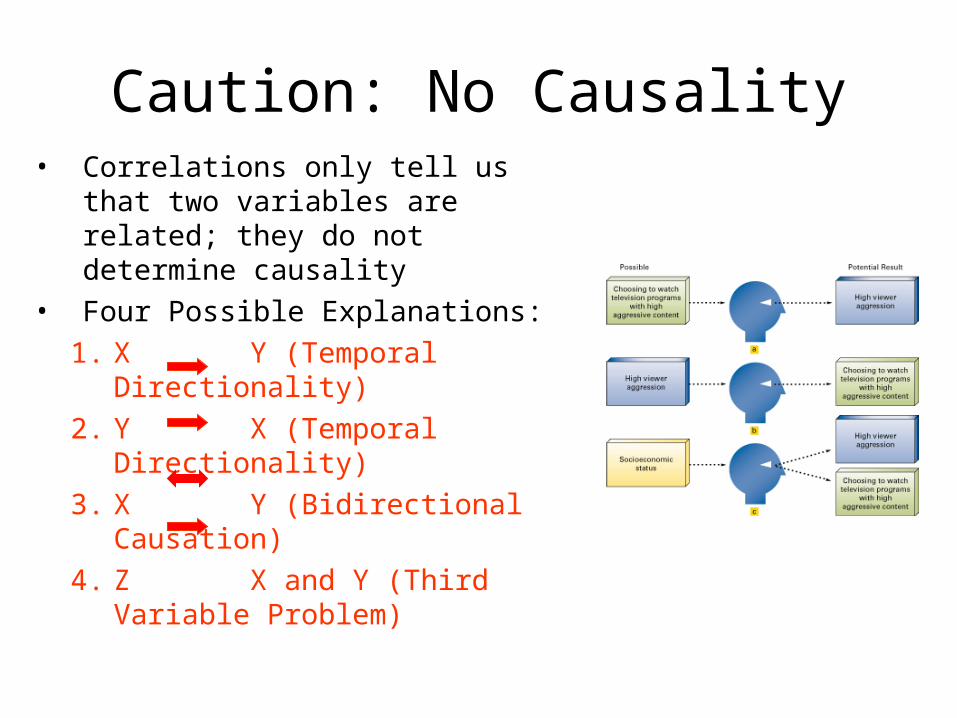
Caution: No Causality• Correlations only tell us that two
variables are related; they do not determine causality
• Four Possible Explanations:1. X Y (Temporal Directionality)2. Y X (Temporal Directionality)3. X Y (Bidirectional Causation)4. Z X and Y (Third Variable
Problem)
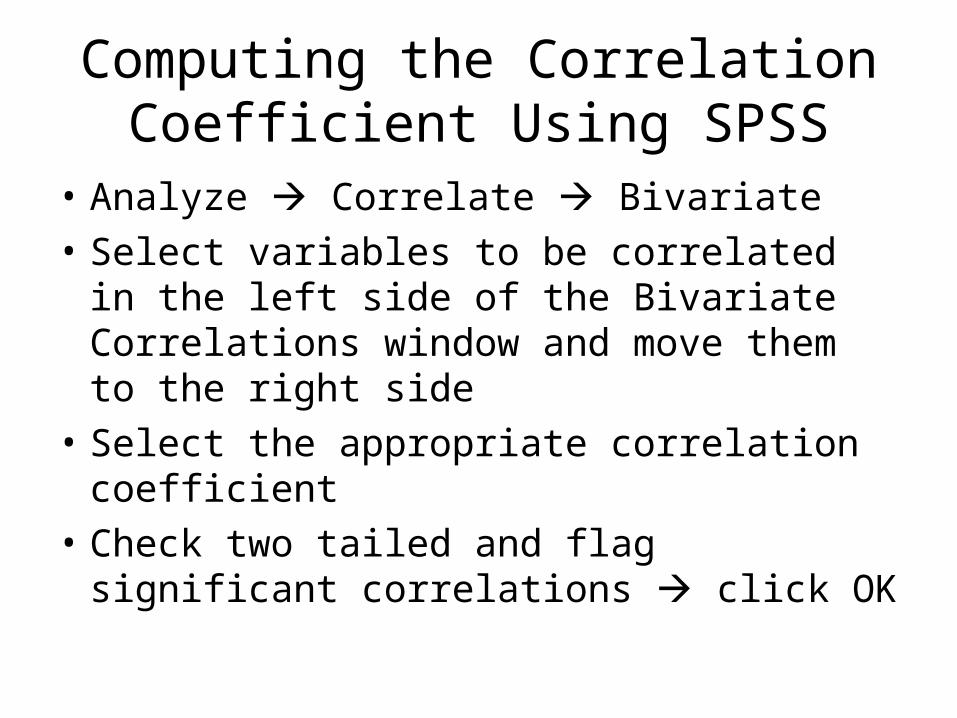
Computing the Correlation Coefficient Using SPSS
• Analyze Correlate Bivariate• Select variables to be correlated in the left side of
the Bivariate Correlations window and move them to the right side
• Select the appropriate correlation coefficient• Check two tailed and flag significant correlations
click OK
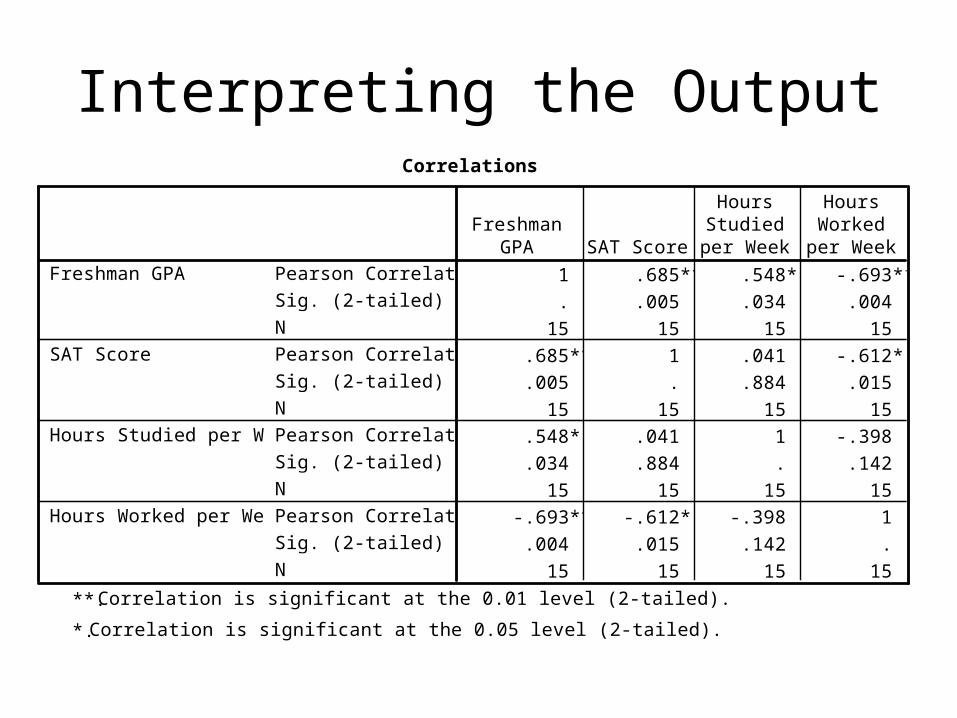
Interpreting the OutputCorrelations
1 .685** .548* -.693**
. .005 .034 .004
15 15 15 15
.685** 1 .041 -.612*
.005 . .884 .015
15 15 15 15
.548* .041 1 -.398
.034 .884 . .142
15 15 15 15
-.693** -.612* -.398 1
.004 .015 .142 .
15 15 15 15
Pearson Correlation
Sig. (2-tailed)
N
Pearson Correlation
Sig. (2-tailed)
N
Pearson Correlation
Sig. (2-tailed)
N
Pearson Correlation
Sig. (2-tailed)
N
Freshman GPA
SAT Score
Hours Studied per Week
Hours Worked per Week
FreshmanGPA SAT Score
HoursStudied
per Week
HoursWorked
per Week
Correlation is significant at the 0.01 level (2-tailed).**.
Correlation is significant at the 0.05 level (2-tailed).*.
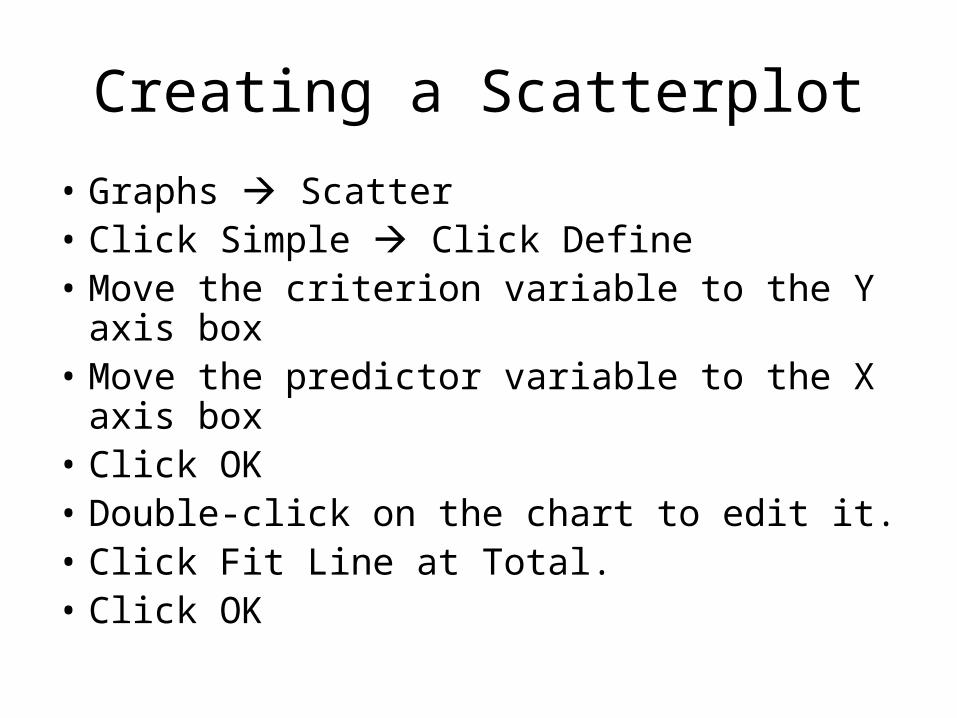
Creating a Scatterplot
• Graphs Scatter• Click Simple Click Define• Move the criterion variable to the Y axis box• Move the predictor variable to the X axis box• Click OK• Double-click on the chart to edit it.• Click Fit Line at Total.• Click OK

Reading Scatterplots
Hours Worked per Week
403020100-10
Fre
shm
an
GP
A
4.0
3.5
3.0
2.5
2.0
1.5
1.0
Hours Studied per Week
403020100
Fre
shm
an G
PA
4.0
3.5
3.0
2.5
2.0
1.5
1.0
Linear Regression
• An important use of the correlation coefficient is the ability to predict one set of scores from another.
• If we know the score on one variable, we can use that score to predict someone’s score on the correlated variable.

The Regression Line
• Line of Best Fit: minimizes the distance between each individual point and the regression line
SAT Score
800700600500400300
Fre
shm
an G
PA
4.0
3.5
3.0
2.5
2.0
1.5
1.0
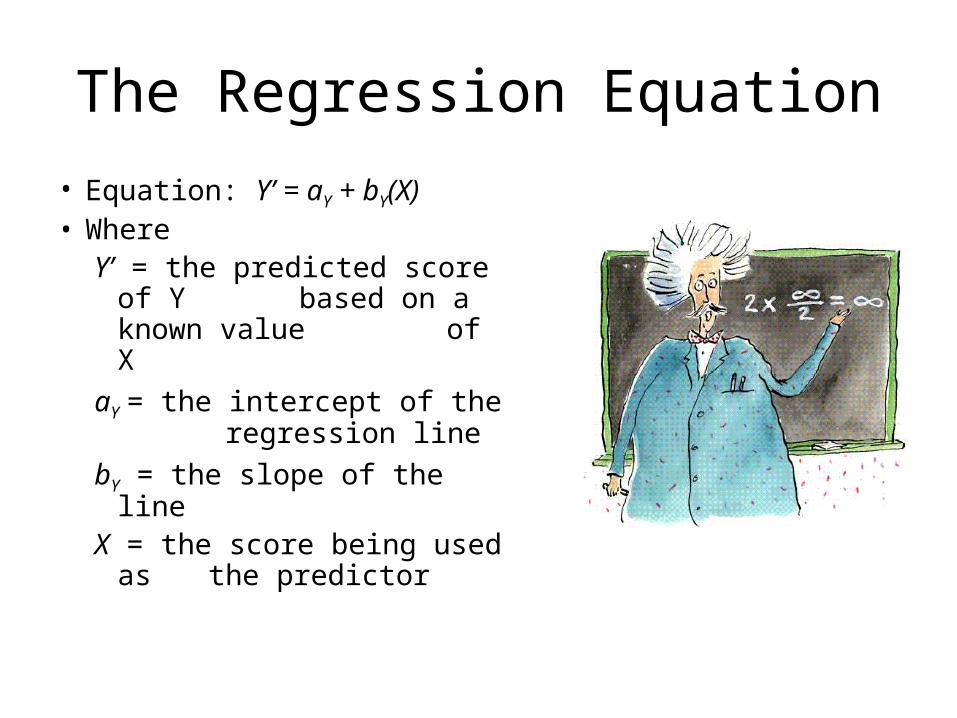
The Regression Equation
• Equation: Y’ = aY + bY(X)• Where
Y’ = the predicted score of Y based on a known value of X
aY = the intercept of the regression line
bY = the slope of the lineX = the score being used as
the predictor
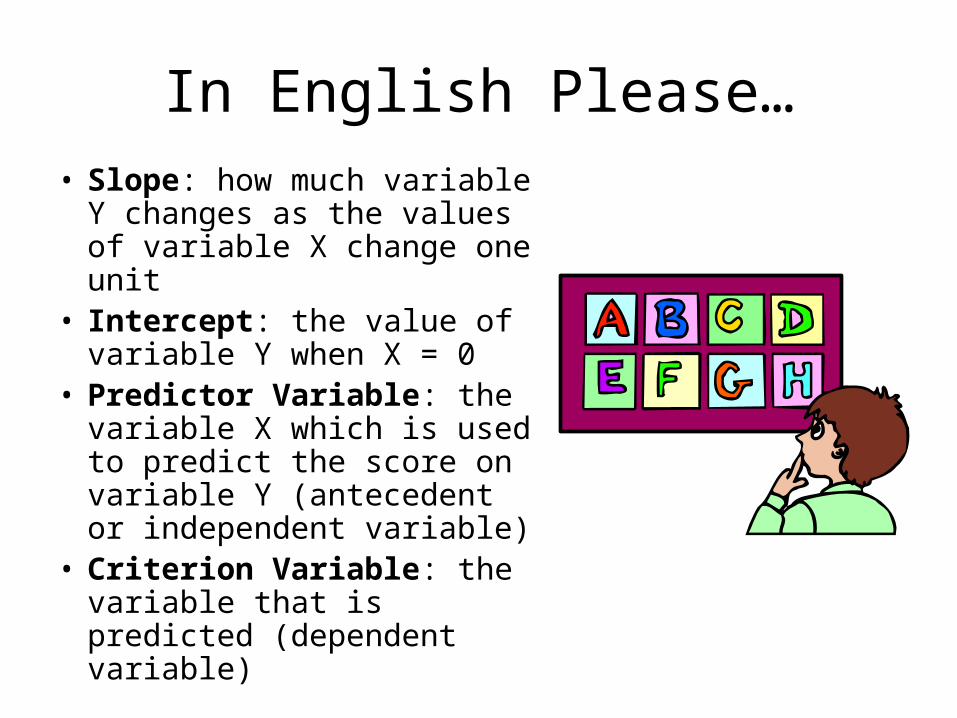
In English Please…• Slope: how much variable Y
changes as the values of variable X change one unit
• Intercept: the value of variable Y when X = 0
• Predictor Variable: the variable X which is used to predict the score on variable Y (antecedent or independent variable)
• Criterion Variable: the variable that is predicted (dependent variable)
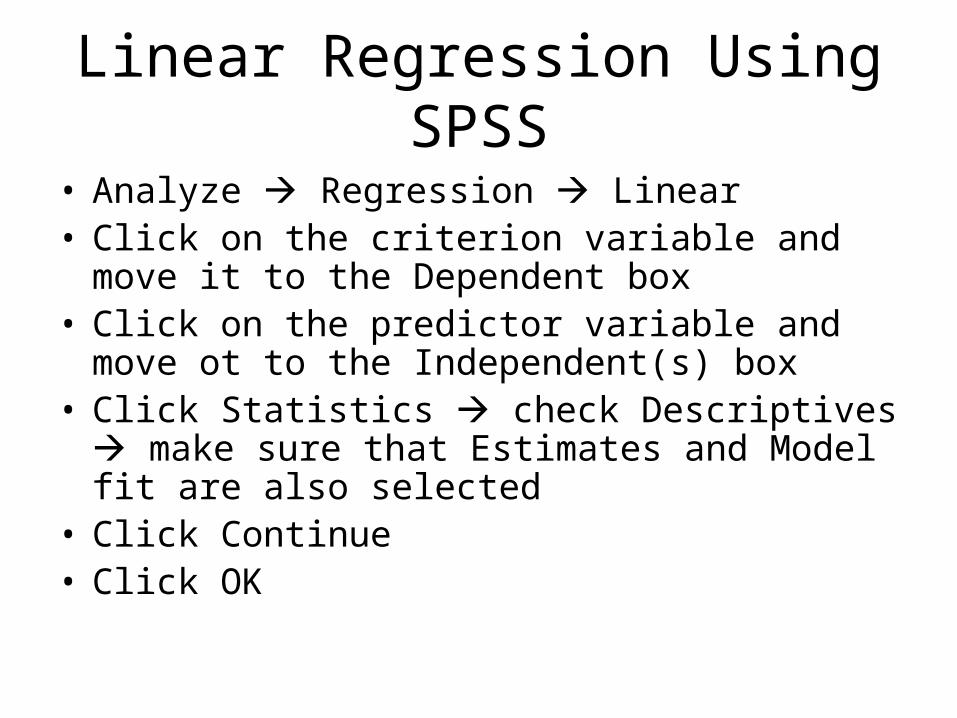
Linear Regression Using SPSS• Analyze Regression Linear• Click on the criterion variable and move it to the Dependent
box• Click on the predictor variable and move ot to the
Independent(s) box• Click Statistics check Descriptives make sure that
Estimates and Model fit are also selected• Click Continue• Click OK
Interpreting the OutputANOVAb
2.862 1 2.862 5.575 .034a
6.674 13 .513
9.536 14
Regression
Residual
Total
Model1
Sum ofSquares df Mean Square F Sig.
Predictors: (Constant), Hours Studied per Weeka.
Coefficientsa
1.735 .395 4.388 .001
.060 .025 .548 2.361 .034
(Constant)
Hours Studied per Week
Model1
B Std. Error
UnstandardizedCoefficients
Beta
StandardizedCoefficients
t Sig.
Dependent Variable: Freshman GPAa.
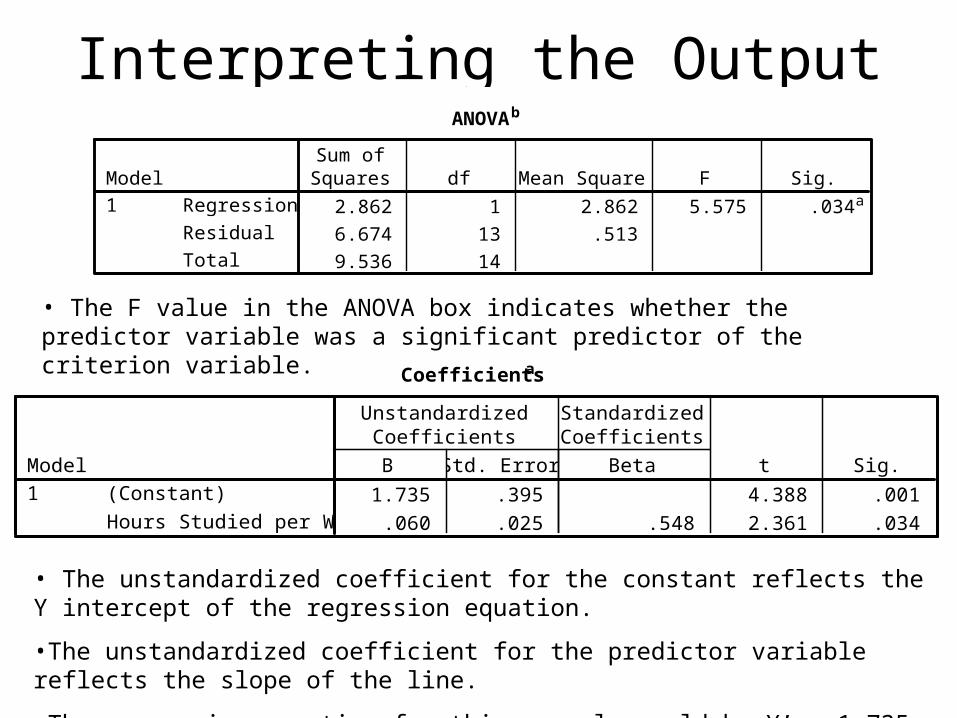
• The F value in the ANOVA box indicates whether the predictor variable was a significant predictor of the criterion variable.
• The unstandardized coefficient for the constant reflects the Y intercept of the regression equation.
•The unstandardized coefficient for the predictor variable reflects the slope of the line.
•The regression equation for this example would be Y’ = 1.735 + .06X