Embed Size (px)
DESCRIPTION
Correlation Indicates the relationship between two dependent variables (x and y) Symbol: r (Pearson correlation coefficient) -1< r < 1. Positive Correlation As value of variable X increases, value of variable Y increases. Strong Positive Corr. r = .80. - PowerPoint PPT Presentation
Citation preview

Correlation
Indicates the relationship between two dependent variables (x and y)
Symbol: r (Pearson correlation coefficient)
-1< r < 1

Positive Correlation
As value of variable X increases, value of variable Y increases

Strong Positive Corr.
r = .80

Strong positive correlation:
- low variability of the data
- one variable acts as a good predictor of the second variable.

Weaker Positive Corr.
r = .50

Weaker correlations:
- More variability in the data
- Less predictability

Negative correlation
As value of variable X increases, value of variable Y decreases.

Strong negative Corr.
r = -.80

Social Activities
Grades

# of bananas eaten
StatisticsAbility
No Correlation r = 0

Variables measured on different scales
e.g. Height and weight
Correlation formula converts the scores into z-score to make them comparable

Limit of correlation is that itidentifies a relationship, but is NOT identifying cause

r
n XY X Y
n X X n Y Y
2 2 2 2

r
n XY X Y
n X X n Y Y
2 2 2 2
Multiply each value of X by its corresponding Y.
Add the products.
Multiply sum by n

r
n XY X Y
n X X n Y Y
2 2 2 2
Add all the X values. Add all the Y values.
Multiply the two sums.

r
n XY X Y
n X X n Y Y
2 2 2 2
Variation of the formula for SS for X

r
n XY X Y
n X X n Y Y
2
22
2
Variation of the formula for SS of Y

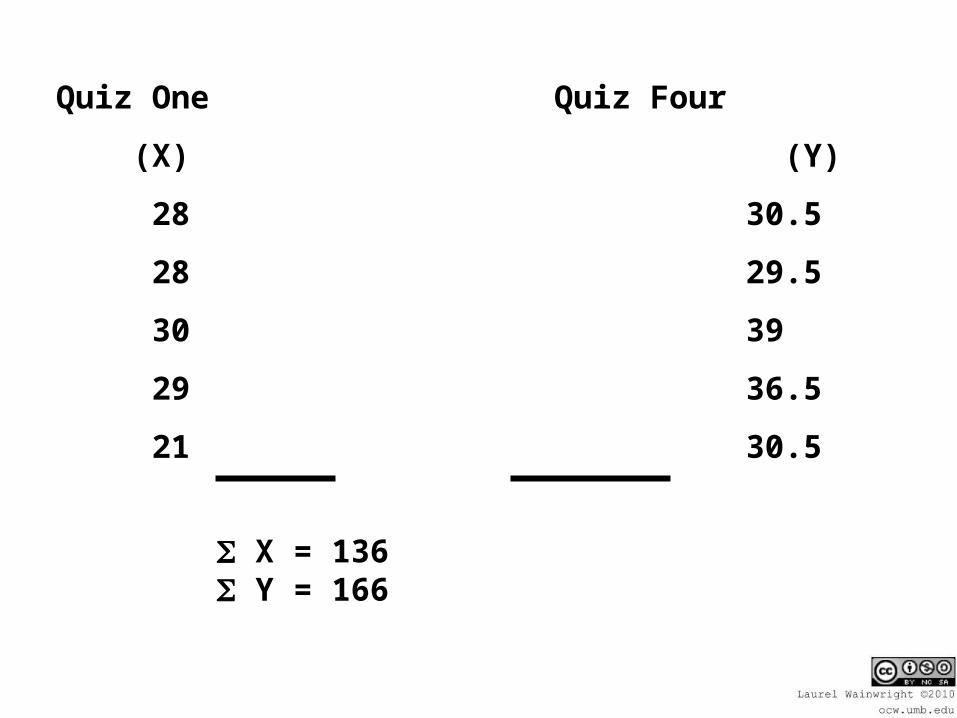
Quiz One Quiz Four
(X) (Y)
28 30.5
28 29.5
30 39
29 36.5
21 30.5
Quiz One Quiz Four
(X) (Y)
28 30.5
28 29.5
30 39
29 36.5
21 30.5
X = 136 Y = 166

Quiz One Quiz Four
(X) X2 (Y)
28 784 30.5
28 784 29.5
30 900 39
29 841 36.5
21 441 30.5
X2 = 3750

Quiz One Quiz Four
(X) (Y) Y2
28 30.5 930.25
28 29.5 870.25
30 39 1521
29 36.5 1332.25
21 30.5 930.25
Y2 = 5584

Quiz One Quiz Four
(X) (Y) (X)(Y)
28 30.5 854
28 29.5 826
30 39 1170
29 36.5 1058.5
21 30.5 640.5
XY = 4549

X = 136 Y = 166
X2 = 3750 Y2 = 5584
XY = 4549
n = 5

r
5 4549 136 166
5 3750 136 5 5584 1662 2

22745 22576
18750 18496 27920 27556

169
254 364

169
92456

169
304 07.
r .55

Critical Value:
df = n -- 2
r crit. = .878

df Critical r
3 .878
5 .754
10 .576
20 .423
50 .273
100 .195

How much variability of X and Y is jointly shared?

How much of the variability of X can be accounted for by variability in Y?

r2 = the strength or the amount of shared variability

r r2
.9 .81 or 81%
.8 .64 or 64%
.7 .49 or 49%

df Critical r
3 .878
5 .754
10 .576
20 .423
50 .273
100 .195

y bx a

b
n xy x y
n x x
2 2

y bx a
y bx a

y bx a

# of absences test grade 8 35 0 48 3 43 2 41 5 39 6 36 X = 24 Y = 242

# of absences test grade 8 64 35 1225 0 0 48 2304 3 9 43 1849 2 4 41 1681 5 25 39 1521 6 36 36 1296 X2= 138 Y2 = 9876

# of absences test grade 8 35 280 0 48 0 3 43 129 2 41 82 5 39 195 6 36 216 xy = 902

r
n XY X Y
n X X n Y Y
2
22
2

r
6 902 24 242
6 138 24 6 9876 2422 2
( )

396
417 59
95
.
.r

b
n xy x y
n x x
2
2
b
5412 5808
6 138 242

57.1
252
396
b

y bx a
y bx a
46
24
X
X
33.406
242
y
y

a )4)(57.1(33.40
40 33 6 28
46 61
. .
.
a
a
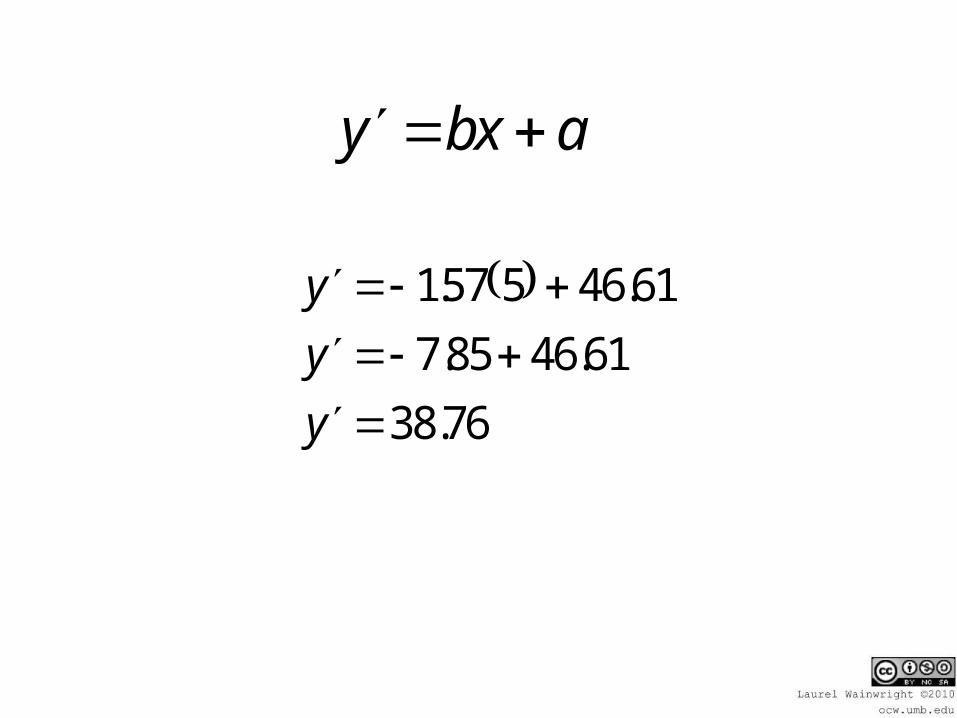
y bx a
y
y
y
157 5 46 61
7 85 46 61
38 76
. .
. .
.