Embed Size (px)
Citation preview
1
CORRELATION OF HIGH SPEED FILMS
WITH OTHER CLINICAL VOICE
MEASUREMENTS Conference of optical imaging, therapeutics, and advanced
technology in head and neck surgery and otolaryngology
Orlando 2012
Mette Pedersen, MD
Ear, nose, throat specialist. FRSM. Dr.med.sci. et h.c.
Former Danish COST representative in the European Union,
The Medical Center
Østergade 18, 3
1100 Copenhagen, Denmark
(published paper 2012 - see www.mpedersen.org)
ABSTRACT
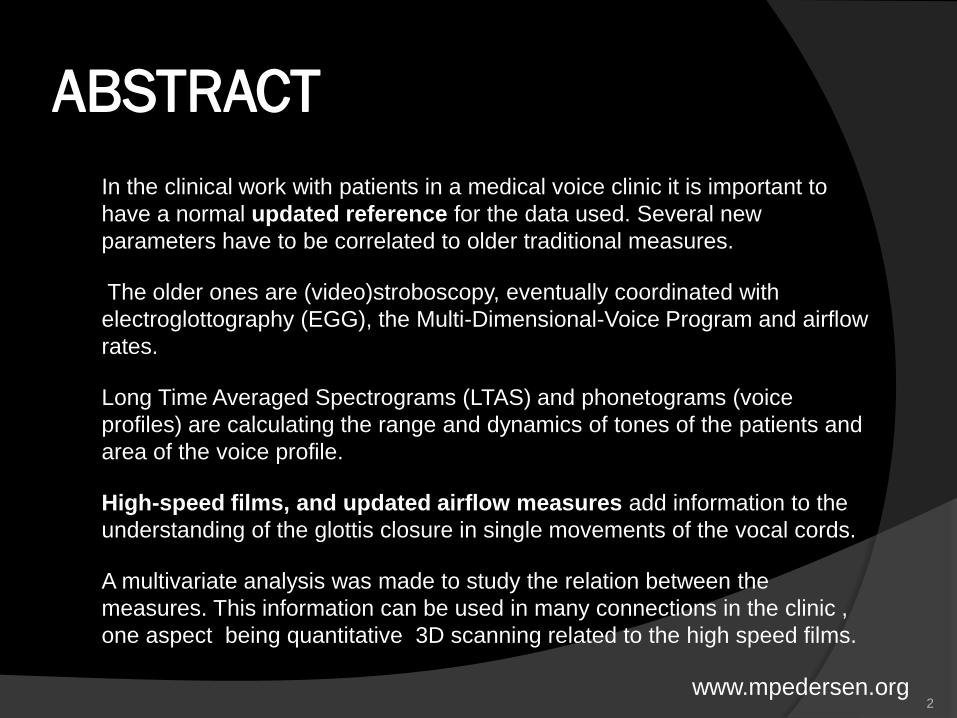
In the clinical work with patients in a medical voice clinic it is important to
have a normal updated reference for the data used. Several new
parameters have to be correlated to older traditional measures.
The older ones are (video)stroboscopy, eventually coordinated with
electroglottography (EGG), the Multi-Dimensional-Voice Program and airflow
rates.
Long Time Averaged Spectrograms (LTAS) and phonetograms (voice
profiles) are calculating the range and dynamics of tones of the patients and
area of the voice profile.
High-speed films, and updated airflow measures add information to the
understanding of the glottis closure in single movements of the vocal cords.
A multivariate analysis was made to study the relation between the
measures. This information can be used in many connections in the clinic ,
one aspect being quantitative 3D scanning related to the high speed films.
2
www.mpedersen.org
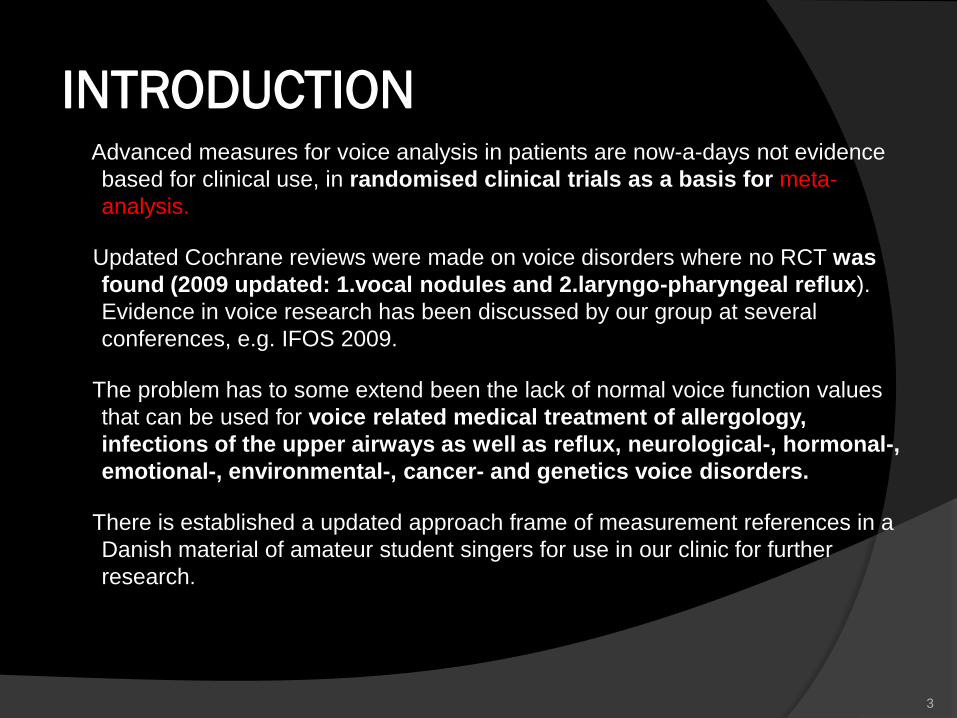
INTRODUCTION Advanced measures for voice analysis in patients are now-a-days not evidence
based for clinical use, in randomised clinical trials as a basis for meta-
analysis.
Updated Cochrane reviews were made on voice disorders where no RCT was
found (2009 updated: 1.vocal nodules and 2.laryngo-pharyngeal reflux).
Evidence in voice research has been discussed by our group at several
conferences, e.g. IFOS 2009.
The problem has to some extend been the lack of normal voice function values
that can be used for voice related medical treatment of allergology,
infections of the upper airways as well as reflux, neurological-, hormonal-,
emotional-, environmental-, cancer- and genetics voice disorders.
There is established a updated approach frame of measurement references in a
Danish material of amateur student singers for use in our clinic for further
research.
3
INTRODUCTION
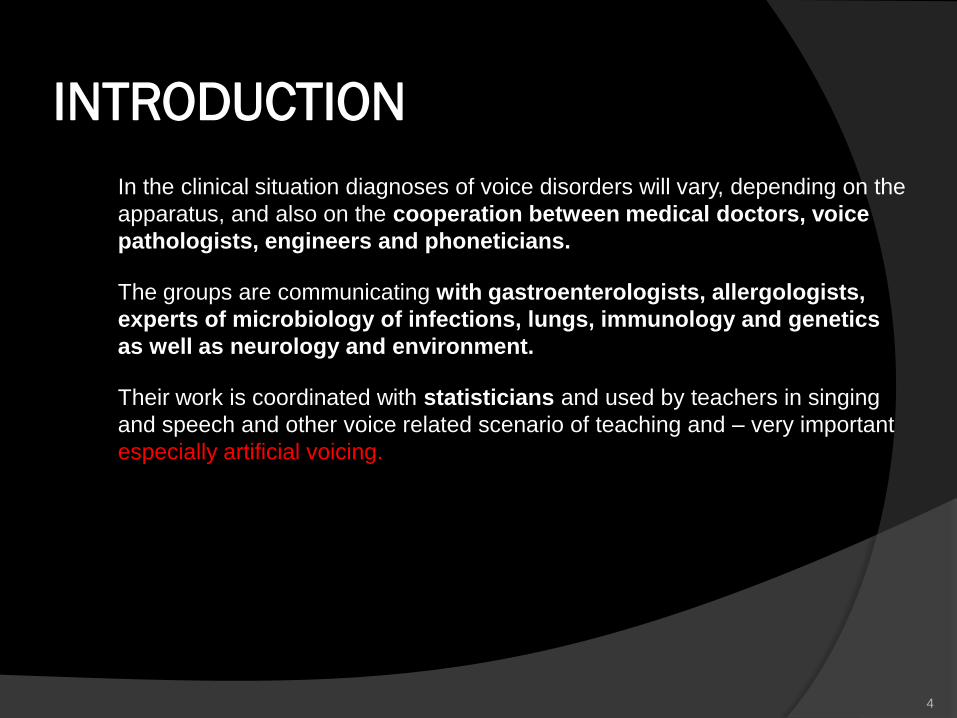
In the clinical situation diagnoses of voice disorders will vary, depending on the
apparatus, and also on the cooperation between medical doctors, voice
pathologists, engineers and phoneticians.
The groups are communicating with gastroenterologists, allergologists,
experts of microbiology of infections, lungs, immunology and genetics
as well as neurology and environment.
Their work is coordinated with statisticians and used by teachers in singing
and speech and other voice related scenario of teaching and – very important
especially artificial voicing.
4
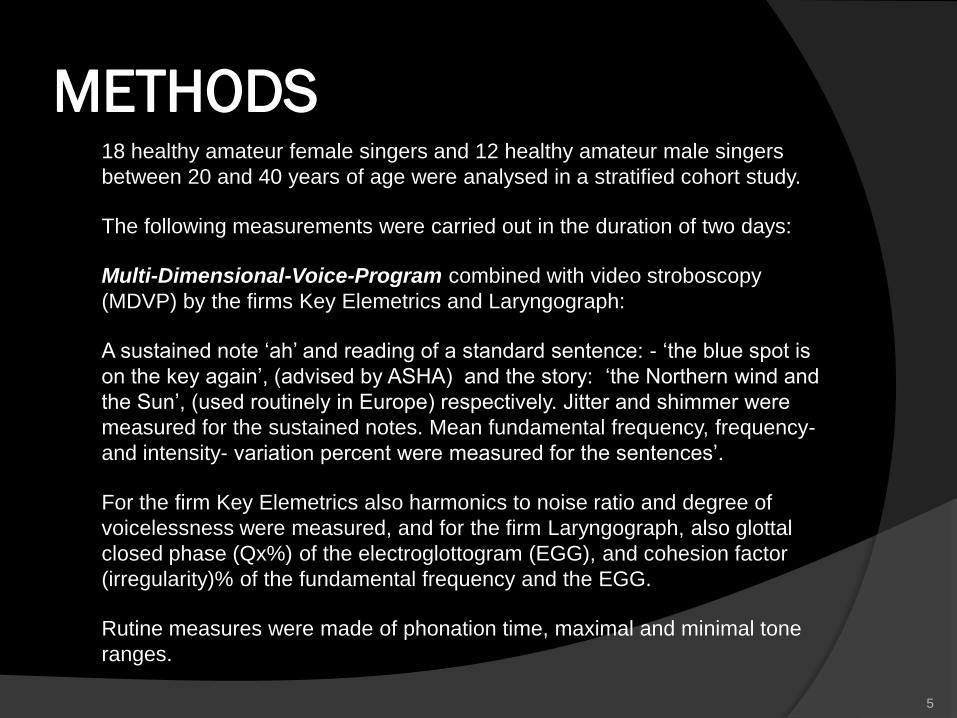
METHODS 18 healthy amateur female singers and 12 healthy amateur male singers
between 20 and 40 years of age were analysed in a stratified cohort study.
The following measurements were carried out in the duration of two days:
Multi-Dimensional-Voice-Program combined with video stroboscopy
(MDVP) by the firms Key Elemetrics and Laryngograph:
A sustained note ‘ah’ and reading of a standard sentence: - ‘the blue spot is
on the key again’, (advised by ASHA) and the story: ‘the Northern wind and
the Sun’, (used routinely in Europe) respectively. Jitter and shimmer were
measured for the sustained notes. Mean fundamental frequency, frequency-
and intensity- variation percent were measured for the sentences’.
For the firm Key Elemetrics also harmonics to noise ratio and degree of
voicelessness were measured, and for the firm Laryngograph, also glottal
closed phase (Qx%) of the electroglottogram (EGG), and cohesion factor
(irregularity)% of the fundamental frequency and the EGG.
Rutine measures were made of phonation time, maximal and minimal tone
ranges.
5
METHODS
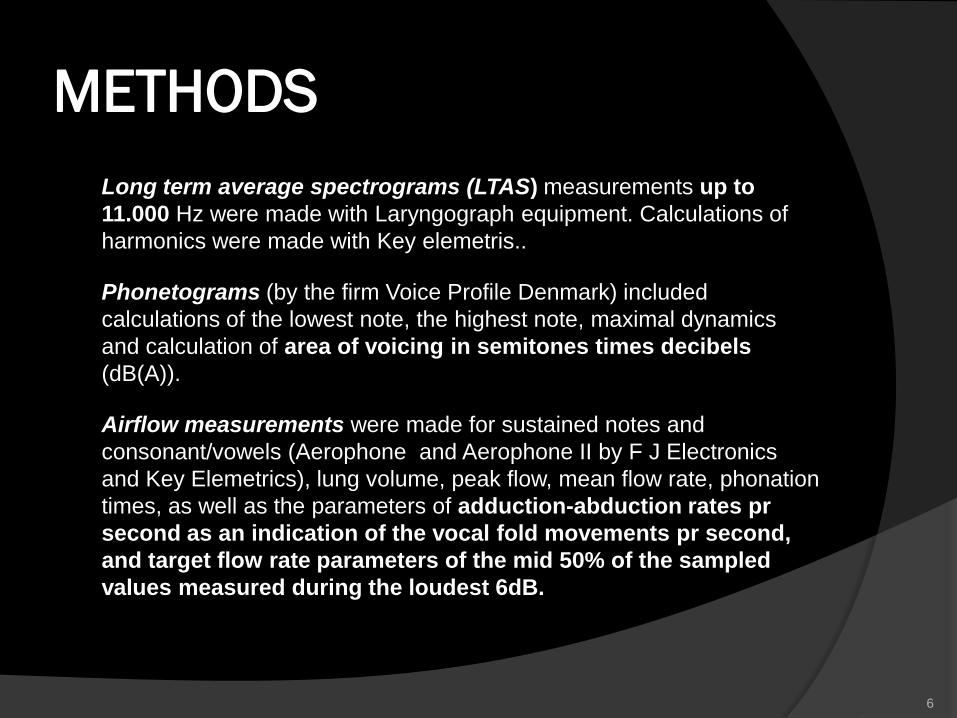
Long term average spectrograms (LTAS) measurements up to
11.000 Hz were made with Laryngograph equipment. Calculations of
harmonics were made with Key elemetris..
Phonetograms (by the firm Voice Profile Denmark) included
calculations of the lowest note, the highest note, maximal dynamics
and calculation of area of voicing in semitones times decibels
(dB(A)).
Airflow measurements were made for sustained notes and
consonant/vowels (Aerophone and Aerophone II by F J Electronics
and Key Elemetrics), lung volume, peak flow, mean flow rate, phonation
times, as well as the parameters of adduction-abduction rates pr
second as an indication of the vocal fold movements pr second,
and target flow rate parameters of the mid 50% of the sampled
values measured during the loudest 6dB.
6
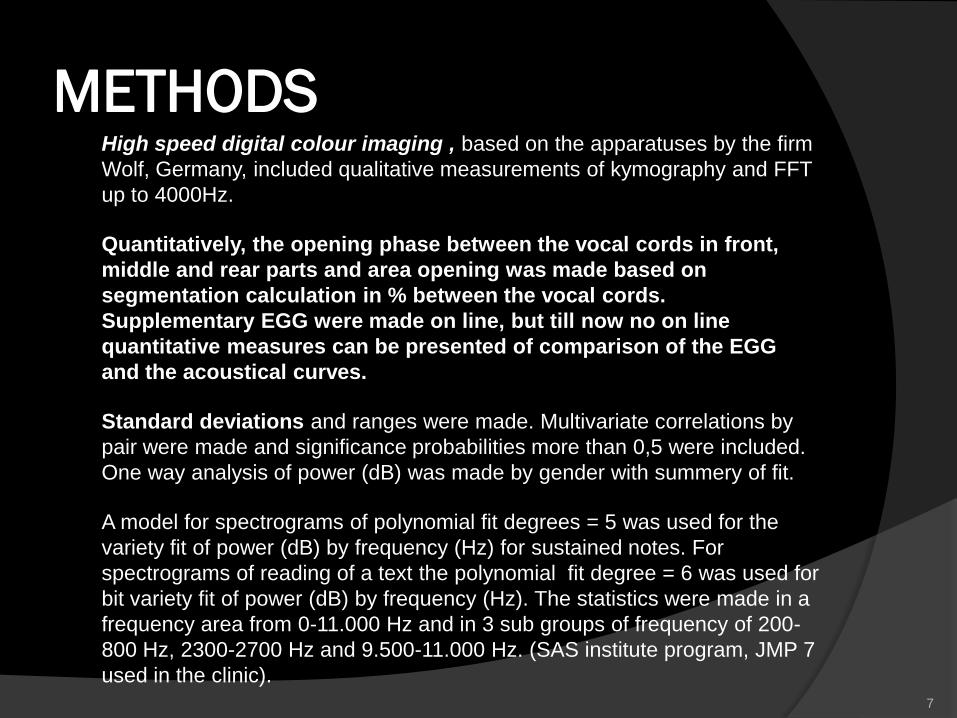
METHODS High speed digital colour imaging , based on the apparatuses by the firm
Wolf, Germany, included qualitative measurements of kymography and FFT
up to 4000Hz.
Quantitatively, the opening phase between the vocal cords in front,
middle and rear parts and area opening was made based on
segmentation calculation in % between the vocal cords.
Supplementary EGG were made on line, but till now no on line
quantitative measures can be presented of comparison of the EGG
and the acoustical curves.
Standard deviations and ranges were made. Multivariate correlations by
pair were made and significance probabilities more than 0,5 were included.
One way analysis of power (dB) was made by gender with summery of fit.
A model for spectrograms of polynomial fit degrees = 5 was used for the
variety fit of power (dB) by frequency (Hz) for sustained notes. For
spectrograms of reading of a text the polynomial fit degree = 6 was used for
bit variety fit of power (dB) by frequency (Hz). The statistics were made in a
frequency area from 0-11.000 Hz and in 3 sub groups of frequency of 200-
800 Hz, 2300-2700 Hz and 9.500-11.000 Hz. (SAS institute program, JMP 7
used in the clinic).
7
RESULTS
The 18 female and 12 male amateur singers had normal video
stroboscopies - an evaluation was made that the high speed films were
normal too:
The mucosa representing normality and no reactions of e.g. infections,
allergies and others.
The arytenoid regions without any oedema or other reactions e.g.
related to the swallowing process.
8
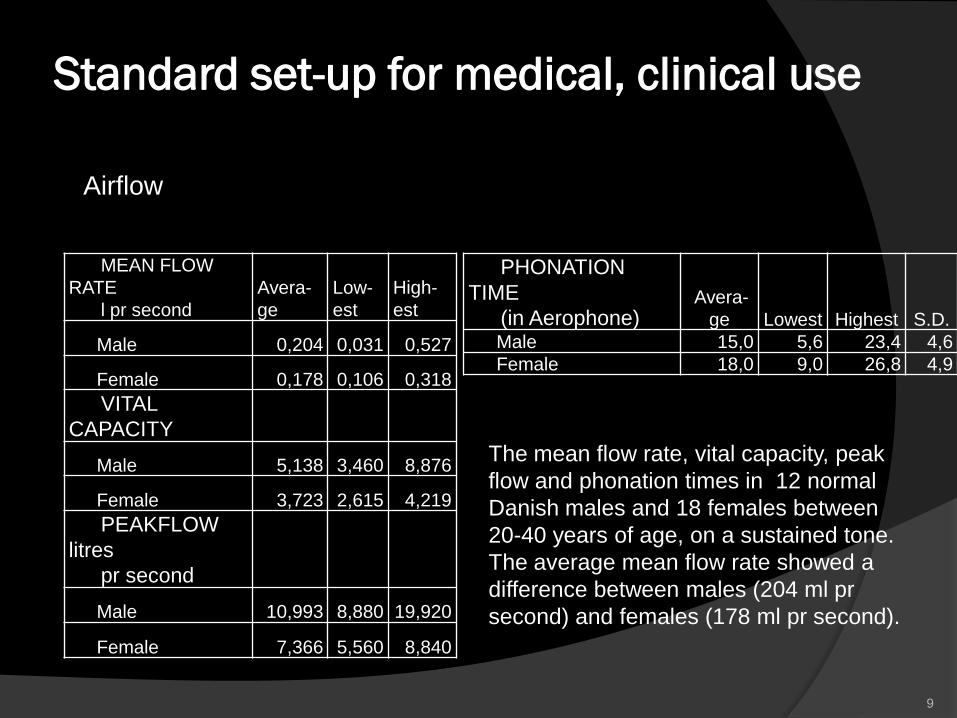
Standard set-up for medical, clinical use
Airflow
9
MEAN FLOW
RATE
l pr second
Avera-
ge
Low-
est
High-
est
Male 0,204 0,031 0,527
Female 0,178 0,106 0,318
VITAL
CAPACITY
Male 5,138 3,460 8,876
Female 3,723 2,615 4,219
PEAKFLOW
litres
pr second
Male 10,993 8,880 19,920
Female 7,366 5,560 8,840
PHONATION
TIME
(in Aerophone) Avera-
ge Lowest Highest S.D.
Male 15,0 5,6 23,4 4,6
Female 18,0 9,0 26,8 4,9
The mean flow rate, vital capacity, peak
flow and phonation times in 12 normal
Danish males and 18 females between
20-40 years of age, on a sustained tone.
The average mean flow rate showed a
difference between males (204 ml pr
second) and females (178 ml pr second).
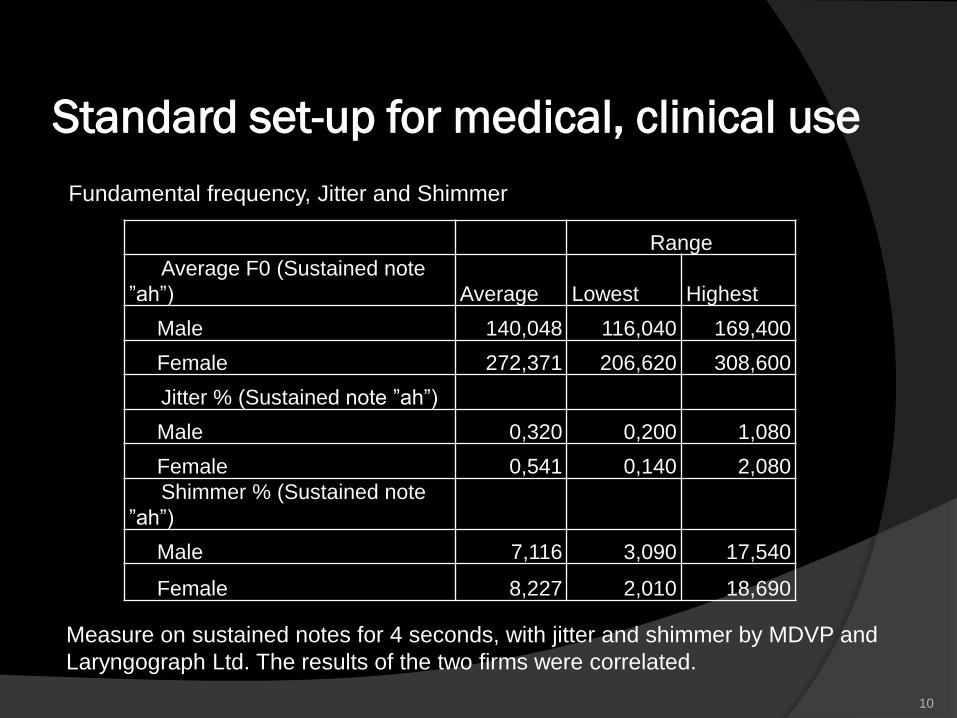
Standard set-up for medical, clinical use
Fundamental frequency, Jitter and Shimmer
10
Measure on sustained notes for 4 seconds, with jitter and shimmer by MDVP and
Laryngograph Ltd. The results of the two firms were correlated.
Range
Average F0 (Sustained note
”ah”) Average Lowest Highest
Male 140,048 116,040 169,400
Female 272,371 206,620 308,600
Jitter % (Sustained note ”ah”)
Male 0,320 0,200 1,080
Female 0,541 0,140 2,080
Shimmer % (Sustained note
”ah”)
Male 7,116 3,090 17,540
Female 8,227 2,010 18,690
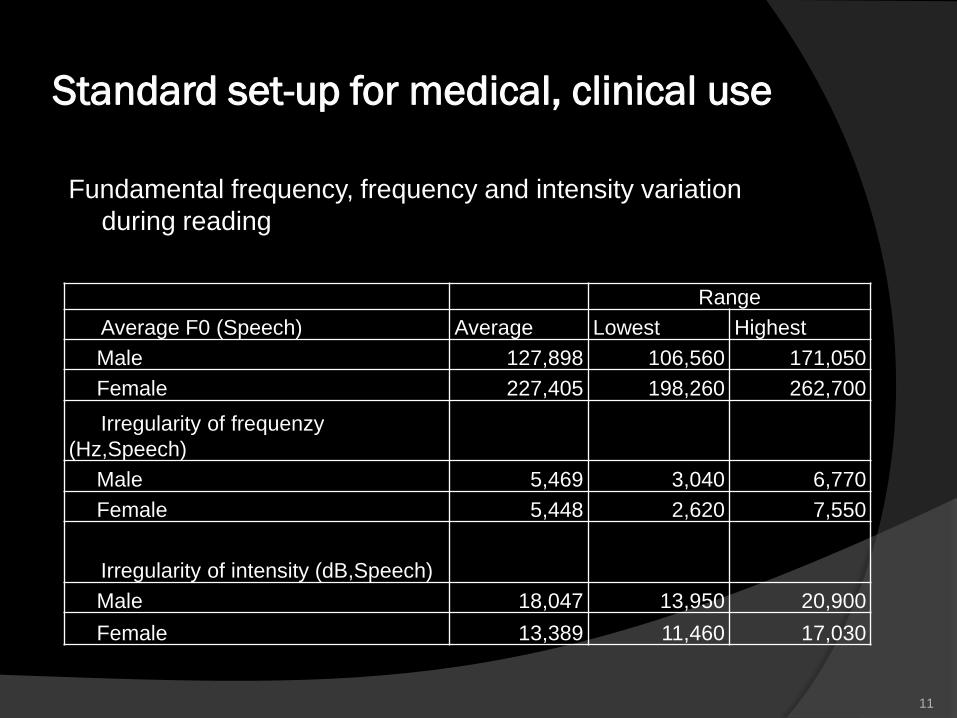
Standard set-up for medical, clinical use
Fundamental frequency, frequency and intensity variation
during reading
11
Range
Average F0 (Speech) Average Lowest Highest
Male 127,898 106,560 171,050
Female 227,405 198,260 262,700
Irregularity of frequenzy
(Hz,Speech)
Male 5,469 3,040 6,770
Female 5,448 2,620 7,550
Irregularity of intensity (dB,Speech)
Male 18,047 13,950 20,900
Female 13,389 11,460 17,030
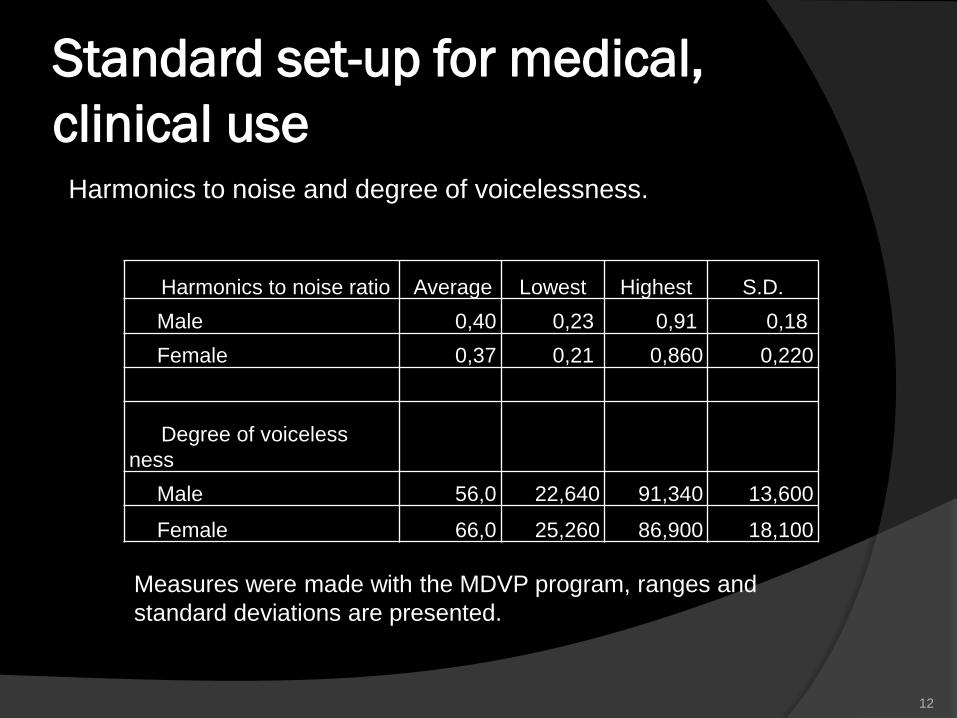
Standard set-up for medical,
clinical use Harmonics to noise and degree of voicelessness.
12
Measures were made with the MDVP program, ranges and
standard deviations are presented.
Harmonics to noise ratio Average Lowest Highest S.D.
Male 0,40 0,23 0,91 0,18
Female 0,37 0,21 0,860 0,220
Degree of voiceless
ness
Male 56,0 22,640 91,340 13,600
Female 66,0 25,260 86,900 18,100
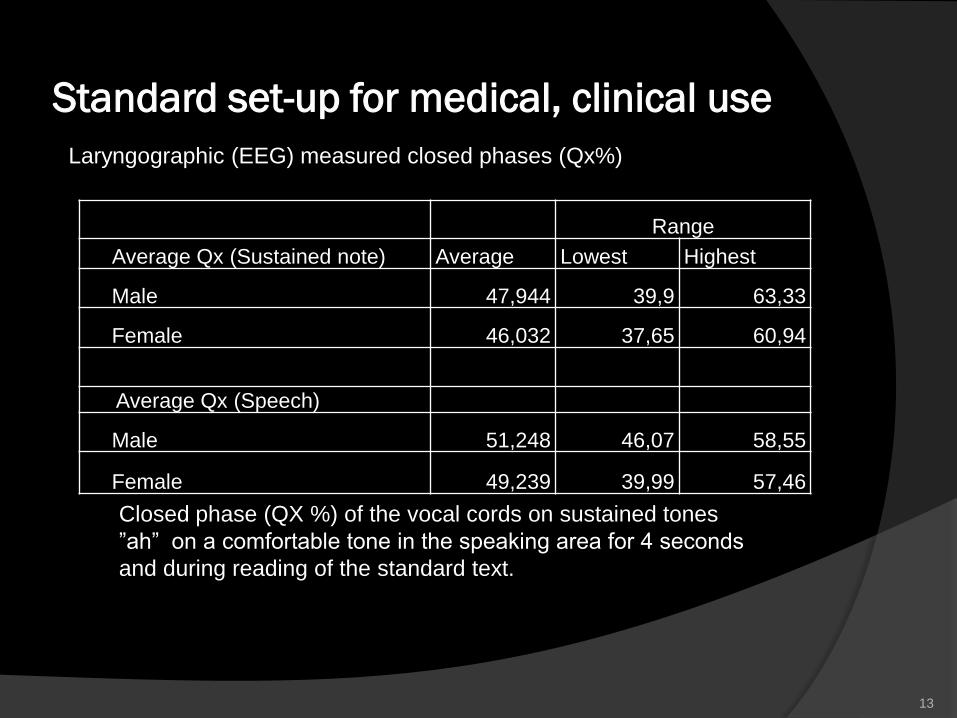
Standard set-up for medical, clinical use
Laryngographic (EEG) measured closed phases (Qx%)
13
Closed phase (QX %) of the vocal cords on sustained tones
”ah” on a comfortable tone in the speaking area for 4 seconds
and during reading of the standard text.
Range
Average Qx (Sustained note) Average Lowest Highest
Male 47,944 39,9 63,33
Female 46,032 37,65 60,94
Average Qx (Speech)
Male 51,248 46,07 58,55
Female 49,239 39,99 57,46
Standard set-up for medical, clinical use
14
No significant difference was found for fundamental frequency, frequency and intensity
variation in reading and for a sustained note for the firms Key Elemetric and
Laryngograph. The use of the term jitter and shimmer in reading of a standard text
should be replaced by frequency and intensity variation during reading, in percent.
Suggested setup for medical, clinical use
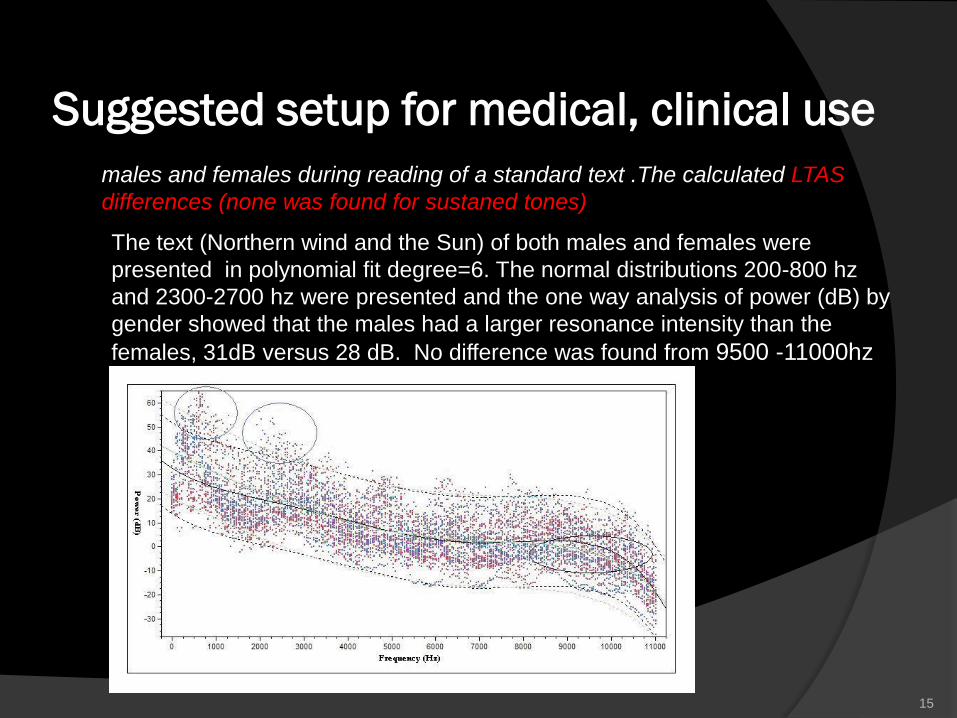
males and females during reading of a standard text .The calculated LTAS
differences (none was found for sustaned tones)
15
The text (Northern wind and the Sun) of both males and females were
presented in polynomial fit degree=6. The normal distributions 200-800 hz
and 2300-2700 hz were presented and the one way analysis of power (dB) by
gender showed that the males had a larger resonance intensity than the
females, 31dB versus 28 dB. No difference was found from 9500 -11000hz
Suggested setup for medical, clinical use
16
Lowest tone Average Lowest Highest S.D.
Male 87 73,4 98 31
Female 160 131 220 33
Highest tone
Male 716 622 880 154,8
Female 1084 1568 1245 204,3
Maximal dynamic range
Male 32 24 57 8,4
Female 37 20 41 9,01
Total area in semitones times decibels
Male 714 406 1054 202
Female 822 432 1047 214
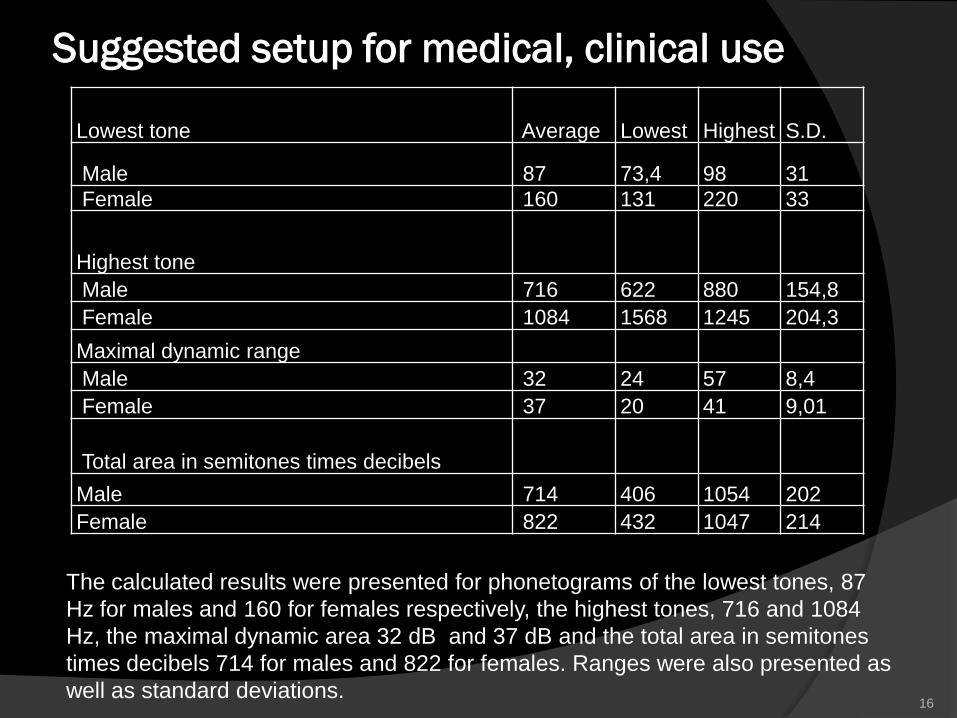
The calculated results were presented for phonetograms of the lowest tones, 87
Hz for males and 160 for females respectively, the highest tones, 716 and 1084
Hz, the maximal dynamic area 32 dB and 37 dB and the total area in semitones
times decibels 714 for males and 822 for females. Ranges were also presented as
well as standard deviations.
Suggested setup for medical, clinical use
Airflow
17
average Highest Lowest S.D
Adduction –Abduction
rate /sec
Male 8,41 11,87 5,64 1,70
Female 7,59 10,37 5,1 1,56
Target flow rate (l/sec)
Male 0,24 0,45 0,17 0,117
Female 0,17 0,21 0,08 0,05
Target SPL (dB)
Male 82,00 89,26 77,28 3,80
Female 79,43 87,12 70,86 6,36
Real air pressure
(cmH2O)
Male 8,30 12,22 5,15 2,23
Female 7,83 9,96 4,034 1,64
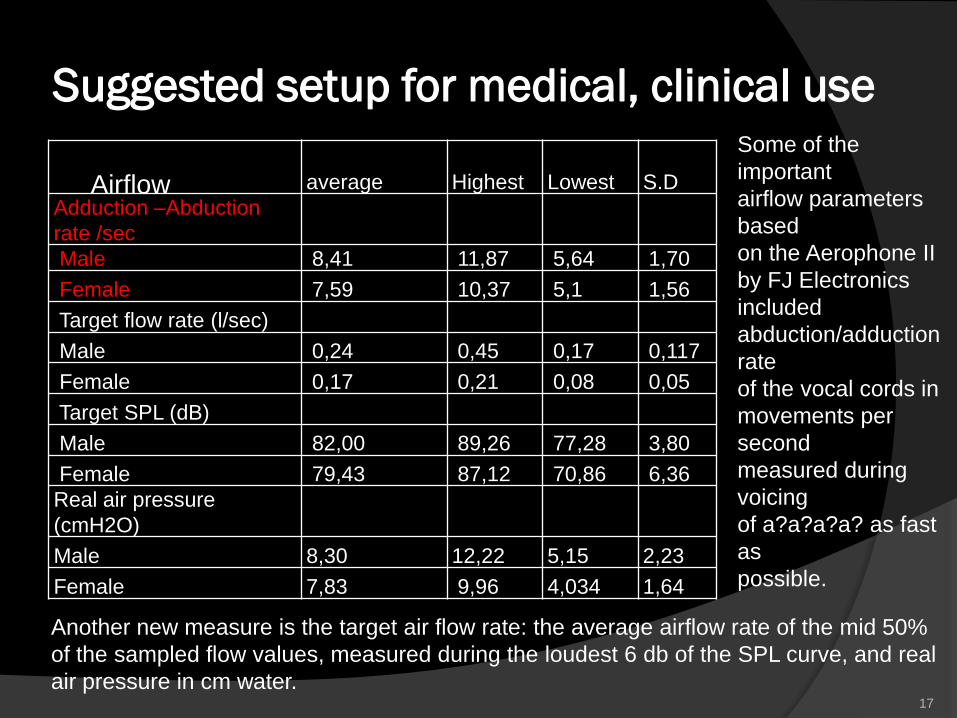
Some of the
important
airflow parameters
based
on the Aerophone II
by FJ Electronics
included
abduction/adduction
rate
of the vocal cords in
movements per
second
measured during
voicing
of a?a?a?a? as fast
as
possible.
Another new measure is the target air flow rate: the average airflow rate of the mid 50%
of the sampled flow values, measured during the loudest 6 db of the SPL curve, and real
air pressure in cm water.
Suggested setup for medical, clinical use
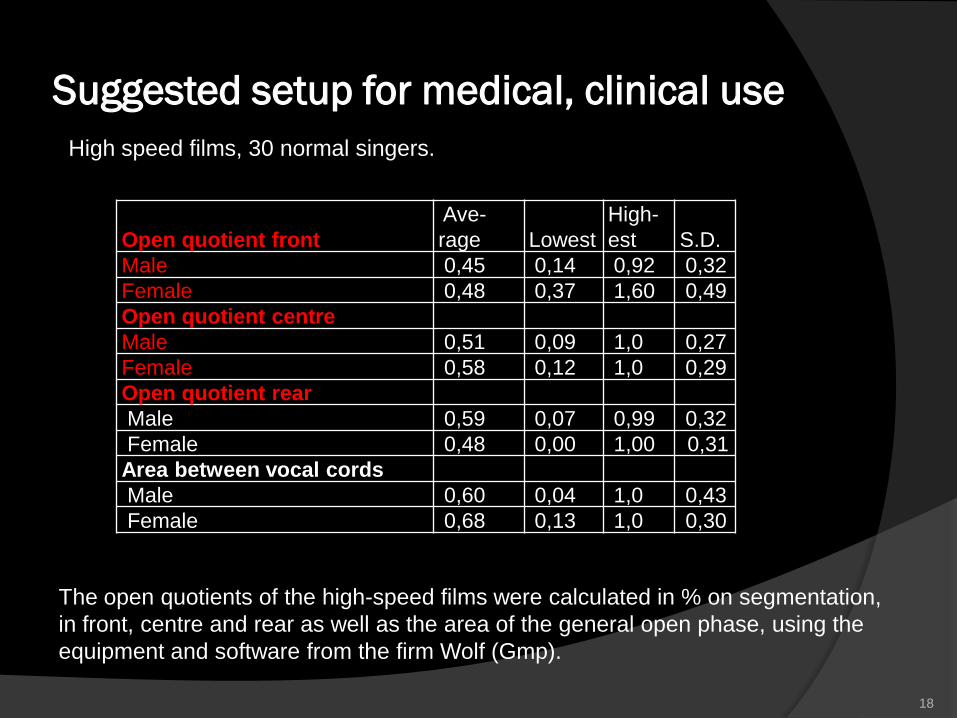
High speed films, 30 normal singers.
18
Open quotient front
Ave-
rage Lowest
High-
est S.D.
Male 0,45 0,14 0,92 0,32
Female 0,48 0,37 1,60 0,49
Open quotient centre
Male 0,51 0,09 1,0 0,27
Female 0,58 0,12 1,0 0,29
Open quotient rear
Male 0,59 0,07 0,99 0,32
Female 0,48 0,00 1,00 0,31
Area between vocal cords
Male 0,60 0,04 1,0 0,43
Female 0,68 0,13 1,0 0,30
The open quotients of the high-speed films were calculated in % on segmentation,
in front, centre and rear as well as the area of the general open phase, using the
equipment and software from the firm Wolf (Gmp).
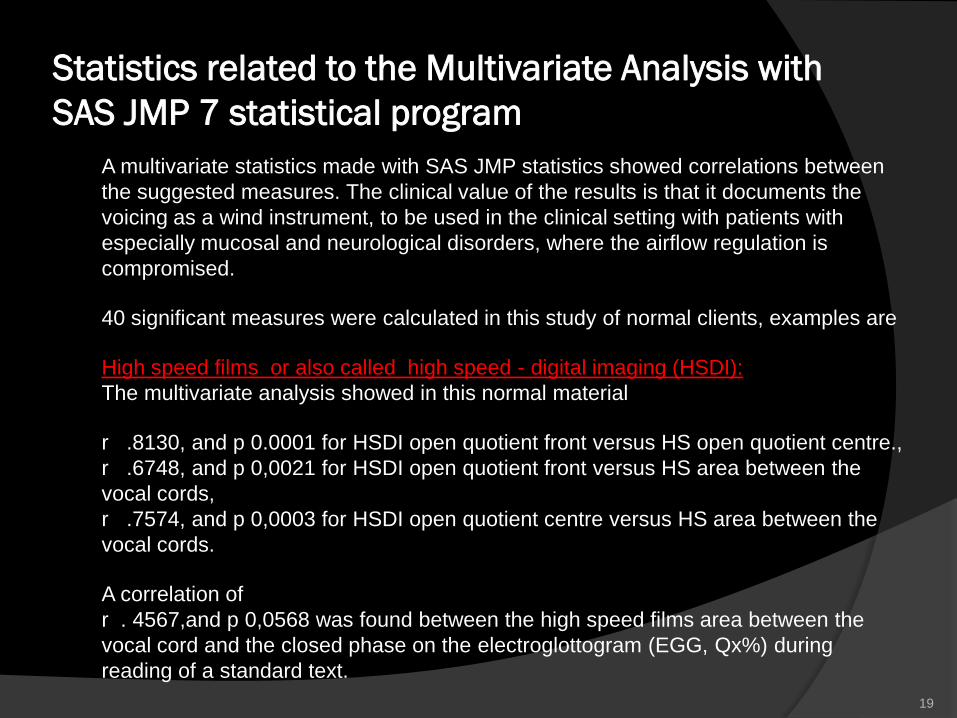
Statistics related to the Multivariate Analysis with
SAS JMP 7 statistical program
A multivariate statistics made with SAS JMP statistics showed correlations between
the suggested measures. The clinical value of the results is that it documents the
voicing as a wind instrument, to be used in the clinical setting with patients with
especially mucosal and neurological disorders, where the airflow regulation is
compromised.
40 significant measures were calculated in this study of normal clients, examples are
High speed films or also called high speed - digital imaging (HSDI):
The multivariate analysis showed in this normal material
r .8130, and p 0.0001 for HSDI open quotient front versus HS open quotient centre.,
r .6748, and p 0,0021 for HSDI open quotient front versus HS area between the
vocal cords,
r .7574, and p 0,0003 for HSDI open quotient centre versus HS area between the
vocal cords.
A correlation of
r . 4567,and p 0,0568 was found between the high speed films area between the
vocal cord and the closed phase on the electroglottogram (EGG, Qx%) during
reading of a standard text.
19
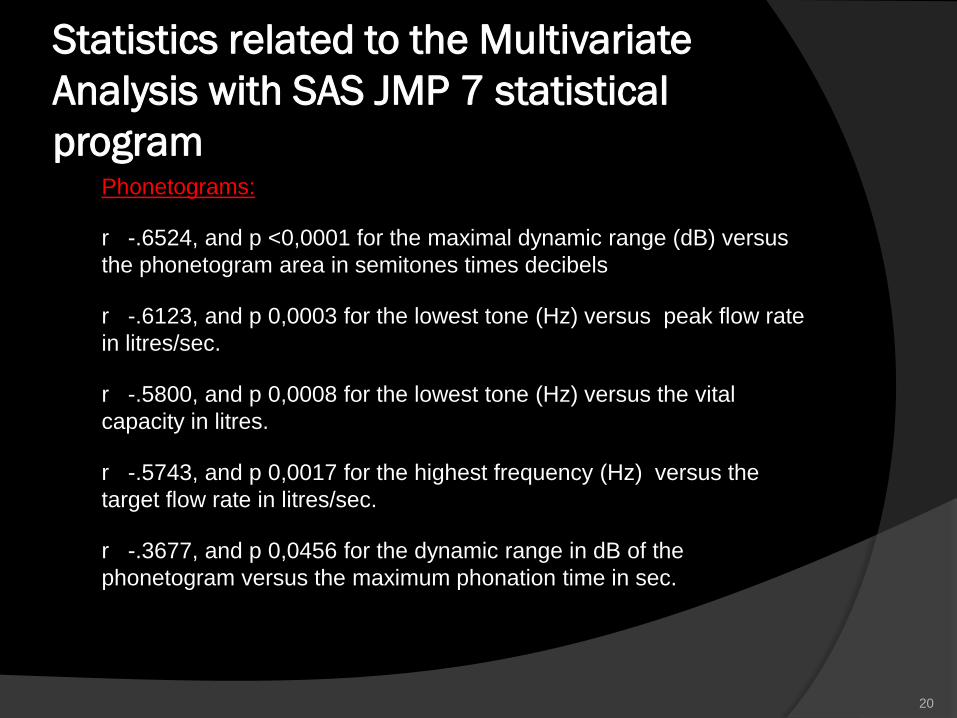
Statistics related to the Multivariate
Analysis with SAS JMP 7 statistical
program Phonetograms:
r -.6524, and p <0,0001 for the maximal dynamic range (dB) versus
the phonetogram area in semitones times decibels
r -.6123, and p 0,0003 for the lowest tone (Hz) versus peak flow rate
in litres/sec.
r -.5800, and p 0,0008 for the lowest tone (Hz) versus the vital
capacity in litres.
r -.5743, and p 0,0017 for the highest frequency (Hz) versus the
target flow rate in litres/sec.
r -.3677, and p 0,0456 for the dynamic range in dB of the
phonetogram versus the maximum phonation time in sec.
20
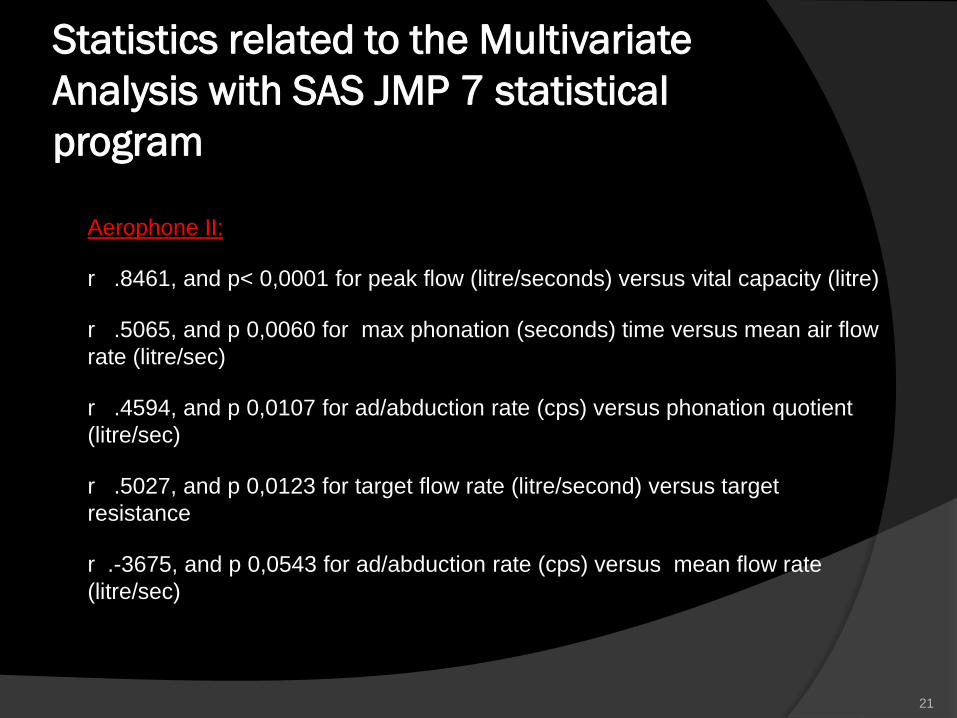
Statistics related to the Multivariate
Analysis with SAS JMP 7 statistical
program
Aerophone II:
r .8461, and p< 0,0001 for peak flow (litre/seconds) versus vital capacity (litre)
r .5065, and p 0,0060 for max phonation (seconds) time versus mean air flow
rate (litre/sec)
r .4594, and p 0,0107 for ad/abduction rate (cps) versus phonation quotient
(litre/sec)
r .5027, and p 0,0123 for target flow rate (litre/second) versus target
resistance
r .-3675, and p 0,0543 for ad/abduction rate (cps) versus mean flow rate
(litre/sec)
21
DISCUSSION
Normal materials of voice measurement for clinical laryngological use
vary with age and local language as well as with cultural language. We
have earlier measured the fundamental frequency and phonetograms
up to 18-19 years of age compared with hormonal development and
secondary gender characteristics. (Normal development of voice
Springer 2008). The same approach will be made again for the aging of
the voice. The suggested air flow measures and as well as quick and
easy high speed filming will make the results even more up-dated for
comparison with pathology - in busy ear-nose-throat clinics.
LTAS averaged from 1-11.000 Hz was made in our large materials on
sustained tone and in reading of a standard text in 12 normal males
and 18 females aged 20-40 years shows significant differences
between the genders during reading. Single plots though give no
information about the quality of the voice, usable in pathology related
e.g. to allergy, infections of the upper airways, reflux and many other
disorders, except in extreme cases. Quantitative 3D pictures of the
larynx might .
22
DISCUSSION The open quotient in high speed films is interesting.
Variations give information as a basis for quantitative diagnosis and treatment
e.g. of posterior laryngitis with edema to be quatified as seen in laryngo-
pharyngeal reflux,
The open quotient in high speed films is interesting also for development of
voice with changing registers, related to the newer popular singing techniques.
Neurological disorders, e.g. dystonia patients often have reduced open phases
and irregular patterns.
Various voice related technical speaking and singing problems are illustrated
with the closure in front, centre and rear part of the vocal cords. Our set up
combined on line with the acoustical, electroglottographical (EGG) and
kymographical signals show the clinical ear-nose-throat specialist where the
disorder is located.
We have presented statistical relations for the new measures of high speed
films, LTAS, phonetograms area and the airflow related parameters. The
high correlations in the SAS statistical program indicate that these
measurements must be used much more in the future. This is a promising cue
to further understanding of the voice as a wind instrument. 23
CONCLUSION
The medical clinical tools: high speed films were evaluated in 30
amateur singers and the (normal) results were correlated with other
parameters measured at the same time in a multivariate statistical
analysis with SAS JMP. Measures of air function show that airflow
analyses must be used much more in the future since the significant
values related to voice were high.
The aspect of air pressure measurement is a promising for clinical trials
of treatment effect of upper airway disorders. For high speed films the
quantitative measurements must be further developed. Till now, the
measures presented in the MDVP and Laryngograph set-ups including
phonetography get heavily better scientific perspectives of accuracy
with high speed films and updated airflow measures for measurement
of pathology usable for development of quantitative 3D measures.
24
Acknowledgement
Sanila Mahmood
Christina Heltoft
Anders Jønsson
25
Reference list
(1)Cochrane Library, Wiley publishing Oxford UK. http://interscience.wiley.com/
(2) Pedersen M, McGlashan J (2007). “Surgical versus non-surgical interventions for vocal cord
nodules.”.Cochrane Review Update in The Cochrane Library Oxford, Wiley publishing UK. Issue 1
(3) Hopkins C, Yousaf U, Pedersen M (2006). “Acid Reflux Treatment for Hoarseness [Review]”
January 2006 in The Cochrane Library Oxford, Wiley publishing UK. Issue 1.
(4) Pedersen M, Beranova A, Moeller S (2004). “Dysphonia: Medical treatment versus a medical voice hygiene
advice approach” European Archives of Otorhinolaryngology, Springer Verlag Germany (electronic version
2003) 261; 6:312-5.
(5) Pedersen M (2008). “Medical treatment versus a medical voice hygiene advice approach” Slideworld.org,
USA: http://www.slideworld.org/ViewSlides.aspx?URL=4884 (date last viewed 12/1/08).
(6) Pedersen M (2004). “Interactions between basic and clinical research. International Conference Voice
Physiology and Biomechanics report.” Marseille France; pages 137-143.
(7) Pedersen M, Yousaf U (2006). “Videostroboscopic expert evaluation of the larynx with running objective
voice measurement at the same time gives more secure results than videos alone” Congress report. The 5th
International Conference on Voice Physiology and Biomechanics Japan; pages 110-3.
(8) Pedersen M, Munck K (2007). “A prospective case-control study of jitter%, shimmer% and Qx%, and glottis
closure cohesion factor (Spead by Laryngograph Ltd.) and Long Time Average Spectra.” Congress report
Models and analysis of vocal emissions for biomedical applications(MAVEBA) Italy; pages 60-4.
26
Reference list (9) Pedersen M (2007). “Evidence based voice assessment. Instruction course.” European Archives of Oto-Rhino-
Laryngology and Head and Neck EUFOS, Vienna Austria ; 264: Supplement S10 HIC 21.
(10). Pedersen M (2007). “Coughing and voice disorders in rhinitis and asthma the role of allergy and medication.” XIIth Congress of the International Rhinological Society, Venice Italy 2007 Roundtable. (By invitation)
(11) Pedersen M (1997). “Biological development and the normal voice in puberty.” Thesis. University of Oulu Finland and Gentofte University Hospital, (director prof. M.Tos) ENT Dpt, Denmark. Book (2008): The normal development of voice in childhood, Springer, Germany.
(12) Loschceller J, Voigt D, Döllinger M, Eysholdt U (2008). ”Phonovibrograms: Fingerprints of vocal fold vibrations.” Second COST action 2103 Workshop, abstract book: Advanced voice function assessment. Aachen, Germany.
(13) Loebach JL, Bent T (2008). “Multiple routes to the perceptual learning of speech.” J. Acoust. Soc. Am. 124: 552-561.
(14) Watson PJ, Munson B (2008). “Parkinson´s disease and the effect of lexical factors on vowel articulation.” J. Acoust..Soc. Am. 124: EL 291-295.
(15) Ohala JJ. (1974). “A mathematical model of speech aerodynamics.” Speech Seminar Stockholm Sweden. Aug.1-3.
(16) Mihaescu M, Khosla S, Gutmark E. (2008). “Unsteady laryngeal airflow simulations: An analysis of the generated intraglottal vertical structures.” J. Acoust.. Soc. Am 124: 2579-80.
(17) Izdebski I, (2011) “Clinical Voice Assessment: The role & value of the phonatory function studies” In Current Diagnosis and Treatment. Otolaryngology Head and Neck Surgery. Third edition. Ed. Lalwani AK, publisher: Mc Graw Hill Medical: 135-448
27