Embed Size (px)
Citation preview

/,,.
SERIAL NO. SSC-30
FINAL REPORT
(Proiect SR-96)
on
CORRELATION OF LABORATORY TESTS WITH
FULL SCALE SHIP PLATE FRACTURE TESTS
by
E, P. Klier
UNIVERSITY OF MARYLAND
and
M. Gensamer
COLUMBIA UNIVERSITY
Tmnwni+ ted through
NATIONAL RESEARCH COUNCIL8S
COMMITTEE ON SHIP STEEL
Advisory to
SHIP STRUCTURECOMMITTEE
Di,k;m of EngkmerkIQ and Industrial Re,mrch
National !+cedsmy of Sciences Nefionel Research Council
Washing!.., D. C.
January 30, 1953

SHIP STRUCTURE COMMITTEE
MEMBER AGENCIES:
B“.,.+” 0$= SHIPS, DEPT. 0, N,””
M,.,,.., SEA T. AN9P0. TATION SZ.VICL DrPT. 0. NAVY
U.,,,. s,,,,, c.,,, G.,.., T.,,, ”.” D, PT.
M,.,,,.. AD M$N8WRAT (ON, D.,,. OF CO... *C=
ADDRESS CORRESPONDENCE TD:
sccF!c7 An”
5“1, S’IFWCT” RE coMM!rr. E
u. s. COAST a.... HE . . . . . . . . . .
w,.”,..,.. 2s. D. C.
A“..,... BUREAU OF SHt,P#N.
January30,1953
Dear Sir:
As partof itsresearchprogramrelatedto theimprovementof hullstructuresof sr,ips,theShip5HxuctureCommitteehassponsoredan investigationon the“Correlationof IAoratoryTestswithFull-ScaleShipPlateFractureTestsr!at PennsylvaniaStateCollege.Herewithis a copyof theFinalReport,LXX-3O, of theinvestigation,entitledIICorrelation~f ~boratoryTestswithFull-ScaleShiPplateFractureTestsl!,by E. P. KlierandM. Gensamer.
Theprojecthasbeenconductedwiththeadvisoryassistanceof theConmitteeon ShipSteelof theNationalAcademyof Sciences-NationalResearchCouncil.
Anyquestions,comments,criticismor othermatterspertainingto theReportshouldbe addressedto the Secretary,ShipStructureCommittee.
ThisReportis beingdistributedto thoseindividualsandagenciesassociatedwithandinterestedin theworkof theShipStructureCommittee.
Yours sincerely,
~~$j%fa-(. .RearAdmiral,U. S. CoastGuardChairman,ShipStructureCommittee

FINAL REPORT(project sR-96)
on
CORRELATION OF LABORATORY TESTS WITH
FULL SCALE SHIP PLATE FRACTURE TESTS
by
E. P. KlierUniversity of Maryland
and
M. GensamerColumbia University
under
Department of the NavyBureau of Ships
Contract NObs-31217with the
Pennsylvania State College
EuShips Project NS-011-042
for
~ STRUCTURE COMMITTEII

j!ABLEOF CONTENTSPage
Introduction .........................................1
Materials Research Program ........................... 1
DavidW. Taylor Model Basin ..................2
The University of California, ProjectSR-92 . . . . . . . . . . . . . . . . . .........2
The University of Illinois, ProjectSR-93 .,........................ 2
The New York Na$:04hipyard, Project......................... 2
Swarthmore College, Project SR-98 ...... ..... 2
The Pennsylvania State College, ProjectSR-96 .......................... 2
University of California, Project SR-92 . . . . . . 3
David W. Taylor Model Basin, ProjectSR-105 ....................... . 3
New York NavalS~:;bYard, Project.,..,...... . ......... 3
Ductile-Brittle Transition Phenomena ................. 3
Uniaxial Stress-Loading - The TensileTest ...........................4
Biaxial Stress Loading ....................... ‘7
Triexial Stress ..............................10
Criteria of the Ductile-BrittleTransition .....................11
Bend Specimen ................................12
Tension Tear Specimens ...,...................12
Notched Tension Specimens ............ ... ...12

TABLE OF CONTENTS (Centinued)
Page
Metallurgical Structure and the 12uctile-Brittle Transition ............,12
Fatigue and The Ductile-Brittle Transition ..,,13
velocity of Loading and the Ductile-Brittle Transition .............lk
Size Effect and the Ductile-BrittleTransition .....................15
The Testing Program ...................................16
Experimental Results ..................................2o
Project Steels
The Ductile-Brittle Transition -Project Steels .................21
Tensile S~rength and Size Effect -Project Steels .................24
Additional Tests
Fractured Liberty Snip Plate Tests ............26
Tests of Other Steels .........................28
The Studies of Kahn and Imbembo ...............29
Discussion ........... .........,.,.,..........,....,..,32
The Ductile-Brittle Transition . . . . . . . . . . . . . ...33
Loading Condition in Structures ........ ,.....36
Ship Steel Selection ..!...,...................38
Acknowledgments .......................................4o
Bibliography ............,....,........................41

LIST @ TABLES
A.
B.
c.
D.
E,
F.
G.
H.
I.
J.
Chemical Analyses of the bteels.
Summary of Test Results - 20-in. Diameter ‘Eubes.
Transition Temperatures of Project Steels as Determinedby Various Notched Tests.
Chemical Analysis in ~ of Specimens From P$&UUI S. DUPONTand PONAGANSET (1-in. Wide Full-Thickness Specimens).
Meche.nicalProperties of Steel from PIERRE S. DUPbNT andPONAGANSET (l-in. Wide Full-Thickness.Specimens).
Transition Temperature in OF of Steels as Determined byVarious Tests.
Properties and Composition of High Yield Strength StructuralSteels Used in the Investigation .
Approximate Transition Temperatures of High Yield StrengthStructural Steels Determined by Means of Different Specimens.
Composition, Tensile and Tear-Test Properties of ship PlateSteels, bdium, Semiskilled,48-S-5, Normal Manganese (Mn/C~)and Medium Semi-killed ABS-B Manganese 0.60-0.90 (Mn/C <3)
Composition, Tensile and Tear Test Properties of Ship PlateSteels, Medium, Rimmed? Medium Rimmed and Fully Killed andHigh-tensile Vanity-type 48-s-5.

LIST OF FIGURES
1.
2*
3*
4.
5.
6,
7.
8.
9.
10.
11.
12.
13.
14.
15.
16,
17.
The transitions in energy absorption and fracture appearancein the Charpy keyhole impact specimen. Steel Dr.
The per cent reduction in area versus temperature of testingSteel E.
Effect of temperature on tensile properties of Steel “C” inthe ‘Iasrolledlicondition.
Hypothetical flow and fracture curves depicting conditionsleading to ductility and fracture transitions.
The strain hardening exponent ~) versus temperature forSteel E and Steel H.
Spherical
Variation
Slow bend
test specimen.
of nominal biaxial properties with temperature.
test results.
Torsion specimen.
Distribution of elastic stress at the base of the notch ina notch-bend test bar.
Charpy keyhole notch specimen.
Charpy V-notch specimens.
The change in transition temperature versus notch root radius-Charpy V-notch specimens.
Diagram showing types of transition curves obtained onnotched specimens.
Influence of normalizing on Lehigh Bend Test transition asindicated by fracture appearance. Silicon-killed steel,0.25%C9 0.66?%In,0.19~Si.
Influence of pre-strain on the transition temperature ofnotched and un-notched mild steel impact specimens.
Effect of fatigue on notched impact strength.

LIST OF FIGURES (Continued)
18.
19.
20.
21,
22,
23.
24.
25.
26.
27.
28.
29.
30.
31.
32.
33.
34.
35.
The transition temperature versus impactinp velocity forselecting project steels in tension impact. Adapted fromBruckner and Newmark, (24).
A suggested extrapolation of the curves of Figure 18.
Suggested variation of transition temperature in theCharpy v-notch impact test with impacting velocity. Thetwo experimental points were determined respectively inslow bending and impact bending.
Influence of specimen width on absorbed energy at constanttemperature.
Form of Taylor Model Basin tensile test specimens.
Details of slot - Taylrm Model Basin specimen.
Effect of ratio of length of slot to width of plate onenergy absorbed. Results are for Steel E specimensnotched with a jewelerfs saw.
Effect of temperature on energy absorbed for specimensof Steel E.
%:t~.h of wide plate specimens and type of stress-raiser.
72-inch specimen in 3,000,000-lb. testing machine.
Specimen cooling mechanism.
Revised design of the full scale hatch corner model.
Hatck corner tests. Specimen 4: Overall view from above.
Hatch corner tests. Specimen 4: Overall view from below.
Sections or apparatus for tests of 20” diameter tubes atlow temperatures.
Restrained welded specimen used for tests of high yieldstrength structural steels.
Restrained welded specimen in testing machine showingpuLling tabs andxnmganin wire extensometer.
Laboratory test specimens employed for correlation with largeplate test results.

QS~ OF FIGURIS (Continued)
36.
37.
38.
39.
40.
Keyhole Motch Summary - Project Steels
V-Notch Summary - Project Steels
Energy absorption, fracture appearance and lateral con-traction vs. testing temperature for v-notch milled andv-notch pressed (both Schnadt modification) charpy impactspecimens. Mild steel.
Charpy v-notch impact transition temperature in OF at 25and 50$ maximum energy absorption for specimens prestrainedin compression.
Charpy keyhole tests of Steel N following different heattreatments.
41-45. The influence of plate thickness and variations fromplate of constant thickness on notched bar test results,all steel from one heat. Project Steel Cc
46. Steel Br - Summary 01’test data
47. Steel C.
48, Steel A.
49. Steel Bn.
50. Steel Dr.
51. Steel Dn.
52. Steel E.
53. Steel H.
54. Steel N.
55. Wide Plate Test Results.
56. Hatch Corner Tests. Maximum noninal stress and energyabsorption (all tests at 700F.)
57* PIERRE S. DUPONT - Plan view of the upper deck showing theplate removed for testing and the adjacent crack..

58● PIERFUZS. DUPONT - Sample from deck plate C-10 showinglocation of test specimens.
59● PONAG.4NSET- Elevation of the starboard side-shell show-ing the location of test specimens in the topside strake.
60. PONAGANSET - Plan view of main deck showing the locationof test specimens.
61. Twelve-inch wide specimens. Results of tests of samplesremoved from fractured ships. 3/4 or 13/16-inch thickplate.
62-a. Eilergyto maximum load vs. temperature relation for re-strained welded specimens of high yield strength structuralsteels, results of tests of specimens made from mild steelwith E-6o2o electrode are shown for comparison.
62-b. Energy to failure VS. temperature relation for restrained
63.
64.
65.
66.
67.
68.
69.
70.
welde~-specimens of high yield strength structural steels.‘esults of tests of specimens made from mild steel withE-6o2o electrode are shown for comparison,
Transition temperatures for H. Y. S. S. Steels amd mildsteel B as determined by 12!!centrally notched specimens.
Tear-test transition temperatures of medium and high-tensileship plate steels, 1/2 and 5/8-inch thicknesses.
Tear-test transition temperatwes of medium and high-tensileship plate steels, 7/8, 1, 1-1/4 and 1-1/2 inch thicknesses.
Tear-test transition temperatures of medium and high-tensileship plate steels, 1/2, 5/8, 3/47 7/8, and l-1/b-inchthicknesses.
Tear-test transition temperatures of medium ship plate steels1/2, 5/8, 3/4, 1 and l-1/2-inch thicknesses, as rolled con-dition.
Tear-test transition temperatures of medium steel shipplate~ 3/k-inch thickness.
Stresses in upper deck of liberty ship.
Twelve inch wide flat plate tests.

The role of materials
If such materials were
problem would cease to
evaluation of weldable
vessel construction, a
not
INTRODUCTION
in the ship fracture problem is obvious.
susceptible to brittle failure, the
exist. With the objective of a final
steels as to their suitability for merchant
wide experimental program was Initiated by
the Board of Investigation to Inquire into the Design and Methods
of Construction of Welded Steel Merchant Vessels~l)* and continued
by the Ship Structure Commlttee(2~3). It was the objective of the
research program conducted at the Pennsylvania State College under
Bureau of Ships Contract NObs-31217 to correlate the work conducted
for the Board and the Ship Structure Committee. This final repcrt
attempts, therefore, tk correlation of the results of the entire
llmaterialllresearch program as conducted between 1944
mately the end of 1950. This program, in abbreviated
given below.
~TERIALS RESEARCH PROGRAM
and approxl-
outline, is
The specifications for the Liberty ship called for a medium
steel. Such steel can be furnished in rimming, semi-killed, and
fully killed grades. In order to supply a series of steels which
would have appreciably different fracture characteristics in the
projected tests, the steels listed in Table A were supplied by
different mills. These steels have been generally designated as
*For numbers in parenthesis see Bibliography

-2-
‘Iproject“ steels. These steels were studied extensively under the
cooperative research programs conducted at the University of Califor-
nia, the David W. Taylor Model Basin, the University of Illinois$
the New York Naval Shipyard, the Pennsylvania State College, and
Swarthmore College.
The research programs conducted at the respective laboratories
were designated as follows:
David W. Tavlor Mode~_: (a) Flat plate tests.
~ University ~ Califthmia, Project SR-92: (a) Flat plate
tests, (b) large tube tests, (c) similitude tests, (d)
bend tests, (e) full-scale hatch corner tests.
~Universit~ Q IlllnOIS, Pro.iectSR-91: (a) Flat plate
tests, (b) impact tests.
‘lQ2NQMXQZklJAQ.s~ 31ZQb2QQ&42!t: (a) Standard
Impact tests, (b) Navy tear tests.
Swarthmore Collece, Project SR-98: (a) 12-inch plate tests,
(b) aspect ratio tests.
~ ~ennsylvania _ Colleeep project -$ (a) Impact
tests, (b) slow bend tests, (c) edge-notched bar tension
test, (d) low-temperature tension tests, (e) strain-gradient
measurements.
In addition to the above tests conducted all or in part on
the project steels, tests were run on certain additional mild and
high strength steels. The augmented testing program Included the

-3-
indicated tests run at the following laboratories:
of California, ~=: (a) Restrained
welded specimen tests on high strength steels, (b) edge-
notched bar tension tests (c) 12-inch plate tests.
David W. Tavlor Model ksin, Project SR-10~; (a) 12-inch
plate tests on mild steels taken from fractured Liberty
ships, (b) edge-notched i.artension tests.
New York Naval ShiDyard, Project SR-104: (a) Tear tests
on selected mild and high strength steels.
The results of the tests conducted on the above program will
be discussed at length in the following, but before these data
are examined it may prove profitable to consider certain generali-
zations which may be made with reference to the ductile-brittle
transition and which must be considered in the ultimate evaluation
of the ship fracture problem.
DUCTILE-BRITTLE TRANSITION PHbNOMEN~— —
The ductile-brittle transition as it is encountered in mild
steel, has in the past generally been associated with the impact
test. In the impact test it is customary to give the results in
terms of the work required to break a specified test bar. This
work to failure has been found to vary with temperature for a
(4)suitable test specimen as in Figure 1 . Thus at relatively high
temperature much work is required to fracture the specimen, while
at relatively lower temperature little work is required to fracture

-4-
the specimen. The F.ightemperature condition
or tough condition, wi>ilethe low temperature
is known as the ductile
condition is known
as the brittle condition, with the intermediate range being desig-
nated as the transitional range, or the ductile-brittle transition.
Of the many factors which mcdify the ductile-brittle transi.
tion in mild steel, unquestionably the most important is the stress
system. It is not possible considering present knowledge to discuss
fully the phenomena associated with the ductile-brittle transition,
as the stress system is arbitrarily varied; but certain reasombly
integrated data are now available for consideration on this point.
In the sections immediately below, the behavior of steels tested
under certain uniaxial, biaxial, and triaxial stress systems~ will
be considered.
Following this.the criteria of the ductile-brittle transition
will be noted, and generalizations
ture, fatigue, velocity of loading
will be introduced.
concerning metallurgical struc-
and size effect, as pertd.nent,
Yniaxial Stress Loading -- The Tensile Test\ If a mild steel
is tested in tension in an appropriate temperature range, a trans&-
tion to brittle behavior will be observed as is indicated in Figure
2. This transitional behavior is comparable to that observed in
the impact test on notched bars, but the test bar used here is a
standard test bar and does not contain an artificial notch. Thus
it =Y be concluded that an external notch is not required to induce
* The terms “uniaxial, biaxial, and triaxial” are somewhat loOSelYapplied and at best apply with good approximation only during theinitial steps of loading.

-5-
brlttleness in such steels, and tk,ebrittleness observed must be
considered an intrinsic property of these materials tested in tension.
In the further analysis of ~ensile test data, it is informa-
tive to compare the yield strengths and the fracture strengths as
is done in Figure 3. It is evident that the transition from ductile
to brittle behavior takes place at a temperature at which the yield
and fracture strengths are in near coincidence. This does not per
se preclude ductile behavior, but this phenomenon has been used
explaining brittle behavior. Thusv Le Chatelier(5) has argued that
the coincidence of the yield and fracture strengths would serve to
localize plastic distortion with a consequent reduction in energy
absorption. On the other hand, Ludwik(6), in a consideration of
comparable data, has proposed that two strength factors exist,
mmely, flow and fracture strengths, and, in general, the flow
strength is less than the fracture strength. When the flow strength
atkains a value equal to that of the fracture strength, failure
ensues. In both of these analysea of the ductile-brittle transition,
the nature of the fracture process is not explained. There is no
differentiation, therefore, of two classes of fracture phenomena
as indicated by the terms shear (fibrous) and normal (CbEaWigf3) type
failures. This latter differentiation should be made, as from a
practical point of view it may be important.
The introduction of the concepts of two fracture types on the
fracture, flow-strength, temperature diagram was first undertaken

-6-
by Davidenkov(7) and has subsequently been variously modified as
for example in Figure 4(8). This type of diagram is phenomeno-
logical in character ariddoes not aid in a basic understanding of
the fracture process. It is, however, an informative construction
and because of this has proven to be of considerable value.
It is Interesting to consider the change in fracture appearance
as a means of differentiating ductile from b~ittle failure. Fracture
type data are plotted in Figure 1 for comparison with the energy
absorption data, and it is seen that the.two transitional phenomena
do not agree. This is a point well worth emphasizing, for as will
become evident below, the non-agreement in the transitions In energy
absorption and fracture appearance is the rule for small specimens
and it i.sonly for very limited conditions that agreement in these
two transitions is achieved.
The treatment of tensile test data by the method of Ludwlk,
while initially holding promise for a solution of the problems
associated with the intrusion of brittleness in mild steels under
certain conditions of testing and use, have under further inspection
proved to be unsatisfactory. This does not mean, however, that
tensile test data may not ultimately prove of much importance in
the analysis of the fracture behavior of steels.
Thus, it may be that the fracture characteristics of a steel
ar9 intimately connected with the ability of that steel tp pro-
pagate strain(9). The propagation of strain is envisaged as

depending on two quantities,
a velocity coefficient which
These two quantities are not
-7-
namely, a work hardening exponent and
is similar to a viscosity coefficient.
easy to separate and cannot be
separated in the standard tensile test. By testing at a series
of temperatures in the vicinity of that of liquid air, however,
it can be shown that the strain hardening exponent~ defined by
the equat5.on~=@#, varies with the temperature.*
Extreme values for the project steels studied are presented
in Figure ~. These data at present cannot be used directly to
predict the fracture characteristics of mild steel, but it is
significant that the steel showing tkmini!mnn value of~at low
temperature has the highest transition temperature In the notched
bar tests.
9Q.ZLQL &i.WiS&SKQaUi: Three sets of data will be considered
here comprising the results of sphere(10), tube(ll), and torsion
tests(12). For the sphere, to a close approximation, the stress
system is balanced biaxial tension; for the Cubes it is biaxial
tension with a variable ratio of the principal stresses; for the
torsion test, the principal stresses are a tensile stress and an
equal compression stress.
The spherical test specimen diagrmmmed in Figure 6 was made
of a steel comparable to Project Steel A. The fracture charac-
teristics of this specimen were studied at numerous temperatures,
*71here is a complex quantity comprising both a strain hardeningexponent%Oand a velocity coefficient
%. These two quantities
cannot be separated by ~ana of the da a collected here.

-8-
with the pertinent data being summarized in Figure 7. It is evident
from this figure that for the temperature range covered there i.S
indicated no transition in ductility, despite the fact that by
fracture appearance this transition was observed at about 60°F.
It should be noted that the presence of a flaw in the sphere (as
perhaps arising from a faulty weld) was a positive embrittling
factor.
For purposes of comparison, slow-bend test data for this steel
are described in Figure 8, wherein it is revealed that the transi-
tion as indicated by fracture appearance for the two tests is in
good agreement. This perhaps sug~ests that failure of the spheres
took place only after the development of effective notches in the
course of straining, wj.ththese notches bringing about failure.
The tube specimen which was tested in biaxial tension is
shown in Figure 32. The test data are summarized in Table 3(11).
The temperatures of testing of the tubes are so far apart that
it is not possible to state transition ranges, but the transition
in fracture appearance lies at about 700F., while the transition
in ductility presumably lies at a somewhat lower temperature(11).
It is interesting to note, however, that for these tubes either
welds or structural defects were primarily responsible for failure,
and therefore these tube specimens in the main may be considered as
having failed prematurely. In other words failure of the tubes was
Initiated by some localized stress raiser and only indirectly by the
principal biaxial stress system.

The sphere and tube tests were conducted on specimens which
may be considered as large compared to standard laboratory test
specimens. Despite the size o! the speci@ens, high ductilitY was
observable, particularly in the sphere tests, and presumably in-
dicated in the tube tests in the absence of crack initiators and
at temperatures which must be considered as low for the steel being
used. On the other hand, for both the sphere and tube tests the
transition in fracture appearance occurred at relatively high
temperatures, and these temperatures are sensibly those predicted
by small scale notched specimen tests.
In comparison with the sphere and tube tests, the torsion
tests conducted by Larson(12) may be considered as small scale
tests, and the element of size effect enters in the consideration
of transition phenomena. The test bar used by Larson is indicated
in Figure 9 and was made from steels C and E. The test data re-
ported are not sufficient to describe fully the transition phenomena,
but the transition in energy absorption definitely lies below
-190°C. while the transition in fracture appearance definitely lies
above -190°C, but below -700F. It will be noted that for these steels
the tranaitionin ductility in the tension test lies above -190%.
The above results may be summarized briefly by stating that the
loading of a specimen in biaxial tension will not in general lead
to brittle failure unless the temperature is excessively low. In
a specimen plastic flow is initiated which ultimately leads to the

-1o-
development of an effective notch. Once this condition is reached
for a large specimen, failure may result by the cleavage mechanism,
if the temperature of the specimen is at or below the transition
temperature indicated by a notched specimen such as, for example,
the slow bend test specimen.
From the torsion test data it may be emphasized that the
cleavage fracture and the temperature range in which it is found
for a given steel is by no means relatable to a basic reference
temperature which has a simple physical significance. Presumably
in the compression test these steels would have no ductile-brittle
transition.
Triaxial Stress ~oadin~~ Perhaps the simplest way in which
a triaxial stress system can be developed is by the introduction
of a notch in a bend test member. In general the more acute the
notch, the more marked is the triaxiality of the resultant stress
system, but for an edge-notched bend bar this stress system has in
general the characteristics indicated in Figure 10(13)0 This stress
system is complex and cannot be used directly to interpret notch-
bend-bar test results, but it has been observed that, in general,
the more acute is the notch in the test bar, the higher is the
temperature at which the transition from ductile to brittle behavior
occurs, Figures 11 and 12(14’.
It will be noted, however, that again as before there may be
disagreementin the transition temperatures revealed by energy

-u-
absorption and fracture appearance,
specimen, however, it is indicated,
cf. Figure 11. For the V-notch
cf. Figure 12, that under cer-
tain conditions of testing full agreeuent in the two
ductile-brittle transition does obtain.
The test data which are reviewed in this report
criteria of
will have been
largely obtained for notched specimens; therefore, specimens in
which triaxial stress systems obtain. The magnitude of these stress
systems will be largely unknown, and for this reason it may appear
surprising that correlation of a consistent nature is at all possible
In anticipation of this objection, it is noted that both on theore-
tical and experimental grounds, there are indications that the
triaxiality of the stress system arising from notch action has a
limiting value(15j16). Th~ theoretical aspect of this problem has
been thoroughly discussed by Neuber(13), while the results of Zeno
and LOW(17) and Bagsar(la) support the theoretical argummt. Thus
both Zeno and Low, and Bagsar studied the effect of notch acuity
on the temperature of the ductile-brittle transition and found that
it could be elevated to only a limited extent by increasing notch
acuity. Bagsarls data are reproduced in Figure 13.
Criteria of th~ Ductile-Brittle Transitio~: In the above dis-
cussion two criteria of the ductile-brittle transtion have been ex-
amined. Numerous other criteria of this transition have been used
but seemingly all are more or less intimately associated with either
the transition in energy absorption or the transition in fracture

-12-
appearance. These criteria have been examined by Stout and McGeady
for bend specimens and for the Navy tear test(19). The criteria
for determining the ductile-brittle transition may be summarized
as follows:
~ SDecimeq~ fracture appearance~ lateral contraction, bend
angle, energy absorption to failure, maximum nominal load;
Tension ~ S~ecimens: fracture appearance, Iate@l contrac-
tion, energy absorbed to initiate crack, energy absorbed to propagate
crack, nominal tensile strength, nominal yield strength;
Notched Tension Snecimens: fracture appearance, lateral con-
traction, elongation, energy absorbed to failure, ene~gy absorbed
to maximum load, and nominal tensile strength.
Of the above criteria, the most easily interpreted are energy
absorption and fracture appearance. That certain of the other
criteria may on occasion be misleading is indicated by consideration
of the idealized diagram, Figure 14, taken from Osborn, & ~. (20) .
The significance of these criteria has been discussed by Vanderbeck
ai~dGensamer(8).
~etal~ Structure @ the Ductile-Brittl~ Transition:
The steels which are of interest in the construction of merchant
vessels must be of welding grades, and, therefore, steels which can
undergo only limited metallurgical structural changes. In general,
modifications of metallurgical structure which are possibly beyond
the as-rolled structure result from normalizing or cold straining
operations, the latter of which usually leads to strain agihg.

-13-
Normalizing, when it clearly brinrs about a reduction in ferrite
grain size, may profoundly lower
but when normalizing is effected
grain size, this lowering of the
fully realized. As indicated by
the ductile-brittle transition(21)
without appreciable change in
transition temperature may not be
Lehigh Slow Bend test data, Figure
15, the optimum lowering of the transition
a normalizing temperature of about 165o%.
tures appreciably above and below 16500F.,
be efficacious.
temperature obtains for
At normalizing tempera-
this treatment may not
Cold straining, in general, is considered as undesirable and
leads to an elevation of the ductile-brittle transition as revealed
by,standard impact test data, but that the effects of cold straining
may be complex is indicated in Figure 16(22), For the notched im-
pact bars the transition temperature was found to rise regularly
with increasing strain. For the u.nnotchedimpact bars, however,
the transition temperature passed through a maximum at about 10$
elongation.
Fatigue and The Ductile-Brittle Transition: Pertinent data.—
on the effects of fatigue on the ductile-brittle transition are
summarized in Figure 17(23). It is clearly evident from this figure
that as fatigue damage increases, the ductile-brittle temperature
is adversely modified and is elevated by about the same order of
magnitude as results from strain-aging.

-14-
Velocity ~ Loading and the Ductile-Brittle Transition: The——
stress conditions in notched specimens are frequently complex beyond
the powers of convenient mathematical analysis. For this reason
alone loading effects cannot be considered in terms of true strain
rates. However, it is known that for a given specimen the rate of
loading may alter appreciably the temperature of,the ductile-brittle
transition. The manner in which this alteration is brought about
is not at present clear and the lin!iteddata available are in some
measure ambiguous. This is illustrated by a consideration of Figure~8(2k)
Here are plotted transitions in energy absorption and frac-
ture appearance for several of the project steels tested in tension
impact at several Impacting velocities.* ●
It will be noted that the curvatures of the respective lines
for energy absorption and fracture a~pearance are inverted and
in this sense are inconsistent. That the curvature of the fracture
appearance lines are the more nearly correct may be surmised from
an attempted extrapolation of the energy absorption curves to higher
impacting velocities. If this is done consistent with the data
$iven in Figure 18, first steel A and ultimately steels Dr and Dn
will be evaluated as of less merit than either steel C or steel E.
Since this conclusion does not seem warranted, on the basis of
other test data obtained on these steels, it is surmised that the
energy absorption curve un?ergoes a change of curvature perhaps
as indicated in Figure 19. The shape of the transition temperature-
velocity curve may be attributed to the experimental testing
*These velocities are converted from energy values and are consideredas approximate only.

-15-
condltions and probably is not of fundamental importance. It iS
important to note, however, that the transition temperature is
sensitive to the velocity of loading; and in a test where the
transitions in energy absorption and fracture appearance coincide,
it would appear that the ductile-brittle transition should increase
monotonically with velocity of loading to develop a curve as drawn
in Figure 20(14). This latter curve reveals that an increase in the
loading rate from that encountered under static loading conditions
(head movement 3 inches per min.) to that encountered in impact
testing (head movement 18 feet per sec.) produces a displacement
of the transition temperature of +70%. It will be noted that
loading rates appreciably less than those encountered in impact
loading may still result in an elevation of the transition tempera-
ture curve.
Q&i i2tG22t * U2,f2Qd&L.ka-Qd&tk hnsitim : ‘l%eterm
“size effect!!as used in a discussion of the mechanics of the
loading and deformation of different sized test bars presupposes
the use of similar test bars. The term cannot be extended with
this rigorous restriction to a consideration of the ductile-brittle
transition, because of intrinsic defection from the requirements
o: similarity, experienced in the testing of the larger test bars.
The modification of the ductile-brittle transition by ‘fsizeeffect’t
must be discussed with this reservation In mind.

-16-
Extensive research which is summarized by Fettweis(25) has
shown conclusively that the ductile-brittle transition for similar
specimens is higher, the larger the specimen. This for a given
steel in an appropriate temperature range leads to a ductile-brittle
transition with increasing size as is indicated in Figure 21. This
phenomenon is critical in the problem of merchant vessel failures?
in that because of it small-scale laboratory tests have not been
available for use in predicting the fracture characteristics of
structures. However, this difficulty can seemingly be overcome
in the bend specimen by the use of a suitably formed sharp notch.
Thus with a pressed notch of 0.0015 inch root radius transitions
in lateral contraction and fracture appearance for a Schnadt-type
slow-bend bar were in full agreement and constant as specimens di-
mensions were varied from 0.39k by 0339b by 2.1 inches to 1.187
by 1.172 by 2.1 inches.
The engineering properties of metals are also mcdified by
size effect. These properties have been extensively studied but
are modified to only a limited degree by the ductile-brittle
transition and so will be reviewed in a later section.
THE TESTING PROG~_
In the analysis of the ship fracture problem: early appraisal
of knowledge on the subject of the ductile-brittle transitionin-
dicated that “size effect” was largely responsible for these

-17-
failures. The testing program, therefore, was organized to include
large-scale tests along with small-scale tests, the latter designed
$0 attain correlation with the large-scale laboratory tests.
Toward the development of a large-scale laboratory test, ex-
ploratory work on flat plate specimens was completed at the David
W. Taylor Model Basin(26). The largest size specimen tested was
12 by 3/4 inches with an internal notch, Figure 22. Pertinent
details of the internal notch are given in Figure 23. Specimens
with suitable notch geometry were tested in both 6- and 12-inch
widths at appropriate temperatures. Pertinent results are
summarized in Figured 24 and 25.
From Figme 24, it is evident that a minimum length notch
must be used in this typ~ of specimsn to insure consistent re-
sults for comparison purposes, and this length has been standardized
as one fourth of plate width.
In keeping with the discussion on size effect it was expected
that the plate tests would give transition temperatures which would
be relatively lower than those for a ship structurs. By an adjust-
ment of notch acuity this condition could be minimized. The results
obtained in the study of notch terminus radius are given In Figure
25, where it will be noted that jewelerts flawcut was the most
severe of the notches studied. This notch terminus was usad through-
out in subsequent flat plate testing.

-18-
Of the large-scale tests the most completely explored were
the intermlly notched flat plate tests in the 12-, 24-, ~- and 72-
inch widths(ll$27). Several additional specimens 108 inches In
width were tested. A drawing of the test specimen is given in
Figure 26, and a picture of the ~.inch plate specimen in the
%ensile test machine is given In Figure 27.
The data of the original flat plate test program indicated
that the results obtained with the 12’fplate specimens are equiva-
lent to those obtained with the 72-inch plate specimens, and the
subsequent flat plate testing at Swarthmore College has been
limited to the 12.inch wide specimen in which L . ~, see Figure
26. This specimen in place in the testing machine and ready for
testing is shown In Figure 28. The Swarthmore data which are con-
sidered in this report were obtained with this specimen. This fact
is noted to eliminate confusion with the later modification of this
test specimen for the Swarthmore aspect-ratio test program. Data
from this program will not be considered in this report.
It was recognized that the data which were obtained in tha
various tests could not be applied directly to the problem of
ship failures without further testing, preferably on a ship structur~
but under controlled conditions. Full-scale ship tests meeting the
above restrictions are conceivable but hardly feasible, so the full
scale hatch corner tast was devised(29) . The objectives of the hatch
corner testing program included: (a) theht-iwtion of the ductile-
brittle transitional behavior of selected project steels fabricated

-19-
into hatch corners of the basic design$ and (b) the redesign or
modification of the basic Liberty ship hatch corner detail. This
first program was essential to the i.nteg~ationof the flat plate
testing program with structural behavior.
The test specimen based on the basic hatch corner design is
given in Figurs 29. The method of testing behavior in testing are
in some measure indicated from a consideration of Figures 30 and 31.
The basic hatch corner specimen was tested in numerous modifica-
tions and several additional new designs were also tested. Details
(29)of these design alterations must be sought in the original report .
Because of its size, it is not possible to test a full width
of shipls deck in way of the hatch opening. The specimen selec$ed,
see Figures 29, 30 and 31~ was as large as could be accommodated in
the testing machine of greatest capacity then available.
The problem of brittle ship failures was recognized as arising
from the action of stress raisers such as structural discontinuit~ss,
accidental notches, etc> The large-scale test program as outlined
above took cognizance of this fact$ and all specimens possessed
effective stress raisers. The magnitudes of these multiaxial stress?q
however, were not known; and it appeared desirable to explore the
field of multiaxial stress in structures. To this end large tube
tests were designed such that the temperature of testing could be
varied over wide controlled limits$ while the longitudinal and
hoop stresses in the shell could be varied regularly through pre-
scribed values to fracture(309● ThLs test specimen is shown in

-20-
Figure 32. (The data obtained with this type specimen have already
been discussed.)
The completed program of tests on large-scale specimens in-
dicated that the mild steels tested all experienced brittle failures
at temperatures above about 200F. Since temperatures of this order
and lower are regularly encountered in service, it appeared desir-
able that the ductile-brittle transition phenomem in certain high-
yield strength structural steels be examined. Since these Steels
were to be examined for possible merchant vessel use, the full-scale
model hatch corner test specimen would be a logical specimen to
test, but because ofth+ M@. strength properties of the steel used~
the capacity of the tensile machine would be exceeded by this speci-
men. For this reason the restrained welded specimen given in Figure
33 was designed. This specimen ready for testing is presented
in Figure 34. Comparable tests for the 12-.inchflat plate specimen,
previously described, were also run.
The specimens described above are, in all instances, large
specimens and are too large for routine laboratory testing, It
was necessary, therefore, that experimentation be undertaken to
explore the possibilities of the correlation of small-scale labora-
tory test results with those obtained in the large-scale tests. In
the course of this experimentation the specimens given in Figure 35
were variously used.
EXPU(IME NTAL RESULTS
L* Q2ilEG&QQ2i2J&.
The data obtained for the project steels will be considered

-21-
following which the further data obtained on the augmented program
will be examined. The ductile-brittle transition data are considered
first.
The Ductil,e-BrittleTransition -- Project Steels: Over a period
of many years the ductile.-brlttletransition has been extensively
studied in the impact test. For this reason one of the first steps
in the examination of the project steels consisted in the determina-
tion of the impact transition curves for standard test conditions.
Data so obtained for the standard keyhole and V-notch Gharpy test
bar are presented in Figures 36 and 37.
The impact transition curves are drawn as smooth curves which
vary regularly through a range of temperature from the maximum value
of energy absorption] or ductile condition$ to the minimum value of
energy absorption or brittle state. Comparison of transition tem-
perature ranges becomes possible from such curves, but occasional
irregularities in individual curves preclude this method of com-
parison from beihg~nerally applicable. Further, the comparison
of energy absorption--temperaturecurves is not a desirable method
of evaluating the fracture characteristics of steels, as this is
an unwieldly procedure. It has been general practice, therefore
to select some energy absorption value as a re?erence value for
evaluating impact transition temperatures. Thus a commonly used
method specifies that temperature, as the transition temperature,
at which the energy absorption for a standard keyhole Charpy

-22-
specimen equals 20 ft. lbs. Other methods hz.verequired that
1/4 maximum, 1/2 maximum or maximum energy absorption can be
specified as the reference criterion.
The impact transition temperatures as specified above may prove
fully acceptable for control purposes, but it is probable that with
the exception of the maximum energy absorption value, these arbitrar-
ily specified transition temperatures are not suitable for a funda-
mental study of the fracture problem. Thus it has been argued that
the gradual decrease of energy absorption through the transition
range, for the V-notch Charpy bar, is an effect resulting from the
fracture behavior of the metal on the compression side of the test
bar(32)C If this weretrue, the elimination of the compression side
of the test bar, as is effectively done in the Schnadt-type bar,
should eliminate the characteristic broad transition range indica-
ted, for example, in Figure 37”( as shown by the slope of the curve
in the transition range). The data in Figure 38 reveal that an
elimination of this broad transition range does obtain when the
compression zone of the impact bar is removed. The impact test
transition temperatures for the project steels, by the indicated
criteria are summarized in Table C.
It has been indicated earlier that certain of the steels which
are being considered here are especially sensitive to strain rate.
In the impact test an unknown factor due to strain rate sensitivity
pretiludesthe adjustment of the impact data to predict static notch-
bar test results. The impact test, however, can be used with this

-23-
reservation in mind, to examine steel quality, thus for example,
to indicate the effects of strain-aging, grain size, plate thick-
ness, etc., on the fracture behavior of a given steel. Groups of
data which may be compared on this basis are presented in Figures
39 to45. These data show that the ductile-brittle transition is
markedly elevated by increase in grain size (plate thickness con-
stant) and by increase in plate thickness (grain size approximately
constant). Variations from plate to plate within the heat tested
are not large as shown in Figures 41, 42 and 43.
It is needless to discuss the steps taken in the development
of suitable correlation tests, by means of which the ductile-brittle
transition in the large plate tests could be predicted. Such tests
have been developed in several directions as may be gathered from a
consideration of the data presented in Figures 46 to %. These
figures summarize all pertinent data relevant to the temperature of
the ductile-brittle transition in the project steels (see Table A).
Some few test results have not been included because of the in-
completeness of the data.
From Figures 46 and 47 it will be seen that virtually complete
agreement in the transition temperature data obtains for the large--
and small-scale tests that have been reported. By analogy this
statement can reasonably be extended to embrace all the project
steels as Figured 48 to 54 show. There is little question, there-
fore, that the ductile-brittle transition temperatures, for such
steels loaded under static conditions in structures, can be predicted

-24-
with a relatively high degree of accuracy. As will follow from a
consideration of the results reported from the 3-inch edge-notched
tension test, it is necessary to specify the criteria of the duc-
tile-brittle transition for restricted tests, with? in general,
fracture appearance being the most suitable criterion for correlating
the results of the small-scale tests with the large-scale test re-
sults.
~ Strenpth and Size Effects -- ~ w: A struc-
ture is designed to carry a prescribed load, and in the interests
of economy this load should be as great as possible ad yet safe
from failure. Experienc? has shown that in meeting these combined
needs the nominal tbnsile strength is not a suitable criterion of
the strength of a structuro but must be modified by a safety factor.
Since safety factors are regularly used in structural deslgn$
it should not, perhaps, be unsuspected to find that in the flat
plate tests a ma?’keddrop-off in tensile streng& accompanies and
increase in plate size, as shown in Figure 55. The drop-off
steels (of 55,ooO to 65,OOO lb./sq.in. tensile strength) frequently
amounts to about 1/3 of the tensile strength so that the tensile
strength value for k8-inch internally notched plate lies between
35,000 and 45~000 lb./sq. in. Hatch corner test data, however,
show that the reduction in tensile strength indicated for the flat
plates is not the maximum to be observed, for nominal tensile
strengths as low as 25,000 lb./sq. in. obse?ved, for nomiml tensile

-25-
strengths as low as 25,ooO lb/sq.in. have been reported fOr the
hatch corner tests. In other words a reduction in tensile strength
by 50$ can arise in a structure.
The reduction in the tensile strength in the hatch corner
tests is in large measure a design problem, as is indicated in
Figure 56. Redesigning is frequently relatively simple; but while
marked improvement in strength can be achieved in this manner, this
can be done only by the virtual elimination of all important local
stress raisers. Accompanying this increase in tensile strength there
is a more or less general increase in ductility which is very
desirable.
In the examination of Figure 56 it is noted that wide varia-
tions in energy absorption values have been obtained. This may be
construed as a lowering of the transition range for the steel, a
conclusion, however, that should be avoided. The model hatch cor-
ners were all made of steel C wl-ichin the large plate tests has
a transition temperature of +1009. The test data which are com-
pared in Figure 56 were all obtained at 700F., and all fractures
were by cleavage. sPeC@en 35 failed by cleavage which was initiated
at ah accidental arc strike incidental to the welding of the struc-
ture. A discussion of matters pertinent to this behavior will be
undertaken below.
~. Additional T&.
The testing program which has been X&viewed in the previous
section can be expanded in two obvious directions, the first of

-26-
which consists in an attempted correlation of the properties re-
vealed in the above tests with the properties of the same materials
in a ship structure. The second consists in the exploration of
the possibility of improved structural materials. Limited ex-
perimentation in these two directions has been completed and is
considered below.
Fractured Libert~ Shi~ Plate Tests: It was generally accepted
during the formative stages of the research program under consider-
ation that the brittle problem in Liberty Ships was directly a
size-effect problem. Thus for the small-scale tests a low transi-
tion range might be expected, and this transition range would be
displaced to increasingly higher temperatures as the size of the
test bar was increased. Figuratively then a full-size ship should
characterize a more or less definite transition range for a speci-
fied steel, and this would lie at a higher temperature than that
for a small-scale test bar. By this predicate, a ship could be
considered as safe from brittle failure as long as the operating
temperature was above that of the transition range, but it would
become highly susceptible to brittle fracture once the tempera-
ture fell below that of the transition range. By this principle
of behavior It becomes reasombly convenient to attempt suitable
correlation between the many laboratory test results and full-
scale ship behavior.
Thus, for example, of the several ships which broke In two,
a restricted few failed under well-documented cmditions of tem-
perature and loading and were accessible for experimental purposes.
-27-
From these ships, therefore, plate pertinent to the initiation,
propagation and termination of the crack could be removed for labora-
tory testing, particularly in the interests of a precise determina-
tion of the ductile-brittle transition in the small-scale tests.
Since the correlation attempted in this manner assumes that the
temperature at which the ship broke will reveal the temperature of
the ductile-brittle transition for the ship, the small laboratory
tests should allow the determination of any needed correction factor
for ship plate evaluation by means of the small-scale tests. Test
data pertinent to this correlation for the 12-inch flat plate speci-
men have been reported ?Gr two ships, the “Fierre S. Dupont” and
the “Ponaganset’’(33).
The “Pierre S. i%pontf’suffered brittle fracture during a severe
winter storm at sea on February 10, 1948, with the air/water tem-
peratures reported as 270/420F.$ respectively. Details of the loca-
tion of the plate available for testing and the specimen lay-out are
given in Figures 57 and 58. The T-2 Tank Ship “Ponaganset” broke
in two on December 9, 1947, while moored and under a hogging load,
with the air/water temperatures being reported as 3\0/410F.,re-
spectively. Details of the plate location for specimens from the
llFonagansetlrare given in Figures 59 and 60. In both the ships
studied the cracks were initiated at about air temperature which
allows fixing the apparent transition ranges at about 300F. for the
I!PierreS. Dupont~fand at about 350F. for the’!ponaganset”.

-28-
!Chechemical analyses of the plates removed from these two ships
are given in Table D and the mechanical properties are given in
Table E. The results of the 12 inch flat plate tests are given
graphically in Figure 61, while the various transition temperature
data are accumulated in Table F. The data for the 12-inch flat
plate tests on the fractured ship plate indicate the transition tem-
peratures for the plates tested lie between kO°F. and 11OOF. These
data indicate that these plates through which the crack propagated
had transition temperatures above the apparent transition tempera-
tures of the ships and hence extended fractures should have been
possible.
Jk&QQz Qtw$-: The high yield strength steels which
were studied at the University of California could not be fabricated
into full-scale hatch corner test specimens because of load restric-
tions on the available testing machine. A reduced sized specimens
called the restrained welded specimen was tested instead. For com-
parison purposes steels Br and C were tested using this specimen,
and the data obtained have already been presented. The restrained
welded specimen gives nearly the same transition temperatures for
the two steels as does the full~scale hatch corner test. The re-
sults obtained for the high yield strength structural steels using
this specimen will, therefore, be considered as equivalent to the
full-scale hatch corner tests run on the project steels.

-29-
The chemical compositions, thermal treatment, and mechanical
properties of the high yield strength structural steels studied
are presented in ‘1.ableG. The transition range data are summarized
in Figures 62 and 63, and transition temperatures are accumulated
in Table Ii.
In brief, these data reveal that much reduced transition range
is possible with selected HYS steels but that a low transition
temperature is not assured by the use of such steels. Further, it
is evident that the good correlation that obtained among the respec-
tive tests for the project steels is not ‘?,ypical~as transition
temperatures given by the 12-inch flat plate HYSS specimen are as
much as 50°F. removed from those given by the restrained welded
specimen.
The nomiml tensile strength values of the restrained welded
specimen of the HYS steels studied here may drop to as low as 35
to 40$ of standard room temperature coupon test values, but the
average nominal strength of the specimens tested was approximately
65$ of the standard test bar tensile strength.
~ Studies &-Cahn and ImbembQ: The survey of the ductile-
brittle transition phenomena in the Navy tear test by Kahn and
Imbembo(34) has been especially revealihg because of the large
number of different types of steels which have been studied with
this test. Since the transition phenomena associated with this
test have already been described for the project steels, it will

-30-
be sufficient to consider here only the transition temperature data
which have been accumulated. Details of the chemical composition
and thermal treatment of the steels studied are presented in Tables
I and J, and the transition temperature data are presented in Figures
64 to 68.
From the tabulated data it is seen that the work included the
testing of:
a. Semi-killed medium steels
1. i{ormalmanganese contents
2. Higher manganese contents
b. Fully killed medium steels
c. Vanity-type high-tensile steels
d. Medium steels of several thicknesses
e. Steels finished by non-conventioml mill practices.
k,anyof the steels were also tested after stress-relieving and
normalizing treatments.
The following generalizations,which have been stated previously,
are emphasized in a consideration of these dataz
a. The transition temperature for a given steel is lower, the
lesser is the finished plate thickness, cf., Figure 64.
b. The transition temperature for a given steel is lower, the
smaller is the ferrite grain size, and the reduction in
transition temperature by the reduction in grain size may
be of large magnitude.

-31-
C. Normalizing when accompanied by a reduction in the ferrite
grain size may reduce the transition temperature by as much
as 1500F., but when a reduction in grain size does not
accompany the normalizing treatment, the reduction in
transition temperature may not be present. In this latter
case when a reduction in transition temperature is noted,
it is normally of small magnitude.
In addition to the above generalizations, it may also be con-
cluded thatg
a. For the as-rolled condition, there is a probable slight re-
duction in the transition temperature as the deoxidation
practice varies to produce from a rimming to fully killed
class of comparable steels, This reduction is more marked
for aluminum treated steels.
b. An adjustment of the (km/C) ratio to higher values does not
ensure a reduction in transition temperature for the as-
rolled platei For such steels, however, a normalizing
treatment may produce a reduction of the transition tem-
perature by as much as \O°F., cf., Figure 65. This re-
duction seemingly is brought about by a reduction in
ferrite grain size.
c. The lighter plate for the high (kin./C)ratio steels con-
sistently shows the smaller ferrite grain size, and this
grain size is not materially reduced by normalizing. The

-32-
grain size in tieavierplate in the normalized condition
approaches that representative of the light plate, and
similarly the transition temperatures for the heavier
plate approach those of the light plate.
d. In the steels studied the McQuaid--Ehngrain size was of
minor importance in determining the transition temperature.
e. Stress-relieving treatments were not observed to improve
the fracture characteristics of the plate studied.
D~~~ussION
The experimental data which have been:presented, indicate that
much of the steel wk.ichhas been used in Liberty and Victory ship
construction may ordinarily be expected to fail with brittle frac-
tures at the temperatures at which these ships regularly operate.
That the ductile-brittle characteristics of these steels, then, do
not of necessity determine the structural behavior of the steels
must follow, since most Liberty and Victory ships continue to
operate satisfactorily. From this it follows that either the
correlation of laboratory tests with ship structural behavior is
precluded by the operation of unknown quantities, or that the factors
which modify the transition temperature of a steel are improperly
combined in the tests to simulate the conditions of ship operation.
That the second alternative is the more probable follows from
a consideration of Figure 69. Here are presented maximum nominal
strength deck stress levels, determined for ships of a type considered

-33-
here under operating conditions, and it will be noted that these
stress values are very much less, for all conditions of loading,
than the comparable stress values measured in the hatch corner
tests.
In examining the apparent incomparability of the laboratory
test results with full-scale ship behavior it becomes desirable
to examine more closely the significance of the ductile-brittle
transition as determined in the small-scale tests, and to re-examine
the conditions of loading in both the laboratory tests and in a ship
structure. Of these the d~ctlle-brittle transition will be considered
first.
The Ductile-Brittle Transitio4: The appearance of brittle
fractures in mild steel specimens has been shoxn to be possible in
unnotched tensile bars tested at a suitable low temperature. None
of the steels which have been studied are brittle in this way at
ship operating temperatures. Such brittleness in ships must result,
therefore, from the existence of effective notches in extreme tensile
structural members. Such notches may arise from design or from de-
fective workmanship, or from a variety of incidental factors such as
arc strikes, the welding of clips to the deck, etc. It is further
possible that effective notches may arise from the action of fatigue.
It is evident, therefore, that the effective notches that exist in
two ships of the same design may vary over a considerable latitude
of intensities in corresponding areas. However, the design of a ship

may be such
a case that
-34.
that the incidence of severe effective
proved to be true in the basic Liberty
notches is high,
ship design.
hhen effective notches arise in this ~ay, design changes may be
introduced to bring about a structure which then becomes as re-
sistant to brittle fracture as the structural materials will
allow.
of the
cargo,
An effective stress raiser may not be a design feature
ship but may arise fram operations involved in tying down
the welding of clips to the deck, or from fatigue action.
The significance of the ductile-brittle transition observed in the
small-scale tests with respect to ship structural behavior must
center then from the outset on a consideration of the intensities
of notch action possible in a ship structure. Such knowledge will
be informative in the design of small-scale iests to predict the
transition temperature of a ship structure under essentially static
loading conditions.
The most severe notch that can be in a ship structure will re-
sult from fatigue action. This is a notch which from earlier dis-
cussion may be considered as having attained a limiting stress
raising capacity and should characterize a limiting maximum transi-
tion range. Under static conditions of loading the ship structure
possessing a fatigue notch as the effective stress raiser would
then have its highest transition temperature.
If the effective notch is not a fatigue crack, in general
under static loading the metal in the notch may be expected to
-35-
reach the yield point and deform before the adjacent material.
Even in a relatively mild notch, however, the stress In the notch
may exceed the fracture stress of the metal before yielding takes
place in the ad¢ material. Once this happens, a crack will
form which if propagated brittlely the structure will fail with a
transition temperature characterized by this crack, thus with a
transition temperature in agreement with that determined for the
fatigue crack in the same structure.
When the effective notch in the ship structure is sufficiently
mild so that plastic flow is possible in regions outside the notch
before cracking takes place h the notch, extensive plastic distor-
tion of the structure Is possible to failure.
Under conditions of static loading it is useful to know the
maximum temperature at which brittle fracture can occur and this
is a temperature determined by the most acute notch available--the
fatigue crack. This temperature is important for it would appear
that all ship fractures originate in notches equal in intensity to
fatigue cracks, ati if this Is so that latent transition temperature
of the ship, when this ship is made of mild steel, must be high.
Under static conditions of loading to failure this high transition
temperature would be realized.
Under service conditions the ship would possess a still higher
transition temperature due to the dynamic conditions of loading,
but brittle failure thus to be expected is not normally realized.

-36-
That brittle failure does not take place must arise because of
differences in loading under the laboratory and service conditions.
These deviations in loading conditions will now be considered.
~SOndiWwti Structures: Nominal tensile stress
values of 10,000 lb./sq. in. are not regularly experienced in the
strength deck of ships in operation, whereas, the nominal stress
in the hatch corner test specimen was measured at 25,000 lb/sq. in~
at failure. In an examination of this question a consideration
of the load-elongation diagram for a 12-inch plate specimen SS given
in Figure 70 is informative. On this diagram the load is specified
at which the initial crack is formed. A consideration of the num-
erous stress-strain diagrams included in the indicated reference(28)
reveals that this crack is regularly formed very early in the course
of the test and at a load of about 5/7 the tensile strength deter-
mined in this test. The ratio of the load to initiate cracking to
the maximum load increases somewhat when the specimen fails with
low energy absorption, but in this case also the initial crack is
normally present for some time prior to failure.
In a ship structure the conditions of loading are not such
that a crack can be initiated and propagated slowly to fracture
of the structure. On the contrary the loading cycle due to wind
loading and wave aation can be expected to be quite short with
a consequent ‘Iimpact”type of loading being experienced. With
this type loading the structure may be overloaded for but a

-3’7-
relatively short time, following which the overload Is released.
The problem of fracture in the ship then is resolvsd into two
components, mmely, a loading factor and a time factor. The in-
terplay of these two factors may be quite complex and may modify
the stren~th properties of the ship steel in a way not now recog-
nized. The response of the ship steel to such loading cycles will
now be considered.
Since the loading rate experimced by the ship can be relatively
high, the transition temperature considered typical of the ship
constructed of a given steel must be elevated by a proportionate
velocity factor over that experienced under static loading conditions
If the ship is operating at a temperature that lies in the range of
brittle behavior, two conditions must now ba fulfilled before
cleavage failure will result. The ship must be overloaded; ~.g.,
the stress in the effective notch must exceed the fracture strength
of the steel, and secondly, tk.isstress must be maintained suffi-
ciently long to allow the crack to be initiated and propagated.
It 5.srecognized that all cleavage fractures are generally
preceeded by some, though slight, amounts of strain. It is alao
accepted that the crack is developed In the Initial stages of its
life at ad.ow rate but is propagated at a high rate. From this
it is concluded that a short but Important time interval must
elapse before a fast moving cleavage crack can be established.
This time interval for a given steel must depend on the temperature
and the amount of overloading experienced In the critical section.

-38-
Iiodata are now available to allow a discussion of these quantities.
However, it is expected that those steels which have the lower
transition temperatures as determined by the laboratory tests, will
be the most effective in suppressing brittle crack formation in
ships.
~ Steel Selectio~: In the consideration of steel selection
for future merchant vessel construction restricted lines of action
are possible. The extreme approaches to the ship fracture problem
are first, the relaxation of materials fracture specificationswith
the expected elimination of the fracture problem by control of design
and second, the setting up of a fully reliable fracture specification
test, with the relaxation of design restrictions.
‘thelatter approach if readily realized would probably prove
desirable from the point of view or construction, but the ductile-
brittle transition studies which have been completed to date indicate
that a construction program based on this philosophy of materials
selection wotlldlead to the rejection of a large percenta~e of the
steels which could be supplied for ship construction. This is
obviously an unacceptable solution.
The alternative approach to the ship fracture problem, that
of controlling ship fractures by design control, has been used in
the construction of the Victory ships. These ships continued to
operate satisfactorilyuntil the winter of 1951-1952, at which time
several serious failures occurred. This suggests that design’improve-
ment without consideration for the fracture characteristics of the
steel is not the final answer to the ship fracture problem.

-39-
It is not the purpose of this discussion to advance a given
test for the purposes of specification needs, but in the interests
of close coordination of such tests with service failure, two
quantities must be given much importance, and these quantities
are the intensity of the notch and the duration of loading. Since
the effective notch in determining the fracture characteristics of
a st~ncture is an extremely acute crack, the notch in a small-scale
correlation test specimen should be sharp. The relative duration
of loading of the specimen would simulate that experienced by the
structure. The testing of even a small test bar over an appropriate
range of temperature should then satisfactorily predict the location
of the ductile-brittle transition for the ship. The transition tem-
perature so determined alone will not predict the performance of the
ship and gives only one extreme value for consideration in antici-
pating ship performance. Qualitatively, however~ there can be no
question but that those steels which have the higher transition tem-
perature will fail more readily in a ship structure than will those
with the lower transition temperatures. In view of the paucity of
data pertaining to the time and loading effects on the development
of a cleavage crack in mild steels and to uncertainties about load-
ing conditions in ship service, it does not appear possible at this
time to devise a test that will provide full correlation with ship
performance.

-40-
ACKNOWLEOGMEN~
The present report is a review of the salient features of
the investigations conducted on medium ship steel under the auspices
of the ship Structure Committee. The reports which have been sub-
mitted by the many contractors of these investigations are both
numerous and voluminous, and It has not been possible tp present
here other than selected material taken from these reports. The
selection of material for inclusion In this report has been the
responsibility of the authors, but valuable suggestions indicating
appropriate deletions and/pr additions have been made by Drs. John
Low, Jr., and Finn Jonassen, both of whom were kind enough to examine
the manuscript in one or more of its early forms. The writer~t
associates at the Pennsylvania State College, notably Drs. John R.
Low, Jr.; William Lankford, Jr.; John Ransom; T. A. Prater; were
closely associated with t~e early development of the research program
that was ultimately completed at that institution.
The writers would like finally to thank Nessrs. James McNutt
and Fred Bailey for much assistance in placing the manuscript,
tabulated material and cuts in final form. Their task has been
rather a difficult one as certain of the cuts requested have not
been readily available.

(1)
(2)
(3)
(4)
(5)
(6)
(7)
(8)
(9)
(lo)
(11)
(12)
(13)
-kl-
BIBLIOGRAPHY
Final Report of the Board to Investigate the Design andMethods of Construction of Welded Steel Merchant Vessels,JUly 15, 1946.
Technical Progress ReDOrt of the ShiD Structure Committee,March 1, 1948; “
Second Technical Progress Report of the Ship StructureCommittee, July 1, i950.
M. Gensamer, E. P. Klier, T. A. Prater, F. C. Wagner, J.Mack and J. L. Fisher: !!Correlationof Laboratory Tests
00
with Full Scale Ship Plate Fracture Tests.ll Ship”StructureCommittee Report Serial No. SfX-9, March 19, 1947,
A. Le Chatelier: Rapport a la Commission francaise desMethodes d’esaais le 22 October 1392. Contrib. pp. 25/46.
P. Lukwik: ‘Elements der Technologischen Mechanik, Berlin,Julius Springer, 1909.
N. N. Davidenkov and.E. M. Shevandin: Jnl. Techn. Phy. IV,1934.
N. N. Davidenkov: “Dynamic Metal Tests.’l Second edition,1936, pp. 158 et. seq.
~. W. Vanderbeck and M. Gensamer: “Evaluating Notch Tough-ness,ttwelding Research Supplement, p. 37-s~ JanuarY 1950-
M. Gensamer:p. 30, 1946.
J. Marin. V.
,,Strengthand Ductility.” Trans. A.S.M. ~.
L. Dutton and J. H. Fauoel: !!HvdrostaticTestsof Spherical Shells,II“Weldiw Resear>h fklppl;ment,p. 593-s9December, 19Lt8.
H. E. Davi&, G. E. Troxell, E. R. Parker? A. Boodberg andM. P. O~Brien !!causesof cleavage Fracture in shiP plate:Flat Plate Tests and A&iitfonal Tests ofiLarge fibes.’!
‘&Structure Committee Report Seria,LNo. st?L8, January 17, 1 7.
H. Larson and E. P. Klier: Trans. A.S.M. ~, P. 1033, 1951
H. Neuber: “Theory of Notch Stress: Principles for ExactStress Calculation” Ann Arbor, Michigan, 1947, pp. 155-175.

-k.2-
(14) K. J. Stodden and E. P. K1.ier: ‘Brittle Failure and SizeEffect in a Mild Steel,1!welding Research supplement~ P“303-s, June 1950.
(15) E. Orowan, J. F. Nye and W. J. Cairns “Notch Brittlenessand Ductile-Fracture in Metals,” Theoretical Research,Report No. 16/45, Ministry of Supply, Armament Research.Sept.; July 1945.
(16) ~$k~chs and J. D. Lubahn, Welding Research Supplement.
(17) R. S. Zeno and J. R. Low, Jr.: “The Effect of Variationin Notch Severity on the Transition Temperature of ShipPlate Steel In the Notched Bar Im act Test,” Welding
tResearch Supplement, p. 145-s, 19 8.
(.18) A. B. Bagsar: Melding Research Supplement, p. 284-s, October1949,
(19) R. D. Stout and L. J. McGeady: llTheMeaning and Measurementof Transition Temperature,1!Welding Research sUPPle~t~p. 299-s, 1948.
(20) Osborn, Scotchbrock, Stout and Johnston, “Comparison ofNotch Tests and Brittleness CriteriaftSupplement, p. 24-s, 1949.
, Welding Research
(21) R. D. Stout and L. J. KcGeady: “Notch Sensitivity ofWelded Steel Plate”, Welding Research Supplement, p. 1-s,January 1949.
(22) N. N. Davidenkov and P. Sakharov: “On the Influence ofCold Working upon the Brittleness of Steel,” Tech. Phy.U.S.S.R. ~, p. 743, 1938.
P. Sakharov: *On the Influence of a Notch upon theCritical Temperature of Brittleness of Cold-Worked Specimens,”Tech. Phy. U.S.S.R. ~, p. 758, 1938.
(23) J. M. Lessens and H. E. Jacques: *Effect of Fatigue ohTransition Temperature of Steel,‘8Welding Rssearch Supplement,P. 74-s, February 1950.
(24) fi.H. Bruckner and N. M. Newmark: “Axial Tension ImpactTests of Structural Steels,a Welding Research Supplement,p. 67-s, 1949.
(25) F. Fettweis: I!TheNotch Impact Test - Development andCritique”, Arch. Eisenhiittenw.Q p. 625, April 1929.(A partial English translation has been published by theShip Structure Committee)

(26)
(27)
(28)
(29)
(30)
(31)
(32)
(33)
(34)
-43-
R. R. Thomas and D. F. Wixxlenberg: 11AStudy of SlottedTensile Specimens for Evaluating the.Toughness of StructuralSteel, Welding Hesearch %pplement, p. 209-s, April 1%.
W. K. Wilson and R. A. Hechtman: I!CleavageFracture ofShip Plate as Influenced by Size Effect,” Ship StructureCommittee Report Serial No. SXL1O, June 12, 1947.
S. T. Carpenter and W. P. Roop: llTensileTests of InternallyNotched Plate Specimensff,Welding Research Supplement,p. 161-s, April 1950.
E. P. DeGarmo, J. L. Weiran and M. P. OtBrien: ‘tCausesof Cleavage Fracture in Ship Plate - Hatch Corner Tests”Ship Structure Committe6 Report No. SSC-5, October 23, 1946.
H. E. Davis, G. E. Troxell, E. R. Parker and M. P. O~Brien$ItBehaviorof Steel under CorsiitionSof Multiaxial Stressand Effect of Welding ani Temperature on this Behavior;Tests of Large Tubular Specimens,” OSRD No. 6365, SerialNo. M-542, December 6, 1945.
A. Boodberg and E. R. Parker, I!Causesof Cleavage Fracturein Ship Plate; High Yield Strength Structural Steel!t,ShipStructure Committee Report Serial Xo. SSC-28, September 21,1949.
E. P. Klier, F. C. Wagner, J. L. Fisher and M. Gensamer:“correlation of Laboratory Tests with Full Scale ShipPlate Fracture Tests, A Study of Strain Gradients ShipStructure Committee Report serial No. SSC-17, l%+.
E. M. MacCutcheon, C. L. Pittiglo and R. H. Raring,IvTransitionTemperature of ship Flate in Notch-Tensile Tests”~Welding Research Supplement, D. ~8b-s, April 1950.
N. A. Kahn and E. A, Imbemboi
I!FurtherStudy of Navy TearTest”, Welding Research Supp ement, p. 84-s, February 1950.

-45-
TABLES
AND
FIGURES
—

C(J)L
A
B?r
Bn
c
Dr
Dri
E
F
G
H
N
4
u.C39
3b.~ 0
.C30
.C26
. ~~~.
.C24
!020
.931
.020
,01c.“_,
.020
3.0 0
‘LADLE. A—.
CHEllICALANALYSES OF THE STEELS———
Ni %
.02
P,~.“,
.~,~
‘2.G
.16
.15
.15
-Cl.,, 4
.98
‘5.“
3.39
,05
.03
.2’2
. (: 5
.1>’
.09
.19
.13
~
. C3
. 23
.C3
.~]
.12
.12
.Ocj
.Q3
.Ck
. C4
.06
‘3,...
~~ :;
. C03
.C1.2
.?15
.C!23
. ;23
.C25
, @+
.02i
.012
.004’
.017
.C18
};2 ,<
. 00k
.005
. C06
.C09
.006
.006
.025
.0C6
. CG6
.004
.005
.CQ6

rioter Tu:
.Q.d”ati.a
X.2,h,.kn.. s,
%
SummaryofT-t Ruulb—.20.1..1
m
N&ml Mxlm?mSt r..., b m:%%. P.,...,pi. . . Frut”r., 9 E1.ng.t, ml
mop. Ulti- .1. i. 5 i..Limit mti b% T . . . L.mg r, . . . .
So>uao 69JWQ &z,Yx g 1 16.9J
m.—P.t*.t 1*1
Q1.w.,
rr..tw~1,.-15.
—,,.s,.tio,/L
.an,mti.mllSt,..,F..i.i
Talgf - 7,.n.-,Jdical ..r. *
!6,260 62, m
r..tr,mp.‘+.—
70
70
H“trr,ati.r’t
( ma%’)
,.di~>ndi ti m,
,“*rnkl?..,, U.
.
.
AJi.1 1..(i.%. p,..,
.
.
“
.
.
.
.
AX1.1 l..t1“,. pm.,
N.t”r, .1 ,,.,,”,.
I.lti.t.d h.v thou i“P1.t8 mbo.t 4 im. frc.m.“.3 P.mll.l to ..ld . . . . nld. mtio.; alla=.h..ri% ,., .bo”t 6 in. , cr.ck Pr.PaJ.t8d. . . . .Omid. r.b, a ie,uth of tub. by .1a..-.g..
So.o
Sz. o
13S,0X
148,5.?3
2
z
2
!4,9ca 49, MX Pr..ticuly ‘.=. . . for tub. i.
C1...mg. rr..tw. entir.ly ?J.uud .lr.mr. r..-,,.1 .nd ..1,.
—
shear for 6 in. (mmtur.)) f aftar rqdr by“l’Ii*, .hur rm’ 4 in,, * ctuncd
Cl . . . . . fr.ct”r. Q?i~iLUtLIW i. ..ld .bo”t48 in. . . . . .id-...t,on -d PmP.@ti.& .P1rIllyaround tub..
cl..%. fracture oric%n.ti.g 1. ..ld Z in. Cr.mm,d-.mti.. .“d pmp.g.,ing Q=mP1. t.lr .ro”l!dtub.. No .h.ttml. c.
C1-..c. r...t”r. .,lgl.!Jt i.. i. ..16 Z* 1.. frommid-... nl.n. S,. cim.n ,h.tte r.. into my pi.,...
Cln.”r,. fr.ct”r. .ri~%c.ti% ., Lm,itudin.1“old 22-1”. frm mid-..etio” ,FO.addlW .1OW theh.., .fC.et.d zone P.%11.1 t. th. mld .“d th..,,.und the ,.,. ., b.,, ..dd .
Cl..-g. ft. ct”re .ri&u<in6 i“ ..ld 4 In. lWm
.ld-*..bi . . . sP.. ~.. .Utt..., it. MW Pi.....
‘m 1“’+”~ l= I ‘ I ““0’
-t--~5,6W 51, S00
1 I I I
4’3, C.W 54, C.00 WWi60.ce30; 0.2 3.0 S.o-42
So, wc 66, cca e. 59.5J%
sn, m 66,300 60, W. 56,0We—
W,C”M 61, EQ2 69,003 7z,@m—
40,0Ya 44: m 4* &s, w
S4,CC.5 W,om 49. Ica m,eca—
40, CO0 66, DY3 86,5C4 88, K.3—
S7’OCO 56, cC0 62. C.W 59.9CQ—
25,003 59 .Cmo 61.CC4 64, MO—
k? ,WJ 49, W3 e 25. w
[
4.4 4.,
,.5 4.0
9.2 10,6
1.6 2.,
4.2 S.8
,7,4 18.7
6.7 6.s
S.o .s.0
2.0 0.3
1
1
1
1
1
1
1
1
m
70
70
i6,1c.o 61,$03 9.0 109, WI
102, CCC
Ms,ceu
86,500
98,cca
41 ,Km
m6,cca
160, m
38. WI
>6,5$4 6S,100 7.6
m.o
3.6
6.0
I
T46,430 +*, ECC-44
-40
-s9
.42
-s8
B.f w.W,lding
.
B.C..,U.d Aft.,W.ldlng
.
no..
hi-or.Z.ldi.g
,8,7$0 4B, ecc
I62, X-J 63, 4X
58.640 64, YX
w .0
10.8
IC1..mg. fr.. t”r. OFie,imtl”, In ..ld 28 In. r.-
.id-...ti . . . %.. i... .h.tt...d into m.w Pi...?.
C1mmC. CI..t”.% ori&inati”E .t defect in @t..90. rroa ..1,, 44 i.. fro. mid . . ...%... ..d pr-p.,.tir.c .m””d ‘?..1..., M .h.tt.ri...
6.1
2.0
S9,7W 59, XC
So, e.$o 24,7CC-44
—
1“
.tion of sLrcss prcstmml k govm. f:til. r..
J F. ffurc OWurrcd :,t or new ends or end co.necticms, pre-
s.tmbly d.. to high complex skws mused by bending i.. ——

TABLE C
TRANSITI?N TWPE]?ATUiES CF PROJECT STEELS
4.S DETER!41KED BY VAR1OUS NO TCH2D TESTS
Chmpylr@ctSA. V-l:otch
T.,, Test
Kqhole Notch
Restrained Chaq
10% Tens:Keyhole Notch
tbtch,d Tension
(S/8” Fide Sectim
3“ Temi. nSheared Edge
Slov-r+emi: sch.,
Type .01”%
billed tbtch
S1ow-6end, SChnat
%. .C.XPLPressed Notch
?2” Wide TensionInt.mal Notch
W Wfle Ten.i..Inteml Natch
(.%arthm- Data!
12” Hide TensionInt.mal Notch
(Callfbnll. and
Illinois hta)
3“ T.nsiw,
Pre,trained ChaIT5% 7.”s , Kq+mle
Prestmined Ch, T
2% Tens: Keyhole
Cbpy Impact
Full TM cknessSawc”t Notch
Charpy Impact
Std. Keyhole !:otch
Telmemkdm *F For Qmi”t or ?l.msition kg.
En.r~ Absom ti on
CEA SnLh” DT&QK~
1CO14O1OO3O2O4OOO 0-m
1271Wm-5S554S _ SO—
9585 EO?”302020--2O -
--- --— ——- _
--- -—-— ———
110 B5 53 2S 25 25-25 <C ~5 <Q
m 72 5s E? 15 42 -15 .17 -2c —
% 953413325233c -2? 4S
89 B148171S-8— — -
% 91 251 S154C 5 0-1S-S4
-—— ——— --— —
65 m 45 045 310-45 —
55 m a o.~sd-s--u —
53 75 m 35 a -?0 19 1s o -1!)0
%fibrous Fracture
:EA m h ET~T
--- -—- .— - _
271m 62-555545 -3C—
--- --— --- _
)7 B7 55 G? 15 42 .15 -1S <0 -
)??3e x!? 7.55 -20<5
1285531715 -1?.- -—
U12C45 ?—323C 3535 7
---- -—.. —--
.— -- --— ___
— — — — — — — —-
— — —-- -—— —
&IerEY Absorption
c SA RID ID TEw QHN. .. —————
?00 200 1S0 lSC M 120 SI 70 70 3 S
Y: 5 140 70 - 70
14C 105 75 55 70
--- -—
—-- --—
.20 85 6? 35 so
? 95 65 MO 3C
m 110 45 33 SC
w !+ . . 7. 2“
--— —-
4C 10S 7S 55 70
4C 105 &3 75 70
45 175 14> 110 m
60 S0-S0-
1035—-75-
— — —-.
—-- --
m -10 0 40 -2C
690-s 0-
? S) -25-32
-14 ---
41 15 15 ,1s 4:G. s.
15
--- _-
703 S-10-
703 S-3S—
UO 85 70 70 35
m 120 m MO 12[ lzo M 3s S5 3s
~ Flhvw ham.,.
CEA BnIhtk EkQHN
--— —-— --- _
ES14070-70E0 @3- m_
——- -—— —-- -
SC 10S 110 105 40 m 40 m lCO -
226 S43 ----- 27-
2585S53SS053-10 O-20 -2.0
m9565103S0W 0-S 0-
02140 455C ? ?70 -250
161%582520-14 ---
Zo?,ws? ? S) 1565-25Q, s.
65
021.276270 -3540 S34C 2S
--— ___ ---- _
—--- ——- ___ _
--— --— ___ _
--- —--- ---- --

% of specimensfrom PIERRE S. DUPONTTable D - Chemical Analysis inand PONAGANSET
Plate C “ Mn Si
DU 0.26 0.33 0.02
PBDP 0.14 0.38 0.00
PBDS 0.15 0.40 0.00
PAD 0.22 0.47 0.04
PCDP O.lli 0.41 0.01
PJSS 0.29 0.45 0.10
* Rimmed, semikllled (S-K)
P s Cu N
0.011 0.038 . . 0. .
0.020 0.035 0.16 0.005
0.020 0.030 0.17 0.004
0.021 0.035 0.03 0.004
0.027 0.030 0.10 0.004
0.015 0.040 0.03 0.0045
Table E - Mechanical Properties of Steel from PIEHRE S. DUPONT andPONAGANSET (l-In. Wide Full-Thickness Speci::ens)
Tensile Yieldstrength point, ‘::n~::: Bend test
Specimen Gage, in. psi. psi
DU 3/4 60,200 34,400 28.2 . .
PROP 13/16 52,3oo 31,900 32.5 OK
PBDS 13/16 55,600 32,6oo 31.0 OK
PAD 13/16 59,700 30,500 25.0 OK
PCDP 13/16 54,500 34, 50G 28.0 OK
PJSS 3/4 65,200 37,100 27.5 OK
Typesteel*
..
Rim
Rim
S-K
Rim
S-K
—
Table F - Transition Temperature in “F. of Steels as Determined byVarious Tests
Steel
DU
PBDP
PBDS
PAD
PCDP
~Jss
No.Tests
7
11
11
11
11
11
T. T.,Energy torupture
37
46
60
104
9+
58
T.T.,fracture
appearance
37
46
60
102
55
60
Keyhole V-Notch1/8 in., Hack Charpy Charpyhole S?lW 15 ft.-lb.15 ft.-lb.
. . 107 . . 62
71 .. 9 ..
127 .. 18 . .
152 $. 12 . .
7+ . . -3 ,.
8’9 ,. -6 . .
NavyTeerTest
. .
90
110
150
90
90

TABLEG
PROPER’ITES AND COMPOSITIONS OF HIGH YIEID STRENGTS STRUCTURAL STSSLSUSEZIIN TSE INT’SSTIGATION
sTEEL NO. 1 2 3 4 B** c
TYPE Alloy Alloy Alloy Alloy Mild MildHEAT TF,LATMLNT Quenched & Quenched & Quenched & Quenched & Semi Killed
Drawn*Semi Xilled
Drawn Drawn Drawn as-rolled as-rolled
PHYSICAL PROPERTIES
Yield Strength Psi.Average 66,OOO 80,000 80,000 84,000 36,ooO
Ultimate Strength39,000
Psi. Av@rage 89,OOO 97,000 100,000 100,000 60,000 67,4ooElongation $ in 211
Average 26 22 20 23 26Reduction In Area $
25.5:Average 64 60 60 68 63
APPROXIMATE CHRNICAL COMPOSITION
Carbon .141::~
.16 .16 .15Manganese .?5
.241.45 .27 .77 .48
Silicon .24 .77 .21 .17 .05Molybdenum .42 .16 .48
.05.20 .005
Chromium .60 1.13 .03Zii-conium .09Phos horus .;14 .02
:jl:Olh
su~pgur .023 .02i.010 .012
.021 .029 .026VanadiumNickel .53 2.32 .02
—* Steel 1 was also used in B normalized condition for some of the tests
...——
** Mild Steel Br properties included for comparison*** + Elongation III8 v
TABLE H
APPROXIFATK TdANJITION YEMPIXATUHES OF HIGH YIELD STSENG’fESTIKICTUHALSThkLS DET’hiiNINhO BY MLLNS OF DIFFERENT SFLC11.l&Ns
_.—.._____ _____
STE.hLs1. 2 3 4 B_
TYPE OF SPECIk!hN APPROXIlib.TETSJINSITIONTE,14PL~TlF.izs
3“ Edge Notched -lo°F +18OF -l!220F -lo8°F +21°F
1211Centrally Notched .50F +20°F -95W -102°F +18‘FRestrained Welded +4Cw +75+ _500F
- 65°F +58‘F

Tea,-T..tIJ!ELu
PrOpertieOof Ship Hateneae (Mn/c<3)
Medium, Sedkiid, 48.S-5,Nom.] MiaIIg.-
—— C.m$m
0:5 0!:2 07;80.25 0.42 0.080.24 0.42 0.080.25 0.49 0.040.25 0.61 0.050.21 0.49 0.080.20 0.55 0.100.18 0.50 0.07p: ::;$ :::
0,14 0.46 0.07
tit.”, Y,—
Al N0.033 0, CF34O.rxw 0.0040.W.3 0.W140.034 0.0340.015 O.WJ0.C02 0.005
–O. D32 o.cm5-0. LW2 0.C44-0. cw 0.C04-0.036 0.!3)4-0.002 O.rm
--:,ati;,zi: ,
pip, dkm+h,.8.. m
.,..,.
34,mo 58,04035 ,bw !36,24035,X4 63,20034,9!30 w,wm82,003 67,90033,303 61,41w81,303 59,4c4332,300 57,*C4
,,..e,&——
M&:,.,
;~ :
35.530,034.531.031.0az, o
M;z&.m &&%fn%-.—Lb./i..● f,..lb./k. ● /&i%?.’:*
56,(?W 1140 75052,600 1C+30 86050,WM 1320 ‘aa~48,300 ~;~ ~1 ~51,81XI#&l ,g~ :::
53:000 1550 lgtll56,13C0 1;!:49,X4 70046,4CKl 960 780
ion, Tensile and Tear-Test Pwperties of Ship Plate0.60/0.90 (MnfC >3)
———_ -———— (... ,,,,,,,;,;,, ” O/.———.— —s,.,{, te”,ik ,7
Co.’fi. F, P. T. 3
0.2, “.,” ;:ll “’ Nt,.” c, M. (P.s.,.) (?.>s. [.)
R 0.004 0.000 40,180 88,0300.22 ,,,,0 0.01 0.UU4 0.000
R 0.’22 0.90 {,.03 0.008 0.004 38,83” 63,820N 0.,2 0.9” 0.03 0.008 “.004R ~:;; ~:~ 0:0, 0.006 0.004 .n 0 05 0.W5 0.C43: ::~: ::~ g:y, 0.006 0.003 .::
,,.007 0.00311 0.20 0.74 0.07 U.008 0.004: 0.20 0.7, 0.07 0.008 0.004 ,..
0.1, 0,72 0.08 0.’m5 0.006~ U.19 0.72 0:08 ::~ ::::: ,..
0.19 0.7, 0 o“N 0.19 <!.7? 0.08 0,005 0.005 :::
,..
R ::;; ::[; ::%.; 0, “05 0. “W 35,540 63,400N 0.005 0.004{ ::;; ::~ ::% 0.009 0.00, 40,~0iJ 65,560
0.009 0.00511 [1. Y2 0.8!4 0.07 (1.006 0.0114N “.00C 0.004R 0.22 0.!,,, 0.0, “. 006 0.006 :3,,900 70,470~ 0’22 0’8” ::: o.mM ,,.006 ,..::;; ::}; O.m
–O. W6 0.005 31,370 57, Y70p; :::: p~ 0.028 0.005 31,600 58,000
# –;:;~fi 0.004 37,w” 68,30[1n 0,22 0.81 0..7 0.004 3R,70” 66,40Ll11 0,20 0.75 0.0s –~:~16 0.00, 34,200 C6,200R ,,.,() “.75 0.00 0. W+ 34,0”0 62,000: ::;; g:yj p; –o’m* (1.005 31,780 58,720
0.006 0.004 34,200 60,2000.,7 0.68 ,,.0, 0. w 0. (XM 34,1(10 G0,60U
; [>.1!1 O 77 11.09 -~:;~G 0,00% 35,000 6?,8000.19 0.77 0.07
;0,.0+ 34,70U 64,100
p: ::;; :::; –~:~~ 0.004 S4,500 W2,100
R0.004 36,600 62,000
0.1!) 0.78 [1.00 – 0.006 0. 0[15 35,200 64,900R 0.17 0.73 0.05 –0.000 0.0.5 33,500 02,100R :,:; ::0: :::; 0.[101 0,005 32,750 56,70’9k .&l:& 0. (“M M,m] ,50,000R 0.1? 0.!,(, 0.10 0001 :36.%(, L!5,1OU: 0.3:3 (1.70 0.08 0.005 0.006 87,160 67,120
::;; 0.7, 0.08 0.005 0.006 38,700 05,%00R o,,ti 0.08 0.00!! <>.01J5 38,410 68,800: :::; :]:;j 0,08 0.00, 0.005 ,..
0,{,,, 0.0[)7 0.005N ::fl ::;: 0.00 0.007 0.0[15 ,..R (,.00N
0.014 0.00$g:~ g:;] ::OIJ :::;: 0:00,
E o 005 39,410 87,620N 0.22 “,7, O., g 11.nM 0.00s: 0.19 0.6, 0.06 0.009 ,, 00%
0.19 <,. (;$) 0.06 0.009 0.004 .:0.1” 0.6, 0.00 0.014 0.003 38,580 64,020
~ 0.1, “.69 0.[1(, 0.014 0.003 ,..R 0. M? O. 0[1.$ 36,580 66,780k, 0“4 “’7” “o’ 0.007 ().004::~ ::y: :::;R 0.012 0.004 ,..
0,012 0.00!: u.,, 0.70 (1:03 o. m!, o, m?, .38;1’1o 04;4%: :::: ::: :.: (mom 0.”04
0.2, 0.87 0.”, 0.000 ,,.004V 0.24 (1 87 0.”7 0.008 0.004R 0.24 [1.87 O.”, 0,007 0,004
~:fi ~:~ ~:~~ 0.007 “.004 .: 0.017 0.000 40,140 66,800N g:;: :.7: 0.ol 0.017 000(!: “,20 ~,v, ::): “.00!3 0.00,
(,.000 0.00{: 0.20 0.75 [1.0, <,.012 0.008 ,:: .:
0.20 0.75 O.lm ,,.012 0,008R O.lg “.7% 009 0.016 0.005 “:
0.19 (,.72 0.0!1 0.01, 0.00J: 0.18 ,,.75 0.08 0.012 0.00:
0.1” 0.75 0.08 0.012 0.005R ml: ::?; 0.0,! 0.009 [,.00: ,..x “,21 ~,8, ~:~? 0.00!4 0:005 ,..R 0021 0 “08 38,850 63,820N 0.21 0.81 0.07 0.02, “.006R 0.18 ..71 0.02 0.004 0.00: 33,3io 6i, iio
0.18 0,7, 0.0, 0.004 0.005[ 0.21 0.86 0.08 0.007 0.005 30,390 67,:20
0.21 O.M 0.08 O.(M7 0.005R 0.21 ,.7, 0.0,
,..0.007 0.006 38,260 65,710
N 0.21 0.7s 0.06 0.007 0.00;~ ;:;[ ~:~ ~:~~ 0:007 0.007 37,160 66,130
0007 0.007 ,..R 0.21 0.90 0.08 U. IIIIQ, 0.Ll)5N 0.21 0.90 0.08 0.CWi o.CKM
Steels, Medium, Sernil.il.
0.6,,,,.—. ~ —8T::,,;y
El## load,. ,. 8t.rf*L*../<n, ,,. lb,,)<”.
27.6 55,700 ;j~~,8,900
31.7 57,100 1530
:g,jl: ;:;:,..
57:000 ;~f~g}~:: ,280
5a:1uo y};54.1(1053,800 :;32~52,QO054,000 ;;~~
31.7 5,,800,.. ,5,100 ,420
30., F&mm logo,.. 64,800 1130
J4,1OO y:52,400
28.0 57,000 114057,500 ~~~~
32.6 52,!70031.8 53,000 1360:::j 58,200 1190
56,W0 ;L4g30.0 m:;::31.0 105032.4 51,500 117033.5 53,600 1360:::: 51,50” y&
W,rloo28.0 67,200 123033.0 53,900 122033.5 53,600 1210:32.0 55,100 1190:<2.0 52,100 [Z&33,6 52,70029, .5 ‘5,,300 ,0,020,8 56,000 1080X.7 55,300 p::4:X2”) ,5,200
E2,600 122053, s00 ]::354,30053,800 14605:3,200 140054,000 1700
3,,, 55,200 1:{30.,. 56,700 15s0
52,000 1Z405,,700 y:,..
27.5 ,0,90050,200 1410
30. s 54,300 126054,700 147054,7G+l ::;:54,400
.0,2 53,700 ; :Oy:$::: ,360
,..F’2,9~ 127051,900 :j;:
30.() 53,700w900 ; :;[50,00050,900 ;;:::#OJ ,40”
54:200 1s105?,80” [ ~o~49,800
,.. 51,200 y:53, 10[1
,.. ,.. ,..33.5 52,600 1420
51,300 134032.7 :$yll) : :;:
30.5 67,000 157054,300 ;~;~
28.0 54,60053,400 ~~~
31.0 55,600p;:g :4&g
56:2.Xl %640

i:.rnno.ition, Te.sile and Tear.lcst Properties of Ship I>laLe Steels, Medium, Fully IGlled (Si or .41)

40 -
30 .z
ii -mma>20 .w KK muz
E
III #
I0.
Oa ..
FIG. 1. The transition.in ...vJ absorptionand
fracture.w?ar.nce in the Ch:wpykeyholeinpct q!echen. steel Dr
.-200 –160 -120 ’80 -4U u *U Ou
TEMPERATURE, “ C
FIG. 2. The per cent md.ction in area versustemperatureof testing.steelE.

. ..43. w, ..,,,
,,6.,,,’” .,.., r,, mm,., Mm,
.25
●.
!
●●
x to -
~❑
3:.15
z
6
$~ .C6-
Klw , I ( , 1-200 ’160 -120 ’80 -40 0 40
TEMPERATURE, - C

se.),.,. ,.
,0—————
i
,//
%/,6+ ‘ ‘~’J7 ‘ ,,.
3,,.L“
,,,,.,.,,,.,,,..=,,
-. I
‘?.
- ,,.,.,.,;,,.,”,, ,,, >”4
.<,,..: ( ,) m “1, {,,,4””. “.ri..l r“!!., U..-io!o!.. O.WJ, ., , ,0 “.504”. . O.w .*II 1!- .I.. d-.
~:;xl:,i,:,:: :: , :+3,, ~u“,, ,1,,...,,... ..,!..1 (-!!!! 11.=-i-. - O.W .! . ~“ 0.-,”. - ..- ., ~,,) ,,,...,,,,.,,. 1. 2 “ml 3: , . ..e,m. . 0,002, .L-A”.mo 4. s .-4
.! 1 = “.ul-h. . O.IW
FIG. 7. t’ahew..fnominol biariat pmpernie. with tempenza.re

F’Irl. Ii, Slow bend test result,s.

\.
\’h
‘o \ (●\O\A
\*
’98
[
O\
\
● 9 \<
NOlldtiOS6V A9WNI
b
+
NOlldHOSW A9WN3

—
—
I
;,.
\
<
)’8’V) H91ONMO13E NOllWUINOO%+
(3) 39VAV313 % +

1 I I
‘-’20‘ =++21-
-200*
F200
:
160m-1
4L
>J20wawzw~ 80~~
4
.:0
o 100 200
PER CENT ELONGATION
ABc
—D
/
-’j
FIG. 1’7.
UNSTRISPEClkSPEClhSPECIN
;SED SPECIMENS:NS STRESSED AT 29,700 PSI:NS STRESSED AT 10,000 WI.NS PRESTRAINED IN TENSION
I I I) 120 160 200 5
TEMPERATURE, ●F
:cffect.of fatiguecm n.t.he<i1~.pmctst:ength.(Znd,,,tnce
% 000 p.s.i.)limitof notcl,cdspecimeneappr.x.. ,C,. TV. B - 105,000CYC1.CSof stress.Curvez - l,OLX!,000cycles.

120
6 1? 1,
IMPACTING VE;OCITY, FT/ S;C
FIG 18. The transition teroperature versms impacting velocityfor selected pm ject steels 1“ tension Impact.
AdaPted from Bmckner and Nekmark, (24).
6 12 18 24IMPACTING VELOCITY, FT/SEC
FIG. 19. A Sll~Eested extrapolation of the curves of F>g . 18.

ILo
130
1-
50
.-
1 I I
6 12 18
IMPACTING VELOCITY. FT/ SEC
FIG. 20. Suggestealvariation of transition temperature in theCharpy V-notch impact test with impacting velocity.The two experimental points were determined reSpectivelyin slow bending and impact bending.
“s:
—-----77’- -!? @zz1-IL
SCATTER!! REGION ,1,
/VAI –~
W IDTH
FIG. 21. Influence of specimen width on absorbed energy atconstant temperature.

I
1 I*.,,S,cc,m,.s ..,,24 !.ch.s b.,
HW,s.. . . .
%r-H3/4
,. --- 3/4
I I [I2. I I I
1
FIG. 22. Form of Taylor Model Basintensile test :;pecimens.
3.3
20
10
0
.%,. L/wFIG. Z&.211scid R#IOd bngib.!%1 10Width d Plateon
berg, AhM2bd. Re~b Am for Steel E Spxime,r., Notchd
With a Jeweler,, Sw
r-LeT‘--iFIG.23. Detailsof slot-T.ylor
Model Basin specimen
60
/ “ 314,, Di.5
50.
1 1 +
: 0.08. Dim7—
J . %w /
10
J,.,!w, S.2. c., - . “1 I
r .L/w - 0.24
-% “ m . . --- ,=


}----------+ --l------i
Lm
IL
I
b-u

=ii+- . ..
?-:. -= . . .. . Z;;:.::+,;,,~: 4!IRMB
=~’-’ ‘“l’ ‘“’”- ; - “ 1’:’” ~“~” ~ =—-----’s:. ,
.-,.
~-c.. :;4uiiiiE - w...::; ..-..._.,&-,... .._9>. ,...&L..._..,!% -,,::.%.-.=.----=:,,,: ,,.;&%-,..........*.“__J@Ei:
.=.s_.,..,
!,.
.

4! II II ‘“”””-“““ iA%;z—---[..N\,,
</?055 SECTION Of SPfC1l’fEN 5u8J[CT[D TO
RXIRL LORD nND IN TEKNRL ,-efs5uf[-,. ,,CC,M.N
~...;
CROSS SECTION OF SPECiP7FN B 5UEU[CTED
TO lNTIRfl#L PRE55URE ONLY (SPECIMEN
HORIZONTJI)
LON61TUDIN.LU SEC770N W 5&EClP7CN SUBJECTED
TO @Xl??L LO.QO RND INTERN17L PRESSURE
FIG. 32. Sections of apparatus for tests of 201’ I)iaiwtertubesat low teriperatures.
UD-7,
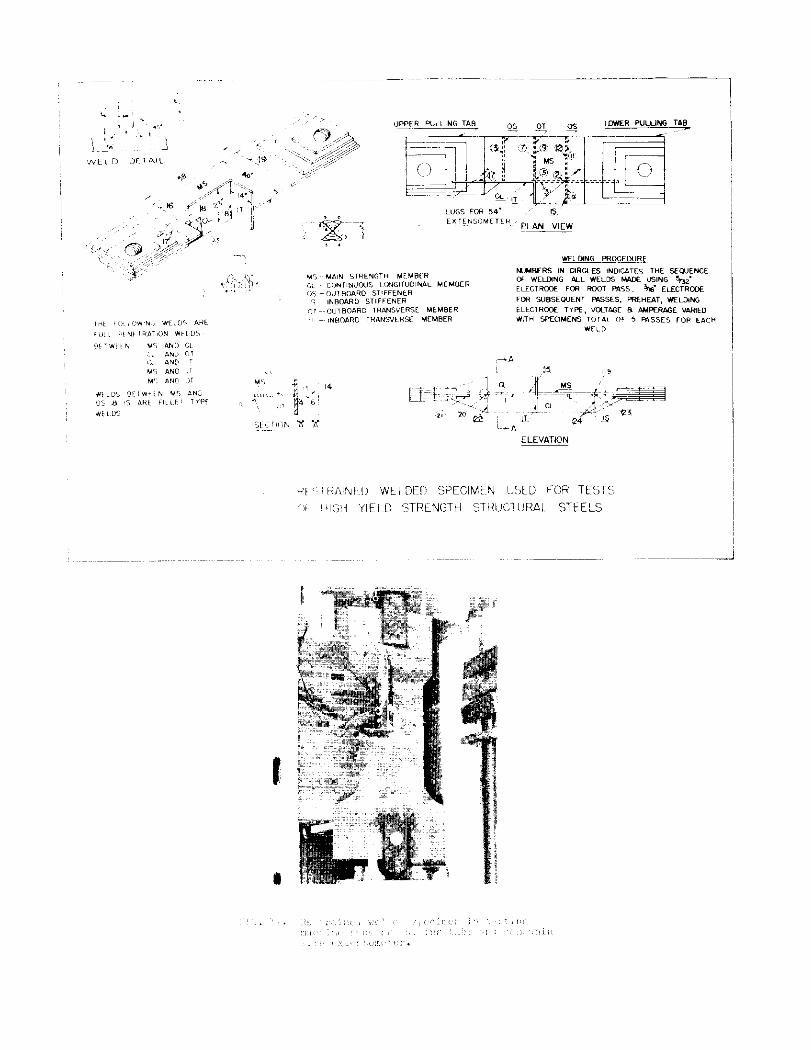
,,. ...,.. ,,,.,:,,, ., .,..


STAN DARD LH SPECIMEN
KEYHOLE NOTCH SUMMARY60 - —> QH
/ /“/
/
:’ 50
J
;.z 40Q(-aK0~ 30
<
$
: 20 Q/
I I ,,_-_— ——El I I 1
-200 -160 -120 -80 -40 0 40 80 120 160
TEMPERATURE OF
FIG. :3(,. r,,r,ol!, ,,,,. )! !lu. T,lry,
/“ -’-..120 / ,/---
——.
3TANOARD LH SPECIMEN
100 V-NOTCH SUM MARY
timA
a/
$
m<> 40 –- , -LJ /Wz.
/20
-. —-120 -80 -40 0 40 eo 120 160 200 240
TEMPERATURE 8F
,:,. ?:. ,-!:.!.<:1. ‘2:$:..=,<

FIG. 38. L~wgy absorption, fracture appetiramce, and
l:1ter21 contraction w. testing temperature forV-no.ch milled and V-n~~*.chpr=sed (bothSchn:adtmodific;a’.ion) L’harpy imp:~ctspecimens.;Milclsteel. (Ref. (14))
1:101010101010
;810
~tiwTreatment
R. T., 1 h,.R.T., 6 hr.R,T.. 12 b.R.T,, 36 hr.R.T.. 1 wk.R,T., 4 wk.R.T., 1 hr.R.T., 6 hr.R, T., 12br.R. T., 36 hr.R. T., 1 wk.R.T, 4 wk.250” c., ~1,hr.250 °C., ltl, hr.2Xi” C.,4hr.2W” C.,30 hr.
Steel A257. 50$!%
30– 1: 35
20 3535
:40204015 4515 35
45:46
451:70 1%55 ‘a555m70 106
TransitionTan:, :F.
257. 50%40
k! 4010 3510 45
352 4536 502025 2m 45
35 ““65 Ew 95
6; 05
FIG. 39. ~hdrF”~\~_I,LJtChinip:,c~trdns iLion Lerhperature
inOF at 2,5 ~,rla 5~~nlmi[llU,lenergy~itwrpticmfor
specimens preslr:,ined in compression. ROT. is
room temperature. (Ref. (35))

10
t-200 -1
Ah’ Co)led f,-,1650 F. X 16.
*Z.*+
*.,..,.-m >....--
“ ..i--——-......- m ,...+ ,*_. ... ....— ----- . <.*L<*4?$:#=awJr-.?+,.:,;,-,;,.,
--a.~.-..:...r —.
c Furn.ce cooledf,.,, 1850 F.x 100
,. Air U,.ld . . .1?5J !:. x 100
, .-
U. Furnace cooledf,.. 1850 F.x 600
STEEL N +
.-d
So)
(2)(3)/
.
I
l—
+
Ill~u~
-120 -80 -4U o )
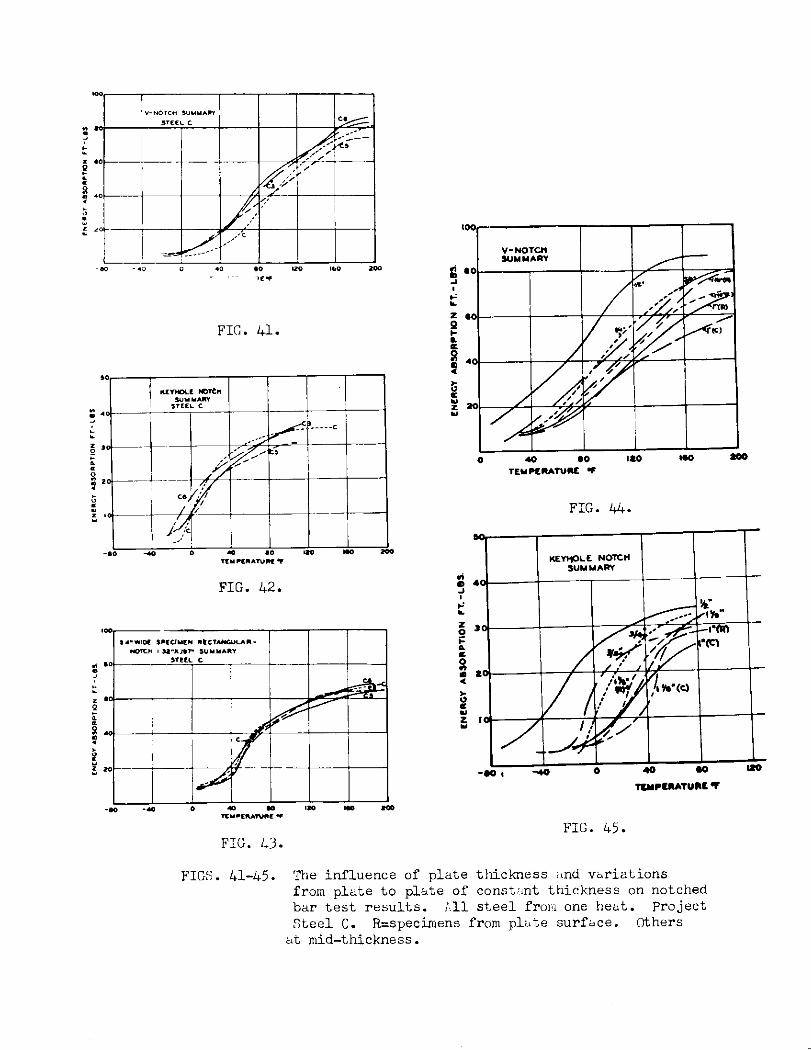
FIG. Q.
FIG. 1+2.
FIGS. Q-45. The influence of plate thickness ~tndvariationsfrom plate to plate of constimt thickness on notchedbar test results. :11 steel from one heat. ProjectSteel C. R=specimens from plate surface. Uthersat mid-thickness.

STE
7
J12’’PLATE
1
3“PLATE.
/’
JRESTRAINEDWELDED
-40 -20 0 20 40 60
4AVYrEARrEST
● 4
4
;LOWIEND
OHARPY v
KEYHOLE
v
1
+ATCH20RNER
/
[
●
● ☛
) -40 -20 0 20 40 60TEMPERATURE, “F
FIG. 46

sTEEL C
‘2” PLATE
,J●
‘PLATE
[
●
●
●
~
PLATE
[
●
/EsTRAINEDMELDED ‘
NY /[ARisT
f
I I
iARPY
KEYHOLE
iATCH;oRNER
/
1201! )0=6090120 I
-30 0 30 Go ‘0TEMPERATURE, 0 F
FIG, 47

STEEL A
J72’’PLATE
2“PLATE
J,
5“PLATE
J,
{ESTRAINEDNELDED
NOT TESTED
) O 40 80 120 160 20C
NAVYTEAR m“
3“TEST
●●
●
go
● ,
)LOW3END
l!!
;HARPY
~~
●KEYllCt
A V-NOTCH
:’
A 0°L
k●
iATCH:ORNER
NOT TESTED
o 40 80 120 160 200TEMPERATURE, “F
FIG. 48
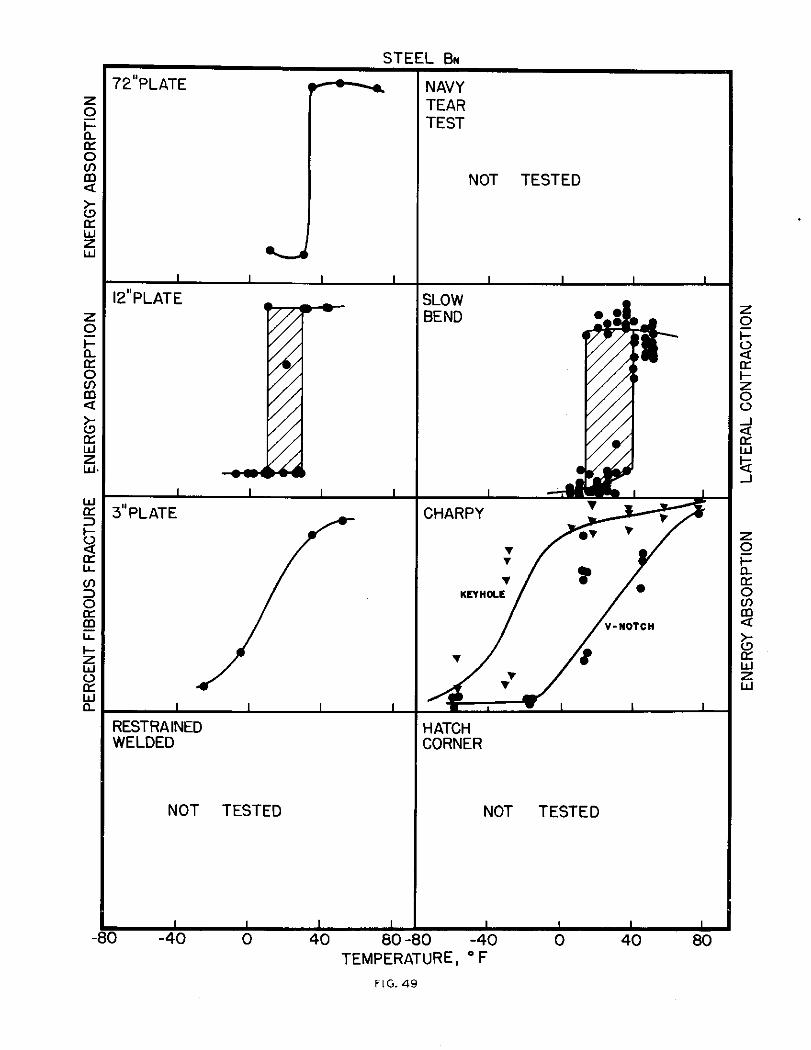
STEEL B.
72’’PLATE
I I
12’’PLATE
?ESTRAINEDWELDED
NOT TESTED
1 1 I I
I -40 0 40 80-
tiAVYTEARTEST
NOT TESTED
iLOWIEND A...*
IiiF
iATCH;ORNER
NOT TESTED
1 I 1 1
) -40 0 40 80TEMPERATURE, 0 F
FIG.49

STE
72’’PLATE
J’12’’PLATE
o-a
3“PLATE
NOT TESTED
,
?ESTRAINEDMELDED
NOT TESTED
~80 -40 80 120 1(
Ih
SLOWIEND ●
;HARPY +. KEYHOLE
4v
Y WV●
6
●Vv
V-nolcn
+ATCH;ORNER
NO- TESTED
-80 -40 0 40 80 120 I
Lzwoofwn
TEMPERATURE, “F
, FIG, 50

2“PLATE
?“PLATE
J
●
1 I
!UPLATE
NOT TESTED
1 ,
?ESTRAINEDWELDED
NOT TESTED
, I
-3o 0 30 60 90 -60 30 0 30 60 90TEMPERATURE, 0 F
FIG. 51
WYEAREST
v’●
● V-m’rctl
●
,
+ATCHCORNER
NOT TESTED
L

.,-S72’’ PLATE
12”PLATE
7-
1 ,
“PLATE
NOT TESTED
ESTRAINEDlELDED
NOT TESTED
o 30 60 90 120 150.
.L L
NAVYTEARTEST
(
●
SLOWBEND
,?!.
● e●
i ●
●
>HARPY
w
IATCHORNER
NOT TESTED
1
0 30 60 90 120 15CTEMPERATuRE, “F
FIG. 52

STEEL H
2“PLATE
1
/’PLATE
?ESTRAINEDNELDED
NOT TESTED
90 -60 -30 0 30 60TEMPEF
IAVY“EAR‘EST
L ●
$
;HARPY
T●ee
T-●
●●
LL●●●:
d ,
KEYHOLE
T
Y
*
-IATCHCORNER
NOT TESTED
-90 -60 -30 0 30 60URE, “F
FIG. 53

ST
72’’ PLATE
2“ PLATE
r-’
f’PLATE
(
ESTRAINED/ELDED
NOT TESTED
-200 -150 -loo -5(3 () 50+
NAVYTEARTEST
NOT TESTED
;LOW3END
● OO
,,,1,
●
●
●
●
;HARPY
sIATCH;ORNER
NOT TESTED
-200 -150 -100 -50 0 50TEMPERATURE, “F
FIG. 54

UV48MTONIN KWLWL ‘STRESSWtltl WIDTH06
..-.
U4RUTU2V IN W STSt39 WITH WIOTH OF PLATE- TESTS AT 327
FIG.55. Wide plate test results.

HATCH CORNER TESTSMAXIMUM NOMINAL STRESS AND ENERGY ABSORPTION
(ill teSts ~t 70°F.)
3Pf:l- CESIGN MAXIMUM NOMINAL STRESj -PSI
FEATURE t’ , ‘?m” I “’r’”” I ‘P I I “Y I ‘“~
5 BAslc CEslai
CCWTINUWS27 LCNGITUCSNAL
GIRDERWSSET FtATE
28 RHNFC6CEMENTU.SC.G, CCOE 5
,E4MZ AS 3029 EXCEPT NO
CX2UBLER
30 US,C.G COOE I
31 BRITISHMODIFICATION Z///H/////H/// fl/Z!!%ZA
JBASIC DESIGN
32 +&&&i
I ~ANGLE BRACES~ I,.. ..——b- ‘ Wl!coo 1 2W+xa ( 3.C9J!’X.3 ‘ 4,C43XI I 5W4X0
I6&
1’
ENERGY ABSORPTION - IN LB.
vH%z+zzzz22vzz23MAXIM NCMINAL STRESS ENERGY ABSORPTION
FIG. 56.

[PUN .IJWER OEM
FW57. Pierre S. DwwIt,,-Pkm tiew Of the upper deckdww% the plate rern.oedrfmk testing and the .djacertc
The ma.k SE-L.. i. . weld . . . . ,.. comer ., N.. , ,.,., .md w“..= ., ..”.3,., !,,*. . . . . . . i..o,”d . . . . . .“..,,,
n
ana STANDARD TENSILE BARS
;jikkb.,8..,, ,6 ,, M,.,.
,,. ”...,, 0,,.
STEEL OU
Fig. 58 .“Pierre S. Dqwmt,,—Smr@e from deck plate C-10aowillg IOc.=tion of t.., ,pe.i ?neru

40Key to Fracture Appearance
.= Fibrous.4
0 Gron.lor ●I 2~. _ e Mixed
%’Steel DU
o@
40
20
0
FIG. 61. Twelve-inch wide specimens. Results of tests of
samples removed from fractured ships. 3/L m 13/16inch thick pl; ,te.

lCMPC,AT”,E o, ,,,, -,,
FIG, 62a ENERGY TO MAXIMUM LOAD vS. TEMPERATURE FIG.626 ENERGY TO FAILURE VS TEMPERATURE
RELATION FUR RESTRAINED WELDEO SPECIMENS RELATION FOR RESTR AlNEO WELDSO SFECIMENSOF HIGH YIELO STRENGTH STRUCTURAL STEELS. OF HI(3I YIELD STRENGTH STRUCTURAL STEELS.
RESULTS w ,,,,s w ,,..,.,.s MA., m.. .,,, Sr...,,,”,,s ,, ,.s,, 0, ,,,,, !4,., MADE m.. ML. ,,,,, .,..WI,. ..6020 ELECTRODE ARE s“,.. ,,, ,..,.., s0..,.602, .Umnoo. AR. ,.0.. m. .,?4,.,,,0..
~j.j~~r-~j
~~~~’wu- “-: ]::““, .
;’y;,~ &
~’~’”k ~l’mr+-y~j
“.” s,. ‘::7:,; “4”s”=..
“,.. ‘~~
X::o”::,,o
. . . . .
.+
.,,. . . . .4,
,6.,,.,,%., ., .. . . !m. ,-.10. 63 T..WT,ON TEM.ER.WRCS ,,. “,,,.s s,,,., 8 .,,. m,., B
.s .,,,.. !... ❑“ ,2. GE.,,..., mm.., ,,,,,.,.,

D E
!00
,..
,2.
~m
~;,


350
300
MA X, LOADFRACTURE 270,800 LB5,
250A I I
8-- ...1.... I-V IS. CRACK 240,000 LBS.
! I I1I
J
2W , - -.
. Ia 1.
; ‘!I “ , ,
150 —,
,
,
I
100 !
-#T=
ENERGY TO V15. CRACK 7,700 lN, L6S. 1
ENERGY TO MAX. LOAD
ENERGY TO FRACTURE }32,900 IN. LBS.
.— ——,
1 , II50 -—
,
,,
0 ~.1 .2 .3 ,4 .5 .6 ,, .8 ,9 ,,~ ,,, ! .2
ELONGATION- INCHES
LOAD-ELONGATION CURVE
SPECIMEN BN 21-I (l°F, O% SHEAR)
350 1 1 I
MAX. LOAD 324,800 LBS.
~
300I
v I \\
,
d250 + \
V15. cRACK 235,500 LBS.
I \
200 ~-- —.
)
: ;
: T
150 :
~
100 — —ENERGY TO VI S. CRACK 4,900 IN. LBS. \
ENERGY To MA X. LOAD 110,000 IN. LBS.1
I IENERGY To FRAcT”R~ 290,000 {N. LBS,
- — I
I 11111111II
50 ; I
1 FRACTURE (
40,000 LBS. ?
1 I
Ii ( I
0 ‘I
1.2 ,3 ,4 .5 ,6 ., ,B ,9 ,,~ ,,, ,2
EL0NGA710N - INCHES
LOAD-ELONGATION CURVE
SPECIMEN BN 21-20 (30° F,10070 SHEAR)
FIG. 70. Twelve-inch wide flat plate tests. (Ref. (28))