Embed Size (px)
Citation preview
CORRELATION OF LIQUID VISCOSITY AT THE NORMAL BOILING POINT1
G J Smith2 3 W V Wilding4 J L Oscarson4 and R L Rowley4
1 Paper presented at the Fifteenth Symposium on Thermophysical Properties June 22-27 2003 Boulder
Colorado USA 2 Design Data Laboratory Eastman Chemical Company P O Box 1972 Kingsport Tennessee 37662-5150
USA 3 To whom correspondence should be addressed E-mail jsmitheastmancom 4 DIPPR Thermophysical Properties Laboratory 350 CB Brigham Young University Provo Utah 84602
USA
ABSTRACT
The importance of liquid viscosity in chemical process design makes it one of the most
measured transport properties Nevertheless of the 1893 compounds in the DIPPR 801
pure-component database liquid viscosity and its temperature dependence (at 1 atm or 01
MPa) have been predicted for nearly 50 of the compounds because no experimental data
are available Unfortunately prediction methods for liquid viscosity often fail
significantly particularly near the normal boiling point Moreover experimental data
measured at lower temperatures are often extrapolated to higher temperatures with
erroneous results To improve liquid viscosity prediction and extrapolation of
experimental data to higher temperatures we propose an empirical rule for estimating the
viscosity of organic compounds at their normal boiling point ηLb The proposed rule
developed and validated with the available experimental data in the DIPPR 801 database
was applied as a quality control check on the 1893 compounds in the database and was
found to improve the available temperature dependent viscosity correlation in the database
for 250 compounds Of particular significance is a smooth trend within chemical families
for the value of the viscosity at the normal boiling point
KEY WORDS correlation data empirical rule extrapolation liquid viscosity normal
boiling point prediction
1 INTRODUCTION
The importance of liquid viscosity in chemical process design makes it one of the
most measured transport properties Liquid viscosity has a direct and large effect on heat
transfer coefficients which are especially important for heat exchangers and various other
heat transfer considerations and are also somewhat important in distillation calculations
Viscosity data are also essential for calculating pressure drops as for pump and piping
calculations Nevertheless the DIPPR 801 database ndash one of the worldrsquos premier
databases for physical property data for chemical engineering applications ndash still contains
predicted liquid viscosity data for nearly 50 of the compounds in the database due to a
lack of available experimental data
While many prediction methods for liquid viscosity (ηL) have been developed over
the years Poling Prausnitz and OrsquoConnell point out that ldquolittle theory has been shown to
be applicable to estimating liquid viscositiesrdquo [1] Therefore most estimation methods are
empirical in nature We have found that often these methods fail significantly particularly
near the normal boiling point Moreover experimental data measured at lower
temperatures are often extrapolated to higher temperatures with erroneous results
To improve liquid viscosity prediction and extrapolation of experimental data to
higher temperatures we propose an empirical rule for estimating the viscosity of organic
compounds at their normal boiling point ηLb The purposes of this paper are to present this
empirical rule and its historical background to document the rulersquos validity and wide-
ranging applicability to demonstrate the surprising variety of ways in which the rule has
been found to be useful for improving the liquid viscosity correlations in the DIPPR 801
database and to propose the use of the rule as a starting point for developing a quantitative
structure-property relationship (QSPR) correlation for liquid viscosity
2 THE EMPIRICAL RULE
The empirical rule in its simplest form is that the liquid viscosity for most organic
compounds should fall within the range of 015 to 055 cP at the compoundrsquos normal
boiling point Standard methods available for establishing the rest of the viscosity-versus-
temperature curve can then be used to obtain viscosities at other temperatures providing
that they are consistent with this empirical rule (Note that 1 cP = 1 centipoise = 0001 Pa
s = 1 mPa middot s)
Recent work within DIPPR Project 801 has shown that this rather simple empirical
rule is remarkably powerful in practice essentially serving as a ldquomissing linkrdquo between the
regression extrapolation prediction and evaluation of liquid viscosity data for organic
compounds as we will demonstrate
3 HISTORICAL BACKGROUND AND VALIDATION
The idea of using the liquid viscosity at the normal boiling point (ηLb) as a
correlating parameter for liquid viscosity data is not a new one in fact its use can be
traced at least as far back as 1918 when according to Partington [2] Arrhenius suggested
the relation
LbLb C ρη = (1)
and reported that the constant C varied from 023 to 032 where ηLb is the liquid viscosity
at the normal boiling point (in cP) and ρLb is the liquid density at the normal boiling point
(in gcm3) Note that if one utilizes the fact that ρLb generally falls within the range of 06
to 13 gcm3 for most organic liquids then it is seen that Arrheniusrsquos equation would
typically yield ηLb values in the range of 018 to 036 cP (Gambill [3] later proposed the
use of an average value for C of 0275 which would yield ηLb values in the slightly
narrower range of 021 to 031 cP)
Some 25 years after Arrhenius Friend and Hargreaves [4] proposed the ldquorheochorrdquo
method for estimating ηLb The rheochor method is a group-contribution method which
correlates ηLb with both ρLb and a ldquorheochorrdquo term determined from the summation of
atomic-group contributions based on the atomic groups present in the compoundrsquos
molecular structure
In 1959 Gambill [3] after reviewing the earlier correlations of Arrhenius and
Friend and Hargreaves proposed two simplifications Gambillrsquos first simplification was
mentioned earlier the use of an average value for C of 0275 in Arrheniusrsquos equation
Gambillrsquos second simplification went one step further saying that one could assume that
ηLb = 029 cP for all organic compounds and that the accuracy of this assumption would
usually still be suitable for most engineering calculations
Grain [5] later proposed that instead of using the historical methods described
above for obtaining a value for ηLb one could use the following categorizations for ηLb
bull Alcohols (aliphatic and aromatic) ηLb = 045 cP bull Primary amines (aliphatic and aromatic) ηLb = 045 cP bull All other organic liquids ηLb = 02 cP
Exceptions benzene (use 03 cP) and cyclohexane (use 04 cP)
Grainrsquos categorizations however appear to be of questionable validity An examination of
the experimentally-derived ηLb values [6] in Table I and Figure 1 shows that there is
probably as much variation in the ηLb values within one of Grainrsquos categories as there is
between the different categories For example from the alcohol curve in Figure 1 it is
seen that Grainrsquos assumption of an ηLb value of 045 cP is a reasonable assumption for
alcohols such as ethanol propanol phenol and perhaps butanol but the 045 cP
assumption gets progressively worse at higher carbon numbers If one were considering a
wide range of alcohols one would be better off to assume a much lower value on average
Similarly Grainrsquos value of 045 cP for amines seems to be unwarranted and 02 cP for ldquoall
other organic liquidsrdquo seems to be a little low overall It appears that Grainrsquos
categorizations may have been based on a very limited set of compounds While the
attempt to delineate a ηLb rule by specific chemical functionality or other molecular
characteristics seems to have merit our analysis of a wide variety of compounds suggests
that Grainrsquos recommended values are neither as valid nor as discriminating as one might
hope and in most cases a better value can be obtained by the straightforward application of
the trends discernible in Table I and Figure 1
Table I provides a comparison of three of the historical methods involving ηLb the
rheochor method Gambillrsquos 029-cP assumption and Grainrsquos categorization method
Table I shows that at least for the given set of compounds (a set chosen to include
representatives of the most common families of organic compounds) the rheochor method
is the best of the three methods while Gambillrsquos and Grainrsquos methods are practically of
equal accuracy (Choosing other ηLb values for the ldquoall the samerdquo assumption it is found
that the average absolute error is minimized at 232 when ηLb = 025 cP)
Some additional observations from Table I and Figure 1
bull Table I and Figure 1 clearly show the validity and general universality of the proposed
empirical rule
bull In general compounds with greater hydrogen bonding have the highest ηLb values
while the alkanes have the lowest ηLb values
bull Out of all of the compounds covered in Table I and Figure 1 only methane and
ethylene glycol fall outside the 015-055 cP range of the proposed empirical rule
bull If the rule is tightened to the slightly narrower range of 02 to 05 cP the outliers are
the low-boiling compounds methane ethane ethylene and propane on the low end
and the highly hydrogen-bonded compounds formic acid ethylene glycol and 14-
butanediol on the high end
bull There is an interesting overall trend of ηLb values decreasing with increasing carbon
number within a given family of compounds In fact many families appear to be
asymptotically approaching a value of about 022 cP as carbon number increases
Despite the long-standing history of correlations involving ηLb the idea of using
ηLb as a correlating parameter for estimating liquid viscosity data seems to have fallen into
relative obscurity in recent decades For example after being prominently featured in the
first edition of the book by Reid and Sherwood [7] the idea was only obliquely mentioned
in the third edition of the book [8] and not mentioned at all in the fourth edition [9]
However the fifth edition of the book [1] reviewed the method of Sastri and Rao [10] for
estimating liquid viscosity versus temperature a method which is based in part on a group
contribution method for estimating ηLb With only minor additional effort one could use
the ηLb-predicting part of the Sastri-Rao method as a means of refining the range of the
presently proposed empirical rule for a particular compound of interest
The first author of the present paper and others at Eastman Chemical Company
have been using the proposed empirical rule (or slight variations of it) for many years and
have found it to be quite useful Since being brought to the attention of DIPPR the
empirical rule has been further investigated and validated using the DIPPR 801 database
and the rule has proved useful from several different standpoints in the work of DIPPR
Project 801 as is detailed in Section 5
4 APPLICABILITY OF THE EMPIRICAL RULE
The proposed empirical rule is presently recommended mainly for organic
compounds containing carbon hydrogen oxygen nitrogen and chlorine However Table
I also includes some organic compounds containing bromine which also obey the rule
Additional preliminary investigations by the authors have found the rule to also be
applicable to other types of compounds ndash including surprisingly even some inorganic
compounds such as phosphine (020 cP) water (028 cP) hydrazine (036 cP) and sulfur
dioxide (043 cP) The rule has also been found to be applicable to glycol ethers which
suggests that the rule is valid for multifunctional compounds (compounds containing more
than one functional group) in addition to monofunctional compounds although this should
be studied further Several brominated andor fluorinated organic compounds have been
found to have ηLb values slightly higher than the rulersquos range falling typically in the range
of 05 to 06 cP
5 USE OF THE EMPIRICAL RULE TO IMPROVE THE DIPPR 801 DATABASE
New compounds included in the DIPPR 801 database must satisfy 28 quality
control checks designed to ensure that properties for the compound are thermodynamically
consistent reasonable and satisfy known trends and relationships In the past no quality
control check was available for ηL or ηLb We recently implemented the ηLb rule as an
additional quality control check and have examined the DIPPR recommended correlations
for ηL for all compounds in the database using the rule The check produced 401
compounds out of 1800 that failed the ηLb criterion
We have reviewed the raw data and DIPPR correlations for all 401 compounds that
failed the quality control check In 151 cases no change was made in the correlation
either because sufficient quality experimental data were available to classify these
compounds as exceptions to the ηLb rule (these were mostly inorganic compounds) or
because no better values could be obtained from the limited data available (often only
estimated data were available) Changes were made in the other 250 cases as guided by
the rule Requiring the value of the viscosity to satisfy the rule often made significant
improvements in the viscosity correlation and assisted us in evaluating conflicting
experimental data sets The kinds of improvements made in the database correlation for
liquid viscosity by use of the ηLb rule can be grouped into four categories
51 Improved correlation and temperature range
The ηLb rule aided the regression of the DIPPR liquid viscosity correlation for a
large number of compounds In many cases the correlation had been developed from data
at temperatures much lower than the normal boiling point and extrapolation of the
correlation to higher temperatures produced values that failed the ηLb test The ηLb rule
allowed improved correlation of the liquid viscosity data with appropriate extrapolation to
higher temperatures Examples of this kind of improvement are shown in Figures 2 and 3
for n-heptylbenzene and nonylphenol respectively Note in Figure 2 that although there is
considerable experimental data for temperatures below the normal boiling point (NBP) for
this compound extrapolation to the NBP with the previous regression produced a value
that did not satisfy the quality control test The improved regression satisfies the test and
extrapolates reasonably to the critical temperature In Figure 3 the minimum in the
previous correlation was eliminated by addition of the ηLb criterion
In some cases the number of coefficients used in the DIPPR correlation caused this
data range problem and application of the ηLb rule provided clear evidence of the incorrect
regression In these cases the slope (ln(ηL) vs 1T) of the last few points was used to
extrapolate ηL to the NBP and a value was obtained consistent with the rule even though
the correlation itself failed the quality control check
52 Improved evaluation of experimental data sets
Application of the ηLb rule in several cases aided in what we believe is a better
evaluation of available experimental data sets Some data that had been evaluated
previously as either less accurate or unacceptable were found to be more consistent with
the rule than some of the previously accepted data Often that evaluation had been based
on the relationship of the experimental data to what was then felt to be the best temperature
correlation Figure 4 for n-hexylbenzene is an example of how the rule assists the
evaluation of disparate ηL data Note that some higher temperature data that had been
previously rejected because of their deviation from the previously used correlation are now
deemed acceptable because of their consistency with the rule
In some cases data reported in the literature subsequent to the last review of the
compound were obtained that agreed with the ηLb rule for compounds that failed the
quality control check For example shown in Figure 5 is ηL as a function of temperature
for 16-hexanediol In this case no previous ηL data were available and the van Velzen
[11] method had been used to predict the values As can be seen the predicted values
failed the ηLb test but the experimental data of Lech et al [12] and Bleazard et al [13]
added to the database since the correlation was developed from the van Velzen values are
consistent with the rule and quality control check
53 Evaluation of predicted values
A hallmark of the DIPPR database is its emphasis on completeness meaning that
when experimental data are unavailable prediction methods are used to ensure that at least
a best estimate is available for all 44 properties for each compound in the database In
several cases ηL correlations for compounds that failed the ηLb test were based upon
predicted data and the ηLb rule was employed to aid in assessing the reliability of several
estimation methods Interestingly two of the methods recommended by reviews [1 9] of
liquid viscosity correlations the van Velzen and Bhethanabotla [14] methods often did not
satisfy the ηLb rule Predictions using these methods for multifunctional compounds often
exhibited large variations from the rule An example of using the ηLb rule to aid in
selecting between competitive prediction methods is illustrated in Figure 6 for p-
hydroquinone where we have selected the Przezdziecki-Sridhar [15] estimated values over
those obtained from the van Velzen method
54 Improved family trends
As previously discussed the trend within chemical families of ηLb is compelling
evidence of the underlying physics of the rule These regular trends for ηLb have been used
in reverse to improve the quality of the correlations and accepted values in the database
For example the family trends previously in the database for the n-alkane and n-alcohol
families are shown in Figure 7 When the available ηL data were re-regressed for each
individual alcohol using the ηLb criterion to guide the extrapolation of that data to higher
temperatures the smoothed family curve shown in Figure 7 for the alcohols was obtained
There was no degradation of the agreement between the correlation and the experimental
data by this procedure instead the procedure improved the range over which the
correlation was effective while smoothing the family trend
6 CONCLUSION
An empirical rule for estimating the liquid viscosity of organic compounds at their
normal boiling point has been developed and validated with the available experimental
data in the DIPPR 801 database The rule is applicable to many different types of organic
compounds Although simple the rule has been found to be remarkably powerful in
practice providing a valuable link between the regression extrapolation prediction and
evaluation of liquid viscosity data The rule was applied as a quality control check on the
complete DIPPR 801 database and was found to improve the available temperature
dependent viscosity correlation in the database for 250 compounds Also an interesting
overall trend of ηLb values decreasing with increasing carbon number within a given family
of compounds has been observed In fact all families appear to be asymptotically
approaching a value of about 022 cP as carbon number increases This suggests that ηLb
values may indeed be quantitatively related to molecular structure andor molecular
descriptors based on electron distribution We are currently using a quantitative structure-
property relationship (QSPR) approach to further investigate this possibility This
represents an extension of Grainrsquos early attempt to categorize and refine the general rule
based on molecular structure
REFERENCES
1 B E Poling J M Prausnitz and J P OrsquoConnell The Properties of Gases and
Liquids 5th ed (McGraw-Hill New York 2001)
2 J R Partington An Advanced Treatise on Physical Chemistry Vol II The Properties
of Liquids (Longmans Green and Co London 1951) p 95
3 W R Gambill Chem Eng 66127 (1959)
4 J N Friend and W D Hargreaves Phil Mag 34643 810 (1943) 35136 631 (1944)
36731 (1945)
5 C F Grain ldquoLiquid Viscosityrdquo in W J Lyman W F Reehl and D H Rosenblatt
Handbook of Chemical Property Estimation Methods (McGraw-Hill New York
1982)
6 R L Rowley W V Wilding J L Oscarson Y Yang N A Zundel T E Daubert
and R P Danner ldquoDIPPR Data Compilation of Pure Compound Propertiesrdquo Design
Institute for Physical Properties American Institute of Chemical Engineers New York
(2003)
7 R C Reid and T K Sherwood The Properties of Gases and Liquids (McGraw-Hill
New York 1958)
8 R C Reid J M Prausnitz and T K Sherwood The Properties of Gases and Liquids
3rd ed (McGraw-Hill New York 1977)
9 R C Reid J M Prausnitz and B E Poling The Properties of Gases and Liquids 4th
ed (McGraw-Hill New York 1987)
10 S R S Sastri and K K Rao ldquoA New Group Contribution Method for Predicting
Viscosity of Organic Liquidsrdquo Chem Eng J 509 (1992)
11 D van Velzen R Lopes Cardozo and H Langenkamp ldquoLiquid Viscosity and
Chemical Constitution of Organic Compounds A New Correlation and a Compilation
of Literature Datardquo EUR 4735e Commission of the European Communities
Luxembourg (1972)
12 T Lech G Czechowski and J Jadzyn ldquoViscosity of the Series of 1n-Alkanediolsrdquo J
Chem Eng Data 46725 (2001)
13 J G Bleazard T F Sun R D Johsnon R M DiGuilio and A S Teja ldquoThe
Transport Properties of Seven Alkanediolsrdquo Fluid Phase Equilib 117386 (1996)
14 V R Bhethanabotla ldquoA Group Contribution Method for Liquid Viscosityrdquo MS
Thesis The Pennsylvania State University University Park PA (1983)
15 J W Przezdziecki and T Sridhar AIChE J 31333 (1985)
(Expl) Rheochor Gambill Grainmethane 0117 0053 029 02propane 0198 0280 029 02heptane 0216 0208 029 02ethylene 0165 0074 029 02cyclohexane 0439 0494 029 04cyclohexene 0332 0430 029 04benzene 0320 0232 029 03diphenyl 0257 0225 029 03acetone 0235 0202 029 02methyl ethyl ketone 0234 0234 029 02acetaldehyde 0222 0173 029 02methanol 0344 0527 029 045propanol 0453 0494 029 045phenol 0465 0524 029 045p-cresol 0352 0468 029 045acetic acid 0389 0364 029 02propionic acid 0343 0323 029 02ethyl acetate 0253 0494 029 02amyl acetate 0217 0208 029 02phenyl n-propyl ether 0244 0211 029 02carbon tetrachloride 0483 0418 029 02chlorobenzene 0286 0251 029 03hydrogen chloride 0458 0488 029 02p-dichlorobenzene 0304 0283 029 03n-butyl bromide 0310 0303 029 02acetonitrile 0270 0197 029 02diethylamine 0227 0213 029 045methyl aniline 0287 0272 029 045dimethyl aniline 0263 0237 029 045nitromethane 0308 0300 029 02nitro-n-pentane 0250 0230 029 02ethyl nitrite 0228 0205 029 02n-amyl nitrite 0239 0222 029 02
Average absolute error () 189 264 268
Experimental value not available in the DIPPR database value is from Reid and Sherwood [7] Table 6-8 p 214Source of experimental data DIPPR Project 801 database [6] sponsors January 2003 version (unless otherwise noted)Rheochor method values are taken directly from Reid and Sherwoods Table 6-8
Table I Comparison of the Rheochor Method Gambills Constant-Value Method and Grains Method
Liquid Viscosity at the Normal Boiling Point (cP)
Figure Captions
Figure 1 Liquid viscosity at the normal boiling point vs carbon number
Figure 2 ηL for n-heptylbenzene with accepted experimental data () the previous DIPPR
correlation (- - - -) and the revised correlation () The vertical dotted line is at the NBP
and the horizontal lines show the ηLb rule
Figure 3 ηL for nonylphenol with accepted experimental data () the previous DIPPR
correlation (- - - -) and the revised correlation () The vertical dotted line is at the
NBP and the horizontal lines show the ηLb rule
Figure 4 ηL for n-hexylbenzene with accepted experimental data () previously not used
points () the previous DIPPR correlation (- - - -) and the revised correlation () The
vertical dotted line is at the NBP and the horizontal lines show the ηLb rule
Figure 5 ηL for 16-hexanediol with previously estimated data () recent experimental
data () the previous DIPPR correlation (- - - -) and the revised correlation () The
vertical dotted line is at the NBP and the horizontal lines show the ηLb rule
Figure 6 ηL for p-hydroquinone with van Velzen estimated data () Przezdziecki-Sridhar
estimated values () the previous DIPPR correlation (- - - -) and the revised correlation
() The vertical dotted line is at the NBP and the horizontal lines show the ηLb rule
Figure 7 ηLb from the DIPPR database correlations for n-alkanes ( line) the original
correlations for n-alcohols () and the new correlations for n-alcohols ( line)
01
015
02
025
03
035
04
045
05
055
06
065
1 2 3 4 5 6 7 8 9 10 11 12 13 14 15 16
Carbon Number
Liqu
id V
isco
sity
at t
he N
orm
al B
oilin
g Po
int (
cP)
n-Alkanoic Acids 1-Alkanols Methyl n-Alkyl Ketones n-Alkyl AcetatesGlycols n-Aldehydes n-Alkanes 1-Chloro-n-Alkanesn-Alkylamines Benzene and Toluene Cyclohexane Phenol
SMITH WILDING OSCARSON AND ROWLEY ndash FIGURE 1
10E-03
10E-02
10E-01
10E+00
10E+01
10E+02
15 20 25 30 35 40 45
1Temperature (1000K)
Liqu
id V
isco
sity
(cP)
SMITH WILDING OSCARSON AND ROWLEY ndash FIGURE 2
10E-01
10E+00
10E+01
10E+02
10E+03
10E+04
10E+05
10 15 20 25 30 35 401Temperature (1000K)
Liqu
id V
isco
sity
(cP)
SMITH WILDING OSCARSON AND ROWLEY ndash FIGURE 3
10E-03
10E-02
10E-01
10E+00
10E+01
10E+02
10 15 20 25 30 35 40 45 501Temperature (1000K)
Liqu
id V
isco
sity
(cP)
SMITH WILDING OSCARSON AND ROWLEY ndash FIGURE 4
10E-03
10E-02
10E-01
10E+00
10E+01
10E+02
14 16 18 20 22 24 26 28 30 32
1Temperature (1000K)
Liqu
id V
isco
sity
(cP)
SMITH WILDING OSCARSON AND ROWLEY ndash FIGURE 5
10E-02
10E-01
10E+00
10E+01
10E+02
10E+03
12 14 16 18 20 22 24
1Temperature (1000K)
Liqu
id V
isco
sity
(cP)
SMITH WILDING OSCARSON AND ROWLEY ndash FIGURE 6
000
005
010
015
020
025
030
035
040
045
050
1 2 3 4 5 6 7 8 9 10 11 12 13 14 15 16 17 18 19 20 21 22 23 24
Carbon Number
Liqu
id V
isco
sity
at N
BP
(cP)
SMITH WILDING OSCARSON AND ROWLEY ndash FIGURE 7
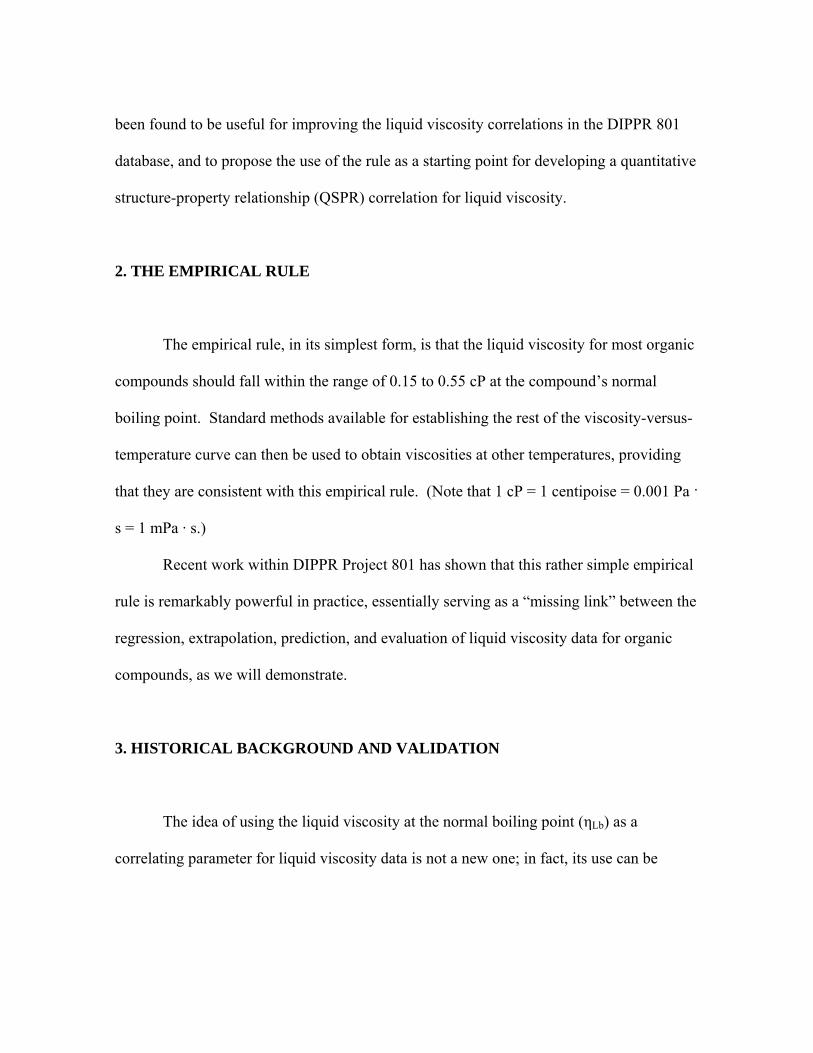
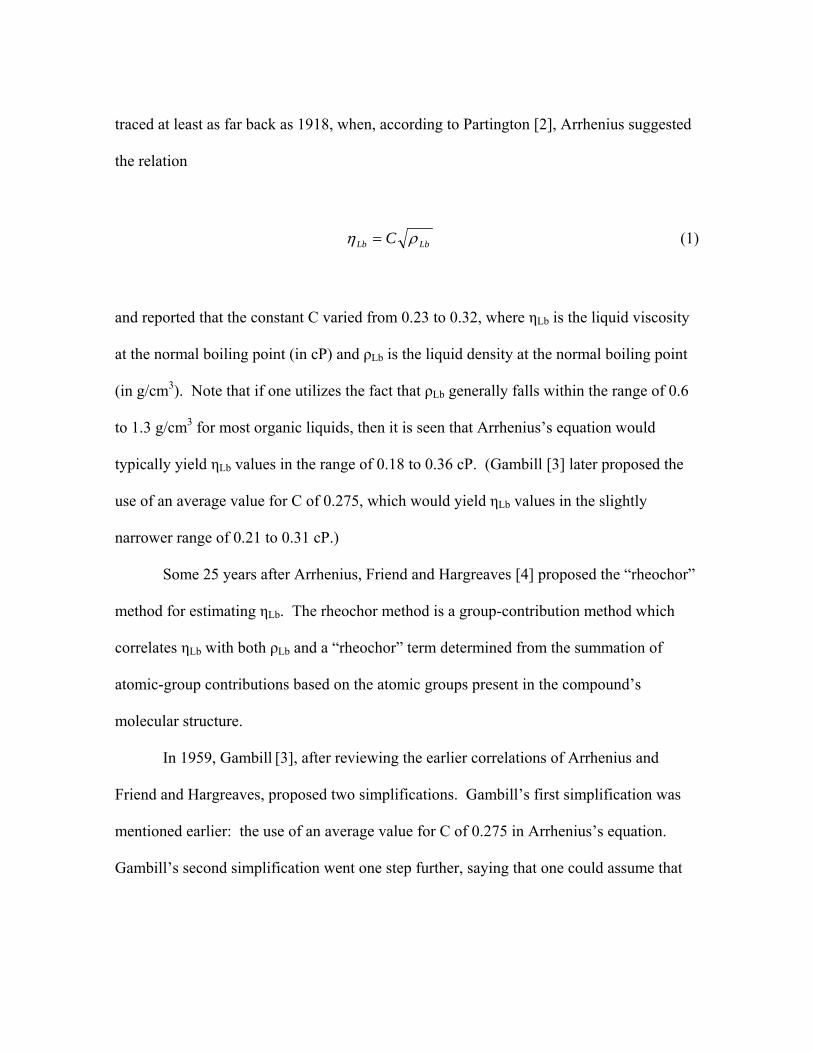
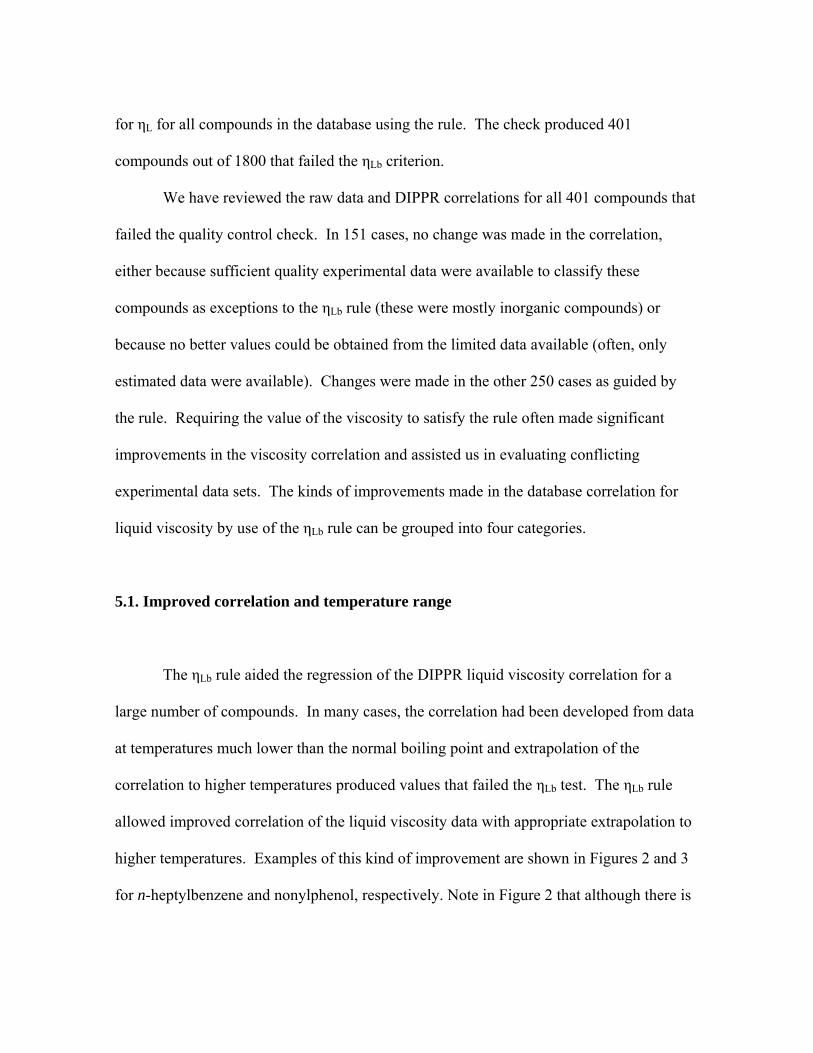
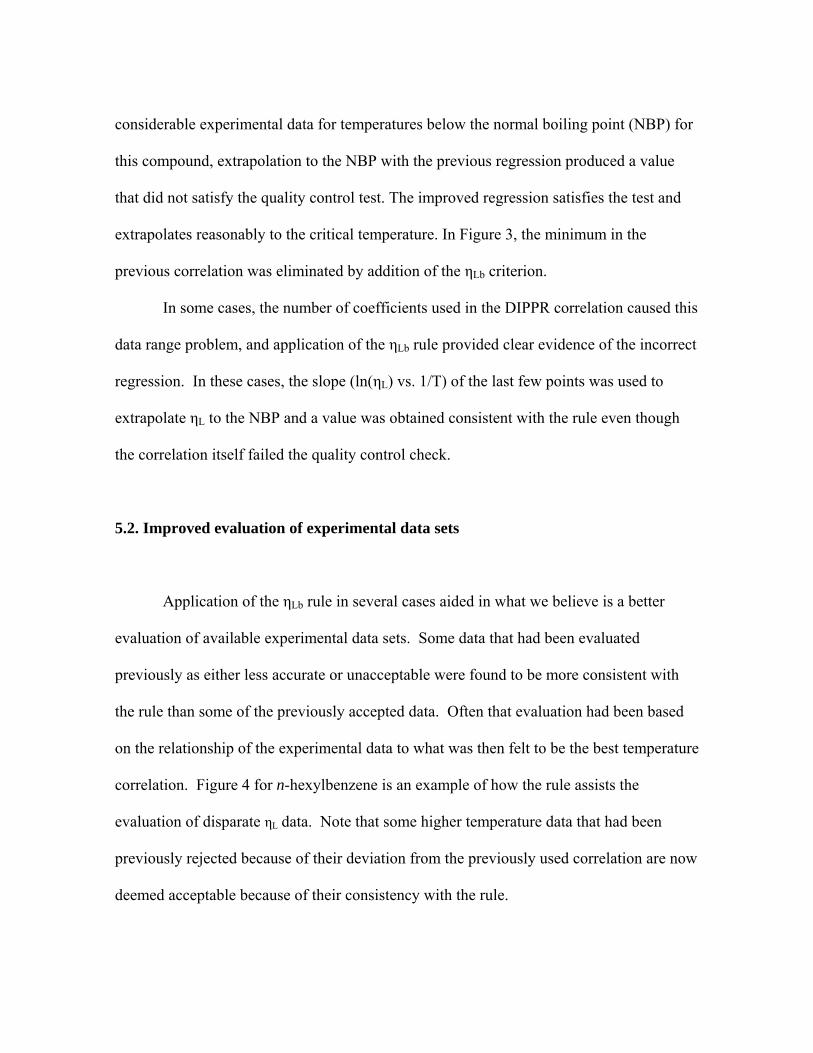
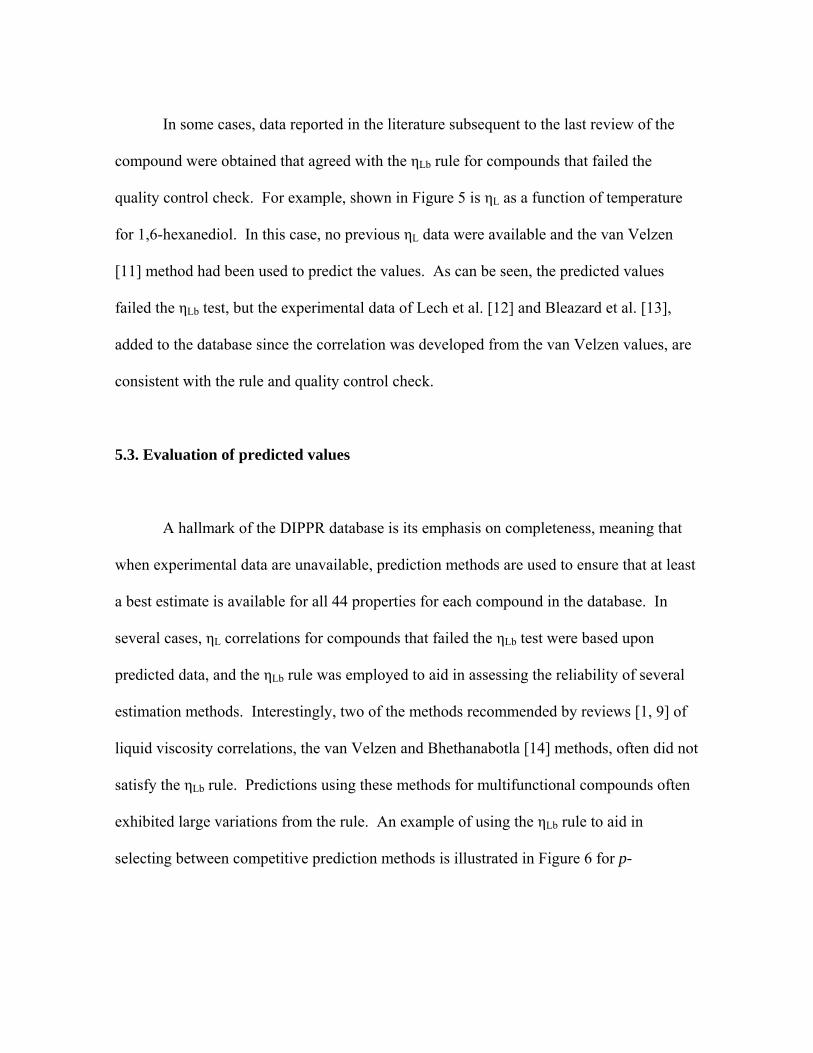
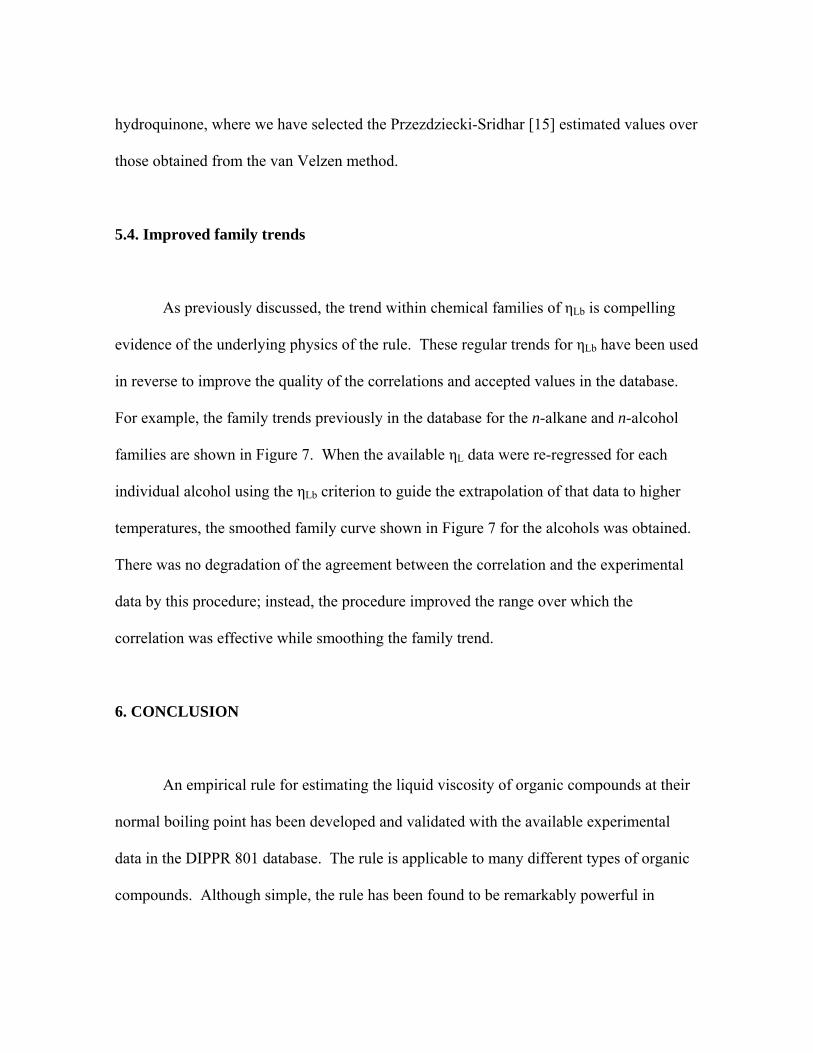
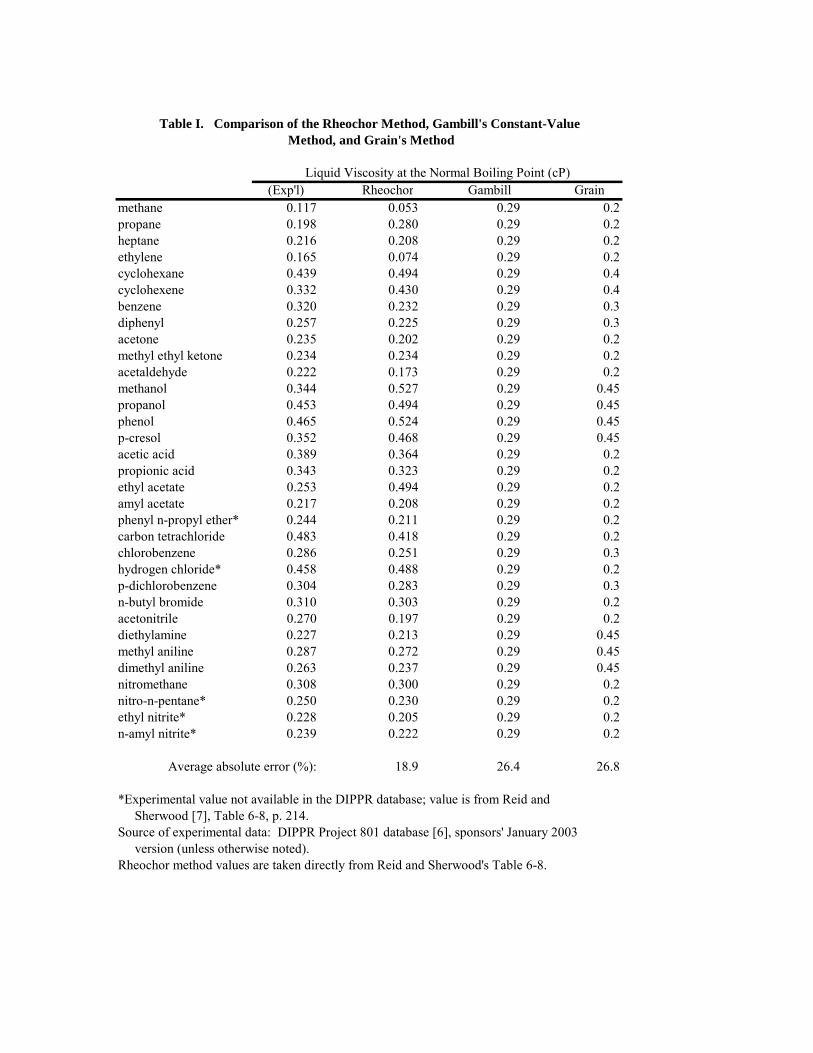
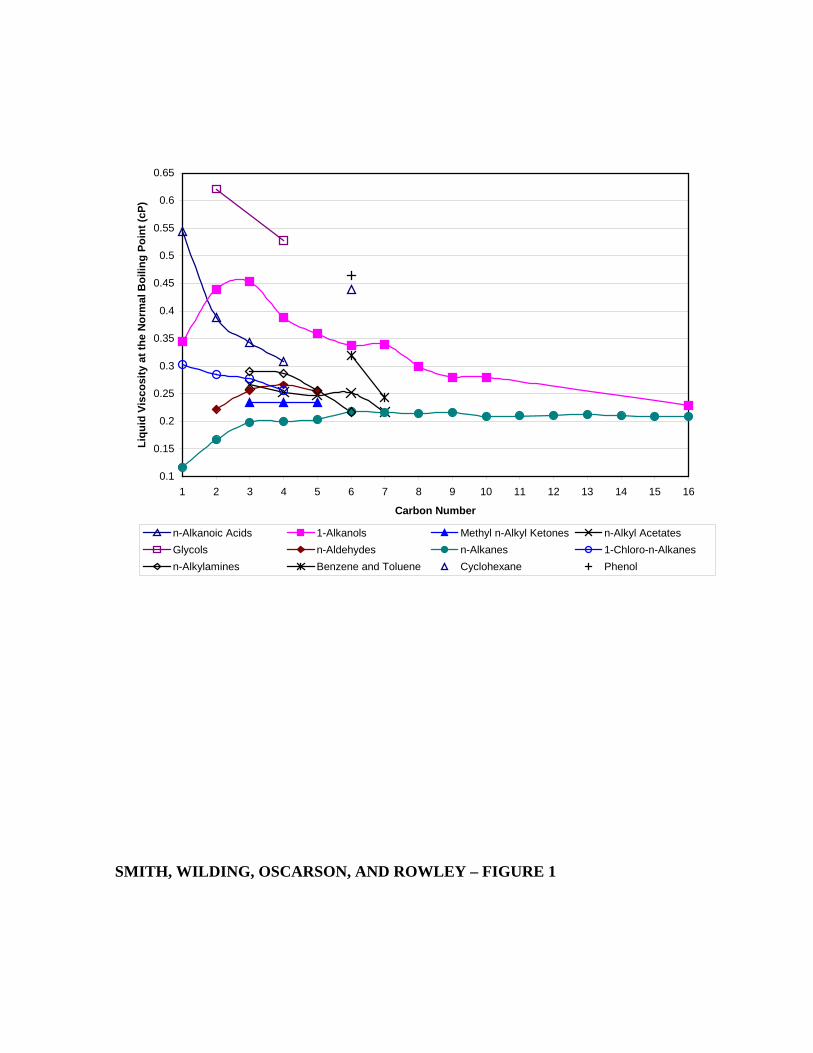
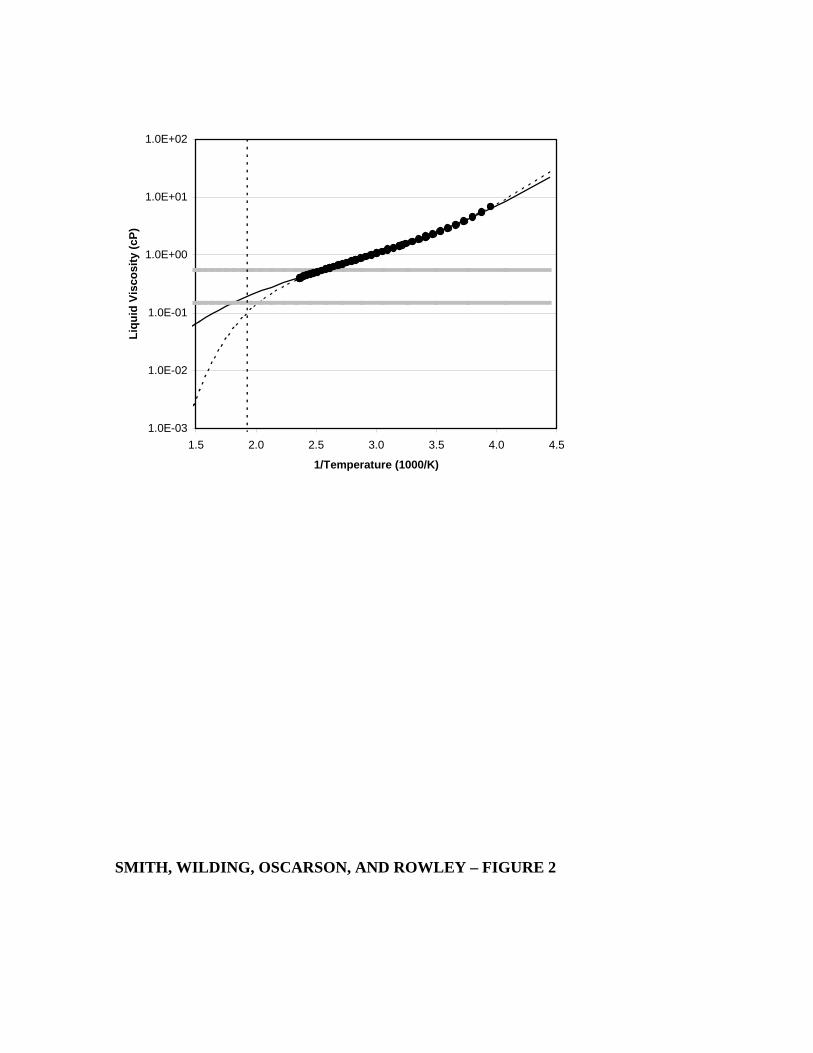
10E-03
10E-02
10E-01
10E+00
10E+01
10E+02
15 20 25 30 35 40 45
1Temperature (1000K)
Liqu
id V
isco
sity
(cP)
SMITH WILDING OSCARSON AND ROWLEY ndash FIGURE 2
10E-01
10E+00
10E+01
10E+02
10E+03
10E+04
10E+05
10 15 20 25 30 35 401Temperature (1000K)
Liqu
id V
isco
sity
(cP)
SMITH WILDING OSCARSON AND ROWLEY ndash FIGURE 3
10E-03
10E-02
10E-01
10E+00
10E+01
10E+02
10 15 20 25 30 35 40 45 501Temperature (1000K)
Liqu
id V
isco
sity
(cP)
SMITH WILDING OSCARSON AND ROWLEY ndash FIGURE 4
10E-03
10E-02
10E-01
10E+00
10E+01
10E+02
14 16 18 20 22 24 26 28 30 32
1Temperature (1000K)
Liqu
id V
isco
sity
(cP)
SMITH WILDING OSCARSON AND ROWLEY ndash FIGURE 5
10E-02
10E-01
10E+00
10E+01
10E+02
10E+03
12 14 16 18 20 22 24
1Temperature (1000K)
Liqu
id V
isco
sity
(cP)
SMITH WILDING OSCARSON AND ROWLEY ndash FIGURE 6
000
005
010
015
020
025
030
035
040
045
050
1 2 3 4 5 6 7 8 9 10 11 12 13 14 15 16 17 18 19 20 21 22 23 24
Carbon Number
Liqu
id V
isco
sity
at N
BP
(cP)
SMITH WILDING OSCARSON AND ROWLEY ndash FIGURE 7
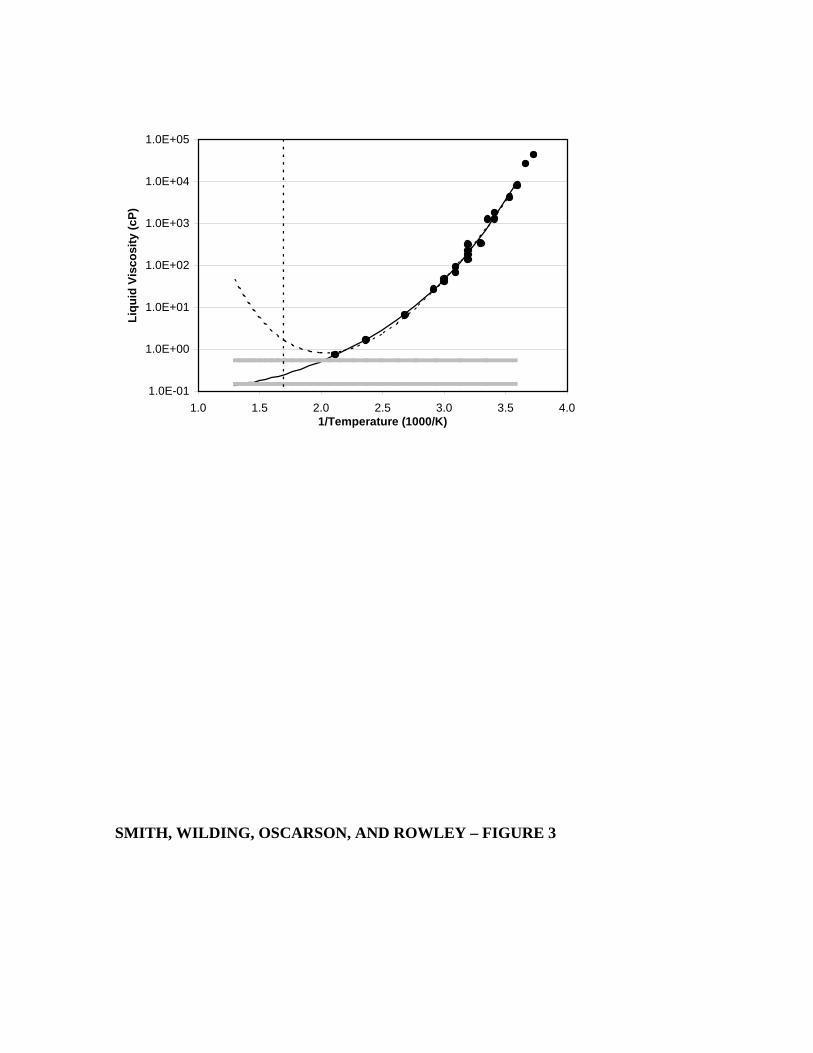
10E-01
10E+00
10E+01
10E+02
10E+03
10E+04
10E+05
10 15 20 25 30 35 401Temperature (1000K)
Liqu
id V
isco
sity
(cP)
SMITH WILDING OSCARSON AND ROWLEY ndash FIGURE 3
10E-03
10E-02
10E-01
10E+00
10E+01
10E+02
10 15 20 25 30 35 40 45 501Temperature (1000K)
Liqu
id V
isco
sity
(cP)
SMITH WILDING OSCARSON AND ROWLEY ndash FIGURE 4
10E-03
10E-02
10E-01
10E+00
10E+01
10E+02
14 16 18 20 22 24 26 28 30 32
1Temperature (1000K)
Liqu
id V
isco
sity
(cP)
SMITH WILDING OSCARSON AND ROWLEY ndash FIGURE 5
10E-02
10E-01
10E+00
10E+01
10E+02
10E+03
12 14 16 18 20 22 24
1Temperature (1000K)
Liqu
id V
isco
sity
(cP)
SMITH WILDING OSCARSON AND ROWLEY ndash FIGURE 6
000
005
010
015
020
025
030
035
040
045
050
1 2 3 4 5 6 7 8 9 10 11 12 13 14 15 16 17 18 19 20 21 22 23 24
Carbon Number
Liqu
id V
isco
sity
at N
BP
(cP)
SMITH WILDING OSCARSON AND ROWLEY ndash FIGURE 7
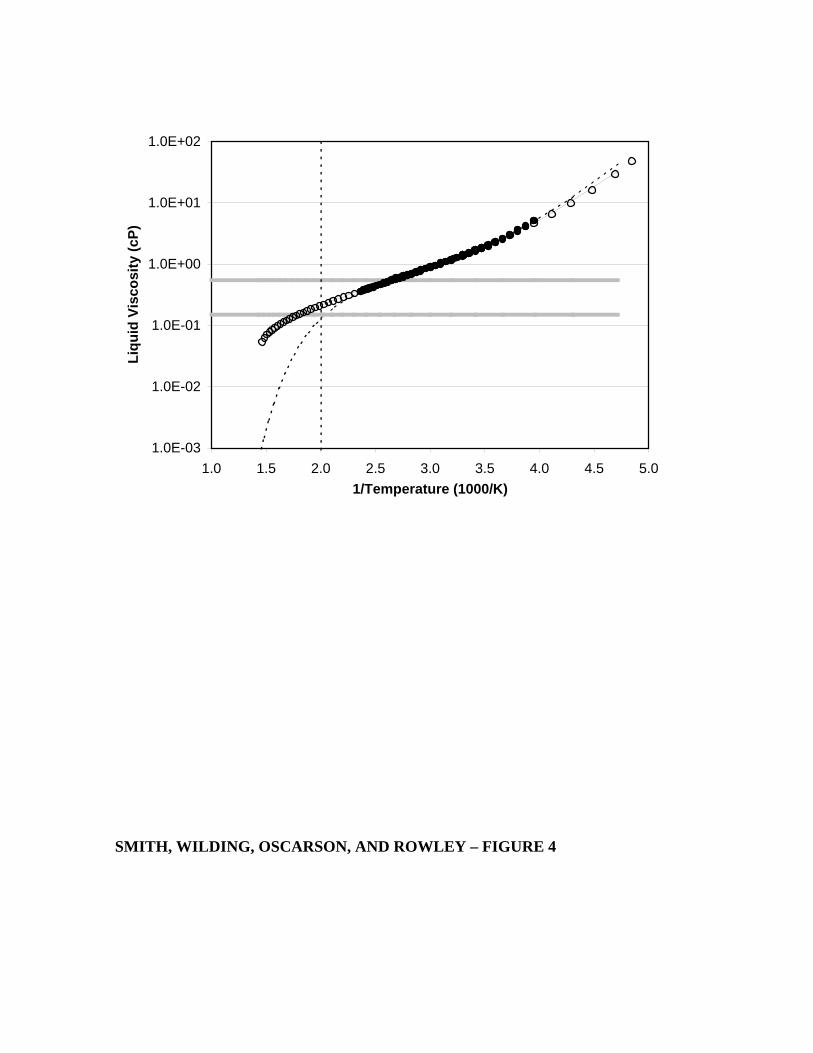
10E-03
10E-02
10E-01
10E+00
10E+01
10E+02
10 15 20 25 30 35 40 45 501Temperature (1000K)
Liqu
id V
isco
sity
(cP)
SMITH WILDING OSCARSON AND ROWLEY ndash FIGURE 4
10E-03
10E-02
10E-01
10E+00
10E+01
10E+02
14 16 18 20 22 24 26 28 30 32
1Temperature (1000K)
Liqu
id V
isco
sity
(cP)
SMITH WILDING OSCARSON AND ROWLEY ndash FIGURE 5
10E-02
10E-01
10E+00
10E+01
10E+02
10E+03
12 14 16 18 20 22 24
1Temperature (1000K)
Liqu
id V
isco
sity
(cP)
SMITH WILDING OSCARSON AND ROWLEY ndash FIGURE 6
000
005
010
015
020
025
030
035
040
045
050
1 2 3 4 5 6 7 8 9 10 11 12 13 14 15 16 17 18 19 20 21 22 23 24
Carbon Number
Liqu
id V
isco
sity
at N
BP
(cP)
SMITH WILDING OSCARSON AND ROWLEY ndash FIGURE 7
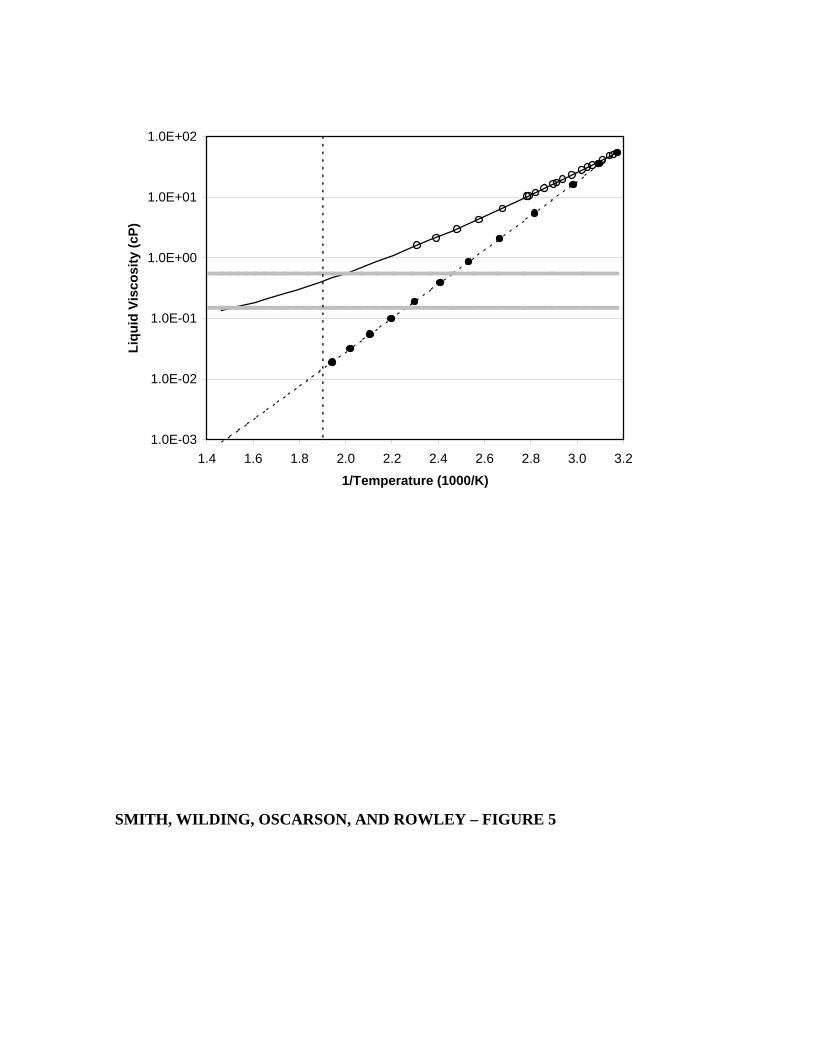
10E-03
10E-02
10E-01
10E+00
10E+01
10E+02
14 16 18 20 22 24 26 28 30 32
1Temperature (1000K)
Liqu
id V
isco
sity
(cP)
SMITH WILDING OSCARSON AND ROWLEY ndash FIGURE 5
10E-02
10E-01
10E+00
10E+01
10E+02
10E+03
12 14 16 18 20 22 24
1Temperature (1000K)
Liqu
id V
isco
sity
(cP)
SMITH WILDING OSCARSON AND ROWLEY ndash FIGURE 6
000
005
010
015
020
025
030
035
040
045
050
1 2 3 4 5 6 7 8 9 10 11 12 13 14 15 16 17 18 19 20 21 22 23 24
Carbon Number
Liqu
id V
isco
sity
at N
BP
(cP)
SMITH WILDING OSCARSON AND ROWLEY ndash FIGURE 7
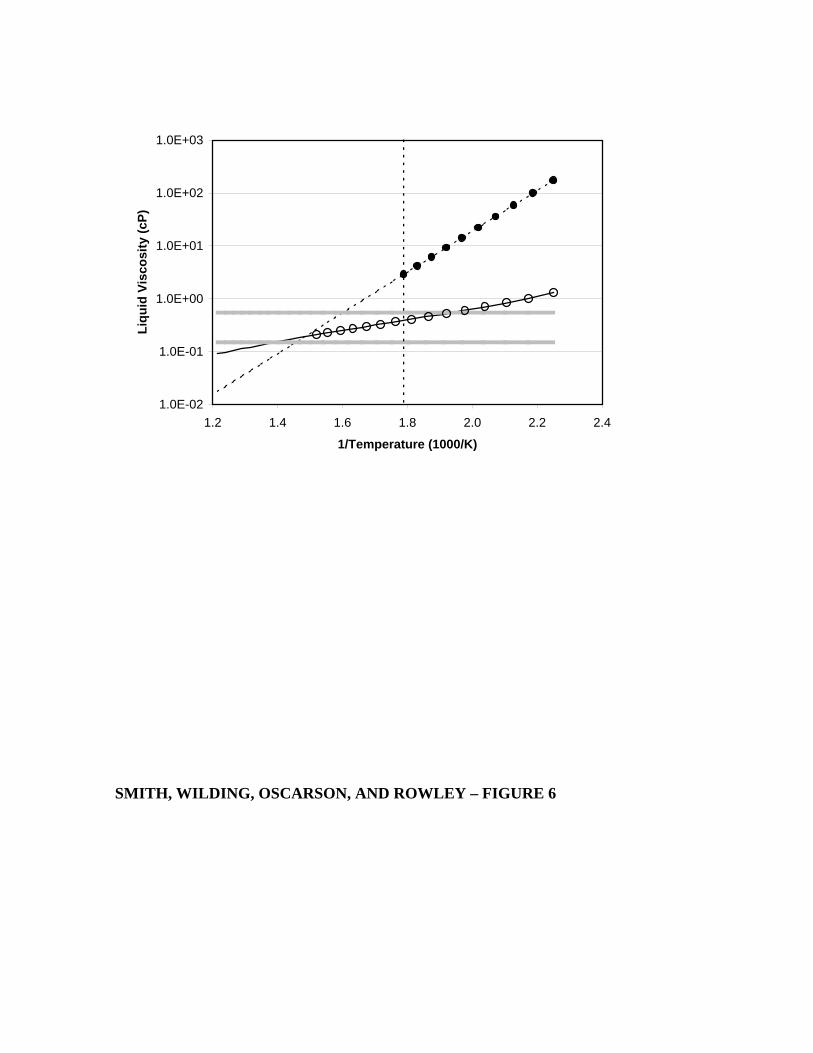
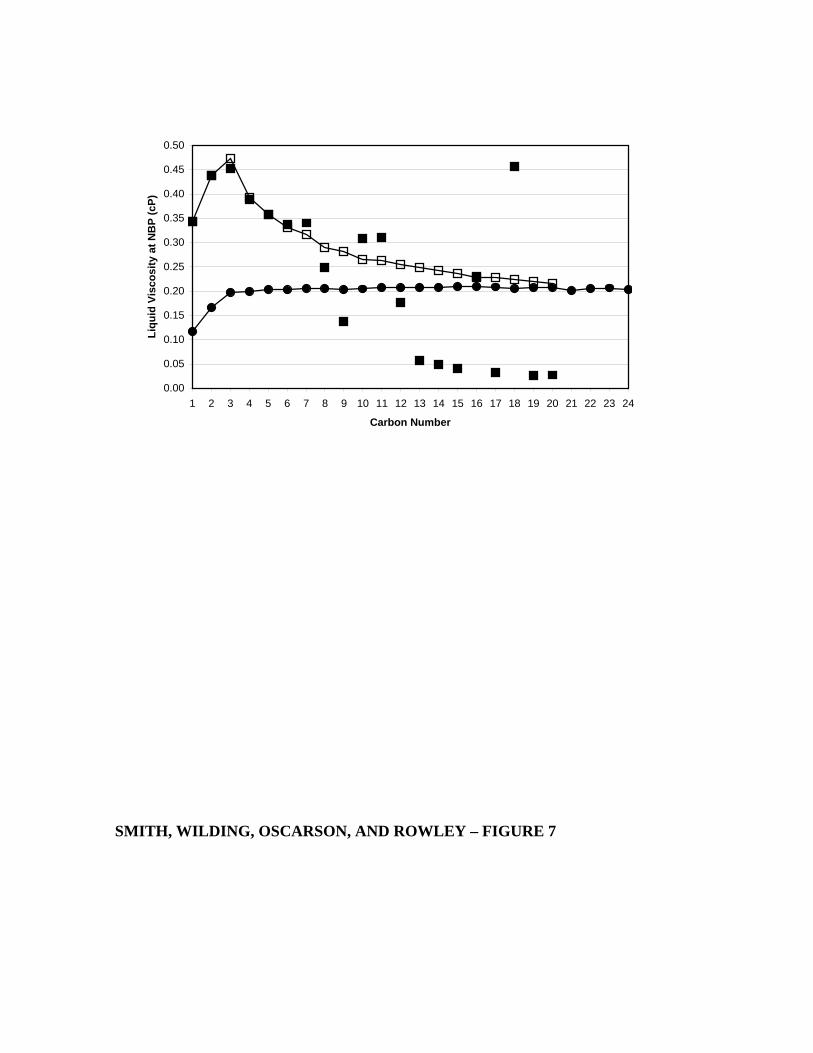
000
005
010
015
020
025
030
035
040
045
050
1 2 3 4 5 6 7 8 9 10 11 12 13 14 15 16 17 18 19 20 21 22 23 24
Carbon Number
Liqu
id V
isco
sity
at N
BP
(cP)
SMITH WILDING OSCARSON AND ROWLEY ndash FIGURE 7