Embed Size (px)
Citation preview

www.ccsenet.org/apr Applied Physics Research Vol. 3, No. 1; May 2011
ISSN 1916-9639 E-ISSN 1916-9647 100
Correlation of Self Potential (SP) and Resitivity Survey Methods for Evaluation of Groundwater Potentials: Case Study of Imo State,
Nigeria
Leonard I. Nwosu, Cyril N. Nwankwo & Anthony S. Ekine
Department of Physics, University of Port Harcourt, Nigeria
E-mail: [email protected], [email protected]
Received: September 21, 2010 Accepted: October 12, 2010 doi:10.5539/apr.v3n1p100
Abstract
A total of seventeen vertical electric surroundings were carried out in Mbaitolu Local Government Area (L.G.A) of Imo State Nigeria, during which apparent resistivity and SP values were simultaneously measured. The field curves obtained reveals a multilayered earth with series of crest and trough for all the sounding stations. VES 6 showed only positive maxima and minima. The distribution of SP values for electrode spacing AB/2 = 100m divides the area into two zones of positive and negative potentials respectively. The anomaly high areas are those of favourable aquifer which form discharge zones with strong lateral flow and high aquifer thickness and transmissivity. Anomaly low areas correspond to areas of infiltration. The depth to aquifer determined from SP survey ranged from 40m to 115m and correlated fairly well with those obtained from resistivity result in 16 out of the 17 stations. The distribution of equipotential lines shown by the contour map divides the area into two zones by a zero potential line suggesting a possible ground water divided in terms of water quality or geologic setting or both. The cross-correlation coefficient computed statistically for each pair of depth points gave correlation significance at the 0.01 level, which validates the results.
Keywords: Correlation, Groundwater potential, SP anomaly, Resistivity
1. Introduction
Lack of access to portable water in Mbaitolu Local Government Area of Imo State Nigeria, especially during dry season has become a perennial problem threatening the comfort of the citizens of the area. The area has experienced rapid urbanization due to this coupled with its nearness to the state capital. Few boreholes drilled in the area are not productive. A recent geophysical survey of the area using resistivity method by Ekine and Iheonunekwu (2007) linked the borehole failure to non availability of requisite data or difficulty in obtaining records of geophysical work earlier carried out in the area.
The area has nearly flat topography which is a characteristic of coastal plain sands with a few high land ridges in the central part stretching from Umunoha to Afara and around Nworieubi, the L.G.A. headquarters, with height ranging from about 37.19 to 55.79 m above sea level (Federal Survey, 1988; Ekine and Iheonunekwu, 2007). There is only a river channel – the Okitankwo River, in the area (Fig.1). This river drains into Oramiriukwa river and dries up during the dry season.
To provide lasting solution to this problem and obtain adequate information about the subsurface formation in the area, data is required from various geophysical techniques such as resistivity and self potential methods; geological and hydrogeological as well as test drilling, water pump testing and water analysis (Ofodile, 1992; Ekine and Iheonunekwu, 2007). Self potential (SP) method of geophysical exploration can be applied to ground water prospecting especially when there is resistivity sounding results for correlation. SP method involves measurement at the surface of electric potentials developed in the earth by electrochemical action between minerals and the solutions with which they are in contact.
A number of works have been done on ground water prospecting using self potential methods (Rindall – Robert, 1990; Fitterman, 1983; Fitterman and Carwin,1982). Positive SP anomalies are associated with discharge zones, strong lateral flow or gravel beds while negative anomalies show downward flow or recharge or clayey beds. The study of Ernstson and Scherer (1986) showed the relation of water table variation to absolute SP values and
www.ccsenet.org/apr Applied Physics Research Vol. 3, No. 1; May 2011
Published by Canadian Center of Science and Education 101
pointed out that electrical conductivity of water was the most important factor that determines the density of current in milli-volts of SP.
This study is aimed at producing a quantitative interpretation of SP data obtained during resistivity survey using Vertical Electric Sounding (VES) and correlating the results obtained with those of resistivity survey in order to obtain a more reliable information that will enhance water prospecting in the study area.
2. Geologic Setting and Hydrogeology of the Area_MOVE to next page
Mbaitolu Local Government Area of Imo State is located between latitude 5o32IN to 5o39IN and longitude 6o56IE to 7o8IE. It lies on the coastal plain and lowland zone of Southeastern Nigeria and is underlain by coastal plain sands of the Benin Formation deposited during the late Tertiary to early Quaternary period (Oguntoyinbo, 1998; Ofodile, 1992). The formation is overlain by thick lateritic red earth formed by weathering and subsequent ferruginization of the weathered older sequences. The formation being very porous and permeable coupled with the underlying clay/shale member of the Bende – Amaki series provides the hydrologic conditions that favour aquifer formation (Maduagwu, 1990).
The hydrology of the area also reveals that Mbaitolu lies in the coastal sedimentary lowlands consisting of unconsolidated sands that are porous. Aquifer occurs in unconfined conditions over most of the area and the depths to aquifer range from a few meters to about 158m with an average depth of about 48m (Maduagwu, 1990). The area also lies in the rain forest belt of Nigeria. The heavy rainfall experienced most parts of the year together with the free drainage nature of the subsoil, makes for high infiltration which ensures adequate ground water recharge.
3. Field Methodology
A portable resistivity meter, the ‘R – Plus’, was used to acquire the SP data. It is a self averaging digital equipment capable of automatically compensating for the polarization of the electrodes, induced polarization of the earth materials and the drift effects. It displays on the screen the apparent resistivity and SP values for each electrode spacing simultaneously.
The Schlumberger electrode configuration was used with maximum electrode spreads of 900m to carry out seventeen vertical electric soundings in the study area. The electrode spacing was targeted to aquifer depth of between 30-150 m. At each station the centre point of the array was marked out with respect to the line of measurement while the spacing between the electrodes was made as short as possible at the beginning of each transverse. On setting up the equipment as desired, the resistivity meter reading of SP and apparent resistivity was then recorded simultaneously against the corresponding current electrode spacing (AB/2). Only the current electrodes are moved more often during measurements while the potential electrodes spacing were moved only when the measurable signal becomes very small. Four of the VES stations were sited near existing boreholes at Mbieri, Ogwa, Orodo and Umunoha to enhance interpretation.
4. Data Presentation
SP curves were obtained by plotting the SP data against half of the electrode spacing in a semi-log graph scale (Fig. 2). A contour map of the SP values for AB/2 = 100m was also drawn (Fig. 3). Three profile lines were drawn across the SP contour map corresponding to the geoelectric cross sections and the interpreted results compared with those of resistivity survey.
Depth to aquifer was estimated from SP curves in a way similar to magnetic studies (Telford, 1976; Dobrin and Savit, 1988). In this method the depth is obtained from the equation.
D = ½ X
where D = depth and X = the half width at the negative maximum.
Using the pumping test data, transmissitivity values were calculated from the resistivity survey and the results were used to draw the transmissivity map (Fig. 7). and the result compared well with the SP result for the aquifer system.
5. Discussion of Results
The field curves revealed multilayered earth with series of crests and troughs for all the sounding stations except for VES 6 which showed only positive maxima and minima. Also VES 4 showed only negative maxima and minima (Fig. 2). Short wavelength oscillation of SP values with small amplitude in some cases is observed near the surface or at shallow depths. These are primarily SP noise, which were reduced by filtering. The long wavelength anomalies are the residual SP. However, the trend of SP values which become more positive going

www.ccsenet.org/apr Applied Physics Research Vol. 3, No. 1; May 2011
ISSN 1916-9639 E-ISSN 1916-9647 102
downhill may be due to topographic effects. Hence, the field data has three components viz: the SP noise, the residual SP and the topographic effect. SP noise can be generated by biological root activity. Residual SP is related to underground lithology and the measured voltages are predominantly due to streaming potentials than to electrochemical potentials (Ernstson and Scherer, 1986).
The distribution of SP values for electrode spacing AB/2 = 100m divides the area into two zones of negative potentials in the eastern and western parts; and positive potentials in the central and southern part of the area (Fig. 4). This electrode spacing was chosen based on the fact that the borehole records revealed the average depth to aquifer to be within the depth probed by this electrode spread. A useful approximation usually adopted in VES work is that the depth of investigation is equal to one fifth (1/5) of the electrode spacing (Vingoe, 1973; Ekwe et al., 2006). The SP profiles showed high anomaly at Umunoha (VES 9) with a value of 106mV and around Orodo (VES 3) with a value of 23 mV. Awo Mbieri in the Southern part (VES 11) has a positive peak of 70mV (Fig. 5a and 5c). When compared with the geoelectric interpretative cross section, the profile line AB shows that these areas are underlain by thick aquifer (Fig. 6). These areas form the discharge zone with strong lateral flow and high aquifer thickness and transmisitivity values (Rindall-Robert, 1990). On the other hand, low SP anomalies are observed in the western and northeastern parts of the study area around Ifeakala (VES 10) and Amaukwu Orodo (VES 13) with peaks of -215 mV and -323 mV respectively. Similarly, a peak of -323 mV is observed around Ubomiri (VES 14) in the southern part. These correspond to areas of infiltration.
The depth to aquifer determined from SP survey correlated fairly well with those obtained from resistivity result (Table 1). The distribution of the isopotentials as shown on Fig.3 divides the entire area into two zones by a zero potential line, suggesting a possible ground water divide in terms of water quality or geologic setting or both. This agrees with the work of Ekine and Iheonunekwu (2007) in the area in which two similar zones were obtained using the hydraulic conductivity product values (Kδ). Areas of similar geologic setting and water quality show fairly constant Kδ values (Niwas and Singal, 1981).
However, the transmissivity map (Fig. 7) obtained using the values calculated from the pumping test data for the resistivity .results show that the entire area has high average transimissitvity which means that the entire Mbaitolu area is underlain by favourable aquifer especially in areas around Umunoha, Orodo and Mbieri.
6. Correlation of Depth to Aquifer Obtained from Resistivity Survey with Those of Sp Survey
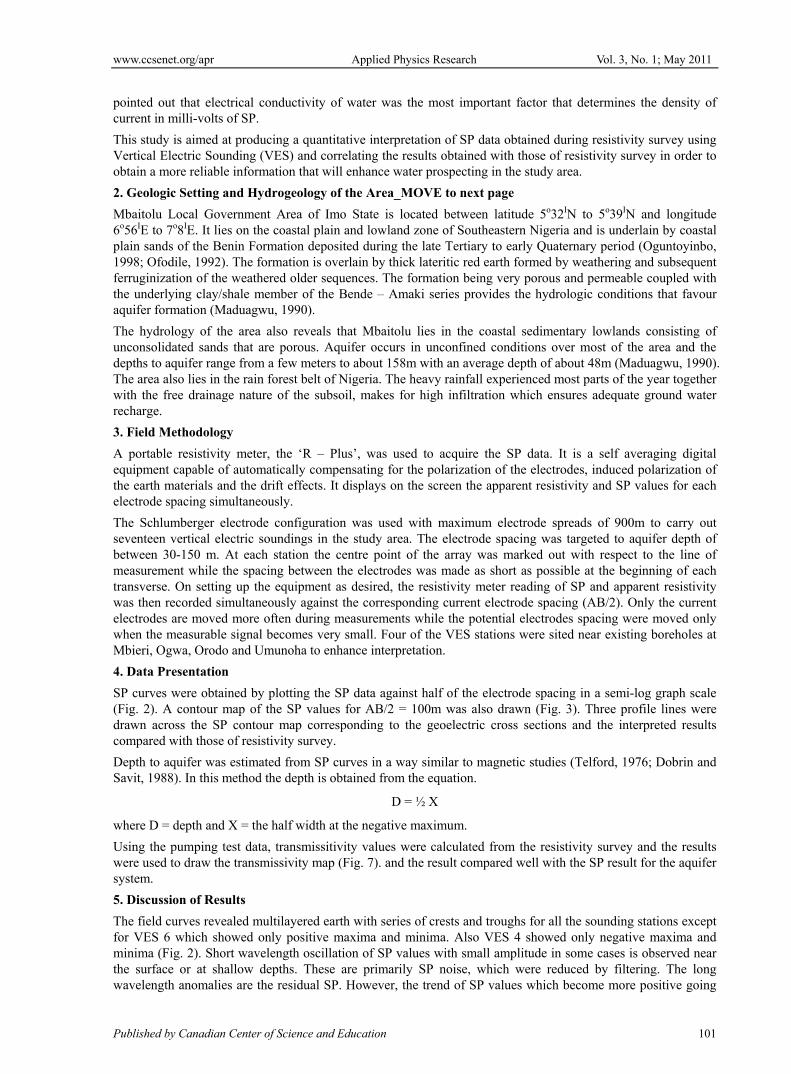
Table 1 shows depth to aquifer determined from SP data compared with corresponding resistivity survey results. Each pair of depth values obtained from both resistivity and SP surveys were statistically correlated. The correlation analysis gave a cross-correlation coefficient value which is significant at the 0.01 level (2-tailed) - Table 2. This validates the results of the study as the two methods correlate very well.
7. Conclusion
Self potential method of geophysical exploration when applied to ground water investigation gives useful and reliable information especially where resistivity sounding data, borehole data and geologic information are available. The results obtained from this study correlated well with that of resistivity sounding method. The entire study area is underlain by favourable aquifer system with variable thickness and high average transmissivity. Specifically, areas around Orodo in the central part, Umunoha and Mbieri in parts of the east, show SP anomaly high corresponding to areas of favourable aquifers. These areas form the discharge zones with strong lateral flow. Areas around the western part within Eziama Obiato and Ogbaku; and the north-eastern part around Ogwa show SP anomaly low and correspond to the zone of infiltration.
This study may have suffered some limitations arising from fairly large local disturbances due to buried pipes, chemical fertilizers as well as electrical earthings. Similarly baseline shifts, effect of surface vegetation and type of over- burden and topographic conditions may have affected the shape of the anomaly.
However, availability of hydrogeological information, borehole data and resistivity survey results combined to enhance interpretation of the SP data.
Acknowledgment
The authors thank the Department of Physics, University of Port Harcourt for providing the resistivity meter equipment used for this study and the Imo State Water Co-operation for releasing the borehole data. The contribution of Late Mr. E.N. Iheonunekwu in the acquisition of resistivity data is highly appreciated. We are also grateful to Prof. J.O. Ebeniro for proof reading this manuscript.

www.ccsenet.org/apr Applied Physics Research Vol. 3, No. 1; May 2011
Published by Canadian Center of Science and Education 103
References
Ayoade, J.O. (1995). Water Resources and their development in Nigeria. Hydrological Science Bulletin, 20: 581 – 591.
Dobrin, M.B. and Savit, C.H. (1988). Introduction to geophysical prospecting, 4th Ed. Mc Graw Hill Books Inc. New York. 755-826.
Ekine, A.S. and Iheonunekwu, E.N. (2007). Geoelectric Survey for Groundwater in Mbaitoli Local Government Area, Imo State Nigeria. Scientia Africana, Vol. 6 (1): 39-48.
Ekwe, A.C, Onu, N.N. and Onuoha, K.M. (2006). Estimation of aquifer hydraulic characteristics from electrical sounding data; the case of middle Imo River Basin aquifers, south-eastern Nigeria. Journal of Spatial Hydrology. Vol. 6. (2): 121-131.
Ernstson, K. and Scherer, H.U. (1986). Self Potential Variations with time and their relation to Hydrological and Meteorological parameters. Geophysics, Vol. 51 (10): 1967 – 1977.
Federal Ministry of Lands and Survey. (1978). National Atlas of the Federal Republic of Nigeria, First Edition.
Filterman, D.V. (1983). Modeling of Self Potential anomaly near vertical Dikes. Geophysics, Vol. 48. (2):171-180.
Filterman, D.V. and Carwin, R.F. (1982). Inversion of self Potential Data. Cerno Prieto Geothermal field Mexico. Geophysics, Vol. 47 (6):938-945.
Maduagwu, G.N. (1990). Water Resources Potential (Unpublished). Hydrogeological documentary, Imo State Public Utilities Board, Owerri.
Niwas, S. and Singhal, O.C. (1981). Estimation of Aquifer transmissivity from Dar-Zarouk parameters in porous media. Journal of hydrology, Vol. 50; 393 – 399.
Ofodile, M.E. (1992). An approach to groundwater study and development in Nigeria, Mecon Services Ltd, Jos, pp 134– 137.
Oguntoyibo, J.S. (1978). Climate, A. geography of Nigeria development, 2nd Ed. HEB Books Nigeria Ltd.
Onuoha, K.M. and Mbazi, F.C.C. (1988). Aquifer Transmissivity from electrical sounding data, the case of Ajali Sandstone Aquifer, South-West of Enugu, Nigeria; in Ofoegbu, C.O. ed. Groundwater and mineral resources of Nigeria Fridr, vieweg and sohn verlagbges elschafr imbh, Brounschweig: 17-31.
Rindall – Robert, J.A. (1990). Water prospecting using surface SP Reconnaissance and Detailed study. International Association of Hydrogeologists, Vol. 1:489-500.
Sill, W.R. (1993). Self Potential Modeling for primary flow. Geophysics, Vol. 48(1): 76-86.
Telford, W.M., Geldert, C.P., Sheriff, R.S. and Keys, O.A. (1976). Applied geophysics, Cambridge University Press. Cambridge.
Vingoe, P. (1973). Electrical Resistivity Surveying. ABEM Geophysics and Electronics Geophysics Memorandum, 5/72.

www.ccsenet.org/apr Applied Physics Research Vol. 3, No. 1; May 2011
ISSN 1916-9639 E-ISSN 1916-9647 104
Table 1. Depth to aquifer determined from SP data compared with corresponding resistivity survey result
Station No
Depth from SP Curve (meters)
Depth from Resistivity data (meters)
1 40.0 42.2 2 35.0 60.0 3 75.0 70.9 4 65.0 68.5 5 60.0 70.0 6 - 93.4 7 80.0 95.5 8 95.0 92.1 9 80.0 81.1
10 45.0 42.4 11 30.0 91.3 12 70.0 73.6 13 65.0 74.2 14 85.0 102.0 15 35.0 40.6 16 40.0 43.0 17 115.0 97.6
Table 2. Statistical correlation of depths to aquifer obtained from SP and Resistivity surveys for all the sounding
stations in the study area
Descriptive Statistics
Mean Std. Deviation N
SP 70.1875 21.8334 17
VES 71.5625 21.1721 17
Correlations
SP VES
Pearson Correlation VES 1.000 .992**
SP .992 1.000
Sig. (2-tailed) SP .000
VES .000
Sum of Squares and Cross-products
VES 6723.877 6879.612
SP 6879.612 7150.437
Covariance VES 448.258 458.641
SP 458.641 476.696
Number (N) VES 16 16
SP 16 16
** Correlation is significant at the 0.01 level (2-tailed).

www.ccsenet.org/apr Applied Physics Research Vol. 3, No. 1; May 2011
Published by Canadian Center of Science and Education 105
Figure 1. Map of study area showing VES station locations

www.ccsenet.org/apr Applied Physics Research Vol. 3, No. 1; May 2011
ISSN 1916-9639 E-ISSN 1916-9647 106
Figure 2. Plots of SP values against Half Electrodes Spacing (AB/2) for all sounding stations in the study area

www.ccsenet.org/apr Applied Physics Research Vol. 3, No. 1; May 2011
Published by Canadian Center of Science and Education 107
Δ = VES Location
Figure 3. Distribution of isopotentials across the study area
Δ = VES Location
Figure 4. Distribution of SP values for AB/2 = 100 m.

www.ccsenet.org/apr Applied Physics Research Vol. 3, No. 1; May 2011
ISSN 1916-9639 E-ISSN 1916-9647 108
Figure 5(a). SP anomaly along profile AB
Figure 5(b). SP anomaly along profile CD
Figure 5(c). SP anomaly along profile EF

www.ccsenet.org/apr Applied Physics Research Vol. 3, No. 1; May 2011
Published by Canadian Center of Science and Education 109
Figure 6. Interpretative geoelectric cross-section along profile AB
Figure 7. Transmissivity Map of the Aquiferous Zone