Embed Size (px)
Citation preview

University of New Orleans University of New Orleans
ScholarWorks@UNO ScholarWorks@UNO
University of New Orleans Theses and Dissertations Dissertations and Theses
Spring 5-17-2012
Correlation of Shear Strength Between Longitudial and Transverse Correlation of Shear Strength Between Longitudial and Transverse
Specimens Specimens
Erasto A. Fernandez University of New Orleans, [email protected]
Follow this and additional works at: https://scholarworks.uno.edu/td
Part of the Civil and Environmental Engineering Commons, Engineering Science and Materials
Commons, Materials Science and Engineering Commons, Ocean Engineering Commons, and the Other
Engineering Commons
Recommended Citation Recommended Citation Fernandez, Erasto A., "Correlation of Shear Strength Between Longitudial and Transverse Specimens" (2012). University of New Orleans Theses and Dissertations. 1435. https://scholarworks.uno.edu/td/1435
This Thesis is protected by copyright and/or related rights. It has been brought to you by ScholarWorks@UNO with permission from the rights-holder(s). You are free to use this Thesis in any way that is permitted by the copyright and related rights legislation that applies to your use. For other uses you need to obtain permission from the rights-holder(s) directly, unless additional rights are indicated by a Creative Commons license in the record and/or on the work itself. This Thesis has been accepted for inclusion in University of New Orleans Theses and Dissertations by an authorized administrator of ScholarWorks@UNO. For more information, please contact [email protected].

Correlation of Shear Strength Between Longitudinal and Transverse Specimens
A Thesis
Submitted to the Graduate Faculty of the
University of New Orleans
in partial fulfillment of the
requirements for the degree of
Master of Science
in Naval Architecture and Marine Engineering
by
Erasto Fernandez
B.S., Florida Atlantic University, 2010
May 2012

ii
To my parents
for their love, support and encouragement.

iii
ACKNOWLEDGEMENTS
Being part of this project has showed me a new meaning to being part of something bigger than
myself. The Office of Naval Research’s Titanium project and the NSRP’s over‐welding project
have reigned above the variety of projects that are worked by this group; a colorful mix of
undergrads, master and PhD students, post doctorates, visiting scholars and faculty.
My project, under ONR’s titanium project, has involved a great variety of activities from
shipyard visits to NASA, from countless hours of computational analysis to operating unique
prototype equipment and highly valuable machinery. It has been the most challenging and
fulfilling experience in my engineering career and will always be a fond memory and inspiration.
For this I thank the Office of Naval Research for making this program a reality.
First, I would like to thank Dr. Pingsha Dong for giving me an opportunity to be part of this team
and being a great motivation for personal growth, work ethic and perseverance, and for
pushing me to do things I did not know I could and for taking me places I never thought I would
find myself in.
I would like to thank also, Lawrence DeCan, for always being a pillar of support when things
were rough and for pushing me even further even when I thought I had nothing else to give.
Always pushing forward and full of ideas, he has been an inspiration as a superior and a
motivation to always see things from multiple points of view.
Alina Shrestha, Chunge Nie and the rest of our great team, I thank you for being available to
help even when we are all always busy; for creating a fun, happy and friendly environment in
the spaces we all share.
Lastly, I would like to thank my parents for being always there, always aware and always
understanding. Their endless love and support has carried me from starting over in a new
country to where I am now, and it will always be my greatest source of motivation, my biggest
inspiration, and the most humbling gift I will ever receive in my life. Thank you.

iv
TABLE OFCONTENTS
LIST OF FIGURES .................................................................................................................................. v
LIST OF TABLES .................................................................................................................................. vii
I. ABSTRACT ................................................................................................................................ viii
II. INTRODUCTION ........................................................................................................................... 1
III. INTRODUCTION TO WELDING .................................................................................................... 2
A. Weld size and Measuring ................................................................................................. 2
1. Weld legs .......................................................................................................................... 2
2. Weld throat ...................................................................................................................... 6
B. AWS equation for Shear Strength ........................................................................................ 6
C. Fracture path ....................................................................................................................... 7
D. UNO Shear Strength Equations ............................................................................................ 8
1. Longitudinal Shear Strength ............................................................................................. 8
2. Transverse Shear Strength ............................................................................................. 10
E. Heat Affected Zone (HAZ) .................................................................................................. 11
F. Leg Size Variation ............................................................................................................... 12
G. MIG vs. TIG ..................................................................................................................... 13
1. TIG (Tungsten inert gas) ................................................................................................. 13
2. MIG (Metal inert gas) ..................................................................................................... 13
IV. MATERIALS AND SPECIMEN MATRIX ........................................................................................ 15
A. Titanium Alloys ................................................................................................................... 15
1. Ti‐CP (Grade 2): .............................................................................................................. 15
2. Ti‐6‐4 (Grade 5): ............................................................................................................. 15
3. Ti‐4‐2.5 (Grade 38): ........................................................................................................ 15
B. Shear Specimen Matrix ...................................................................................................... 15
V. Pre‐test preparations............................................................................................................. 17
A. Dog Bones .......................................................................................................................... 17
B. Shear Specimens ................................................................................................................ 19
1. Longitudinal Shear Specimens ....................................................................................... 20

v
2. Transverse Shear Specimens .......................................................................................... 20
VI. TESTING ............................................................................................................................... 22
A. Dog Bones .......................................................................................................................... 22
B. Shear Specimens ................................................................................................................ 25
VII. Data Analysis ...................................................................................................................... 27
A. Dog Bones .......................................................................................................................... 27
B. Shear Specimens ................................................................................................................ 29
VIII. CONCLUSIONS ....................................................................................................................... 39
A. Better Shear Strength correlation ..................................................................................... 39
B. Low Shear Strength values for TIG ..................................................................................... 39
C. Larger welds have lower Shear Strength than smaller welds ........................................... 39
WORKS CITED .................................................................................................................................. 40
VITA ............................................................................................................................................... 41
LISTOFFIGURESFigure 1 Throat definition for different weld profiles. a = weld throat. ......................................... 2
Figure 2 Detail cross‐section of a weld ........................................................................................... 2
Figure 3 MIG titanium weld displays measuring standards ........................................................... 3
Figure 4 TIG titanium weld displays measuring standards ............................................................. 3
Figure 5 Digital caliper .................................................................................................................... 4
Figure 6 Weld Leg measuring detail ............................................................................................... 5
Figure 7 NSRP definition of weld throat ......................................................................................... 6
Figure 8 Shear Strength values for typical AWS calculations ......................................................... 7
Figure 9 Typical failure angle for Longitudinal welds [7] ................................................................ 8
Figure 10 Typical failure for Transverse welds [7] .......................................................................... 8
Figure 11 Plot showing the non‐linear distribution of stress along the length of Longitudinal
specimens ....................................................................................................................................... 9
Figure 12 ABAQUS model of longitudinal Shear Specimen ............................................................ 9
Figure 13 SCF curve‐fitting and equation ..................................................................................... 10
Figure 14 Geometric representation of the Transverse weld profile including forces involved .. 11
Figure 15 HAZ shown in this TIG weld macrograph ...................................................................... 12

vi
Figure 16 TIG welding taking place at Textron Shipyard .............................................................. 13
Figure 17 MIG welding taking place at Textron Shipyard ............................................................. 14
Figure 18 Delivered Shear Specimens ........................................................................................... 16
Figure 19 UNO Dog Bone Dimensions .......................................................................................... 17
Figure 20 Delivered Dog Bones ready for measuring ................................................................... 18
Figure 21 ASTM E8 Dog Bone specifications ................................................................................. 18
Figure 22 A batch of Dog Bones after being pulled to failure ...................................................... 19
Figure 23 Longitudinal specimen after welding ............................................................................ 20
Figure 24 Longitudinal specimen after machining is completed .................................................. 20
Figure 25 Transverse specimens after welding ............................................................................ 21
Figure 26 Transverse specimens after machining ........................................................................ 21
Figure 27 Structures Lab at UNO & the MTS machine. ................................................................ 22
Figure 28 MTS Extensometer ready .............................................................................................. 23
Figure 29 Computer interface for the MTS Tensile machine ....................................................... 24
Figure 30 Broken Dog Bone ready for removal from the MTS machine ...................................... 25
Figure 31 MTS machine during testing ......................................................................................... 26
Figure 32 Stress‐strain curve with 2% shift ................................................................................... 27
Figure 33 Close‐up of Stress‐strain curve showing Yield Stress intersection ............................... 28
Figure 34 Typical Load‐Displacement curves for Longitudinal & Transverse specimens ............. 29
Figure 35 Shear strength results for MIG specimens ................................................................... 30
Figure 36 Low shear strength results for TIG specimens .............................................................. 30
Figure 37 Typical TIG profile at the weld root shows large gap for lack of penetration .............. 31
Figure 38 Typical MIG profile at the weld root shows much better quality................................. 31
Figure 39 Macro image of a typical TIG weld shows location of close‐ups .................................. 31
Figure 40 Improved vales for MIG shear strength ........................................................................ 32
Figure 41 Improved values for TIG shear strength ....................................................................... 32
Figure 42 Typical distribution of a 1/8" TIG weld ......................................................................... 33
Figure 43 Typical smaller values for 3/16" welds ......................................................................... 33
Figure 44 Typical profiles at the root of larger 3/16" welds ......................................................... 34
Figure 45 Better penetration is visible in these smaller 1/8" welds............................................. 34
Figure 46 A typical display of the Shear Strength values achieved by the AWS formula and the
lack of correlation between the specimens.................................................................................. 35
Figure 47 A typical display of how UNO Shear Strength results do correlate between
Longitudinal and Transverse specimens ....................................................................................... 35
Figure 48 Lack of fusion is clearly visible in this weld after fracture has occurred ...................... 36
Figure 49 Cold clad is shown in this weld as the base plate separated entirely from the weld
material ......................................................................................................................................... 36
Figure 50 Another example of the recurrent lack of penetration ................................................ 37

vii
Figure 51 An almost vertical disconnection shows a typical cold clad ......................................... 37
Figure 52 AWS results using after fracture measurements do not correlate between specimens
....................................................................................................................................................... 38
Figure 53 Shear Strength correlation between Longitudinal and Transverse specimens is
achieved with UNO's equations .................................................................................................... 38
LISTOFTABLESTable 1 ........................................................................................................................................... 16

viii
I. ABSTRACT
In this thesis, new methods for shear strength are proposed and backed up through extensive
experimentation, ABAQUS models and data analysis of Titanium welds of three different alloys.
The results are compared with those obtained by using the procedure outlined by AWS B4 for
calculating Shear Strength in the transverse and longitudinal directions; this equation is widely
used by the American Welding Society (AWS) and all those in search of more efficient designs
involving welding.
It is a well‐documented issue that the equation provided by AWS yields a large discrepancy
between the values for shear strength of longitudinal and transverse welds.
Key Words: Shear Strength, Titanium, Weld, Welding, TIG, MIG, HAZ, AWS, Stress, Strain.
1
II. INTRODUCTION
The purpose of this paper is to provide results and conclusions on the comparisons between
the standard definition of traction stress based Shear Strength and the new definition proposed
by Dr. Dong and Chunge Nie from the Laboratory for Welded Structures in the college of Naval
Architecture and Marine Engineering at The University of New Orleans (UNO).
The data used in this paper and all of the project’s experimentation was done using specimens
made out of Titanium in the following alloys: Grade 2 Ti‐CP (commercially pure), Grade 5
Ti6Al4V and Grade 38 Ti‐425. An extensive study of the materials themselves had to be
conducted for this is also an area where very few papers have been published and never before
have these amounts of tests been perform on such an unusual material. A secondary purpose
within this paper is to show the capabilities of Titanium.
Due to limited literature available for this project, the majority of the referenced material is
from Dr. Dong’s previous papers and the pending paper from Chunge Nie and Dr. Dong.
This project was executed under funding by the Office of Naval Research (ONR). Specimen
preparation was done by Textron Marine and Land Systems. Textron, ONR and UNO are part of
a team working on the capabilities and the feasibility of using titanium in the ship building
industry in the future.
All available specimens for this project were tested by April 2012.

2
III. INTRODUCTIONTOWELDING
A. WeldsizeandMeasuring
1. Weldlegs
The vertical and horizontal legs on welds are measured in the same manner, although they are
rarely of the same dimensions. This is due to several factors including the human errors
involved in a manual process and the effects of gravity as the weld material settles down.
The vertical and horizontal legs of a weld’s cross‐section go from the root of the weld to the
intersections that the lines originating from the root make with the diagonal line that crosses
both ends of the weld toes. This diagonal line is to be tangent to the inner curvature of the
weld cap when the profile of the weld is concaved; when it is convex, this line will not go any
further away from the root than the connection of both weld toes (Figure 1).
Figure 1 Throat definition for different weld profiles. a = weld throat.
The following image (Figure2) illustrates how the different parts of a weld are broken down:
Figure 2 Detail cross‐section of a weld

3
The following are scaled macro pictures of both TIG and MIG titanium welds with their detail
measurements marked, they show the difference when it comes to measuring the two different
processes used to weld during this project (Figures 3 & 4).
Figure 3 MIG titanium weld displays measuring standards
Figure 4 TIG titanium weld displays measuring standards

4
Leg sizes were measured both before and after fracture with digital calipers (Figure 5). This long
process was carried out six times per weld, including vertical and horizontal legs. All
measurements were done at equal distance of each other to acquire the best possible data;
since the welds vary in length between transverse and longitudinal shear specimens, the space
between the measurements changed to match the weld but always maintaining equal distances
between each measurement. This procedure yielded a large amount of data due to the total
number of welds in all the specimens in the experiment; a total 3888 weld leg measurements
were taken.
In the case of TIG welds, because of the nature of this welding process, the pre‐pulled
measurements had to be brought down by 1mm to account for the meniscus.
Figure 5 Digital caliper
Figure 6 illustrates how the weld leg measuring process took place along the way. We started
by taking the original measurements for X1 and Y1, these values were reduced by the 1mm to
account for the meniscus and yielded the new values for X2 and Y2; these are the values used
for pre‐fracture results.
For the after‐fracture results, the value for X3 was measured off the horizontal legs of all
broken welds; the X3 values were used in formula (1), derived from similar triangles theory, to
scale the Y2 values and yield the Y3 values to complete the after‐fracture weld measurements.
3 ∗ (1)

5
Figure 6 Weld Leg measuring detail

6
2. Weldthroat
The throat of the weld is measured from the root straight to the line joining the weld toes or
the tangent of the inner curve of the weld cap (Figure 7); this depends on the weld profile as
explained on a previous section of this thesis.
Figure 7 NSRP definition of weld throat
B. AWSequationforShearStrength
The AWS formula for calculating Shear Strength has been around for quite a while and it is
known that it yields values for longitudinal and transverse loads with a large difference
between them (Figure 8); There have been other publications that present far more detailed
studies explaining the reasons for this behavior, such as the works from Kato and Marta [9] and
Timoshenko [8]. This thesis works to provide support of new equations being proposed by
members of this team [4] and to prove that they achieve a much higher level of correlation
between shear strength in longitudinal and transverse specimens.
The AWS formula for Shear Strength is as follows:
∗ (2)
As it is mentioned before, this formula produces results with a large discrepancy between
longitudinal and transverse Shear Strength values, this is due in part to the assumption that all
welds fracture at 45° from the root; it is a well‐documented observation that transverse welds
fracture at an angle of approximately 22.5°, making this a different enough process to require
other considerations [4].

7
Figure 8 Shear Strength values for typical AWS calculations
Furthermore, the stresses in transverse welds when put under load, have a linear distribution
along the length of the weld, contrary to the nonlinear distribution present in longitudinal
welds along the same path; this also indicates the need for specific formulations and
procedures for each of the two situations. A much more detailed account for these matters is
explained in Nie and Dong’s work [4].
C. Fracturepath
The welds will fracture along different paths depending if they are Longitudinal or transverse
specimens to be tested.
The weld fracture in Longitudinal Shear specimens will follow its path approximately along 45°,
originating at the weld root and making its way to the tangent line; this happens due to shear
forces acting in opposite directions parallel to the weld length [10], furthermore, the smallest
area within the weld along its length is present at an angle of 45° originating from the root.
This path is shown on the following picture in the cross‐section of a tested longitudinal
specimen (Figure 9):
0
20
40
60
80
100
120
140
31 32 33 34 35 36
Shear strength (ksi)
Specimen
Ti‐CP/MIG (s=3/16")AWS

8
Figure 9 Typical failure angle for Longitudinal welds [7]
The weld fracture in Transverse Shear specimens will follow its path approximately along 22.5°,
originating at the weld root and making its way to the tangent line. The following picture shoes
the path of fracture in a transverse specimen (Figure 10):
Figure 10 Typical failure for Transverse welds [7]
D. UNOShearStrengthEquations
1. LongitudinalShearStrength
As mentioned before, stress is not linearly uniform along the length of longitudinal welds,
therefore, FEA models (Figure 12) are required to plot the distribution of stress and identify the
ultimate stress when the weld fails (Figure 11). Finding this value is critical for the calculation of
the Stress Concentration Factor or SCF, a crucial part of the equation.

9
Figure 11 Plot showing the non‐linear distribution of stress along the length of Longitudinal specimens
Figure 12 ABAQUS model of longitudinal Shear Specimen
The SCF is defined as the maximum stress value divided by the average stress along the weld
length.
∗
(3)
Maximum stress value provided by the FEA model’s stress distribution curve
Load applied to specimen [lbs]

10
Weld throat at 45°[in]
Total weld length [in]
Solving equation (2) for provides the UNO equation for Longitudinal Shear Strength:
∗
∗ (4)
During the process of this project, several models were created and their respective SCF values
were used for curve‐fitting and obtaining the following equation that allows us to find a
specimen’s SCF without having to create new models for each one; the curve and equation
provided here apply only to the specific design of our specimens.
(5)
Figure 13 SCF curve‐fitting and equation
2. TransverseShearStrength
Extensive detail and precise description of the derivations and procedures relevant to this
equation are available in the literature referenced throughout this thesis [4].
The UNO equation governing Transverse welds is derived from the geometrical nature of the
weld (Figure 14).

11
Figure 14 Geometric representation of the Transverse weld profile including forces involved
Equation (5) is the resulting formula for Shear Strength provides a tool that assumes a failure
angle of 22.5° and yields proper correlation with its counterpart longitudinal shear strength.
. ∗
∗ (6)
E. HeatAffectedZone(HAZ)
The HAZ is the volume of base metal that has been affected during the welding process to the
point of altering its microstructure and properties. This volume is clearly depicted in Figure 2 in
this thesis.
The extend of these effects causing the HAZ may vary due to different factors such as weld and
filler material, amount of heat put in during the process and how concentrated this heat is
along the specimen. These effects are shown in the following TIG weld where it can be easily
seen how the microstructure changes beyond the point where weld filler material and base
metal mix (Figure 15).

12
Figure 15 HAZ shown in this TIG weld macrograph
F. LegSizeVariation
Welding during this project was done completely by hand and it relied entirely on the welder’s
abilities and expertise. The welder, knowing the target size, had to picture the size as he laid the
weld down; this makes the welding process very subjective and dependent on the welder’s
correct knowledge and definition of the sizes required. While the welder might be hitting his
target to very high level of accuracy, if his mental target is not exactly the same as the real
dimension the design requires then the weld will be constantly off from the mark.
We want to obtain the smallest possible weld that we can prove sufficient for the structure at
hand, for this the welder has to be able to consistently lay accurate welds at the desired target
size.
13
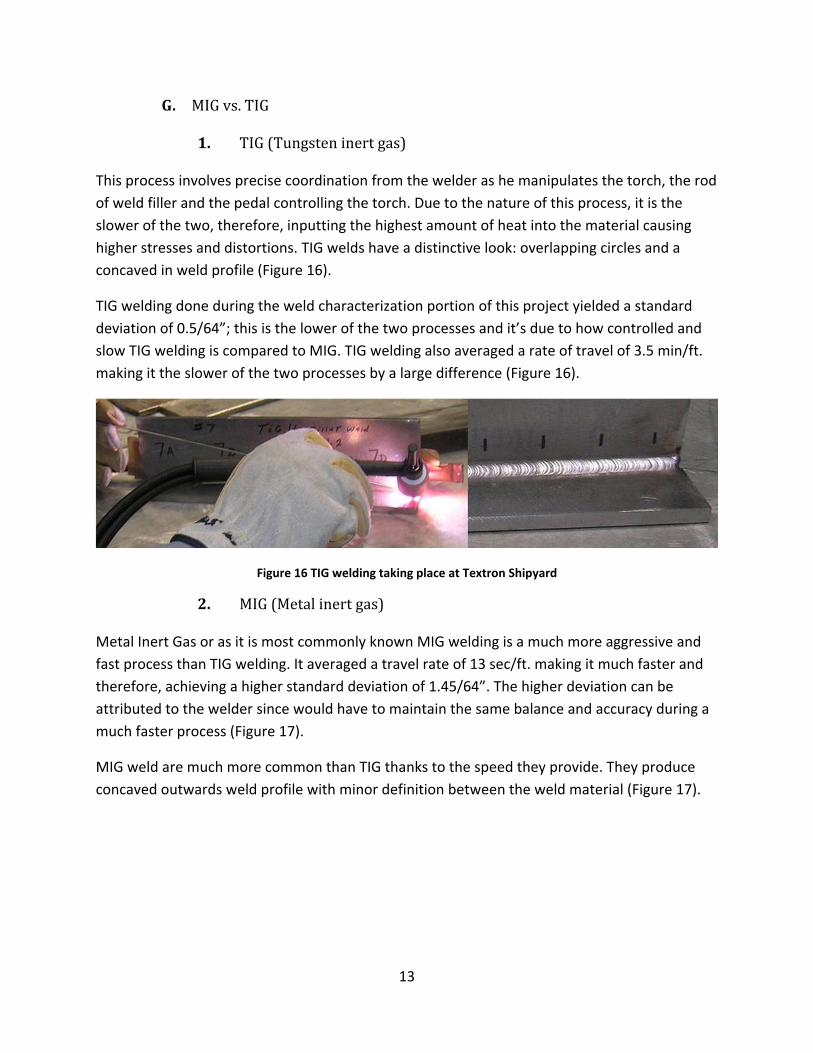
G. MIGvs.TIG
1. TIG(Tungsteninertgas)
This process involves precise coordination from the welder as he manipulates the torch, the rod
of weld filler and the pedal controlling the torch. Due to the nature of this process, it is the
slower of the two, therefore, inputting the highest amount of heat into the material causing
higher stresses and distortions. TIG welds have a distinctive look: overlapping circles and a
concaved in weld profile (Figure 16).
TIG welding done during the weld characterization portion of this project yielded a standard
deviation of 0.5/64”; this is the lower of the two processes and it’s due to how controlled and
slow TIG welding is compared to MIG. TIG welding also averaged a rate of travel of 3.5 min/ft.
making it the slower of the two processes by a large difference (Figure 16).
Figure 16 TIG welding taking place at Textron Shipyard
2. MIG(Metalinertgas)
Metal Inert Gas or as it is most commonly known MIG welding is a much more aggressive and
fast process than TIG welding. It averaged a travel rate of 13 sec/ft. making it much faster and
therefore, achieving a higher standard deviation of 1.45/64”. The higher deviation can be
attributed to the welder since would have to maintain the same balance and accuracy during a
much faster process (Figure 17).
MIG weld are much more common than TIG thanks to the speed they provide. They produce
concaved outwards weld profile with minor definition between the weld material (Figure 17).

14
Figure 17 MIG welding taking place at Textron Shipyard

15
IV. MATERIALSANDSPECIMENMATRIX
A. TitaniumAlloys
1. Ti‐CP(Grade2):
Titanium “CP” or commercially pure, is unalloyed and in this case is of grade 2. Commercially
pure titanium varies from grades 1 to 4, as the grade increases so does the tensile and yield
strength of the metal. These variations occur between the four grades due to the different
percentages of interstitial elements or “impurities” in the different metals.
2. Ti‐6‐4(Grade5):
Grade 5 titanium is the most commonly used of all the alloys present in this project, it is also
known as Ti6AL4V, Ti‐6AL‐4V and as referred within this team: Ti‐6‐4. The popularity of this
particular alloy is due to it being heat treatable and stronger than CP while retaining most of
the thermal properties.
The alloy’s chemical composition is formed by 6% aluminum, 4% vanadium, a maximum of
0.25% iron, a maximum of 0.25% oxygen and the balance in titanium [6].
3. Ti‐4‐2.5(Grade38):
Grade 38’s composition is formed by 4% aluminum, 2.5% vanadium, 1.5% iron and the balance
in titanium. This alloy was created by Allegheny Technologies Incorporated (ATI) and they were
the sole providers of this metal during this project. ATI called the alloy: ATI 425; it is very similar
in its properties to Grade 5 yet it has much better cold workability like other “weaker” alloys
[5].
B. ShearSpecimenMatrix
The test specimen matrix (Table 1) shows all the specimens that were required by the project
and tested by April 2012. These specimens were made of the previously mentioned materials;
each different material was used in eight sets of three specimens. These eight sets differed in
weld direction (longitudinal or transverse), Weld target size (1/8” or 3/16”) and the welding
process used (TIG or MIG).
All specimens were fabricated by Textron and delivered to the laboratory at UNO (Figure 18).

16
Table 1
Figure 18 Delivered Shear Specimens

17
V. Pre‐testpreparations
A. DogBones
The specimens referred to as “dog bones” were designed (Figure 19) by the UNO team and up
to the specifications set by the American Society for Testing and Materials in their standard for
Tension Testing of Metallic Materials ASTM E8 [1] (Figure 21). These specimens were tested to
establish basic material properties of the alloys used in the Titanium project; although this data
was used in this project, it has served other projects under the mantel of the Titanium project
as well.
The Dog Bones were cutout by Textron Marine and Land System at their shipyard; they were
delivered to UNO for inspection, testing and analysis.
Figure 19 UNO Dog Bone Dimensions
All Dog Bones were separated into their respective groups of three specimens (Figure 20) and
then measured individually for width at the grip sections, width at the gage section, thickness
throughout the entire specimen, and total length; as indicated in the ASTM E8 [1] (Figure 21)
standard’s procedure. Several measurements were taken for each location and then averaged
for a more accurate analysis.

18
Figure 20 Delivered Dog Bones ready for measuring
Figure 21 ASTM E8 Dog Bone specifications
For future reference of this project and the specimens tested, all measurements were saved
along with pictures of each individual specimen before and after testing (Figure 22).

19
Figure 22 A batch of Dog Bones after being pulled to failure
B. ShearSpecimens
All shear specimens were delivered together to UNO, at this point the team began to prepare
all 72 specimens for testing; this involved similar but not identical procedure for both
longitudinal and transverse pieces.
All specimens were marked on all four major plates in case any of them separated from the
main body after failure. All welds were numbered on each specimen for further tracking of the
failure process.
All welds were measured before the specimens were pulled. The measuring techniques are
explained with further detail on the corresponding section of this thesis.
Shear specimens were designed as close as possible to meet the ASTM E8 standard [2]; the
weld length on the titanium samples had to be shorten so that they would be able to be pulled
at UNO due to limitations with the MTS machine.
20
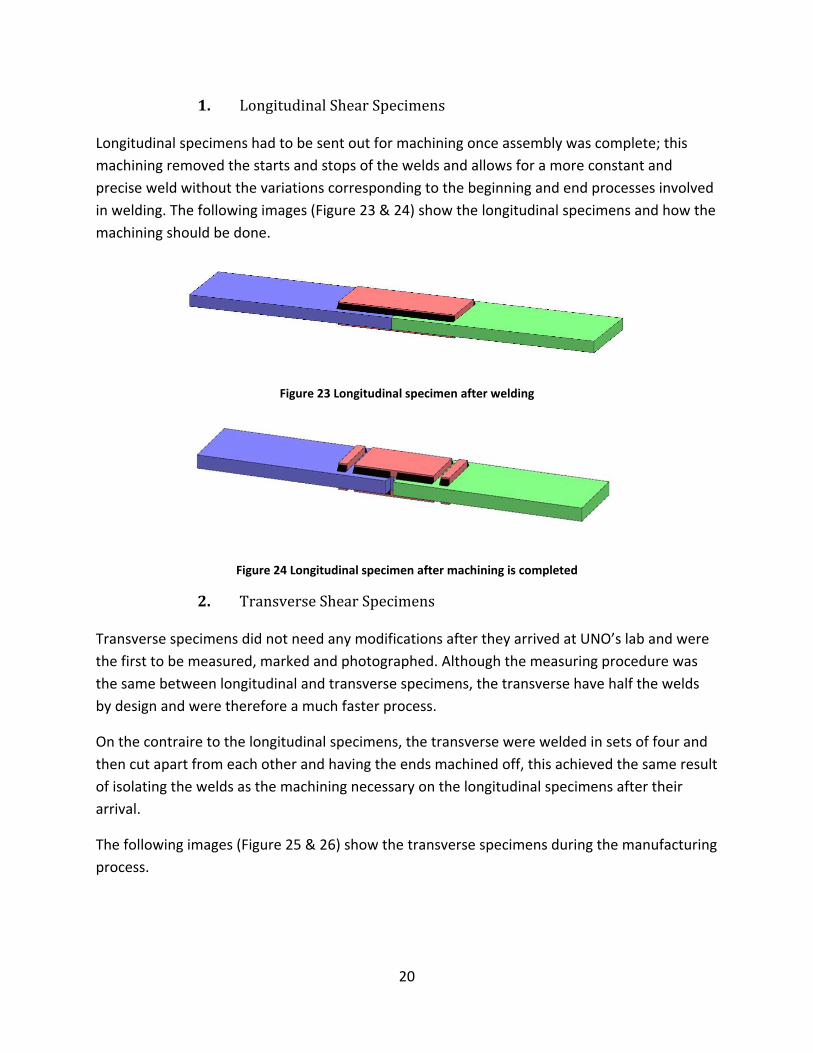
1. LongitudinalShearSpecimens
Longitudinal specimens had to be sent out for machining once assembly was complete; this
machining removed the starts and stops of the welds and allows for a more constant and
precise weld without the variations corresponding to the beginning and end processes involved
in welding. The following images (Figure 23 & 24) show the longitudinal specimens and how the
machining should be done.
Figure 23 Longitudinal specimen after welding
Figure 24 Longitudinal specimen after machining is completed
2. TransverseShearSpecimens
Transverse specimens did not need any modifications after they arrived at UNO’s lab and were
the first to be measured, marked and photographed. Although the measuring procedure was
the same between longitudinal and transverse specimens, the transverse have half the welds
by design and were therefore a much faster process.
On the contraire to the longitudinal specimens, the transverse were welded in sets of four and
then cut apart from each other and having the ends machined off, this achieved the same result
of isolating the welds as the machining necessary on the longitudinal specimens after their
arrival.
The following images (Figure 25 & 26) show the transverse specimens during the manufacturing
process.

21
Figure 25 Transverse specimens after welding
Figure 26 Transverse specimens after machining

22
VI. TESTING
Specimens for this project were divided in two major groups, one being the Dog Bones for base
material property analysis and the other being the shear test specimens for establishing a
better correlation between the longitudinal and transverse shear values.
A. DogBones
The Dog Bones were tested one by one on the MTS tensile machine in the Structures
Laboratory at The University of New Orleans (Figure 27). The procedure that was programed
into the machine’s computer was designed up to the same standards that govern the entire test
[2]; this allowed to a slow initial pull until the specimen was just pass its yield point, after that
point the pulling rate increased automatically and continued at the new rate until failure of the
specimen; at this point the machine stopped and reset itself for a new specimen to be mounted
(Figure 30).
Figure 27 Structures Lab at UNO & the MTS machine.

23
Using the metal stoppers provided by MTS the specimens were set centered within the wedges;
the same area was gripped at both ends of all specimens. An extensometer (Figure 28), also by
MTS, was used to measure the elongation of the specimens to a higher degree of accuracy than
the values given by the machine. The extensometer was positioned carefully within the gage
length of the Dog Bones after they were set on the machine ready to be pulled.
Figure 28 MTS Extensometer ready
Once the data showed that the specimen had passed the point of yield (Figure 33), the test was
paused automatically and the extensometer removed to avoid any damage at the point of
failure. The test was resumed once the instrument was off the specimen and the operator was
cleared and in a safe location.

24
Figure 29 Computer interface for the MTS Tensile machine
After the specimen was successfully pulled (Figure 30) and the data recorded, the pieces were
removed from the wedges and stored; the machine was checked for any possible consequences
of the recurring testing and then the process continued with each one of the Dog Bones.
25
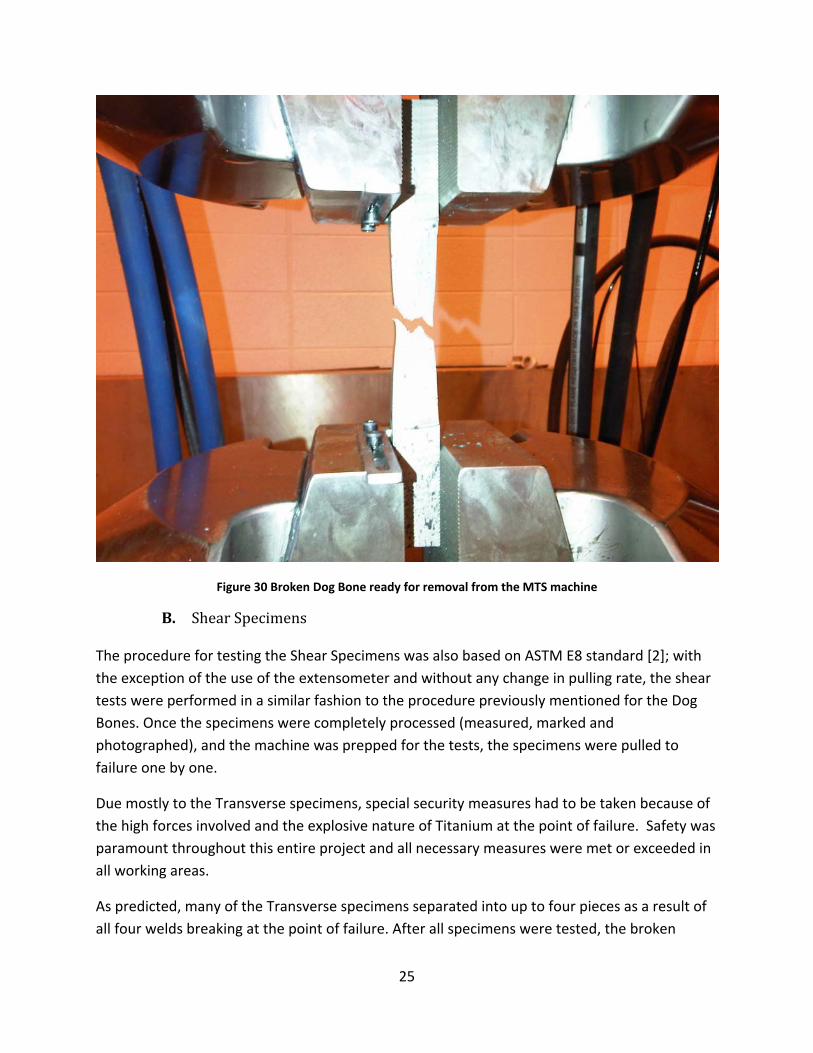
Figure 30 Broken Dog Bone ready for removal from the MTS machine
B. ShearSpecimens
The procedure for testing the Shear Specimens was also based on ASTM E8 standard [2]; with
the exception of the use of the extensometer and without any change in pulling rate, the shear
tests were performed in a similar fashion to the procedure previously mentioned for the Dog
Bones. Once the specimens were completely processed (measured, marked and
photographed), and the machine was prepped for the tests, the specimens were pulled to
failure one by one.
Due mostly to the Transverse specimens, special security measures had to be taken because of
the high forces involved and the explosive nature of Titanium at the point of failure. Safety was
paramount throughout this entire project and all necessary measures were met or exceeded in
all working areas.
As predicted, many of the Transverse specimens separated into up to four pieces as a result of
all four welds breaking at the point of failure. After all specimens were tested, the broken

26
horizontal legs were re‐measured using the digital calipers (Figure5); these after‐failure
horizontal values for leg size were used with the theory of similar triangles [12] to scale the
measured before‐failure vertical legs while preserving the geometry of the welds. This new
measured after‐failure data was to compared correlation of Shear Strength alongside the target
weld sizes; this process was carried out for the results to take into account all imperfections
contained within the welds (Figure 37).
Figure 31 MTS machine during testing

27
VII. DataAnalysis
A. DogBones
As mentioned previously, the sole purpose of the Dog Bone experiments was to determine and
corroborate base material properties and so aid the process of proving UNO’s equations for
correlating Shear Strength. When such an aid was necessary, Stress‐strain graphs such Figures
32 & 33 were produced to find Yield and Ultimate strengths of the material in question.
Detailed explanation of this procedure is thoroughly explained by Dr. Dong in his publication
[11].
The 2% shift mentioned in Dr. Dong’s work is used in Figure 32 & 33 to find the Yield Strength of
the material; this is detailed on Figure 33 with a close‐up of Figure 32.
Figure 32 Stress‐strain curve with 2% shift

28
Figure 33 Close‐up of Stress‐strain curve showing Yield Stress intersection

29
B. ShearSpecimens
A vast amount of data was collected from the 72 titanium shear specimens tested; questions
and interesting facts were abundant as the data was revised.
Figure 34 shows the typical profiles that load‐displacement curves have for both Longitudinal
and Transverse specimens.
Figure 34 Typical Load‐Displacement curves for Longitudinal & Transverse specimens
Two major issues were observed during the analysis process, these are believed to explain
some of the misrepresenting data found in the later stages of the project. Values for Shear
Strength were found to be distinctively lower in various batches of TIG welded specimens than
those of MIG welded samples where both sets are targeted at the same leg size. Also, values for
Shear Strength of welds targeted at larger sizes were found to be smaller than those targeted at
smaller leg sizes while they both were of the same weld procedure and material.
These two phenomena are believed to be caused mostly due to a higher concentration of weld
imperfections in TIG welded samples and in larger leg size welds. The following charts (Figures
35 & 36) showcase the discrepancies found between TIG and MIG welded specimens
manufactured to the same leg size and with the same materials:
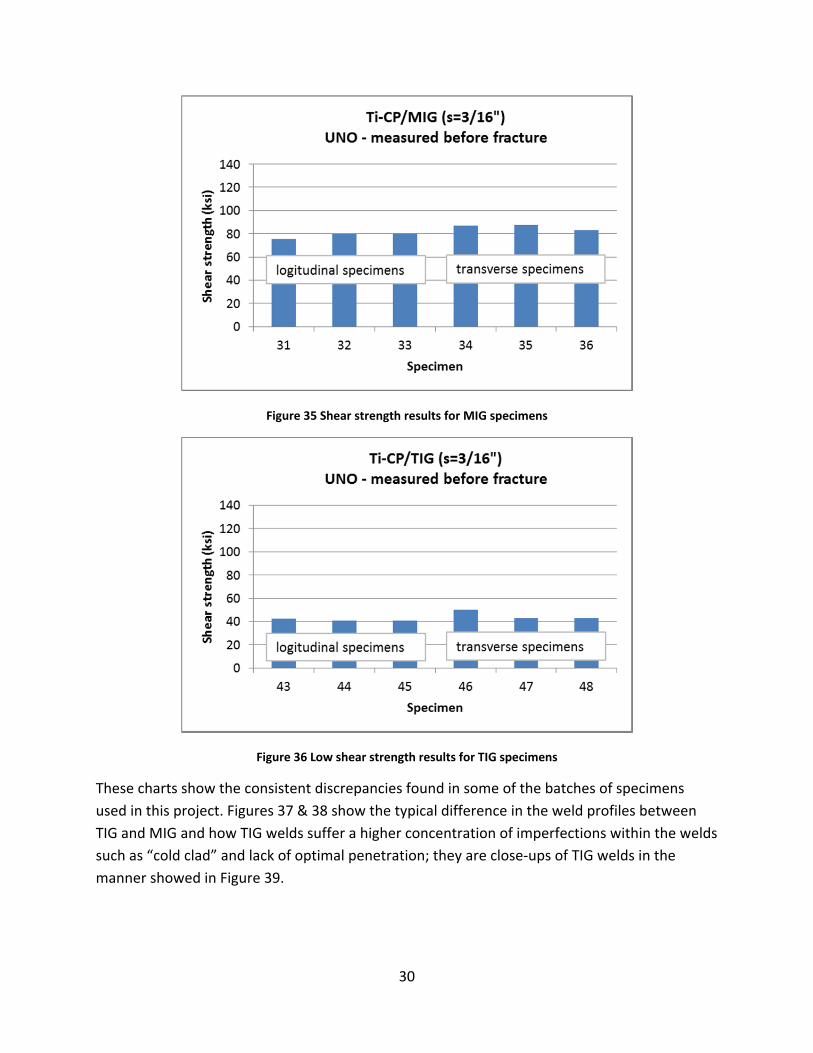
30
Figure 35 Shear strength results for MIG specimens
Figure 36 Low shear strength results for TIG specimens
These charts show the consistent discrepancies found in some of the batches of specimens
used in this project. Figures 37 & 38 show the typical difference in the weld profiles between
TIG and MIG and how TIG welds suffer a higher concentration of imperfections within the welds
such as “cold clad” and lack of optimal penetration; they are close‐ups of TIG welds in the
manner showed in Figure 39.
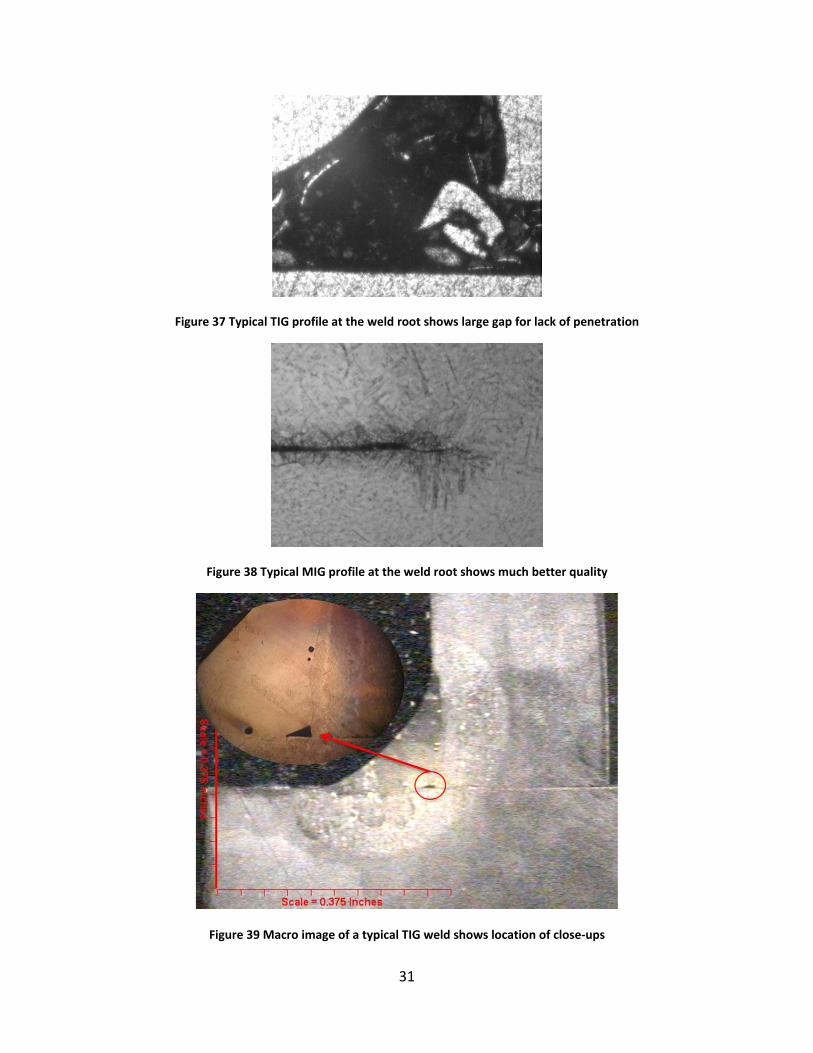
31
Figure 37 Typical TIG profile at the weld root shows large gap for lack of penetration
Figure 38 Typical MIG profile at the weld root shows much better quality
Figure 39 Macro image of a typical TIG weld shows location of close‐ups

32
After considering these irregularities between the different size welds, we took them into
account and used the after‐fracture measurements. As shown in Figures 40 & 41 , the ratio
between MIG and TIG shear strengths improved approximately 20% by using the more accurate
after‐fracture weld leg sizes; although this is an improvement, it does not reconcile the
differences between the two welding processes entirely, this might be due to other issues
present in the specimens used in this project and they should be investigated further in future
research.
Figure 40 Improved vales for MIG shear strength
Figure 41 Improved values for TIG shear strength

33
The following charts show the irregularities between large and small targeted leg size
specimens and how those intended to be larger failed at lower loads (Figures 42 & 43).
Figure 42 Typical distribution of a 1/8" TIG weld
Figure 43 Typical smaller values for 3/16" welds
The previous charts serve to showcase the irregularity of the larger welds having lower Shear
Strength values than the larger ones; this is believed to be due to a higher concentration of
imperfections in larger welds. The following images show typical close‐ups at the root of the
welds; they confirm the trend that larger welds contain imperfections more often and larger

34
than smaller welds (Figures 44 & 45). The area within the weld profile from which these images
come from is illustrated in Figure 39.
Figure 44 Typical profiles at the root of larger 3/16" welds
Figure 45 Better penetration is visible in these smaller 1/8" welds
Taking into account those irregularities, those specimens deemed defective are set aside as we
now look to compare the correlation between Longitudinal and Transverse Shear Strength
values with the improved formulas. Figure 46 & 47 show the typical comparison between the
correlation achieved by AWS and that obtained by UNO when both are using data measured
before the specimens are tested.

35
Figure 46 A typical display of the Shear Strength values achieved by the AWS formula and the lack of correlation between the specimens
Figure 47 A typical display of how UNO Shear Strength results do correlate between Longitudinal and Transverse specimens
The imperfections that cause these issues are illustrated in the photographs shown next.
Figures 48 ‐ 51 display the typical outcome of a test conducted with flawed specimen.

36
Figure 48 Lack of fusion is clearly visible in this weld after fracture has occurred
Figure 49 Cold clad is shown in this weld as the base plate separated entirely from the weld material

37
Figure 50 Another example of the recurrent lack of penetration
Figure 51 An almost vertical disconnection shows a typical cold clad
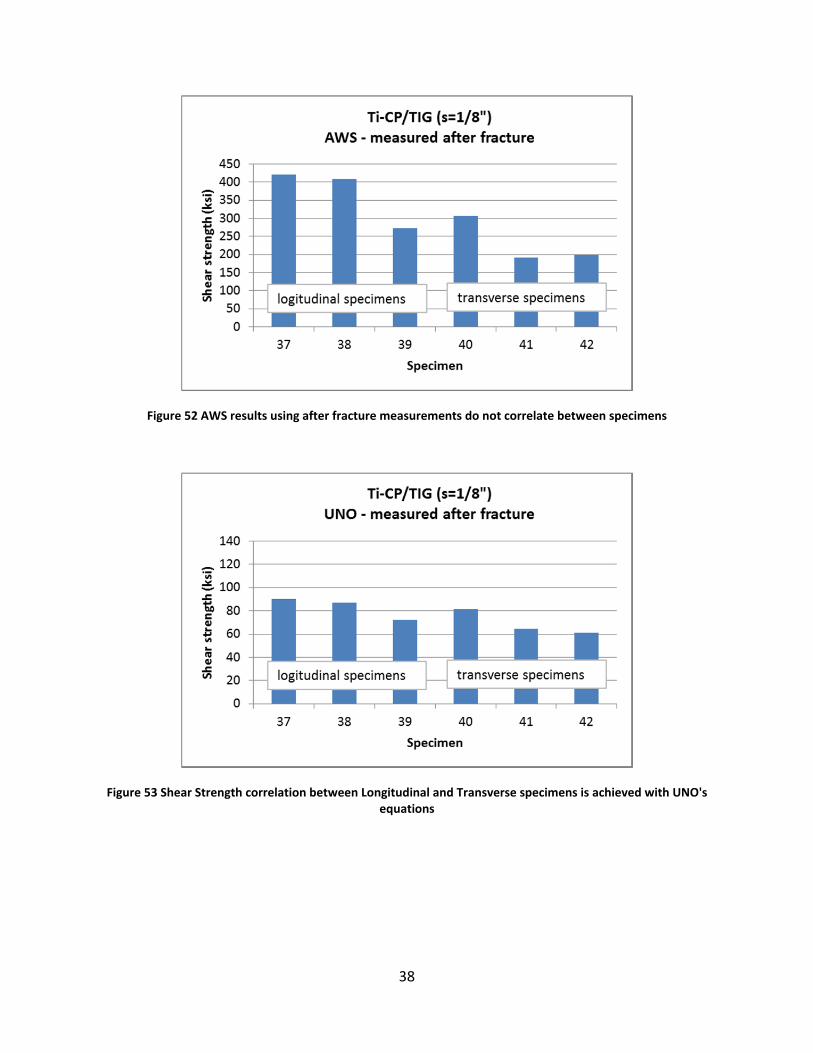
Adding another level of complexity to the study, the results are compared using the data
obtained after the specimens were tested to failure. Figure 52 shows how AWS values correlate
even worse when the real values for leg sizes are used; this after‐breaking values take into
account all imperfections, making them more accurate compared to the values measured
before fracture. Figure 53 shows how UNO’s equations continue to yield values for Shear
Strength that correlate much better between Longitudinal and Transverse specimens.
38
Figure 52 AWS results using after fracture measurements do not correlate between specimens
Figure 53 Shear Strength correlation between Longitudinal and Transverse specimens is achieved with UNO's equations

39
VIII. CONCLUSIONS
A. BetterShearStrengthcorrelation
The equations provided and used by the UNO team show the best correlation for Shear
Strength between Longitudinal and Transverse specimens whether the data is acquired before
or after the testing is conducted. AWS’s values do not correlate in either case, yet they show a
trend to worsen when using the more realistic data measured after testing was conducted.
B. LowShearStrengthvaluesforTIG
TIG welded specimens show a trend to have lower Shear Strength values than their MIG
counterpart with the same leg size target and materials. Partially, this trend can be explained by
an observed higher concentration of larger imperfections within TIG welds than those found in
MIG welded specimens. Lack of penetration and cold clads are among the issues that repeat
themselves more often in TIG welding than in MIG processes. The issue was improved
approximately by 20% by using weld leg sizes measured after fracture; this improvement does
not entirely get rid of the discrepancies found between MIG and TIG specimen’s shear strength
and therefore, further research ought to be conducted in other areas such as microstructures
and increased detail in the differences between the two weld processes must be recorded to
reach a better explanation of why the discrepancy still persists.
C. LargerweldshavelowerShearStrengththansmallerwelds
This issue was also shown to be a consequence of weld imperfections being most common in
larger welds than they are in smaller ones. This issue also serves to empower the call for
smaller welds in industry that these projects all attempt to achieve; lowering weld sizes will
reduced the stresses and distortions found in welded structures, and while still being strong
enough for the necessary applications, this will also reduce weight and manufacturing costs.

40
WORKSCITED
[1] AWS B4.0: 2007 Standard Methods for Mechanical Testing of Welds
[2] ASTM E8
[3] Krumpen Jr., R.P.; Jordan, C.R.. Reduced fillet weld sizes for naval ships. Welding Journal,
1984, 63(4): 34~41
[4] Nie, C.; Dong, P.. Traction Stress Based Shear Strength Definition of Fillet Welds. Pending
Publishing.
[5] ATI 38‐644 Beta Titanium Alloy. Technical Data Sheet.
[6] Oxford Alloys, Inc. Certified Material Test Report for Grade 5 Titanium.
[7] R. W. McClellan. Evaluation of the fillet weld shear strength of flux cored arc welding electrodes. NSRP 0320, paper No. 5B‐1, 1990.
[8] S. Timoshenko. Theory of elasticity. McGraw‐Hill Book Co., 1951 [9] Ben Kato, Koji Morita. Strength of transverse fillet welded joints. Welding Journal, 1974,
53(2): 59~64 [10] G. Kamtekar. A new analysis of the strength of some simple fillet welded connections.
Journal of Constructional Steel Research, 1982, 2(2): 33~45 [11] Dong, P , Hong, JK et al, “The Master S‐N Curve Method: An Implementation For Fatigue
Evaluation Of Welded Components in the 2007 ASME B&PV Code, Section VIII, Division 2 and API 579‐1/ASME FFS‐1,” WRC Bulletin, No. 523, December, 2010, New York, New York.
[12] Similar Triangles. http:// www.mathopenref.com/similartriangles.html

41
VITA
Erasto Fernandez was born in Caracas, Venezuela to Erasto Fernandez and Claudia Zapata. He
received his undergraduate degree in Ocean Engineering at Florida Atlantic University in May
2010. He became a Citizen of the United States of America in 2011. He will be receiving his
graduate degree at the University of New Orleans in May 2012. He has worked for Dr. Pingsha
Dong as a graduate assistant in the School of Naval Architecture and Marine Engineering for
over a year now and will continue to do so as he pursues his PhD in the same College and
concentration.


![A CORRELATION ANALYSIS OF SHEAR …...Direct Shear (DS) Test [3] The DS test is the oldest experiment proposed by Coulomb which uses a box cutter type appliance for determining the](https://img.pdfslide.net/doc/110x75/5e74ccc37db70c0bed0887fe/a-correlation-analysis-of-shear-direct-shear-ds-test-3-the-ds-test-is-the.jpg)


![A CORRELATION ANALYSIS OF SHEAR PARAMETERS … · Direct Shear (DS) Test [3] The DS test is the oldest experiment proposed by Coulomb which uses a box cutter type appliance for determining](https://img.pdfslide.net/doc/110x75/5b32bb577f8b9a81728cd980/a-correlation-analysis-of-shear-parameters-direct-shear-ds-test-3-the-ds.jpg)