Embed Size (px)
Citation preview

CORRELATION OF TENSILE PROPERTIES WITH STABILITY AND COHESIOMETER VALUES FOR ASPHALT-TREATED MATERIALS
by
William O. Hadley W. Ronald Hudson Thomas W. Kennedy
Research Report Number 98-6
Evaluation of Tensile Properties of Subbases for Use in New Rigid Pavement Design
Research Project 3-8-66-98
cond uc ted for
The Texas Highway Department
in cooperation with the U. S. Department of Transportation
Federal Highway Administration Bureau of Public Roads
by the
CENTER FOR HIGHWAY RESEARCH
THE UNIVERS ITY OF TEXAS AT AUSTIN
June 1970

The op~n~ons, findings, and conclusions expressed in this publication are those of the authors and not necessarily those of the Bureau of Public Roads.
ii

PREFACE
This is the sixth report in a series of reports emanating from Project
3-8-66-98, "Evaluation of Tensile Properties of Subbases for Use in New Rigid
Pavement Design." This report is slightly different from previous oneS in that
it attempts to show the relationship between tensile properties of asphalt
treated materials and the traditional tests conducted on these materials by
the Texas Highway Department, including the Hveem stabilometer and cohesiometer
tests. As the study of tensile properties and their use in design becomes more
prevalent, it may be desirable to be able to estimate tensile properties from
previously determined cohesiometer or stabilometer values. Likewise, where
tensile properties are available for a material but estimates for cohesiometer
and stabilometer values are needed, these results may be used.
A rather sophisticated statistical technique has been used to provide the
engineer with a value judgment on the quality of the correlation for each pair
of variables. The report is divided into two parts in order to document the
study and at the same time make the results useful to the engineer. Chapters 1,
2, and 3 contain the information necessary for the engineer to utilize the
data. The remainder of the report, including the appendices, provides back
ground information on the statistical techniques used and details on how the
tests were conducted. This information will be useful for researchers and
others desiring to extend the work.
This report required the assistance of many individuals and the authors
would like to acknowledge the work of all those who contributed to it. Special
thanks are extended to Dr. Gerald R. Wagner and Mr. Joseph Kozuh for their
help in designing the statistical experiment and in providing guidance in the
analysis of the data. Special appreciation is also due Messrs. Pat S. Hardeman
and James N. Anagnos for their assistance in the preparation and testing of
iii

iv
the lime-treated materials, and to Messrs. James L. Brown and Harvey J. Trey
big of the Texas Highway Department, Hho provided the technical liaison for the
project.
June 1970
William o. Hadley W. Ronald Hudson Thomas W. Kennedy

LIST OF REPORTS
Report No. 98-1, "An Indirect Tensile Test for Stabilized Materials," by W. Ronald Hudson and Thomas W. Kennedy, summarizes current knowledge of the indirect tensile test, reports findings of limited evaluation of the test, and describes the equipment and testing techniques developed.
Report No. 98-2, IIAn Evaluation of Factors Affecting the Tensile Properties of Asphalt-Treated Materials," by William O. Had ley, W. Ronald Hudson, and Thomas W. Kennedy, discusses factors important in determining the tensile strength of asphalt-treated materials and reports findings of an evaluation of eight of these factors.
Report No. 98-3, "Evaluation of Factors Affecting the Tensile Properties of Cement-Treated Materials," by Humberto J" Pendola, Thomas W. Kennedy, and W. Ronald Hudson, presents factors important in determining the strength of cement-treated materials and reports findings of an evaluation by indirect tensile test of nine factors thought to affect the tensile properties of cement-treated materials.
Report No. 98-4, "Evaluation of Factors Affecting the Tensile Properties of Lime-Treated Materials," by S. Paul Miller, Thomas W. Kennedy, and W. Ronald Hudson, presents factors important in determining the strength of cementtreated materials and reports findings of an evaluation by indirect tensile test of eight factors thought to affect the tensile properties of limetreated materials.
Report No. 98-5, "Evaluation and Prediction of the Tensile Properties of LimeTreated Materials,1I by Walter S. Tulloch, II, W. Ronald Hudson, and Thomas W. Kennedy, presents a detailed investigation by indirect tensile test of five factors thought to affect the tensilE! properties of lime-treated materials and reports findings of an investigation of the correlation between the indirect tensile test and standard Texas Highway Department tests for lime-treated materials.
Report No. 98-6, "Correlation of Tem:ile Properties with Stability and Cohesiometer Values for Asphalt-Treated Materials," by William O. Hadley, W. Ronald Hudson, and Thomas W. Kennedy, presents a detailed correlation of indirect tensile test parameters, i.e., strength, modulus of elasticity, POisson's ratio, and failure strain, with stabi.lity and cohesiometer values for asphalttreated materials.
Report No. 98-7, IIA Method of Estimating Tensile Properties of Materials Tested in Indirect TenSion," by William O. Hadley, W. Ronald Hudson, and Thomas W. Kennedy, presents the development of equations for estimating material properties such as modulus of elasticity, Poisson's ratio, and tensile strain based upon the theory of the indirect tensile test and reports verification of the equations for aluminum.
v

ABSTRACT
This report describes a study to determine the correlation between the
tensile properties of asphalt-treated materials tested in indirect tension
and the stability and cohesiometer values for identical companion specimens
tested in the Hveem stabilometer and cohesiometer. The parameters obtained
from the indirect tensile test included tensile strength at failure, estimated
tensile strain at failure, Poisson's ratio, and modulus of elasticity, each of
which was compared with both the stability and cohesiometer values.
The test results for analyses found to be significantly correlated are
presented in tables and displayed in scatter diagrams, with the tensile
properties obtained from the indirect tensile tests plotted on the ordinate
and either the stability or cohesiometer values plotted on the abscissa. The
techniques used to characterize the relationship between the responses of
the Hveem and indirect tensile tests as (1) no correlation, (2) a trend, or
(3) acceptable correlation are also described in the report. The least
squares lines of best fit between the test responses are also presented in
the scatter diagrams, which also show the regions within which 95 percent of
all data points would be expected to fall.
Statistical significance tests ,,Jere used to determine whether or not the
results of the two experiments could be combined to illustrate general rela
tionships between tensile properties and stability and cohesiometer values.
Conclusions based on the correlation results are presented in the report
and indicate that correlations between the parameters obtained from the in
direct tensile test and the Hveem st<lbility and cohesiometer values are de
pendent upon the confines of the study. In general, stability values corre
lated with Poisson's ratio and tensile strain while the cohesiometer values
correlated with modulus of elasticity, tensile strength, and tensile strain.
KEY WORDS: indirect tensile test, stabilometer, cohesiometer, asphalt-treated material, modulus of elasticity, Poisson's ratio, tensile strength, tensile strain, stability, cohesiometer value, regression analysis, correlation.
vi
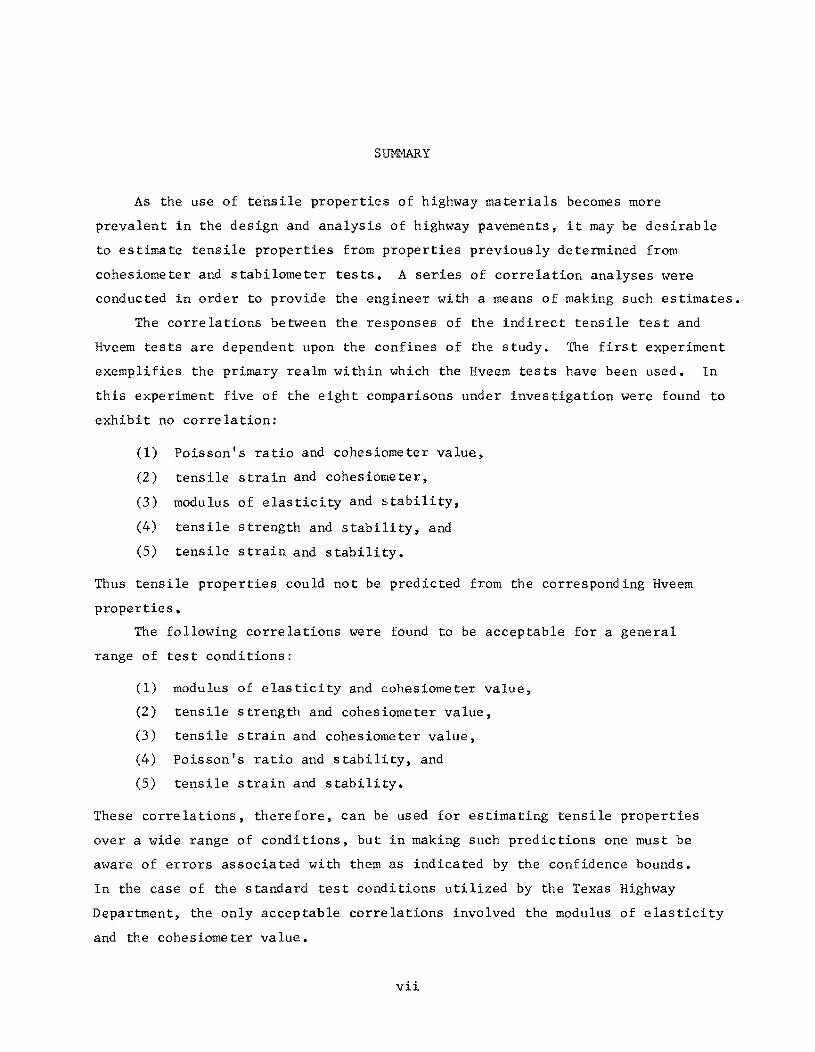
SUMMARY
As the use of tensile properties of highway materials becomes more
prevalent in the design and analysis of highway pavements, it may be desirable
to estimate tensile properties from properties previously determined from
cohesiometer and stabilometer tests. A series of correlation analyses were
conducted in order to provide the engineer with a means of making such estimates.
The correlations between the responses of the indirect tensile test and
Hveem tests are dependent upon the confines of the study. The first experiment
exemplifies the primary realm within which the Hveem tests have been used. In
this experiment five of the eight comparisons under investigation were found to
exhibit no correlation:
(1) Poisson's ratio and cohesiometer value,
(2 ) tensile strain and cohesiometer,
(3) modulus of elasticity and stability,
(4) tensile strength and s tabili ty, and
(5) tensile strain and stability.
Thus tensile properties could not be predicted from the corresponding Hveem
properties.
The following correlations were found to be acceptable for a general
range of test conditions:
(1) modulus of elasticity and cohesiometer value,
(2) tensile strength and cohesiometer value,
(3) tensile strain and cohesiometer value,
(4) Poisson's ratio and stability, and
(5) tensile strain and stability.
These correlations, therefore, can be used for estimating tensile properties
over a wide range of conditions, but in making such predictions one must be
aware of errors associated with them as indicated by the confidence bounds.
In the case of the standard test conditions utilized by the Texas Highway
Department, the only acceptable correlations involved the modulus of elasticity
and the cohesiometer value.
vii

IMPLEMENTATION STATEMENT
The correlations obtained from this study can be useful in evaluating
the performance of existing pavements in terms of material properties. A
wealth of knowledge concerning stability and cohesiometer values is available
for existing pavement, and in many cases the traffic data or load applications,
performance, and possible pavement life are also available. By estimating
material properties such as modulus of elasticity, Poisson's ratio, tensile
strength, and tensile strain from the Hveem parameters, the performance and
life of a pavement could be related to material characteristics, possibly
providing a better understanding of pavement performance.
The correlation could also be useful in new pavement design by providing
the capability to estimate the material characteristics. Once the estimates
of modulus of elasticity and Poisson's ratio values were known, layered
system analysis could be undertaken to evaluate different design sections.
viii

TABLE OF CONTENTS
PREFACE
LIST OF REPORTS •
ABSTRACT AND KEY WORDS
SUMMARY.
IMPLEMENTATION STATEMENT
CHAPTER 1. INTRODUCTION . . CHAPTER 2. EXPERIMENTAL DESIGNS
Experiment 1 • • • Experiment 2 • 0
CHAPTER 3. SUMMARY OF RESULTS
•
CHAPTER 4. ANALYSIS TECHNIQUES •
•
. . CHAPTER 5. CORRELATION ANALYSIS AND DISCUSSION OF RESULTS
Experiment 1 • Experiment 2 Combining the Results of
•
the Two Experiments •
CHAPTER 6. A DISCUSSION OF POSSIBLE CORRELATIONS •
CHAPTER 7. CONCLUS IONS AND RECOMMENDATIONS . . REFERENCES • • • . . . . . . . . . ~ . . . .
ix
•
•
• o • •
o
. .
iii
v
vi
vii
• viii
1
2 2
7
14
21 21 22
27
29
31

APPENDICES
Appendix 1. Appendix 2.
Preparation and Testing Procedures . . . . • Test Data for Asphalt Cement and Test Results for Experiments 1 and 2 • • • • . . . . • . • •
x
33
35
THE AUTHORS • • • • • . • • • • . • • • • . • . • . " . • • • . • • • . • 40

CHAPTER 1. INTRODUCTION
Previous studies (Refs 1-6) have indicated that the indirect tensile test
can be used for evaluation of tensile strengths of stabilized materials. Based
on research at The University of Texas at Austin (Ref 7) it appears that the
test can also be used to determine other material characteristics, i.e., mod
ulus of elasticity, Poisson's ratio, and estimated tensile strains at failure.
Equations based on theoretical and experimental work conducted by Hondros
(Ref 8) have been used to obtain estimates of these four parameters and are
now being used for the evaluation of a variety of asphalt-treated materials.
Many design methods for bituminous materials involve the use of semi
theoretical tests such as the stabilometer and cohesiometer tests (Ref 9),
which have been established through laboratory and field correlation. The
relationship of the indirect tensile test and the proposed design methods to
such existing tests is important and would be useful to those who want to
evaluate the performance of existing pavements in terms of material properties.
In many cases a wealth of information concerning cohesiometer and stabilometer
values is available for existing pavements, covering a variety of pavement
conditions. By estimating material properties such as modulus of elasticity,
Poisson's ratio, tensile strength, and failure strain from Hveem parameters,
it should be possible to relate the performance of such existing pavements to
material characteristics, leading to a better understanding of pavement per
formance. With this in mind a correlation study was undertaken to provide a
basis for relating the results of the indirect tensile test with those from
the Hveem tests.
To provide the range of comparisons needed required two experiments. The
first utilized standard Texas Highway Department preparation and test pro
cedures (Ref 10) and the second involved preparation and test procedures pro
posed for the indirect tensile test. The preparation and testing procedures
used in these experiments are presented in Appendix 1.
1
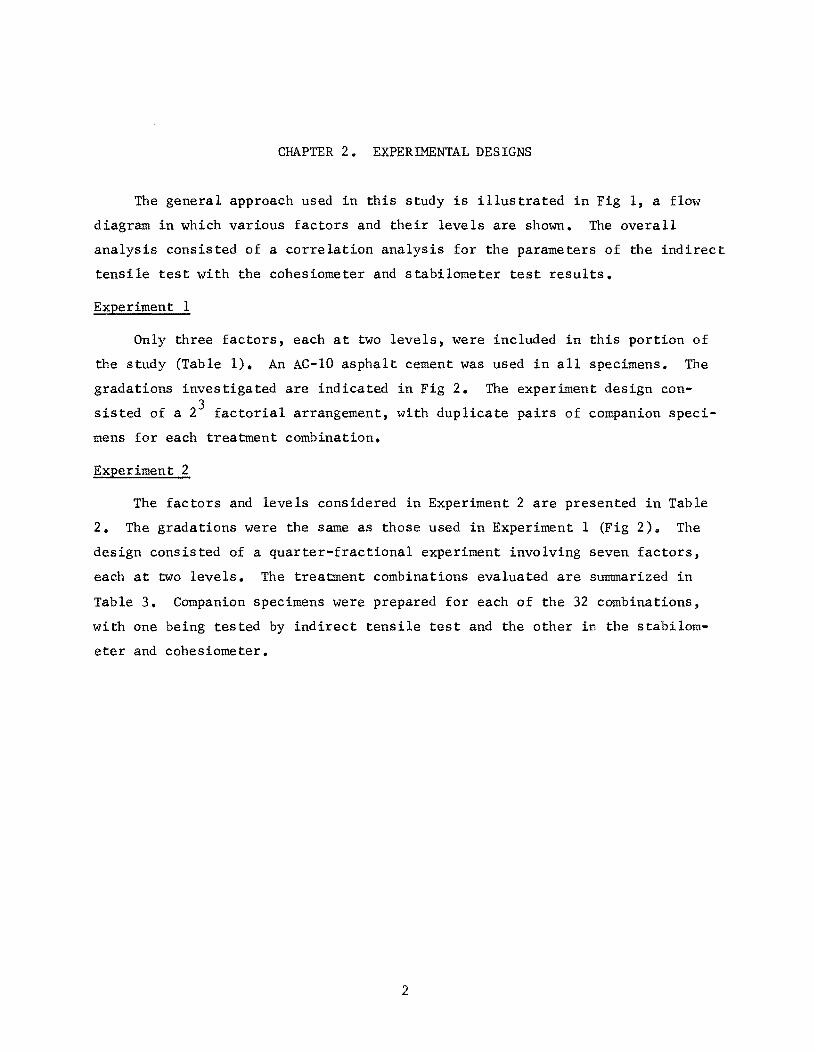
CHAPTER 2. EXPERIMENTAL DESIGNS
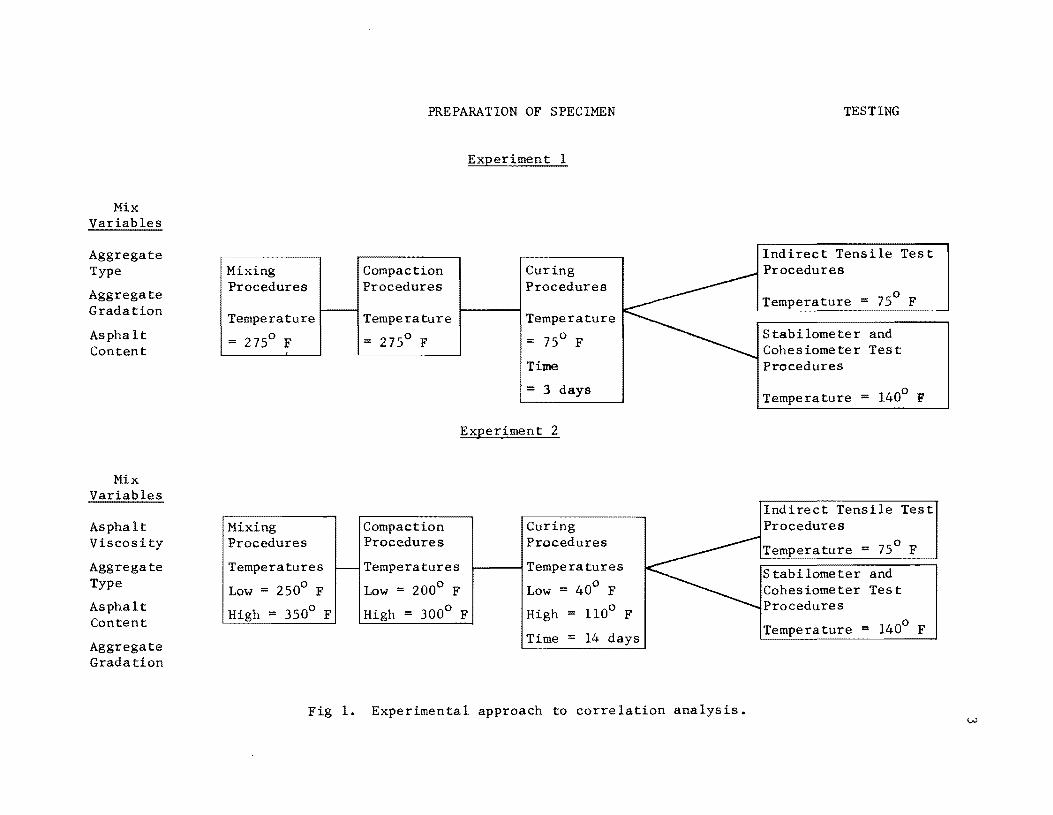
The general approach used in this study is illustrated in Fig 1, a flow
diagram in which various factors and their levels are shown. The overall
analysis consisted of a correlation analysis for the parameters of the indirect
tensile test with the cohesiometer and stabilometer test results.
Experiment 1
Only three factors, each at two levels, were included in this portion of
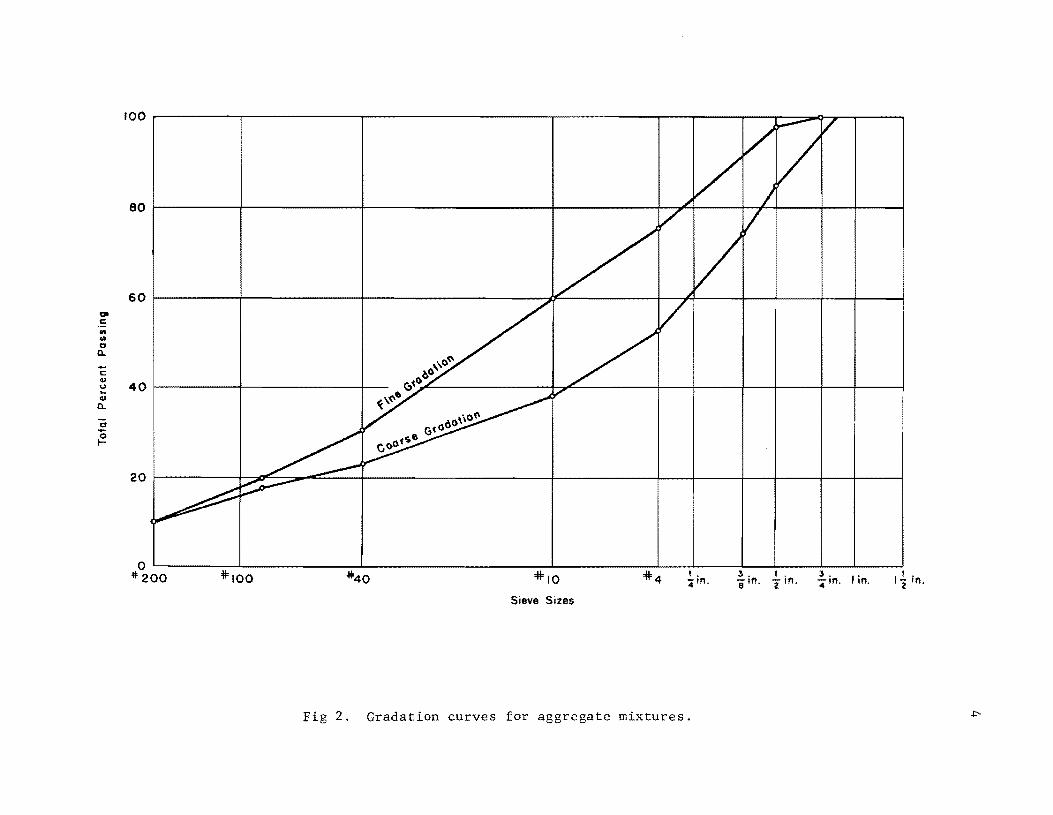
the study (Table 1). An AC-10 asphalt cement was used in all specimens. The
gradations investigated are indicated in Fig 2. The experiment design con
sisted of a 23 factorial arrangement, with duplicate pairs of companion speci
mens for each treatment combination.
Experiment 2
The factors and levels considered in Experiment 2 are presented in Table
2. The gradations were the same as those used in Experiment 1 (Fig 2)0 The
design consisted of a quarter-fractional experiment involving seven factors,
each at two levels. The treatment combinations evaluated are summarized in
Table 3. Companion specimens were prepared for each of the 32 combinations,
with one being tested by indirect tensile test and the other in the stabilom
eter and cohesiometer.
2
Mix Variables
Aggregate Type
Aggregate Gradation
Asphalt Content
Mix Variables
Asphalt Viscosity
Aggregate Type
Asphalt Content
Aggregate Gradation
PREPARATION OF SPECIMEN TESTING
Experimen t 1
Indirect Tensile Test Mixing Compaction Curing Procedures Procedures Procedures Procedures
~ Temperature = 750
F Temperature Temperature Temperature
= 2750 F = 2750 F = 750 F Stabilometer and Cohesiometer Test
Time Procedures
= 3 days Temperature = 1400 F
Experiment 2
Indirect Tensile Test Mixing Compaction Curing Procedures Procedures Procedures Procedures K Temperature = 75° F Temperatures - Temperatures Temperatures S tabi lome ter and Low = 2500 F Low = 2000 F 0 Cohesiometer Low = 40 F Test
High = 3500 F High = 3000 F High = 1100 F Procedures
Temperature = 1400 F
Time == 14 days
Fig 1. Experimental approach to correlation analysis.
go c: III III 0
0... -c: CI> <.) ... CIJ
0...
0 -0 I-
100
80 ~--------+-------------+---------------------+-----------4-~4-----+-~+----4---+----~
60
40
20
o #'200
r:,"~
~ \~.
·o~ ~~"
Sieve Sizes
I, 4',",
Fig 2. Gradation curves for aggregate mixtures.
~in, ~ in. ~in, lin. , ,
1"2 In.

TABLE 1. FACTORS AND LEVELS FOR EXPERIMENT 1
Levels Factors Low (-1) High (+1)
Aggregate type Crushed Rounded limestone gravel
Aggregate gradation Fine Coarse
Asphalt content, % 5.5 7.0
TABLE 2. FACTORS AND LEVELS FOR EXPERIMENT 2
Factors
Aggregate type
Aggregate gradation
Asphalt viscosity*
Asphalt content, %
Mixing temperature, 0 F
Compaction temperature, 0 F
Curing temperature, 0 F
Low (-1)
Crushed limestone
Fine
AC-5
5.5
250
200
40
Levels
High (+1)
Rounded gravel
Coarse
AC-20
8.5
350
300
110
* Test data for the asphalt cement are in Appendix 2.
5

TABLE 3. QUARTER-FRACTIONAL FACTORIAL ARRANGEMENT EVALUATED IN EXPERIMENT 2
Limestone Grayel
Fine Coarse Fine
AC5 AC20 AC5 AC20 AC5 AC20
5.5
Coarse
AC5 AC20
40r-+-~-+-----+------~--~-----+----~-----r-----+----~
5.5
8.5
5,5
8.5
Note: The shaded areas indicate treatment combinations tested
6

CHAPTER 3. SUMMARY OF RESULTS
The properties for materials used in this study, as determined by tests,
are contained in Appendix 2. The data include the physical properties of the
asphalt cements and the test results, including modulus of elasticity, Poisson's
ratio, tensile strength, tensile strain, stability value, and cohesiometer
value.
Relationships between the Hveem parameters of stability and cohesiometer
values and the elastic parameters were obtained by regression techniques for
the two experiments discussed in Chapter 2. The correlation coefficient ob
tained from the regression results was used as a measure of the linear relation
ship between the two sets of parameters and provided an estimate of true
correlation. This correlation coefficient as well as other criteria discussed
in Chapter 4 was then used to classify the relationships as
(1) no correlation,
(2) a trend, or
(3) an acceptable correlation.
If the relationship was "no correlation", then there was assumed to be no
relationship between the two particular variables, i.e., the value of one of
the variables was independent of the value of the other. A trend was considered
to be a weak correlation in which an increase in the value of one variable was
accompanied by a general increase or decrease in the value of the other variable.
An acceptable correlation was considered to be a relationship in which the
value of one variable could be predicted from a second variable with a relatively
high degree of reliability.
Classifications of the relationships between the Hveem and indirect tensile
test parameters for the two experiments are presented in Table 4. Significance
tests were also conducted, to determine if the results of Experiments 1 and 2
could be combined to provide a more general relationship. The results of
statistical significance tests are included in Table 4. For further explanation
of the technique used in the significance testing, see Chapter 5.
7

Variables
Modulus of elasticity and stability
Poisson's ratio and stability
Tensile strength and stability
Tensile strain and stability
Modulus of elasticity and cohesiometer value
Poisson's ratio and cohesiometer value
Tensile strength and cohesiometer value
Tensile strain and cohesiometer value
TABLE 4. ClASSIFICATION OF RElATIONSHIPS BETWEEN VARIABLES
For Experiment 1 There was
No correlation
A trend
No correlation
No correlation
Acceptable correlation
No corre la tion
A trend
No corre la tion
For Experiment 2 There was
A trend
Acceptable correlation
A trend
Acceptable correlation
Acceptable correlation
A trend
Acceptable correlation
Acceptable correlation
Can the Results be Combined?
Yes
Yes
Yes
Yes
Yes
No
Yes
No

9
The regression equations for those relationships found to be correlated
are presented in Table 5. In most cases the equations were obtained from com
bined results of Experiments 1 and 2. The prediction capability and the source
of the equations are included in the last two columns of Table 5. An equation
with poor prediction capability should not be used to estimate one variable
from a second variable. In making predictions from equations of good prediction
capability, it is necessary to know the range in the prediction, as indicated
by the 95 percent confidence limits. These limits (± two standard deviations)
were computed with a 95 percent certainty that the predicted value would be
contained within them. It should be noted also that the correlation equations
presented in Table 5 are valid only within the confines of the study. Any
extrapolation outside the limitations of the study should be made with the
knowledge that erroneous answers may be obtained.
The various correlation analyses which were found to be significantly
correlated are displayed as scatter diagrams in Fig 3 for Experiment 1 and
in Fig 4 for Experiment 2. Figure 3a is an example of a scatter diagram for
an analysis from Experiment 1 for which there was no correlation. The tensile
properties obtained from the indirect tensile test are plotted on the ordinate
and the corresponding stability or cohesiometer values are plotted on the
abscissa.
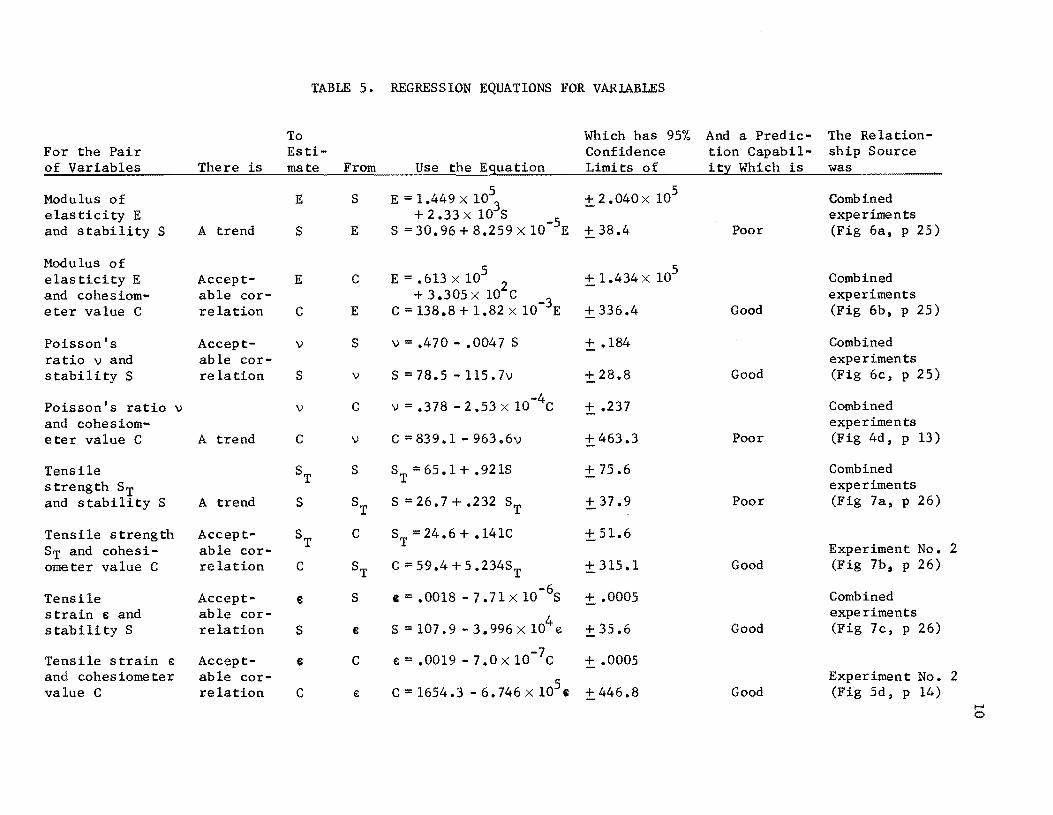
TABLE 5. REGRESSION EQUATIONS FOR VARIABLES
To Which has 9570 And a Predic- The Re la tion-For the Pair Esti- Confidence tion Capabil- ship Source of Variables There is mate From Use the Eguation Limits of it:y Which is was
Modulus of E S E = 1.449 X 1053
±2.040x 10⁵ Combined elasticity E +2.33x 10 S experiments and stability S A trend S E S =30.96+8.259x 1O-5E + 38.4 Poor (Fig 6a, p 25)
Modulus of E = .613 X 105 ± 1.434 X 10⁵ elasticity E Accept- E C Combined
and cohesiom- able cor- + 3.305 X 10²C experiments eter value C relation C E C = 138.8 + 1.82 X 10⁻³E ± 336.4 Good (Fig 6b, p 25)
Poisson's Accept- v S v = .470 - .0047 S ± .184 Combined ratio v and able cor- experiments stabili ty S relation S v S=78.5-115.7v ±28.8 Good (Fig 6c, p 25)
Poisson's ratio v C -4
± .237 Combined v v = .378 - 2 .53 X 10 C and cohesiom- experiments eter value C A trend C v C =839.1- 963.6'J ± 463.3 Poor (F ig 4d, p 13)
Tensile ST S ST =65.1+ .92lS ± 75.6 Combined strength ST experiments and stability S A trend S ST S =26.7 + .232 ST ± 37.9 Poor (Fig 7a, p 26)
Tensile strength Accept- ST C ST = 24.6 + .14lC ±5l.6 ST and cohesi- able cor- Experiment No. 2 ometer value C relation C ST C =59.4+5.234ST ± 315.1 Good (Fig 7b, p 26)
Tensile Accept- e: S e = .0018 -7.71 X 1O-6S ± .0005 Combined strain e: and able cor-
S = 107.9 - 3.996 X 10⁴
e experiments
stability S relation S e: ±35.6 Good (Fig 7c, p 26)
Tensile strain € Accept- e: C e: = • 0019 - 7 .0 X 10 - 7 C ± .0005 and cohesiometer able cor-
C = 1654.3 - 6.746 X lOSe: Experiment No. 2
value C relation C € ± 446.8 Good (Fig 5d, p 14) l-' 0

4
on 0
'" .. 3 Q. ~ -IIJ ~
:l:' 'u ~ .. .2 2 IIJ
"> .. ::I
~ i
o
,5
.4
"i' .3
.2 .. 1:1
ex: It) . g .2 .1 ~
.I
0
11
4 , I / ,
I I , I
I o,.......-S: HE) I on I 0 , I Q 3 ,
o , I )(
0 "in ,
I , - Q.
I .....J;;F 0' &' 000 I -',- , I w , E= f(S) ,
I >-, .. 2 I :§ I I .... 95% Confidence I 0 0 III
01 I E Bounds (2 s.) I w ,
0 , , I
10 20 30 40 50 60 70 80 Stability Value (S)
I .... 0
I II> :l "5 "0 0 ~
o 200 400 600 Cohesiometer Value (C)
(a) (b)
S= f(lI) 0 \ \
\ \ \ \ \ 140
\ \ \ \ 0
\ 'in 120 a. , 0 ~ , I-
\ \ (I) 100 , 8 .to:
\ 1;. , 0 c: \ ~ 80
\ u;
\0 Q)
0 ~ 60 \
c:
\ {!!.
\ 0 \ 40
95% conflde~ \ \ Bounds (2 I.) \ \ 20 \
\ o t\ \
10 20 30 40 50 60 70 80 0 200 400 600 Stability Value (S) Cohesiometer Value (C)
(c) (d)
Fig 3. Scatter diagrams for Experiment 1.
800
/
: f( C )
800

6
"2 >c 5
l ~
~
~4 >.
;!: .~
i iii 3
'0 /
~ I
~ 2 0 :'I
0
0
.5
.4
- \ ;,. 0\
0 .3 :;:
0 a::
_lit I: 0 en lit .2 '0
Q..
.1
o
12
I 0 I 'I
I 1'-5= He) I
1 I I o 0 950/ 0 Confidence /
o 1 Bounds (21,)
l I
I I 0 I 0 I
I 0 /
I 0 I. / I I 0 8
0 10 0 0
I 0
1 0 I 0
1 o 0
0 / /
1 I I
10 20 30 40 50 60 70 eo 90 0 400 800 1200
Stability Value (S) Cohesiometer Value (C)
(a) (b)
\ ,
\ 0 \ ~ 0 \ \ 0
o ' \0 \ \ 95 % Confidence \ \ Bounds (2 ~.)
\
95 % Confidence \ \ Bounds (2 i.)
\ ,<,5 = f(&,) \
0 ~ \ 0 \
0\ '\ ~ 0 \ :\ 0 \
\ 0
0 \ \
10 20 30 40 50 60 70 80 90 0 Stability Value (5)
(c)
\ \ \ \ \
, 0
',C=f(J<) ~
, 0
o , \ , 0 \
0 \ \ \
~ \ \ \ \ \
0 0 \
o 11= fCC) ~
0
0
400 800 1200 COOesiometer Va lue (C)
(d)
Fig 4. Scatter diagrams for modulus of elasticity and Poisson's raLio for Experiment 2.
\
\ \ \ \
200
ISO
/ &.
/
'I /
/
/ I.
/
5T :f( 5; o /
o o 0 /
'0100 / / /
0/
/ c .. ... -(/) .. i c ~
c ".:
o
50 0
/ /
o o
o /
95 % Confidence bounds (2 e,)
0,+-----~~~--~--~--4_--+_--~_+
o ~ w m ~ 50 ~ ro ~ ~ 0 5tabil ity Value ( 5 )
(a)
.002 0
.: .001 " CI .. -(/) '" 950/0 Confidence bound s (2 s.)
o~~~-+--~--~--~~--~--~--+ o 10 20 30 40 50 60 70 80 90 0
5 tability Val ue ( 5 )
(c)
13
95 % Confidence bounds (2f,)
400 SOO 1200 1600 Cohesiometer Value (C)
(b)
~ 950/ 0 Confidence
'- \. bounds (2t.) o ~
o
400 800 1200 1600
Cohesiometer Volue ( C )
(d)
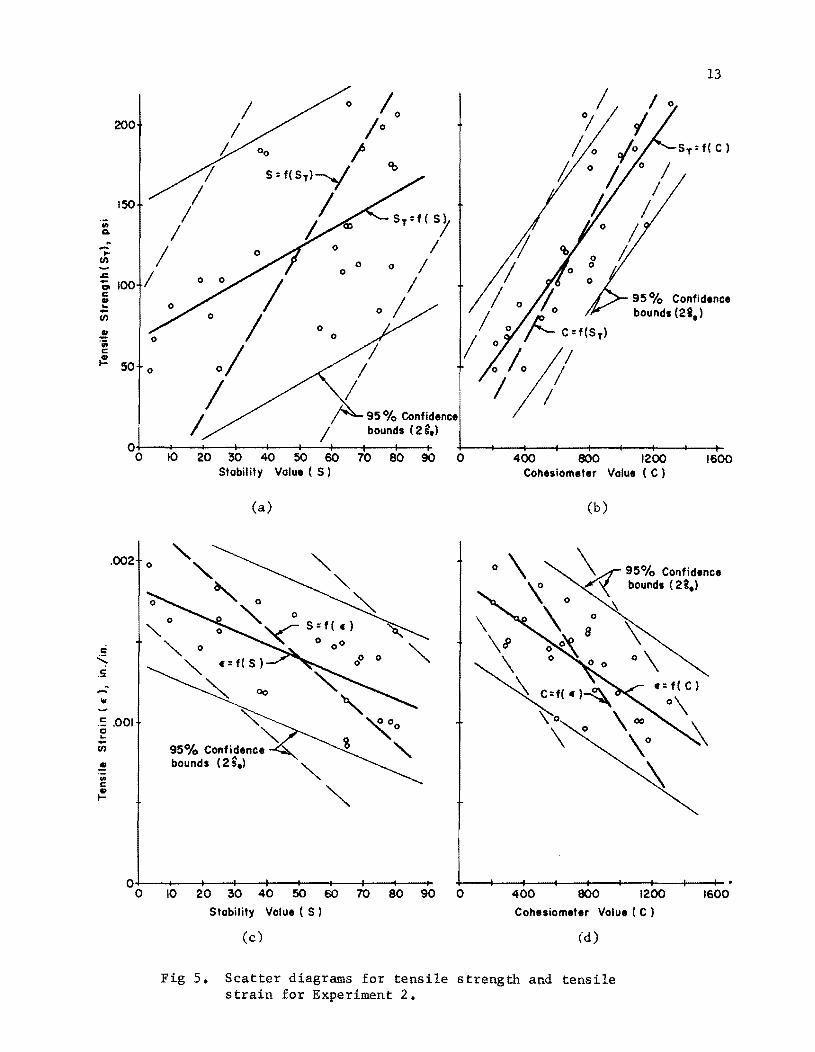
Fig 5. Scatter diagrams for tensile strength and tensile strain for Experiment 2.

CHAPTER 4. ANALYS IS TECHNIQUES
In routine analysis, the variable plotted on the abscissa is the independ
ent variable, which can be measured exactly, and the one plotted on the ordi
nate is the dependent variable, which is usually assumed to be subject to
fluctuations for a given value of the independent variable. Thus, test results
from the stabilometer or cohesiometer would normally be used to estimate an
indirect tensile test parameter, but there is no reason why indirect tensile
test results could not be used to estimate cohesiometer or stabilometer values.
In addition, there is no reason to believe that errors and variations were not
associated with all parameters. Thus the responses from the tests were con
sidered to be two independent variables and the analysis was conducted in terms
of a bivariate population (Ref 11); i.e., the analysis involved two independent
variables, each of which had errors associated with its determination. There
fore, the responses from the indirect tensile test as well as the Hveem tests
were considered to be random variables and were analyzed as a bivariate
popu la tion.
A simple linear regression analysis was used to determine a correlation
coefficient between the modulus of elasticity, Poisson's ratio, tensile
strength, and tensile strain, as determined from the indirect tensile test and
the stability and cohesiometer values for the companion specimens in both
experiments. The correlation coefficient was used as a measure of the linear
relationship between parameters and provided an estimate of the true correla
tion. With statistical techniques presented by Snedecor and Cochran (Ref 11),
significance tests were conducted on these correlation coefficients to deter
mine whether or not a correlation between a particular set of variables
actually existed at a given probability level. The results of the significance
tests and a visual inspection of the scatter diagrams were used to establish
the acceptability of the correlations.
Confidence limits about the sample correlation coefficients were estab
lished for those relationships which were felt to be acceptable correlations.
These limits were computed with a 95 percent certainty that the interval
14
15
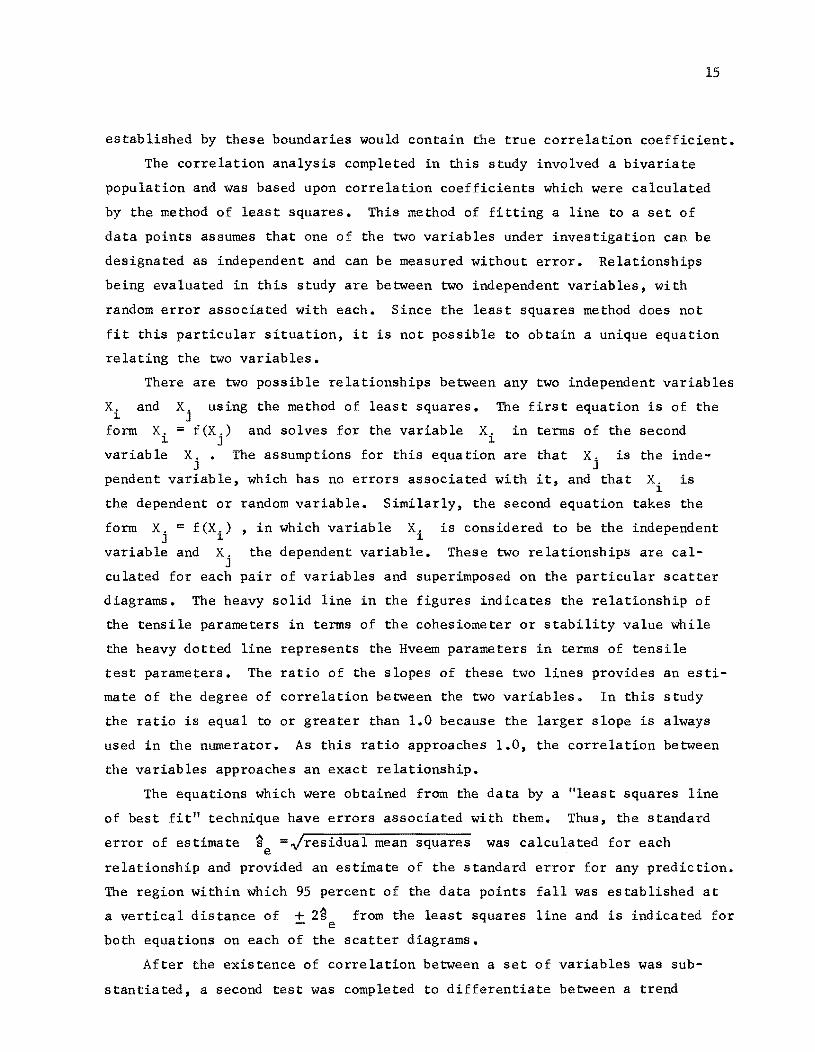
established by these boundaries would contain the true correlation coefficient.
The correlation analysis completed in this study involved a bivariate
population and was based upon correlation coefficients which were calculated
by the method of least squares. This method of fitting a line to a set of
data points assumes that one of the two variables under investigation can be
designated as independent and can be measured without error. Relationships
being evaluated in this study are between two independent variables, with
random error associated with each. Since the least squares method does not
fit this particular situation, it is not possible to obtain a unique equation
relating the two variables.
There are two possible relationships between any two independent variables
Xi and Xj using the method of least squares. The first equation is of the
form X. = f(X.) and solves for the variable X. in terms of the second ~ J ~
variable Xj • The assumptions for this equation are that Xj is the inde-
pendent variable, which has no errors associated with it, and that X. is ~
the dependent or random variable. Similarly, the second equation takes the
form X. = f(X.) J ~
variable and X. J
culated for each
, in which variable X. is considered to be the independent ~
the dependent variable. These two relationships are cal-
pair of variables and superimposed on the particular scatter
diagrams. The heavy solid line in the figures indicates the relationship of
the tensile parameters in terms of the cohesiometer or stability value while
the heavy dotted line represents the Hveem parameters in terms of tensile
test parameters. The ratio of the slopes of these two lines provides an esti
mate of the degree of correlation between the two variables. In this study
the ratio is equal to or greater than 1.0 because the larger slope is always
used in the numerator. As this ratio approaches 1.0, the correlation between
the variables approaches an exact relationship.
The equations which were obtained from the data by a "least squares line
of best fit" technique have errors associated with them. Thus, the standard
error of estimate g =vfresidual mean squares was calculated for each e
relationship and provided an estimate of the standard error for any prediction.
The region within which 95 percent of the data points fall was established at
a vertical distance of + 2~ from the least squares line and is indicated for e
both equations on each of the scatter diagrams.
After the existence of correlation between a set of variables was sub
stantiated, a second test was completed to differentiate between a trend
16
and an acceptable correlation. In this report a trend was assumed to be a
weak correlation in which an increase in the value of one variable was accom
panied by a general increase or decrease in the value of the other variable.
An acceptable correlation was considered to be a relationship in which the value
of one variable could be predicted from a second variable with a relatively
high degree of reliability. The criteria for making this determination are
not available in any known statistical method or technique.
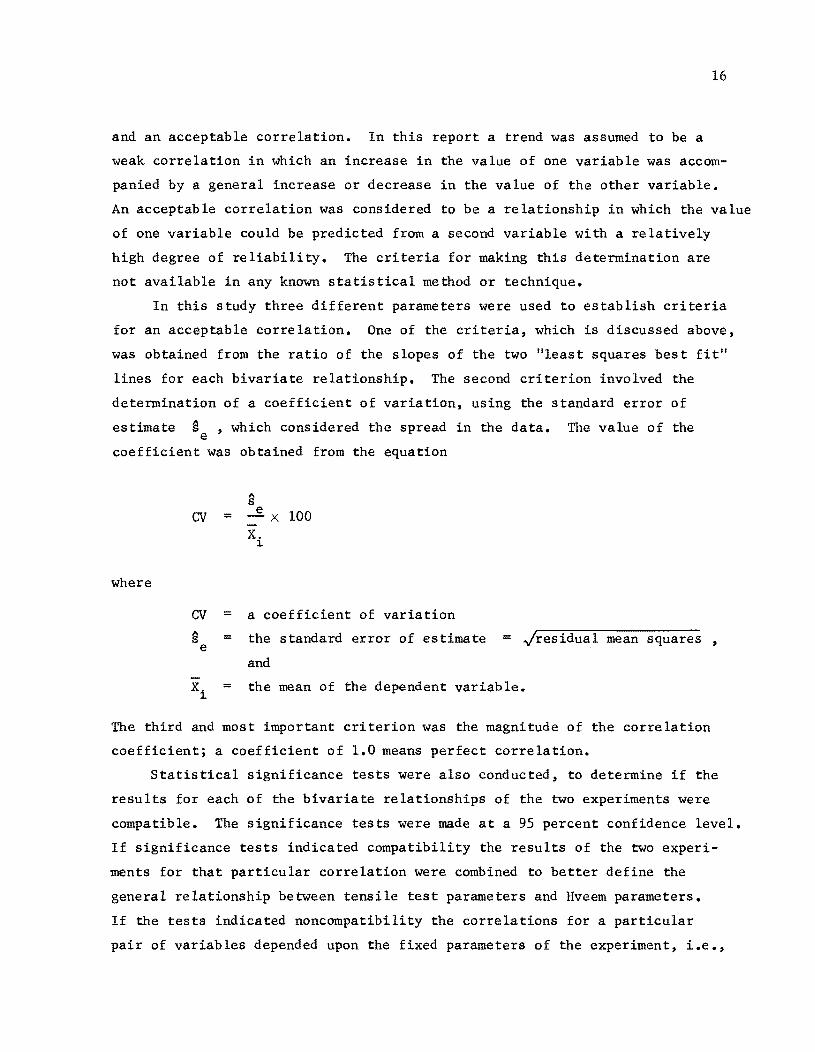
In this study three different parameters were used to establish criteria
for an acceptable correlation. One of the criteria, which is discussed above,
was obtained from the ratio of the slopes of the two Illeas t squares best fitll
lines for each bivariate relationship. The second criterion involved the
determination of a coefficient of variation, using the standard error of
estimate g ,which considered the spread in the data. The value of the e
coefficient was obtained from the equation
where
" s CV = ~ x 100
X. ~
CV = a coefficient of variation
g = the standard error of estimate = v!residual mean squares , e
and
= the mean of the dependent variable.
The third and most important criterion was the magnitude of the correlation
coefficient; a coefficient of 1.0 means perfect correlation.
Statistical significance tests were also conducted, to determine if the
results for each of the bivariate relationships of the two experiments were
compatible. The significance tests were made at a 95 percent confidence level.
If significance tests indicated compatibility the results of the two experi
ments for that particular correlation were combined to better define the
general relationship between tensile test parameters and Hveem parameters.
If the tests indicated noncompatibility the correlations for a particular
pair of variables depended upon the fixed parameters of the experiment, i.e.,

mixing and preparation restrictions, and, therefore, the results of the two
experiments could not be combined.
17
The statistical tests outlined above for the individual experiments were
also completed on the data combined from both experiments.
CHAPTER 5. CORRELATION ANALYSIS AND DISCUSSION OF RESULTS
Prior to a detailed evaluation of correlation relationships between the
various parameters it was necessary to determine the form of equation to be
used to represent the relationship between each pair of variables. The sim-
plest method involves a first order or linear equation of the form T. = ~
f(H.) ,where T. is a tensile test parameter and H. is a Hveem parameter. J ~ J
Other possibilities include quadratic, T. = f(H~) cubic, T. = f(H~) ; and ~ J .~ J
higher order equations. Correlation coefficients for each of the comparisons
were computed from the data, using the first three equation forms.
In the first experiment a linear relationship produced higher correlation
coefficients than the other two for all cases except modulus of elasticity
versus cohesiometer value and tensile strength versus cohesiometer value, for
which a cubic relationship produced coefficients which were respectively 3.9
and 4.1 percent larger than the linear form. Even in these two cases, however,
the increases were not of sufficient magnitude to warrant using the higher
order equation.
Similar results were found in Experiment 2, where a linear relationship
provided the best correlation coefficient for all but two cases. A quadratic
relationship for Poisson's ratio versus stability and tensile strain versus
stability produced negligible increases in the correlation coefficients of
0.60 and 0.93 percent, respectively_
Since the improvement, if any, in the correlation coefficients caused by
using higher order equations was negligible in both experiments, all subse
quent analyses concerning correlation between any two variables considered
only a linear relationship.
The parameters used in determining the correlation between all pairs of
variables for the two experiments are presented in Tables 6 and 7. The results
of the two experiments are discussed in the following paragraphs.
18

TABLE 6. PARAMETERS USED IN CORRElATION ANALYS IS FOR EXPERIMENT 1
95% Confidence Does Bands About
Corre 1ation Correlation Correlation Slope Coefficients Acceptable Variables Coefficient r Exist? Coefficient Ratio of Variation,% Correlation?
E las tici ty and .1213 No stability
Poisson's ratio -.5686 Yes and stability
-.102 ~ r ~ -.831 31.0 41, 20 No
Tensile strength .3487 No and stability
Tensile strain -.4794 No and stability
Elasticity and .7238 Yes . 356 ~ r ~ .898 1.9 19, 13 Yes cohesiometer value
Poisson's ratio and .4109 No cohesiometer value
Tensile strength and .6185 Yes .177~r~ .853 2.6 15, 14 No cohesiometer value
Tensile strain and .0578 No cohesiometer value

Table 7. PARAMETERS USED IN CORRELATION ANALYSIS FOR EXPERIMENT 2
95% Confidence Does Bands About
Correlation Correlation Correlation Slope Coefficients Variables Coefficient r Exist? Coefficient Ratio of Variation.
Elasticity and .5278 Yes .176 ::;; r :5:; .760 3.6 42, 43 stability
Poisson's ratio -.8248 Yes -.643 ::;; r ~ -.919 1.5 42, 29 and stability
Tensile strength +.5768 Yes .244 =:;; r =:;; .789 3.0 34, 41 and stability
Tensile strain -.7858 Yes -.573 ~ r =:;; -.900 1.6 20, 31 and stability
Elasticity and .8069 Yes .593 =:;; r =:;; .905 1.5 29, 26 cohesiome ter value
Poisson's ratio and -.6411 Yes -.337 ::;; r =:;; -.824 2.4 57, 34 cohesiometer value
Tensile strength and .8580 Yes .705 ~ r =:;; .935 1.4 21, 23 cohesiometer value
Tensile strain and .7235 Yes -.467 :5:; r =:;; -.868 1.9 22, 30 cohesiometer value
Acceptable % Correlation?
No
Yes
No
Yes
Yes
No
Yes
Yes
N o

21
Experiment 1
The following pairs of variables did not correlate (see Table 6):
(1) Poisson's ratio and cohesiometer value,
(2) tensile strain and cohesiometer value,
(3) modulus of elasticity and stability,
(4) tensile strength and stability, and
(5) tensile strain and stability.
An example of lack of correlation can readily be seen in Fig 3a, where
modulus of elasticity was plotted versus stability and the data generally fell
in a shotgun pattern.
The three pairs of variables which correlated were (1) modulus of elas
ticity and cohesiometer value (Fig 3b), (2) Poisson's ratio and stability
(Fig 3c), and (3) tensile strength and cohesiometer value (Fig 3d)o Of the
three only the correlation between the modulus of elasticity and the cohesiom
eter value was considered to be acceptable (see Fig 3b).
The correlation coefficient for the relationship, 0.724, was relatively
high and the values of slope ratio, 1.9, and coefficient of variation, 19 and
13 percent, were small.
For Poisson's ratio versus stability, 13 of the 16 points fell roughly
within a circle near the center of the plot (Fig 3c). The correlation
coefficient was higher than would be expected from a visual inspection of the
scatter diagram because of the relative positions of the data points located
at Poisson's ratio values of 0.46 and 0.05, which were generally on opposite
sides of the interior circle of data. The values for the other two parameters
of this particular relationship (Table 6) were also important in the decision
that the correlation was unacceptable for practical purposes.
The correlation between tensile strength and cohesiometer value, shown
in Fig 3d, was considered to be unacceptable for practical use because of the
low correlation coefficient. The other two parameters are low, as required,
but do not compensate for the low correlation coefficient of 0.619.
Experiment 2
The results of the correlation analysis for Experiment 2 (Table 7) indi
cate that there was correlation between the parameters of the indirect tensile
test and the Hveem stability and cohesiometer values in all cases evaluated.

22
Of the eight relationships evaluated, five correlations were considered
to be acceptable. The three which were considered to be trends only, because
of their low correlation coefficients, were (1) modulus of elasticity and
stability (Fig 4a), (2) Poisson's ratio and cohesiometer value (Fig 4d), and
(3) tensile strength and stability (Fig 5a).
The following five comparisons exhibited acceptable correlations:
(1) modulus of elasticity and cohesiometer value (Fig 4b),
(2) Poisson's ratio and stability (Fig 4c),
(3) tensile strength and cohesiometer value (Fig 5b),
(4) tensile strain and stability (Fig 5c), and
(5) tensile strain and cohesiometer value (Fig 5d).
All the parameters listed in Table 5 were adequate for an acceptable correla
tion.
Combining the Results of the Two Experiments
The results of the significance tests which were conducted to determine
if the data from two experiments could be combined are presented in Table 8.
There are two comparisons for which the results of the two experiments
could not be combined: (1) Poisson's ratio and cohesiometer value and
(2) tensile strain and cohesiometer value. The correlation for these was
positive for Experiment 1 and negative for Experiment 2, indicating a lack of
correlation between the pair of variables over the two experiments.
Those comparisons for which there waS common correlation were
(1) modulus of elasticity and cohesiometer value,
(2) tensile strength and cohesiometer value,
(3) modulus of elasticity and stability,
(4) Poisson's ratio and stability,
(5) tensile strength and stability, and
(6) tensile strain and stability.
Scatter diagrams for the combined experiments are presented in Figs 6 and 7.
The acceptability of the correlation for these six comparisons was determined
and is presented in Table 8. The 95 percent confidence limits for the
correlation coefficients were calculated to provide, with 95 percent certainty,
the range within which the true correlation coefficient exists. These limits
are also given in Table 8.
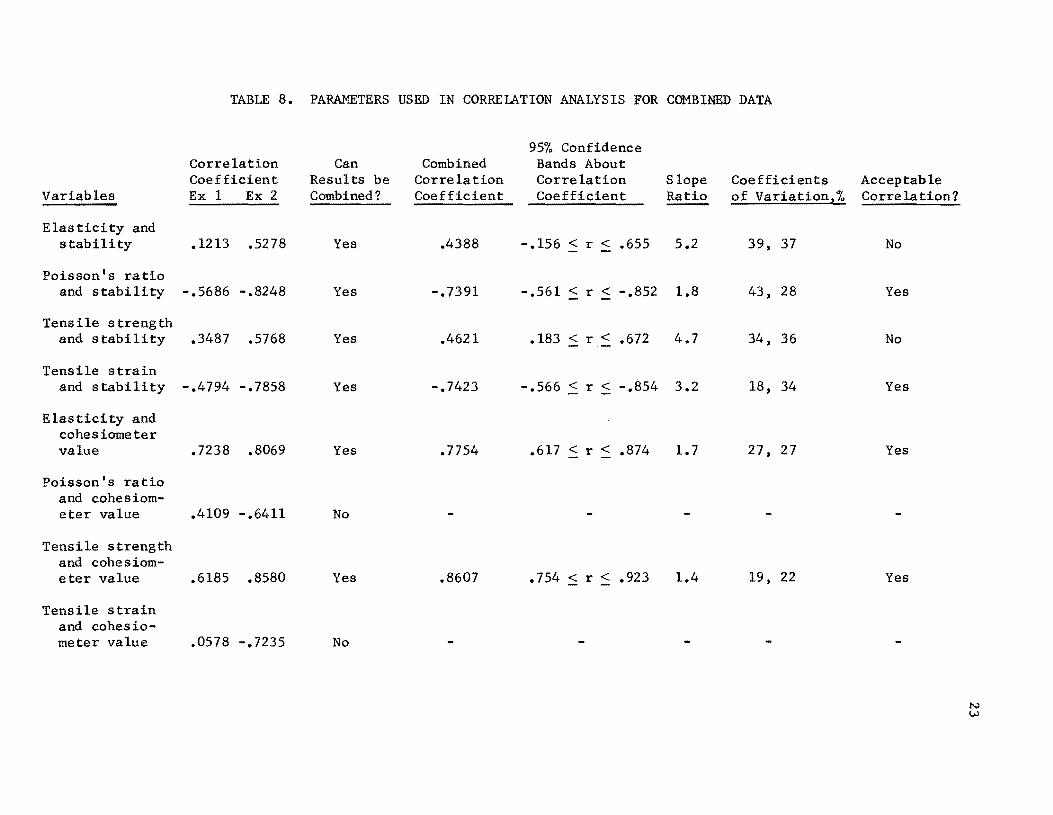
TABLE 8.
Correlation Coefficient
Variables Ex 1 Ex 2
E las tici ty and stability .1213 .5278
Poisson's ratio and stability -.5686 -.8248
Tensile strength and stability .3487 .5768
Tensile strain and stability -.4794 -.7858
Elasticity and cohesiometer value .7238 .8069
Poisson's ratio and cohesiom-eter value .4109 -.6411
Tensile strength and cohe s iom-eter value .6185 .8580
Tensile strain and cohesio-meter value .0578 -.7235
PARAMETERS USED IN CORRELATION ANALYSIS FOR COMBINED DATA
95% Confidence Can Combined Bands About
Results be Correlation Correlation Slope Coefficients Combined? Coefficient Coefficient Ratio of Variation,%
Yes .4388 -.156 < r < .655 5.2 39, 37
Yes -.7391 -.561 < r < -.852 1.8 43, 28
Yes .4621 .183 <r< .672 4.7 34, 36
Yes -.7423 -.566 ::: r < -.854 3.2 18, 34
Yes .7754 .617 < r < .874 1.7 27, 27
No
Yes .8607 .754 <r< .923 1.4 19, 22 - -
No
Acceptable Correlation?
No
Yes
No
Yes
Yes
Yes
N Vol

6
"'0 )(
'iii 5 Q. -UJ
~4 :Q j UJ
3 -0
II> :s
~2 0 ::E
/
0
. 95 % Confidence Bounds (2 i.)
7
I I
I
I
I
/
/ I
I
o • o o .1'
/
o /
1
01 • I
I I 0
I o
o
o I oI-S=f(E) 7
/ 1 0 •
o • •• 0
o
• 0
/ /
• I
/
I /
I
o 10 20 30 40 50 60 70 80 90 o 400 800 1200
.5
.4 \
llo
0.3 :;: co
0::
.I
\ o \
\ 0
\ \
Stability Value (S)
(a)
\ \ o ., \
o ,
\(S=f(v)
\ \ .0
o
\ v= f(5) \
\ \ 0
o
\ \ ~.
•
\
•
o
o
95 % Confidence Bounds (2 t.)
\ \
, 0.0
o \ 0 . \ , ~ '0 0 ., 00
o ,
Cohesiometer Value (C)
(b)
• - Experiment I
o - Experiment 2
o 10 20 30 40 50 60 70 80 90 Stabili ty Value (5)
(c)
Fig 6. Scatter diagrams for modulus of elasticity and Poisson's ratio values for combined data.
24

200
150 'iii 0-
A
~ C/) ...... -= r f 100 -C/)
41
'i c ~
50
o
,0020
.5 " ,0015 ,~
ft .... 1&1 ...... c: '6 .. -C/)
.!! 'iii
,0010
~
.0005
I I
/ 0 0
L <0
95 % Confidence / '--S : f (Sy) / Bounds (21J /
I / I
I 0 o ~ • 0
/ 7· .0 • • <)
0 0
/ : / •• /0 ; • 0
0 • / . 0 0
I / 0 0
/ • /
400 800 1200 ~ ro ~ ~ 00 ~ ro ~ ~ 0 Stability Volue (S) Cohesiometer Value eC)
(a)
0
• 0
• "-0
0 0 "-00 • • •
• t • I • I t I I o ~ ro ~ ~ ~ ~ ro ~ ~
Stability Value (S)
(c)
(b)
• - Experiment I
o - Experiment 2
Fig 7. Scatter diagrams for tensile strength and tensile strain for combined data.
25
26
Two of these six correlations were considered to be trends only, primarily
because of relatively low correlation coefficients: (1) modulus of elasticity
and stability and (2) tensile strength and stability. The slope ratio for each
was relatively high, an additional cause for their unacceptability.
The other four comparisons were determined to provide an acceptable cor
relation between the particular variables. The correlation between modulus of
elasticity and cohesiometer value was considered acceptable because of the
relatively high correlation coefficient, 0.775, and the low values of slope
ratio, 1.7, and coefficients of variation, 27 and 27 percent, for the two
regression equations. The scatter diagram (Fig 6b) further substantiates the
acceptable correlation.
There is an apparent linear relationship between Poisson's ratio and
stability (Fig 6c), with an increase in stability value associated with a
decrease in Poisson's ratio. The combined correlation coefficient, 0.739,
was fairly high and the values of the two remaining criteria were adequate.
The relationship between tensile strength and cohesiometer value provided
the highest correlation coefficient, 0.861, and the lowest slope rate, 1.4,
in the study. In addition the coefficients of variation were small when com
pared collectively with the others. The strong linear relationship can be
seen in Fig 7b, where high cohesiometer values correspond to high modulus of
elasticity values.
The fourth correlation involved tensile strain and stability value (Fig 7c)
and was also acceptable. This determination was based on the combined cor
relation coefficient, -.724, since the slope ratio was relatively high, 3.2.

CHAPTER 6. A DISCUSSION OF POSSIBLE CORRELATIONS
The existence of correlations may be best explained by a discussion of
the responses of the Hveem tests as they relate to the elastic parameters.
The stabilometer value or Hveem stability value for asphalt-treated
materials is obtained from a special triaxial-type testing cell which indi
cates the ability of a mix to resist deformation under load. Since the
resistance of materials to deformation can be related to material properties,
the stabilometer test should provide some measure of the effect of such para
meters as stiffness, which is analogous to modulus of elasticity, Poisson's
ratio, and material strains. An indicator of these parameters is obtained
from the pressure created in the oil cell surrounding the test specimen. The
lateral pressure is caused primarily by the lateral deformation of the speci
men created by the corresponding vertical load and deformation. The magnitude
of the lateral pressure provides some idea of the material stiffness. Under
a high vertical pressure a low lateral pressure indicates a stiff mixture
while a high lateral pressure indicates a less stiff mixture. This stiffness,
however, is confounded with the effect of Poisson's ratio. A low value of
Poisson's ratio for a specimen would generally mean a low lateral movement
for a given vertical movement while a larger value would mean a larger lateral
deflection. The oil pressure in the device is also related to this movement
and thus the factors are further confounded.
The lateral deformation of a specimen tested in the stabilometer cell is
probably caused by the cumulative effect of shear, compressive, and tensile
stresses. The stability, then, provides some measure of the tensile strain
created in the specimen during testing, but other types of strain are expected
to be confounded with them.
The Hveem cohesiometer value is obtained by measuring the force required
to break or bend a circular specimen acting as a cantilever beam in the Hveem
cohesiometer. Thus this test is similar to a beam test and primarily provides
a measure of the flexural strength of the material. If the material is
assumed to be linear elastic and to obey Hooke's law, stress is related to
27

28
strain according to the equation
(J = €E
where
0' = stress,
€ = strain,
E = modulus of elasticity.
If a correlation exists between the cohesiometer value and tensile strength
it follows from considering the above equation that there could also be corre
lation of the cohesiometer value with both the modulus of elasticity and ten
sile strain.

CHAPTER 7. CONCLUSIONS AND RECOMMENDATIONS
The correlations between the responses of the indirect tensile test and
Hveem tests are dependent upon the confines of the study. The first experi
ment exemplifies the primary realm within which the Hveem tests have been
used. In this experiment five of the eight comparisons under investigation
were found to exhibit no correlation:
(1) Poisson's ratio and cohesiometer value,
(2) tensile strain and cohesiometer,
(3 ) modulus of elasticity and stability,
(4 ) tensile strength and stability, and
(5) tensile strain and stability.
In these five cases the responses were truly independent, and, therefore, the
tensile properties could not be predicted from the corresponding Hveem para
meters.
On the other hand, a range of test conditions was evaluated in Experiment
2 and correlation between the variables was found to exist for all comparisons.
The following correlations were found to be acceptable for a general
range of test conditions:
(1) modulus of elasticity and cohesiometer value,
(2) tensile strength and cohesiometer value,
(3) tensile strain and cohesiometer value,
(4) Poisson's ratio and stability, and
(5) tensile strain and stability.
These can be used for estimating properties over a wide range of conditions,
but in making such predictions one must be aware of errors associated with
them, as indicated by the confidence bounds. It would be expected that primary
interest would involve predictions of tensile parameters from Hveem parameters,
but in special cases Hveem parameters would be predicted from indirect tensile
parameters.
29

30
In the specific case of the sponsor's standard test conditions, the only
acceptable correlation found involved the modulus of elasticity and the co
hesiometer value.
The tests reported here were conducted to fulfill a special need, and it
is, therefore, not recommended that further correlation be pursued. Time and
money can better be spent on the development of a design method based on the
indirect tensile test.
REFERENCES
1. Breen, J .. J., and J. E. Stephens, "Split Cylinder Test Applied to Bituminous Mixtures at Low Temperatures," Journal of Materials, Vall, No.1, American Society for Testing and Materials, March 1966, p 66.
2. Anderson, K. 0., and W. P. Hahn, "Design and Evaluation of Asphalt Concrete with Respect to Thermal Cracking," Proceedings of the Association of Asphalt Paving Technologists, Vol 37, 1968.
3. Messina, R., '~plit Cylinder Test for Evaluation of the Tensile Strength of Asphalt Concrete Mixtures," unpublished Master's Thesis, The University of Texas, Austin, Texas, 1966.
4. Kennedy, Thomas W., and W. Ronald Hudson, "Application of the Indirect Tensile Test to Stabilized Materials," Highway Research Record No. 235, Highway Research Board, 1968, pp 36-48.
5. Hadley, William 0., W. Ronald Hudson, and Thomas W. Kennedy, "An Evaluation of Factors Affecting the Tensile Properties of AsphaltTreated Materials," Research Report No. 98-2, Center for Highway Research, The University of Texas at Austin, June 1967.
6. Hadley, William 0., W. Ronald Hudson, Thomas W. Kennedy, and Virgil Anderson, "A Statistical Experiment to Evalua te Tensile Properties of Asphalt-Treated Materials," Proceedings of the Association of Asphalt Paving Technologists, Vol 38, 1969.
7. Hadley, William 0., W. Ronald Hudson, and Thomas W. Kennedy, "A Method of Estimating Tensile Properties of Materials Tested in the Indirect Tensile Test," Research Report No. 98-7, Center for Highway Research, The University of Texas at Austin, July 1970.
8. Hondros, G., liThe Evaluation of Poisson's Ratio and the Modulus of Materials of a Low Tensile Resistance by the Brazilian (Indirect Tensile) Test with Particular Reference to Concrete," Australian Journal of Applied Science, VallO, No.3.
9. American Society for Testing Materials, Resistance to Deformation and Cohesion of Bituminous Mixtures by Means of Hveem Apparatus, ASTM Designation Dl56l.
10. Texas Highway Department, Manual of Testing Procedures, Vall, Bituminous Section.
11. Snedecor, G. W., and W. G. Cochran, Statistical Methods, 6th Edition, 2nd printing, Iowa State University Press, Ames, Iowa, 1968, pp 172-190.
31

APPENDIX 1
PREPARATION AND TESTING PROCEDURES

APPENDIX 1. PREPARATION AND TESTING PROCEDURES
All asphalt-treated materials were mixed for three minutes and compacted
in a Texas gyratory shear molding press to form a cylindrical specimen with a
nominal 4-inch diameter and 2-inch height. The molded specimens were allowed
to cool to room temperature and their densities were determined (Ref 10). The
specimens were cured, for three or fourteen days, at the designated curing
temperature. At the end of the curing period the specimens to be tested in the
stabilometer and cohesiometer were brought to the standard test temperature of
1400 F + 20 F (Ref 10) ,and the indirect tensile test specimens were brought to o the proposed standard temperature of 75 F.
Companion specimens were prepared for each treatment combination. One
specimen was tested in a carefully controlled indirect tensile test (Refs 4
and 5) and the other specimen was tested in the stabilometer, returned to the
test temperature, and finally tested in the cohesiometer.
33

APPENDIX 2
TEST DATA FOR ASPHALT CEMENT AND
TEST RESULTS FOR EXPERIMENTS 1 AND 2

TEST DATA FOR COSDEN ASPHALT CEMENTS (Source: Cosden Petroleum Corporation, Big Springs, Texas)
Asphalt
Water, %
Viscosity at 2750
F, Stokes
Viscosity at 1400
F, Stokes
Flash point C.O.C., o F
Duc til i ty, 770
F, 5 cm/min, cm
Relative viscosity (after oxid3tion, 15~ films for 2 hours at 225 F, viscosities determined at 77
0 F)
Penetration at 770
F, 100g, 5 sec.
Specific gravity at 770
F
Solubility in CC14
, %
AC-5 AC-10
NIL . NIL
2.45 2.6
773 1088
560 570
141+ 141+
3.87 4.0
112 92
1.003 1.006
99.7+ 99.7+
35
AC-20
NIL
3.6
2532
565
141+
2.7
64
1.009
99.7+

36
INDIRECT TENSILE TEST RESULTS FOR EXPERIMENT 1
Modulus Treatment of Tensile Tensile
Specimen Combination* E las tid ty • Poisson's Strength, Strain, Number ...L _B_.~ ps i (xl ()l5 ) Ratio psi micro -uni ts
1 -1 -1 -1 2.489 .2646 106.1 1474
6 +1 -1 -1 2.479 .1985 82.2 llOO
3 -1 +1 -1 2.490 .2723 108.9 1682
8 +1 +1 -1 2.545 .1779 105.8 1610
13 -1 -1 +1 2.398 .3510 100.8 1506
14 +1 -1 +1 3.791 .2828 126.2 1697
11 -1 +1 +1 1.687 .4568 73.9 1846
12 +1 +1 +1 3.415 .2560 112.8 1076
21 -1 -1 -1 1.754 .0396 93.9 948
18 +1 -1 -1 2.455 .1653 96.0 1249
23 -1 +1 -1 1.551 .0487 72 .3 989
24 +1 +1 -1 3.139 .1290 119.1 1088
25 -1 -1 +1 2.406 .3137 82.2 1107
30 +1 -1 +1 2.955 .2468 107.8 1426
27 -1 +1 +1 1.430 .1983 66.2 1174
28 +1 +1 +1 2.686 .3877 91.4 1343
* Factors and levels are as follows:
Factor Descri]2tion Low Level ~-1l High Level lill A Aggrega te limestone gravel
B Grada tion fine coarse
C Aspha 1 t con ten t, % 5.5 8.5
37
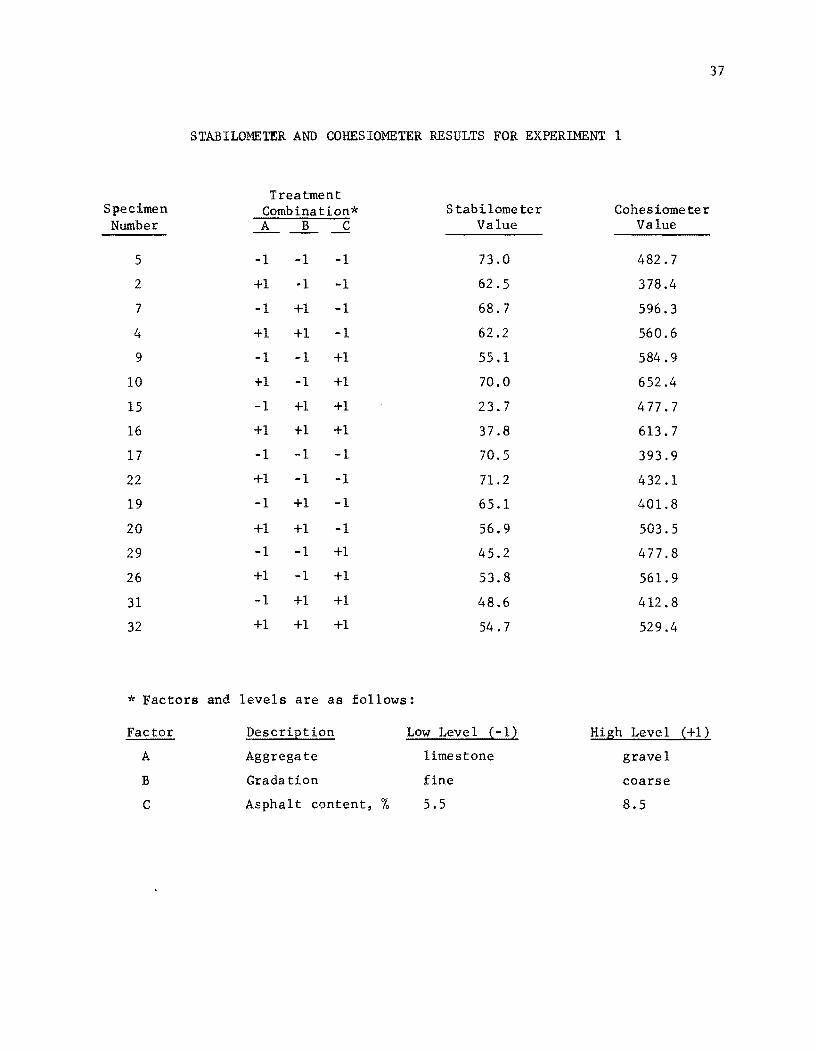
STABILOMET!R AND COHESIOMETER RESULTS FOR EXPERIMENT 1
Treatment Specimen Combination* Stabilometer Cohesiometer Number A B C Value Value ----
5 -1 -1 -1 73.0 482.7
2 +1 -1 -1 62.5 378.4
7 -1 +1 -1 68.7 596.3
4 +1 +1 -1 62.2 560.6
9 -1 -1 +1 55.1 584.9
10 +1 -1 +1 70.0 652.4
15 -1 +1 +1 23.7 477.7
16 +1 +1 +1 37.8 613.7
17 -1 -1 -1 70.5 393.9
22 +1 -1 -1 71.2 432.1
19 -1 +1 -1 65.1 401.8
20 +1 +1 -1 56.9 503.5
29 -1 -1 +1 45.2 477 .8
26 +1 -1 +1 53.8 561.9
31 -1 +1 +1 48.6 412.8
32 +1 +1 +1 54.7 529.4
* Factors and levels are as follows:
Factor Descri:etion Low Level ~ -I} High Level {+1}
A Aggregate limestone gravel
B Gradation fine coarse
C Asphalt content, % 5.5 8.5

INDIRECT TENSILE TEST RESULTS FOR EXPERIMENT 2
Treatment Modulus of Tensile Center Tensile Specimen Combina tions* E1as ticity, psi Poisson's Strength, Strain,
Number _C_ --.!L l -.L (x105 ) Ratio psi micro-units
242 -1 -1 -1 +1 -1 -1 -1 0.977 .4637 48.3 1639 210 +1 -1 +1 +1 -1 -1 -1 2.269 .4324 87.3 1645 249 -1 -1 -1 -1 +1 -1 -1 1.351 .2541 68.4 1477 233 +1 +1 -1 -1 +1 -1 -1 2.986 .3855 120.4 1757 217 +1 -1 +1 -1 +1 -1 -1 1.821 .1673 84.7 1399 201 -1 +1 +1 -1 +1 -1 -1 2.194 .2103 114.3 1384 252 +1 -1 -1 +1 -1 +1 -1 4.799 .1477 213.3 1136 220 -1 -1 +1 +1 -1 +1 -1 3.442 .1542 181.6 1188 243 +1 -1 -1 -1 +1 +1 -1 2.415 .0401 110.8 1016 227 -1 +1 -1 -1 +1 +1 -1 4.275 .0720 137.2 889 211 -1 -1 +1 -1 +1 +1 -1 3.651 .0663 173.2 1560 195 +1 +1 +1 -1 +1 +1 -1 4.983 .0565 198.6 1008 224 -1 -1 -1 -1 -1 -1 +1 1.263 .1568 74.4 1511 208 +1 +1 -1 -1 -1 -1 +1 2.631 .2278 122.7 1485 256 +1 -1 +1 -1 -1 -1 +1 2.376 .1711 107.9 1505 240 -1 +1 +1 -1 -1 -1 +1 2.378 .3213 115.9 1669 215 -1 -1 -1 +1 +1 -1 +1 1.806 .4606 79.9 1845 247 +1 -1 +1 +1 +1 -1 +1 2.374 .3084 102.9 1463 231 -1 +1 +1 +1 +1 -1 +1 1.462 .4462 65.5 1745 214 +1 -1 -1 -1 -1 +1 +1 3.737 .0177 137.1 857 198 -1 +1 -1 -1 -1 +1 +1 6.133 .1711 185.2 1398 246 -1 -1 +1 -1 -1 +1 +1 2.569 -.0897 174.9 1006 230 +1 +1 +1 -1 -1 +1 +1 5.005 .0443 206.1 957 221 +1 -1 -1 +1 +1 +1 +1 2.341 .2773 102.9 1576 205 -1 +1 -1 +1 +1 +1 +1 0.830 .3322 47.5 1978 253 -1 -1 +1 +1 +1 +1 +1 3.169 .1225 183.7 1200
* See Table 2 for fac tors and levels

39
STABILOMETER AND COHESIOMETER RESULTS FOR EXPERIMENT 2
Treatment Specimen Combinations * S tabilometer Cohesiometer
Number A B C D E F G Value Value ------- --281 -1 -1 -1 +1 -1 -1 -1 25.61 395.4 265 +1 -1 +1 +1 -1 -1 -1 9.13 370.1 285 -1 -1 -1 -1 +1 -1 -1 61.19 287.1 277 +1 +1 -1 -1 +1 -1 -1 36.90 666.5 269 +1 -1 +1 -1 +1 -1 -1 74.39 577 .1 261 -1 +1 +1 -1 +1 -1 -1 68.67 811.9 286 +1 -1 -1 +1 -1 +1 -1 65.00 1296.0 270 -1 -1 +1 +1 -1 +1 -1 39.35 993.4 282 +1 -1 -1 -1 +1 +1 -1 78.67 603.6 274 -1 +1 -1 -1 +1 +1 -1 64.77 1170.0 266 -1 -1 +1 -1 +1 +1 -1 79.39 801. 9 258 +1 +1 +1 -1 +1 +1 -1 75.79 1102.0 272 -1 -1 -1 -1 -1 -1 +1 56.55 297.9 264 +1 +1 -1 -1 -1 -1 +1 60.79 631.1 288 +1 -1 +1 -1 -1 -1 +1 62.98 679.4 280 -1 +1 +1 -1 -1 -1 +1 48.05 837.6 268 -1 -1 -1 +1 +1 -1 +1 22.24 503.4 284 +1 -1 +1 +1 +1 -1 +1 18.78 549.8 276 -1 +1 +1 +1 +1 -1 +1 4.76 216.3 267 +1 -1 -1 -1 -1 +1 +1 65.32 895.0 259 -1 +1 -1 -1 -1 +1 +1 69.22 1082.0 283 -1 -1 +1 -1 -1 +1 +1 78.25 1125.0 275 +1 +1 +1 -1 -1 +1 +1 80.84 772.3 271 +1 -1 -1 +1 +1 +1 +1 26.23 796.3 263 -1 +1 -1 +1 +1 +1 +1 3.37 220.7 287 -1 -1 +1 +1 +1 +1 +1 37.58 845.3
* Factors and levels are as follows:
Factor Descri~tion Low Level (-1) High Level ~+1l
A Aggregate limestone gravel B Gradation fine coarse C Viscosity (specs) AC-5 AC-20 D Asphalt content, % 5.5 8.5 E Mixing temp., 0 F 250 350 F C . 0 F 200 300 ompactlon temg, G Curing temp., F 40 110

THE AUTHORS
William O. Hadley is a Research Associate with the Cen
ter for Highway Research at The University of Texas at Austin.
He has had experience in the areas of highway design, power
plant construction, and missile complex construction at Cape
Kennedy, Florida. He is the author of several technical papers
and reports and is currently involved in researching and eval
uating the use of asphalt-treated subbases in rigid pavement construction.
W. Ronald Hudson is an Associate Professor of Civil Engi
neering and Associate Dean of the College of Engineering at
The University of Texas at Austin. He has had a wide variety
of experience as a research engineer with the Texas Highway
Department and the Center for Highway Research at The Univer
sity of Texas at Austin and was Assistant Chief of the Rigid
40
Pavement Research Branch of the AASHO Road Test. He is the author of numerous
publications and was the recipient of the 1967 ASCE J. James R. Croes Medal.
He is presently concerned with research in the areas of (1) analysis and design
of pavement management systems, (2) measurement of pavement roughness perform
ance, (3) slab analysis and deSign, and (4) tensile strength of stabilized
subbase materials.
Thomas W. Kennedy is an Associate Professor of Civil En
gineering at The University of Texas at Austin. His experience
includes work with the Illinois Division of Highways and re
search at the University of Illinois and the Center for Highway
Research at The University of Texas at Austin, where he has
conducted extensive investigations in the areas of (1) highway
geometries, (2) concrete durability, (3) tensile strength of stabilized sub
base materials, and (4) time-dependent deformation of concrete and has con
tributed numerous publications in the field of transportation engineering.
He is a member of several professional societies and has participated in
committee work for the Highway Research Board and the American Concrete
Institute.