Embed Size (px)
Citation preview
Walden UniversityScholarWorks
Walden Dissertations and Doctoral Studies Walden Dissertations and Doctoral StudiesCollection
2019
Correlational Analysis of the Relationship AmongMastery Experience, Self-Efficacy, and ProjectSuccessOlakunle Taofeek LemboyeWalden University
Follow this and additional works at: https://scholarworks.waldenu.edu/dissertations
Part of the Databases and Information Systems Commons
This Dissertation is brought to you for free and open access by the Walden Dissertations and Doctoral Studies Collection at ScholarWorks. It has beenaccepted for inclusion in Walden Dissertations and Doctoral Studies by an authorized administrator of ScholarWorks. For more information, pleasecontact [email protected].
Walden University
College of Management and Technology
This is to certify that the doctoral dissertation by
Olakunle T. Lemboye
has been found to be complete and satisfactory in all respects, and that any and all revisions required by the review committee have been made.
Review Committee Dr. Salvatore Sinatra, Committee Chairperson, Management Faculty
Dr. David Gould, Committee Member, Management Faculty Dr. Aridaman Jain, University Reviewer, Management Faculty
Chief Academic Officer Eric Riedel, Ph.D.
Walden University 2019
Abstract
Correlational Analysis of the Relationship Among Mastery Experience, Self-Efficacy,
and Project Success
by
Olakunle T. Lemboye
MBA, Blekinge Institute of Technology, 2010
MSc, Dublin City University, 2007
BSc, Ogun State University, 1995
Dissertation Submitted in Partial Fulfillment
of the Requirements for the Degree of
Doctor of Philosophy
Management
Walden University
May 2019
Abstract
Project managers are important to organizational performance and survival because of
their role in managing, controlling, and steering organizational projects to success.
Research has shown that project failures are globally pervasive due to the shortage of
experienced and well-skilled project managers. The purpose of this descriptive
correlational study was to improve the current understanding of the relationships among
project managers’ project management experience, self-efficacy, and project success, for
which the research questions were focused on in addition to the role of project
management experience on self-efficacy and project success. The theoretical framework
was based on social cognitive theory. This study involved a nonexperimental research
design with a survey to collect data. Purposive sampling was used to recruit 51 Canadian-
based Project Management Institute certified project managers with experiences in
information technology projects. Multiple linear regression was used to assess the role of
project management experience on self-efficacy and project success. Results indicated
significant relationships among project management experience, self-efficacy, and project
success and that project management experience did not mediate the relationship between
self-efficacy and project success. The results may assist organizational leaders to better
understand the holistic implications of project managers’ project management
experiences with project success as well as the role of self-efficacy on project success.
The positive social change implications of this study include greater project success and
decrease project risks due to ineffective project management. Improved project success
may enhance the economic prosperity of organizations, employees, and the community.
Correlational Analysis of the Relationship among Mastery Experience, Self-Efficacy, and
Project Success
by
Olakunle Taofeek Lemboye
MBA, Blekinge Institute of Technology, 2010
MSc, Dublin City University, 2007
BSc, Ogun State University, 1995
Dissertation Submitted in Partial Fulfillment
of the Requirements for the Degree of
Doctor of Philosophy
Management
Walden University
May 2019

Dedication
This study is dedicated to God Almighty who made it possible for me to survive
the rigors of the last four years. To my wife and kids, thank you for your support,
encouragement, and endless prayers. You guys are my rock upon without which I would
not have been able to finish this doctoral study.
Acknowledgments
Thank you to Dr. Salvatore Sinatra, Dr. David Gould, and Dr. Godwin Igein for
their help and support throughout the dissertation process. They facilitated a supportive
committee that made the dissertation process enjoyable and free of stress. Special thanks
also go to my other colleagues on this doctoral journey for being part of a rich
collaborative thinking and learning environment at Walden University. I want to thank
Dr. Alaba Oluyomi for inspiring me to pursue a doctoral degree. I also want to thank the
faculty staffs, the librarians, the Writing Center staff, and the Research Center staff for all
their support throughout the doctoral program.
i
Table of Contents
List of Tables ...................................................................................................................... vi
List of Figures ...................................................................................................................... x
Chapter 1: Introduction to the Study ................................................................................... 1
Background .................................................................................................................... 2
Problem Statement ......................................................................................................... 5
Purpose .......................................................................................................................... 7
Theoretical Framework ................................................................................................. 7
Research Questions and Hypotheses ............................................................................. 9
Nature of the Study ...................................................................................................... 11
Definition of Key Terms ............................................................................................. 12
Assumptions ................................................................................................................ 13
Scope and Delimitations .............................................................................................. 14
Limitations ................................................................................................................... 14
Significance of the Study ............................................................................................. 15
Summary ...................................................................................................................... 15
Chapter 2: Literature Review ............................................................................................ 18
Introduction ................................................................................................................. 18
Literature Review Search Strategy .............................................................................. 19
Theoretical Foundation ................................................................................................ 20
Literature Review ........................................................................................................ 22
Project Management .............................................................................................. 22
ii
Role of Project Management in Organizations ..................................................... 23
Project Management Frameworks ......................................................................... 23
Project Management Body of Knowledge ............................................................ 24
Project Management Body of Knowledge and Project Success ............................ 25
Project Success Indicators ..................................................................................... 26
Self-Efficacy .......................................................................................................... 26
Sources and Development of Self-Efficacy .......................................................... 27
Mechanism of Self-Efficacy .................................................................................. 29
Self-Efficacy and Performance Enhancement ....................................................... 30
Project Management Experience ........................................................................... 31
Project Management Skills, Competence, and Experience ................................... 31
Relevance of Experience in a Project Management Environment ........................ 33
Relevance of Experience on Self-Efficacy in a Project Management
Environment .............................................................................................. 34
Summary ...................................................................................................................... 35
Chapter 3: Research Method ............................................................................................. 37
Introduction ................................................................................................................. 37
Research Design and Rationale ................................................................................... 37
Methodology ................................................................................................................ 39
Participants ............................................................................................................ 39
Materials and Instruments ..................................................................................... 42
Pilot Study ............................................................................................................. 43
iii
Data Collection, Processing, and Analysis ............................................................ 44
Methodological Assumptions, Limitations, and Delimitations ............................. 45
Threats to Validity ................................................................................................. 46
Ethical Assurances ................................................................................................. 47
Summary ...................................................................................................................... 48
Chapter 4: Results .............................................................................................................. 50
Introduction ................................................................................................................. 50
Data Collection and Analysis ................................................................................ 51
Demographics ........................................................................................................ 51
Findings ................................................................................................................. 52
Pearson Correlation Assumptions ......................................................................... 54
Linear Multiple Regression Assumptions ............................................................. 62
Analysis of Test Results ........................................................................................ 66
Research Question 1 .............................................................................................. 66
Research Question 2 .............................................................................................. 67
Research Question 3 .............................................................................................. 67
Research Question 4 .............................................................................................. 68
Conclusion ................................................................................................................... 72
Chapter 5: Discussion, Conclusions, and Recommendations ........................................... 73
Introduction ................................................................................................................. 73
Interpretation of Findings ............................................................................................ 73
Applications to Professional Practice .................................................................... 77
iv
Implications for Positive Social Change ..................................................................... 78
Recommendations for Action ...................................................................................... 79
Recommendations for Further Research ..................................................................... 79
Reflections ................................................................................................................... 80
Conclusion ................................................................................................................... 81
References ......................................................................................................................... 82
Appendix A: Instruments and Items Included in Study Survey ........................................ 96
Appendix B: Frequency Tables for Demographic Variables .......................................... 102
Appendix C: Frequency Tables for Project Success, Project Management Self-
Efficacy, and Project Management Experience Survey Questions ..................... 105
Appendix D: Descriptive Statistics of Study Variables .................................................. 116
Appendix E: Cronbach’s Alpha for PSS and PMSE Scales ............................................ 117
Appendix F: Descriptive Statistics and Bivariate Correlation Test Results for
PMSE and NGSE ................................................................................................ 118
Appendix G: Stem and Leaf Plot Table Showing Outliers ............................................. 119
Appendix H: Test of Pearson Correlation Analysis Assumptions .................................. 120
Appendix I: Correlation Analysis of the Relationships between PMSE, PSS, and
PMES Successful Experience Scores .................................................................. 122
Appendix J: Mediating Effect of PMES Successful Experience on Self-Efficacy
and Project Success Using Least Square Estimation ........................................... 123
Appendix K: Mediating Effect of PMES Successful Experience on Self-Efficacy
and Project Success Using Weighted Least Square Estimation .......................... 125

v
Appendix L: Permissions to use Research Instruments .................................................. 127
vi
List of Tables
B1. Frequency Table for Age .......................................................................................... 102
B2. Frequency Table for Gender ..................................................................................... 102
B3. Frequency Table for Professional Certification (PMP) ............................................ 103
B4. Frequency Table for Professional Certification (PgMP) .......................................... 103
B5. Frequency Table for Professional Certification (PfMP) ........................................... 103
B6. Frequency Table for Professional Certification (Other) ........................................... 103
B7. Frequency Table for Country of Residence .............................................................. 104
B8. Frequency Table for Country of Residence (Other) ................................................. 104
C1. Percentage of Projects that Meet Budget Allowance ................................................ 105
C2. Percentage of Projects that Meet Deadlines ............................................................. 105
C3. Percentage of Projects that Meet Technical Specifications ...................................... 105
C4. Percentage of Projects that Meet the Expectations of the Customer ........................ 106
C5.Address Poor Individual Performance by Providing Constructive Criticism Promptly
in Private .................................................................................................................. 106
C6. Delegate Work to Meet Project Needs While Considering Team Members’ Personal
and Professional Needs ............................................................................................ 106
C7. Monitor Team Behaviors and Take Corrective Action When the Team is not
Working Well .......................................................................................................... 107
C8. Negotiate Acceptable Project Decisions When Stakeholders Disagree Over Priorities
................................................................................................................................. 107
C9. Communicate to Ensure that All Stakeholders Have the Same Understanding ....... 107
vii
C10. Engage External Stakeholders ................................................................................ 108
C11. Develop Shared Stakeholder Understanding of the Project .................................... 108
C12. Implement Project Management Processes and Procedures in a Way That Gains
Acceptance From All Members of the Team .......................................................... 108
C13. Break the Work Down with Measurable Completion Criteria that Team Members
will Commit to Delivering ....................................................................................... 109
C14. Incorporate “Lessons Learned” from Previous Projects into Planning the Work .. 109
C15. Ensure the Plan for the Project Reflects Relevant Legal Requirements and
Addresses Potential Conflicts .................................................................................. 109
C16. Use Appropriate Risk Analysis Tools .................................................................... 110
C17. Prioritize Measurable Project Success Criteria in Cooperation With All Relevant
Stakeholders ............................................................................................................ 110
C18. Achieve Sign Off on a Realistic Schedule for the Project ...................................... 110
C19. Hold Regular Status Meetings ................................................................................ 111
C20. Recognize When a Risk or Legal Requirement Becomes an Issue and Take Action
................................................................................................................................. 111
C21. Take the Time to Seek Feedback on My Personal Performance ............................ 111
C22. Define Key Characteristics and Business Benefits of the Product of the Project and
Acquire Sign Off ..................................................................................................... 112
C23. Ensure That All Requests for Changes to the Product of the Project Follow a
Defined Change Control Process and Only Those Signed Off by the Sponsor are
Acted On .................................................................................................................. 112
viii
C24. Secure Sign Off of The Product of the Project to Close the Project ....................... 112
C25. Write a Project Charter that Describes the Project in Enough Detail to Obtain
Agreement from Key Stakeholders to Begin Work ................................................ 113
C26. Implement Kick-Off Activities ............................................................................... 113
C27. Obtain Phase End Sign Off on the Outputs of the Last Phase and Transition
Between Phases ....................................................................................................... 113
C28. Close the Project by Finalizing Project Records, Obtaining Sign Off and
Redeploying the Team ............................................................................................. 114
C29. Plan for Project Evaluation Including Specifying the Purpose, Focus, Criteria, and
Relevant Evaluation Techniques to be Used ........................................................... 114
C30. Evaluate the Project in Accordance With the Evaluation Plan Engaging All Key
Stakeholders in the Evaluation ................................................................................ 114
C31. Evaluate Project Reviews and Suggested Improvements, Discuss With Key
Stakeholders and Take Appropriate Action ............................................................ 115
C32. Aggregate Percentage of Successful Experiences on IT projects ........................... 115
H1. Test of Normality: PMES, PMSE, and PSS Scores ................................................. 120
H2. Descriptive Statistics: PMES, PMSE, and PSS Scores ............................................ 121
J1. Descriptive Statistics of the Regression Model ......................................................... 123
J2. Stages of the Regression Model ................................................................................. 123
J3. Regression Model Summary ...................................................................................... 123
J4. Regression Model ANOVA Table ............................................................................. 124
J5. Regression Model Coefficients Table ........................................................................ 124
ix
K1. Stages of WSLE Regression Model ......................................................................... 125
K2. WSLE Regression Model Summary ......................................................................... 125
K3. WSLE Regression Model ANOVA Table ................................................................ 126
K4. WSLE Regression Model Coefficients Table .......................................................... 126
x
List of Figures
Figure 1. Sources of self-efficacy ........................................................................................ 8
Figure 2. Research steps .................................................................................................... 39
Figure 3. PSS successful experience outlier graph ............................................................ 54
Figure 4. PMES successful experience outlier graph ........................................................ 54
Figure 5. Frequency distribution of project success scores ............................................... 56
Figure 6. Frequency distribution of project management self-efficacy scores .................. 56
Figure 7. Frequency distribution of PMES successful experience scores ......................... 57
Figure 8. Project success scores outlier graph ................................................................... 57
Figure 9. Project management self-efficacy scores outlier graph ..................................... 58
Figure 10. PMES successful experience scores outlier graph ........................................... 58
Figure 11. PMSE and project success linearity test .......................................................... 59
Figure 12. PMES successful experience and self-efficacy test ......................................... 60
Figure 13. PMES successful experience and project success linearity test ....................... 60
Figure14. PMSE and PSS scores homoscedasticity test ................................................... 61
Figure 15. PMES successful experience and PMSE scores homoscedasticity test ........... 61
Figure 16. PMES successful experience and PSS scores homoscedasticity test ............... 62
Figure 17. Standardized residual histogram ...................................................................... 63
Figure 18. Normal P-P plot of standardized residuals ....................................................... 64
Figure 19. Normal P-P plot of standardized residuals ....................................................... 65
1
Chapter 1: Introduction to the Study
Current business environments have resulted in organizational leaders
implementing projects to improve businesses and implement changes more easily
(Berssaneti & Carvalho, 2015; Bronte-Stewart, 2015). However, the high rate of project
failure is an impediment to competitive growth and performance (Berssaneti & Carvalho,
2015; Bronte-Stewart, 2015). Many researchers (Huff & Prybutok, 2008; Hwang & Lim,
2013; Silva de Araújo & Pedron, 2015) have highlighted project managers’ competence
and experience as one of the factors that enhance project performance and success.
According to Kamohi and Autram (2014), repeated cases of successful experiences in a
task can enhance project managers’ efficacy, whereas repeated cases of negative
experiences are likely to result in low self-efficacy. Consequently, the type of experiences
to which project managers are exposed could indicate how project managers will perform
in their role.
In Chapter 1, I introduce the research topic and background information on the
interrelationship between the key research variables: project managers’ experience, self-
efficacy, and project success. The problem statement, the purpose of the study, and the
theoretical framework follow the background of the study. Chapter 1 also includes the
research questions, research hypotheses, nature of the study, and definitions of key terms.
The chapter concludes with the assumptions, scope and delimitations, limitations,
significance of the study, and summary.
2
Background
Organizational leaders are increasingly transforming the way they operate by
focusing on strategic projects instead of traditional management that involves set
procedures (Itegi, 2015; Project Management Institute [PMI], 2015). Organizational
projects enable fast and consistent delivery of business results to cope with the challenges
of a dynamic business landscape. For example, Lenovo experienced a 10% increase in
turnover in 2006 due to the establishment of a project management office that enabled the
transition from traditional management approaches to a project management approach
(Itegi, 2015). Many authors have also emphasized project management as a core
organizational competence to remain competitive and achieve organizational success
through overall project success (Benoy & Gracias, 2015; Hadad, Keren, & Laslo, 2013;
Itegi, 2015; Sadeghi, Mousakhani, Yazdani, & Delavari, 2014). A project is successful
when its completion is “within the specified constraints of scope, time, cost, quality,
resources, and risk” (PMI, 2013, p. 35).
The selection of project managers with the right skills and competencies is crucial
to project success in modern organizations (Benoy & Gracias, 2015; Hadad et al., 2013;
Sadeghi et al., 2014; Sprouse, 2010). For this reason, there is an increase in project
managerial job openings, and the industry is experiencing a surge in professionals
seeking to transition to project managerial roles. However, the high demands for project
managers sometimes force organizational leaders to resort to new and inexperienced
project managers to fill these roles (Benoy & Gracias, 2015). In the absence of
experienced project managers, organizational leaders may take on managers who have
3
little or no project management experience to be successful in these roles (Benoy &
Gracias, 2015; Florentine, 2014). Inexperienced project managers such as new or junior
project managers are more susceptible to project failures, causing high monetary losses
(Benoy & Gracias, 2015; PMI, 2015). Additionally, new managers are sometimes not
prepared to face work-related challenges when compared to seasoned managers, making
them more susceptible to failure (Plakhotnik, Rocco, & Roberts, 2011). Almost half of
first-time managers fail in the first 3 months of occupying the role due to inexperience,
causing significant organizational losses and affecting the performance of the
organization (Plakhotnik et al., 2011). For example, a trend among software engineers
occupying their first project managerial role indicated that they either quit the role after a
short period or avoided the role due to complexities and fear of failure (Pressman, 1998).
Many project managers acquire the necessary project management skills through
traditional ways of learning such as academic and specialist training programs but may
lack the experience in meeting the challenges of real life projects (Geithner & Menzel,
2016; Ramazani & Jergeas, 2015). The growing complexities in business environments
require project managers to possess a combination of relevant skills, expertise, and
experience to lead projects (Barnwell, Nedrick, Rudolph, Sesay, & Wellen, 2014). There
is a link between project managers’ experience and competency development (Geithner
& Menzel, 2016; Ofori, 2014). However, there is a lack of studies on the project
management environment to support this relationship. Other authors such as Plakhotnik
et al. (2011) have linked everyday experiences to the performance and success of new
managers, whereas others have emphasized practical experiences as a source of
4
professional competence such as practicum experience improving preservice teacher
performance (Martins, Costa, & Onofre, 2015).
Many authors have also underscored the positive influence of experience on self-
efficacy, which affects achievement and performance in areas like academic
environments and general success (Ineson, Jung, Hains, & Kim, 2013; Martins et al.,
2015). Experience with success has also influenced self-efficacy in programs like a
technology-supported behavior intervention program (Achterkamp, Hermens, &
Vollenbroek-Hutten, 2015). Many studies (Ineson et al., 2013; Kamohi & Autram, 2014;
Martins et al., 2015; Wood & Bandura; 1989) have found that successful experiences
lead to high self-beliefs (self-efficacy), whereas failures or poor performances lead to low
self-efficacy beliefs. These findings suggest that inexperienced project managers have
lower self-efficacy than experienced project managers because they are more susceptible
to the negative experiences of project failures.
Research has suggested that there is a relationship among professional experience,
self-efficacy, and successful outcomes (Ineson et al., 2013; Kamohi & Autram, 2014;
Martins et al., 2015). However, much work has not been done on the effect of experience
on self-efficacy and how self-efficacy affects performance in a project environment.
There is a gap in the literature of project management regarding the relationships of
repeated performance of project management tasks, project managers’ self-efficacy, and
project success in real life project management environment. Researchers have not
captured how project managers’ positive successful and negative failure experiences in a
project management environment affect the outcome of projects. This gap formed the
5
context of this study on the relationships between these three variables in a project
environment.
Problem Statement
Project failures are still pervasive across the globe, causing substantial financial
losses to project owners such as organizations and governments (Damoah & Akwei,
2017; Liebowitz, 2015). For example, Liebowitz (2015) highlighted that only 41 out of
199 projects in the United Kingdom government’s 500 billion-pound portfolio were
successfully delivered in 2014. Liebowitz also noted that the U.S. government loses $20
billion of its $80 billion annual spending on information technology (IT) projects to
failed projects. Further, Aranyossy, Blaskovics, and Horvath (2018) reported that 18% of
IT projects failed in 2012, and Damoah and Akwei (2017) reported a financial loss in
2010 of about 15 million New Zealand dollars to organizations as a result of the
nondelivery of one-third of organizational projects on budget. Allen, Alleyne, Farmer,
McRae, and Turner (2014) also reported that the projected rate of project failure for
Gartner from 2013 to 2016 was between 20% to 28%. Moreover, Davis (2011) found that
only 41% of projects met their objectives within specified standards for time, budget, and
quality. Finally, Denic, Moracanin, Milic, and Nesic (2014) found that over 90% of
enterprise resource planning implementation projects experience resource overrun.
The general problem was that there is a shortage of experienced and well-skilled
project managers due to the increasing demand for successful project managers to ensure
faster and successful delivery of projects (Benoy & Gracias, 2015; Gewanial & Bekker,
2015). Many organizational leaders are turning to less experienced project managers,
6
such as new and junior project managers, to occupy available project managerial roles
(Benoy & Gracias, 2015; Florentine, 2014; Gewanial & Bekker, 2015). However, new or
junior managers are not as competent as experienced managers and are more prone to
project failures, putting customer expectations and organizational success at risk
(Florentine, 2014; Benoy & Gracias, 2015). Project managers’ lack of experience is one
of the reasons that projects fail (Benoy & Gracias, 2015; Florentine, 2014; Patanakul,
2014). The PMI, a professional membership organization for individuals who want to
advance a career in project management, reported in its 2014 survey of project
management leaders and practitioners that inexperienced project managers accounted for
20% of project failures (PMI, 2015).
Although many studies have focused on the effect of the duration of project
managers’ experience on project efficiency and success (Aranyossy, Blaskovics, &
Horvath, 2018; Rubin & Seeling, 1967; Rugenyi, 2016), the effect of successful and
failure experiences has not been sufficiently explored. The specific problem addressed in
this study was the deficiency in knowledge regarding how the exposure of project
managers to success and failure experiences affects their efficiency and project success.
A review of past literature revealed no research on the correlational relationship among
successful and failure experiences of project managers, self-efficacy of project managers,
and project success. Thus, the focus of this study was on the four indicators of project
success and performance: cost, schedule, technical performance, and customer
satisfaction (Berssaneti & Carvalho, 2015; Thi & Swierczek, 2010). Additionally, no
scholar has evaluated whether the self-efficacy theory of the social cognitive theory is
7
valid in IT project environment, so I attempted to reduce this gap by investigating the
relationships among project managers’ exposure to successful experiences, self-efficacy,
and project success.
Purpose
The purpose of this quantitative, descriptive correlational study was to improve
the current understanding of the relationships among project management experience,
project managers’ self-efficacy, and project success. Researchers have not fully explored
the validity of the self-efficacy theory of Bandura’s social cognitive theory in a project
environment, especially the effect of self-efficacy, through mastery experience, on
project success. This study involved examining the relationships between project
managers’ exposure to successful experiences and their self-efficacy. This study also
involved examining the relationship between perceived self-efficacy of project managers
and project success as well as how successful experiences mediate this relationship.
Theoretical Framework
Part of the framework for this study includes perspectives of project success.
There are three perspectives for measuring project success: sponsor’s perspective, project
manager’s perspective, and client or customer’s perspective (Thi & Swierczek, 2010).
Project success criteria also includes cost, schedule, technical performance, and customer
satisfaction, meaning that a project is successful if it is completed within budget, on time,
and with the proper performance that leads to customer acceptance (Thi & Swierczek,
2010). Adherence to cost, schedule (time), and quality are important indicators that are
traditionally used to measure project success, though quality can be further divided into
8
technical specifications and customer satisfaction (Berssaneti & Carvalho, 2015). In this
study, the focus was on the three dimensions of project success that constitute the Iron
Triangle (i.e., cost, schedule, and quality). The Iron Triangle has been used in many
studies to represent the connection among these three dimensions (Bronte-Stewart, 2015).
The theoretical framework for this study was also guided by Bandura’s social
cognitive theory, as the focus of the study was on self-efficacy. Many authors of self-
efficacy studies have relied on Bandura’s (1989) social cognitive theory (Bolaños-
Medina, 2014; Ineson et al., 2013; Martins et al., 2015). The social cognitive theory
explains the role of mastery modeling in the development of cognitive, social, and
behavioral competencies of people, how people cultivate beliefs in their capabilities, and
motivation enhancement through goal systems (Bandura, 1989, 1994; Wood & Bandura,
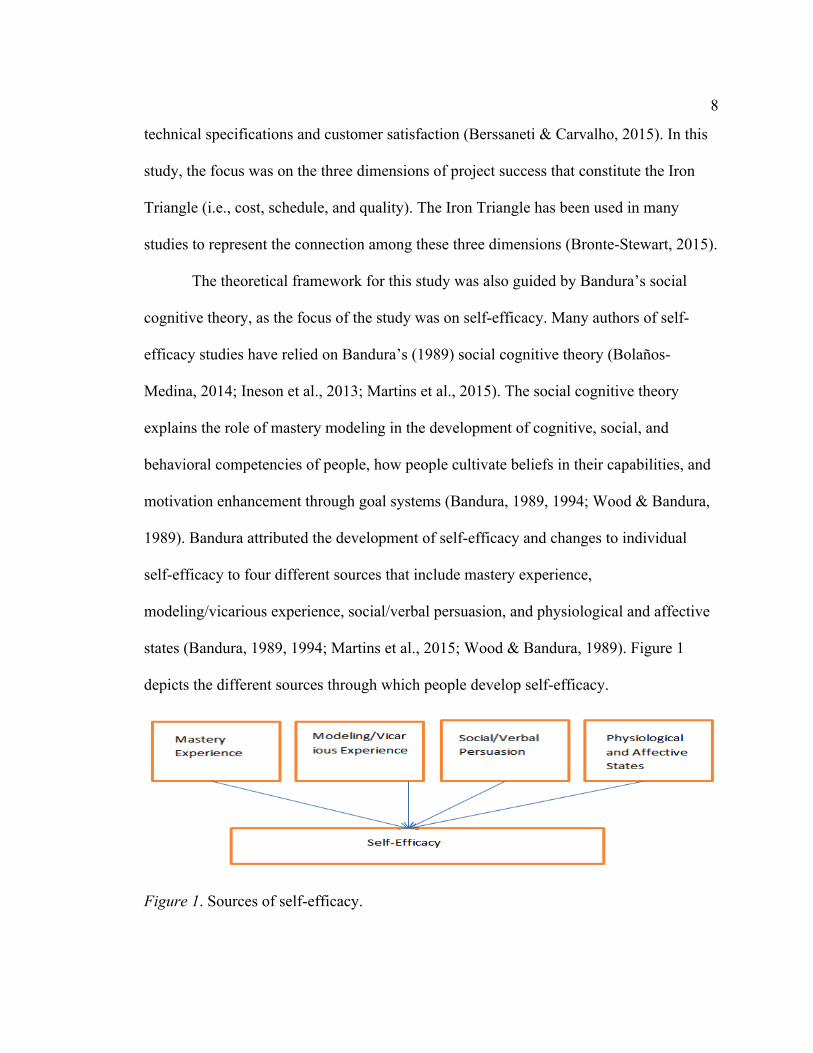
1989). Bandura attributed the development of self-efficacy and changes to individual
self-efficacy to four different sources that include mastery experience,
modeling/vicarious experience, social/verbal persuasion, and physiological and affective
states (Bandura, 1989, 1994; Martins et al., 2015; Wood & Bandura, 1989). Figure 1
depicts the different sources through which people develop self-efficacy.
Figure 1. Sources of self-efficacy.
9
Self-efficacy is central to the self-regulation of motivation and performance
attainments in social cognitive theory because the capability to mobilize motivation
through self-reactive influences is one of the human mechanisms that facilitate this
regulatory process, which works through personal efficacy beliefs (Bandura, 1991, 1994;
Wood & Bandura, 1989). Repeated successes enable people to develop high assurance in
their capabilities, affirming that external experiences influence self-efficacy (Bandura,
1991, 1994; Wood & Bandura, 1989). Bandura (1994) asserted that there is a positive
relationship between self-efficacy and the boldness to take on mentally taxing and
threatening activities. Further, mastery experience is the most effective way of
developing a strong sense of efficacy because it provides convincing evidence of success
(Bandura, 1994; Martins et al., 2015; Wood & Bandura, 1989). Therefore, self-efficacy
theory from a social and cognitive perspective was the underlying premise for examining
the relationships among the following variables: mastery experience, self-efficacy, and
project success.
Research Questions and Hypotheses
I examined the relationships among project managers’ exposure to successful
experiences, self-efficacy, and project success, especially how successful project
management experiences mediate the relationship between self-efficacy and project
success. The following four research questions and hypotheses guided the study:
Research Question 1: What is the relationship between project managers’
exposure to successful experiences and project managers’ self-efficacy?
10
H01: There is no significant statistical relationship between project managers’
exposure to successful experiences and self-efficacy.
Ha1: There is a significant statistical relationship between project managers’
exposure to successful experiences and self-efficacy.
Research Question 2: What is the relationship between project managers’ self-
efficacy and project success?
H02: There is no significant statistical relationship between project managers’
self-efficacy and project success.
Ha2: There is a significant statistical relationship between project managers’ self-
efficacy and project success.
Research Question 3: What is the relationship between project managers’
exposure to successful experiences and project success?
H03: There is no significant statistical relationship between project managers’
exposure to successful experiences and project success.
Ha3: There is a significant statistical relationship between project managers’
exposure to successful experiences and project success.
Research Question 4: Does project managers’ exposure to successful experiences
mediate the relationship between self-efficacy and project success?
H04: Project managers’ exposure to successful experiences does not mediate the
relationship between self-efficacy and project success.
Ha4: Project managers’ exposure to successful experiences mediates the
relationship between self-efficacy and project success.
11
Nature of the Study
I adopted a quantitative descriptive correlational design to guide data collection,
analysis, and evaluation of results. Quantitative research is consistent with understanding
the relationships between random research variables (Frankfort-Nachmias, Nachmias, &
DeWaard, 2015). The descriptive correlational design is relevant when describing
research variables and investigating the natural relationships or associations between and
among these variables (Sousa, Driessnack, & Mendes, 2007). Researchers embark on
descriptive correlational design when investigating if and how changes in one or more
variables predict changes in one or more variables (Sousa, Driessnack, & Mendes, 2007).
Data collection was achieved through a survey, and the sample population was from
members of the PMI. Surveys enable researchers to study a representative sample of
institutions and communities and generate standardized quantifiable data that can be
statistically analyzed to reveal relevant characteristics in an unbiased and scientific
manner (Rea & Parker, 2014).
In this study, I used the project success scale (PSS) to measure variables that
include cost, schedule/time, and quality that are traditionally used to measure project
success (Berssaneti & Carvalho, 2015). I adopted the PSS scale from the project
efficiency scale that Serrador and Turner (2015) used in their study on the relationships
between project success and project efficiency measures of cost, time, and scope and
requirements. To measure the indicators of self-efficacy, I used the new 8-item general
self-efficacy (NGSE) scale developed by Chen, Gully, and Dov (2001). The NGSE scale
has been used to examine the influence of prior subject knowledge, prior ability, and
12
work experience on the self-efficacy of students (Ineson et al., 2013). I also used a task-
specific self-efficacy scale that Blomquist, Farashah, and Thomas (2016) used to measure
the competencies of project managers in performing the different project management
tasks.
The selection of participants in this study was achieved through purposive
sampling. This strategy is appropriate when researchers seek specific participants who
meet certain qualification criteria (Suen, Huang, & Lee, 2014). In this study, I used
quantitative analysis to demonstrate the relationships among the research variables. I used
IBM SPSS statistical software for quantitative and descriptive data analysis of the sample
population. The estimation of the relationships between the research variables in this
study was achieved through correlation and regression analysis. The evaluation of the
mediating effect of project management experience on the relationship between project
managers’ self-efficacy and project success was achieved through linear multiple
regression.
Definition of Key Terms
Mastery experience: The most effective source of information about self-efficacy
and it represents how a highly successful experience positively affects human perception
of self-efficacy (Martins et al., 2015). It enables people to judge whether they have the
capability to accomplish a particular task (Ineson et al., 2013).
Project: “A temporary endeavor that has a definite beginning and end, undertaken
to create a unique product, service, or result” (PMI, 2013, p. 3). Bronte-Stewart (2015)
considered four different definitions of project success from four project management
13
standards organizations and surmised that projects are temporary in nature, unique, and
are focused toward achieving certain objectives or creation of end-products.
Project management: “The application of knowledge, skills, tools, and techniques
to project activities to meet project requirements” (PMI, 2013, p. 5).
Project manager: A “person assigned by the performing organization to lead the
team that is responsible for achieving the project objectives” (PMI, 2013, p. 16).
Project success: Completion of a project “within the constraints of scope, time,
cost, quality, resources, and risk as approved between the project managers and senior
management” (PMI, 2013, p. 35).
Self-efficacy: How well a person believes in his or her ability to perform a
particular task (Moriarty, 2014). Martins et al. (2015) described self-efficacy as “people’s
judgments of their capabilities to organize and execute courses of action required to attain
designated types of performances” (p. 264).
Assumptions
The following assumptions underlie this study:
1. The selected project managers have diverse experiences, and the participants
will report their project management experiences accurately.
2. Due to the anonymous nature of this study, I assumed that the selected project
managers provided honest reflections of the project success indicators.
Anonymous study participants are more likely to provide honest reporting to
questions than when participation is not anonymous (Warner et al., 2011).
14
3. The selected project managers possess relevant industry knowledge to work
effectively, given that all projects are different and require knowledge of the
specific industry.
Scope and Delimitations
Although there are many dimensions for measuring project success, compliance
with cost, schedule, and quality has been traditionally used in many studies (Berssaneti &
Carvalho, 2015; Thi & Swierczek, 2010). The scope of this study was restricted to
mastery experience, one of the sources of self-efficacy, because it provides evidence as
the most effective way to develop a strong sense of efficacy (Bandura, 1994; Martins et
al., 2015). Due to convenience and accessibility, the scope of this study was limited to
PMI certified project managers in Canada but not limited to Canadian projects.
Limitations
Three limitations apply to this study. First, the lack of random selection in
purposive sampling poses external validity issues due to possible selection bias that often
affects the representativeness of the research sample and generalization of research
results beyond the sample. However, efforts were made to eliminate selection bias by
seeking the expertise of a research methodologist to determine the qualification criteria
that ensured the selection of research participants that were representative of the study
population. Second, the research relied on participants accurately reporting their level of
project management experience; otherwise, the validity of research results may be
affected. Third, the NGSE self-efficacy measurement scale is a general scale that is not
specific to any domain. Therefore, the domain items might not capture project
15
management tasks specific activities, thus posing threats to the validity of the research
results. To enhance the validity of the results, a task-specific self-efficacy scale was used
to capture participants’ competencies in the different project management tasks.
Significance of the Study
The goal of this study was to understand the holistic implications of project
management experience on project managers’ self-efficacy and project success. The
results could provide new insights into ways that could enhance the competency,
integration, adaptation, and success of inexperienced, new, and junior project managers
in project managerial roles, which can enhance the success of organizational projects.
Because organizations implement projects on a regular basis as solutions to the
challenges of the competitive business environment, results from this study could also
help organizational leaders better understand ways to maximize project success rates and
overall success of the organization. Results could help organizations determine the tools
and framework needed to enhance the success of project managers and organizational
sustainability. The results may reveal ways to lessen the effect of the type of project
managers’ experiences on the different dimensions of project success and can help
prevent the high turnover rate of new project managers, organizational failure,
downsizing, job loss, and shutdown of organizations. Preventing or lessening such
detriments can be significant for positive social change.
Summary
Projects play a significant role in organizational success and are critical to the
performance, growth, and survival of organizations (Kamohi & Autram, 2014; PMI,
16
2013). Project managers are important to the success rate of organizational projects, as a
project management approach to managing, monitoring, and controlling project tasks
account for 20% of project success, whereas the performance of project managers
account for the remaining 80% (Kamohi & Autram, 2014). Project managers require
requisite skills, knowledge, and experience to apply project management methodology,
best practices, and standards to monitor, manage, and control project activities as well as
enhance project success (PMI, 2013). Inexperienced and underdeveloped project
managers are one of the major causes of project failure (PMI, 2015). Given the scarcity
of experienced project managers and the limited knowledge of the relationship among
mastery experience, self-efficacy, and successful performances, this quantitative study
was focused on project management environment and the relationships among project
management experience, self-efficacy, and project success.
Chapter 2 contains a thorough review of project management and self-efficacy
literature relating to project managers’ effectiveness and success. I also present a
summary of the themes that emerged from the literature review. Chapter 3 contains a
detailed discussion of the research methodology used to answer the research questions.
Chapter 3 also includes the rationale for selecting a quantitative nonexperimental
research design and discussions about recruitment, sampling, and the target population. A
description of the survey instruments, data collection and analysis methods,
methodological assumptions and limitations, ethical and validity issues related to this
study, and a brief chapter summary formed the basis for the remainder of Chapter 3.
17
Chapter 4 contains details of data collection, sample characteristics, and screening
of research participants. The chapter also contains the results of correlation and
regression analysis as well as the results of the linear multiple regression analysis. I
include a discussion of all findings associated with each research question and hypothesis
as well as an overview of additional findings that might influence future studies. Chapter
5 contains the summary of the study that details the limitations, interpretations of
findings, recommendations for future research, and the implications for positive social
change.
18
Chapter 2: Literature Review
Introduction
Many projects fail despite project managers having recognized industry
certifications in project management for the skills and expertise to manage projects
(Varajao, Colomo-Palacios, & Silva, 2016). The lack of skilled project managers and
technical project management techniques and poor project management are significant
factors that cause project failure (Ramos & Mota, 2014). The PMI (2015) linked 20% of
project failure within a 12 months period to inexperienced project managers, and the lack
of effective project management is a common feature of failed projects (Varajo et al.,
2016). My analysis of relevant studies revealed a relationship among experience, self-
efficacy, and performance (Ineson et al., 2013; Kamohi & Autram, 2014; Martins et al.,
2015), aligning with Bandura’s self-efficacy theory that suggests successful experiences
increase self-efficacy, and in turn performance, achievement, and success.
The purpose of this quantitative, descriptive correlational study was to improve
the current understanding of the relationships among project management experience,
project managers’ self-efficacy, and project success. I start the literature review with a
discussion of the literature search strategy followed by articles that provided insight into
Bandura’s self-efficacy theory regarding the sources of self-efficacy, development of
self-efficacy, mastery experience, and the effect of mastery experience on self-efficacy.
Next, I include a literature review of researches focused on project management
frameworks, project management knowledge, and its relevance to project success, and
indicators of project success. I also include articles focused on relevant project
19
management skills, main competency areas, and the route through which project
managers acquire project management experience. Additional discussion involves the
relevance of project managers’ experience on self-efficacy in a project management
environment. I conclude the chapter with an overview of articles that highlight the
relationship among experience, self-efficacy, and project performance.
Literature Review Search Strategy
In this literature review, I focused on the relationship among project managers’
experience, self-efficacy, and project success in a project environment. The articles were
selected from peer-reviewed journals and academic journals hosted by databases that
include ABI/INFORM Complete, Academic Search Complete, and Business Source
Complete. Other academic databases include Computers and Applied Sciences Complete,
Google Scholar, International Journal of Project Management, and Project Management
Journal. The search of the databases was based on the keywords project success, project
failure, project manager, project management experience, mastery experience, first-time
manager, new project manager, self-efficacy, social cognitive theory, known-groups
technique, purposive sampling, linear multiple regression, and regression analysis. I used
limiters such as published date to limit the articles to only peer-reviewed journals
published in the last 5 years. I also used citation chaining to identify relevant articles,
journals, and studies from those already discovered. The literature review also contains
relevant information from white papers and the yearly pulse of the profession reports
from the PMI website. I also obtained relevant information from the 2013 project
manager salary and development survey conducted by ESI International, a project-
20
focused training company. I also obtained news report with relevant information from the
website of CIO magazine, a respected trade journal.
Theoretical Foundation
The theoretical foundation for this study was the social cognitive theory by
Bandura, which grew out of the social learning theory. The social learning theory
introduced the role of cognitive capacity in influencing behavior. According to Bandura
(1971), the social learning theory represents a shift from the traditional learning theorists
who promoted the concept of behavior from internal forces such as needs, drives, and
impulses, and motivators. The social cognitive theory introduced the concept of human
functioning as a triadic model of reciprocal determinism arising from the interaction
between behavior, cognitive capability and other personal factors, and environmental
influences (Bandura, 1989). The social cognitive theory was based on the proposition that
people learn through direct experience, modeling, and observing the behavior of others
and that behavior is motivated and regulated by the ongoing exercise of self-influence
(Bandura, 1971, 1991, 1994). The social cognitive theory was also based on the
assumption that people change by creating new patterns of behavior through direct
experience or observation and by acquiring symbolic representations of modeled
activities (Bandura, 1971).
In social cognitive theory, cognition plays a central role in the motivation and
regulation of human behavior (Bandura, 1989, 1991). Perceived self-efficacy is an
important cognitive factor that influences personal control over people’s motivation, and
improvement in self-efficacy tends to have a corresponding effect on motivation and
21
performance (Bandura, 1994; Wood & Bandura, 1989). Bandura posited that self-
efficacy is central to the exercise of personal agency and plays a key role in the self-
regulation of motivation and performance attainments (Bandura, 1991, 1994; Wood &
Bandura, 1989).
Self-efficacy influences individual performance, motivation, coping abilities, and
persistence in difficult situations in addition to facilitating goal-setting and decision-
making (Bolaños-Medina, 2014). The literature revealed the use of the self-efficacy
concept in ways similar to this study and in multiple contexts (Beas & Salanova, 2006).
For example, Daglar, Bilgic, Evcili, and Bolat (2018) and Martins et al. (2015) showed
the positive effect of self-efficacy on achievement and performance in academic
environments for both students and teachers. In a clinical context, Peters, Potter, Kelly,
and Fitzpatrick (2019) reported that self-efficacy positively influenced health-related
quality of life in people with multimorbidity. Sukhee and Jiwon (2018) also reported that
older women with higher self-efficacy recorded successful osteoporosis and fall’s
preventive behavior than those with lower self-efficacy. Sivrikaya (2018) applied the
self-efficacy concept to sports and concluded that self-efficacy influenced the acquisition
of football skills and that it is a key characteristic of a successful athlete. Finally,
Blomquist et al. (2016) and Kamohi and Autram (2014) applied self-efficacy to project
management to predict the performance and effectiveness of project managers.
One of the propositions of self-efficacy is that people consciously create and
strengthen their self-efficacy through information integrated from the different sources of
self-efficacy (Bandura, 1994; Wood & Bandura, 1989). This proposition provided the
22
rationale for the application of self-efficacy in this study that contributes to the ongoing
discussion in academia about success and performance enhancement strategies for project
managers. Repeated experiences of success strengthen self-efficacy and thus
performance, whereas failure experiences undermine self-efficacy by creating self-doubt
(Bandura, 1988, 1994; Bolaños-Medina, 2014; Inison et al., 2013; Wood & Bandura,
1989). Mastery experience, the direct experience from successful completion of tasks, is
the most effective way of gaining a strong sense of self-efficacy. In this study, the self-
efficacy concept provided the guidelines for developing and formulating the research
questions and hypothesizing the relationships among the research variables. The research
questions in this study related to whether self-efficacy is a motivation variable for
predicting project success and whether success experiences affect project managers’ self-
efficacy and project success, thus addressing the deficiency in knowledge regarding these
relationships in IT project environments.
Literature Review
Project Management
Project management is a formalized approach that enhances the handling of
complex business undertaken in organizations through well-organized processes for the
planning, controlling, and managing projects and clearly defined roles (Gemünden,
2014). Many international standard organizations are promoting project management as
an approach to assist organizations, especially project managers, to manage, increase the
success rate of projects and ultimately organizational performance and productivity (Md
Nasir, Sahibuddin, Ahmad, & Mohd Fauzi, 2015). Project management helps
23
organizations realize the benefits of projects as well as satisfy the needs for which they
undertake projects.
Role of Project Management in Organizations
Organizations are increasingly relying on project management to help enhance
business performance, productivity, and organizational success (Gemünden, 2014; Mir &
Pinnington, 2014; Pollack & Adler, 2014). The value of project management lies in its
effect on project success indicators, including but not limited to customer satisfaction,
business success, and long-term organizational success (Mir & Pinnington, 2014). Project
management also has a significant effect on business productivity when used to undertake
core business activities (Pollack & Adler, 2014), and project management has a strong
effect on the productivity of practitioners and the organization as a whole (Gemünden,
2014). Project managers rely on project management methods and frameworks for
efficient planning, managing, execution, and controlling of organizational projects, which
leads to a better balance of quality, time, cost, and risk (Md Nasir et al., 2015). Thus,
individual project managers and organizations benefit from the use of project
management practices, tools, and methodologies.
Project Management Frameworks
Many have promoted different variants of project management frameworks, tools,
and techniques to enhance project success and improve organizational performance.
Project management frameworks provide project managers with knowledge, skills, tools,
and techniques to ensure effective management of project activities through efficient use
of project resources to meet user and stakeholder needs, while also striving to fulfill the
24
various critical success factors (Besteiro, de Souza Pinto, & Novaski, 2015; Md Nasir et
al., 2015). Some of the examples of the existing variants of project management
guidelines, standards, and methodologies include project management body of
knowledge (PMBOK), PRINCE2, International Standards Organization 21500:2012
standard (Drob & Zichil, 2013; Ika & Hodgson, 2014). Other variants include the Guide
for Project and Program Management for Enterprise Innovation (P2M) and agile
methodologies such as SCRUM and rapid application development. According to Md
Nasir et al. (2015), PMBOK is the most prominent and widely used project management
framework for non-IT and IT projects.
Project Management Body of Knowledge
The PMI publishes the PMBOK that defines project management processes
(Nahod & Radujković, 2013). The PMBOK contains globally recognized guidelines and
best practices for managing projects across diverse industries with a view to achieving a
more successful outcome (Nasir et al., 2015; PMI, 2013; Varajao et al., 2016). In the fifth
edition of PMBOK, the PMI grouped the core project management activities and tasks for
managing projects into five project management process groups. These process groups
interact with one another and are independent of the application areas or industry focus
(PMI, 2013). The PMI presented the process groups in the order of which project
activities happen, and they include initiating process group, planning process group,
executing process group, monitoring and controlling process group, and closing process
group (PMI, 2013; Varajao et al., 2016).
25
The PMI recognizes 47 project management processes that underlie the five
process groups, with the outcome of one process becoming the input of at least one other
process (Pinheiro, 2010; PMI, 2013). The 47 processes form the basis of the 10 separate
knowledge areas that integrate the five process groups. The knowledge areas include
project integration management, project scope management, project time management,
project quality management, project human resource management, project
communications management, project risk management, project procurement
management, and project stakeholder management (PMI, 2013). Each knowledge area
represents a focused area of specialization with related set of concepts, terms, and
activities (PMI, 2013). Implementation of the project management processes and best
practices result in better productivity and improved project performance indicators as
well as project success (Nasir et al., 2015; Varajao et al., 2016).
Project Management Body of Knowledge and Project Success
Project managers who use PMBOK as a reference for executing projects need to
be competent and knowledgeable in the project management knowledge areas to
complete projects that meet customer expectations and stakeholders’ requirements (Chou,
Irwan, & Pham, 2013; Gomes, 2013). The application of PMBOK as a project
management framework has a positive effect on critical success factors for software
projects (Nasir et al., 2015), and understanding PMBOK’s concept is one of the success
factors in enterprise resource planning project implementation (Gomes, 2013). Higher
project success index values have been observed when project managers apply PMBOK
techniques, tools, and skills, while those who have not used PMBOK recorded lower
26
project success index values (Chou et al., 2013). There is also a relationship among
project managers’ age and experience, project management methodology,
implementation of project management risk processes, and project success, as
experienced project managers are more aware of the importance of project management
risk processes (Varajao et al., 2016). Overall, there is a relationship between project
managers’ effective application of the tools, techniques, and skills contained in the
PMBOK and successful implementation and delivery of projects (Chou et al., 2013; Nasir
et al., 2015; Varajao et al., 2016).
Project Success Indicators
Many authors use the Iron Triangle to represent the connection between the three
traditional indicators, also known as triple constraints, of project success: cost, schedule,
and quality (Bronte-Stewart, 2015). However, authors like Serrador and Turner (2015)
have noted that the triple constraints may not be adequate to measure project success
because project measurements may not meet customer/stakeholder satisfaction while
fulfilling the triple constraint requirements. To expand the view of project management,
Berssaneti and Carvalho (2015) and Thi and Swierczek (2010) added that the quality
indicator encompasses the technical specifications and customer satisfaction. Scope and
quality have been used interchangeably in many studies as part of the triple constraint
(Pollack, Helm, & Adler, 2018).
Self-Efficacy
Bandura introduced self-efficacy as part of the social cognitive theory to account
for someone’s belief in his or her capabilities to perform the actions required to manage
27
potential situations (Bolaños-Medina, 2014). Self-efficacy plays an important role in the
self-regulation of motivation, goal-setting, anticipation of likely outcomes of tasks, and
coping in the face of difficulty (Bandura, 1994; Bolaños-Medina, 2014; Kamohi &
Autram, 2014). The stronger the perceived self-efficacy of individuals, the higher the
motivation and commitment toward a task as well as the goals they set for themselves
(Bandura, 1994; Bolaños-Medina, 2014; Kamohi & Autram, 2014). People with a high
sense of self-efficacy activate motivation and necessary cognitive resources with the
courses of actions they need to achieve target tasks (Kamohi, 2014). Self-efficacious
people tend to have a higher tendency to embrace the right strategies to achieve target
tasks as well as a higher recovery rate from setbacks (Bolaños-Medina, 2014). Therefore,
there is a link among self-efficacy and individuals’ motivation and performance in a wide
range of tasks (Bandura, 1994; Bolaños-Medina, 2014; Kamohi & Autram, 2014).
Sources and Development of Self-Efficacy
There are four ways to create and strengthen people’s capabilities to produce
certain levels of performance to thrive in an environment or on a task: mastery
experiences, vicarious experiences, social persuasion, and physiological and emotional
states (Bandura, 1994; Bolaños-Medina, 2014; Inison et al., 2013; Kamohi & Autram,
2014). For mastery experiences, researchers on self-efficacy have found that experiences
of repeated successes enhance self-efficacy and failure experiences undermine it. Mastery
experiences are associated with actual successes that reinforce a sense of capacity to be
successful and are the most powerful contributors to self-efficacy (Bolaños-Medina,
2014; Inison et al., 2013). In contrast, failure experiences create self-doubt and affect
28
performance (Wood & Bandura, 1989). Additionally, people can develop a strong sense
of self-efficacy through the persuasive influence of social role models, or vicarious
experiences (Bandura, 1994; Bolaños-Medina, 2014). The more people assume they are
similar to their social models, the more the persuasive influence of the successes and
failures of the social models on their capacity to succeed in comparable activities.
Further, people work to succeed and in turn develop a strong sense of self-efficacy
through verbal encouragement from others, which is known as social persuasion
(Bandura, 1994; Bolaños-Medina, 2014; Kamohi & Autram, 2014). A boost in self-
efficacy through credible verbal encouragement tends to encourage extra efforts from
people as well as the development of the right skills to succeed (Bandura, 1994; Bolaños-
Medina, 2014; Kamohi & Autram, 2014).
In addition to people’s experiences, physiological and emotional states can affect
self-efficacy. The inherent physiological and emotional states of people influence how
they judge their capacity to succeed in given activities (Bandura, 1994; Bolaños-Medina,
2014). People perceive and interpret their stress reactions and tensions as signs of
incapacity to perform and succeed in given activities (Bandura, 1994; Bolaños-Medina,
2014). Mood also affects how people interpret and judge their self-efficacy in that
positive mood tends to enhance self-efficacy, whereas negative mood has a contrasting
effect on self-efficacy (Bandura, 1994). Hence, developing the skills and ability to reduce
the stress reactions as well as alter the emotional states and misinterpretations can help
enhance self-efficacy (Bandura, 1994).
29
The four sources of self-efficacy provide information that is processed through
the self-appraisal process to produce results that influence the judgment of perceived self-
efficacy (Bandura, 1989). Acting on the results of the self-appraisal process can lead to
successes or failures, and these experiences are recycled back into the self-appraisal
operative competencies (Bandura, 1989). Overall, there is a link between the acquisition
of self-efficacy belief, through these different sources, and individual success in related
tasks or activities (Bandura, 1994; Blomquist et al., 2016; Bolaños-Medina, 2014; Inison
et al., 2013; Kamohi & Autram, 2014). There is also a link among project managers’ self-
efficacy, competency, individual success, and overall project success (Blomquist et al.,
2016; Kamohi & Autram, 2014).
Mechanism of Self-Efficacy
There are four psychological processes that self-efficacy activates to regulate
human behavior and functioning on a task: cognitive, motivational, affective, and
selective processes (Bandura, 1994; Bolaños-Medina, 2014). These processes influence
how people feel, think, behave, and motivate themselves in an environment or in
executing a particular task, and thus individual performance (Bandura, 1994; Bolaños-
Medina, 2014). Cognitive processing relates to the self-appraisal of capability and how it
influences individual goal-setting. People with a high sense of perceived self-efficacy
tend to set higher goals and possess effective cognitive abilities to anticipate, construct,
and visualize successful scenarios, thus firming up their commitment towards the tasks at
hand (Bandura, 1994; Bolaños-Medina, 2014). Motivational processing relates to how
personal self-belief in a given task influences motivation by enhancing the capacity to
30
forethought and anticipate the likely outcome of the task (Bandura, 1994; Bolaños-
Medina, 2014). Affective processing relates to how self-efficacy influences people’s
thought patterns about the environment or task-based challenges (Bandura, 1994;
Bolaños-Medina, 2014). People with a low sense of self-efficacy develop disturbing
thought patterns about their inability to cope in an environment or with a task and exhibit
avoidance behavior, whereas those with a higher sense of self-efficacy exercise control
over the challenging thoughts (Bandura, 1994; Bolaños-Medina, 2014). In addition to
cognitive, motivational, and affective processing, selective processing relates to how
people’s self-efficacy beliefs influence the environment and tasks they embrace
(Bandura, 1994; Bolaños-Medina, 2014). People tend to avoid environments and tasks
they judge exceed their coping abilities, while they embrace environments and tasks they
are capable of handling successfully (Bandura, 1994; Bolaños-Medina, 2014).
Self-Efficacy and Performance Enhancement
The interaction of the four psychological processes helps people develop either a
positive or negative evaluative reaction towards a task as well as influence how they
perceive and interpret their level of performance, capacity to handle the task and possible
outcome (Bandura, 1994). The self-efficacy mechanism is central to the development of
personal agency because of its strong effect on human thought, affect, motivation, and
action (Bandura, 1991). The belief in own efficacy to produce the desired actions
necessary to achieve certain outcomes is a major driver of personal agency (Bandura,
2006). Personal agency refers to the internal locus of control that allows people to
attribute their behaviors and outcomes to their efforts, and it helps boost confidence, high
31
self-esteem, independence, and performance (Hamilton, Matthews, & Crawford, 2015).
Further, a person’s positive judgment of own performance enhances self-efficacy because
it sets the occasion for self-reactive influences (Bandura, 1991). People are likely to
trigger actions to address any discrepancy that may arise between their actual
performance and the internal standard or goals they set for themselves (Bandura, 1991).
Project Management Experience
People learn and acquire the skills and competency they need to handle the tasks
assigned to them through experience on the job, formal education, and training, amongst
others (Benoy & Gracias, 2015; Ofori, 2014). Hands-on experience is the best way to
learn; and the selection of project managers to meet organizational needs often rely on
candidate’s past performance and experience in a similar role (Benoy & Gracias, 2015;
Ofori, 2014). Overall, project managers need a certain level of skills and competencies to
thrive and be successful.
Project Management Skills, Competence, and Experience
Many organizations rely on project managers with project management skills and
competencies up to a prescribed standard to enhance the success of organizational
projects (Ofori, 2014). Project management skills and competencies standard framework
is set by professional project management accreditation organizations such as PMI,
International Project Management Association, Australian Institute of Project
Management, and Association of Project Management (Ofori, 2014). The PMI project
manager competency development framework is one of the blueprints for the acquisition
of functional project management knowledge and expertise that many project managers
32
rely on in modern competitive and dynamic project management environment. Project
managers acquire the necessary skills and competencies to handle the challenges of the
project environment through a combination of knowledge enriching mediums like formal
training, experience, and hands-on opportunity in a project management role (Ofori,
2014). For example, student participants of a business simulation game designed to
provide real work practice in a multidisciplinary project team experienced an increase in
project management knowledge (Geithner & Menzel, 2016). The experience helped the
students acquire and improve both technical project management knowledge and soft
skills (Geithner & Menzel, 2016). Overall, hands-on experience in project management
improves the competencies and skills of project managers.
The 10 knowledge areas and five process groups of project management form the
basis of project manager competency development framework, which enriches three main
competency areas of project management that include knowledge, performance, and
personal (Briere et al., 2015; Geithner & Menzel, 2016; Ofori, 2014). Project
management knowledge is the personal contributions of project managers towards project
related activities through their knowledge and understanding (Briere et al., 2015;
Geithner & Menzel, 2016; Ofori, 2014). Project management performance is the ability
of project managers to successfully perform project related activities, whereas personal
competency relates to soft skills such as project managers’ behavior, attitude, and core
personality traits when performing project-related activities (Briere et al., 2015; Geithner
& Menzel, 2016; Ofori, 2014). Overall, the project manager competency development
33
framework is a valuable tool for evaluating the knowledge, competence, and experience
of project managers.
Relevance of Experience in a Project Management Environment
Geithner and Menzel (2016) reported an increase in project management
knowledge amongst student participants of a business simulation game designed to
provide real work practice in a multidisciplinary project team. The authors found that
practical experiences acquired through the business simulation game positively affect
students’ project management knowledge, competence, and skills. Although the authors
focused on the academic environment, they underscored the importance of practical
project management experiences in promoting skill acquisition and knowledge
development in a project environment. Huff and Prybutok (2008) linked prior project
management experience to project managers’ knowledge base, which in turn influences
project performance. In contrast, Rubin and Seeling (1967) found that the effect of
project management experiences on project performance is minimal. Thi and Swierczek
(2010) identified project managers’ competence as having the strongest relationship to
project performance. Huff and Prybutok (2008) aligned with Thi and Swierczek (2010) in
that they reported that project management experience progressively increases the project
manager’s competence by increasing their knowledge. Overall, there is a relationship
among practical project management experience, project managers’ knowledge,
competence, and performance (Geithner & Menzel, 2016; Huff & Prybutok, 2008; Thi &
Swierczek, 2010).
34
Further, many studies have also found similarities in how project managers’
competencies and knowledge affect project success (Carlton, 2017; Ekrot, Kock, &
Gemünden, 2016; Nahod & Radujković, 2013). Nahod and Radujković (2013) reported
that technical project management competencies are critical to achieving project
objectives. Ekrot et al. (2016) reported a positive relationship between average project
success and project management competence retention through retention initiatives such
as lessons learned systems. Carlton (2017) found that IT project leaders with technical IT
competencies and knowledge are better equipped to manage complex IT projects
compared to technically incompetent project managers. The author noted that technically
incompetent project managers adversely affect project outcomes. These findings suggest
that project managers with high technical competence are more likely to achieve
successful project outcomes. Overall, there is a relationship among practical project
management experience, project managers’ competence, and project success (Carlton,
2017; Ekrot et al., 2016; Geithner & Menzel, 2016; Huff & Prybutok, 2008; Nahod &
Radujković, 2013; Thi & Swierczek, 2010).
Relevance of Experience on Self-Efficacy in a Project Management Environment
Martins et al. (2015) highlighted that “mastery experience is the most powerful
source of information for people to develop a strong sense of their level of self-efficacy”
(p. 264). The authors asserted that experience reinforces competence self-perception.
Negative failure experiences result in low self-efficacy and affect performance, whereas
positive successful experiences enhance self-efficacy and improve performance (Kamohi
& Autram, 2014; Martins et al., 2015; Wood & Bandura; 1989). People involved in
35
project-based roles require high levels of self-efficacy to deal effectively with project
uncertainties, and the challenging and complex work experiences (Lloyd-Walker, French,
& Crawford, 2016). Kamohi and Autram (2014) found a positive influence of project
managers’ self-efficacy improvement on effectiveness in five specific personal critical
competencies: adaptability, ability to handle ambiguity, persistence, perseverance,
emotional intelligence, and resilience.
Additionally, Blomquist et al. (2016) found that project management self-efficacy
of project managers is a predictor of performance. Project managers’ self-efficacy
positively influences six project performance indicators that include budgeting allowance,
meeting deadlines, delivering specifications, contributing to the organizational strategy,
meeting stakeholder expectations, and delivering business benefits (Blomquist et al.,
2016). Research has suggested that past success and failure experiences of project
managers affect their self-efficacy and that high levels of self-efficacy have a positive
relationship with project performance as well as the ability to handle uncertainties and
challenging work experiences (Blomquist et al., 2016; Kamohi & Autram, 2014).
Research has also suggested that exposing project managers to successful project
management experiences through association with experienced project managers or
mentorship opportunities enhance the chances of successful completion of future project
tasks and deliverables (Blomquist et al., 2016; Kamohi & Autram, 2014).
Summary
The literature review revealed the relevance of positive experiences on people’s
competence, self-efficacy, and successful handling of tasks. Concerning project
36
management, the literature review revealed three emergent themes about the relationships
among project management experience of project managers, self-efficacy, and project
performance and success. One of the themes indicates that project management
experiences enhance project managers’ knowledge, competency levels, and project
performance. The second theme indicates that successful project management
experiences will likely enhance the self-efficacy of project managers. The last theme
indicates that high levels of project managers’ self-efficacy enhance project performance.
The three themes encapsulate the objectives of this study and collectively suggest
that project managers with overwhelming successful project management experiences
stand a better chance of becoming successful. However, there is a lack of empirical
studies that examine how success and failure experiences of project managers relate to
self-efficacy and project performance. No empirical evidence supports the first two
themes that suggested that project management experiences enhance the project
managers’ knowledge, competency levels, performance, and self-efficacy. In this study, I
addressed such gaps in the literature by examining the effect of successful experiences of
project managers on their self-efficacy and project success.
The findings of Blomquist et al. (2016) provided empirical evidence to support
the last theme. However, because the study involved projects from different industries,
the levels, and nuances of project challenges and risks could differ, thus affecting project
performance. Hence, there is a need for examining the consistency of the findings of
Blomquist et al. in IT project domain. Chapter 3 contains details of the methodology used
to gather and analyze the research data.
37
Chapter 3: Research Method
Introduction
The purpose of this quantitative study was to improve the current understanding
of the relationships among project management experience, project managers’ self-
efficacy, and project success. Because the literature review showed insufficient empirical
research to support the relationships, in this study, I describe and analyze these
relationships to increase the understanding of how project management experience affects
self-efficacy and project success. The results of this study foster an understanding of how
the self-efficacy of project managers affects the ability to deliver project tasks and
deliverables within time, cost, and scope constraints. In this chapter, I include sections on
research design, rationale for selecting the research design, methodology, threats to
validity, and ethical procedure. The Methodology section contains details about the
population, sampling and sampling procedures, participants’ recruitment, data collection,
processing, and analysis, and instrumentation.
Research Design and Rationale
The main research questions in this study were focused on how project managers’
experiences of project success affect their self-efficacy and project success as well as
how self-efficacy affects the success of IT projects. The research questions were as
follows:
Research Question 1: What is the relationship between project managers’
exposure to successful experiences and project managers’ self-efficacy?
38
Research Question 2: What is the relationship between project managers’ self-
efficacy and project success?
Research Question 3: What is the relationship between project managers’
exposure to successful experiences and project success?
Research Question 4: Does project managers’ exposure to successful experiences
mediate the relationship between self-efficacy and project success?
The nature of the research questions necessitated a quantitative descriptive
correlational study, a nonexperimental research design, to answer them. Correlational
research is useful when the goal is to examine the relationships between two or more
random variables within the same population or between the same variables in two
different populations (Curtis, Comiskey, & Dempsey, 2016). This study involved the
measurement of three study variables using validated survey instruments and examining
the relationships among these variables. The literature revealed that positive experiences
of success lead to high self-efficacy, whereas negative experiences of failure lead to low
self-efficacy, and high self-efficacy is associated with success, whereas low self-efficacy
often leads to failure. The interdependencies between these research variables suggest
that the more the exposure of project managers to successful project management
experiences, the higher their self-efficacy and the chances of project success. There is no
research to support these relationships, indicating a gap in the literature.
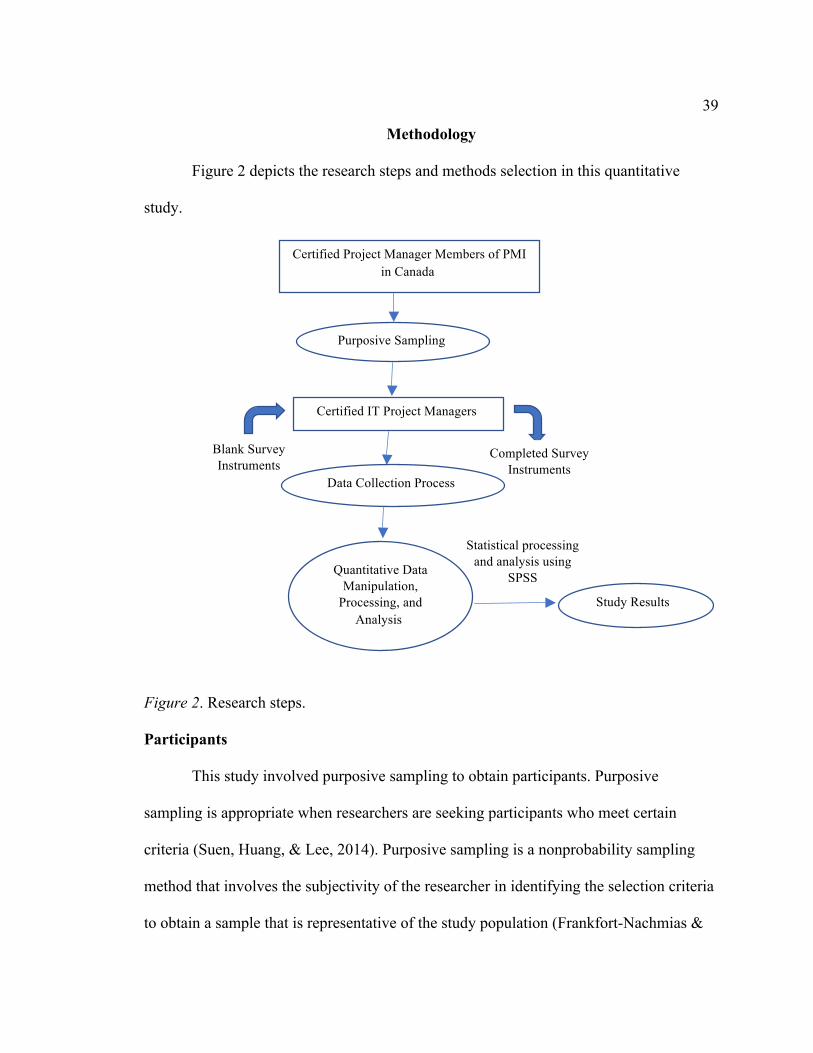
39
Methodology
Figure 2 depicts the research steps and methods selection in this quantitative
study.
Figure 2. Research steps.
Participants
This study involved purposive sampling to obtain participants. Purposive
sampling is appropriate when researchers are seeking participants who meet certain
criteria (Suen, Huang, & Lee, 2014). Purposive sampling is a nonprobability sampling
method that involves the subjectivity of the researcher in identifying the selection criteria
to obtain a sample that is representative of the study population (Frankfort-Nachmias &
Certified Project Manager Members of PMI in Canada
Purposive Sampling
Certified IT Project Managers
Blank Survey Instruments
Completed Survey Instruments
Data Collection Process
Statistical processing and analysis using
SPSS Quantitative Data Manipulation,
Processing, and Analysis
Study Results
40
Nachmias, 1996). The drawbacks of using nonrandom sampling strategies like purposive
sampling include nonrepresentativeness of the research sample and external validity
issues from possible selection bias (Frankfort-Nachmias, Nachmias, & DeWaard, 2015).
To alleviate the effect of the lack of random sampling, Suen et al. (2014) suggested
increasing the statistical power of the study by increasing the sample size.
This study involved a population of Canadian-based PMI certified project
management professionals with current or past experiences in IT projects. I intended to
survey certified project management professional members of a Canadian PMI chapter
and obtained the approval of the chapter to carry out the survey. The decision was made
to broaden the target population to include PMI certified project management
professionals in Canada due to low participation of members of the PMI chapter. In the
absence of any official information on the population of these project managers, I relied
on the information available on the websites of all the PMI chapters in Canada that
showed that there were over 24,935 members. About 8,000 members were identified as
holders of project management professional certification.
It is important to use power analysis to determine the sample size, which takes
into account the probability of Type I or Type II error occurring during hypotheses
testing. The probability of a Type I error is denoted as alpha or α, and the probability of
Type II error is denoted as beta or β (Bagiella et al., 2019; Tellez et al., 2015). Type I
error occurs when the null hypothesis is rejected when it is true, and Type II errors occur
when the null hypothesis is not rejected when it is false results (Bagiella et al., 2019;
Hae-Young, 2015; Tellez et al., 2015). Power analysis uses the alpha level, effect size,
41
and statistical power in calculating the sample size of a study (Bagiella et al., 2019;
Tellez et al., 2015). By convention, the alpha level of .05 minimizes the probability of
Type I error occurring, and it represents a 5% chance of making a wrong conclusion
(Hae-Young, 2015; Tellez et al., 2015). The power level of .80 is acceptable, and it
indicates an 80% chance of arriving at the correct conclusion (Tellez et al., 2015). A
conventional way of interpreting effect size is to classify the correlation coefficient value
of 0.2 as a small effect, 0.3 as a medium effect, and 0.5 as a large effect (Cohen, 1969;
Tellez et al., 2015). Effect size is often estimated from past studies that probe similar
constructs, and it represents the strength of the relationship between the variables under
investigation (Blomquist et al., 2016; Tellez et al., 2015).
Past studies on the relationship between self-efficacy and performance have
indicated that effect sizes that ranged between 0.23 to 0.38 make self-efficacy a good
predictor of performance (Blonquist et al., 2016). For example, consistent with past
studies, Blomquist et al. (2016) reported an effect size of 0.32 in their study.
Additionally, Geithner and Menzel (2016) reported correlation coefficients of .478 to
.812 in their study on the relationship between learning through experience and project
management students’ skills and performance levels, whereas Achterkamp et al. (2015),
Bandura (1989, 1994), Martins et al. (2015), and Wood and Bandura (1989) reported a
high correlation between successful experiences and performances.
For this study, I used an alpha level of .05, effect size of .3, and statistical power
of .80. G*Power offers accurate and advanced sample size calculation and can provide
the estimate of sample size based on the alpha level, effect size, power, and other
42
parameters depending on the statistical test (see Meysamie et al., 2014). I conducted a
priori power analysis using G*Power software version 3.1.9.2 with an effect size of .3,
alpha error probability of 05, and power of .80, and the software returned a sample size of
82 for correlation analysis, and 68 for multiple linear regression involving medium effect
size and two predictors. Should the ideal sample size be inaccessible, a contingency plan
was to use a reduced power of .70 and 90% confidence level resulting in a sample size of
49 for correlation analysis, and 43 for multiple linear regression.
Based on the G*Power calculator, the target sample size for this study was 82.
The criteria that each study participant must meet to be representative of the study
population are relatively simple. The criteria include the following:
1. Worked/Working on IT projects as a project manager in Canada.
2. Possess project management professional certification from the PMI.
There seem to be no other characteristics of the study population that would make some
individuals more representative of the population than others. The study population
consists of certified project management professional members of the PMI, Canada. The
participants include a targeted sample of project managers that possess the PMI
certification and have worked on many IT projects in Canada or currently working on IT
projects in Canada.
Materials and Instruments
Data collection was through an online survey published on the SurveyMonkey
website. This method of data collection involved the distribution of the survey link to
certified members of the PMI. The survey has four parts, namely, bio-data section, PSS,
43
project management self-efficacy scale (PMSE), and project management experience
scale (PMES). Participants were asked to record their details in the bio-data section and
score four items on the PSS. These items include: (a) “What percentage of the projects
you manage to meet budget allowance”; (b) “What percentage of the projects you
manage meet deadlines”; (c) “What percentage of the projects you manage meet technical
specifications”; and d) “What percentage of the projects you manage meet the
expectations of the customer.” The participants scored these items using a 5-point Likert-
type scale as follows: (1) “less than 20%”, “21–40%”, “41–60%”, “61–80%”, and “80-
100%”. Adopting the task-specific self-efficacy scale used in Blomquist et al. (2016), the
PMSE has 22 items covering five competency areas that represent distinct tasks from
these competency areas. Participants were asked to score their level of confidence in
completing each task using a 5-point Likert-type scale ranging from “Cannot do the task
(0% confident)” to “Totally confident to manage the task effectively (100%).” Adopting
the new one-dimensional 8-item general self-efficacy scale used in Ineson et al. (2013),
participants also scored the indicators of self-efficacy on a 5-point Likert-type scale that
ranges from (1) strongly disagree to (5) strongly agree. Participants used the PMES to
record their years of experience and the aggregate percentage of successful experiences
on relevant projects using a 10-point Likert-type scale ranging from “10%” to “100%.” A
copy of the survey can be found in Appendix A.
Pilot Study
A pilot test typically begins data collection, and it is an important step in the
development of research instruments because it provides feedback on the validity and
44
reliability of the instrument (Cooper & Schindler, 2008). Researchers can skip the pilot
study phase due to time constraints and when the study involves instruments that have
been validated in a past study (Cooper & Schindler, 2008). The pilot study was skipped
in this study because the research involved three established and well-validated survey
instruments that have been used in past studies to obtain measures relating to the research
variables. The PMSE, NGSE, and PSS have been used in many studies (Blomquist et al.,
2016; Chen et al., 2001; Ineson et al., 2013; Serrador & Turner, 2015) to measure the
constructs of self-efficacy and project success (see Appendix L for permissions to use
research instruments).
Data Collection, Processing, and Analysis
This study involved IT projects only and one country, Canada. Data
administration and collection were achieved through an online survey tool,
SurveyMonkey. The survey link was sent directly to my LinkedIn contacts in Canada that
possessed PMI certification and Canadian experience in IT projects. I also published the
survey link on the Facebook page of a PMI chapter in Canada and invited certified
members to participate in the survey. Upon clicking the survey link, the project managers
were directed to read the informed consent that appeared on the screen before proceeding
with the survey. The consent form contained the responsibilities of the participants if they
volunteer to participate in the study. Project managers who decided to participate in the
study were requested to proceed with the survey by clicking the “Next Page” button,
while those who did not want to participate in the study were instructed to close the
survey window to exit the survey. In this study, I used quantitative data analysis to
45
analyze the research data in order to discern the relationships among the research
variables. I used IBM SPSS Statistical Software for data analysis as well as descriptive
analysis of the sample. The main sources of data for this study were the research
participants, and the secondary data sources include project management reports,
documents, and information system. The estimation of the relationships between the
research variables was achieved through correlation and regression analysis. The
evaluation of the mediating effect of project managers’ exposure to successful
experiences on the relationship between project manager’s self-efficacy and project
success was through linear multiple regression.
Methodological Assumptions, Limitations, and Delimitations
Some critical assumptions govern the use of linear regression analysis to ensure
the validity of the outcome of the statistical analyses (Anja & Casper, 2017). The
assumptions include linearity, normality of residuals, independence of errors, absence of
multicollinearity between the predictor variables, and homoscedasticity, and Chapter 4
includes the evaluation of these statistical assumptions. To ensure the empirical validity
of a measuring scale, researchers evaluate the correlation between scores obtained from
the scale and outcomes from a criterion measure (Baugher, Weisbord, & Ramos, 2014).
However, the absence of participants’ project success and self-efficacy ratings made it
impossible to examine the empirical validity of the scales, thus posing a methodological
limitation to this study. The analysis of the work of Anja and Casper (2017) showed that
developers of IBM SPSS statistical software offer simple ways to verify multivariate
46
normality, linearity, homoscedasticity, and some of the other assumptions through SPSS
statistics and graphical interpretation of SPSS plots and graphs.
Threats to Validity
The validity and reliability of measurements were paramount in this study. In
quantitative research, it is important to address concerns about the validity of
measurements such as content, construct, and empirical validity. Having subject-matter
expertise to assess the effectiveness of the test items on the measurement instruments
enhanced content validity. I used the convergent validity technique to assess the construct
validity of the task-specific PMSE scale and the 8-item general self-efficacy scale.
Construct validity is high when the different measures of the same construct yields
related results (Bolaños-Medina, 2014).
Serrador and Turner (2015) used the PSS as a subscale of the main survey
instrument to measure project success based on performance against the triple
constraints: cost, time, and scope. The authors reported a relationship between the
respondents’ project success ratings and the scores recorded for the triple constraints,
denoted as project efficiency scores; hence an indication of satisfactory construct and
empirical validity. Despite methodological limitation that hindered the examination of the
empirical validity of the measuring scales, I was confident to adopt the PMSE because it
exhibited satisfactory convergent and discriminant validity by producing similar results in
different contexts (Blomquist et al., 2016). Furthermore, there was enough justification
for adopting the PSS because the triple constraint is traditionally a measure of project
success in many studies.
47
Reliability relates to the extent to which the study measurements are repeatable
under identical conditions (Drost, 2011). The use of scales can enhance the reliability of
measurements because an aggregate score from several variables is a more reliable
indicator of an attribute (Gliem & Gliem, 2003). Because the NGSE, PMSE, and PSS are
multi-item scales, summing up the individual item scores can average out measurements
errors, thus enhancing the reliability of measurements (Gliem & Gliem, 2003). Also,
these scales are less complex and easy to read and complete, reducing the chances of
random measurement errors. To further reduce measurement errors, some of the scales
have provision for alternative responses where necessary.
Blomquist et al. (2016) highlighted that the PMSE exhibited satisfactory
reliability measurements with the loading factors of the 27 project management self-
efficacy indicators above the required 0.70. Despite these assurances, I used the parallel-
forms reliability strategy using the NGSE scores and PMSE scores to ensure the
reliability of the self-efficacy measurements. Because these two scales probe similar
constructs, I evaluated the consistency of measurements across the two scales. Serrador
and Turner (2015) found that the triple constraint is a reliable measure of project success.
The authors reported satisfactory reliability of the PSS with a Cronbach’s alpha of 0.769.
Ethical Assurances
I maintained the current standards for the ethical well-being of participants by
following the recommendations of the Walden University Institutional Review Board
(IRB) throughout the different phases of this study. I requested that the participants
complete the informed consent before commencing the survey. Consent is necessary to
48
protect participants’ rights and safety. The consent form contained information relating to
the purpose of the study, known risks, benefits of the study, and duration of the study. I
also used the consent form to inform the participants that participation is voluntary and
confidential. Further, I highlighted in the consent form the procedures of the study, my
contact information, and the contact information of the representative of Walden
University. The consent form also included the Walden University Institutional Review
Board (IRB) approval number 05-04-18-0281744. Furthermore, I used the consent form
to inform the participants that they may quit the research at any time. In line with the
approval requirements of the Walden University IRB, I will ensure the safekeeping of
research data and relevant resources for 5 years.
Summary
A detailed description of the research methodology for examining the
relationships among the research variables was presented in Chapter 3. Based on the gap
in the literature, I identified three main research variables, namely, project managers’
mastery experience, self-efficacy, and project success and hypothesized four relationships
in line with the social cognitive theory. Due to the theorized relationships, I used
correlation and regression analysis for the evaluation of the relationships among these
variables. I used linear multiple regression to evaluate the mediating effect of project
managers’ successful project management experiences on the relationship between
project managers’ self-efficacy and project success.
In this study, I used the purposive sampling method due to the peculiarity of the
population of interest and the need for the sample participants to meet certain selection
49
criteria, while relying on the researcher’s judgment. I used PMES to obtain details of the
project management experiences of project managers and adopted the PSS, PMSE, and
the 8-item NGSE from other studies that showed acceptable validity of measurements
from these scales. I used an online survey to collect data from participants through
SurveyMonkey online tool. This method offers a cheaper way of data collection. To
alleviate some of the disadvantages of an online survey, such as low response rate and
lack of control over who fills out the survey, the LinkedIn email was resent to my
LinkedIn contacts as a reminder. I present the descriptive statistics of the demographic
variables and the findings from the statistical analysis of the research data and test of
research hypotheses in Chapter 4.
50
Chapter 4: Results
Introduction
The purpose of this quantitative, descriptive correlational study was to evaluate
the relationships among project management experience, project managers’ self-efficacy,
and project success as determined by the survey responses from a sample of PMI certified
project managers in Canada. The project success aspect was measured using the PSS,
which measured adherence to four dimensions of project success that includes budget,
deadline, technical specifications, and customer expectations. The self-efficacy of the
project manager participants was measured using PMSE and the NGSE scales. The
PMSE scale produced 22 measures representing the efficacy beliefs of project managers
for fixed skills that fall within the five main competency areas of project management:
manage project team, manage stakeholder relationships, development of project plan,
manage project execution, and evaluation of project performance. The NGSE scale
produced eight measures representing the general self-efficacy beliefs of project
managers in a broad context.
I represented the scale scores for each respondent by a single composite score
obtained by calculating the unweighted average of related scale items. Project
management experience was limited to the experiences garnered from repeated cases of
success in a particular task, otherwise known as mastery experience. The mastery
experience aspect of this study was measured using the PMES to produce two measures:
years of experience as a project manager on IT projects and the aggregate percentage of
successful experiences of project managers. The relationships among the research
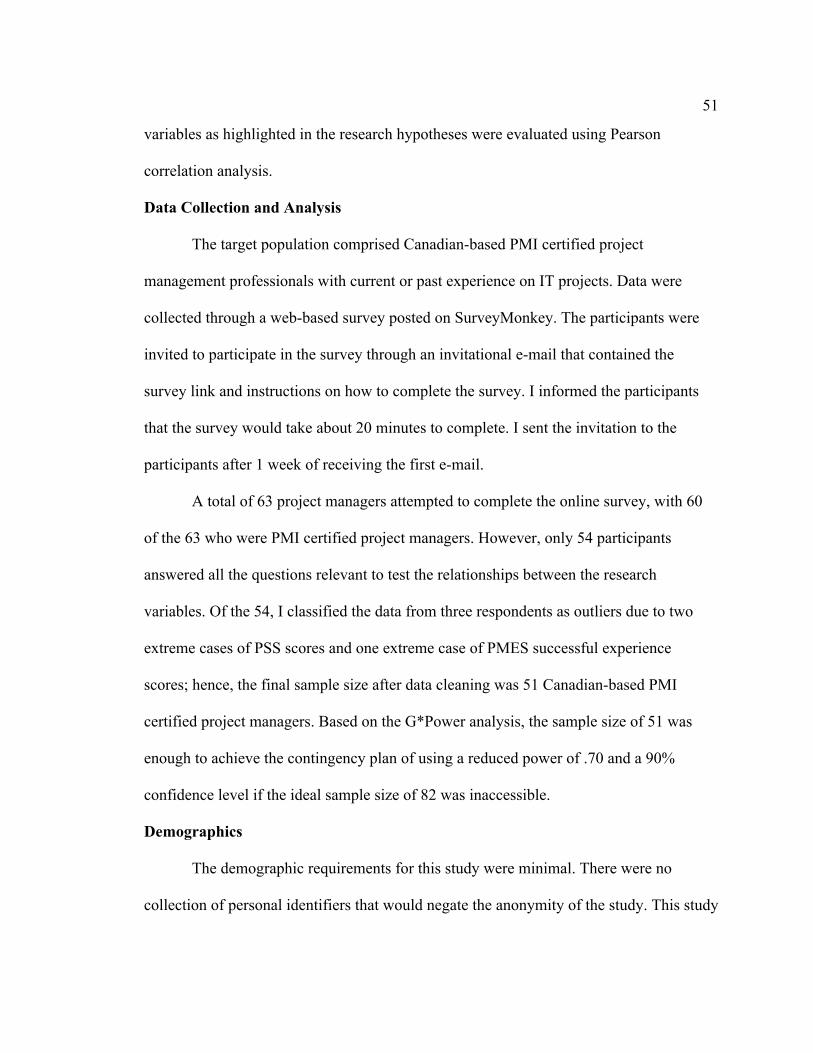
51
variables as highlighted in the research hypotheses were evaluated using Pearson
correlation analysis.
Data Collection and Analysis
The target population comprised Canadian-based PMI certified project
management professionals with current or past experience on IT projects. Data were
collected through a web-based survey posted on SurveyMonkey. The participants were
invited to participate in the survey through an invitational e-mail that contained the
survey link and instructions on how to complete the survey. I informed the participants
that the survey would take about 20 minutes to complete. I sent the invitation to the
participants after 1 week of receiving the first e-mail.
A total of 63 project managers attempted to complete the online survey, with 60
of the 63 who were PMI certified project managers. However, only 54 participants
answered all the questions relevant to test the relationships between the research
variables. Of the 54, I classified the data from three respondents as outliers due to two
extreme cases of PSS scores and one extreme case of PMES successful experience
scores; hence, the final sample size after data cleaning was 51 Canadian-based PMI
certified project managers. Based on the G*Power analysis, the sample size of 51 was
enough to achieve the contingency plan of using a reduced power of .70 and a 90%
confidence level if the ideal sample size of 82 was inaccessible.
Demographics
The demographic requirements for this study were minimal. There were no
collection of personal identifiers that would negate the anonymity of the study. This study
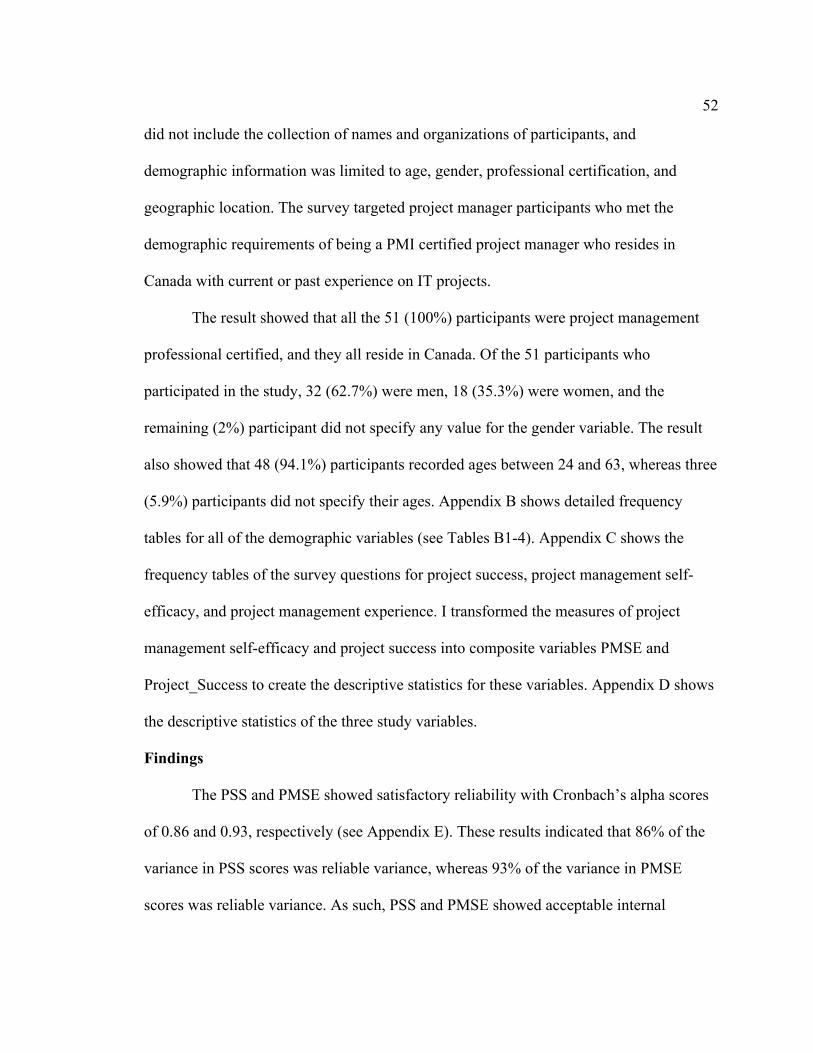
52
did not include the collection of names and organizations of participants, and
demographic information was limited to age, gender, professional certification, and
geographic location. The survey targeted project manager participants who met the
demographic requirements of being a PMI certified project manager who resides in
Canada with current or past experience on IT projects.
The result showed that all the 51 (100%) participants were project management
professional certified, and they all reside in Canada. Of the 51 participants who
participated in the study, 32 (62.7%) were men, 18 (35.3%) were women, and the
remaining (2%) participant did not specify any value for the gender variable. The result
also showed that 48 (94.1%) participants recorded ages between 24 and 63, whereas three
(5.9%) participants did not specify their ages. Appendix B shows detailed frequency
tables for all of the demographic variables (see Tables B1-4). Appendix C shows the
frequency tables of the survey questions for project success, project management self-
efficacy, and project management experience. I transformed the measures of project
management self-efficacy and project success into composite variables PMSE and
Project_Success to create the descriptive statistics for these variables. Appendix D shows
the descriptive statistics of the three study variables.
Findings
The PSS and PMSE showed satisfactory reliability with Cronbach’s alpha scores
of 0.86 and 0.93, respectively (see Appendix E). These results indicated that 86% of the
variance in PSS scores was reliable variance, whereas 93% of the variance in PMSE
scores was reliable variance. As such, PSS and PMSE showed acceptable internal
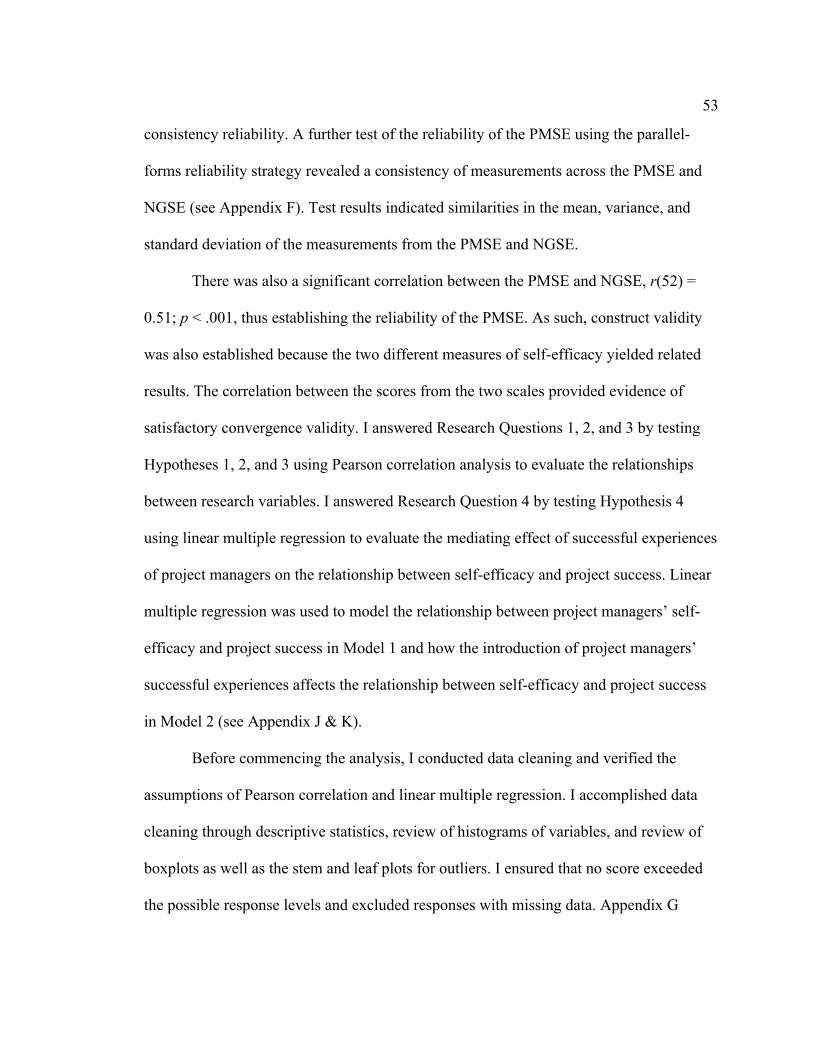
53
consistency reliability. A further test of the reliability of the PMSE using the parallel-
forms reliability strategy revealed a consistency of measurements across the PMSE and
NGSE (see Appendix F). Test results indicated similarities in the mean, variance, and
standard deviation of the measurements from the PMSE and NGSE.
There was also a significant correlation between the PMSE and NGSE, r(52) =
0.51; p < .001, thus establishing the reliability of the PMSE. As such, construct validity
was also established because the two different measures of self-efficacy yielded related
results. The correlation between the scores from the two scales provided evidence of
satisfactory convergence validity. I answered Research Questions 1, 2, and 3 by testing
Hypotheses 1, 2, and 3 using Pearson correlation analysis to evaluate the relationships
between research variables. I answered Research Question 4 by testing Hypothesis 4
using linear multiple regression to evaluate the mediating effect of successful experiences
of project managers on the relationship between self-efficacy and project success. Linear
multiple regression was used to model the relationship between project managers’ self-
efficacy and project success in Model 1 and how the introduction of project managers’
successful experiences affects the relationship between self-efficacy and project success
in Model 2 (see Appendix J & K).
Before commencing the analysis, I conducted data cleaning and verified the
assumptions of Pearson correlation and linear multiple regression. I accomplished data
cleaning through descriptive statistics, review of histograms of variables, and review of
boxplots as well as the stem and leaf plots for outliers. I ensured that no score exceeded
the possible response levels and excluded responses with missing data. Appendix G
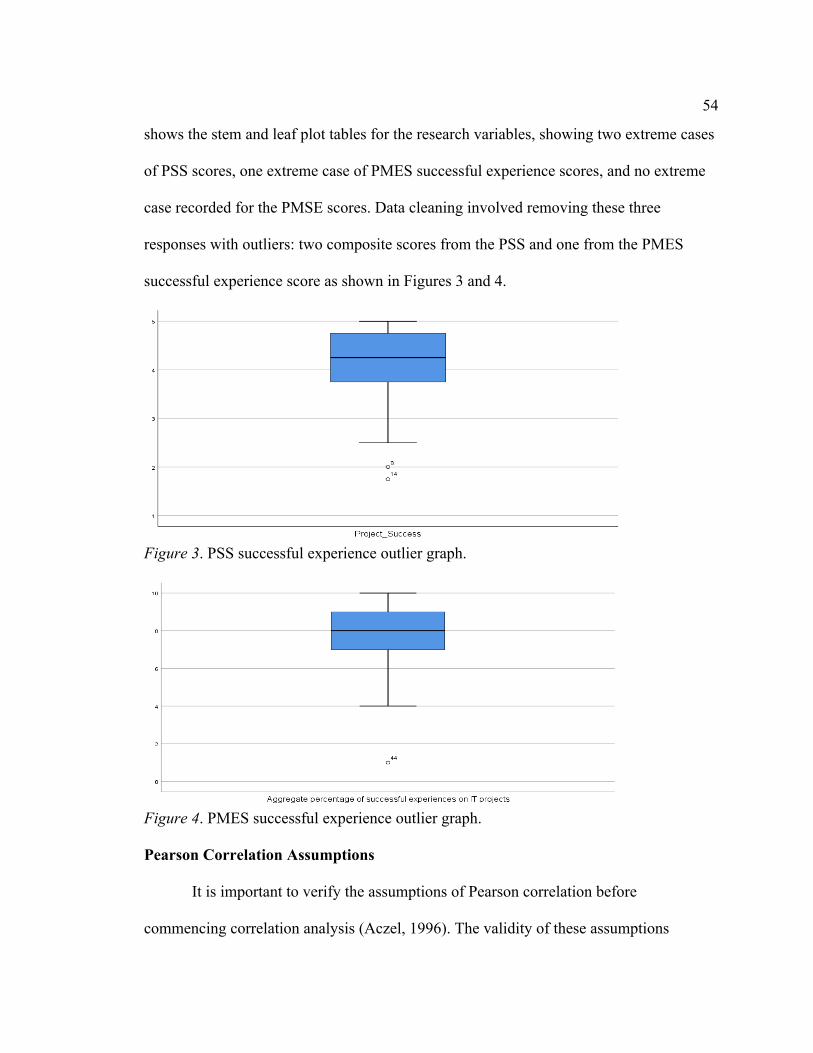
54
shows the stem and leaf plot tables for the research variables, showing two extreme cases
of PSS scores, one extreme case of PMES successful experience scores, and no extreme
case recorded for the PMSE scores. Data cleaning involved removing these three
responses with outliers: two composite scores from the PSS and one from the PMES
successful experience score as shown in Figures 3 and 4.
Figure 3. PSS successful experience outlier graph.
Figure 4. PMES successful experience outlier graph.
Pearson Correlation Assumptions
It is important to verify the assumptions of Pearson correlation before
commencing correlation analysis (Aczel, 1996). The validity of these assumptions
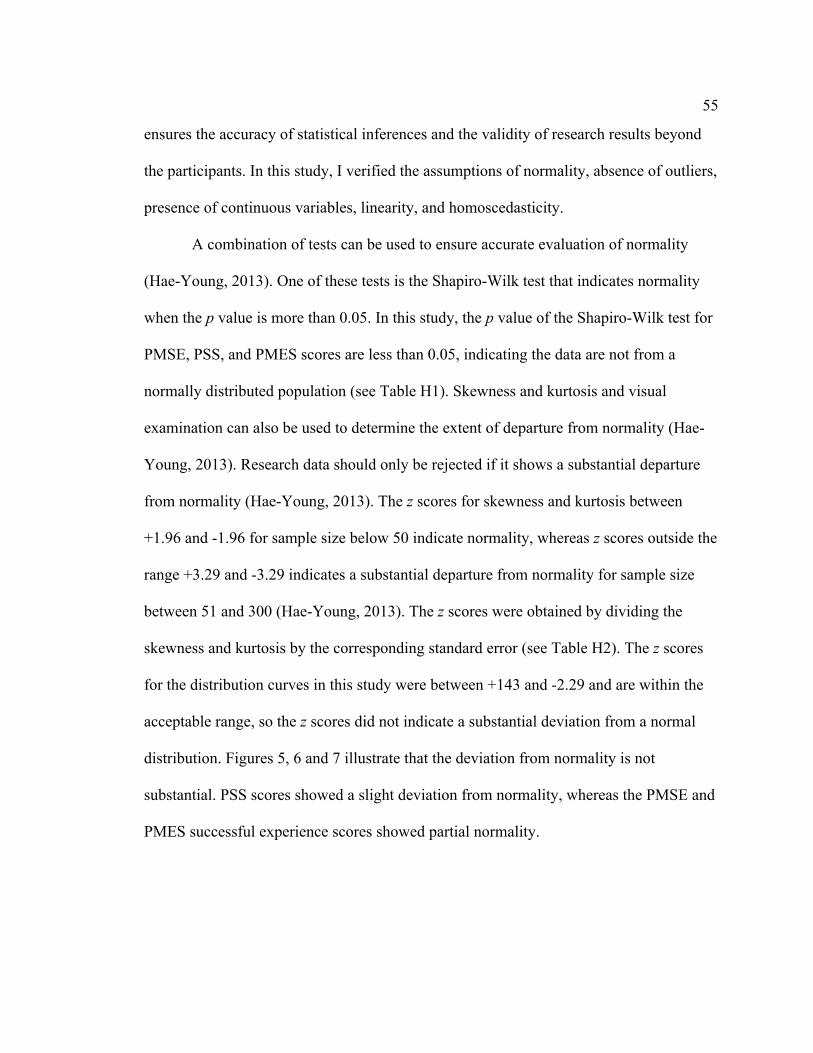
55
ensures the accuracy of statistical inferences and the validity of research results beyond
the participants. In this study, I verified the assumptions of normality, absence of outliers,
presence of continuous variables, linearity, and homoscedasticity.
A combination of tests can be used to ensure accurate evaluation of normality
(Hae-Young, 2013). One of these tests is the Shapiro-Wilk test that indicates normality
when the p value is more than 0.05. In this study, the p value of the Shapiro-Wilk test for
PMSE, PSS, and PMES scores are less than 0.05, indicating the data are not from a
normally distributed population (see Table H1). Skewness and kurtosis and visual
examination can also be used to determine the extent of departure from normality (Hae-
Young, 2013). Research data should only be rejected if it shows a substantial departure
from normality (Hae-Young, 2013). The z scores for skewness and kurtosis between
+1.96 and -1.96 for sample size below 50 indicate normality, whereas z scores outside the
range +3.29 and -3.29 indicates a substantial departure from normality for sample size
between 51 and 300 (Hae-Young, 2013). The z scores were obtained by dividing the
skewness and kurtosis by the corresponding standard error (see Table H2). The z scores
for the distribution curves in this study were between +143 and -2.29 and are within the
acceptable range, so the z scores did not indicate a substantial deviation from a normal
distribution. Figures 5, 6 and 7 illustrate that the deviation from normality is not
substantial. PSS scores showed a slight deviation from normality, whereas the PMSE and
PMES successful experience scores showed partial normality.
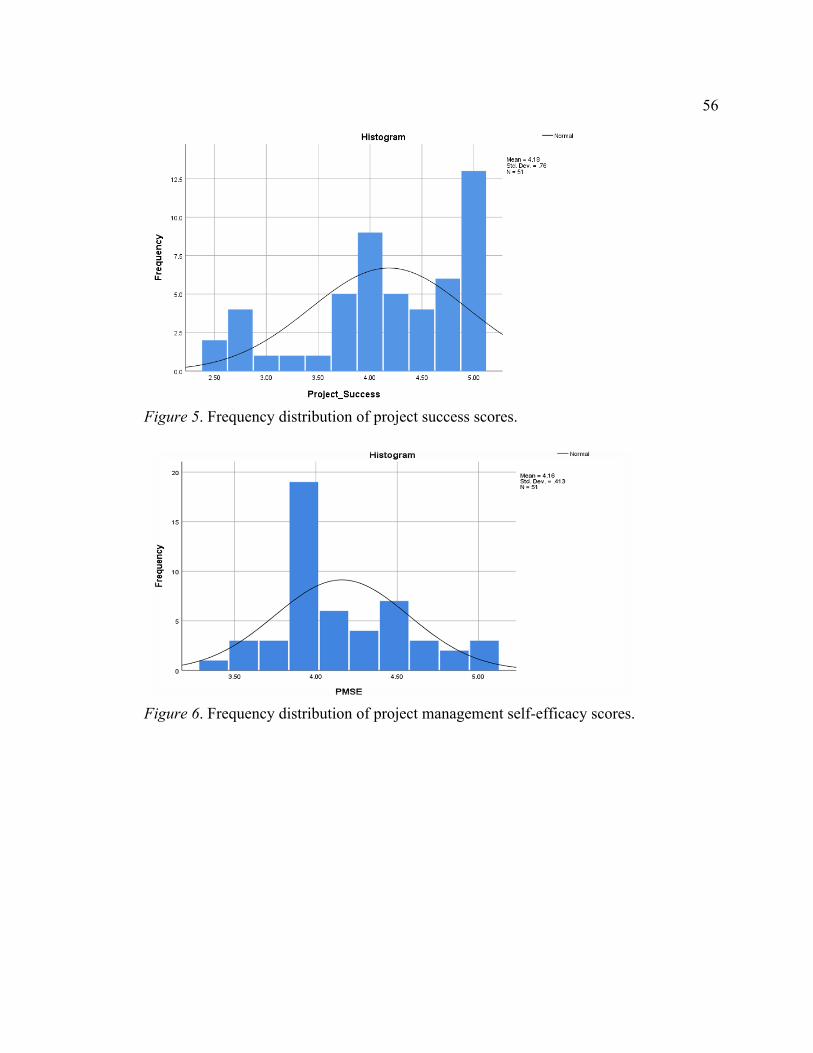
56
Figure 5. Frequency distribution of project success scores.
Figure 6. Frequency distribution of project management self-efficacy scores.
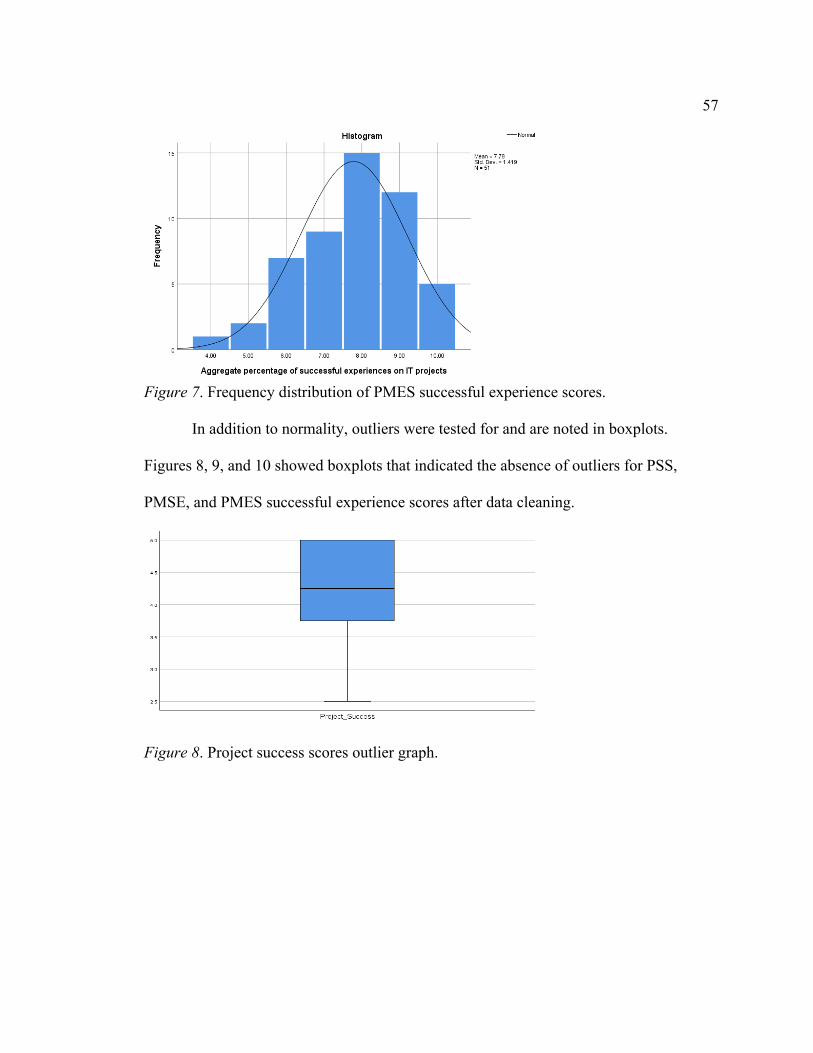
57
Figure 7. Frequency distribution of PMES successful experience scores.
In addition to normality, outliers were tested for and are noted in boxplots.
Figures 8, 9, and 10 showed boxplots that indicated the absence of outliers for PSS,
PMSE, and PMES successful experience scores after data cleaning.
Figure 8. Project success scores outlier graph.
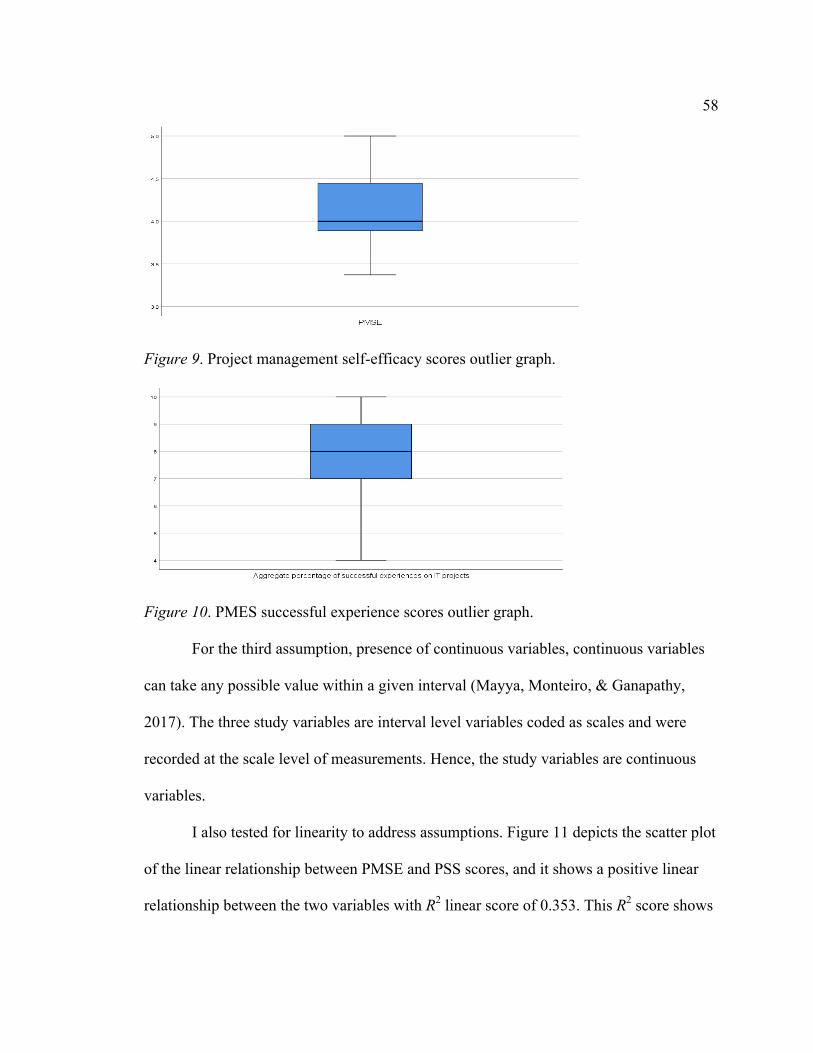
58
Figure 9. Project management self-efficacy scores outlier graph.
Figure 10. PMES successful experience scores outlier graph.
For the third assumption, presence of continuous variables, continuous variables
can take any possible value within a given interval (Mayya, Monteiro, & Ganapathy,
2017). The three study variables are interval level variables coded as scales and were
recorded at the scale level of measurements. Hence, the study variables are continuous
variables.
I also tested for linearity to address assumptions. Figure 11 depicts the scatter plot
of the linear relationship between PMSE and PSS scores, and it shows a positive linear
relationship between the two variables with R2 linear score of 0.353. This R2 score shows
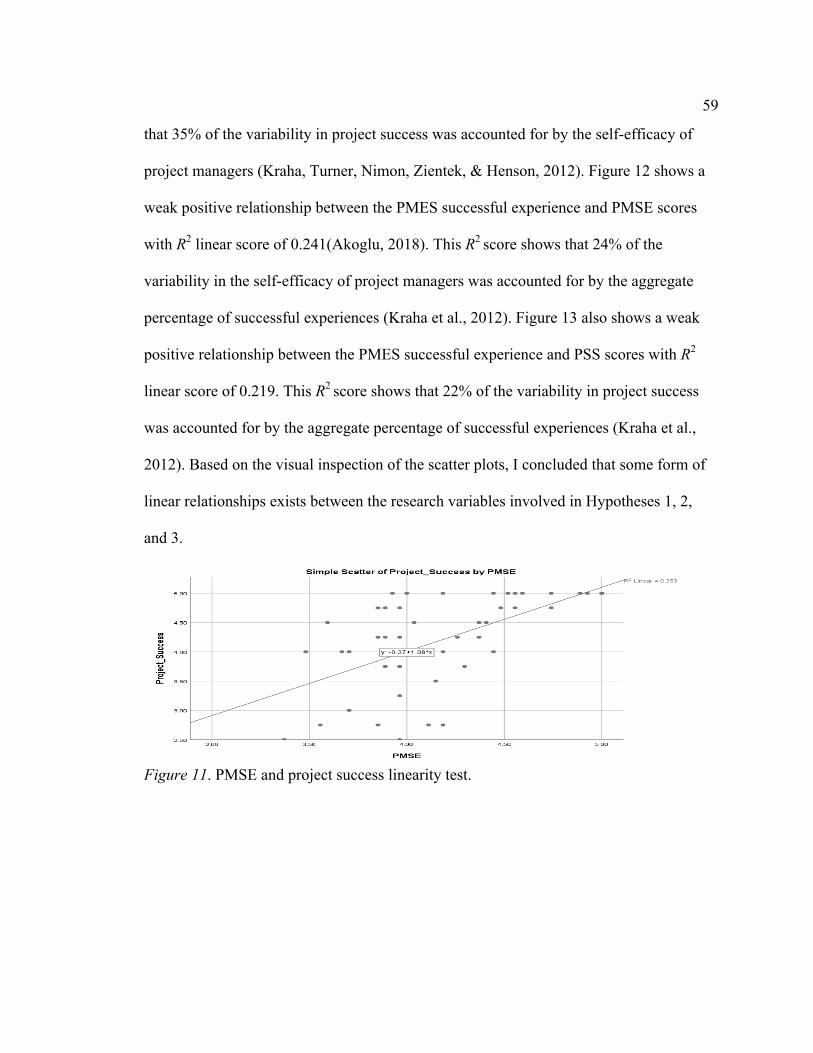
59
that 35% of the variability in project success was accounted for by the self-efficacy of
project managers (Kraha, Turner, Nimon, Zientek, & Henson, 2012). Figure 12 shows a
weak positive relationship between the PMES successful experience and PMSE scores
with R2 linear score of 0.241(Akoglu, 2018). This R2 score shows that 24% of the
variability in the self-efficacy of project managers was accounted for by the aggregate
percentage of successful experiences (Kraha et al., 2012). Figure 13 also shows a weak
positive relationship between the PMES successful experience and PSS scores with R2
linear score of 0.219. This R2 score shows that 22% of the variability in project success
was accounted for by the aggregate percentage of successful experiences (Kraha et al.,
2012). Based on the visual inspection of the scatter plots, I concluded that some form of
linear relationships exists between the research variables involved in Hypotheses 1, 2,
and 3.
Figure 11. PMSE and project success linearity test.
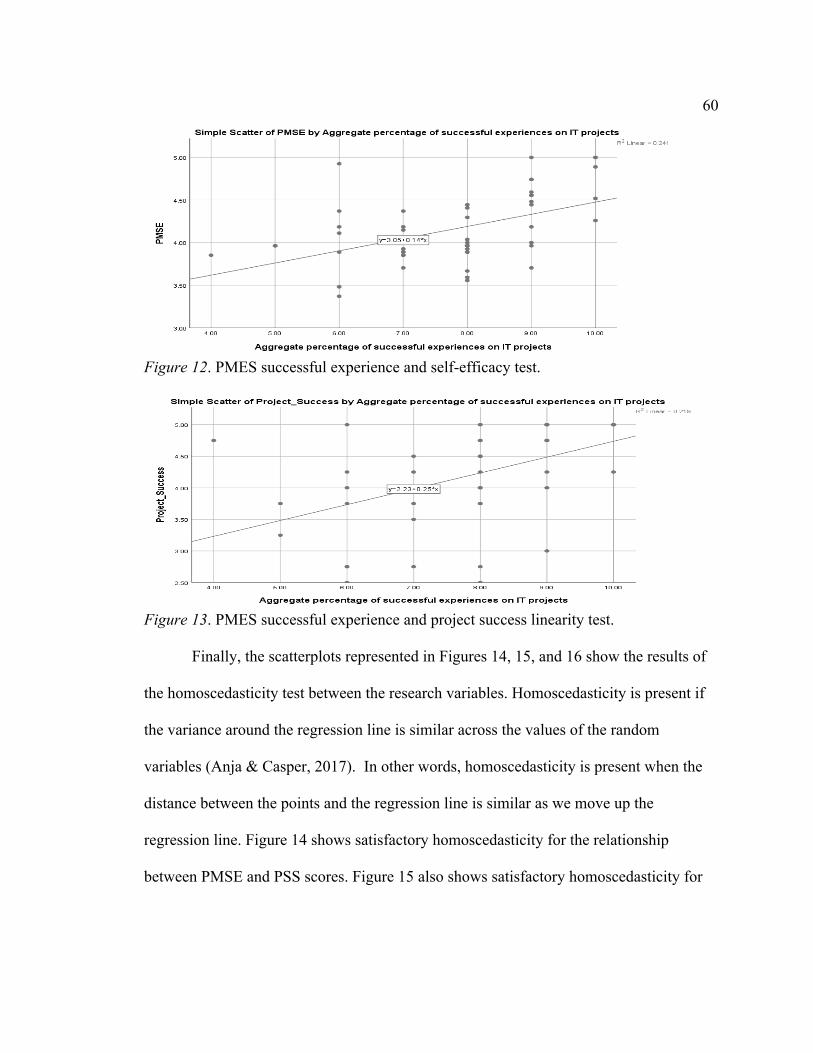
60
Figure 12. PMES successful experience and self-efficacy test.
Figure 13. PMES successful experience and project success linearity test.
Finally, the scatterplots represented in Figures 14, 15, and 16 show the results of
the homoscedasticity test between the research variables. Homoscedasticity is present if
the variance around the regression line is similar across the values of the random
variables (Anja & Casper, 2017). In other words, homoscedasticity is present when the
distance between the points and the regression line is similar as we move up the
regression line. Figure 14 shows satisfactory homoscedasticity for the relationship
between PMSE and PSS scores. Figure 15 also shows satisfactory homoscedasticity for
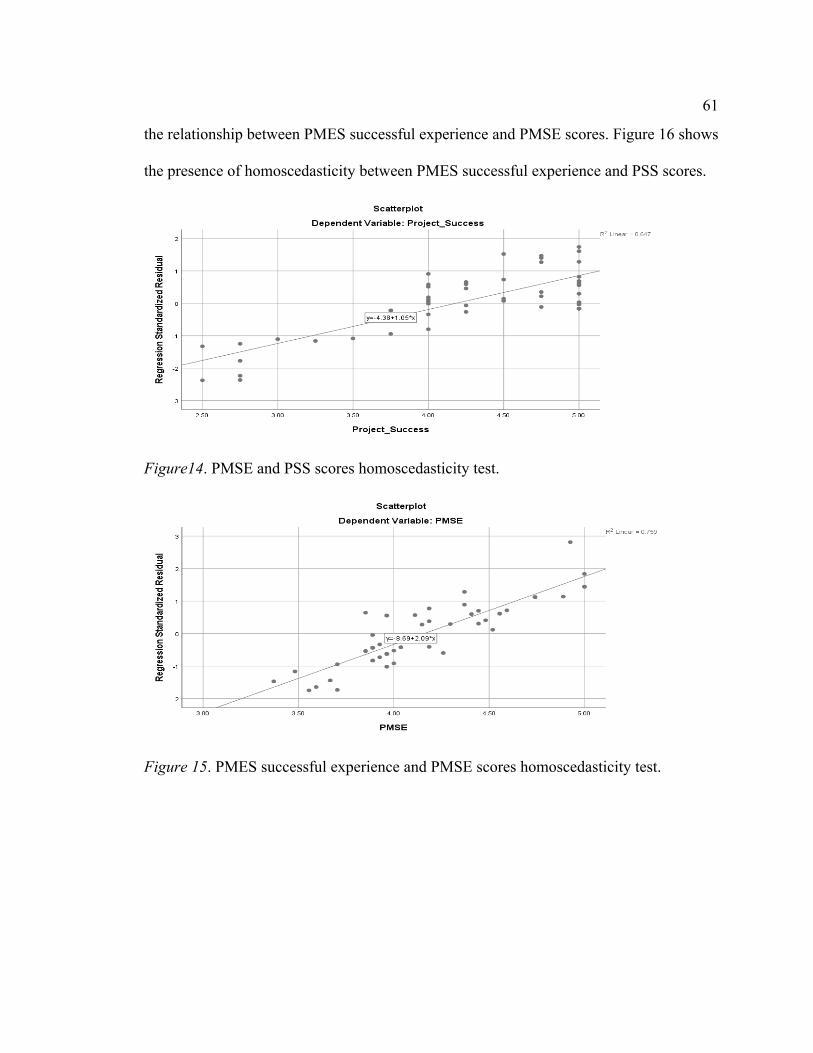
61
the relationship between PMES successful experience and PMSE scores. Figure 16 shows
the presence of homoscedasticity between PMES successful experience and PSS scores.
Figure14. PMSE and PSS scores homoscedasticity test.
Figure 15. PMES successful experience and PMSE scores homoscedasticity test.
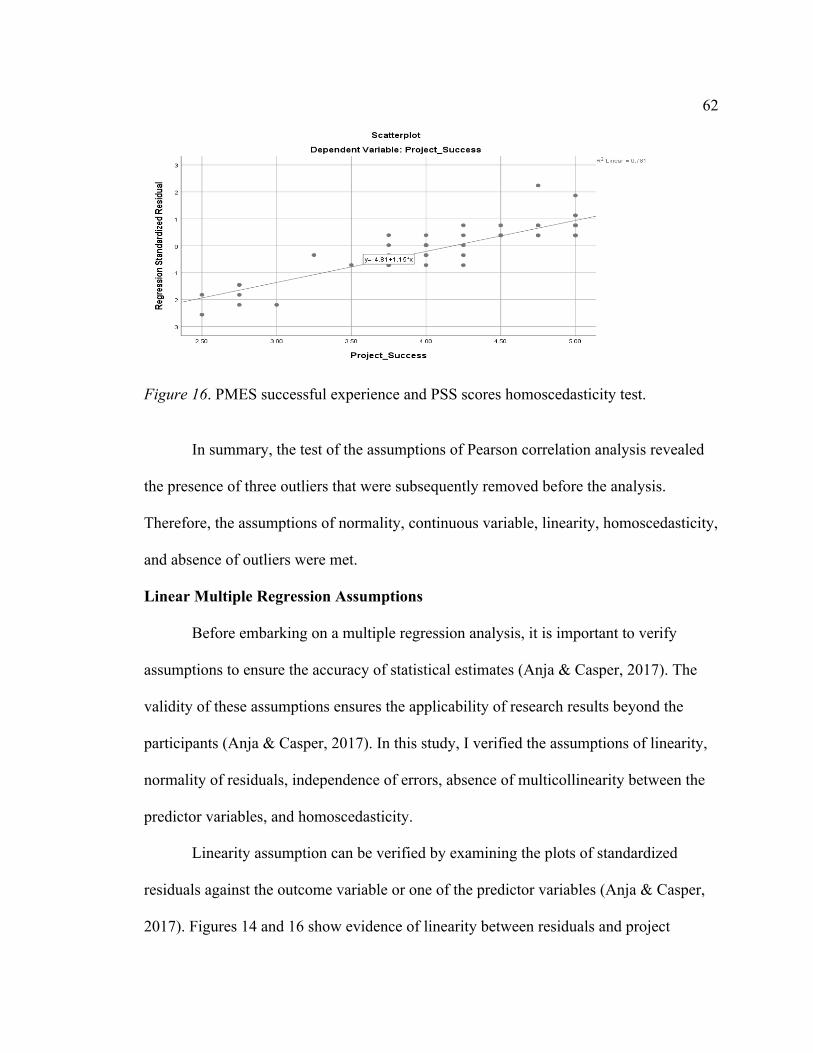
62
Figure 16. PMES successful experience and PSS scores homoscedasticity test.
In summary, the test of the assumptions of Pearson correlation analysis revealed
the presence of three outliers that were subsequently removed before the analysis.
Therefore, the assumptions of normality, continuous variable, linearity, homoscedasticity,
and absence of outliers were met.
Linear Multiple Regression Assumptions
Before embarking on a multiple regression analysis, it is important to verify
assumptions to ensure the accuracy of statistical estimates (Anja & Casper, 2017). The
validity of these assumptions ensures the applicability of research results beyond the
participants (Anja & Casper, 2017). In this study, I verified the assumptions of linearity,
normality of residuals, independence of errors, absence of multicollinearity between the
predictor variables, and homoscedasticity.
Linearity assumption can be verified by examining the plots of standardized
residuals against the outcome variable or one of the predictor variables (Anja & Casper,
2017). Figures 14 and 16 show evidence of linearity between residuals and project
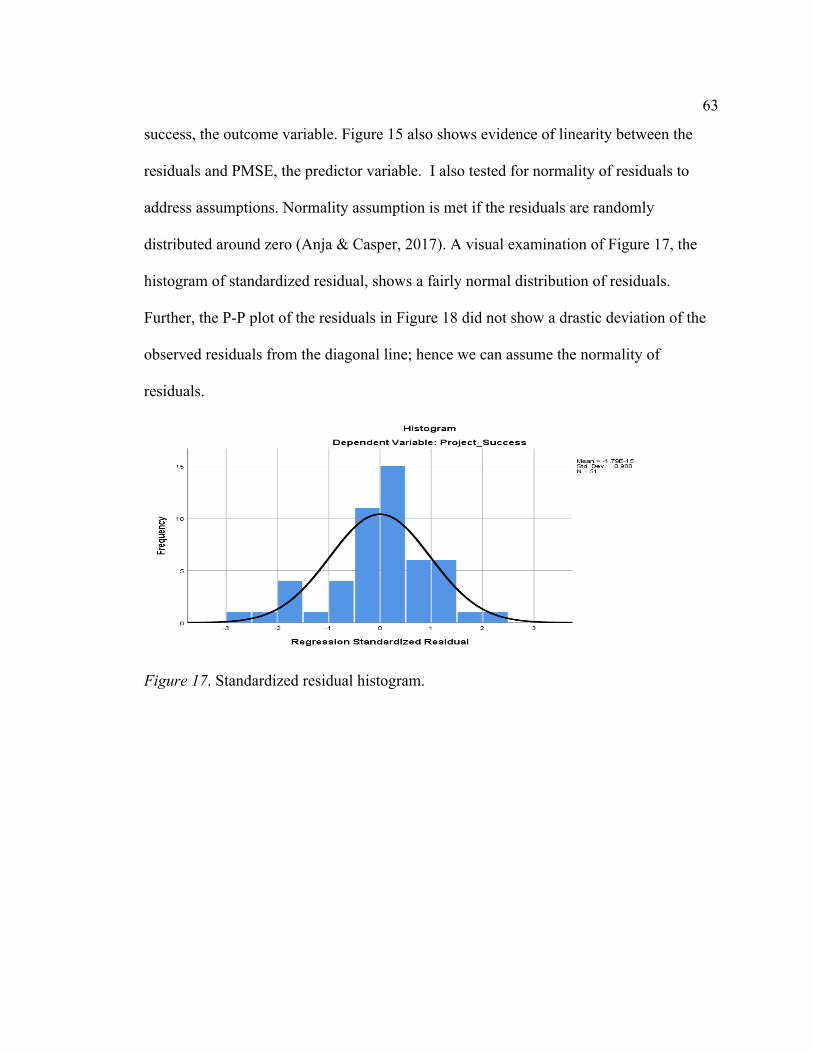
63
success, the outcome variable. Figure 15 also shows evidence of linearity between the
residuals and PMSE, the predictor variable. I also tested for normality of residuals to
address assumptions. Normality assumption is met if the residuals are randomly
distributed around zero (Anja & Casper, 2017). A visual examination of Figure 17, the
histogram of standardized residual, shows a fairly normal distribution of residuals.
Further, the P-P plot of the residuals in Figure 18 did not show a drastic deviation of the
observed residuals from the diagonal line; hence we can assume the normality of
residuals.
Figure 17. Standardized residual histogram.
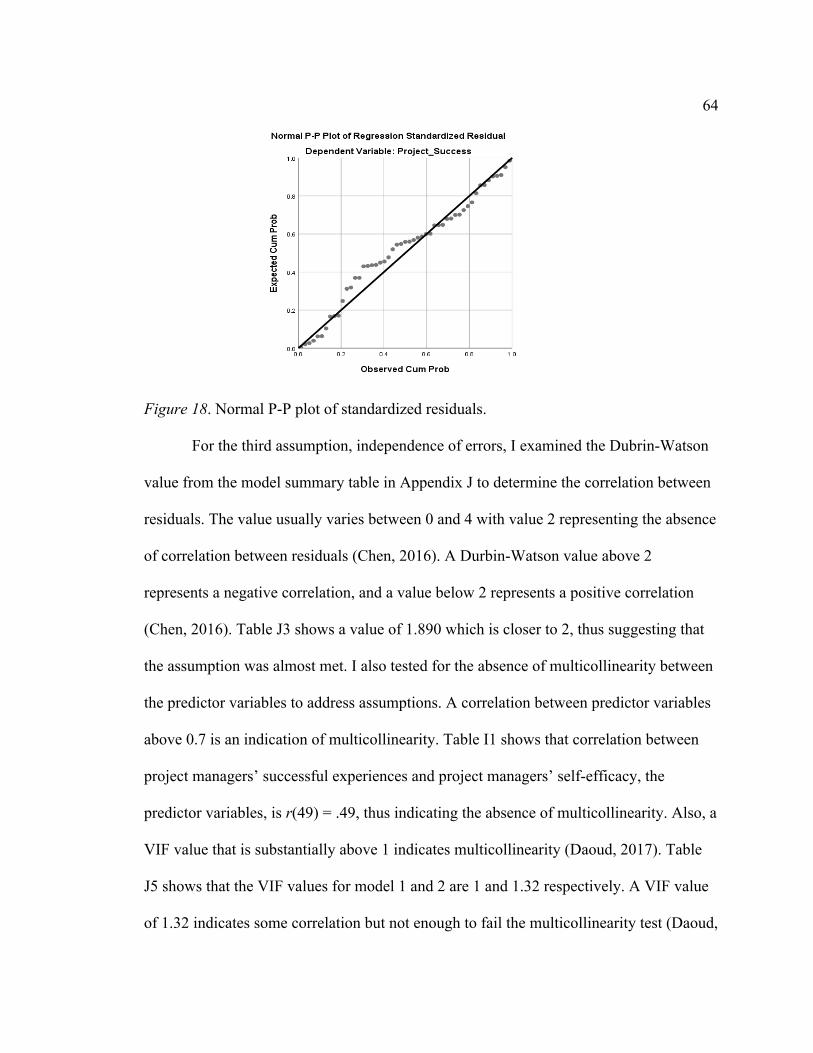
64
Figure 18. Normal P-P plot of standardized residuals.
For the third assumption, independence of errors, I examined the Dubrin-Watson
value from the model summary table in Appendix J to determine the correlation between
residuals. The value usually varies between 0 and 4 with value 2 representing the absence
of correlation between residuals (Chen, 2016). A Durbin-Watson value above 2
represents a negative correlation, and a value below 2 represents a positive correlation
(Chen, 2016). Table J3 shows a value of 1.890 which is closer to 2, thus suggesting that
the assumption was almost met. I also tested for the absence of multicollinearity between
the predictor variables to address assumptions. A correlation between predictor variables
above 0.7 is an indication of multicollinearity. Table I1 shows that correlation between
project managers’ successful experiences and project managers’ self-efficacy, the
predictor variables, is r(49) = .49, thus indicating the absence of multicollinearity. Also, a
VIF value that is substantially above 1 indicates multicollinearity (Daoud, 2017). Table
J5 shows that the VIF values for model 1 and 2 are 1 and 1.32 respectively. A VIF value
of 1.32 indicates some correlation but not enough to fail the multicollinearity test (Daoud,
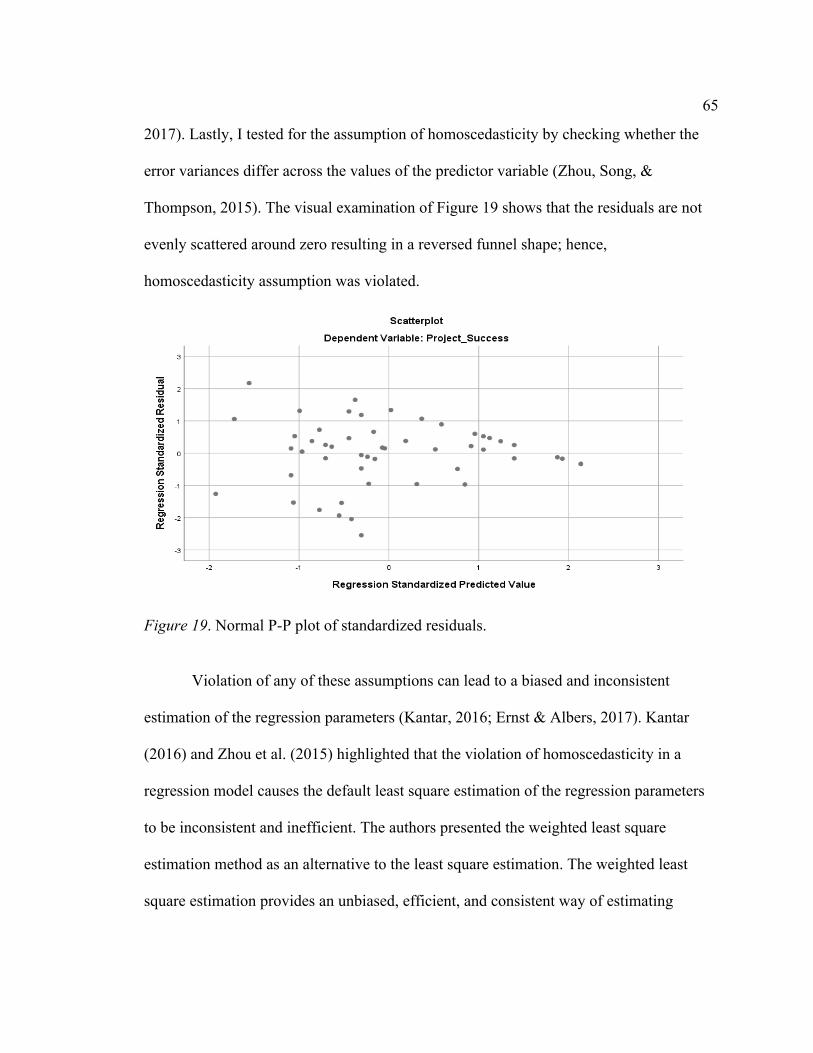
65
2017). Lastly, I tested for the assumption of homoscedasticity by checking whether the
error variances differ across the values of the predictor variable (Zhou, Song, &
Thompson, 2015). The visual examination of Figure 19 shows that the residuals are not
evenly scattered around zero resulting in a reversed funnel shape; hence,
homoscedasticity assumption was violated.
Figure 19. Normal P-P plot of standardized residuals.
Violation of any of these assumptions can lead to a biased and inconsistent
estimation of the regression parameters (Kantar, 2016; Ernst & Albers, 2017). Kantar
(2016) and Zhou et al. (2015) highlighted that the violation of homoscedasticity in a
regression model causes the default least square estimation of the regression parameters
to be inconsistent and inefficient. The authors presented the weighted least square
estimation method as an alternative to the least square estimation. The weighted least
square estimation provides an unbiased, efficient, and consistent way of estimating
66
regression parameters when the error variance around the regression line is inconsistent
across the values of the outcome variable (Kantar; 2016; Zhou et al., 2015). In addition,
Kantar (2016) noted that the weighted least square estimation method is efficient when
analyzing small samples. In the weighted least square estimation method, each case of the
outcome variable is adjusted by an estimate of the prediction error associated with it.
Analysis of Test Results
Appendix I shows the results of the correlation analysis of the relationships
between the research variables in Hypotheses 1, 2, and 3. I only needed to use the
weighted least square estimation method to test hypothesis 4. I obtained and analyzed the
regression parameters from both least square estimation and weighted least square
estimation methods to enhance the validity of the results by checking for consistency
across the two methods. Appendix J shows the results of the regression model analysis
using the default least square estimation method.
Research Question 1
In Research Question 1, I evaluated the relationship between project managers’
exposure to successful experiences and project managers’ self-efficacy by testing these
hypotheses below:
H01: There is no significant statistical relationship between project managers’
exposure to successful experiences and self-efficacy.
Ha1: There is a significant statistical relationship between project managers’
exposure to successful experiences and self-efficacy.
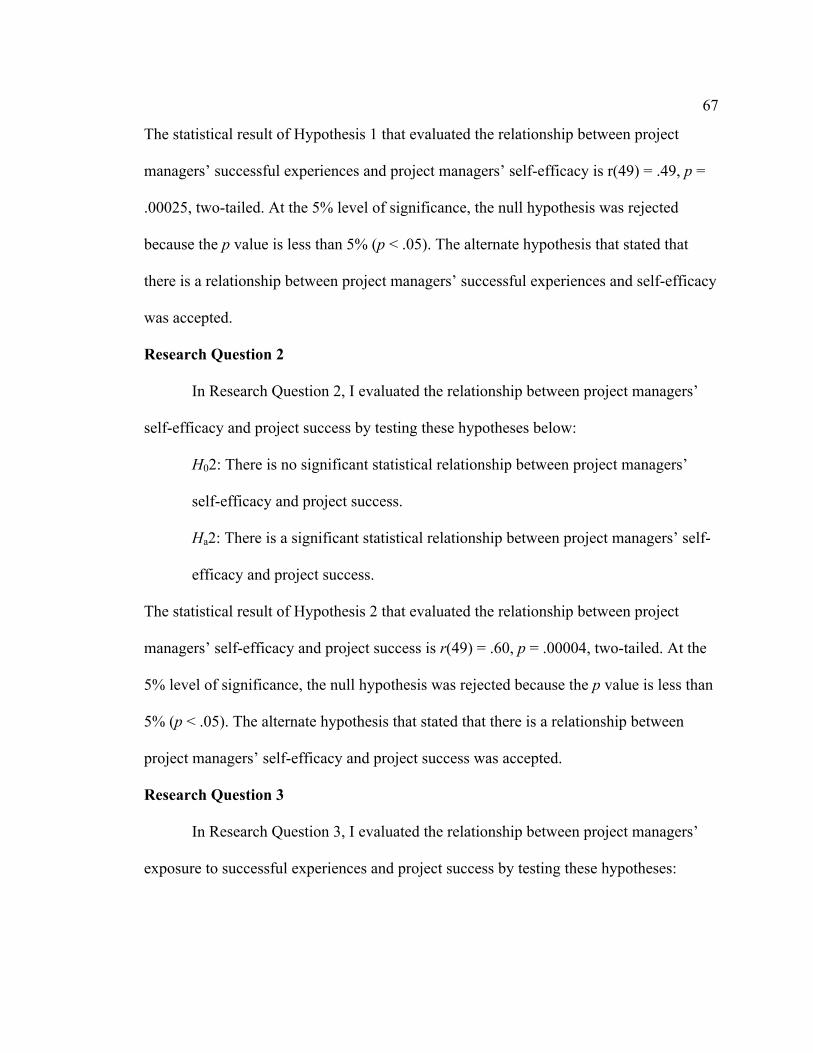
67
The statistical result of Hypothesis 1 that evaluated the relationship between project
managers’ successful experiences and project managers’ self-efficacy is r(49) = .49, p =
.00025, two-tailed. At the 5% level of significance, the null hypothesis was rejected
because the p value is less than 5% (p < .05). The alternate hypothesis that stated that
there is a relationship between project managers’ successful experiences and self-efficacy
was accepted.
Research Question 2
In Research Question 2, I evaluated the relationship between project managers’
self-efficacy and project success by testing these hypotheses below:
H02: There is no significant statistical relationship between project managers’
self-efficacy and project success.
Ha2: There is a significant statistical relationship between project managers’ self-
efficacy and project success.
The statistical result of Hypothesis 2 that evaluated the relationship between project
managers’ self-efficacy and project success is r(49) = .60, p = .00004, two-tailed. At the
5% level of significance, the null hypothesis was rejected because the p value is less than
5% (p < .05). The alternate hypothesis that stated that there is a relationship between
project managers’ self-efficacy and project success was accepted.
Research Question 3
In Research Question 3, I evaluated the relationship between project managers’
exposure to successful experiences and project success by testing these hypotheses:
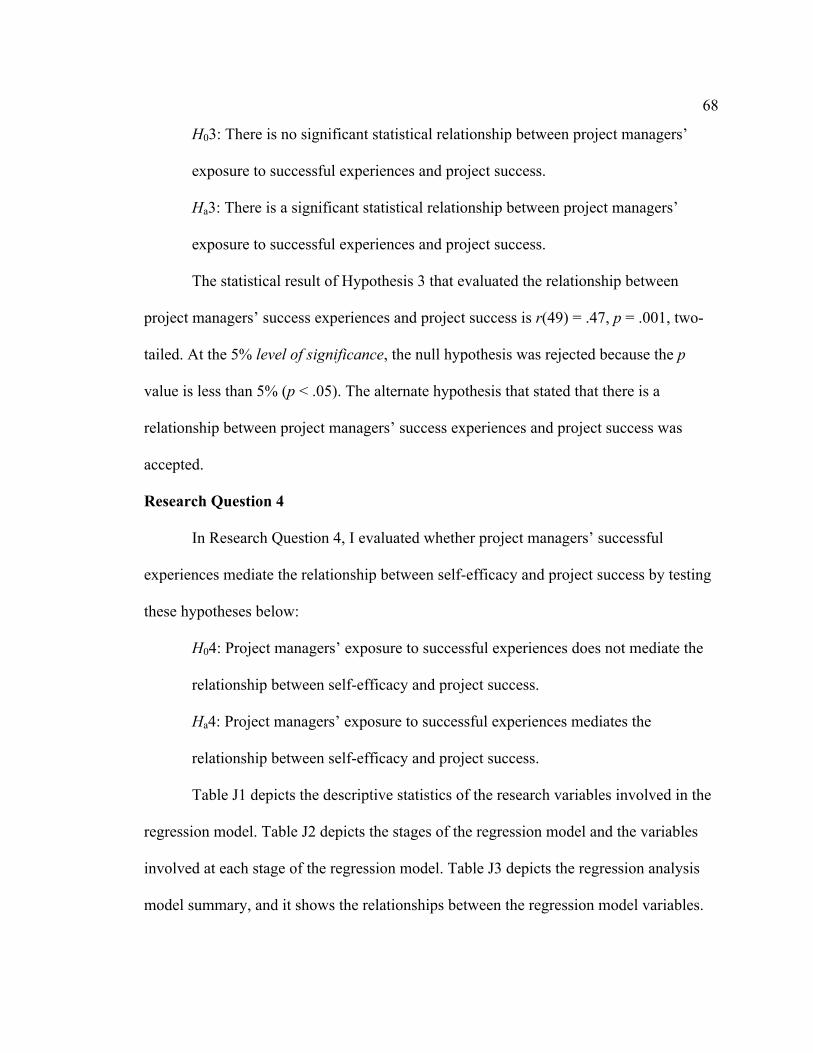
68
H03: There is no significant statistical relationship between project managers’
exposure to successful experiences and project success.
Ha3: There is a significant statistical relationship between project managers’
exposure to successful experiences and project success.
The statistical result of Hypothesis 3 that evaluated the relationship between
project managers’ success experiences and project success is r(49) = .47, p = .001, two-
tailed. At the 5% level of significance, the null hypothesis was rejected because the p
value is less than 5% (p < .05). The alternate hypothesis that stated that there is a
relationship between project managers’ success experiences and project success was
accepted.
Research Question 4
In Research Question 4, I evaluated whether project managers’ successful
experiences mediate the relationship between self-efficacy and project success by testing
these hypotheses below:
H04: Project managers’ exposure to successful experiences does not mediate the
relationship between self-efficacy and project success.
Ha4: Project managers’ exposure to successful experiences mediates the
relationship between self-efficacy and project success.
Table J1 depicts the descriptive statistics of the research variables involved in the
regression model. Table J2 depicts the stages of the regression model and the variables
involved at each stage of the regression model. Table J3 depicts the regression analysis
model summary, and it shows the relationships between the regression model variables.
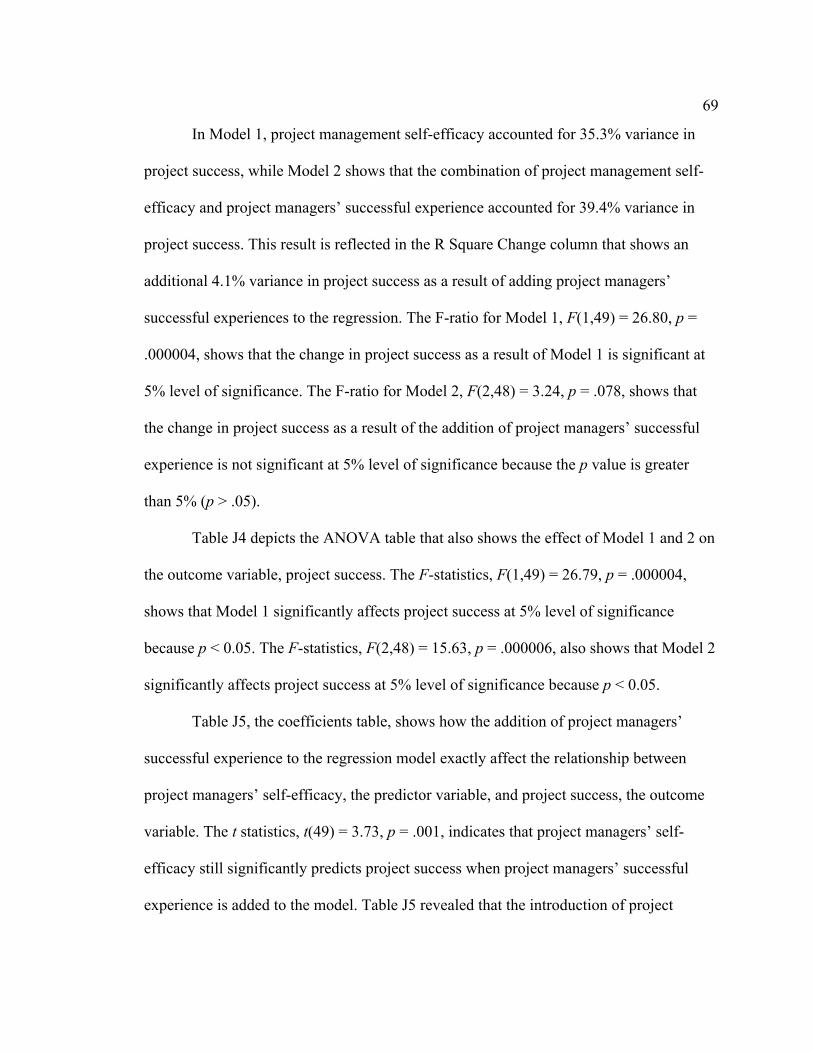
69
In Model 1, project management self-efficacy accounted for 35.3% variance in
project success, while Model 2 shows that the combination of project management self-
efficacy and project managers’ successful experience accounted for 39.4% variance in
project success. This result is reflected in the R Square Change column that shows an
additional 4.1% variance in project success as a result of adding project managers’
successful experiences to the regression. The F-ratio for Model 1, F(1,49) = 26.80, p =
.000004, shows that the change in project success as a result of Model 1 is significant at
5% level of significance. The F-ratio for Model 2, F(2,48) = 3.24, p = .078, shows that
the change in project success as a result of the addition of project managers’ successful
experience is not significant at 5% level of significance because the p value is greater
than 5% (p > .05).
Table J4 depicts the ANOVA table that also shows the effect of Model 1 and 2 on
the outcome variable, project success. The F-statistics, F(1,49) = 26.79, p = .000004,
shows that Model 1 significantly affects project success at 5% level of significance
because p < 0.05. The F-statistics, F(2,48) = 15.63, p = .000006, also shows that Model 2
significantly affects project success at 5% level of significance because p < 0.05.
Table J5, the coefficients table, shows how the addition of project managers’
successful experience to the regression model exactly affect the relationship between
project managers’ self-efficacy, the predictor variable, and project success, the outcome
variable. The t statistics, t(49) = 3.73, p = .001, indicates that project managers’ self-
efficacy still significantly predicts project success when project managers’ successful
experience is added to the model. Table J5 revealed that the introduction of project
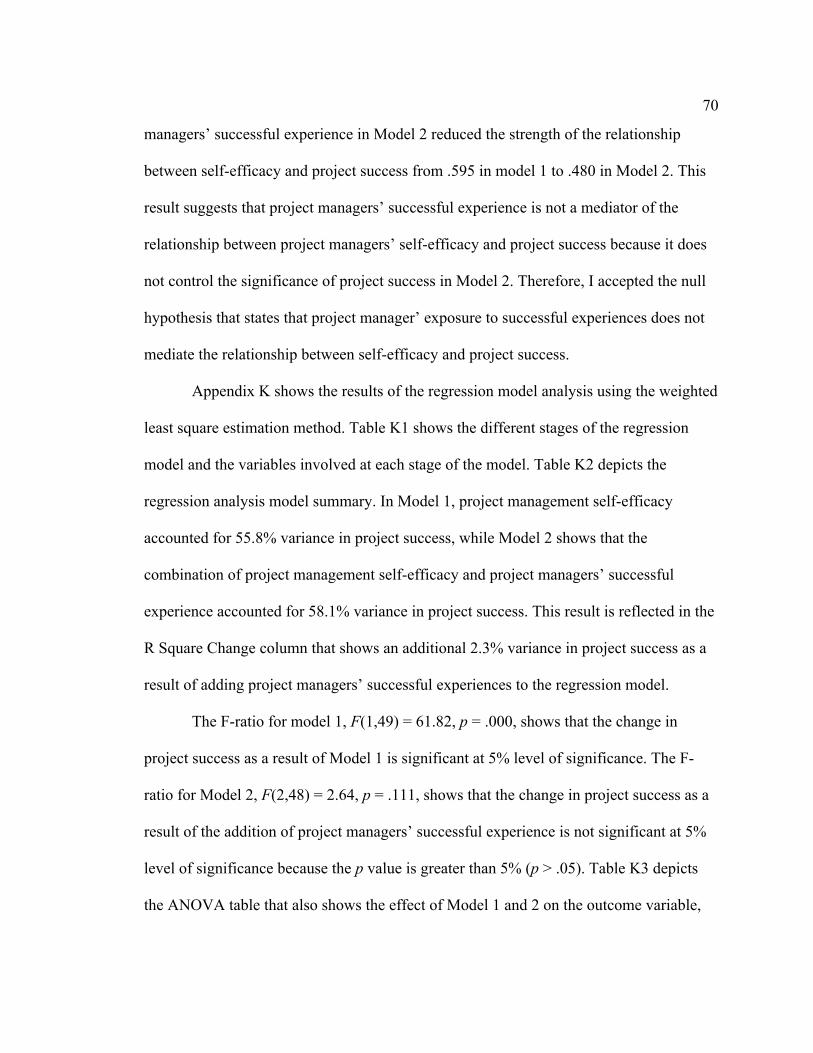
70
managers’ successful experience in Model 2 reduced the strength of the relationship
between self-efficacy and project success from .595 in model 1 to .480 in Model 2. This
result suggests that project managers’ successful experience is not a mediator of the
relationship between project managers’ self-efficacy and project success because it does
not control the significance of project success in Model 2. Therefore, I accepted the null
hypothesis that states that project manager’ exposure to successful experiences does not
mediate the relationship between self-efficacy and project success.
Appendix K shows the results of the regression model analysis using the weighted
least square estimation method. Table K1 shows the different stages of the regression
model and the variables involved at each stage of the model. Table K2 depicts the
regression analysis model summary. In Model 1, project management self-efficacy
accounted for 55.8% variance in project success, while Model 2 shows that the
combination of project management self-efficacy and project managers’ successful
experience accounted for 58.1% variance in project success. This result is reflected in the
R Square Change column that shows an additional 2.3% variance in project success as a
result of adding project managers’ successful experiences to the regression model.
The F-ratio for model 1, F(1,49) = 61.82, p = .000, shows that the change in
project success as a result of Model 1 is significant at 5% level of significance. The F-
ratio for Model 2, F(2,48) = 2.64, p = .111, shows that the change in project success as a
result of the addition of project managers’ successful experience is not significant at 5%
level of significance because the p value is greater than 5% (p > .05). Table K3 depicts
the ANOVA table that also shows the effect of Model 1 and 2 on the outcome variable,
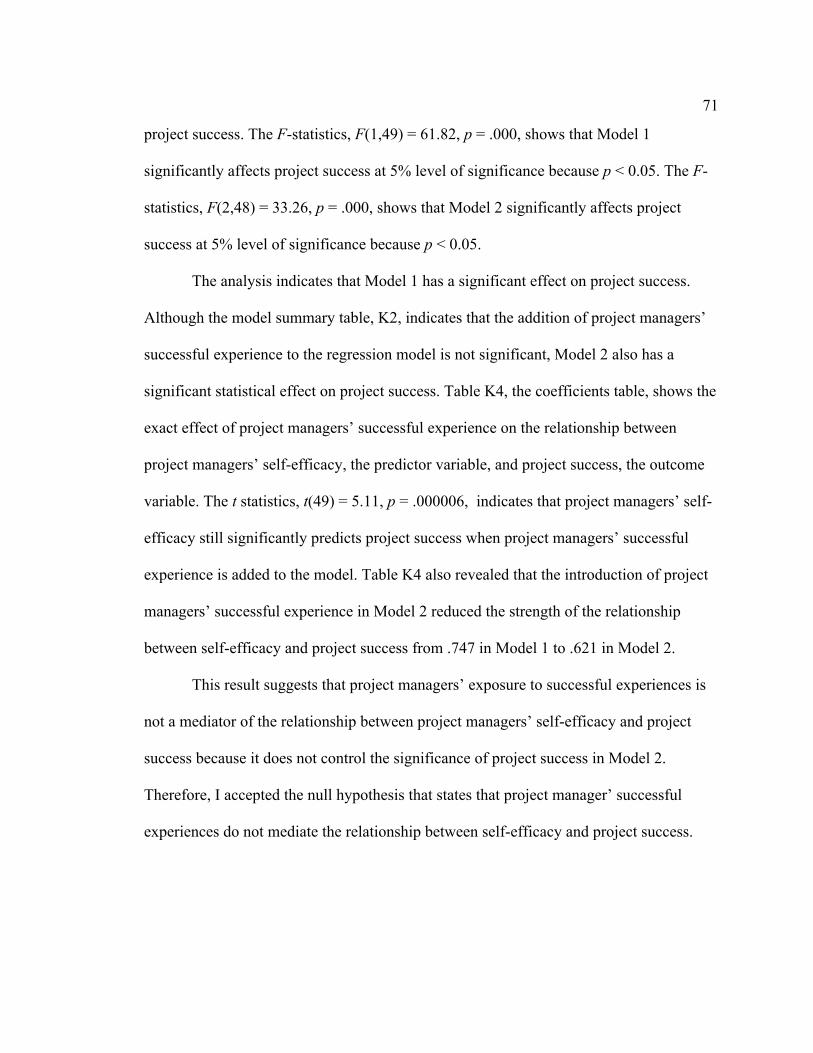
71
project success. The F-statistics, F(1,49) = 61.82, p = .000, shows that Model 1
significantly affects project success at 5% level of significance because p < 0.05. The F-
statistics, F(2,48) = 33.26, p = .000, shows that Model 2 significantly affects project
success at 5% level of significance because p < 0.05.
The analysis indicates that Model 1 has a significant effect on project success.
Although the model summary table, K2, indicates that the addition of project managers’
successful experience to the regression model is not significant, Model 2 also has a
significant statistical effect on project success. Table K4, the coefficients table, shows the
exact effect of project managers’ successful experience on the relationship between
project managers’ self-efficacy, the predictor variable, and project success, the outcome
variable. The t statistics, t(49) = 5.11, p = .000006, indicates that project managers’ self-
efficacy still significantly predicts project success when project managers’ successful
experience is added to the model. Table K4 also revealed that the introduction of project
managers’ successful experience in Model 2 reduced the strength of the relationship
between self-efficacy and project success from .747 in Model 1 to .621 in Model 2.
This result suggests that project managers’ exposure to successful experiences is
not a mediator of the relationship between project managers’ self-efficacy and project
success because it does not control the significance of project success in Model 2.
Therefore, I accepted the null hypothesis that states that project manager’ successful
experiences do not mediate the relationship between self-efficacy and project success.
72
Conclusion
The analysis revealed a slight difference in the results from the least square
estimation and weighted least square estimation methods of multiple linear regression,
but the difference is not enough to affect the outcome of the test of Hypothesis 4. This
chapter contains the findings based upon the data captured from Canadian-based certified
project management professional members of the PMI with experience in IT projects.
The results showed a statistically significant positive correlation among project
managers’ self-efficacy, project managers’ exposure to successful experiences, and
project success. The results also showed that project managers’ exposure to successful
experiences does not mediate the relationship between project managers’ self-efficacy
and project success. Included in Chapter 5 is a detailed discussion of the findings and
how it fits into the existing literature. I conclude Chapter 5 with the implications of this
research for practice and recommendations for further studies.
73
Chapter 5: Discussion, Conclusions, and Recommendations
Introduction
This study was conducted to address the deficiency in knowledge regarding how
project managers’ success experiences affect their efficacy and project success. The
interrelationship among project managers’ competence, project success, and overall
organizational performance is why the investigation of ways to improve the performance
of project managers and their eventual success continues to be an area of research
interest. The purpose of this study was to examine the relationships among project
managers’ exposure to successful experiences, self-efficacy, and project success. Data
were collected from 63 PMI certified project managers who reside in Canada with current
or past experiences on IT projects out of which 54 responses were valid. Three responses
that contained outliers were removed before proceeding with data analysis, so the total
sample was 51.
Interpretation of Findings
I tested four hypotheses for the research questions that guided this research. The
first research question pertained to whether a relationship exists between project
managers’ successful experiences and project managers’ self-efficacy. The findings as
reported in Chapter 4 indicated a moderate positive relationship between successful
experiences of project managers and their self-efficacy, r(49) = .49, p = .00025, two-
tailed. Although the result did not confirm a causal relationship between the two research
variables, it indicated that participants with higher exposure to successful experiences
tended to have higher self-efficacy. This study represents a first attempt at demystifying
74
how project managers’ successful experiences affect their self-efficacy in a project
management environment. The result is consistent with the self-efficacy theory that
suggests repeated cases of successful experiences lead to high self-efficacy (Bandura,
1989, 1994; Wood & Bandura; 1989). The finding also supports past research that
established that successful experience has a positive effect on the self-efficacy
(Achterkamp et al., 2015; Martins et al., 2015). This finding also clarified the evidence
from studies (Geithner & Menzel, 2016; Huff & Prybutok, 2008) in project management
environment that a link exists between practical project management experience and the
acquisition of project management skills and competence.
The second research question addressed whether a relationship exists between
project managers’ self-efficacy and project success. The statistical findings indicated a
slightly strong positive relationship between the self-efficacy of project managers and
project success, r(49) = .60, p = .00004, two-tailed. The result is consistent with the self-
efficacy theory in that the stronger the self-efficacy, the more successful people become,
and self-efficacy contributes to the attainment of competencies and success (Bandura,
1989, 1994). Although the self-efficacy theory has been found to hold in general
management research, there have been few attempts to investigate the construct in project
management, which is why I was not able to locate prior researches to support a robust
discussion of this statistical finding.
Despite a lack of research, the finding for Research Question 2 is similar to the
findings of Kamohi and Autram (2014) that established that self-efficacy positively
affects the effectiveness of project managers in modern-day organizations. However, the
75
authors only examined the effect of self-efficacy on the intrinsic personal attributes of
project managers and concluded that self-efficacy has a positive influence on the intrinsic
attributes that contribute to project managers’ effectiveness in a project environment
(Kamohi & Autram, 2014). The finding from this study is also supported by Blomquist
et al. (2016), who demonstrated that project managers with higher self-efficacy delivered
higher job performance as well as a positive correlation between project managers’ self-
efficacy and each of the scale items of the PSS used in this study. However, this study
was limited to IT projects and involved only project management professionals certified
by the PMI, and Blomquist et al. assessed different types of project managers with
diverse qualifications.
The third research question addressed whether a relationship exists between
project managers’ successful experiences and project success. The findings indicated a
moderate positive relationship between project managers’ successful experiences and
project success, r(49) = .47, p = .001, two-tailed. This result is consistent with the central
idea of the self-efficacy theory that the more the exposure of people to successful
experiences in each task, the more likely they are to accomplish the task because of the
positive effect of the successful performances on their perceived self-efficacy (Bandura,
1994; Wood & Bandura, 1989).
I was unable to locate any prior research on the topic in Research Question 3—the
relationship between successful experiences and project success in a project environment.
The few studies I located focused on the duration of project management experience and
its effect on knowledge acquisition, competence, and project performance in a project
76
management environment. Among these studies, Rubin and Seeling (1967) reported that
project management experiences have a minimal effect on project performance, which is
inconsistent with the result of this study. Although the authors initially thought that
project performance was due to the project managers’ experience, they eventually
concluded that project performance improved because organizations highly prioritize
larger projects and assign more experienced managers to these projects (Rubin & Seeling,
1967). Additionally, the results of this study partially support the work of Geithner and
Menzel (2016) demonstrating that practical project management experience enhances
project management knowledge and competence and Ekrot et al.’s (2016) argument that
project managers’ competence retention positively influences project success. Finally,
other studies suggested that differences in the project management experience levels of
project managers cause differences in decision-making and outcomes, as decision-making
and the ability to understand trade-offs are competencies that affect project performance
and success (Huff & Prybutok, 2008; Thi & Swierczek, 2010). This also relates to the
finding for Research Question 3.
The fourth research question addressed whether project managers’ successful
experiences mediate the relationship between self-efficacy and project success. The
findings indicated that the self-efficacy of project managers continued to significantly
relate to project success when the aggregate percentage score of project managers’
successful experiences was added to the regression model, t(49) = 5.11, p = .000006.
Additionally, the effect of one standard deviation change in project managers’ self-
efficacy on project success only reduced in strength from .747 in Model 1 to .621 when
77
project manager’ successful experience was added in Model 2. This result confirmed that
project managers’ successful experiences did not control the significance of the
relationship between self-efficacy and project success, indicating the absence of a
mediating effect of project managers’ successful experiences.
I was unable to locate any prior research on the topic in Research Question 4—the
mediating effect of general project management experience on the relationship between
self-efficacy and project success. Hence, this study is the first attempt at demystifying
whether project management experience of project managers mediates the relationship
between self-efficacy and project success.
Applications to Professional Practice
Projects are critical to the sustainable growth and survival of businesses (Kamohi
& Autram, 2014). Research has shown that project success is critical to the overall
organizational success by enhancing the organizational ability to efficiently cope with
dynamic business environments (Ekrot et al., 2016). Project managers with key
competence in project management play a significant role in the success of projects
(Ekrot et al., 2016; Sadeghi et al., 2014). Despite the availability of training programs and
professional certifications to help project managers acquire relevant project management
skills and competencies, researchers and practitioners continue to report a high project
failure rate (Allen et al., 2014; Standish, 2014). Researchers and practitioners highlighted
project managers’ lack of experience as one of the reasons for project failure (Benoy &
Gracias, 2015; Florentine, 2014; PMI, 2015).
78
The few attempts to examine the effect of project managers’ experience in the
project management environment have been limited to the duration of experiences. This
study was anchored on the self-efficacy concept of Bandura’s social cognitive theory, and
I demonstrated the relationship between project managers’ successful experiences, self-
efficacy, and project success to obtain information that could help organizational leaders
to make decisions on maximizing project success. Statistically proven findings from this
study can provide new insights for researchers and practitioners on the holistic
implications of the self-efficacy theory in the project management environments.
Implications for Positive Social Change
The literature revealed that project failure causes financial losses to project
owners (Benoy & Gracias, 2015; Damoah & Akwei, 2017), the influence of which can be
detrimental to organizational performance and success as well as the success of the
community. Project managers are important drivers of project success and eventual
organizational performance (Ramos & Mota, 2014). From the perspectives of positive
social change, information from this study could help formulate strategies to improve the
success rate of project managers and overall project success. The positive social change
implication is that project successes can help reduce the problems and losses associated
with failure and eventually enhance organizational performance, sustainability, and
survival, as well as the economic advancement of the employees and their community.
Resultantly, the findings of this study could make significant contributions to positive
social change by mitigating the implications of project failure and poor organizational
79
performance such as job losses, downsizing, organizational failure, and eventual
organizational shutdown.
Recommendations for Action
Project managers require skills and competencies beyond the ones garnered
through formal education and training to be able to deal with the complexities of modern
projects (Ramazani & Jergeas, 2015). In this study, I brought attention to the positive
effect of successful experiences on project success and how successful experiences
positively affect project managers’ belief in their ability to successfully perform project
management tasks. Organizational managers and professional certification bodies can
draw on the insights from this study to improve existing project management training and
development curriculum for project managers. As indicated in my participants’ invitation
email, I will disseminate the summary of my research findings to the participants and
seek to publish it on the social media page of a PMI chapter in Canada. I will also give
my consent to other project management organizations and PMI chapters to publish the
results.
Recommendations for Further Research
The small sample size (n = 51) and the lack of random selection of research
participants pose external validity concerns from possible selection bias. Future research
should focus on a random selection of research participants from a larger pool of project
managers to minimize or eliminate possible selection bias as well as improve the
statistical power and generalizability of research findings. Unidimensional variable
measurements such as the aggregate percentage of successful experiences contained in
80
the PMES are susceptible to random measurements errors unlike multi-item variable
measurements (Gliem & Gliem, 2003). Summing up the individual items could average
out the measurement errors (Gliem & Gliem, 2003). To my knowledge, there is no
evidence that a multi-item scale exists for capturing the different types of project
management experiences; hence future researchers could focus on developing an
evidenced-based multidimensional scale for capturing successful and failure experiences
in project management.
Finally, future researchers should also consider examining how project failure
experiences affect the performance and success of project managers in IT project
environment. Furthermore, given that the factors that affect project outcomes are not
universal and are different across industries, future researchers should consider
expanding this research to other industries to confirm if the relationships between the
research variables are similar across the industries.
Reflections
My experiences and shortcomings as an uncertified IT project manager prompted
my interest in the field of project management, especially how first-time IT managers
cope with the challenges associated with the role. I initially focused on the pursuit of a
doctoral designation to such an extent that I almost forgot the primary objective of
advancing knowledge in my chosen field. A related gap in the literature led me to a
different path; and as I continued researching my research topic and developing the
content of my prospectus, the need for the novelty of a doctoral research became clearer.
81
Developing original research that required a high level of intellectual maturity and critical
thinking became my primary motivation.
Conclusion
The literature revealed the importance of competent project managers in steering
projects to success especially in today’s complex and dynamic business environment.
This study contributed to the existing discussions on project success, especially the
critical success factors of IT projects. The findings of this quantitative research supported
the research hypotheses and demonstrated that (a) a positive relationship exists among
project managers’ successful experiences, self-efficacy, and project success, and (b)
project managers’ successful experiences do not mediate the relationship between their
self-efficacy and project success. These results converge on several key points of the self-
efficacy concept and results from a few related studies. The results provided new insights
into the influence of successful experiences on the self-efficacy of IT project managers.
While this study did not confirm cause-and-effect relationships, the findings
suggested that project success might be improved through the exposure of project
managers to repeated cases of success. Therefore, organizational managers can improve
the success rate of project managers, especially new and junior project managers, by
exposing them to successful experiences through mentorship programs with highly
successful project managers. Because the results of this study are consistent with many
aspects of the self-efficacy concept, organizations can also improve the success rate of
project managers by instituting a strategic development framework for IT projects that
focus on self-efficacy enhancement.
82
References
Achterkamp, R., Hermens, H. J., & Vollenbroek-Hutten, M. M. R. (2015). The influence
of success experience on self-efficacy when providing feedback through
technology. Computers in Human Behavior, 52, 419–423.
doi:10.1016/j.chb.2015.06.029
Aczel, A. (1996). Complete business statistics. New York, NY: McGraw-Hill.
Akoglu, H. (2018). User’s guide to correlation coefficients. Turkish Journal of
Emergency Medicine, 18(3), 91–93. doi:10.1016/j.tjem.2018.08.001
Anja, F., & Casper, J. (2017). Regression assumptions in clinical psychology research
practice: A systematic review of common misconceptions. Peerj, 5, 1–15.
doi:10.7717/peerj.3323
Allen, M., Alleyne, D., Farmer, C., McRae, A., & Turner, C. (2014). A framework for
project success. Journal of Information Technology & Economic Development,
5(2), 1–17. Retrieved from http://www.gsmi-ijgb.com
Aranyossy, M., Blaskovics, B., & Horvath, A. (2018). How universal are IT project
success and failure factors? Evidence from Hungary. Information Systems
Management, 35(1), 15–28. doi:10.1080/10580530.2017.1416943
Bagiella, E., & Chang, H. (2019). Power analysis and sample size calculation. Journal of
Molecular and Cellular Cardiology, 1–3. doi:10.1016/j.yjmcc.2019.01.006
Bandura, A. (1971). Social learning theory. New York, NY: General Learning Press.
Bandura, A. (1989). Social cognitive theory. In R. Vasta (Ed.), Annals of child
development. Vol. 6. Six theories of child development (pp. 1–60). Greenwich,
83
CT: JAI Press.
Bandura, A. (1991). Social cognitive theory of self-regulation. Organizational Behavior
and Human Decision Processes, 50, 248–287. doi:10.1016/0749-5978(91)90022-
L
Bandura, A. (1994). Self-efficacy. In V. S. Ramachaudran (Ed.), Encyclopedia of human
behavior (Vol. 4, pp. 71–81). New York, NY: Academic Press. (Reprinted in H.
Friedman [Ed.], Encyclopedia of mental health. San Diego, CA: Academic Press,
1998).
Bandura, A. (2006). Toward a psychology of human agency. Perspectives on
Psychological Science, 1(2), 164–180. doi:10.1111/j.1745-6916.2006.00011.x
Barnwell, D., Nedrick, S., Rudolph, E., Sesay, M., & Wellen, W. (2014). Leadership of
international and virtual project teams. International Journal of Global Business,
7(2), 1–8. Retrieved from http://www.gsmi-ijgb.com
Baugher, D., Weisbord, E., & Ramos, C. (2014). Is the empirical validity of prior
experience for performance affected by rating approach? Personnel Review, (3),
438–463. doi:10.1108/PR-10-2012-0188
Beas, M., & Salanova, M. (2006). Self-efficacy beliefs, computer training and
psychological well-being among information and communication technology
workers. Computers in Human Behavior, 22(6), 1043–1058.
doi:10.1016/j.chb.2004.03.027
Benoy, J., & Gracias, N. (2015). Strategic talent management: A proposed model for
building talent pipeline of project managers. International Journal of
84
Management, 6(7), 69–85. Retrieved from http://www.iaeme.com/
Berssaneti, F. T., & Carvalho, M. M. (2015). Identification of variables that impact
project success in Brazilian companies. International Journal of Project
Management, 33(3), 638–649. doi:10.1016/j.ijproman.2014.07.002
Besteiro, E. N. C., de Souza Pinto, J., & Novaski, O. (2015). Success factors in project
management. Business Management Dynamics, 4(9), 19–34. Retrieved from
http://www.bmdynamics.com
Blomquist, T., Farashah, A. D., & Thomas, J. (2016). Project management self-efficacy
as a predictor of project performance: Constructing and validating a domain-
specific scale. International Journal of Project Management, 34(8), 1417–1432.
doi:10.1016/j.ijproman.2016.07.010
Bolaños-Medina, A. (2014). Self-efficacy in translation: Translation & interpreting
studies. The Journal of the American Translation & Interpreting Studies
Association, 9(2), 197–218. doi:10.1075/tis.9.2.03bol
Brière, S., Proulx, D., Flores, O. N., & Laporte, M. (2015). Competencies of project
managers in international NGOs: Perceptions of practitioners. International
Journal of Project Management, 33(1), 116–125.
doi:10.1016/j.ijproman.2014.04.010
Bronte-Stewart, M. (2015). Beyond the iron triangle: Evaluating aspects of success and
failure using a project status model. Computing and Information Systems, 19(2),
21–37. Retrieved from http://cis.uws.ac.uk/research/journal/vol19.htm
Carlton, D. (2017). Competence versus confidence in IT project leadership and its impact
85
on project outcomes. Journal of Modern Project Management, 38–45.
doi:10.19255/JMPM01304
Chen, Y. (2016). Spatial autocorrelation approaches to testing residuals from least
squares regression. PLOS ONE, 11(1), 1–19. doi:10.1371/journal.pone.0146865
Chen, G., Gully, S. M., & Eden, D. (2001). Validation of a new general self-efficacy
scale. Organizational Research Methods, 4(1), 62–83.
doi:10.1177/109442810141004
Chou, J., Irawan, N., & Pham, A. (2013). Project management knowledge of construction
professionals: Cross-Country study of effects on project success. Journal of
Construction Engineering and Management, 139(11), 1–15.
doi:10.1061/(ASCE)CO.1943-7862.0000766
Cohen, J. (1969). Statistical power analysis for the behavioral sciences. New York, NY:
Academic Press.
Cooper, D. R., & Schindler, P. S. (2008). Business research methods (10th ed.). New
York, NY: McGraw-Hill.
Curtis, E. A., Comiskey, C., & Dempsey, O. (2016). Importance and use of correlational
research. Nurse Researcher, 23(6), 20–25. doi:10.7748/nr.2016.e1382
Daglar, G., Bilgic, D., Evcili, F., & Bolat, O. (2018). The relationship between self-
efficacy-sufficiency and professional motivation of the midwifery students.
International Journal of Caring Sciences, 11(2), 1238–1246. Retrieved from
http://www.internationaljournalofcaringsciences.org
Damoah, I. S., & Akwei, C. (2017). Government project failure in Ghana: A
86
multidimensional approach. International Journal of Managing Projects in
Business, 10(1), 32–59. doi:10.1108/IJMPB-02-2016-0017
Daoud, J. (2017). Multicollinearity and regression analysis. Journal of Physics:
Conference Series, 949, 1–6. doi:10.1088/1742-6596/949/1/012009
Davis, S. A. (2011). Investigating the impact of project managers’ emotional intelligence
on their interpersonal competence. Project Management Journal, 42(4), 37–57.
doi:10.1002/pmj.20247
Denic, N., Moracanin, V., Milic, M., & Nesic, Z. (2014). Risk management in
information system projects. Tehničkivjesnik, 21(6), 1239–1242. Retrieved from
http://www.tehnicki-vjesnik.com
Drob, C., & Zichil, Z. (2013). Overview regarding the main guidelines, standards and
methodologies used in project management. Journal of Engineering Studies and
Research, 19(3), 26–31. Retrieved from http://www.pubs.ub.ro/
Drost, E. A. (2011). Validity and reliability in social science research. Education
Research and Perspectives, 38(1), 105–124. Retrieved from
http://www.erpjournal.net/
Ernst, A. F., & Albers, C. J. (2017). Regression assumptions in clinical psychology
research practice: A systematic review of common misconceptions. PEER J, 1–
16. doi:10.7717/peerj.3323
Ekrot, B., Kock, A., & Gemünden, H. (2016). Retaining project management competence
- Antecedents and consequences. International Journal of Project Management,
34(2016), 145–157. doi:10.1016/j.ijproman.2015.10.010
87
ESI International. (2013). ESI Annual Salary Survey. Retrieved from http://www.esi-
intl.com/~/media/files/public-site/us/research-reports/esi-2013-project-manager-
salary-and-development-survey
Frankfort-Nachmias, C., & Nachmias, D. (1996). Research methods in the social sciences
(5th ed.). New York, NY: St. Martin’s Press.
Frankfort-Nachmias, C., Nachmias, D., & DeWaard, J. (2015). Research methods in the
social sciences (8th ed.). New York, NY: Worth.
Florentine, S. (2014, March). Shortage of project managers sends businesses scrambling.
CIO Magazine. Retrieved from http://www.cio.com/article/2377811/careers-
staffing/shortage-of-project-managers-sends-businesses-scrambling.html
Geithner, S., & Menzel, D. (2016). Effectiveness of learning through experience and
reflection in a project management simulation. Simulation & Gaming, 47(2) 228–
256. doi:10.1177/1046878115624312
Gemünden, H. G. (2014). Project management as a behavioral discipline and as driver of
productivity and innovations. Project Management Journal, 45(6), 2–6.
doi:10.1002/pmj.21466
Gewanial, C., & Bekker, M. (2015). Project manager attributes influencing project
success in the South African construction industry. Acta Structilia, 22(1), 33–47.
Retrieved from http://apps.ufs.ac.za/kovsiejournals/default.aspx?journal=12
Gliem, J., & Gliem, R. (2003, October). Calculating, interpreting and reporting
Cronbach’s alpha reliability coefficient for Likert-type scales. Paper presented at
the proceedings of the Midwest research to practice conference in adult,
88
continuing and community education, Columbus, OH.
Gomes, R. M. (2013). Contributions of the PMBok to the project management of an ERP
system implementation. Revista de Gestão e Projetos, 4(2), 153–162.
doi:10.5585/gep.v4i2.37
Hadad, Y., Keren, B., & Laslo, Z. (2013). A decision-making support system module for
project manager selection according to past performance. International Journal of
Project Management, 31(4), 532–541. doi:10.1016/j.ijproman.2012.10.004
Hae-Young, K. (2013). Statistical notes for clinical researchers: Assessing normal
distribution (2) using skewness and kurtosis. Restorative Dentistry &
Endodontics, 1(52), 52–54. doi:10.5395/rde.2013.38.1.52
Hae-Young, K. (2015). Statistical notes for clinical researchers: Type I and type II errors
in statistical decision. Restorative Dentistry & Endodontics, 40(3), 249–252.
doi:10.5395/rde.2015.40.3.249
Hamilton, V., Matthews, J., & Crawford, S. (2015). Development and preliminary
validation of a parenting self-regulation scale: “Me as a parent.” Journal of Child
& Family Studies, 24(10), 2853–2864. doi:10.1007/s10826-014-0089-z
Huff, R. A., & Prybutok, V. R. (2008). Information systems project management decision
making: The influence of experience and risk propensity. Project Management
Journal, 39(2), 34–47. doi:10.1002/pmj.20050
Hwang, B., & Lim, E. J. (2013). Critical success factors for key project players and
objectives: Case study of Singapore. Journal of Construction Engineering &
Management, 139(2), 204–215. doi:10.1061/(ASCE)CO.1943-7862.0000597
89
Ika, L., & Hodgson, D. (2014). Learning from international development projects:
Blending critical project studies and critical development studies. International
Journal of Project Management, 32(7), 1182–1196.
doi:10.1016/j.ijproman.2014.01.004
Ineson, E. M., Jung, T., Hains, C., & Kim, M. (2013). The influence of prior subject
knowledge, prior ability and work experience on self-efficacy. Journal of
Hospitality, Leisure, Sport & Tourism Education, 12(1), 59–69.
doi:10.1016/j.jhlste.2012.11.002
Itegi, F. M. (2015). Improving organization performance: Project management approach
sustainable development in face of globalization. Journal of Entrepreneurship
and Organization Management, 4(3), 1–6. doi:10.4172/2169-026X.1000155
Kamohi, L., & Autram, J. (2014). The effect of self-efficacy improvement on the
effectiveness of project managers in contemporary organisations. Journal of
Leadership and Management Studies, 1(1), 37–46.
doi:10.13189/ujm.2017.050805
Kantar, Y. M. (2016). Estimating variances in weighted least-squares estimation of
distributional parameters. Mathematical & Computational Applications, 21(2), 1–
13. doi:10.3390/mca21020007
Kraha, A., Turner, H., Nimon, K., Zientek, L., & Henson, R. (2012). Tools to support
interpreting multiple regression in the face of multicollinearity. Frontiers in
Psychology, 3(44), 1–16. doi:10.3389/fpsyg.2012.00044
Lloyd-Walker, B., French, E., & Crawford, L. (2016). Rethinking researching project
90
management. International Journal of Managing Projects in Business, 9(4), 903–
930. doi:10.1108/IJMPB-04-2016-0033
Liebowitz, J. (2015). IT project failures: What management can learn. IT Professional
Magazine, 17(6), 8–9. doi:10.1109/MITP.2015.110
Martins, M., Costa, J., & Onofre, M. (2015). Practicum experiences as sources of pre-
service teachers’ self-efficacy. European Journal of Teacher Education, 38(2),
263–279. doi:10.1080/02619768.2014.968705
Mayya, S., Monteiro, A., & Ganapathy, S. (2017). Types of biological variables. Journal
of Thoracic disease, 9(6), 1730–1733. doi:10.21037/jtd.2017.05.75
Md Nasir, M., Sahibuddin, S., Ahmad, R., & Fauzi, S. (2015). How the PMBOK
addresses critical success factors for software projects: A multi-round Delphi
study. Journal of Software, 10(11), 1283–1300. doi:10.17706/jsw.10.11.1283–
1300
Meysamie, A., Taee, F., Mohammadi-Vajari, M., Yoosefi-Khanghah, S., Emamzadeh-
Fard, S., & Abbassi, M. (2014). Sample size calculation on web, can we rely on
the results? Journal of Medical Statistics and Informatics, 2(3), 1–7.
doi:10.7243/2053-7662-2-3
Mir, F. A., & Pinnington, A. H. (2014). Exploring the value of project management:
Linking project management performance and project success. International
Journal of Project Management, 32(2), 202–217.
doi:10.1016/j.ijproman.2013.05.012
Moriarty, B. (2014). Research design and the predictive power of measures of self-
91
efficacy. Issues in Educational Research, 24(1), 55–66. Retrieved from
http://www.iier.org.au/iier.html
Munns, A. K., & Bjeirmi, B. F. (1996). The role of the project management in achieving
project success. International Journal of Project Management, 14(2), 81–87.
doi:10.1016/0263-7863(95)00057-7
Nahod, M., & Radujković, M. M. (2013). The impact of ICB 3.0 competences on project
management success. Procedia - Social and Behavioral Sciences, 74(Selected
papers from the 26th IPMA (International Project Management Association),
World Congress, Crete, Greece, 2012), 244–254.
doi:10.1016/j.sbspro.2013.03.014
Ofori, D. (2014). An exploratory study of project management competency in Ghana.
Journal of African Business, 15(3), 197–210. doi:10.1080/15228916.2014.956644
Patanakul, P. (2014). Managing large-scale IS/IT projects in the public sector: Problems
and causes leading to poor performance. Journal of High Technology
Management Research, 25, 21–35. doi:10.1016/j.hitech.2013.12.004
Peters, M., Potter, C., Kelly, L., & Fitzpatrick, R. (2019). Self-efficacy and health-related
quality of life: A cross-sectional study of primary care patients with multi-
morbidity. Health and Quality of Life Outcomes, 17(1), 1–11.
doi:10.1186/s12955-019-1103-3
Plakhotnik, M. S., Rocco, T. S., & Roberts, N. A. (2011). Development review
integrative literature review, increasing retention and success of first-time
managers: A model of three integral processes for the transition to management.
92
Human Resource Development Review, 10(1), 26–45.
doi:10.1177/1534484310386752
Pollack, J. & Adler, D. (2014). Does project management affect business productivity:
Evidence from Australian small to medium enterprises. Project Management
Journal, 45(6), 17-24. doi:10.1002/pmj.21459
Pollack, J., Helm, J., & Adler, D. (2018). What is the Iron Triangle, and how has it
changed? International Journal of Managing Projects in Business, 11(2), 527–
547. doi:10.1108/IJMPB-09-2017-0107
Pressman, R. (1998). Fear of trying: the plight of rookie project managers. IEEE
Software, (1), 50. doi:10.1109/52.646881
Project Management Institute. (2013). A guide to the project management body of
knowledge (PMBOK guide) (5th ed.). Newtown Square, PA: Project Management
Institute, Inc.
Project Management Institute. (2015). Capturing the value of project management.
Retrieved from https://www.pmi.org/~/media/PDF/learning/pulse-of-the-
profession-2015.ashx
Ramazani, J., & Jergeas, G. (2015). Project managers and the journey from good to great:
The benefits of investment in project management training and education.
International Journal of Project Management, 33(1), 41–52.
doi:10.1016/j.ijproman.2014.03.012
Ramos, P., & Mota, C. (2014). Perceptions of success and failure factors in information
technology projects: A study from Brazilian companies. Procedia - Social and
93
Behavioral Sciences, 119(Selected papers from the 27th IPMA (International
Project Management Association), World Congress, Dubrovnik, Croatia, 2013),
349–357. doi:10.1016/j.sbspro.2014.03.040
Rea, L. M., & Parker, R. A. (2014). Designing and conducting survey research: A
comprehensive guide (4th ed.). San Francisco, CA: John Wiley and Sons, Inc.
Rubin, I. M., & Seeling, W. (1967). Experience as a factor in the selection and
performance of project managers. IEEE Transactions of Engineering
Management, 14 (3), 131–134. doi:10.1109/TEM.1967.6448338
Rugenyi, F. (2016). Assessment of the influence of project management competence on
the triple constraint in projects in Nairobi. International Journal of Academic
Research in Business and Social Sciences, 6(4), 295–209.
doi:10.6007/IJARBSS/v6-i4/2108
Sadeghi, H., Mousakhani, M., Yazdani, M., & Delavari, M. (2014). Evaluating project
managers by an interval decision-making method based on a new project manager
competency model. Arabian Journal for Science & Engineering, 39(2), 1417–
1430. doi:10.1007/s13369-013-0631-0
Serrador, P., & Turner, J. (2014). The relationship between project success and project
efficiency. Procedia - Social and Behavioral Sciences, 119, 75–84.
doi:10.1016/j.sbspro.2014.03.011
Silva de Araújo, C., & Pedron, C. (2015). IT project manager competencies and IT
project success: A qualitative study. Organisational Project Management, 2(1),
53–75. doi:10.5130/opm.v2i1.4142
94
Sivrikaya, M. (2018). The role of self-efficacy on performance of sports skills of football
players. Journal of Education and Training Studies, 6(12), 75–79.
doi:10.11114/jets.v6i12a.3952
Sousa, V., Driessnack, M., & Mendes, I. (2007). An overview of research designs
relevant to nursing, part 1: Quantitative research designs. Revista Latino-
Americana De Enfermagem, 15(3), 502–507. doi:10.1590/S0104-
11692007000300022
Sprouse, L. (2010). The influence of the efficacy of the program management office on
the IT project success (Doctoral Dissertation). Retrieved from:
http://www.pmi.org/~/media/PDF/Surveys/Lore%20Sprouse%20Dissertation.ash
x
Standish Group. (2014). Standish group report: Chaos. Retrieved from
https://www.projectsmart.co.uk/white-papers/chaos-report.pdf
Suen, L. W., Huang, H., & Lee, H. (2014). A comparison of convenience sampling and
purposive sampling. The Journal of Nursing, 61(3), 105–111.
doi:10.6224/JN.61.3.105
Sukhee A., & Jiwon, O. (2018). Relationships among knowledge, self-efficacy, and
health behavior of osteoporosis and fall prevention in old aged women. Korean
Journal of Women Health Nursing, 24(2), 209–218.
doi:10.4069/kjwhn.2018.24.2.209
Thi, C., & Swierczek, F. (2010). Critical success factors in project management:
implication from Vietnam. Asia Pacific Business Review, 16(4), 567–589.
95
doi:10.1080/13602380903322957
Tellez, A., Garcia, C., & Corral-Verdugo, V. (2015). Effect size, confidence intervals and
statistical power in psychological research. Psychology in Russia: State of the Art,
8(3), 27–47. doi:10.11621/pir.2015.0303
Varajão, J., Colomo-Palacios, R., & Silva, H. (2017). ISO 21500:2012 and PMBoK 5
processes in information systems project management. Computer Standards &
Interfaces, 50, 216–222. doi:10.1016/j.csi.2016.09.007
Warner, C., Appenzeller, G., Grieger, T., Belenkiy, S., Breitbach, J., Parker, J., & Hoge,
C. (2011). Importance of anonymity to encourage honest reporting in mental
health screening after combat deployment. Archives of General Psychiatry, 68,
1065–1071. doi:10.1001/archgenpsychiatry.2011.112
Wood, R., & Bandura, A. (1989). Social cognitive theory of organizational management.
Academy of Management Review, 14(3), 361–384.
doi:10.5465/AMR.1989.4279067
Zhou, Q. M., Song, P. X. K., & Thompson, M. E. (2015). Profiling heteroscedasticity in
linear regression models. Canadian Journal of Statistics, 43(3), 358–377.
doi:10.1002/cjs.11252
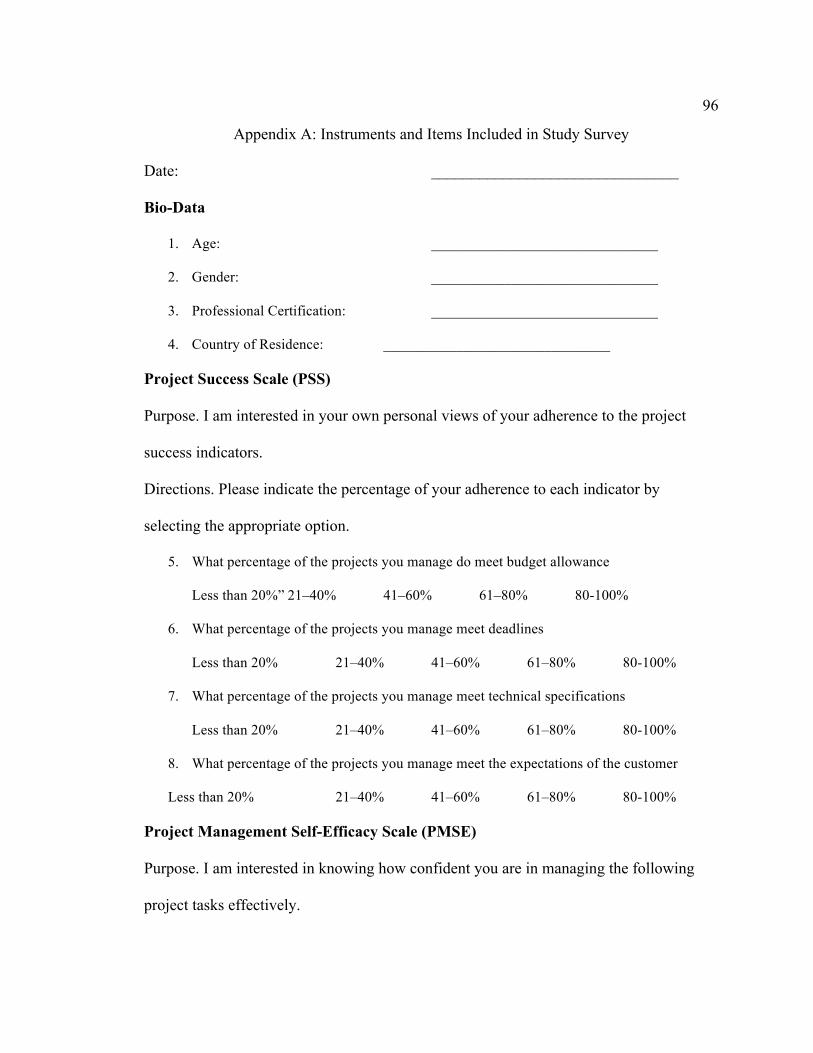
96
Appendix A: Instruments and Items Included in Study Survey
Date: _______________________________
Bio-Data
1. Age: _______________________________
2. Gender: _______________________________
3. Professional Certification: _______________________________
4. Country of Residence: _______________________________
Project Success Scale (PSS)
Purpose. I am interested in your own personal views of your adherence to the project
success indicators.
Directions. Please indicate the percentage of your adherence to each indicator by
selecting the appropriate option.
5. What percentage of the projects you manage do meet budget allowance
Less than 20%” 21–40% 41–60% 61–80% 80-100%
6. What percentage of the projects you manage meet deadlines
Less than 20% 21–40% 41–60% 61–80% 80-100%
7. What percentage of the projects you manage meet technical specifications
Less than 20% 21–40% 41–60% 61–80% 80-100%
8. What percentage of the projects you manage meet the expectations of the customer
Less than 20% 21–40% 41–60% 61–80% 80-100%
Project Management Self-Efficacy Scale (PMSE)
Purpose. I am interested in knowing how confident you are in managing the following
project tasks effectively.
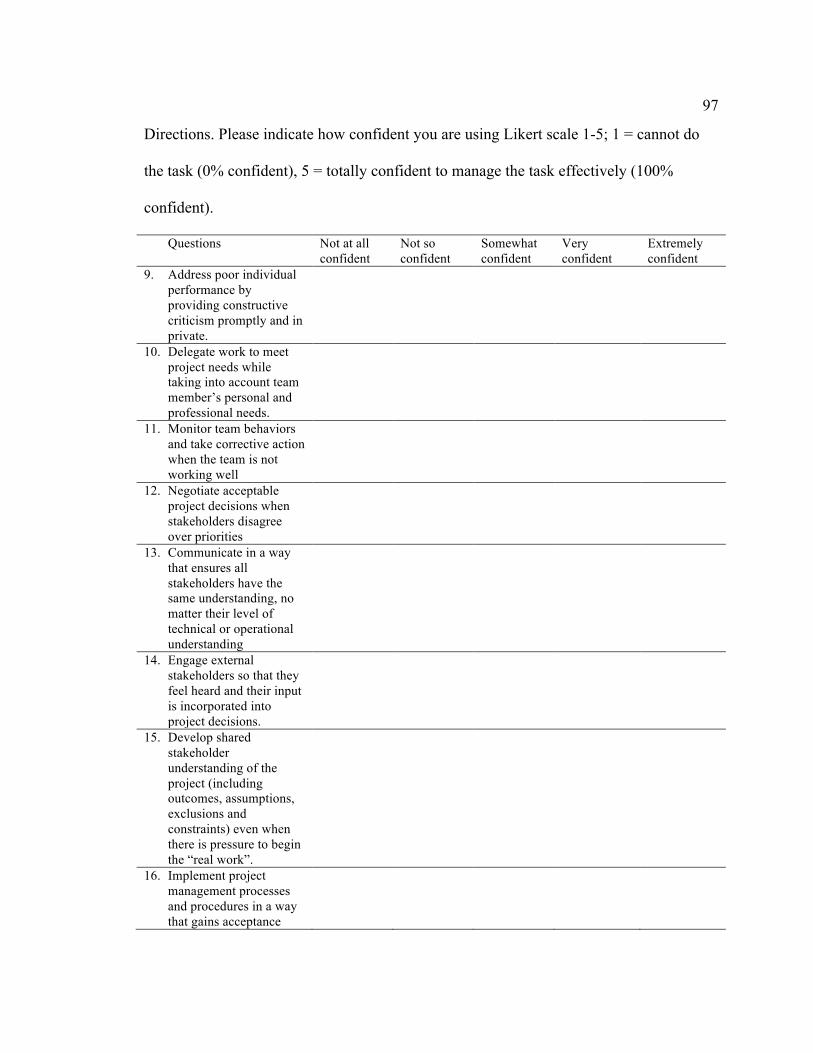
97
Directions. Please indicate how confident you are using Likert scale 1-5; 1 = cannot do
the task (0% confident), 5 = totally confident to manage the task effectively (100%
confident).
Questions Not at all confident
Not so confident
Somewhat confident
Very confident
Extremely confident
9. Address poor individual performance by providing constructive criticism promptly and in private.
10. Delegate work to meet project needs while taking into account team member’s personal and professional needs.
11. Monitor team behaviors and take corrective action when the team is not working well
12. Negotiate acceptable project decisions when stakeholders disagree over priorities
13. Communicate in a way that ensures all stakeholders have the same understanding, no matter their level of technical or operational understanding
14. Engage external stakeholders so that they feel heard and their input is incorporated into project decisions.
15. Develop shared stakeholder understanding of the project (including outcomes, assumptions, exclusions and constraints) even when there is pressure to begin the “real work”.
16. Implement project management processes and procedures in a way that gains acceptance
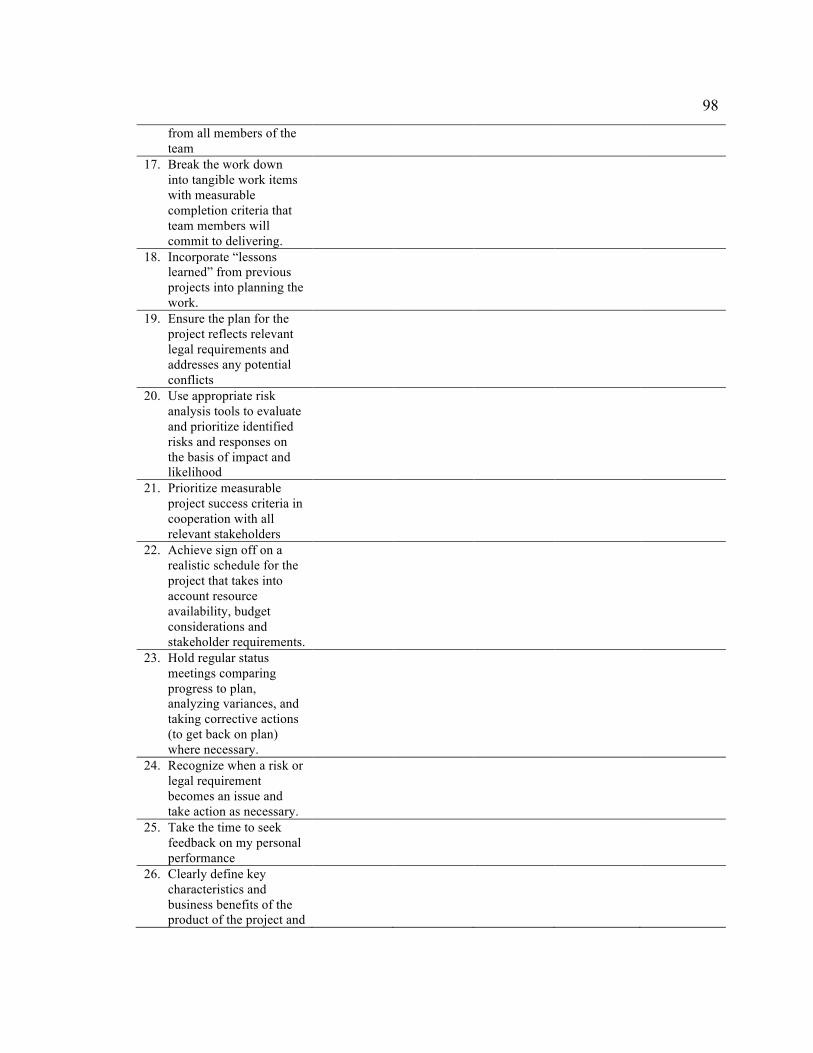
98
from all members of the team
17. Break the work down into tangible work items with measurable completion criteria that team members will commit to delivering.
18. Incorporate “lessons learned” from previous projects into planning the work.
19. Ensure the plan for the project reflects relevant legal requirements and addresses any potential conflicts
20. Use appropriate risk analysis tools to evaluate and prioritize identified risks and responses on the basis of impact and likelihood
21. Prioritize measurable project success criteria in cooperation with all relevant stakeholders
22. Achieve sign off on a realistic schedule for the project that takes into account resource availability, budget considerations and stakeholder requirements.
23. Hold regular status meetings comparing progress to plan, analyzing variances, and taking corrective actions (to get back on plan) where necessary.
24. Recognize when a risk or legal requirement becomes an issue and take action as necessary.
25. Take the time to seek feedback on my personal performance
26. Clearly define key characteristics and business benefits of the product of the project and
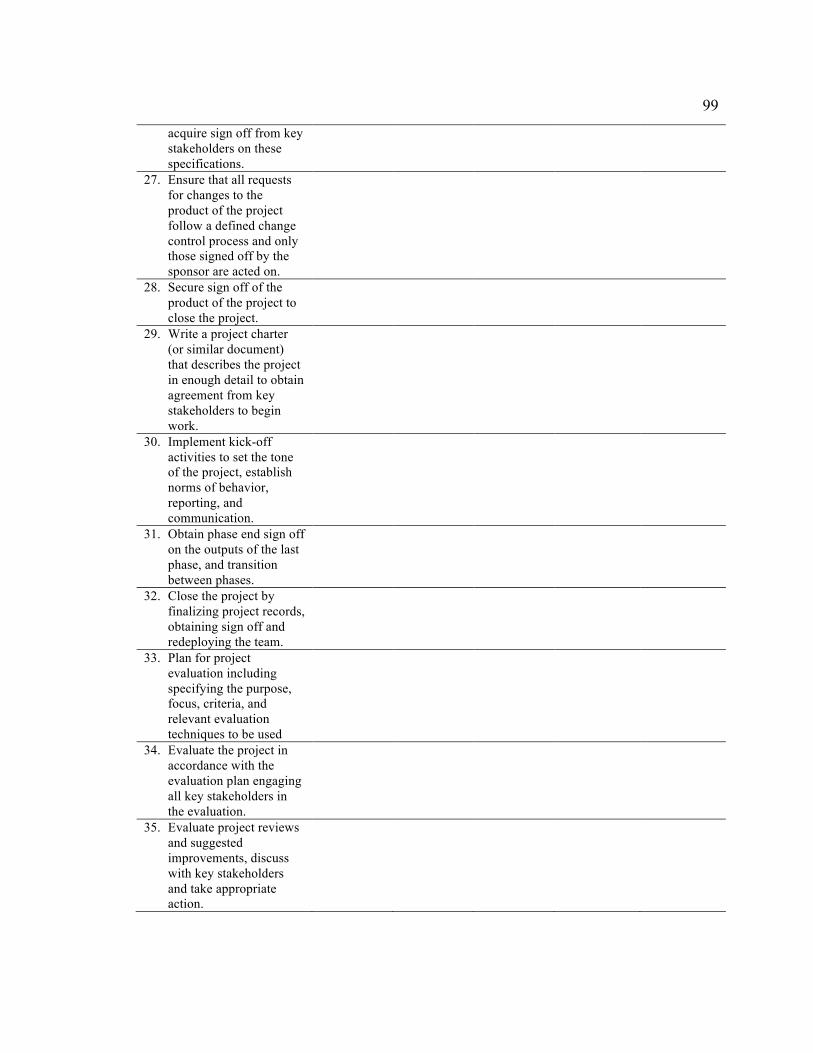
99
acquire sign off from key stakeholders on these specifications.
27. Ensure that all requests for changes to the product of the project follow a defined change control process and only those signed off by the sponsor are acted on.
28. Secure sign off of the product of the project to close the project.
29. Write a project charter (or similar document) that describes the project in enough detail to obtain agreement from key stakeholders to begin work.
30. Implement kick-off activities to set the tone of the project, establish norms of behavior, reporting, and communication.
31. Obtain phase end sign off on the outputs of the last phase, and transition between phases.
32. Close the project by finalizing project records, obtaining sign off and redeploying the team.
33. Plan for project evaluation including specifying the purpose, focus, criteria, and relevant evaluation techniques to be used
34. Evaluate the project in accordance with the evaluation plan engaging all key stakeholders in the evaluation.
35. Evaluate project reviews and suggested improvements, discuss with key stakeholders and take appropriate action.
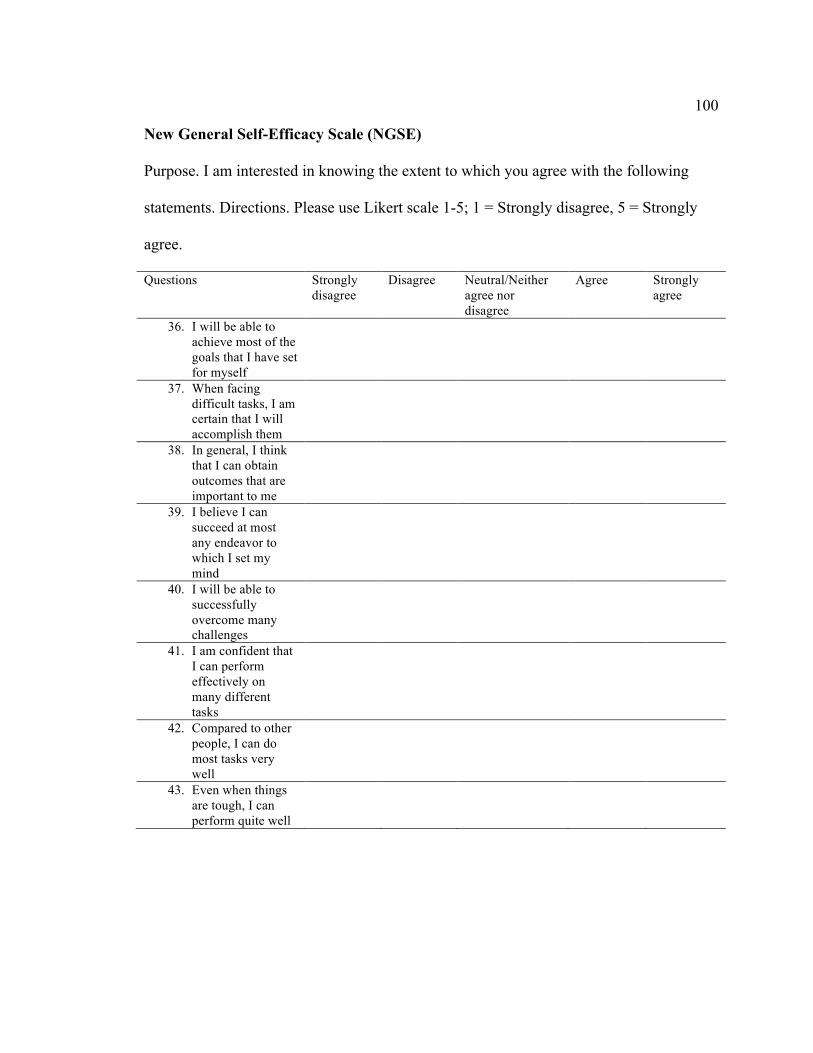
100
New General Self-Efficacy Scale (NGSE)
Purpose. I am interested in knowing the extent to which you agree with the following
statements. Directions. Please use Likert scale 1-5; 1 = Strongly disagree, 5 = Strongly
agree.
Questions Strongly disagree
Disagree Neutral/Neither agree nor disagree
Agree Strongly agree
36. I will be able to achieve most of the goals that I have set for myself
37. When facing difficult tasks, I am certain that I will accomplish them
38. In general, I think that I can obtain outcomes that are important to me
39. I believe I can succeed at most any endeavor to which I set my mind
40. I will be able to successfully overcome many challenges
41. I am confident that I can perform effectively on many different tasks
42. Compared to other people, I can do most tasks very well
43. Even when things are tough, I can perform quite well
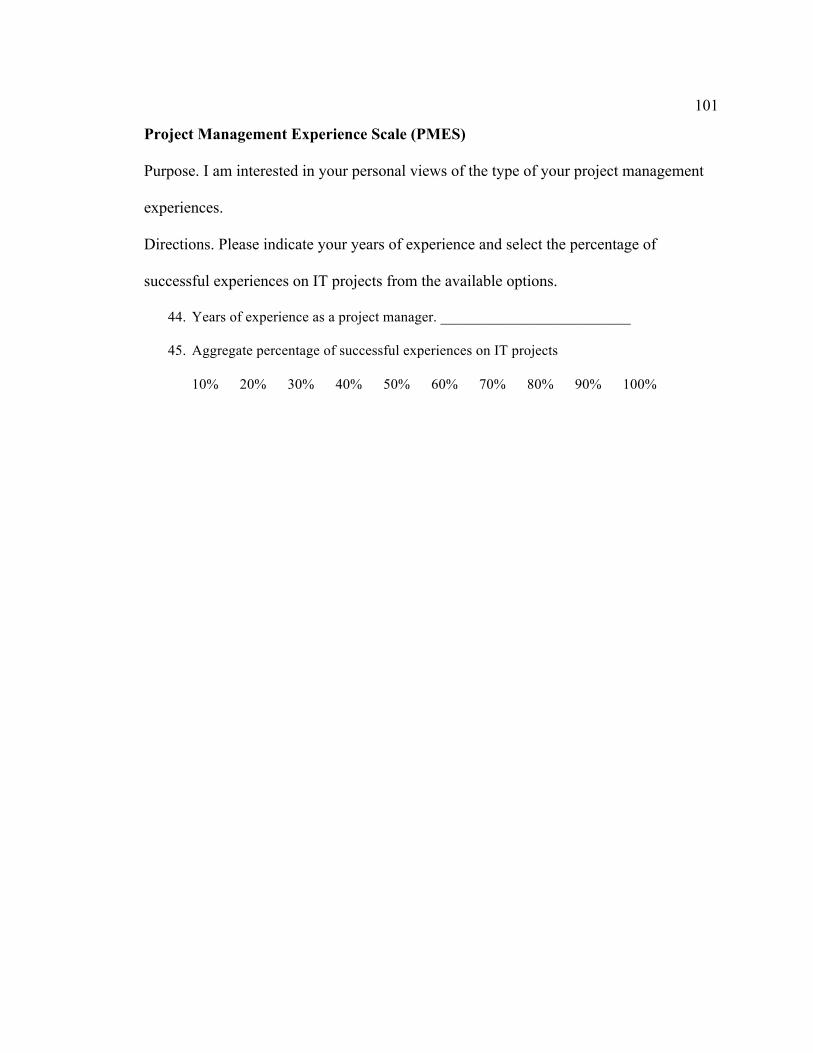
101
Project Management Experience Scale (PMES)
Purpose. I am interested in your personal views of the type of your project management
experiences.
Directions. Please indicate your years of experience and select the percentage of
successful experiences on IT projects from the available options.
44. Years of experience as a project manager. __________________________
45. Aggregate percentage of successful experiences on IT projects
10% 20% 30% 40% 50% 60% 70% 80% 90% 100%
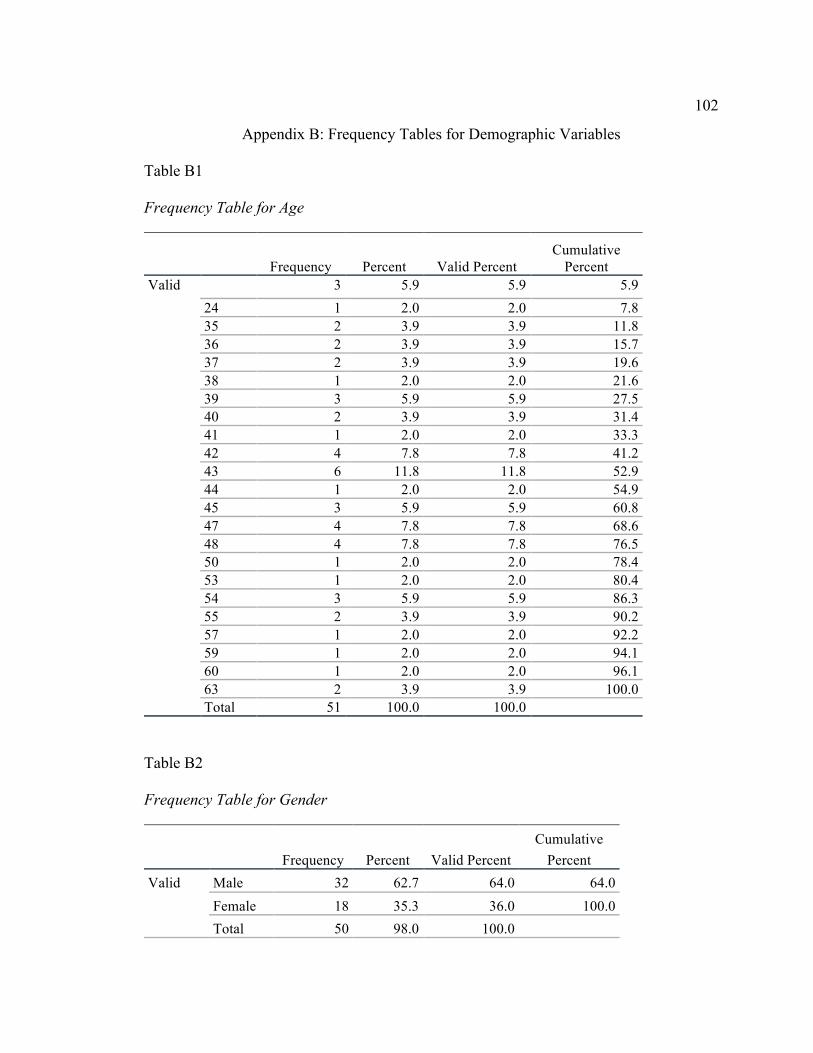
102
Appendix B: Frequency Tables for Demographic Variables
Table B1
Frequency Table for Age
Frequency Percent Valid Percent Cumulative
Percent Valid 3 5.9 5.9 5.9
24 1 2.0 2.0 7.8 35 2 3.9 3.9 11.8 36 2 3.9 3.9 15.7 37 2 3.9 3.9 19.6 38 1 2.0 2.0 21.6 39 3 5.9 5.9 27.5 40 2 3.9 3.9 31.4 41 1 2.0 2.0 33.3 42 4 7.8 7.8 41.2 43 6 11.8 11.8 52.9 44 1 2.0 2.0 54.9 45 3 5.9 5.9 60.8 47 4 7.8 7.8 68.6 48 4 7.8 7.8 76.5 50 1 2.0 2.0 78.4 53 1 2.0 2.0 80.4 54 3 5.9 5.9 86.3 55 2 3.9 3.9 90.2 57 1 2.0 2.0 92.2 59 1 2.0 2.0 94.1 60 1 2.0 2.0 96.1 63 2 3.9 3.9 100.0 Total 51 100.0 100.0
Table B2
Frequency Table for Gender
Frequency Percent Valid Percent Cumulative
Percent Valid Male 32 62.7 64.0 64.0
Female 18 35.3 36.0 100.0 Total 50 98.0 100.0
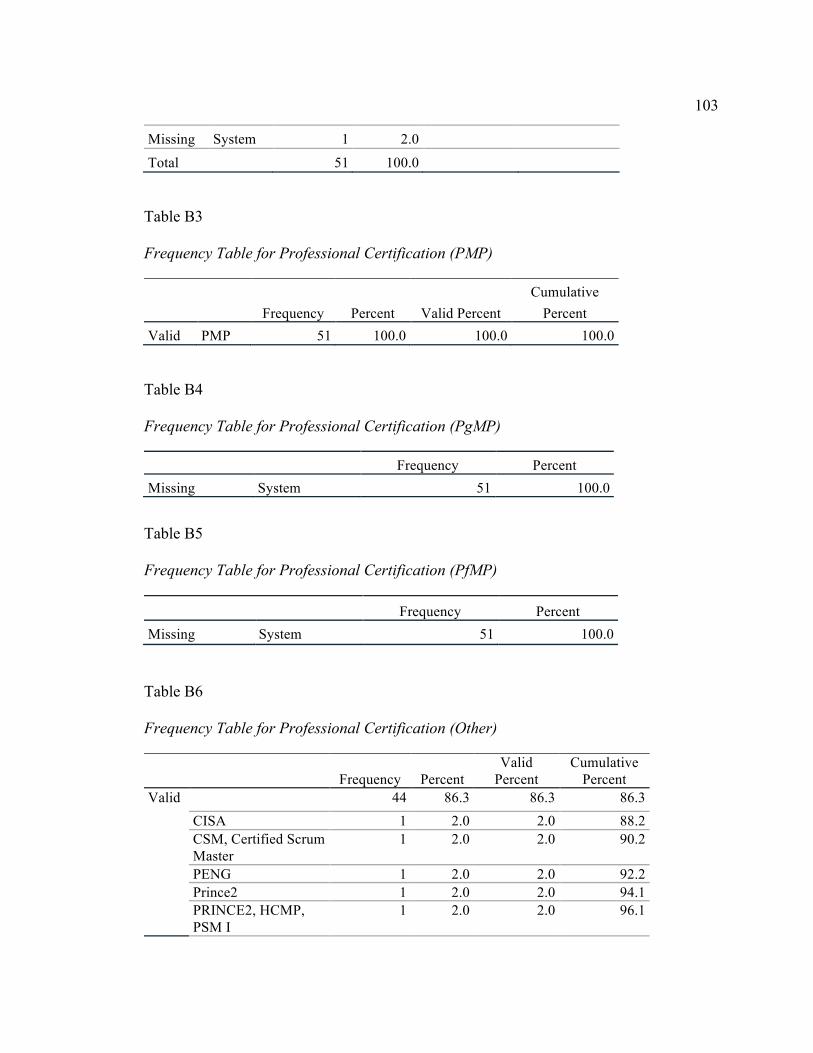
103
Missing System 1 2.0
Total 51 100.0
Table B3
Frequency Table for Professional Certification (PMP)
Frequency Percent Valid Percent Cumulative
Percent Valid PMP 51 100.0 100.0 100.0
Table B4
Frequency Table for Professional Certification (PgMP)
Frequency Percent Missing System 51 100.0
Table B5
Frequency Table for Professional Certification (PfMP)
Frequency Percent Missing System 51 100.0
Table B6
Frequency Table for Professional Certification (Other)
Frequency Percent Valid
Percent Cumulative
Percent Valid 44 86.3 86.3 86.3
CISA 1 2.0 2.0 88.2 CSM, Certified Scrum Master
1 2.0 2.0 90.2
PENG 1 2.0 2.0 92.2 Prince2 1 2.0 2.0 94.1 PRINCE2, HCMP, PSM I
1 2.0 2.0 96.1
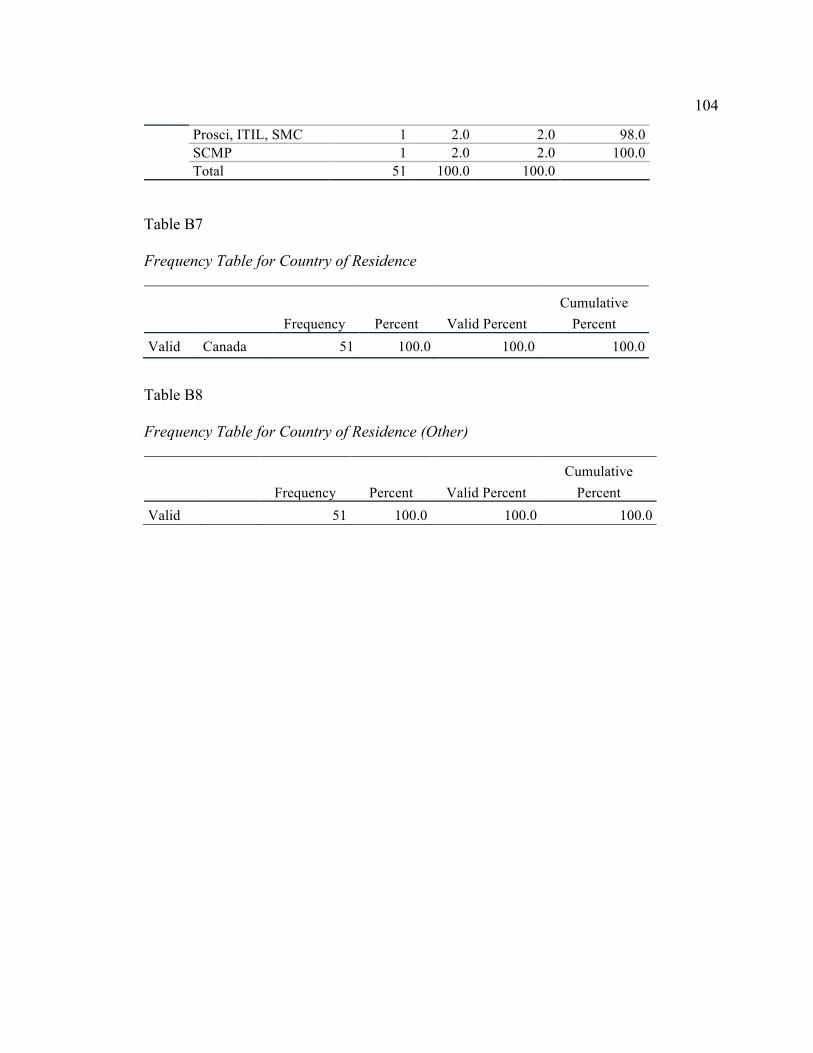
104
Prosci, ITIL, SMC 1 2.0 2.0 98.0 SCMP 1 2.0 2.0 100.0 Total 51 100.0 100.0
Table B7
Frequency Table for Country of Residence
Frequency Percent Valid Percent Cumulative
Percent Valid Canada 51 100.0 100.0 100.0
Table B8
Frequency Table for Country of Residence (Other)
Frequency Percent Valid Percent Cumulative
Percent Valid 51 100.0 100.0 100.0
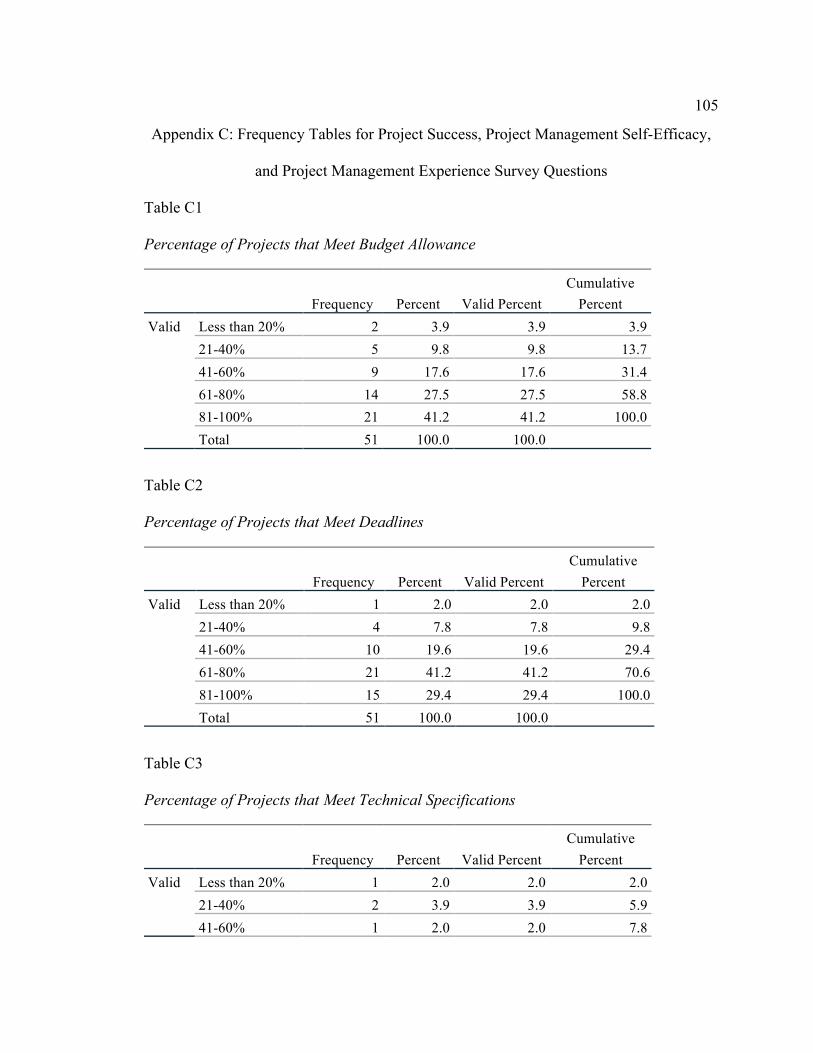
105
Appendix C: Frequency Tables for Project Success, Project Management Self-Efficacy,
and Project Management Experience Survey Questions
Table C1
Percentage of Projects that Meet Budget Allowance
Frequency Percent Valid Percent Cumulative
Percent Valid Less than 20% 2 3.9 3.9 3.9
21-40% 5 9.8 9.8 13.7 41-60% 9 17.6 17.6 31.4 61-80% 14 27.5 27.5 58.8 81-100% 21 41.2 41.2 100.0 Total 51 100.0 100.0
Table C2
Percentage of Projects that Meet Deadlines
Frequency Percent Valid Percent Cumulative
Percent Valid Less than 20% 1 2.0 2.0 2.0
21-40% 4 7.8 7.8 9.8 41-60% 10 19.6 19.6 29.4 61-80% 21 41.2 41.2 70.6 81-100% 15 29.4 29.4 100.0 Total 51 100.0 100.0
Table C3
Percentage of Projects that Meet Technical Specifications
Frequency Percent Valid Percent Cumulative
Percent Valid Less than 20% 1 2.0 2.0 2.0
21-40% 2 3.9 3.9 5.9 41-60% 1 2.0 2.0 7.8
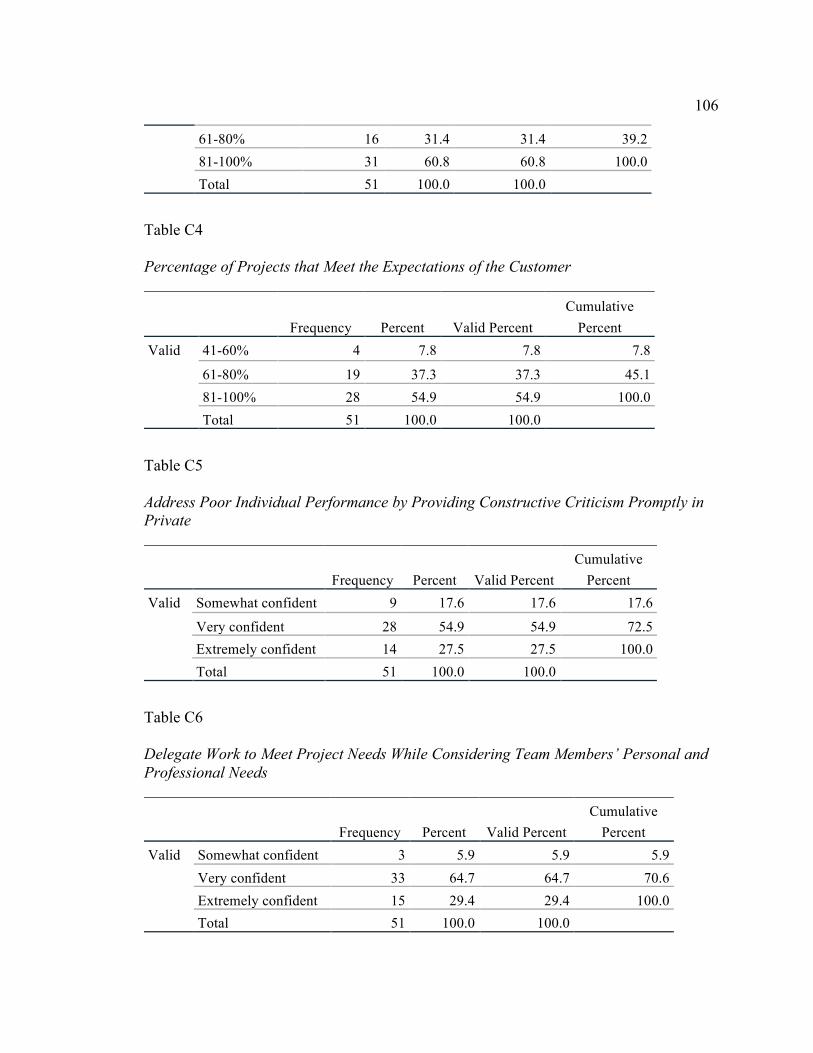
106
61-80% 16 31.4 31.4 39.2 81-100% 31 60.8 60.8 100.0 Total 51 100.0 100.0
Table C4
Percentage of Projects that Meet the Expectations of the Customer
Frequency Percent Valid Percent Cumulative
Percent Valid 41-60% 4 7.8 7.8 7.8
61-80% 19 37.3 37.3 45.1 81-100% 28 54.9 54.9 100.0 Total 51 100.0 100.0
Table C5
Address Poor Individual Performance by Providing Constructive Criticism Promptly in Private
Frequency Percent Valid Percent Cumulative
Percent Valid Somewhat confident 9 17.6 17.6 17.6
Very confident 28 54.9 54.9 72.5 Extremely confident 14 27.5 27.5 100.0 Total 51 100.0 100.0
Table C6
Delegate Work to Meet Project Needs While Considering Team Members’ Personal and Professional Needs
Frequency Percent Valid Percent Cumulative
Percent Valid Somewhat confident 3 5.9 5.9 5.9
Very confident 33 64.7 64.7 70.6 Extremely confident 15 29.4 29.4 100.0 Total 51 100.0 100.0
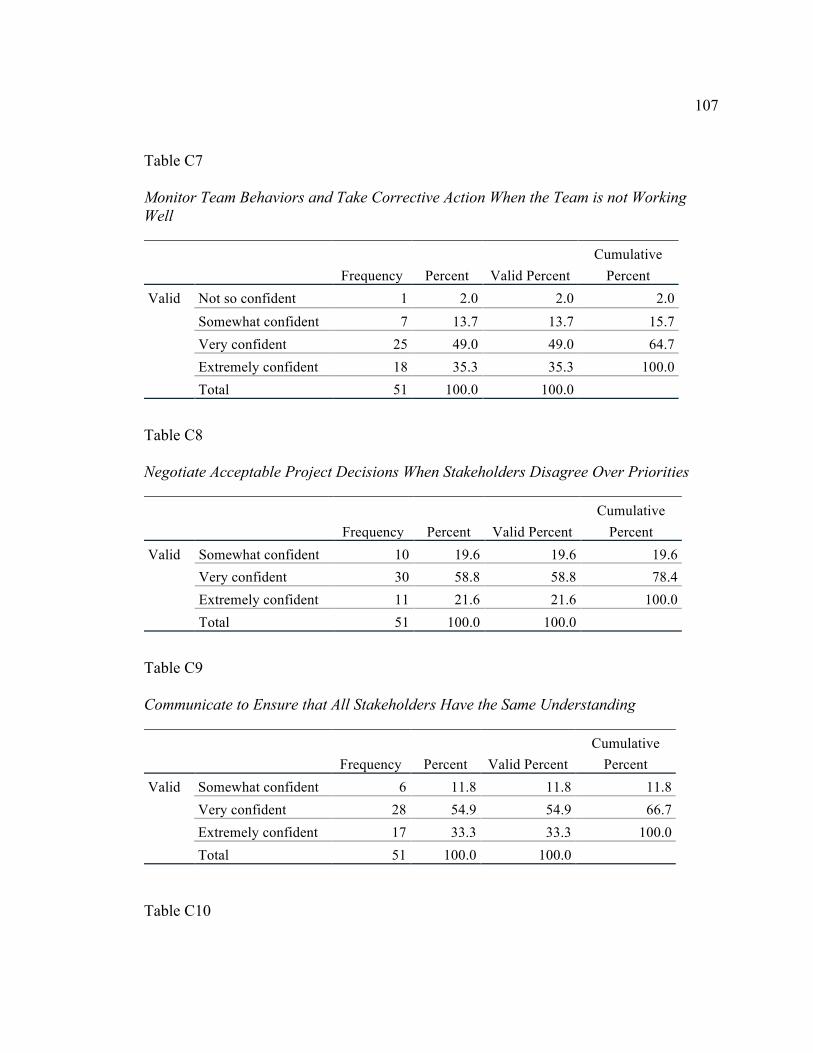
107
Table C7
Monitor Team Behaviors and Take Corrective Action When the Team is not Working Well
Frequency Percent Valid Percent Cumulative
Percent Valid Not so confident 1 2.0 2.0 2.0
Somewhat confident 7 13.7 13.7 15.7 Very confident 25 49.0 49.0 64.7 Extremely confident 18 35.3 35.3 100.0 Total 51 100.0 100.0
Table C8
Negotiate Acceptable Project Decisions When Stakeholders Disagree Over Priorities
Frequency Percent Valid Percent Cumulative
Percent Valid Somewhat confident 10 19.6 19.6 19.6
Very confident 30 58.8 58.8 78.4 Extremely confident 11 21.6 21.6 100.0 Total 51 100.0 100.0
Table C9
Communicate to Ensure that All Stakeholders Have the Same Understanding
Frequency Percent Valid Percent Cumulative
Percent Valid Somewhat confident 6 11.8 11.8 11.8
Very confident 28 54.9 54.9 66.7 Extremely confident 17 33.3 33.3 100.0 Total 51 100.0 100.0
Table C10
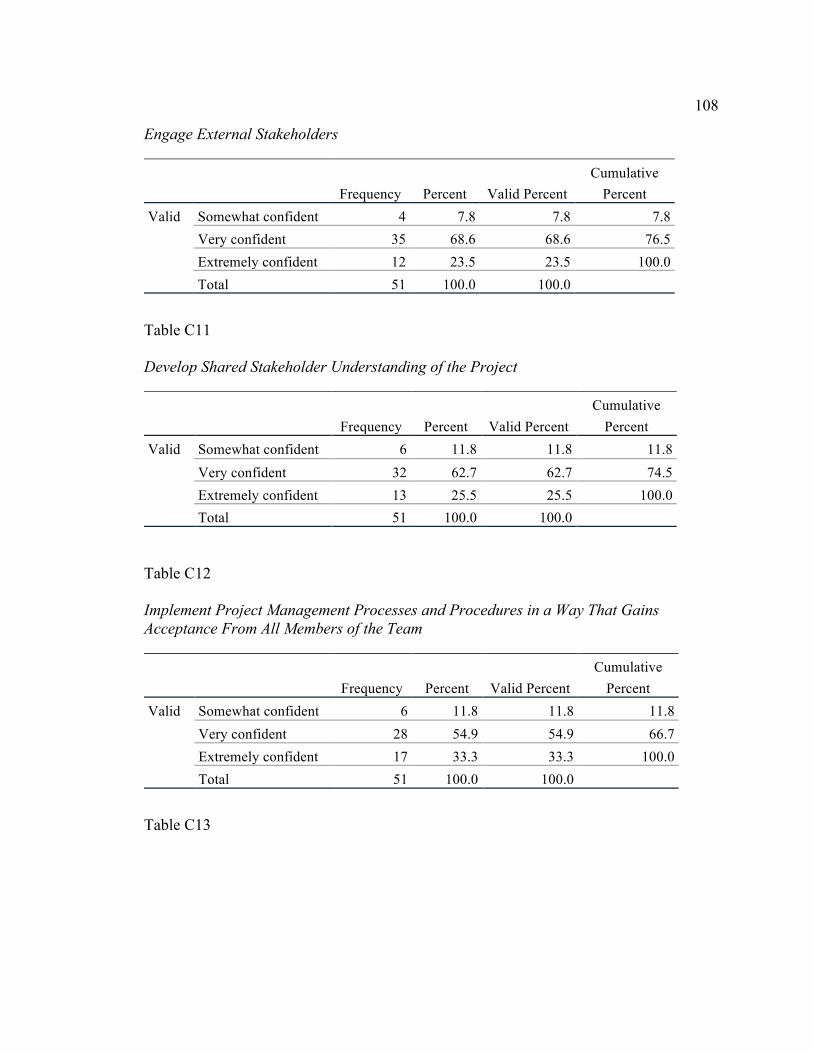
108
Engage External Stakeholders
Frequency Percent Valid Percent Cumulative
Percent Valid Somewhat confident 4 7.8 7.8 7.8
Very confident 35 68.6 68.6 76.5 Extremely confident 12 23.5 23.5 100.0 Total 51 100.0 100.0
Table C11
Develop Shared Stakeholder Understanding of the Project
Frequency Percent Valid Percent Cumulative
Percent Valid Somewhat confident 6 11.8 11.8 11.8
Very confident 32 62.7 62.7 74.5 Extremely confident 13 25.5 25.5 100.0 Total 51 100.0 100.0
Table C12
Implement Project Management Processes and Procedures in a Way That Gains Acceptance From All Members of the Team
Frequency Percent Valid Percent Cumulative
Percent Valid Somewhat confident 6 11.8 11.8 11.8
Very confident 28 54.9 54.9 66.7 Extremely confident 17 33.3 33.3 100.0 Total 51 100.0 100.0
Table C13
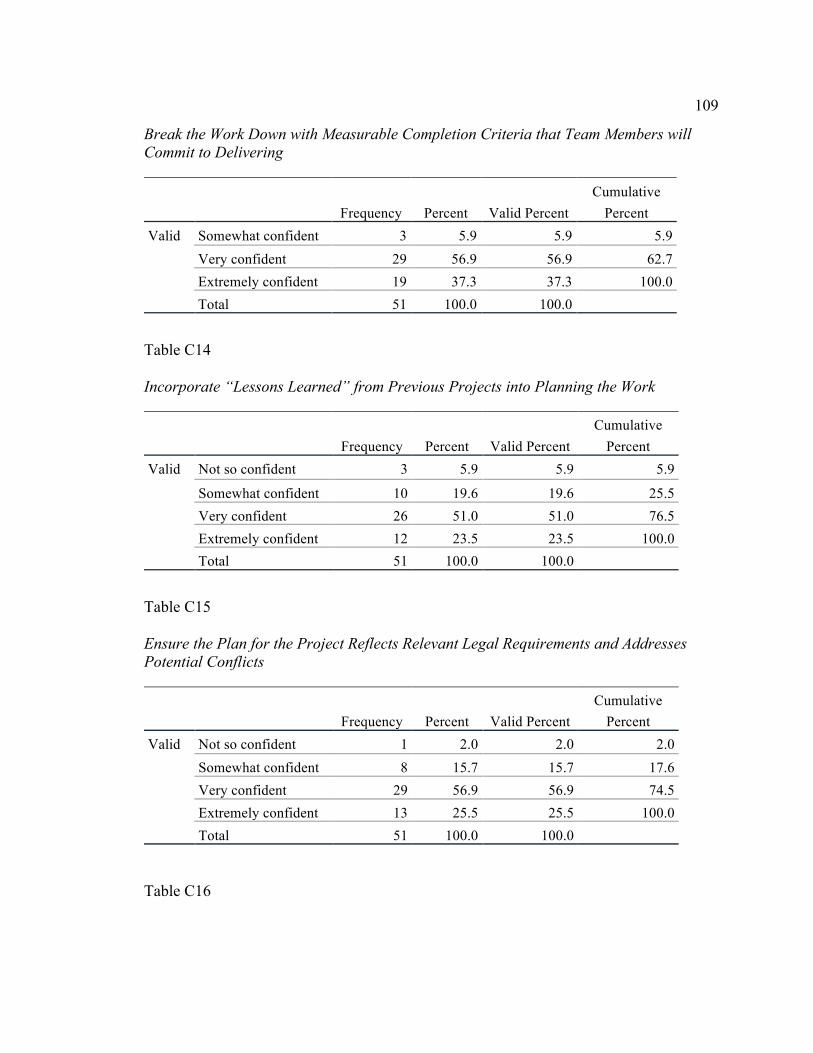
109
Break the Work Down with Measurable Completion Criteria that Team Members will Commit to Delivering
Frequency Percent Valid Percent Cumulative
Percent Valid Somewhat confident 3 5.9 5.9 5.9
Very confident 29 56.9 56.9 62.7 Extremely confident 19 37.3 37.3 100.0 Total 51 100.0 100.0
Table C14
Incorporate “Lessons Learned” from Previous Projects into Planning the Work
Frequency Percent Valid Percent Cumulative
Percent Valid Not so confident 3 5.9 5.9 5.9
Somewhat confident 10 19.6 19.6 25.5 Very confident 26 51.0 51.0 76.5 Extremely confident 12 23.5 23.5 100.0 Total 51 100.0 100.0
Table C15
Ensure the Plan for the Project Reflects Relevant Legal Requirements and Addresses Potential Conflicts
Frequency Percent Valid Percent Cumulative
Percent Valid Not so confident 1 2.0 2.0 2.0
Somewhat confident 8 15.7 15.7 17.6 Very confident 29 56.9 56.9 74.5 Extremely confident 13 25.5 25.5 100.0 Total 51 100.0 100.0
Table C16
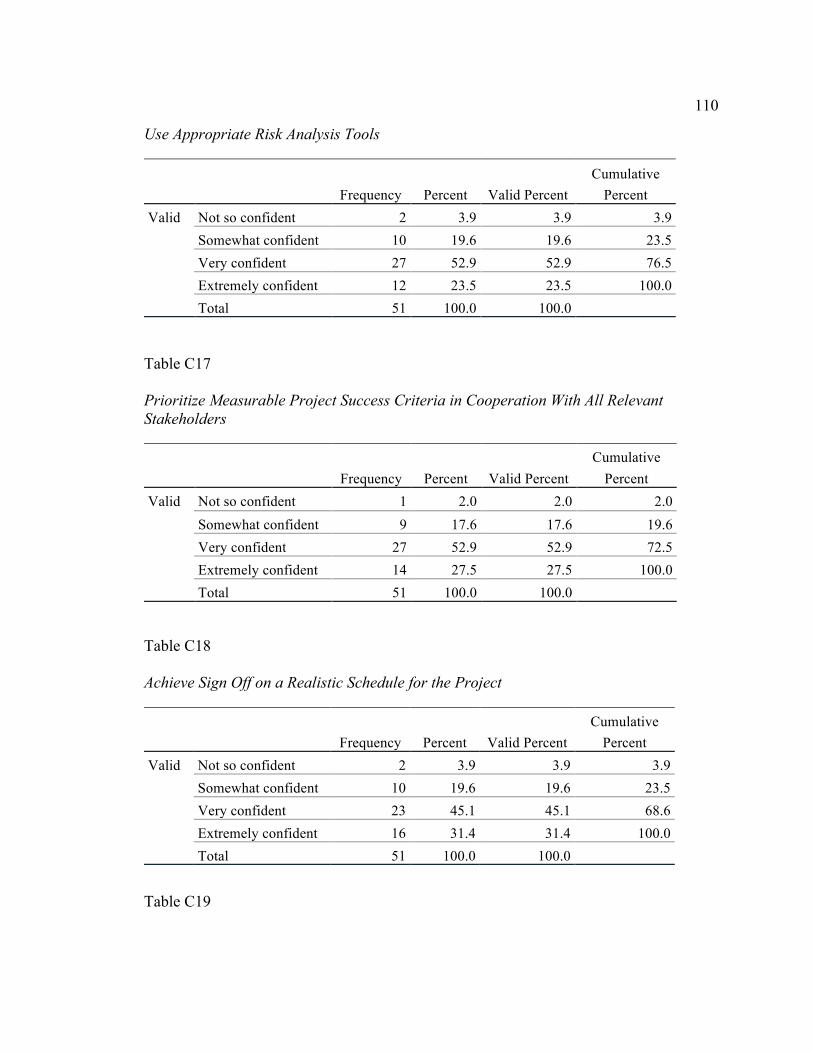
110
Use Appropriate Risk Analysis Tools
Frequency Percent Valid Percent Cumulative
Percent Valid Not so confident 2 3.9 3.9 3.9
Somewhat confident 10 19.6 19.6 23.5 Very confident 27 52.9 52.9 76.5 Extremely confident 12 23.5 23.5 100.0 Total 51 100.0 100.0
Table C17
Prioritize Measurable Project Success Criteria in Cooperation With All Relevant Stakeholders
Frequency Percent Valid Percent Cumulative
Percent Valid Not so confident 1 2.0 2.0 2.0
Somewhat confident 9 17.6 17.6 19.6 Very confident 27 52.9 52.9 72.5 Extremely confident 14 27.5 27.5 100.0 Total 51 100.0 100.0
Table C18
Achieve Sign Off on a Realistic Schedule for the Project
Frequency Percent Valid Percent Cumulative
Percent Valid Not so confident 2 3.9 3.9 3.9
Somewhat confident 10 19.6 19.6 23.5 Very confident 23 45.1 45.1 68.6 Extremely confident 16 31.4 31.4 100.0 Total 51 100.0 100.0
Table C19
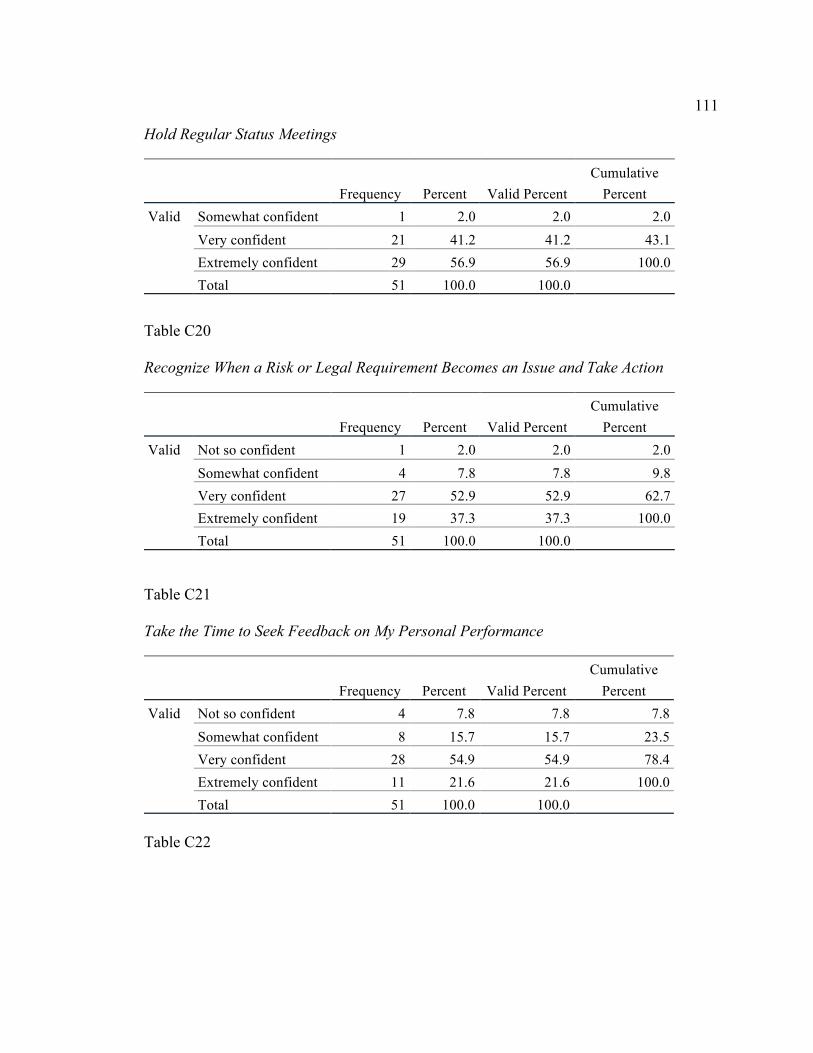
111
Hold Regular Status Meetings
Frequency Percent Valid Percent Cumulative
Percent Valid Somewhat confident 1 2.0 2.0 2.0
Very confident 21 41.2 41.2 43.1 Extremely confident 29 56.9 56.9 100.0 Total 51 100.0 100.0
Table C20
Recognize When a Risk or Legal Requirement Becomes an Issue and Take Action
Frequency Percent Valid Percent Cumulative
Percent Valid Not so confident 1 2.0 2.0 2.0
Somewhat confident 4 7.8 7.8 9.8 Very confident 27 52.9 52.9 62.7 Extremely confident 19 37.3 37.3 100.0 Total 51 100.0 100.0
Table C21
Take the Time to Seek Feedback on My Personal Performance
Frequency Percent Valid Percent Cumulative
Percent Valid Not so confident 4 7.8 7.8 7.8
Somewhat confident 8 15.7 15.7 23.5 Very confident 28 54.9 54.9 78.4 Extremely confident 11 21.6 21.6 100.0 Total 51 100.0 100.0
Table C22
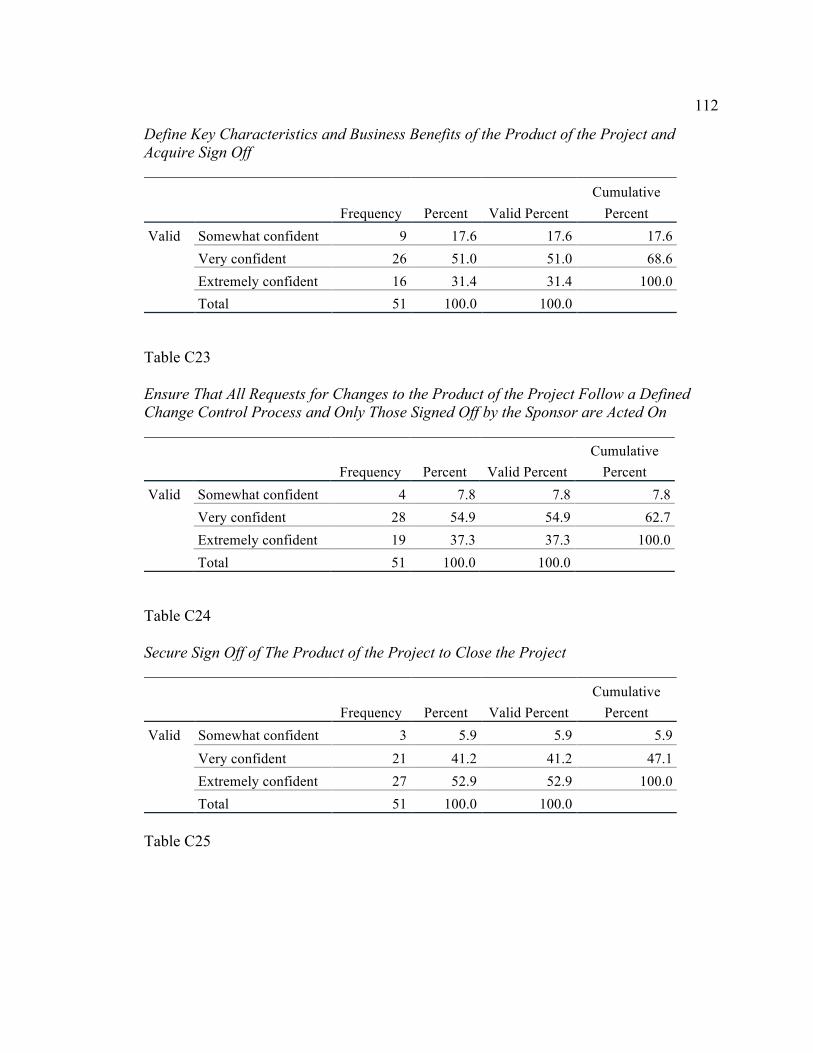
112
Define Key Characteristics and Business Benefits of the Product of the Project and Acquire Sign Off
Frequency Percent Valid Percent Cumulative
Percent Valid Somewhat confident 9 17.6 17.6 17.6
Very confident 26 51.0 51.0 68.6 Extremely confident 16 31.4 31.4 100.0 Total 51 100.0 100.0
Table C23
Ensure That All Requests for Changes to the Product of the Project Follow a Defined Change Control Process and Only Those Signed Off by the Sponsor are Acted On
Frequency Percent Valid Percent Cumulative
Percent Valid Somewhat confident 4 7.8 7.8 7.8
Very confident 28 54.9 54.9 62.7 Extremely confident 19 37.3 37.3 100.0 Total 51 100.0 100.0
Table C24
Secure Sign Off of The Product of the Project to Close the Project
Frequency Percent Valid Percent Cumulative
Percent Valid Somewhat confident 3 5.9 5.9 5.9
Very confident 21 41.2 41.2 47.1 Extremely confident 27 52.9 52.9 100.0 Total 51 100.0 100.0
Table C25
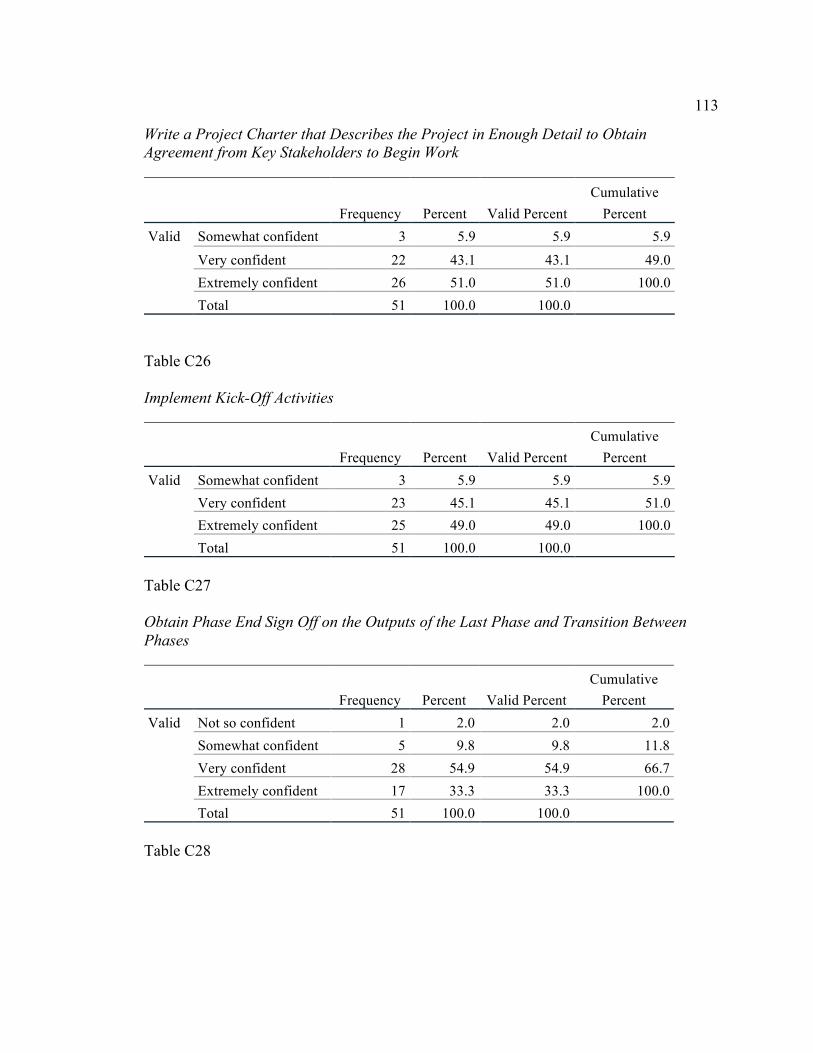
113
Write a Project Charter that Describes the Project in Enough Detail to Obtain Agreement from Key Stakeholders to Begin Work
Frequency Percent Valid Percent Cumulative
Percent Valid Somewhat confident 3 5.9 5.9 5.9
Very confident 22 43.1 43.1 49.0 Extremely confident 26 51.0 51.0 100.0 Total 51 100.0 100.0
Table C26
Implement Kick-Off Activities
Frequency Percent Valid Percent Cumulative
Percent Valid Somewhat confident 3 5.9 5.9 5.9
Very confident 23 45.1 45.1 51.0 Extremely confident 25 49.0 49.0 100.0 Total 51 100.0 100.0
Table C27
Obtain Phase End Sign Off on the Outputs of the Last Phase and Transition Between Phases
Frequency Percent Valid Percent Cumulative
Percent Valid Not so confident 1 2.0 2.0 2.0
Somewhat confident 5 9.8 9.8 11.8 Very confident 28 54.9 54.9 66.7 Extremely confident 17 33.3 33.3 100.0 Total 51 100.0 100.0
Table C28
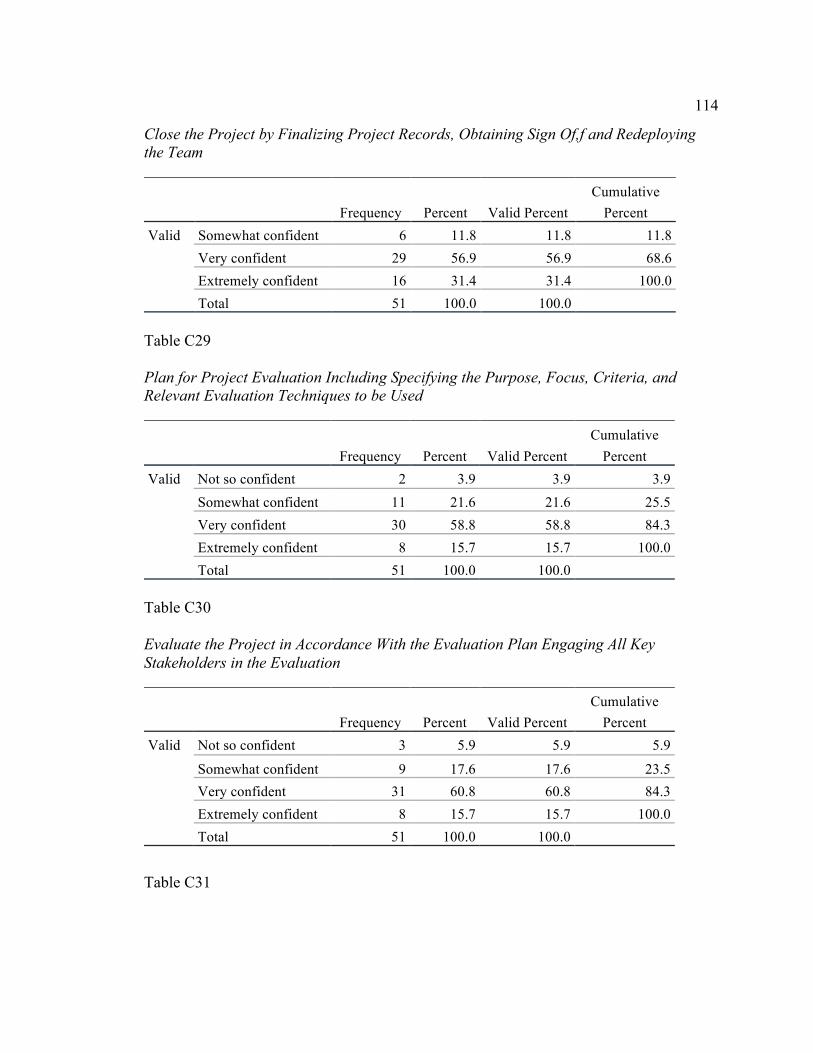
114
Close the Project by Finalizing Project Records, Obtaining Sign Of,f and Redeploying the Team
Frequency Percent Valid Percent Cumulative
Percent Valid Somewhat confident 6 11.8 11.8 11.8
Very confident 29 56.9 56.9 68.6 Extremely confident 16 31.4 31.4 100.0 Total 51 100.0 100.0
Table C29
Plan for Project Evaluation Including Specifying the Purpose, Focus, Criteria, and Relevant Evaluation Techniques to be Used
Frequency Percent Valid Percent Cumulative
Percent Valid Not so confident 2 3.9 3.9 3.9
Somewhat confident 11 21.6 21.6 25.5 Very confident 30 58.8 58.8 84.3 Extremely confident 8 15.7 15.7 100.0 Total 51 100.0 100.0
Table C30
Evaluate the Project in Accordance With the Evaluation Plan Engaging All Key Stakeholders in the Evaluation
Frequency Percent Valid Percent Cumulative
Percent Valid Not so confident 3 5.9 5.9 5.9
Somewhat confident 9 17.6 17.6 23.5 Very confident 31 60.8 60.8 84.3 Extremely confident 8 15.7 15.7 100.0 Total 51 100.0 100.0
Table C31
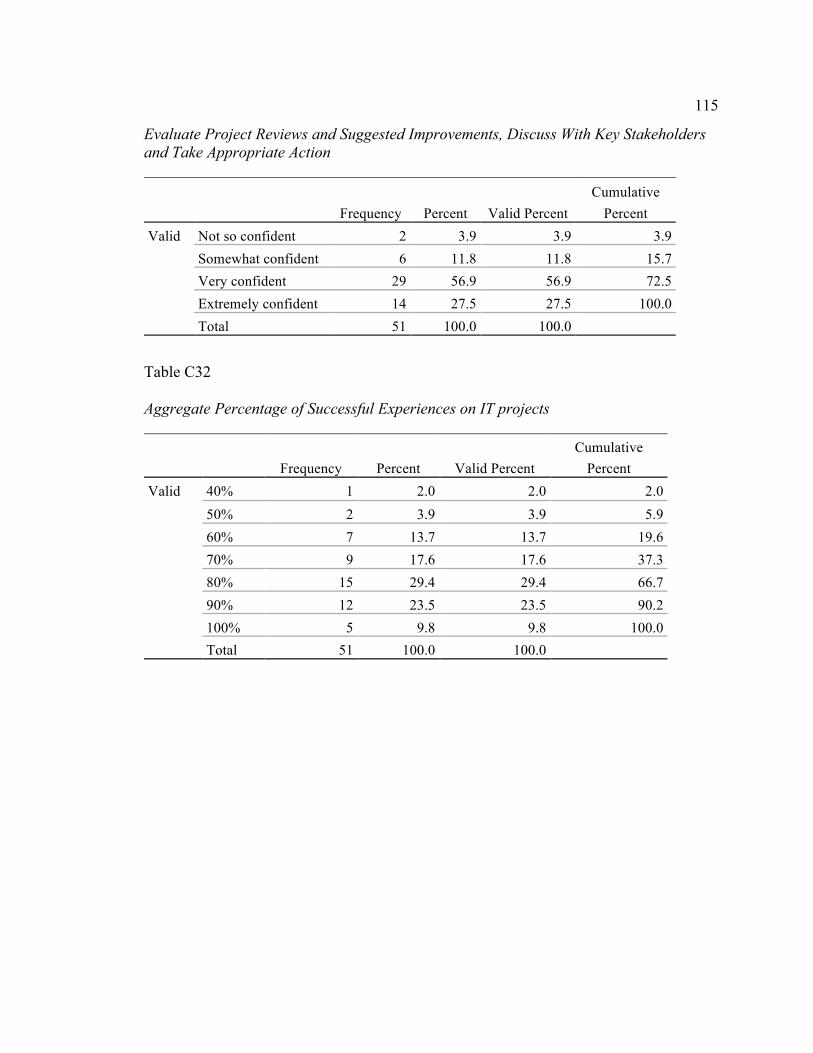
115
Evaluate Project Reviews and Suggested Improvements, Discuss With Key Stakeholders and Take Appropriate Action
Frequency Percent Valid Percent Cumulative
Percent Valid Not so confident 2 3.9 3.9 3.9
Somewhat confident 6 11.8 11.8 15.7 Very confident 29 56.9 56.9 72.5 Extremely confident 14 27.5 27.5 100.0 Total 51 100.0 100.0
Table C32
Aggregate Percentage of Successful Experiences on IT projects
Frequency Percent Valid Percent Cumulative
Percent Valid 40% 1 2.0 2.0 2.0
50% 2 3.9 3.9 5.9 60% 7 13.7 13.7 19.6 70% 9 17.6 17.6 37.3 80% 15 29.4 29.4 66.7 90% 12 23.5 23.5 90.2 100% 5 9.8 9.8 100.0 Total 51 100.0 100.0
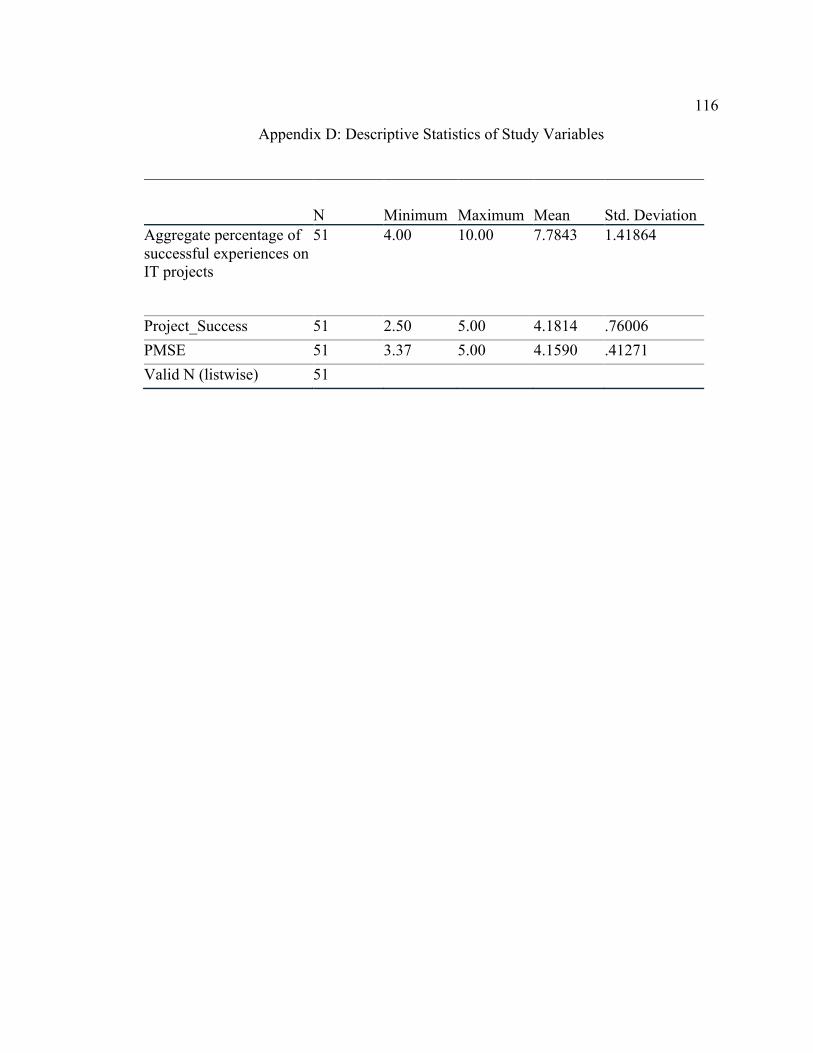
116
Appendix D: Descriptive Statistics of Study Variables
N Minimum Maximum Mean Std. Deviation Aggregate percentage of successful experiences on IT projects
51 4.00 10.00 7.7843 1.41864
Project_Success 51 2.50 5.00 4.1814 .76006 PMSE 51 3.37 5.00 4.1590 .41271 Valid N (listwise) 51
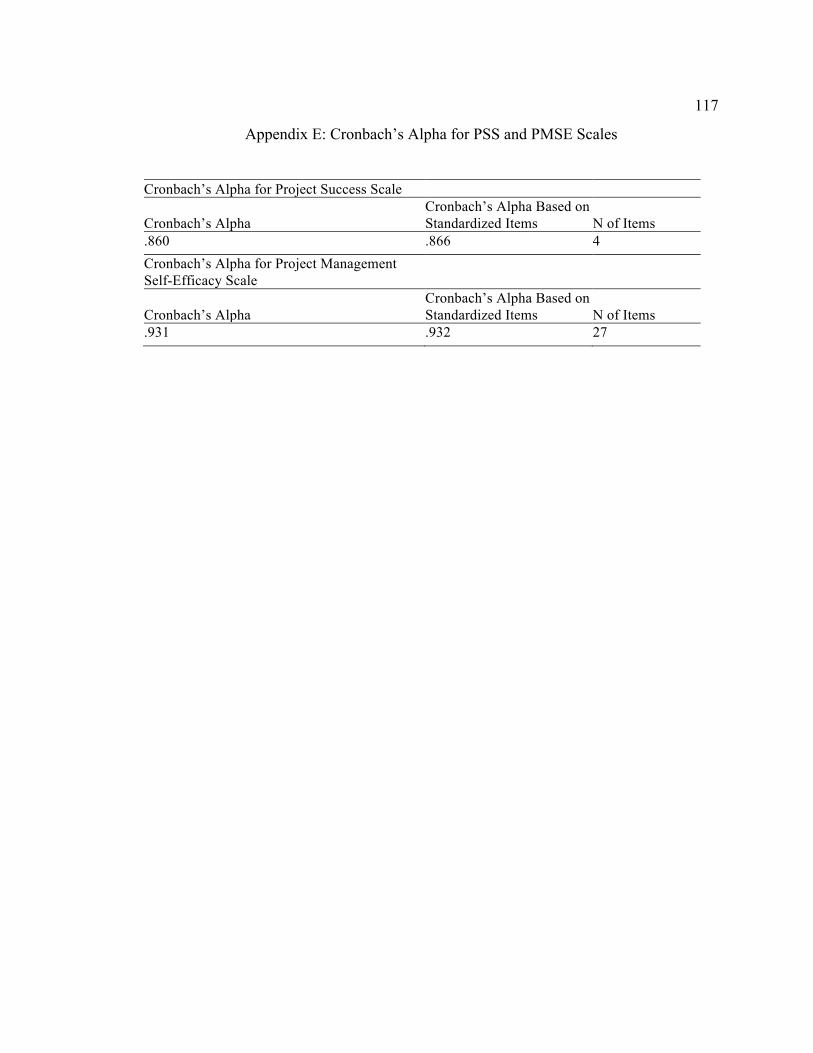
117
Appendix E: Cronbach’s Alpha for PSS and PMSE Scales
Cronbach’s Alpha for Project Success Scale
Cronbach’s Alpha Cronbach’s Alpha Based on Standardized Items N of Items
.860 .866 4 Cronbach’s Alpha for Project Management Self-Efficacy Scale
Cronbach’s Alpha Cronbach’s Alpha Based on Standardized Items N of Items
.931 .932 27
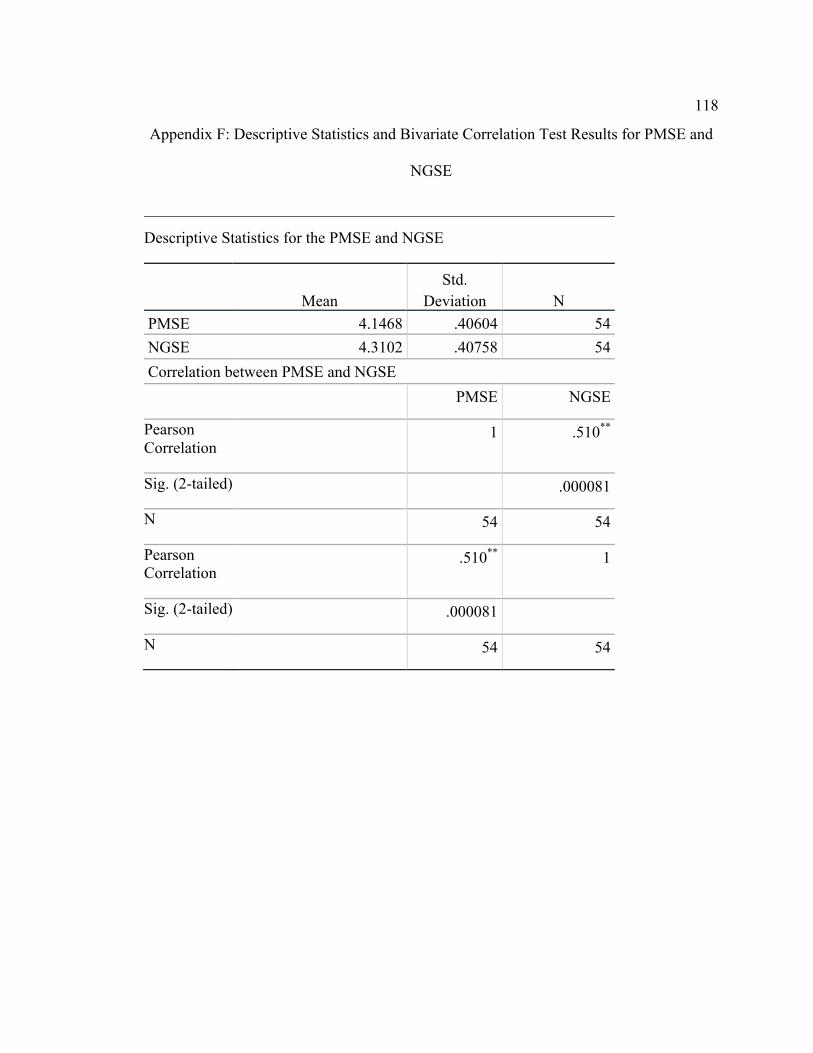
118
Appendix F: Descriptive Statistics and Bivariate Correlation Test Results for PMSE and
NGSE
Descriptive Statistics for the PMSE and NGSE
Mean Std.
Deviation N PMSE 4.1468 .40604 54 NGSE 4.3102 .40758 54 Correlation between PMSE and NGSE PMSE NGSE
Pearson Correlation
1 .510**
Sig. (2-tailed) .000081
N 54 54
Pearson Correlation
.510** 1
Sig. (2-tailed) .000081
N 54 54
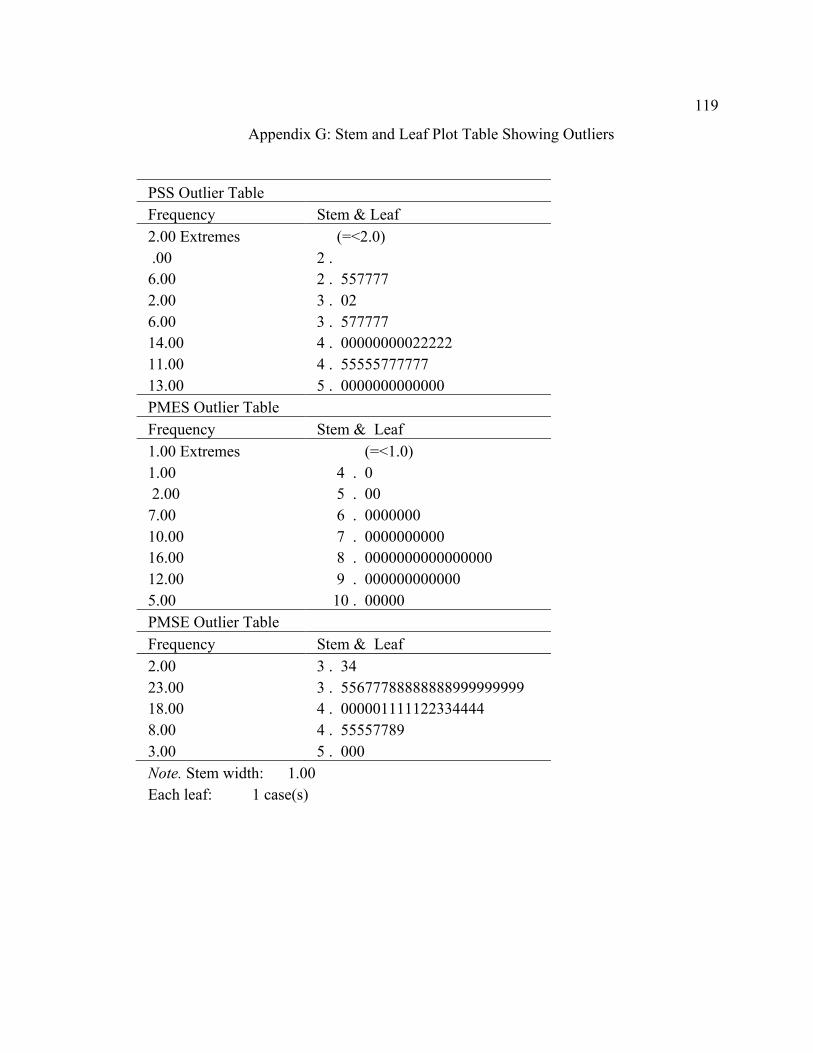
119
Appendix G: Stem and Leaf Plot Table Showing Outliers
PSS Outlier Table Frequency Stem & Leaf 2.00 Extremes (=<2.0) .00 2 . 6.00 2 . 557777 2.00 3 . 02 6.00 3 . 577777 14.00 4 . 00000000022222 11.00 4 . 55555777777 13.00 5 . 0000000000000 PMES Outlier Table Frequency Stem & Leaf 1.00 Extremes (=<1.0) 1.00 4 . 0 2.00 5 . 00 7.00 6 . 0000000 10.00 7 . 0000000000 16.00 8 . 0000000000000000 12.00 9 . 000000000000 5.00 10 . 00000 PMSE Outlier Table Frequency Stem & Leaf 2.00 3 . 34 23.00 3 . 55677788888888999999999 18.00 4 . 000001111122334444 8.00 4 . 55557789 3.00 5 . 000 Note. Stem width: 1.00 Each leaf: 1 case(s)
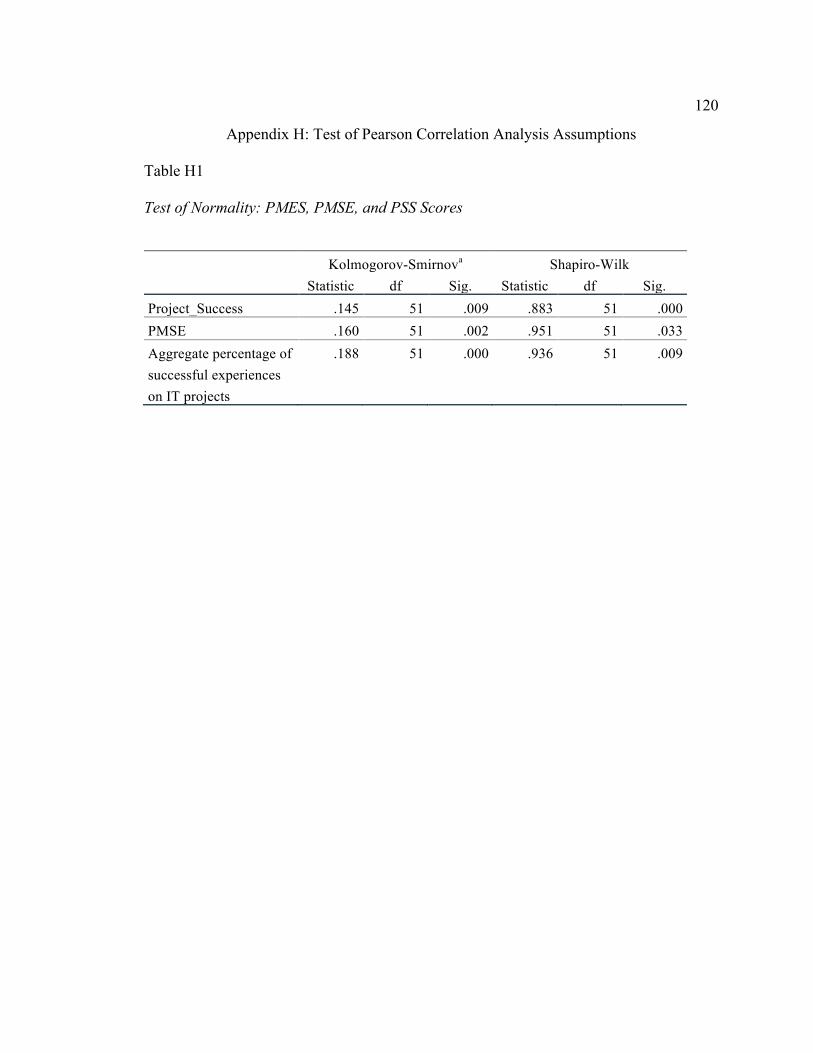
120
Appendix H: Test of Pearson Correlation Analysis Assumptions
Table H1
Test of Normality: PMES, PMSE, and PSS Scores
Kolmogorov-Smirnova Shapiro-Wilk
Statistic df Sig. Statistic df Sig. Project_Success .145 51 .009 .883 51 .000 PMSE .160 51 .002 .951 51 .033 Aggregate percentage of successful experiences on IT projects
.188 51 .000 .936 51 .009
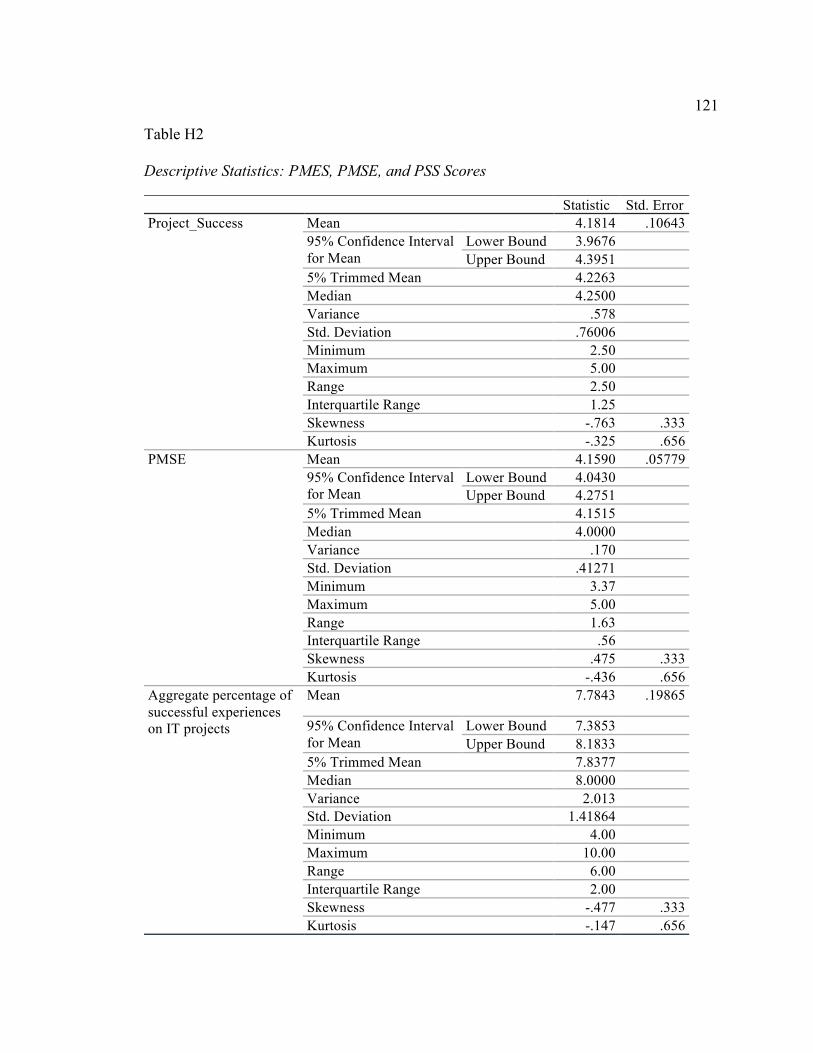
121
Table H2
Descriptive Statistics: PMES, PMSE, and PSS Scores
Statistic Std. Error Project_Success Mean 4.1814 .10643
95% Confidence Interval for Mean
Lower Bound 3.9676 Upper Bound 4.3951
5% Trimmed Mean 4.2263 Median 4.2500 Variance .578 Std. Deviation .76006 Minimum 2.50 Maximum 5.00 Range 2.50 Interquartile Range 1.25 Skewness -.763 .333 Kurtosis -.325 .656
PMSE Mean 4.1590 .05779 95% Confidence Interval for Mean
Lower Bound 4.0430 Upper Bound 4.2751
5% Trimmed Mean 4.1515 Median 4.0000 Variance .170 Std. Deviation .41271 Minimum 3.37 Maximum 5.00 Range 1.63 Interquartile Range .56 Skewness .475 .333 Kurtosis -.436 .656
Aggregate percentage of successful experiences on IT projects
Mean 7.7843 .19865
95% Confidence Interval for Mean
Lower Bound 7.3853 Upper Bound 8.1833
5% Trimmed Mean 7.8377 Median 8.0000 Variance 2.013 Std. Deviation 1.41864 Minimum 4.00 Maximum 10.00 Range 6.00 Interquartile Range 2.00 Skewness -.477 .333 Kurtosis -.147 .656
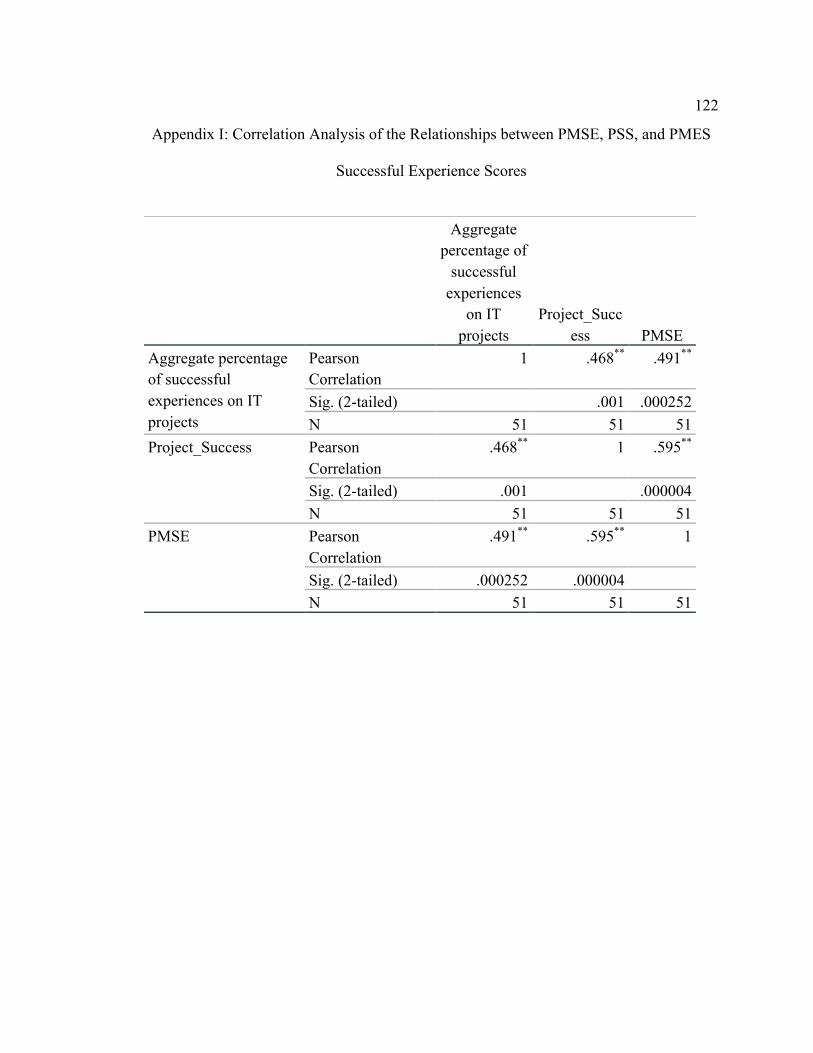
122
Appendix I: Correlation Analysis of the Relationships between PMSE, PSS, and PMES
Successful Experience Scores
Aggregate percentage of
successful experiences
on IT projects
Project_Success PMSE
Aggregate percentage of successful experiences on IT projects
Pearson Correlation
1 .468** .491**
Sig. (2-tailed) .001 .000252 N 51 51 51
Project_Success Pearson Correlation
.468** 1 .595**
Sig. (2-tailed) .001 .000004 N 51 51 51
PMSE Pearson Correlation
.491** .595** 1
Sig. (2-tailed) .000252 .000004 N 51 51 51
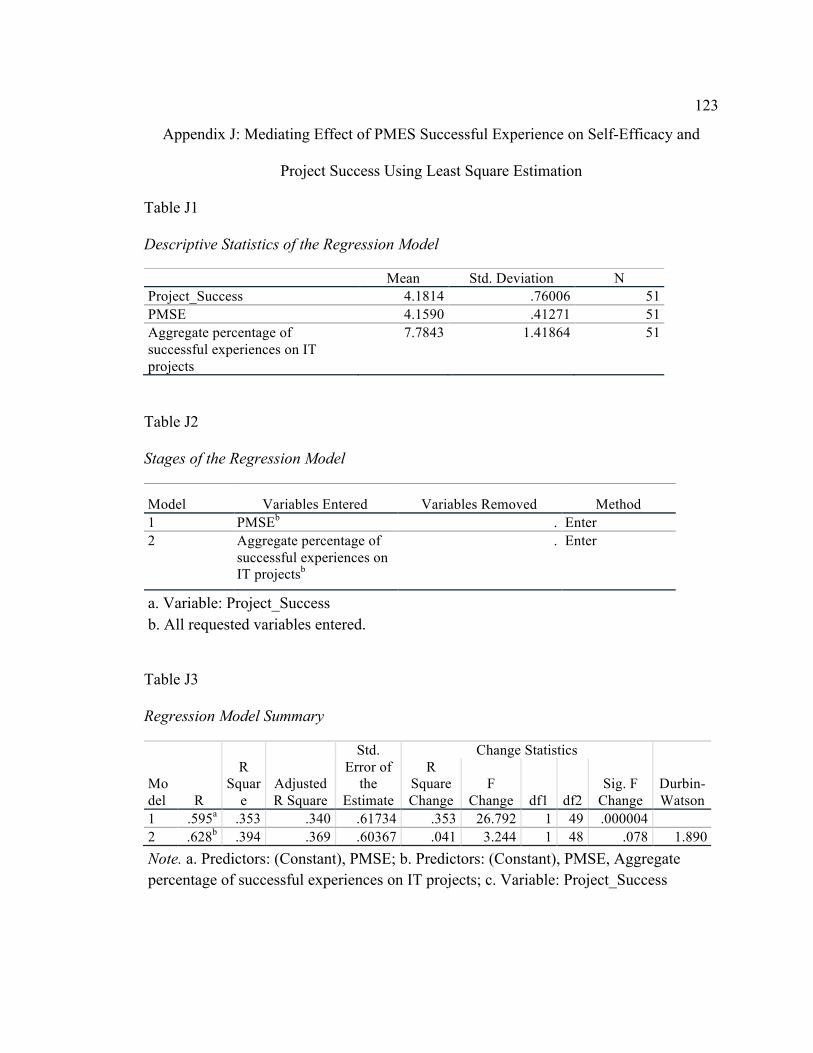
123
Appendix J: Mediating Effect of PMES Successful Experience on Self-Efficacy and
Project Success Using Least Square Estimation
Table J1
Descriptive Statistics of the Regression Model
Mean Std. Deviation N Project_Success 4.1814 .76006 51 PMSE 4.1590 .41271 51 Aggregate percentage of successful experiences on IT projects
7.7843 1.41864 51
Table J2
Stages of the Regression Model
Model Variables Entered Variables Removed Method 1 PMSEb . Enter 2 Aggregate percentage of
successful experiences on IT projectsb
. Enter
a. Variable: Project_Success b. All requested variables entered.
Table J3
Regression Model Summary
Model R
R Squar
e Adjusted R Square
Std. Error of
the Estimate
Change Statistics
Durbin-Watson
R Square Change
F Change df1 df2
Sig. F Change
1 .595a .353 .340 .61734 .353 26.792 1 49 .000004 2 .628b .394 .369 .60367 .041 3.244 1 48 .078 1.890 Note. a. Predictors: (Constant), PMSE; b. Predictors: (Constant), PMSE, Aggregate percentage of successful experiences on IT projects; c. Variable: Project_Success
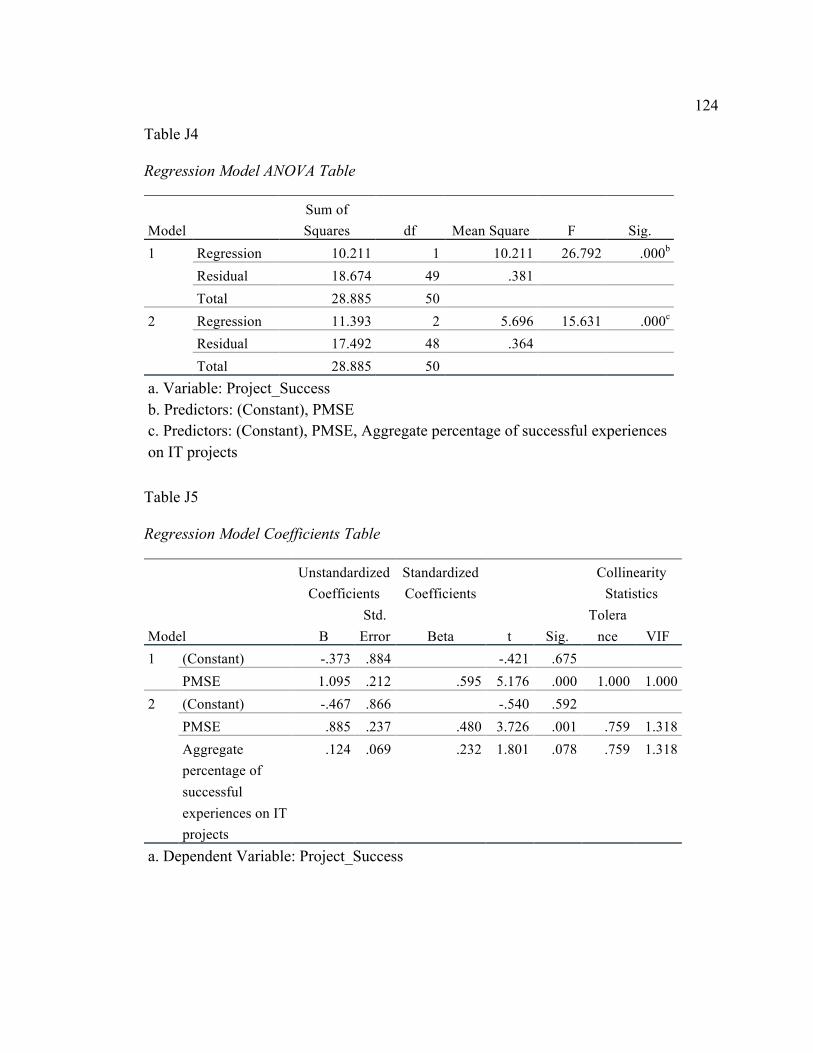
124
Table J4
Regression Model ANOVA Table
Model Sum of Squares df Mean Square F Sig.
1 Regression 10.211 1 10.211 26.792 .000b Residual 18.674 49 .381
Total 28.885 50
2 Regression 11.393 2 5.696 15.631 .000c Residual 17.492 48 .364
Total 28.885 50
a. Variable: Project_Success b. Predictors: (Constant), PMSE c. Predictors: (Constant), PMSE, Aggregate percentage of successful experiences on IT projects
Table J5
Regression Model Coefficients Table
Model
Unstandardized Coefficients
Standardized Coefficients
t Sig.
Collinearity Statistics
B Std.
Error Beta Tolera
nce VIF 1 (Constant) -.373 .884 -.421 .675
PMSE 1.095 .212 .595 5.176 .000 1.000 1.000 2 (Constant) -.467 .866 -.540 .592
PMSE .885 .237 .480 3.726 .001 .759 1.318 Aggregate percentage of successful experiences on IT projects
.124 .069 .232 1.801 .078 .759 1.318
a. Dependent Variable: Project_Success
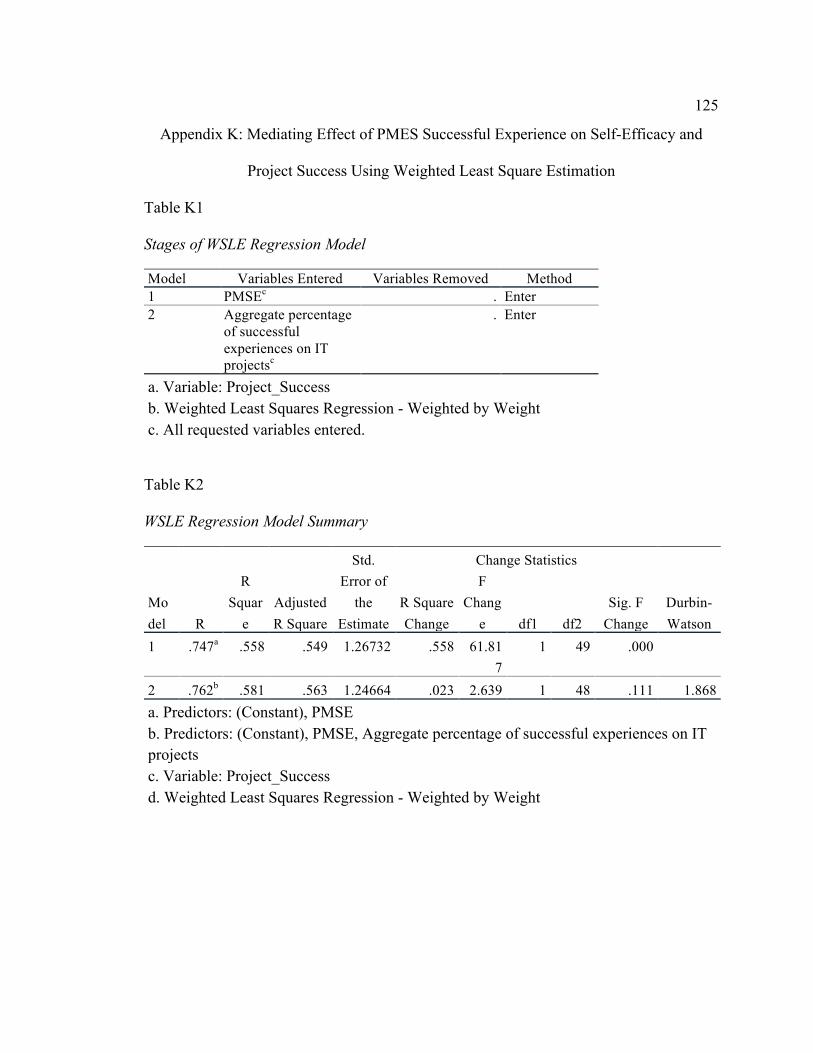
125
Appendix K: Mediating Effect of PMES Successful Experience on Self-Efficacy and
Project Success Using Weighted Least Square Estimation
Table K1
Stages of WSLE Regression Model
Model Variables Entered Variables Removed Method 1 PMSEc . Enter 2 Aggregate percentage
of successful experiences on IT projectsc
. Enter
a. Variable: Project_Success b. Weighted Least Squares Regression - Weighted by Weight c. All requested variables entered.
Table K2
WSLE Regression Model Summary
Model R
R Squar
e Adjusted R Square
Std. Error of
the Estimate
Change Statistics
Durbin-Watson
R Square Change
F Chang
e df1 df2 Sig. F
Change 1 .747a .558 .549 1.26732 .558 61.81
7 1 49 .000
2 .762b .581 .563 1.24664 .023 2.639 1 48 .111 1.868 a. Predictors: (Constant), PMSE b. Predictors: (Constant), PMSE, Aggregate percentage of successful experiences on IT projects c. Variable: Project_Success d. Weighted Least Squares Regression - Weighted by Weight
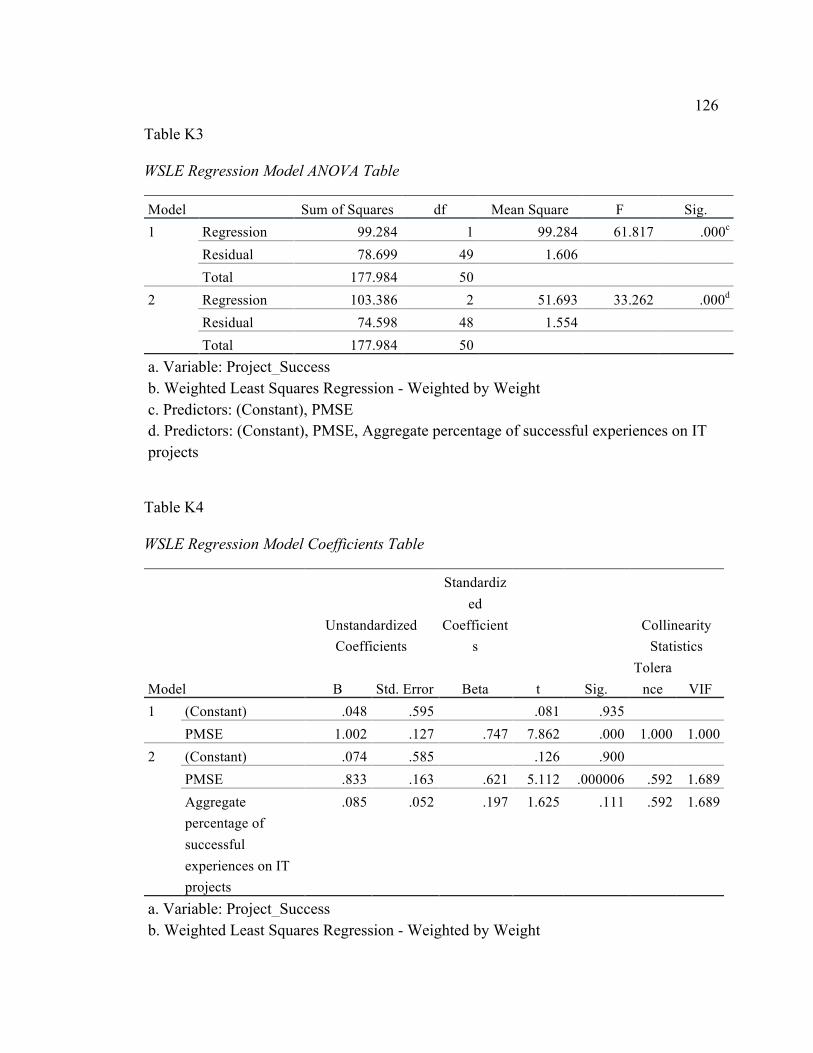
126
Table K3
WSLE Regression Model ANOVA Table
Model Sum of Squares df Mean Square F Sig. 1 Regression 99.284 1 99.284 61.817 .000c
Residual 78.699 49 1.606
Total 177.984 50
2 Regression 103.386 2 51.693 33.262 .000d Residual 74.598 48 1.554
Total 177.984 50
a. Variable: Project_Success b. Weighted Least Squares Regression - Weighted by Weight c. Predictors: (Constant), PMSE d. Predictors: (Constant), PMSE, Aggregate percentage of successful experiences on IT projects
Table K4
WSLE Regression Model Coefficients Table
Model
Unstandardized Coefficients
Standardized
Coefficients
t Sig.
Collinearity Statistics
B Std. Error Beta Tolera
nce VIF 1 (Constant) .048 .595 .081 .935
PMSE 1.002 .127 .747 7.862 .000 1.000 1.000 2 (Constant) .074 .585 .126 .900
PMSE .833 .163 .621 5.112 .000006 .592 1.689 Aggregate percentage of successful experiences on IT projects
.085 .052 .197 1.625 .111 .592 1.689
a. Variable: Project_Success b. Weighted Least Squares Regression - Weighted by Weight
127
Appendix L: Permissions to use Research Instruments
Blomquist et al. (2016) – PMSE ELSEVIER LICENSE TERMS AND CONDITIO NS Mar 01, 2018 This Agreement between Mr. Olakunle Lemboye ("You") and Elsevier ("Elsevier") consists of your license details and the terms and conditions provided by Elsevier and Copyright Clearance Center. License Number 4300290239615 License date Mar 01, 2018 Licensed Content Publisher Elsevier Licensed Content Publication International Journal of Project Management Licensed Content Title Project management self-efficacy as a predictor of project performance: Constructing and validating a domain-specific scale Licensed Content Author Tomas Blomquist,Ali Dehghanpour Farashah,Janice Thomas Licensed Content Date Nov 1, 2016 Licensed Content Volume 34 Licensed Content Issue 8 Licensed Content Pages 16 Start Page 1417 End Page 1432 Type of Use reuse in a thesis/dissertation Portion full article Format electronic Are you the author of this Elsevier article? No Will you be translating? No Title of your thesis/dissertation Correlational Analysis of the Relationship Among Mastery Experience, Self-Efficacy, and Project Success Expected completion date Dec 2020 Estimated size (number of pages) 200 Requestor Location Mr. Olakunle Lemboye 113 Cranleigh Park SE Calgary, AB T3M 1J1 Canada Attn: Mr. Olakunle Lemboye Publisher Tax ID GB 494 6272 12 Total 0.00 CAD Terms and Conditions INTRODUCTION 1. The publisher for this copyrighted material is Elsevier. By clicking "accept" in connection with completing this licensing transaction, you agree that the following terms and conditions apply to this transaction (along with the Billing and Payment terms and conditions established by Copyright Clearance Center, Inc. ("CCC"), at the time that you opened your Rightslink account and that are available at any time at http://myaccount.copyright.com). GENERAL TERMS 2. Elsevier hereby grants you permission to reproduce the aforementioned material subject to the terms and
128
Serrador and Turner (2015) – PSS Title: The Relationship between Project Success and Project Efficiency Author: Pedro Serrador,J. Rodney Turner Publication: Procedia - Social and Behavioral Sciences Publisher: Elsevier Date: 19 March 2014 Copyright © 2014 The Authors. Published by Elsevier Ltd. Logged in as: Olakunle Lemboye Account #: 3001255821 Creative Commons Attribution-NonCommercial-No Derivatives License (CC BY NC ND) This article is published under the terms of the Creative Commons Attribution-NonCommercial-No Derivatives License (CC BY NC ND). For non-commercial purposes you may distribute and copy the article and include it in a collective work (such as an anthology), provided you do not alter or modify the article, without permission from Elsevier. The original work must always be appropriately credited. Permission is not required for this non-commercial use. For commercial use please continue to request permission via RightsLink. Copyright © 2018 Copyright Clearance Center, Inc. All Rights Reserved. Privacy statement. Terms and Conditions. Comments? We would like to hear from you. E-mail us at [email protected]
Chen et al. (2001) – NGSE 3/1/2018 Rightslink® by Copyright Clearance Center https://s100.copyright.com/AppDispatchServlet#formTop 1/1 Title: Validation of a New General Self-Efficacy Scale Author: Gilad Chen, Stanley M. Gully, Dov Eden Publication: Organizational Research Methods Publisher: SAGE Publications Date: 01/01/2001 Copyright © 2001, © SAGE Publications Logged in as: Olakunle Lemboye Gratis Reuse Permission is granted at no cost for use of content in a Master’s Thesis and/or Doctoral Dissertation. If you intend to distribute or sell your Master’s Thesis/Doctoral Dissertation to the general public through print or website publication, please return to the previous page and select ‘Republish in a Book/Journal’ or ‘Post on intranet/password-protected website’ to complete your request.