Embed Size (px)
Citation preview
Correlations Between Water Quality Parameters and Levels of 4-NP in Water and Sediment of Stroubles Creek Watershed
Aaron Bradner
Project Report Submitted to the Faculty of the Virginia Polytechnic Institute and State University
In Partial Fulfillment of the Requirements for the Degree of
Master of Science In
Crop and Soil Environmental Sciences
Dr. Kang Xia, Co-chair Dr. Vinod Lohani, Co-chair
Dr. Carl Zipper, Committee Member
February 2013 Blacksburg, VA
1
ABSTRACT
This observational study examined the potential correlation of different water quality
parameters with concentration of the organic contaminant 4-nonylphenol (4-NP) in the bed sediment
and water column of Stroubles Creek, a tributary of the New River in southwest Virginia. Weekly sample
collection occurred over the course of approximately four months (Jun 25-Oct 15, 2012). On Monday
mornings two water samples and a sediment sample were collected from threes sites along Stroubles
Creek to be analyzed for 4-NP. Three water quality sondes maintained by Virginia Tech’s Biological
Systems Engineering Department on lower Stroubles were deployed continuously and recorded five
parameters (dissolved oxygen, pH, conductivity, turbidity, and temperature) every 15 minutes a few feet
upstream of the 4-NP sample collection sites. These data were compiled into a weighted weekly average
using an exponential decay curve, giving more weight to the most recent days before sample collection.
Analyzed along with the weekly average were the weekly minimum (min) and weekly maximum (max) of
each parameter. These max, min, and average values for all 5 parameters at each of the three sites were
compared to the concentration of 4-NP detected in the soil and water samples collected weekly from
each site to determine if there was any significant correlation (r > .30) between these parameters with
4-NP concentration.
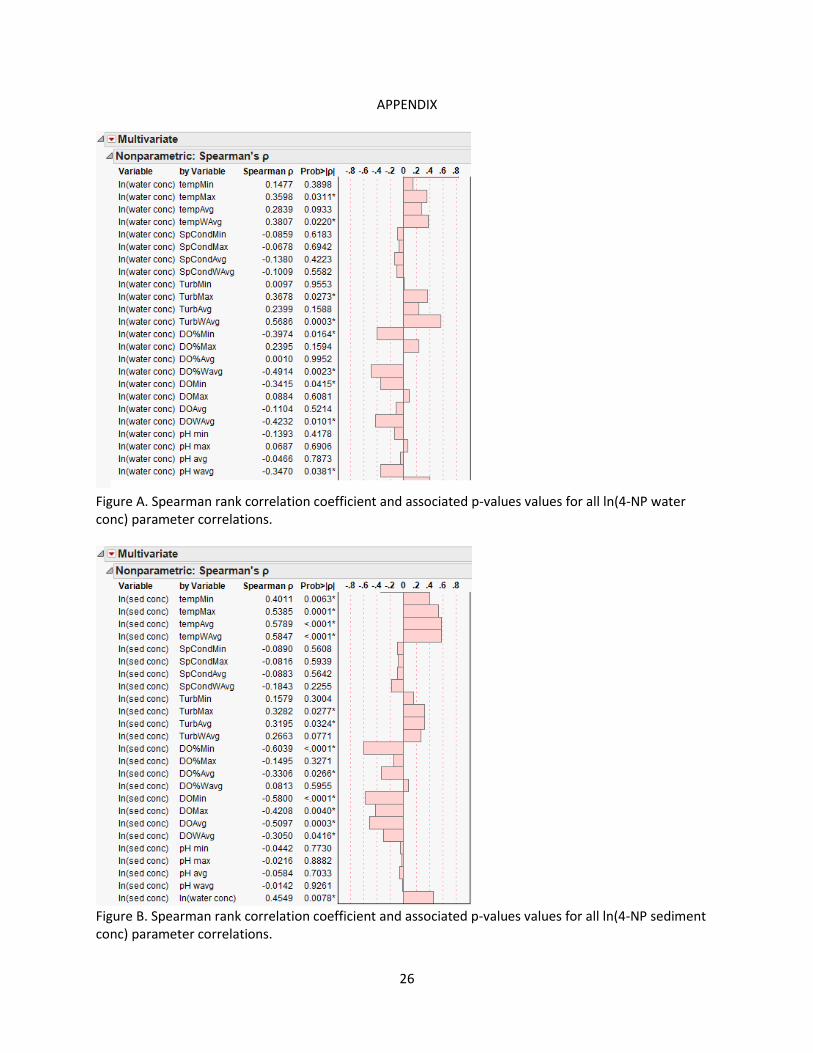
The following observations were made for ln(4-NP water concentration): temperature
(maximum; positive correlation), turbidity (maximum and weighted average; both positive correlation),
and dissolved oxygen (minimum % saturation, weighted average % saturation, weekly minimum, weekly
weighted average; all negative correlation) were significantly correlated.
The following observations were made for ln(4-NP sediment concentration): temperature
(minimum, maximum, weekly average, weighted average; all positively correlated), turbidity (maximum;
positively correlated), and dissolved oxygen (minimum % saturation, weekly minimum, weekly
maximum, weekly average; all negatively correlated) were significantly correlated.
KEY WORDS
4-NP, water parameters, stream, dissolved oxygen, conductivity, turbidity, pH, temperature
INTRODUCTION
Stroubles Creek is a tributary of the New River and collects runoff from a large area of
Montgomery County, with a watershed area of approximately 58 km2 (Younos et al., 2010) to the point
at which it flows into the New River. The Stream Restoration, Education, and Management (StREAM) Lab

2
in Virginia Tech’s Biological Systems Engineering (BSE) department began monitoring lower Stroubles in
late 2010 with multiparameter water quality sondes YSI 6920 V2 at three sites downstream of the Duck
Pond at Virginia Tech (Figure 1). Sondes at the StREAM Lab locations record dissolved oxygen, pH,
turbidity, conductivity, and temperature at 15-minute intervals. The sondes, located in a section of
Stroubles that flows through agricultural fields, are calibrated every two weeks by BSE students.
The compound 4-nonylphenol (4-NP) is an organic contaminant that results from the photolytic
and microbial breakdown of NP ethoxylate, a compound ubiquitous in soaps, detergents, and
surfactants. The compound 4-NP has been detected in a wide range of environmental samples (Shang
et. Al 1999, Dachs et al., 1999, Sole et al., 2000; Kolpin et al., 2002) and has been found in low
concentrations in Stroubles Creek water and sediment samples by Dr. Xia’s research group.
The length of time over which data were collected in this study (five months) is much longer
than the studies covered in the literature review, in which the data duration typically was on the order
of days-weeks rather than months. By covering a significantly longer amount of time, this should give a
different and interesting approach to how such observational studies are conducted.
LITERATURE REVIEW
Introduction
Alkylphenol ethoxylates are an industrially important class of compounds used as industrial
detergents, emulsifiers, wetting agents, and dispersing agents (Maguire, 1999; Thiele et al., 1997). These
compounds can break down over time through microbial or photolytic degradation into a number of
degradation products. One of those degradation products is 4-NP, an estrogenic endocrine disruptor
(McCormick et al., 2005; Miles-Richardson et al., 1999). Though little is known about the extent of
environmental occurrence of 4-NP due to lack of analytical methods capable of detecting such
compounds at low levels, it poses such threats by causing abnormal physiological processes and
reproductive impairment (Kolpin et al. 2002).
As an organic contaminant and an endocrine disruptor 4-NP can have a negative impact on
aquatic biota in lotic systems, and may linger in sediment for some time. A study (Ekelund et al., 1993)
found that 4-NP degraded at the rate of 1.2% daily in the presence of sediment. Many other studies
documenting microbial degradation in river sediment (Yuan et al., 2003), photocatalytic degradation
(Pellizetti et al., 1989; Turchi and Ollis, 1989; Xia and Jeong, 2004), temperature-dependent sediment
adsorption (Cornellisen et al., 1997), physical properties such as hydrophobicity (Ahel and Giger, 1993),
and bioavailability (Miles-Richardson et al., 1999) of 4-NP exist and will be discussed in further detail in
3
subsequent sections. The compound 4-nonylphenol is considered toxic to many organisms at low
concentrations. Leblanc et al. (2000) found that Daphnia magna suffered developmental effects, such as
curved spine and underdeveloped antennae, at concentrations as low as .45 uM. It can also cause
expression of female sex characteristics: one study observed male rainbow trout hepatocytes produce
vitellogenin (egg yolk protein) in the presence of 1.64 mg/L NP over seven days (Xie et al. 2005).
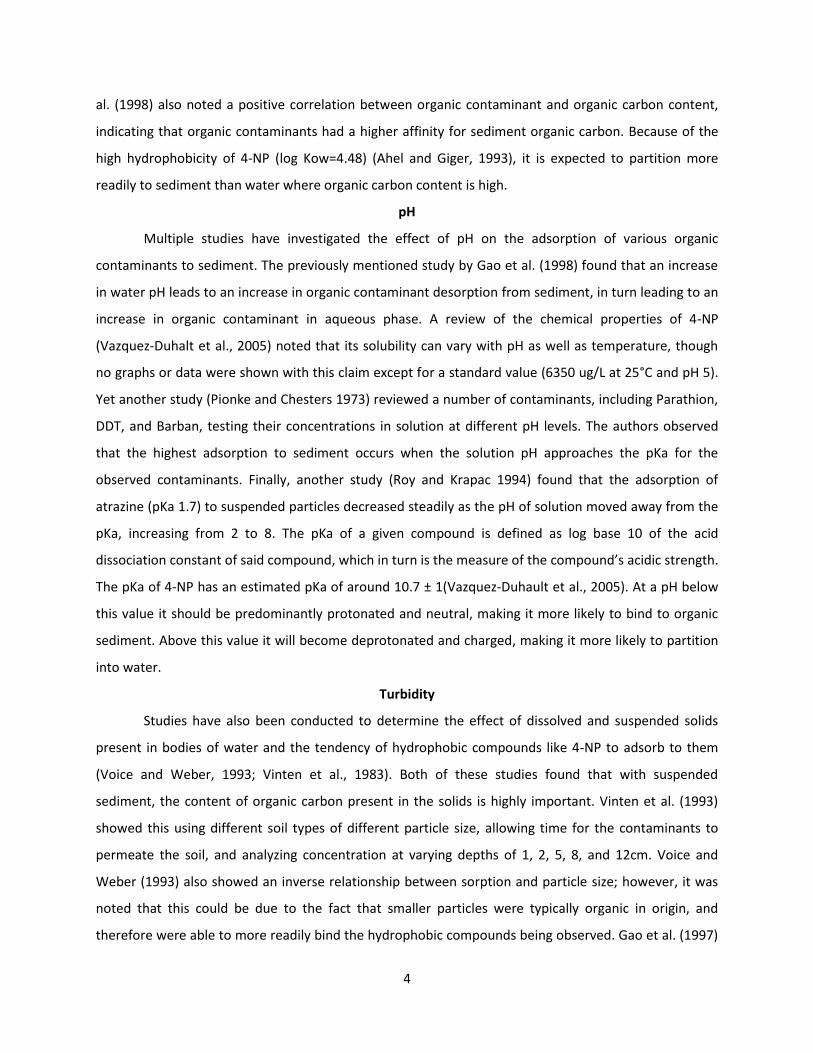
The compound 4-NP could originate from a number of places at these sites. Other studies have
found that prominent sources of 4-NP include biolsolids (Xia and Jeong, 2004), as well municipal sewage
treatment plants, textile manufacturing, pulp and paper production and recycling, and some pesticide
formulations (Topp and Starratt, 2009). Given the lack of textile and paper production in the Stroubles
Creek watershed, and the location of the collection sites in an agricultural field, it is surmised that the
source of 4-NP at the sites originates from pesticide or biolsolids application to crops.
Although there are many published studies on the environmental behaviors of 4-NP, there is
limited information on the effects of water quality parameters on 4-NP environmental behaviors. This
paper will review studies of similar compounds, specifically focusing on factors that have been found to
affect the environmental partitioning, transport, and fate of 4-NP.
Organic carbon content
The partitioning and transport of 4-NP in lotic aqueous systems is an important topic that has
not been widely researched; however, there are a number of studies that have monitored similar
compounds and contaminants. A study investigating the occurrence and accumulation of more than 30
different organic contaminants, including polycyclic aromatic hydrocarbons as well as DDT and its
derivatives, was performed on the San Joaquin River and its tributaries in California (Pereira et al.,
1996). This study measured the concentration of each of these contaminants separately in water and
sediment samples. It found significant concentrations of hydrophobic compounds with similar chemical
properties to 4-NP in downstream sediment. Specifically, the compounds observed were found in a
higher concentration in sediment than the water column. It is important to note that this study was
conducted during a month of little rainfall and therefore low flow which may affect contaminant
partitioning. Pereira et al. (1996) also took samples of suspended sediment during high and low flow to
analyze for contamination and found that concentrations were higher in suspended sediment than bed
sediment due to higher organic carbon content in the suspended sediment.
A second study (Gao et al., 1998) conducted in Germany investigated the effects of organic
carbon on the sorption kinetics of seven different organic contaminants, including Bifenox and
Triadimenol, from agricultural runoff. In addition to the study performed by Pereira et al. (1996), Gao et
4
al. (1998) also noted a positive correlation between organic contaminant and organic carbon content,
indicating that organic contaminants had a higher affinity for sediment organic carbon. Because of the
high hydrophobicity of 4-NP (log Kow=4.48) (Ahel and Giger, 1993), it is expected to partition more
readily to sediment than water where organic carbon content is high.
pH
Multiple studies have investigated the effect of pH on the adsorption of various organic
contaminants to sediment. The previously mentioned study by Gao et al. (1998) found that an increase
in water pH leads to an increase in organic contaminant desorption from sediment, in turn leading to an
increase in organic contaminant in aqueous phase. A review of the chemical properties of 4-NP
(Vazquez-Duhalt et al., 2005) noted that its solubility can vary with pH as well as temperature, though
no graphs or data were shown with this claim except for a standard value (6350 ug/L at 25°C and pH 5).
Yet another study (Pionke and Chesters 1973) reviewed a number of contaminants, including Parathion,
DDT, and Barban, testing their concentrations in solution at different pH levels. The authors observed
that the highest adsorption to sediment occurs when the solution pH approaches the pKa for the
observed contaminants. Finally, another study (Roy and Krapac 1994) found that the adsorption of
atrazine (pKa 1.7) to suspended particles decreased steadily as the pH of solution moved away from the
pKa, increasing from 2 to 8. The pKa of a given compound is defined as log base 10 of the acid
dissociation constant of said compound, which in turn is the measure of the compound’s acidic strength.
The pKa of 4-NP has an estimated pKa of around 10.7 ± 1(Vazquez-Duhault et al., 2005). At a pH below
this value it should be predominantly protonated and neutral, making it more likely to bind to organic
sediment. Above this value it will become deprotonated and charged, making it more likely to partition
into water.
Turbidity
Studies have also been conducted to determine the effect of dissolved and suspended solids
present in bodies of water and the tendency of hydrophobic compounds like 4-NP to adsorb to them
(Voice and Weber, 1993; Vinten et al., 1983). Both of these studies found that with suspended
sediment, the content of organic carbon present in the solids is highly important. Vinten et al. (1993)
showed this using different soil types of different particle size, allowing time for the contaminants to
permeate the soil, and analyzing concentration at varying depths of 1, 2, 5, 8, and 12cm. Voice and
Weber (1993) also showed an inverse relationship between sorption and particle size; however, it was
noted that this could be due to the fact that smaller particles were typically organic in origin, and
therefore were able to more readily bind the hydrophobic compounds being observed. Gao et al. (1997)

5
noted that a significant amount of contaminant may be lost during rain events due to sorption of the
contaminant to very small particles that do not settle out quickly but rather remain suspended and are
washed away in the storm runoff to settle out elsewhere. However, both did note that suspended
sediment plays a role in the transport and partitioning of organic contaminants.
Temperature
Temperature-dependent solubility has been observed as well (Gerard et al., 1997). In this study
increases in temperature were found to have a positive correlation with desorption of organic
contaminants from sediment; specifically, the percent of slow-rate desorption decreased as
temperature was increased from 5°C to 20°C to 60°C. These tests were run for extended lengths of time
varying from days to months. However, the greatest change in rate of desorption occurred very rapidly,
with most of the organic material desorbing into solution within the first few minutes-hours. After the
first approximately 10 hours of exposure of contaminated sediment to water, desorption of the
contaminant leveled off rapidly and linearized. One previously cited paper (Pionke and Chesters 1973)
also noted that post-application transport is likely dependent on relative humidity as well as soil and air
temperature, which can have a direct effect on water temperature.
Conductivity
It has been found that total dissolved solids played an important role in the transport as well
(Vinten et al., 1983), limiting the movement of organic contaminants within soil. Of the two
contaminants observed, Paraquat and DDT, DDT most resembles 4-NP with a log Kow in the same order
of magnitude (~4.9). Suspended in distilled water, the contaminants were able to penetrate soil to a
depth of 12cm; however, in the presence of very dilute calcium chloride, the contaminants were found
no further than 1cm in the soil. This was found to be due to flocculation to the soil used in the study; the
calcium bound the contaminants, and then bound to the soil, abating transport. However, when
suspended solids were absent and the organic contaminant was not adsorbed to suspended sediment,
the calcium did not bind to the contaminant and it moved freely into the soil.
Dissolved oxygen
One study (Pellizetti et al., 1989) was found that does not specifically address the effect of
dissolved oxygen levels on 4-NP breakdown but notes that under aerobic conditions, 4-NP can degrade
rapidly from sensitized photolysis by dissolved organic matter. Due to the requirement of oxygen for
photooxidation to occur (Faust and Holgne, 1987) poorly oxygenated waters may slow the rate of
breakdown. Conversely, high DO levels may assist in the rapid breakdown of 4-NP. This transformation
can be rapid, as the study by Pelizetti et al. (1989) was able to completely degrade 4-NP through a
6
photocatalytic process over the course of one hour. For this reason DO is expected to have a negative
correlation with 4-NP concentrations.
Aerobic microbial degradation of 4-NP is also possible (Yuan et al., 2003). While 4-NP is not
readily broken down anaerobically, in the presence of higher concentrations of DO breakdown proceeds
more quickly. According to Yuan et al. (2003) 4-NP was found to be completely degraded after 70 days in
sediment without acclimated microbes, and just 28 days with NP-acclimated microbes indicating that
aerobic degradation was responsible for breakdown. This would indicate that higher DO would favor
aerobic degradation, and low DO would decrease microbial aerobic degradation.
Anthropogenic effects
It is important to note that the prevalence of organic contaminants is heavily affected by the
location to their application in the case of anthropogenic sources (Weston et al., 2004). It was found
that in the central valley of California, a highly agricultural region, that different bodies of water would
have different concentrations and so could not be directly compared to each other; e.g. irrigation canals
located adjacent to orchards that were treated with pesticides would have a greater degree of
contamination than upstream or downstream influent and effluent, particularly with regards to streams
of differing sizes. The concentration of organic contaminants in the water is also, obviously, affected by
the rate of application (Wauchope, 1978), as higher application rates can increase contamination.
Land application of biosolids is another means of introduction to the environment (Xia and
Jeong, 2004). Several million tonnes of biosolids are land applied every year in the United States and due
to the high hydrophobicity of 4-NP (log Kow=4.48) (Ahel and Giger, 1993), large quantities of 4-NP are
found in biosolids. Even years after application has ceased, 4-NP can be found at high levels in the soil.
Summary
Many of the water parameters monitored have been shown in previously published literature to
have an effect on the concentration of different organic substances such as pesticides, in the water
column and sediment of affected waterways. These support the reasoning behind the monitoring of
water parameters with regards to the concentration, and although 4-NP is not one of the compounds in
these papers that have been reviewed, it is expected that 4-NP will follow trends similar to other organic
compounds of its class that have similar characteristics.
PROJECT OBJECTIVE
The primary objective of this project was to explore the possible correlation between five water
quality parameters (dissolved oxygen, pH, conductivity, turbidity, and temperature) and the
7
concentration of 4-NP in the water column and bed sediment at a monitoring site of the StREAM Lab in
Stroubles Creek.
METHODS
Study site
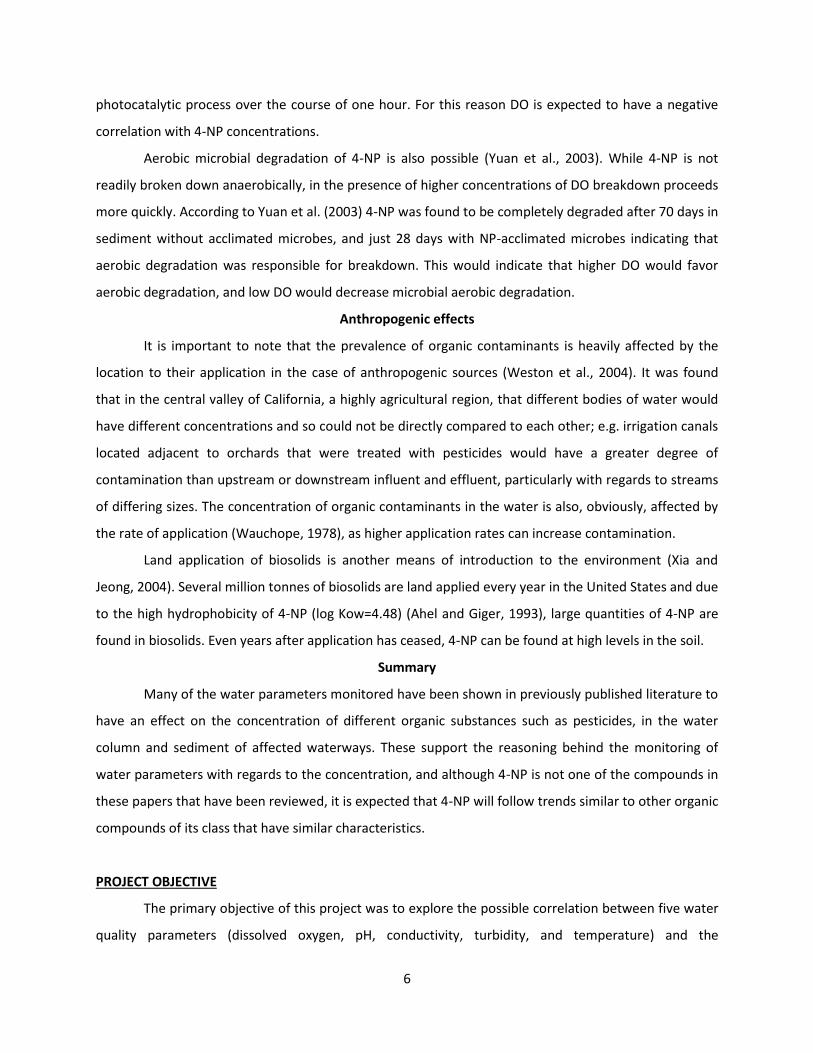
The particular sites used in this observational study were chosen for their scientific interest and
ease of observation. The contaminant 4-NP had already been found at the three sites by Dr. Xia’s
research group and samples were already being taken. Sondes had already been deployed and
maintained by the BSE department some time before, making data collection significantly less
expensive, difficult, and time-consuming. These sites run along an approximately half-mile stretch
through the experimental agriculture fields to the west of campus near the Foxridge apartment
complex. The sites are only accessible by dirt road and are relatively remote with regards to human
access (Figure 1). Bridge 1 is .34 miles upstream of Bridge 2, which is .20 miles upstream of Bridge 3.
Fig 1. Location of 4-NP sampling sites and water quality monitoring stations in Stroubles Creek. Source: Google Earth.
Data collection
Data were collected and analyzed by Dr. Xia’s research group. The data collected in this project covered
two major points:
8
1. Parameter data collection: water quality parameter data was collected with sondes every 15 minutes
at three points along Stroubles Creek over the course of the study.
2. 4-NP sample collection: Stream sediment and water samples were collected from the water quality
parameter measurement points along Stroubles each Monday.
Sonde
The multiparameter water quality sondes YSI 6920 V2 at the StREAM Lab sites in lower Stroubles
were deployed continuously 7 days a week and set to record data at 15 minute intervals. These sondes
are maintained by the BSE department and are calibrated every two weeks by BSE students. The sondes
are installed at three bridges: bridge 1 is located at 37°12’36.37’’N 80°26’42.32’’W; bridge 2 at
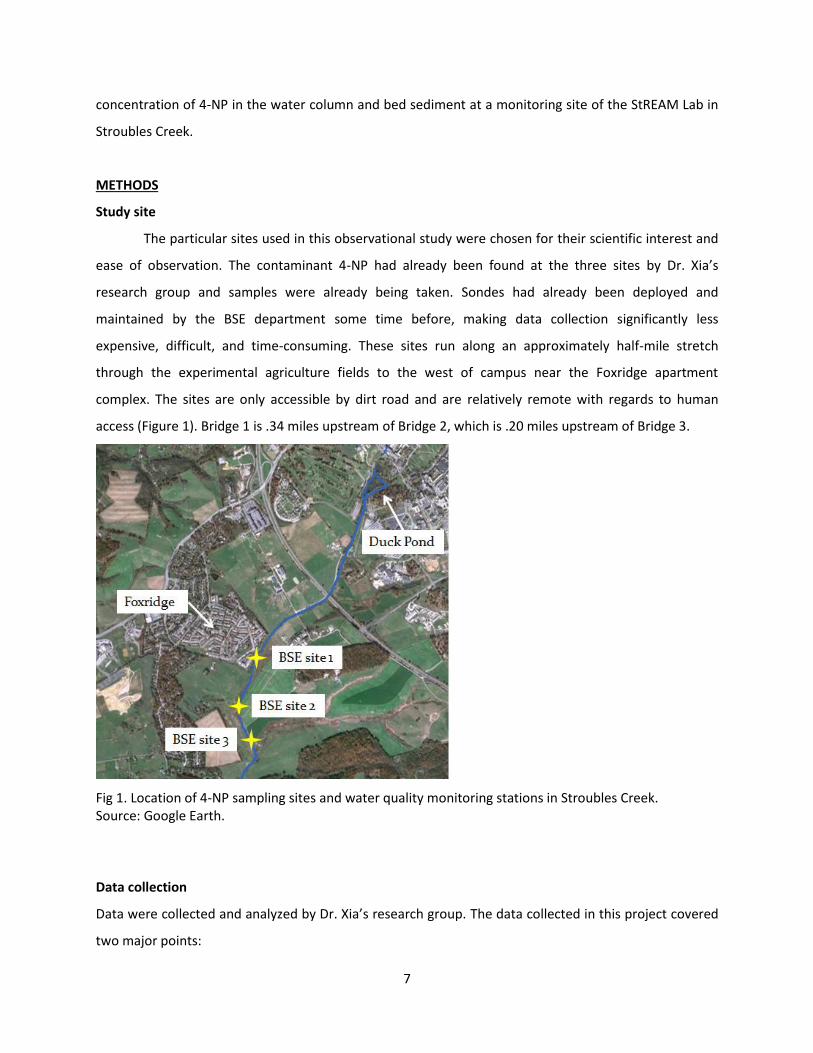
37°12’23.16’’N 80°26’50.83’’W; and bridge 3 at 37°12’13.96’’N 80°26’46.75’’W. Below is an example
table of how the raw data appeared as it was obtained from the sonde for the first six hours on the first
day of deployment on the most downstream site.
Site DateTime Temp_degC SpCond_mS/cm Turb_NTU DO_% DO_mg/L Batt_V pH [H+]
3 6/18/2012 12:00 22.86 0.41 8.9 97.5 8.38 13.1 7.73 1.86209E-08
3 6/18/2012 12:15 23.1 0.407 8.5 99.7 8.52 13.2 7.75 1.77828E-08
3 6/18/2012 12:30 23.24 0.403 10.4 100.5 8.57 13 7.76 1.7378E-08
3 6/18/2012 12:45 23.51 0.401 7.1 102.3 8.68 13.1 7.76 1.7378E-08
3 6/18/2012 13:00 23.3 0.4 7.1 98.2 8.37 13 7.73 1.86209E-08
3 6/18/2012 13:15 23.37 0.4 6.6 98.4 8.38 13.1 7.74 1.8197E-08
3 6/18/2012 13:30 23.42 0.4 6.4 99.2 8.43 13.1 7.73 1.86209E-08
3 6/18/2012 13:45 23.38 0.4 6.1 98.7 8.4 13.1 7.74 1.8197E-08
3 6/18/2012 14:00 23.25 0.4 6.1 97.9 8.35 13.1 7.73 1.86209E-08
3 6/18/2012 14:15 23.24 0.4 5.4 97.6 8.32 13.3 7.73 1.86209E-08
3 6/18/2012 14:30 23.26 0.4 5.3 99.9 8.52 13.1 7.73 1.86209E-08
3 6/18/2012 14:45 23.25 0.4 5.6 100.8 8.6 13.3 7.73 1.86209E-08
3 6/18/2012 15:00 23.24 0.4 5.5 101.3 8.64 13.1 7.74 1.8197E-08
3 6/18/2012 15:15 23.3 0.399 5 101.3 8.64 13.1 7.74 1.8197E-08
3 6/18/2012 15:30 23.63 0.399 4.7 105.2 8.91 13.1 7.75 1.77828E-08
3 6/18/2012 15:45 24.05 0.399 4.6 107.8 9.05999 13.1 7.78 1.65959E-08
3 6/18/2012 16:00 24.07 0.399 4.3 109.4 9.18 13 7.78 1.65959E-08
3 6/18/2012 16:15 24.07 0.399 4.7 108.4 9.1 13 7.79 1.62181E-08
3 6/18/2012 16:30 24.33 0.399 6.6 109.6 9.16 13.1 7.8 1.58489E-08
3 6/18/2012 16:45 24.6 0.399 4.9 111.5 9.28 13.2 7.81 1.54882E-08
3 6/18/2012 17:00 24.68 0.399 4.7 111.2 9.24 13 7.8 1.58489E-08
3 6/18/2012 17:15 24.65 0.401 5 109.9 9.13 13.1 7.8 1.58489E-08
3 6/18/2012 17:30 24.6 0.403 4.6 109.2 9.08 13 7.79 1.62181E-08
3 6/18/2012 17:45 24.54 0.406 4.7 108 8.99 13.1 7.78 1.65959E-08
3 6/18/2012 18:00 24.39 0.409 4.7 104.7 8.74 13 7.78 1.65959E-08
Fig 2. Example table of data downloaded from sonde at site 3 on first day of deployment.
9
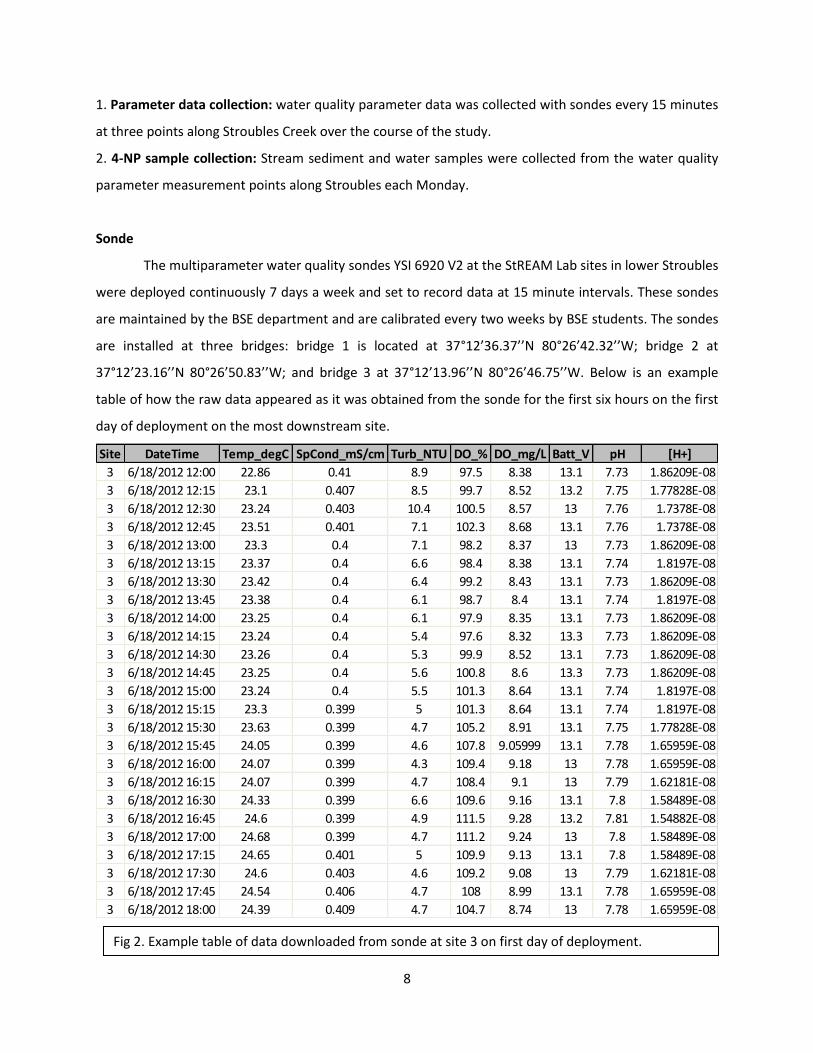
4-NP sample collection
Over the course of the summer and fall semester, two students in Dr. Xia’s lab drove through
the agriculture fields to the furthest sampling point downstream and collect two water samples
(~500mL) and one sediment sample (~500mL). The sediment samples consisted of finer organic
sediment near to the bank rather than gravelly sediment that clearly washed off the road. These
samples were stored in glass Mason jars with 5 drops of hydrochloric acid and stored on ice. The student
moved upstream to the next collection site, following the same sampling procedure, until all sampling
sites had been visited.
Prior to sampling, one student gathered 10 pre-cleaned Mason jars (2 water samples and 1
sediment sample for each of the 3 sites, then one overall field blank). Labels were prepared in lab and
applied to the jars. A second student collected ice from Latham hall and fill a cooler about 1/3 full with
ice. A small kit with necessary equipment (a trowel for collecting sediment samples, paper towels, a
solution of 50:50 methanol/water for decontaminating the trowel between samples, a small dropper-
topped bottle containing concentrated HCl for fixing the samples, and Nitrile gloves) was also taken to
the sampling site. The students then proceeded to Site 3, the furthest site downstream so as to prevent
false readings from disturbing upstream sediment.
At the site, three Mason jars and the kit of supplies were taken to the site from the truck, which
was parked along the dirt road through the agriculture field. One student took water samples from the
center of the creek. The samples were preserved immediately after acquisition by placing 5 drops of
concentrated HCl into each sample. A second student took sediment samples from the edge of the
stream bed but still under the water. This sample was also fixed with 5 drops of concentrated HCl. The
equipment and samples were carried back to the truck and the samples were put on ice in the cooler.
The trowel used for sediment sample collection was washed with the Methanol/Water solution to
remove residual debris. The students then proceeded to the next site and repeat the same method for
the three remaining sites. Once all samples were collected, the students returned to lab and stored the
samples in a freezer to prevent degradation before analysis.
4-NP Water Sample Extraction
Samples were thawed and analyzed within 48 hours to prevent degradation of analytes. To
extract 4-NP from the water samples, 200mL of each sample was measured in a graduated cylinder
washed with ultrapure water. The sample container was then washed out with ultrapure water and the
measured sample was poured from the graduated cylinder back into the rinsed container. The
graduated cylinder was washed again with ultrapure water and 200mL of the next sample was
10
measured. The second container was washed with ultrapure water and the sample was poured back
from the graduated cylinder into the rinsed container. This was repeated until 200mL of all the samples
had been measured.
The solid-phase extraction (SPE) filter was washed before filtering of samples with 3mL of 10%
methanol (MeOH) solution. Once the MeOH had run through the filter 3mL ultrapure water was run
through the filters. The SPE tubes were filled with 3mL of sample at a time and gravity filtered until the
rate of filtration slowed down enough to warrant using the vacuum filter (usually around 100mL). The
vacuum was turned on to filter the remainder of the sample for the sake of saving time.
Once the samples were completely filtered, the filters were rinsed again with 6mL of a 5%
MeOH solution and 6mL of ultrapure water. They were then dried with the vacuum on for 30 min. Once
dry, test tubes were placed under the filtration tubes and the filters were washed with a 70
dichloromethane: 30 acetone solution to wash the 4-NP in the filter into the tests tubes.
The eluted 4-NP was placed under a flow of pure nitrogen. This allowed for evaporation of liquid
while keeping the 4-NP in the test tube. Once dry, 500uL of MeOH was added and the tubes were
vortexed to dissolve the dry 4-NP in the MeOH. This mixture was placed in the gas chromatograph.
4-NP Sediment Sample Extraction
An arbitrary amount (>4g) of each sediment sample was placed in a vial and dried under vacuum
for 4 days. Once dry, 2 grams of each sample were weighed out and placed in a clean vial. 10 mL of a 1:1
hexane/acetone mixture was added to each sample and the vials were sonicated for 20 minutes.
Meanwhile, silica gel for dehydrating the samples was prepared by measuring 1g SiO2 and 1g Na2SO4 and
combining in one vial.
Once sonication was complete, the vials were centrifuged for 10 minutes at 3500 rpm and 25C.
At the end of centrifugation, the liquid in each vial was pipetted off the top and was processed through
the SPE. The same process for cleaning and filtering the water sample was followed for the sediment
sample.
Gas Chromatograph Analysis
Gas chromatograph-mass spectrometry analysis was performed using an Agilent 790A gas
chromatograph along with an Agilent 7000 series triple quadrupole GC/MS detector and an Agilent 7693
autosampler. The initial column of the GC/MS/MS was held at 60oC for 0.5 min, increased to 100oC at
15oC per minute, further increased to 200oC at 5oC per minute, and finally increased to 280oC at 25oC per
minute. The backflush time is 3.0188min making the whole time for a cycle 26.867min. The inlet
temperature was set at 200oC, transfer line temperature was set at 250oC, and the ion source

11
temperature was set at 200oC. The analytical column is HP-5MS (30 m × 0.250 mm i.d., 0.25um film
thickness, Agilent, USA) and with a backflush column of Agilent res. (0.78m×150 um ×0 um). Splitless
mode was used at a Helium gas flow rate of 2.25 mL per minute. The injection volume was 1 uL and the
collision gas used was nitrogen. The x compound was qualified by electron impact at 70 eV using
multiple reaction monitoring (MRM) mode. The MS/MS quantification and confirmation ions are m/z
(107+121+135+149). According to the elute pattern of the isomers, four time segments were set in the
MRM method.
The results from the GC-MS are displayed as chromatograms. Technical grade 4-NP was used as
external standard for the qualification and the quantification of total 4-NP. The graph is created as
counts vs acquisition time in minutes. In order to quantify the concentration of the 4-NP in each sample,
the peak area is determined using the program from 19 to 21.5 minutes. In figure 2, this is shown by the
shaded area under the peaks within this range. Since 4-NP has many isomers, the different peaks
represent the different isomers all of which are important to include when determining the
concentration of 4-NP in the samples.
The area of the peaks is used in conjunction with the calibration curve to determine the 4-NP
concentration in the final extract. The concentration of the final extractant in the 2mL GC vial multiplies
the extraction concentration factor of the corresponding result in 4-NP concentration in the water or
sediment sample. (Moutinho, 2012)
Fig 3. Chromatogram of the 400 μg/L standard run on July 3, 2012. Source: Moutinho, 2012
Data processing
12
Data was processed using Microsoft Excel and JMP. The water concentration data from each site
was averaged by site; the sediment concentration was not averaged as only one sample was collected.
The weekly parameter data from the three sites was averaged from one Monday through the following
Monday. The minimum, maximum, and weighted average was determined for each week as well in
order to coincide with the 4-NP sampling dates, which occurred on Monday mornings. Sonde data was
separated by site and week so that one sheet of data would contain one week (12PM Monday-11:45AM
the following Monday) of data from any given site (one, two, or three). This allowed for faster
processing of weekly average, weighted weekly average, weekly minimum, and weekly maximum.
Finally, the concentration data from each site was compared to the parameter data from each site.
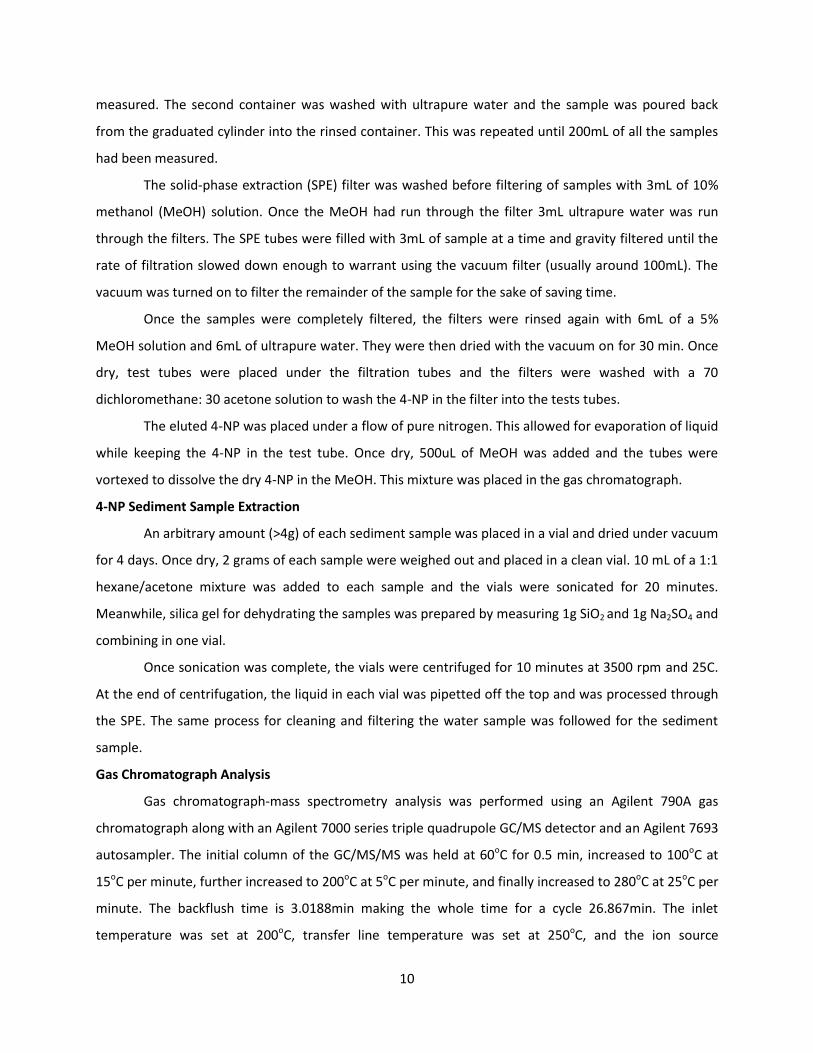
The generation of a model for exponential decay was discussed with LISA so that each point
would have an increasingly greater factor in determining weekly averages, giving a total weight of one
for all points. The model that was produced was (y=9x10⁻⁶ex). This exponential decay, based on data
from Topp and Starratt (1999), gives a total weight of 1 to stream parameters collected over the entire
week while giving more weight parameters measured closer to the collection dates. Because 4-NP is
removed quite quickly from the stream in a matter of days, any parameters being compared to its
concentration were not expected to have as significant an impact as more recent parameter
measurements and were therefore weighted accordingly in the average. The minimum and maximum
values were also included to determine threshold values for partitioning and solubility.
Due to the strongly negative skewness of the raw data samples, a ln-normal plot was used to
provide a more normalized distribution for parametric analysis. Using JMP, the 4-NP concentration data
was converted into a ln-normal plot for both the water column and the bed sediment. Each value (min,
max, average, weighted average) of each parameter (dissolved oxygen, pH, conductivity, turbidity,
temperature) was plotted against the ln of both the water and sediment concentrations. Residuals were
also calculated.
13
Figure 4. Weighted average curve developed by to give more weight to more recently collected parameters, based off data from previous literature (Topp and Starratt 1999).
STATISTICAL ANALYSIS
Weekly analysis comparison: With the assistance of statistical collaborators from LISA
(Laboratory for Interdisciplinary Statistical Analysis), a program that assists students on the Virginia Tech
campus with statistical analysis of project data, the weekly sonde parameter weighted averages were
compared to the weekly 4-NP sample concentration and analyzed for correlation between any of the
parameters and 4-NP concentration.
Each measurement (maximum, minimum, average, and weighted average) of each parameter
(DO, % saturation DO, turbidity, conductivity, pH, and temperature) was then analyzed for correlation in
JMP using a scatterplot matrix. Correlation coefficient values greater than .30 were considered slightly
correlated, while any values greater than .50 were considered strongly correlated (personal
communication, LISA and Dr. Holtzman). This process was used as a preliminary test to determine which
parameters had at least some degree of correlation.
These parameters found to have a correlation coefficient greater than .30 were then analyzed
non-parametrically using Spearman’s rank correlation coefficient. Spearman’s coefficient was chosen to
analyze the correlation between ln(concentration) and parameter values for its ability to measure
statistical dependence between two continuous variables in addition to being less sensitive to strong
outliers that were prevalent in this study. These Spearman rho values were used to verify correlation.
Once non-parametric correlation between parameters and ln(concentration) had been verified, the
residual error of the linear correlation was plotted to show that it was evenly distributed against the ln-
normal data.

14
RESULTS
Distribution
Figure 5. Sediment 4-NP concentration (ug/kg) distribution.
Figure 6. Water 4-NP concentration (ug/L) distribution.
15
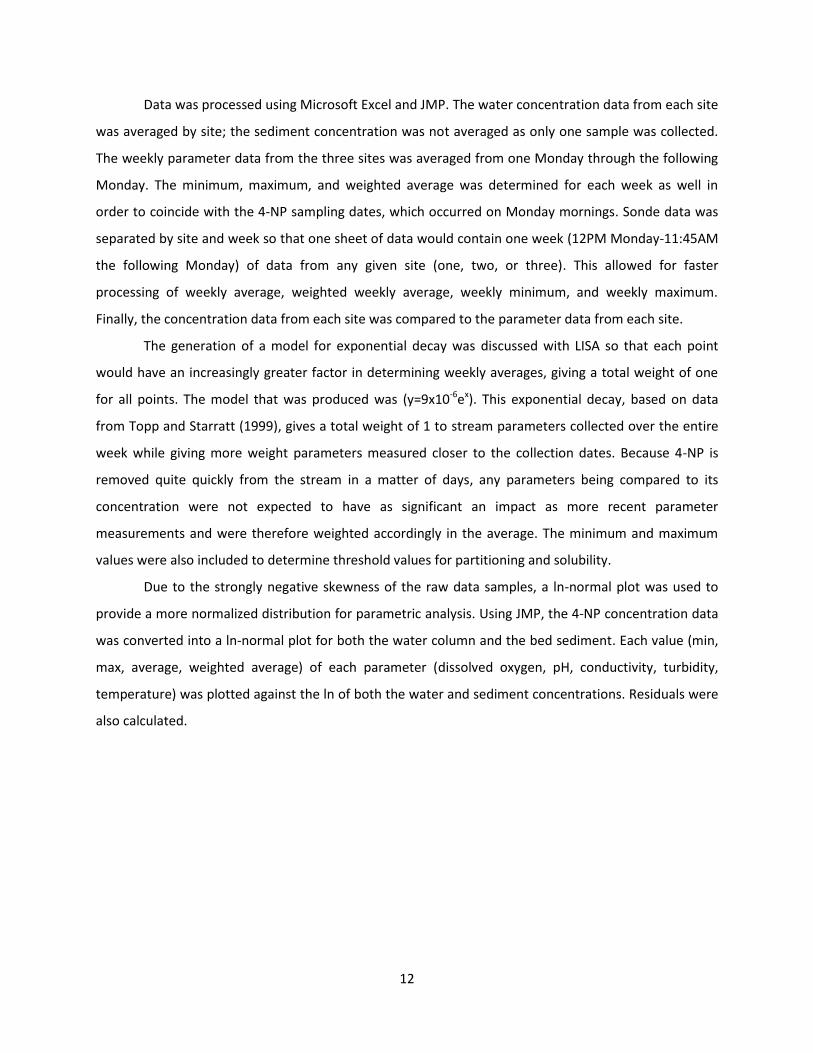
Figure 7. Normalized ln(4-NP sediment concentration) distribution.
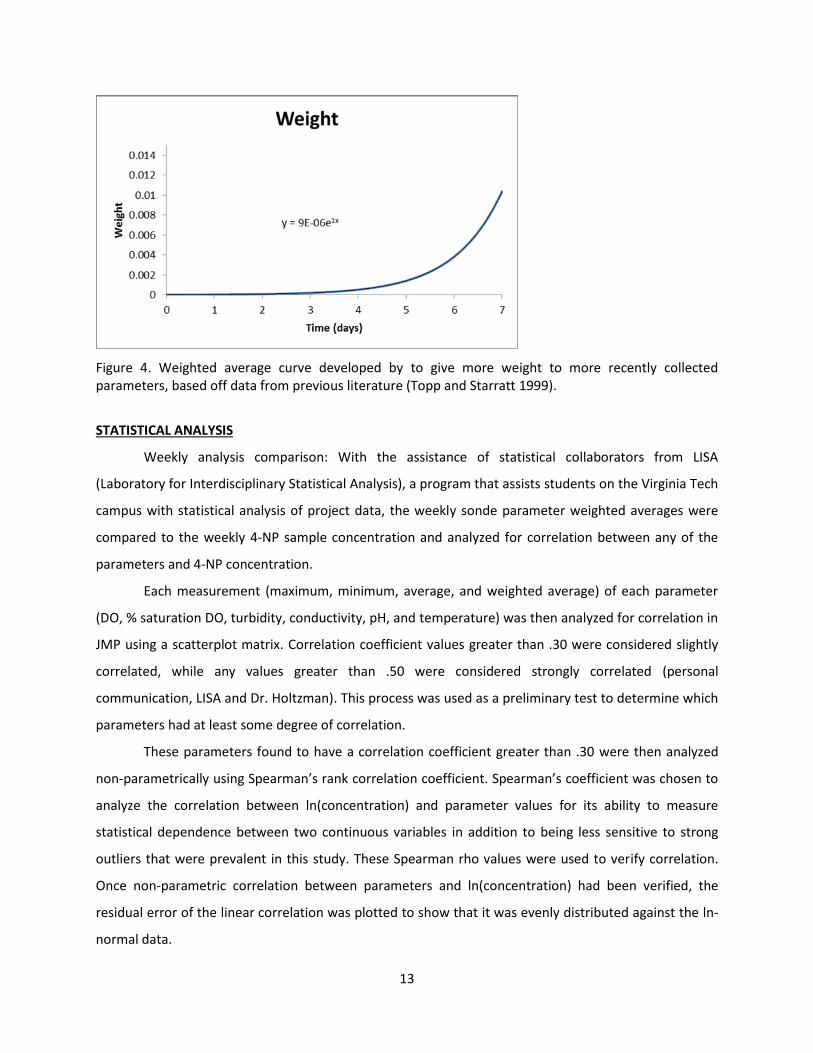
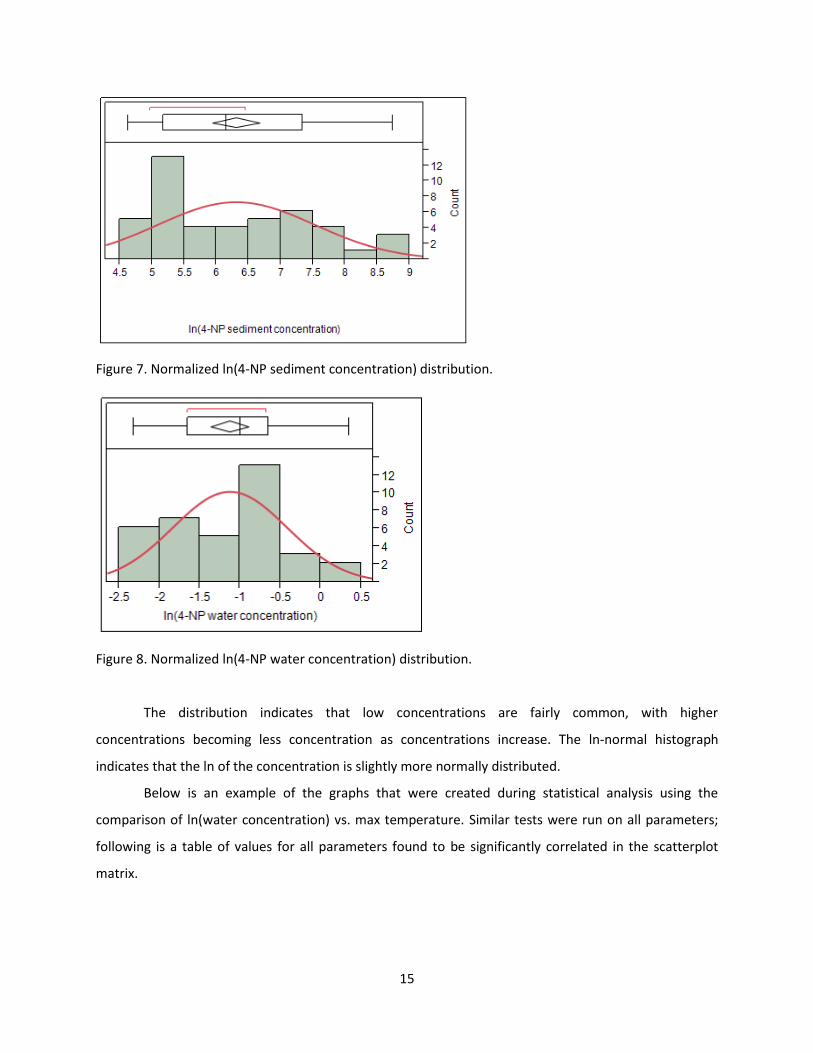
Figure 8. Normalized ln(4-NP water concentration) distribution.
The distribution indicates that low concentrations are fairly common, with higher
concentrations becoming less concentration as concentrations increase. The ln-normal histograph
indicates that the ln of the concentration is slightly more normally distributed.
Below is an example of the graphs that were created during statistical analysis using the
comparison of ln(water concentration) vs. max temperature. Similar tests were run on all parameters;
following is a table of values for all parameters found to be significantly correlated in the scatterplot
matrix.

16
Figure 9. Scatterplot matrix correlation plot of ln(water conc) vs. temp max.
Figure 10. Plotted residuals of temp max vs. water concentration, showing normalized distribution. Mean residual error =1.015e-16.

17
Figure 11. Plot of ln(water conc) vs. temp max. The equation was found to be: ln (water conc)=-3.108683 + 0.0745811*tempMax
Figure 12. Correlation values, residual values, and equations for significantly correlated ln(water conc) parameters. Note that values determined to be not significant are not included in this table.
Figure 13. Correlation values, residual values, and equations for significantly correlated ln(sediment conc) parameters. Note that values determined to not be significant are not included in this table.
The weekly measured water parameters that were found to be correlated (r > .30) with ln(4-NP
water concentration) were maximum temperature (positive), maximum turbidity (positive), weighted
average turbidity (positive), minimum percent dissolved oxygen (negative), weighted average percent
Scatterplot correlation (p=.10) Spearman's rho Mean residual error Equation
Temp max 0.3158 0.7278 1.02E-16 ln (water conc)=-3.108683 + 0.0745811*tempMax
Turbidity max 0.3362 0.8319 1.27E-17 ln (water conc)= -1.314593 + 0.0005758*TurbMax
Turb weighted avg 0.3117 0.8161 -1.78E-16 ln (water conc)= -1.250195 + 0.0062698*TurbWAvg
DO % min -0.3909 -0.7702 -3.24E-16 ln (water conc)= 1.5642206 - 0.0431757*DO%Min
DO % weighted avg -0.4502 -0.7363 2.73E-16 ln (water conc)= 4.080151 - 0.0620596*DO%Wavg
DO min -0.3057 -0.7456 -2.98E-16 ln (water conc)= 0.3399041 - 0.2616293*DOMin
DO weighted avg -0.4129 -0.4232 -1.11 ln (water conc)= 1.5516164 - 0.3481977*DOWAvg
ln(water 4-NP concentration)
Scatterplot correlation (p=.10) Spearman's rho Mean residual error Equation
Temp min 0.3594 0.7105 -1.39E-15 ln (sed conc)= 4.6388001 + 0.1050106*tempMin
Temp max 0.4953 0.8706 -1.09E-15 ln (sed conc)= 0.896712 + 0.1982751*tempMax
Temp avg 0.476 0.8444 0.0808 ln (sed conc)= 1.9186665 + 0.2072973*tempAvg
Temp weighted avg 0.4731 0.8331 7.43E-02 ln (sed conc)= 2.869848 + 0.1666804*tempWAvg
Turbidity max 0.3742 0.7948 -2.31E-15 ln (sed conc)= 5.9375285 + 0.0010626*TurbMax
DO % min -0.6032 -0.8887 -3.85E-15 ln (sed conc)= 12.683851 - 0.1054644*DO%Min
DO min -0.5652 -0.8903 -4.38E-15 ln (sed conc)= 10.564311 - 0.7901679*DOMin
DO max -0.3915 -0.7509 -3.34E-15 ln (sed conc)= 13.093933 - 0.5637333*DOMax
DO avg -0.473 -0.8597 -1.93E-15 ln (sed conc)= 13.483401 - 0.9288989*DOAvg
ln(sediment 4-NP concentration)
18
dissolved oxygen (negative), minimum dissolved oxygen (negative), dissolved oxygen weighted average
(negative), and total rainfall (positive).
The weekly measured water parameters found to be correlated with ln(4-NP sediment
concentration) were minimum temperature (positive), maximum temperature (positive), average
temperature (positive), weighted average temperature (positive), maximum turbidity (positive),
minimum percent dissolved oxygen (negative), minimum dissolved oxygen (negative), maximum
dissolved oxygen (negative), and average dissolved oxygen (negative).
DISCUSSION
From reviewing previously published literature the observed correlations of ln(4-NP water
concentration)with temperature (positive), turbidity (positive), and rainfall (positive) were expected.
The increase in temperature would allow for better mixing between a lipophilic chemical and water
(Cornellisen et al., 1997), while greater rainfall would transport more 4-NP from its source into the
stream through surface runoff (Sole et al., 2000) and increased turbidity would allow for desorption of 4-
NP from fine sediment (Gao et al., 1998; Liber et al., 1999). The overall negative correlation with
dissolved oxygen was also expected as well based on the work of Faust and Holgne (1987). However, DO
is affected by many other stream parameters such as temperature and rainfall. Further testing should be
performed to rule out confounding variables.
Based on the aforementioned dissolved oxygen studies (Pellizetti et al., 1989; Faust and Holgne,
1987; Yu et al., 2003), the observed negative correlation with ln(4-NP sediment concentration) was
expected. However, the other significantly correlated parameters did not correlate with ln(4-NP
sediment concentration) in the expected manner. Temperature and turbidity both showed a positive
correlation with ln(4-NP sediment concentration), the same as ln(4-NP water concentration). This would
indicate that as temperature and turbidity increase 4-NP increases in both sediment and water, or
causes an overall net gain in the stream rather than partitioning from one matrix to another. From
previously published literature it would have been expected that as water temperatures increased, 4-NP
would desorb from fine particulate sediment more readily and decrease concentration within sediment
(Cornellisen et al., 1997). However, each temperature value measured indicated that increasing
temperature increased 4-NP concentration in sediment. Although this correlation may be caused by a
confounding extraneous variable such as runoff caused by rainfall, further research is suggested.
The positive correlation with turbidity may be explicable by surface runoff of 4-NP from its
source during a rain event (Sole et al., 2000) which would also coincide with increases in turbidity.
19
Although a source has yet to be determined for Stroubles Creek, it is safe to say that Stroubles Creek
itself does not produce synthetic chemicals like 4-NP on its own. Rather rain events cause washing from
the as-yet undetermined source into Stroubles, increasing overall net 4-NP concentration in the stream.
However, again further research would be suggested.
It was expected that decreases in pH during rain events would have a positive correlation with
water 4-NP concentration and a negative correlation with sediment 4-NP concentration. However, due
to the brevity of the changes (typically a .2 unit decrease over <2 hours before recovering) with respect
to the amount of time the stream was monitored (168 hours in a week), it is reasonable that no
correlation would have been noticed. Additionally, because no samples were taken during a rain event
but rather after the stream pH had sufficient time to return to its normal pH, it is reasonable that pH
would not appear to correlate. Finally, because the stream pH is constantly below the pKa of 4-NP, there
would not be much of a change in chemical properties between base flow and rain events. Regardless,
in future studies samples should be collected on shorter time scales, specifically during rain events, to
ascertain the effect acute decreases in pH may have on concentration.
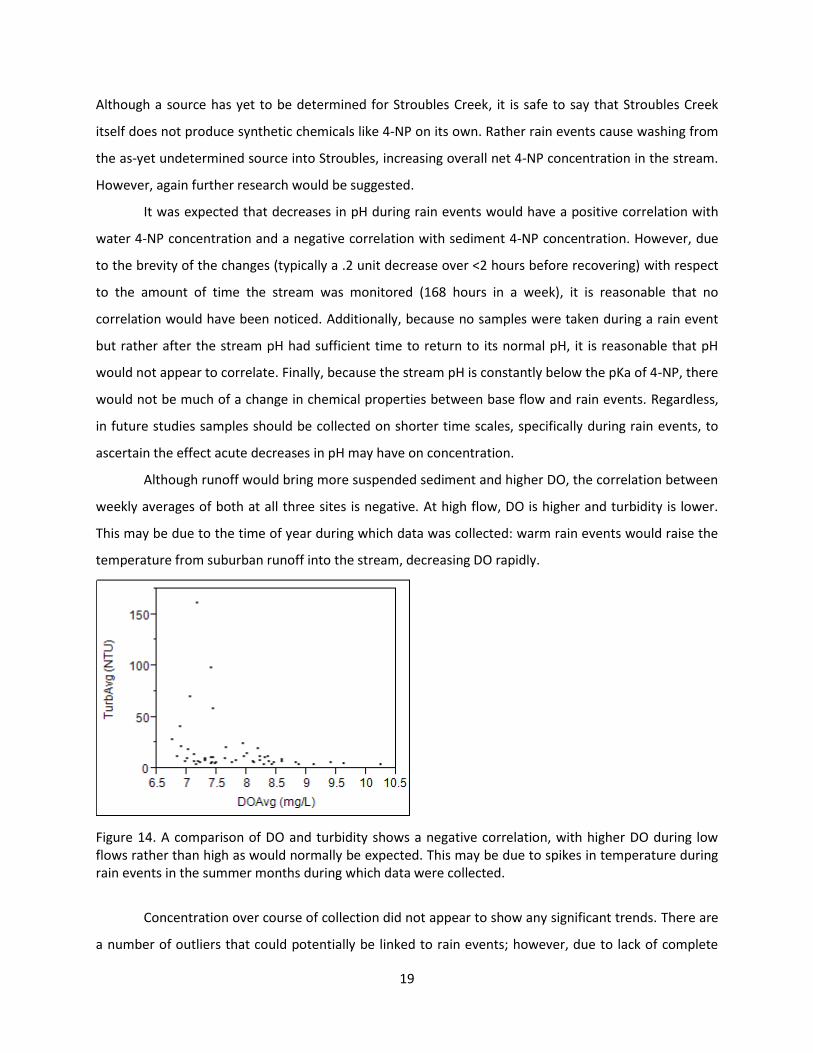
Although runoff would bring more suspended sediment and higher DO, the correlation between
weekly averages of both at all three sites is negative. At high flow, DO is higher and turbidity is lower.
This may be due to the time of year during which data was collected: warm rain events would raise the
temperature from suburban runoff into the stream, decreasing DO rapidly.
Figure 14. A comparison of DO and turbidity shows a negative correlation, with higher DO during low flows rather than high as would normally be expected. This may be due to spikes in temperature during rain events in the summer months during which data were collected.
Concentration over course of collection did not appear to show any significant trends. There are
a number of outliers that could potentially be linked to rain events; however, due to lack of complete

20
rainfall data, this could not be determined, The outliers show no relevant correlation to other
parameters and may be caused by leaching from the source. Further investigation into the source of the
4-NP found in the stream would be informative.
Figure 15. Concentration of 4-NP in sediment samples over duration of sample collection.
Figure 16. Concentration of 4-NP in water samples over duration of sample collection.
Future Work
Because of a restriction of resources, samples were only collected on a weekly basis to ease
scheduling and reduce the use of resources. Future studies should include sampling during high flows to
determine short-term, acute effects as opposed to just chronic, week-long effects. Because all of the
parameters change to some degree for such a short time during rain events they have little impact on
the weekly average which may affect the correlation of some of the data. For example, pH may show

21
strong correlation during a rain event due to sharp decreases during rain events; because no samples
were collected during rain events, any correlation (or lack thereof) could not be observed. DO showed
significant negative correlation in both water and sediment samples; it may show stronger negative
correlation during cold winter rain events that raise DO, or weaker correlation during hot summer rain
events that lower DO. Although this is only conjecture it could be concluded more definitely in a future,
more thorough study.
This observational study occurred over the course of two different seasons (begin early summer,
end mid fall), which is significantly longer than any studies performed in the literature review. These
seasonal changes were unaccounted for in the final analysis that covered the entire study. These
seasonal changes can cause unaccounted variations such as: organic carbon input, water temperature,
rainfall amount, and DO, among others. Accounting for these seasonal differences would require an
increase in resources such as the ability to measure organic carbon. No calendar season was recorded in
entirety, which would make comparing one season to another inaccurate at best without a complete set
of coinciding data.
Rainfall data was obtained from Virginia Tech’s BSE department, but only ran for one month of
data collection and so was not analyzed. Few rain events occurred during the short period of available
rainfall data, which makes determination of correlation difficult. However, there are a number of
outliers present in the data that may well be due to rain events. At the collection points in the stream
rain events are the only likely cause for changes in parameters. In future endeavours it would be worth
obtaining continuous rainfall data, perhaps from the town of Blacksburg which would be more complete
than the one rain gauge at BSE site two.
There were a number of possible factors that could affect the concentration of 4-NP that were
not monitored in this study. As discussed in the literature review, organic carbon concentration in the
sediment was not accounted for nor was is standardized among the sites. The precipitation temperature
was also not recorded for the duration of this study; however, the temperature of the rain may
contribute to the transport of 4-NP from its source to the stream and therefore should be monitored in
the future.
It is possible that some equipment utilized in the acquisition of parameter data was not
functioning properly: for example, the BSE sondes located along the stream indicated a conductivity of
400 ms at the first site, a sudden drop to 0 ms at the second site, and an increase back to 390 ms at the
third site. This happened every week over the course of the study, at random intervals each week lasting
from a few hours to a few days. These readings were consistent, and the second site conductivity data

22
was not included in the final analysis. Additionally, one sonde reported an average turbidity of 200 NTU
which is unlikely except in the event of a weeklong storm, or with multiple readings of very high
turbidity. The rain data indicated there was only 13mm of rain during the week this average was
recorded, implying the possibility of obstructed equipment which is a possibility. These data points were
not excluded during analysis because they were infrequent, and multiple communications with BSE
assured that the equipment is maintained and calibrated regularly.
ACKNOWLEDGMENTS
I thank my committee members Dr. Xia, Dr. Lohani, and Dr. Zipper for their support and
guidance through this project, and for taking the time to read revisions and offer suggestions to help
improve this report. I also thank the members of Dr. Xia’s lab: Terri Sosienski, Paul Parker, Christiana,
and Jennifer Moutinho for performing the sediment and water sample collection and analysis. I thank
my statistics team Andy Hoegh and Amy Till for their patience with me in explaining statistics and their
invaluable assistance with the data analysis. Thanks to Dr. Ingrid Lee for assistance with my literature
review and Dr. Mary Lee for providing suggestions on statistical analysis. Finally thanks to the BSE
department, in particular Dr. Cully Hession, Siavash Hoomehr, and the StREAM Lab for being willing to
work with me and for providing the water parameter data that was used in this observational study.
23
SOURCES
Brix R, Hvidt S, Carlsen L. 2001. Solubility of NP and NP ethoxylates on the possible role of micelles. Chemosphere 44:759-763. Cornellisen G, Van Noort PCM, Parsons JR, Govers HAJ. 1997. Temperature dependence of slow adsorption and desorption kinetics of organic compounds in sediments. Environmental Science and Technology 31:454-460. Dachs, J., D.A. Van Ry, and S.J. Eisenreich. 1999. Occurrence of estrogenic NPs in the urban and coastal atmosphere of the lower Hudson River estuary. Environmental Science and Technology 33:2676–2679. Ekelund R, Granmo A, Magnusson K, Berggren M. 1993. Biodegradation of 4-NP in seawater and sediment. Environmental Pollution 79:59-61. Faust, B.C., and J.Holgne . 1987. Sensitized photooxidation of phenols by fulvic acid and in natural waters. Environmental Science and Technology 21: 957–964. Gao JP, Maguhn J, Spitzauer P, Kettrup A. 1998. Sorption of pesticides in the sediment of the Teufelsweiher Pond (Southern Germany). I: Equilibrium assessments, effect of organic carbon content and pH. Water Research 32:1662-1672. Gao JP, Maguhn J, Spitzauer P, Kettrup A. 1997. Distribution of pesticides in the sediment of the small Teufelsweiher pond (southern Germany). Water Research 31:2811-2819. Kolpin, D.W., E.T. Furlong, M.T. Meyer, E.M. Thurman, S.D. Zaugg, L.B. Barber, and H.T. Buxton. 2002. Pharmaceuticals, hormones, and other organic wastewater contaminants in U.S. streams, 1999– 2000: A national reconnaissance. Environmental Science and Technology 36:1202– 1211. Leblanc GA, Xueyan M, Rider CV. 2000. Embryotixicity of the alkylphenol degradation product 4-nonylphenol to the crustacean Daphnia magna. Environmental Health Perspectives 108:1133-1138. Liber K, Knuth ML, Stay FS. 1999. An integrated evaluation of the persistence and effects of 4-NP in an experimental littoral system. Environmental Toxicology and Chemistry 18:357-362. Maguire, R.J. 1999. Review of persistence of NP and NP ethoxlates in aquatic environments. Water Quality Research Journal of Canada 34:37-78. McCormick SD, O’Dea MF, Moeckel AM, Lerner DT, Bjornsson BT. 2005. Endocrine disruption of parr-smolt ptransformation and seawater tolerance of Atlantic salmon by 4-NP and 17β-estradiol. General and Comparative Endocrinology 142:280-288. Miles-Richardson SR, Pierens SL, Nichols KM, Kramer VJ, Snyder EM, Snyder SA, Render JA, Fitzgerald SD, Giesy JP. 1999. Effects of Waterborne Exposure to 4-NP and NP Ethoxylate on Secondary Sex Characteristics and Gonads of Fathead Minnows (Pimephales promelas). Environmental Research 80:122-137.

24
Moutinho, J. 2010. Investigating the Occurrence and Fate of 4-NP in a Watershed Impacted by Urban Development. Pelizzetti, E., C. Minero, V. Maurino, A. Sclafani, H. Hidaka, and N. Serpone. 1989. Photocatalytic degradation of NP ethoxylated surfactants. Environ. Sci. Technol. 23:1380–1385. Pereira WE, Domagalski JL, Hostettler FD, Brown LR, Rapp JB. 1996. Occurrence and accumulation of pesticides and organic contaminants in river sediment, water and clam tissues from the San Joaquin River and tributaries, California. Environmental Toxicology and Chemistry 15:172-180. Pionke HB and Chesters G. 1973. Pesticide-Sediment-Water Interactions. Journal of Environmental Quality 2:29-45. Shang, D.Y., R.W. MacDonald, and M.G. Ikonomou. 1999. Persistence of NP ethoxylate surfactants and their primary degradation products in sediments from near a municipal outfall in the Strait of Georgia, British Columbia, Canada. Environmental Science and Technology 33:1366–1372. Sole ,M.,M.J.L.DeAlda,M. Castillo,C. Porte,K. Ladegaard-Pedersen, and D. Barcelo. 2000. Estrogenicity determination in sewage treatment plants and surface waters from the Catalonian area (NE Spain). Environmental Science and Technology 34:5076–5083. Thiele, B., K. Gunther, and M.J. Schwuger. 1997.Alkylphenol ethoxylates: Trace analysis and environmental behavior. Chemical Reviews 97: 3247–3272. Topp, E and Starratt, A. 1999. Rapid Mineralization Of The Endocrine-Disrupting Chemical 4-Nonylphenol In Soil. Environmental Toxicology and Chemistry 19:313-318. Turchi CS and Ollis DF. 1990. Photocatalytic degradation of organic water contaminants; mechanisms involving hydroxyl radical attack. Journal of Catalysis 122:178-192. Vazquez-Duhalt R, Marquez-Rocha F, Ponce E, Licea AF, Viana MT. 2005. NP, an integrated vision of a pollutant. Applied Ecology and Environmental Research 4:1-25. Vinten AJA, Yaron B, Nye PH. 1983. Vertical transport of pesticides into soil when adsorbed on suspended particles. Journal of Agriculture and Food Chemistry 31: 662-664. Voice TC, Weber WJ. 1983. Sorption of Hydrophobic compounds by sediments, soils and suspended solids I-theory and background. Water Research 17:1433-1441. Wauchope RD. 1978. The pesticide content of surface water draining from agricultural fields-a review. Journal of Environmental Quality 7:459-472. Weston DP, You J, Lydy MJ. 2004. Distribution and Toxicity of sediment-associated pesticides in agriculture-dominated water bodies of California’s central valley. Environmental Science and Technology 38:2752-2759.
25
Xia K, Jeong CY. 2004. Photodegradation of the Endocrine-Disrupting Chemical 4-NP in Biosolids Applied to Soil. Journal of Environmental Quality 33:1568-1574. Xie L, Thrippleton K, Irwin MA, Seimering GS, Mekebri A, Crane D, Berry K, Schlenk D. 2005. Evaluation of Estrogenic Activities of Aquatic Herbicides and Surfactants Using an Rainbow Trout Vitellogenin Assay. Toxicological Sciences 87:391-398. Yuan SY, Yu CH, Chang BV. 2003. Biodegradation of NP in river sediment. Environmental Pollution 127:425-430. Younos, T. Parece, T. DiBettito, S. Sprague, T. 2006. The Stroubles Creek Watershed: History of Development and Chronicles of Research. VWRRC Special Report No. SR48-2010. Personal communication, Dr. Golde Holtzman (October 2012). Personal communication, Andy Hoegh and Amy Till (November 2012).
26
APPENDIX
Figure A. Spearman rank correlation coefficient and associated p-values values for all ln(4-NP water conc) parameter correlations.
Figure B. Spearman rank correlation coefficient and associated p-values values for all ln(4-NP sediment conc) parameter correlations.

27
Figure C. Pearson rank correlation coefficient values for all parameters.
Figure D. Associated p-values of Pearson rank correlation coefficients for all parameters.
DO%min DO%max DO%avg DO%wavg DOMin DOMax DOAvg DOWavg phMin phMax phAvg phWavg
ln(4-NP water conc) 0.0184 0.0876 0.6573 0.0059 0.0697 0.3928 0.705 0.0123 0.7602 0.6145 0.3936 0.2314
ln(4-NP sediment conc) <.0001 0.5658 0.0749 0.5866 <.0001 0.0078 0.001 0.0464 0.7229 0.93 0.5878 0.3576
TempMin TempMax TempAvg TempWavg CondMin CondMax CondAvg CondWavg TurbMin TurbMax TurbAvg TurbWavg
ln(4-NP water conc) 0.6673 0.0606 0.3949 0.108 0.4944 0.4609 0.555 0.7154 0.6177 0.045 0.4611 0.0642
ln(4-NP sediment conc) 0.0153 0.0005 0.0009 0.001 0.5679 0.3773 0.6075 0.3237 0.2424 0.0113 0.1264 0.1171