Embed Size (px)
Citation preview
Correlations
Determining Relationships:
Chapter 5:123-127
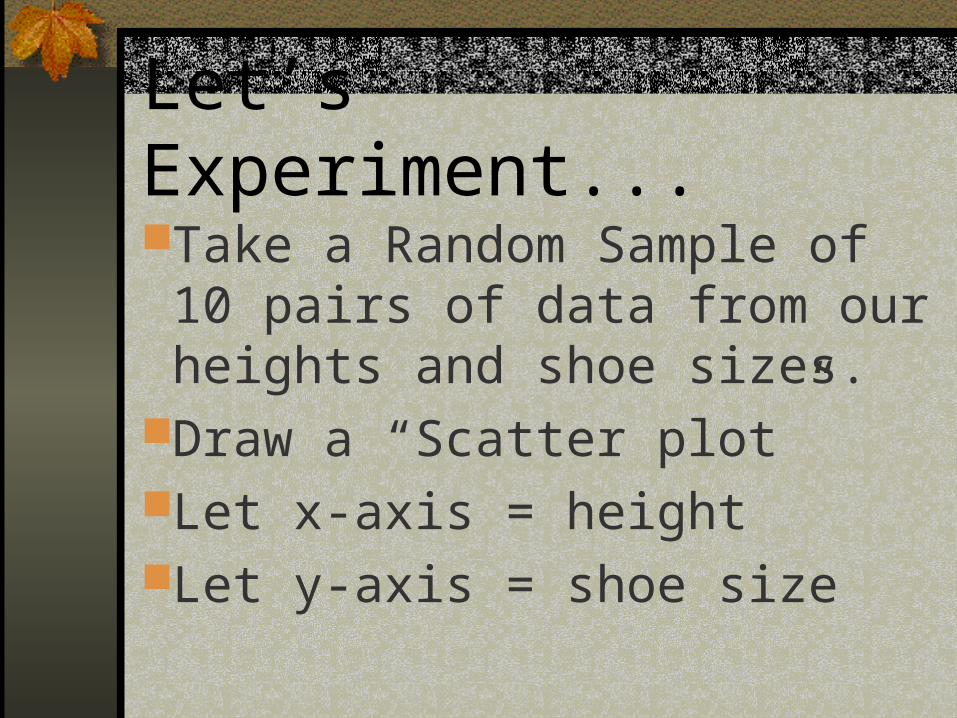
Let’s Experiment...
Take a Random Sample of 10 pairs of data from our heights and shoe sizes.
Draw a “Scatter plot”Let x-axis = heightLet y-axis = shoe size
See the point?
Draw a “best fit” line (trend line) through the dots
Make a conclusion
Scatter plots “visualize” correlationsWhen dots fall near the line, the
correlation is strongWhen dots are widely scattered,
the correlation is weakGraphs are quick, but math is
more precise (of course!)
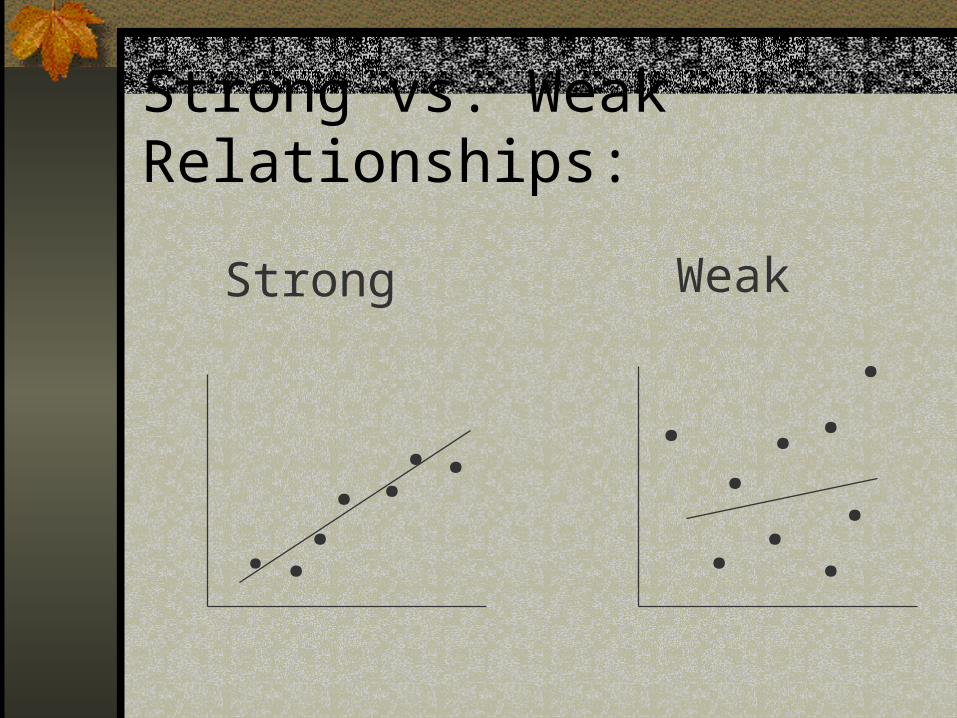
Strong vs. Weak Relationships:
Strong Weak
. .. .
.. . .
..
.
.
.
.
.
.
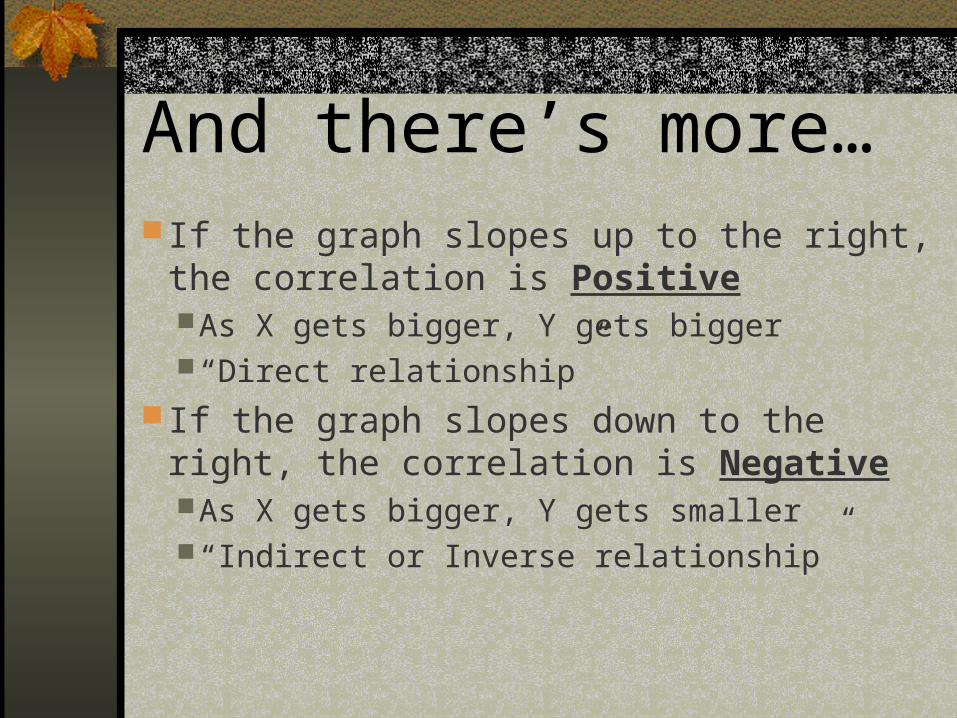
And there’s more… If the graph slopes up to the right, the
correlation is PositiveAs X gets bigger, Y gets bigger“Direct relationship”
If the graph slopes down to the right, the correlation is NegativeAs X gets bigger, Y gets smaller“Indirect or Inverse relationship”

Positive and Negative Relationships
Positive Negative
X
Y Y
X
QUESTION:
Think of 5 “pairs” of data you could gather to compare (heights and shoe sizes) to observe a correlation.
Teaching Applications
Free Throw % vs. Arm StrengthSwimming Stroke # vs. TimesExpert Judge vs. Skill
AchievementTeaching Method vs. Student
Outcomes
Wellness ApplicationsSmoking vs. CAD RiskSkinfold thickness vs. Body
DensityHeart Rate vs. VO2
Flexibility vs. Lower Back Pain
Uses of correlational researchExploration: “I wonder if
these variables are related?”Prediction: “I wonder if I can
predict one from the other?”
Quantifying the Relationship for precision
Does that mean “math”?
Pearson Product Moment: r=
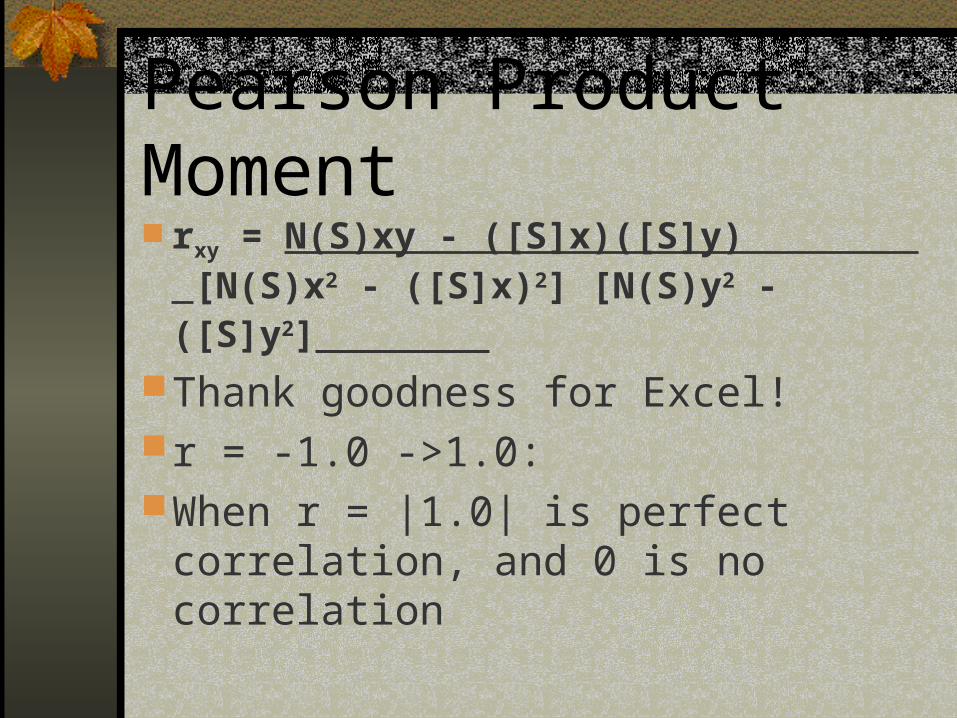
Pearson Product Moment rxy = N(S)xy - ([S]x)([S]y) [N(S)x2
- ([S]x)2] [N(S)y2 - ([S]y2] Thank goodness for Excel! r = -1.0 ->1.0: When r = |1.0| is perfect correlation,
and 0 is no correlation
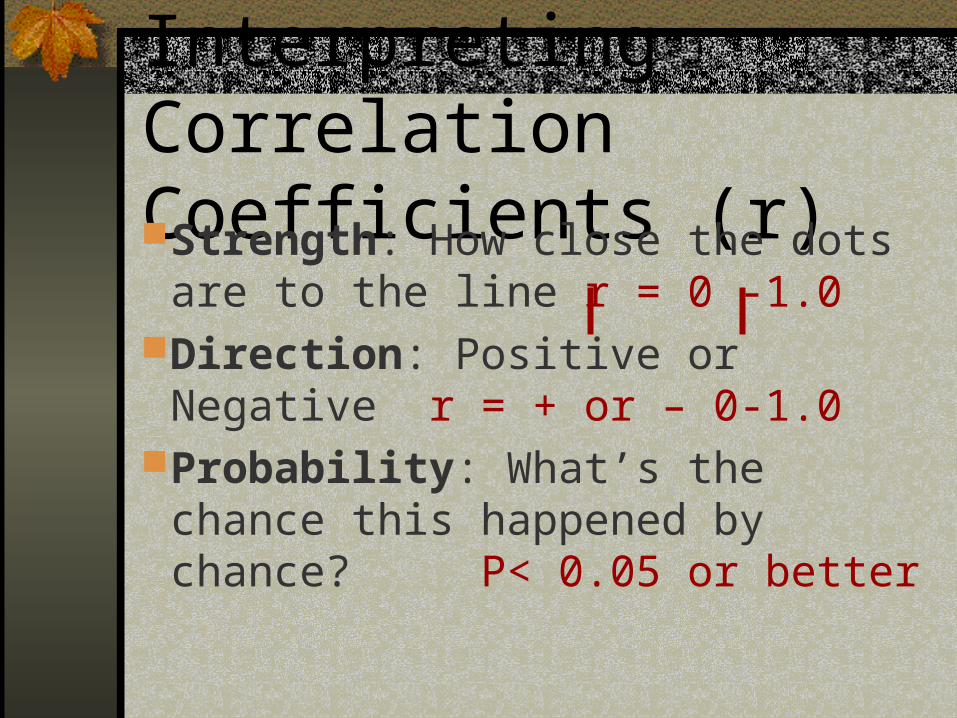
Interpreting Correlation Coefficients (r)Strength: How close the dots are
to the line r = 0 -1.0Direction: Positive or Negative r =
+ or – 0-1.0Probability: What’s the chance
this happened by chance? P< 0.05 or better
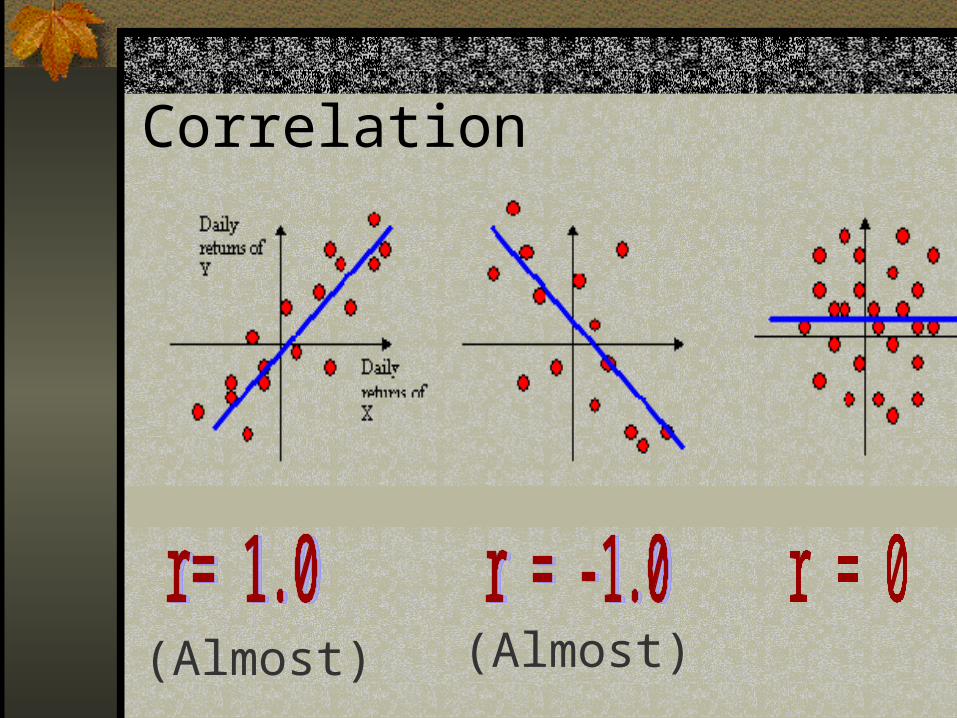
Correlation
(Almost) (Almost)
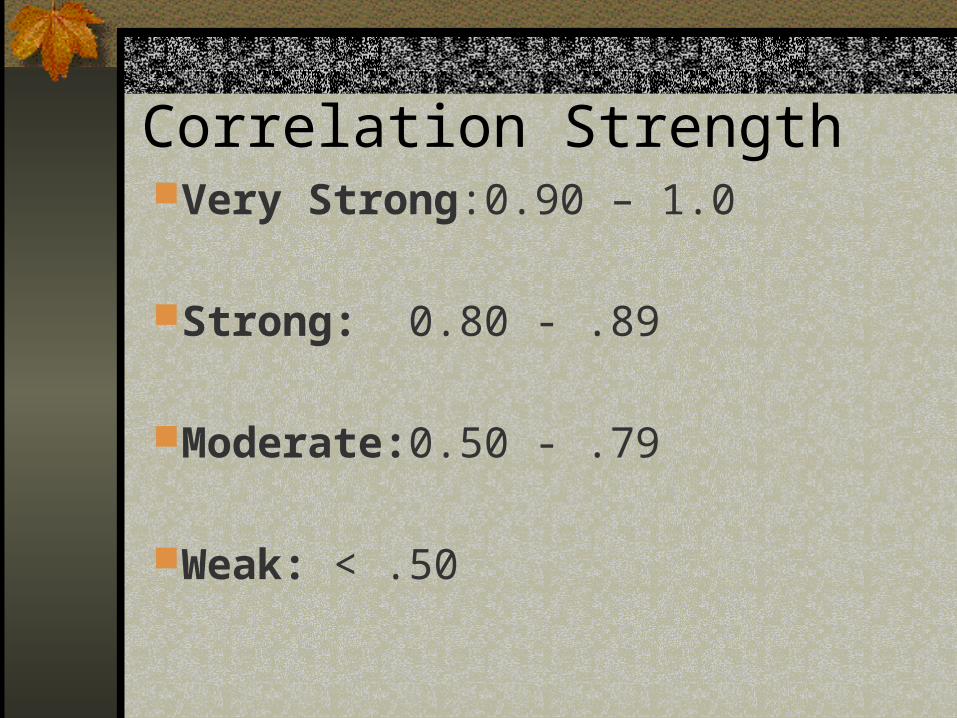
Correlation StrengthVery Strong: 0.90 – 1.0
Strong: 0.80 - .89
Moderate: 0.50 - .79
Weak: < .50
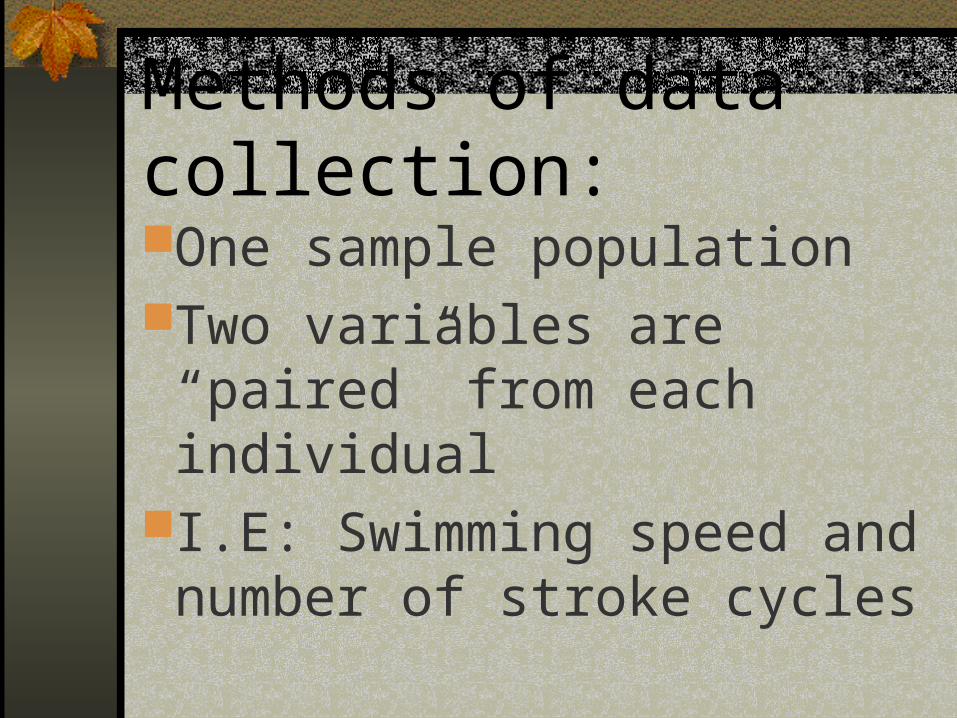
Methods of data collection:One sample populationTwo variables are “paired”
from each individualI.E: Swimming speed and
number of stroke cycles
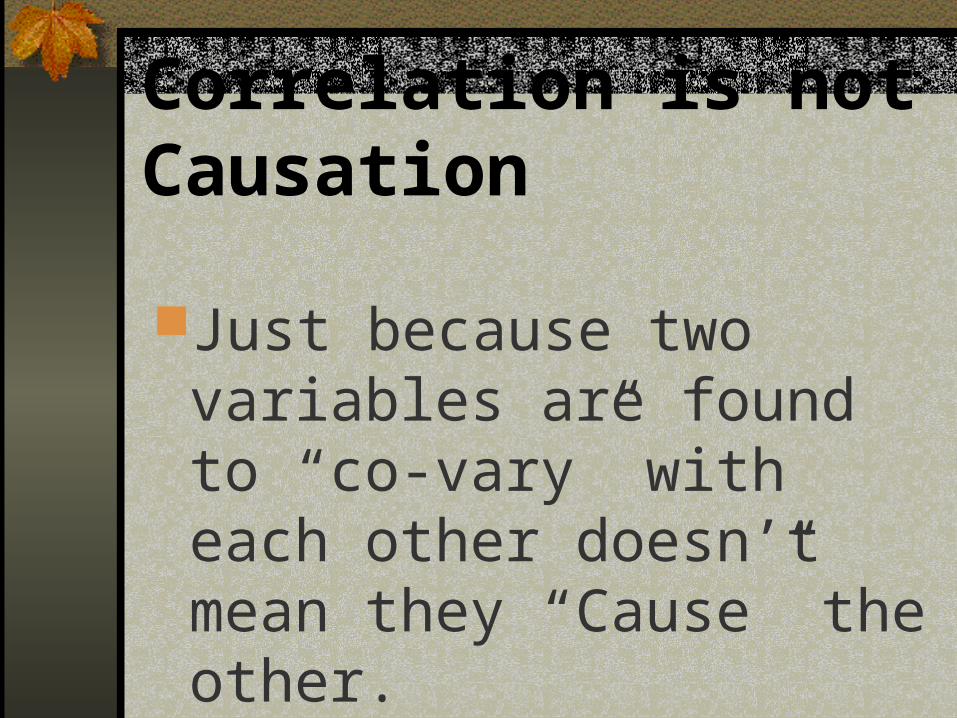
Correlation is not Causation
Just because two variables are found to “co-vary” with each other doesn’t mean they “Cause” the other.
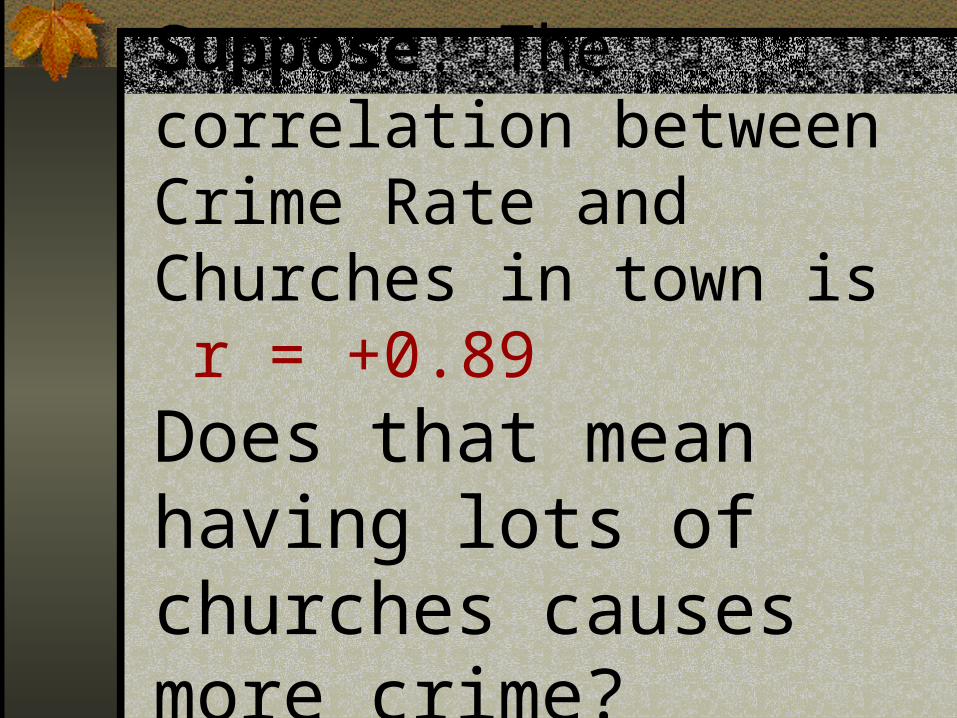
Suppose: The correlation between Crime Rate and Churches in town is r = +0.89Does that mean having lots of churches causes more crime?
Summary
Correlations look for relationships in variance between two variables
Scatter plots are used to visualize (graph) correlations
Summary, cont...Pearson Product Moment is
an example of statistical quantification of co-variance: r = -1.0 -> +1.0
When r = |1.0|, the relationship is perfectly strong
Summary, cont.
r = 0: There is no correlationNegative: inversely related -
when one gets higher, the other gets lower
Positive: Both get higher or lower together

Strong vs. Weak Relationships:
Strong Weak
. .. .
.. . .
..
.
.
.
.
.
.
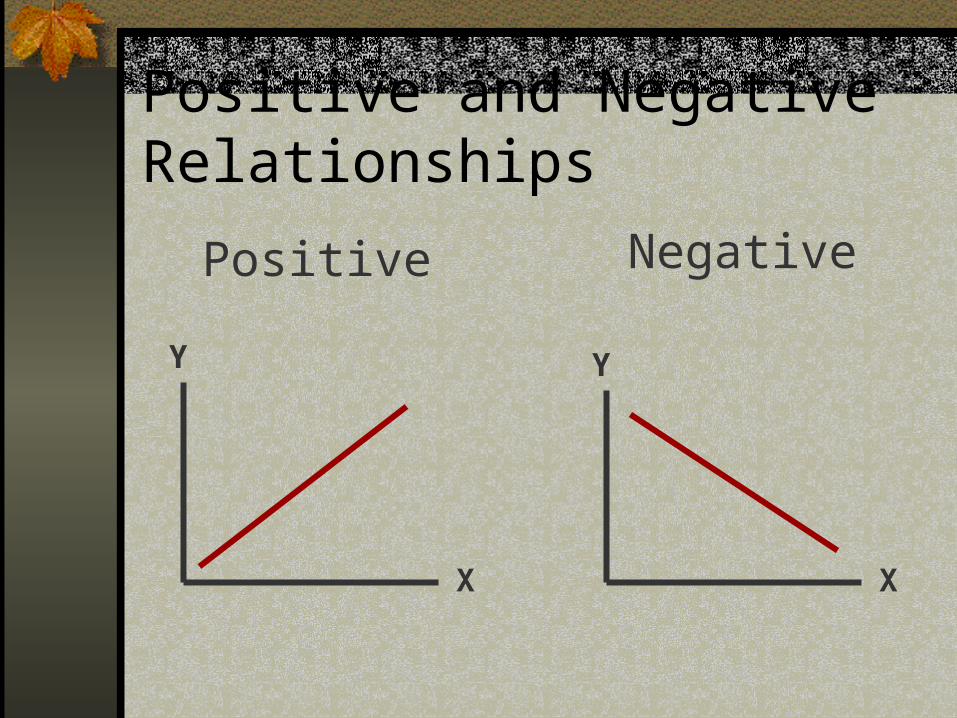
Positive and Negative Relationships
Positive Negative
X
Y Y
X

Correlation
(Almost) (Almost)
Lab 3: CorrelationsRead the Lab thoroughly Import Data from my Web siteDetermine your hypothesis
regarding the measurement that has the best correlation with body fatness:
Complete the lab

N.C. Wyeth, “The Spruce Ledge”