Embed Size (px)
Citation preview
FINANCIAL CONDUCTR~~ AUTHORITY
25 The North Colonnade Canary Wharf London E145HS
Tel: +44 (0)20 7066 1000The Rt Hon Nicky Morgan MP Fax: +44 (0)20 7066 1099
Treasury Select Committee www.fca.org.uk House of Commons London SWlA OAA
25 October 2017
Our Ref: SA171020Z
Indebtedness among young people
Thank you for your letter of 18 October 2017 concerning indebtedness among young people.
You have asked me to set out the evidence I have seen on the trends and causes of indebtedness in younger groups and how this debt is being used to fund essential living costs. You also ask for the underlying detail that our Financial Lives Survey was based on. Lastly you would like to know whether the FCA has looked at the macro-economic implications of this indebtedness and if so whether we have considered any solutions.
Broad trends in credit use
Consumer credit plays an important role in society by enabling borrowers to purchase goods and services and spread repayments over time and by smoothing more erratic income flows. Although consumer credit growth remains well above the rate of growth in household disposable income, the overall level of consumer debt relative to household incomes is in line with historical averages. For reference, I have included this chart in the appendix to this letter. More broadly, the level of household indebtedness, including unsecured consumer credit and mortgage debt, has risen over the past two decades primarily as a result of significant increases in mortgage debt.
There are well known and established reasons why debt and savings levels vary quite consistently over people's lifetimes, something that is often referred to by economists as the life cycle model. Younger people and households will typically have higher levels of indebtedness relative to income than older households. The precise form of the life cycle model is evolving in the current environment of very low real interest rates alongside increasing longevity, to point to two major factors at work. These so-called inter-generational changes are profound and challenging.
The FCA has a 'number of other sources of information on consumer indebtedness that help inform our work. We work with not-for-profit debt advice agencies such as Citizens Advice and Stepchange and their experience and analysis help us get a sense of the wider picture.
Registered as aLimited Company in England and Wales No. 1920623. Registered office as above.
After taking over the regulation of consumer credit firms, we have done further work on the way consumers use credit, for example through our Credit Card Market Study. I, along with the other Directors of the FCA, regularly travel around the UK and meet debt advice charities which has enabled me to speak to front line advisors, giving me a firsthand perspective on the issues facing consumers and the severe impact indebtedness can have. This has been invaluable.
FCA experience of consumer indebtedness
Issues relating to over-indebtedness are complex and involve multiple factors. People who are in difficulty with debt often have a large range of debts, including for utilities and to public sector bodies. We are seeing a picture where a far higher proportion of debts are on essential expenditure (so-called priority debts). I do therefore welcome initiatives such as the "Breathing Space".
The Financial Lives survey (involving 13,000 people) offers useful context in relation to consumer credit among younger age groups, for example revealing differences between 18-24 and 25-34 year aids. Sixty nine per cent of 18-24 years hold credit or loan products, compared with 82% of 25-34 year aids and a national average of 78%. Both age groups are more likely to have been overdrawn at some point in the last 12 months on their current account than the general population (29% of 18-24s and 36% of 25-34s, compared with a national average of 25%). Indeed 25-34s are the second most overdrawn age group after the 35-44s (38%). I have attached three charts from the survey (involving 13,000 people) showing potential vulnerability, difficulty in servicing debt and over-indebtedness, all by age.
Ideally, we would have a time series of these measures to show changes, but our survey is a new initiative by the FCA, so that will take time. But the survey does give an insight into debt levels and the makeup of debt, by breaking down debt into different categories, such as personal loans. Mean unsecured debt levels, including Student Loans Company (SLC) loans, are highest among these two groups (£8,750 for 18-24s and £8,250 for 25-34s). However, their mean unsecured debts excluding SLC loans are much lower. Those aged 18 to 24 have the lowest mean unsecured debt (£1,460) apart from those 75+ (£540). The situation looks different for 24-35s, who have the third highest mean unsecured debt excluding SLC loans (£4,200), close behind the 45-54s (£4,910) and 35-44s (£5,130) age groups. According to the survey, the 25-34s age group appears to be most likely to be in financial difficultyC1J (13%) and the most likely to be over-indebtedC2J (23%) in comparison with all other age groups.
I have set out these differences along with further data and analysis in the appendix to this letter. As supporting information on these points and to add further detail to that already available in Financial Lives, we have also made available on our website the very large amount of data contained in the survey.
In addition to our own work to understand these issues, these findings have been supported by the experience of not-for-profit debt advice agencies, who we engage with through our partnerships work. As an example, Christians Against Poverty state that in 2006, on average, non-priority debt accounted for 85% of of an individual's total outstanding debt, and priority debts accounted for 9%. In 2016, priority debts accounted for 32% of an individual's indebtedness and 70% of clients reported falling behind on them.
ui Payments for any credit commitments and/or any domestic bills have been missed In any three or more of the last six months c21 Term adopted from the Money Advice Service to describe having one or both of the following characteristics: keeping up with domestic bills and credit commitments Is a heavy burden; payments for any credit commitments and/or any domestic bills have been missed In any three or more of the last six months
StepChange have also reported 1 that 63% of their clients in the first six months of 2017 were under 40, a proportion that has grown over the past five years.
There is a lot we have done and will continue to do to understand the use of credit and its impact. Since the Financial Conduct Authority (FCA) took over regulation of consumer credit in April 2014, we have focused in particular on products that we believe pose the highest risks to our consumer protection objective, including high-cost credit. We have already taken important steps to address the risk of consumer harm from these products. This has included the introduction of the price cap for High Cost Short Term Credit lenders and other measures specific to the sector, for example, caps on rollovers and restrictions on the use of continuous payment authorities.
Our Credit Card Market Study identified significant concerns about the scale, extent and nature of longer-term card debt. We are implementing a package of remedies, including proposed new rules to address persistent credit card debt and requiring firms to assess whether customers are at risk of developing financial difficulties and intervene appropriately. We also want to ensure that customers - especially those at risk of debt problems - are not given unaffordable credit limit increases and have proper control over their credit limits. We will monitor the implementation of these remedies and their outcomes, and take further action if necessary.
Drawing on our experience from our credit card work, we will also consider long term use of high-cost credit and what we can do to ensure that consumers are appropriately protected and not trapped in a long term cycle of high-cost debt. We have identified a number of issues which could cause consumer harm, and will consult on proposed solutions by next Spring.
The macro-economic implications and the Financial Policy Committee (FPC)
The FCA does not have a macroeconomic objective. But I can offer my view as a member of the Bank of England Financial Policy Committee.
The FPC noted at its September meeting2 that domestic credit has grown broadly in line with nominal GDP over the past two years. Consumer credit is an important determinant of banks' ability to withstand severe economic downturns, and can therefore pose a risk to financial stability through losses to banks in such a downturn. The FPC has set out the actions it has taken to mitigate this risk, including bringing forward its assessment of the losses the banking system would incur on consumer credit in its 2017 concurrent stress test scenario.
I would agree with the point made at a recent hearing by Mark Carney, namely that the macroeconomic picture on the sustainability of household debt is supported by the level of employment and the low debt service ratio. As he noted, the FCA's responsibilities focus on protecting consumers, and thus primarily on firms' conduct at the individual customer level. Our responsible lending rules require firms to assess a consumer's creditworthiness, including the affordability of credit, before entering into a credit agreement. In particular, this must include the consumer's ability to make repayments as they fall due, without this adversely affecting their financial situation.
We have published a consultation paper on changes to our rules to clarify our expectations of firms in this area. We have also set out our approach to regulating consumer credit and how we think about sustainability in this context. In developing our proposals, we have worked closely with the Bank and PRA and taken account of the findings and judgement of the FPC.
1 https://www.stepchange.org/Pol icyand Research/2017-persona 1-debt-statistics-mid-yearbook.aspx 2 http://www.bankofengland.eo.uk/publications/Documents/news/2017/009.pdf

I hope that the above information and attached data from our Financial Lives Survey is helpful in providing further clarity on this issue.
I
Andrew Bailey Chief Executive
Appendix
1. Financial Lives Survey 2017 Summary information related to credit and debt1
Introduction
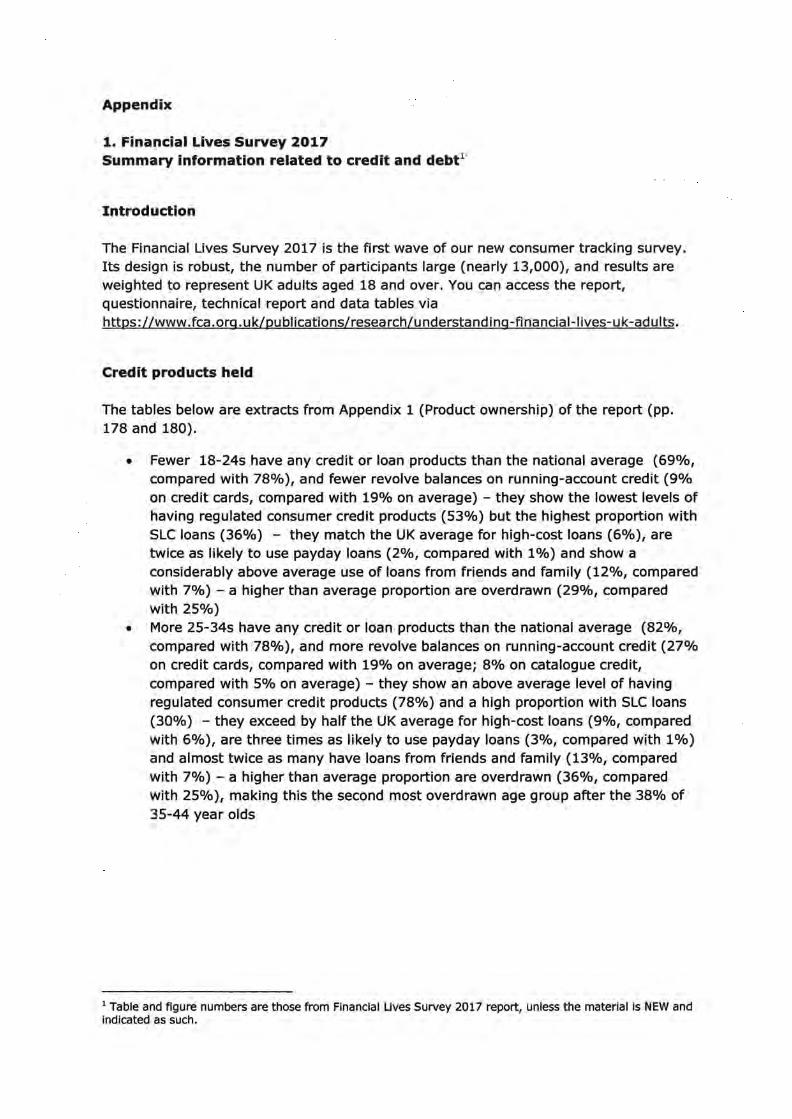
The Financial Lives Survey 2017 is the first wave of our new consumer tracking survey. Its design is robust, the number of participants large (nearly 13,000), and results are weighted to represent UK adults aged 18 and over. You can access the report, questionnaire, technical report and data tables via httos://www.fca.org.uk/publications/research/understanding-financial-lives-uk-adults.
Credit products held
The tables below are extracts from Appendix 1 (Product ownership) of the report (pp. 178 and 180).
• Fewer 18-24s have any credit or loan products than the national average (69%, compared with 78%), and fewer revolve balances on running-account credit (9% on credit cards, compared with 19% on average) - they show the lowest levels of having regulated consumer credit products (53%) but the highest proportion with SLC loans (36%) - they match the UK average for high-cost loans (6%), are twice as likely to use payday loans (2%, compared with 1%) and show a considerably above average use of loans from friends and family (12%, compared with 7%) - a higher than average proportion are overdrawn (29%, compared with 25%)
• More 25-34s have any credit or loan products than the national average (82%, compared with 78%), and more revolve balances on running-account credit (27% on credit cards, compared with 19% on average; 8% on catalogue credit, compared with 5% on average) - they show an above average level of having regulated consumer credit products (78%) and a high proportion with SLC loans (30%) - they exceed by half the UK average for high-cost loans (9%, compared with 6%), are three times as likely to use payday loans (3%, compared with 1 % ) and almost twice as many have loans from friends and family (13%, compared with 7%) - a higher than average proportion are overdrawn (36%, compared with 25%), making this the second most overdrawn age group after the 38% of 35-44 year olds
1 Table and figure numbers are those from Financial Lives Survey 2017 report, unless the material is NEW and indicated as such.
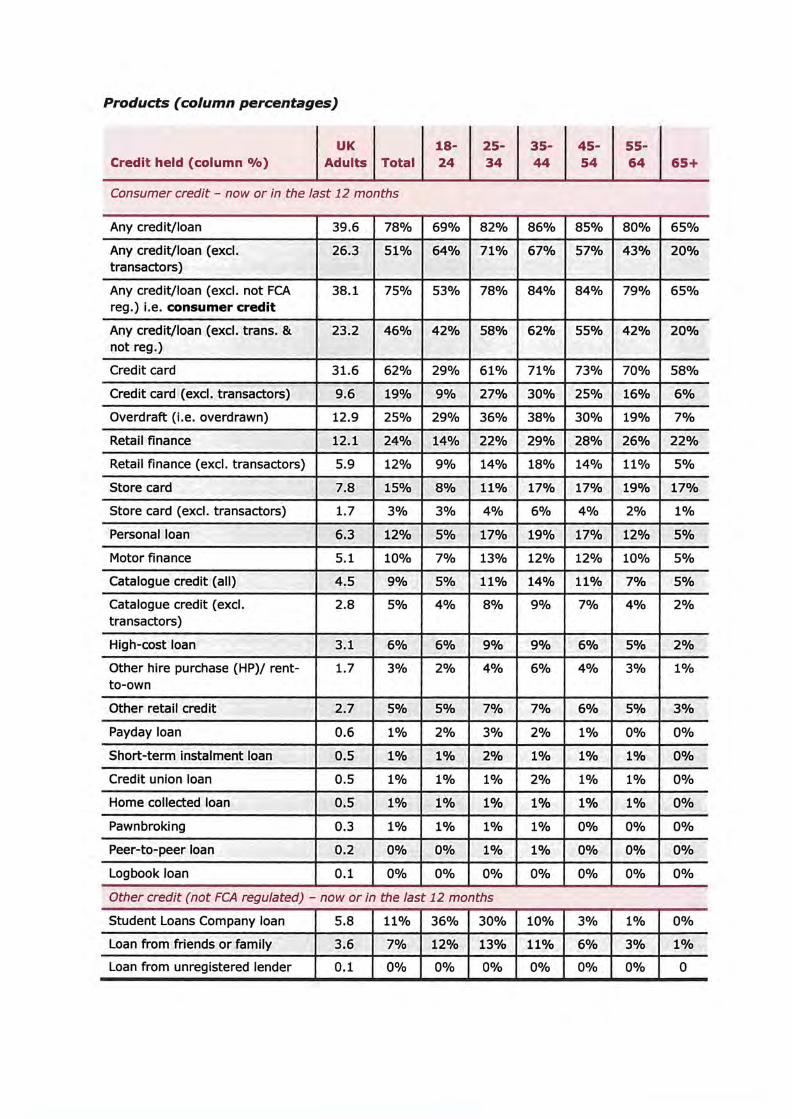
Products (column percentages)
Credit held (column 0/o} UK
Adults Total 1824
2534
3544
4554
5564 65+
Consumer credit - now or in the last 12 months
Any credit/loan 39.6 78% 69% 82% 86% 85% 80% 65%
Any credit/loan (excl. 26.3 51% 64% 71% 67% 57% 43% 20% transactors)
Any credit/loan (excl. not FCA 38.1 75% 53% 78% 84% 84% 79% 65% reg.) i.e. consumer credit
Any credit/loan (excl. trans. & 23.2 46% 42% 58% 62% 55% 42% 20% not reg.)
Credit card 31.6 62% 29% 61% 71% 73% 70% 58%
Credit card (excl. transactors) 9.6 19% 9% 27% 30% 25% 16% 6%
Overdraft (i.e. overdrawn) 12.9 25% 29% 36% 38% 30% 19% 7%
Retail finance 12.1 24% 14% 22% 29% 28% 26% 22%
Retail finance (excl. transactors) 5.9 12% 9% 14% 18% 14% 11% 5%
Store card 7.8 15% 8% 11% 17% 17% 19% 17%
Store card (excl. transactors) 1.7 3% 3% 4% 6% 4% 2% 1%
Personal loan 6.3 12% 5% 17% 19% 17% 12% 5%
Motor finance 5.1 10% 7% 13% 12% 12% 10% 5%
Catalogue credit (all) 4.5 9% 5% 11% 14% 11% 7% 5%
Catalogue credit (excl. 2.8 5% 4% 8% 9% 7% 4% 2% transactors)
High-cost loan 3.1 6% 6% 9% 9% 6% 5% 2%
Other hire purchase (HP)/ rent 1.7 3% 2% 4% 6% 4% 3% 1% to-own
Other retail credit 2.7 5% 5% 7% 7% 6% 5% 3%
Paydayloan 0.6 1% 2% 3% 2% 1% 0% 0%
Short-term instalment loan 0.5 1% 1% 2% 1% 1% 1% 0%
Credit union loan 0.5 1% 1% 1% 2% 1% 1% 0%
Home collected loan 0.5 1% 1% 1% 1% 1% 1% 0%
Pawnbroking 0.3 1% 1% 1% 1% 0% 0% 0%
Peer-to-peer loan 0.2 0% 0% 1% 1% 0% 0% 0%
Logbook loan 0.1 0% 0% 0% 0% 0% 0% 0%
Other credit (not FCA regulated) - now or in the last 12 months
Student Loans Company loan 5.8 11% 36% 30% 10% 3% 1% 0%
Loan from friends or family 3.6 7% 12% 13% 11% 3% 1%6%
Loan from unregistered lender 0.1 0% 0% 0% 0% 0% 0% 0
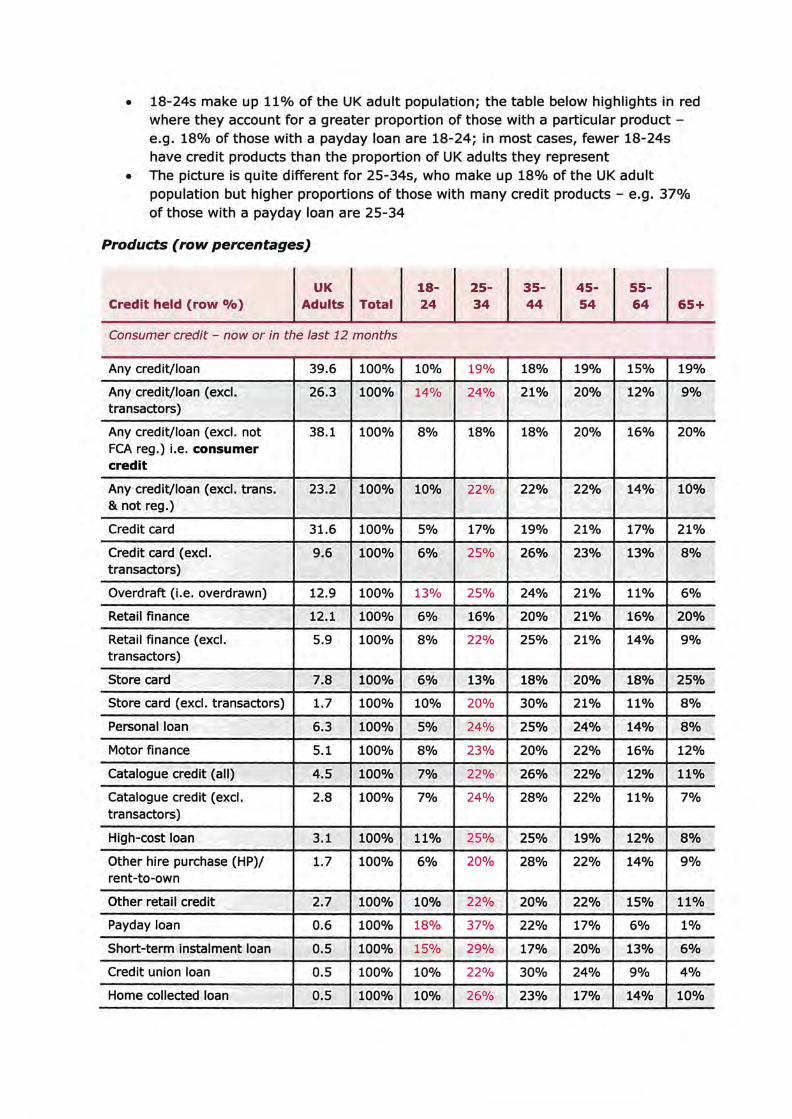
• 18-24s make up 11% of the UK adult population; the table below highlights in red where they account for a greater proportion of those with a particular product e.g. 18% of those with a payday loan are 18-24; in most cases, fewer 18-24s have credit products than the proportion of UK adults they represent
• The picture is quite different for 25-34s, who make up 18% of the UK adult population but higher proportions of those with many credit products - e.g. 37% of those with a payday loan are 25-34
Products (row percentages)
Credit held (row 0/o) UK
Adults Total 1824
2534
3544
4554
5564 65+
Consumer credit - now or in the last 12 months
Any credit/loan 39.6 100% 10% 19% 18% 19% 15% 19%
Any credit/loan (excl. 26.3 100% 14% 24% 21% 20% 12% 9% transactors)
Any credit/loan (excl. not 38.1 100% 8% 18% 18% 20% 16% 20% FCA reg.) i.e. consumer credit
Any credit/loan (excl. trans. 23.2 100% 10% 22% 22% 22% 14% 10% & not reg.)
Credit card 31.6 100% 5% 17% 19% 21% 17% 21%
Credit card (excl. 9.6 100% 6% 25% 26% 23% 13% 8% transactors)
Overdraft (i.e. overdrawn) 12.9 100% 13% 25% 24% 21% 11% 6%
Retail finance 12.1 100% 6% 16% 20% 21% 16% 20%
Retail finance (excl. 5.9 100% 8% 22% 25% 21% 14% 9% transactors)
Store card 7.8 100% 6% 13% 18% 20% 18% 25%
Store card (excl. transactors) 1.7 100% 10% 20% 30% 21% 11% 8%
Personal loan 6.3 100% 5% 24% 25% 24% 14% 8%
Motor finance 5.1 100% 8% 23% 20% 22% 16% 12%
Catalogue credit (all) 4.5 100% 7% 22% 26% 22% 12% 11%
Catalogue credit (excl. 2.8 100% 7% 24% 28% 22% 11% 7% transactors)
High-cost loan 3.1 100% 11% 25% 25% 19% 12% 8%
Other hire purchase (HP)/ 1.7 100% 6% 20% 28% 22% 14% 9% rent-to-own
Other retail credit 2.7 100% 10% 22% 20% 22% 15% 11%
Payday loan 0.6 100% 18% 37% 22% 17% 6% 1%
Short-term instalment loan 0.5 100% 15% 29% 17% 20% 13% 6%
Credit union loan 0.5 100% 10% 22% 30% 24% 9% 4%
Home collected loan 0.5 100% 10% 26% 23% 17% 14% 10%
UK 18 25 35 45 55Credit held (row 0/o) Adults Total 24 34 44 54 64 65+
Pawnbroking 0.3 100% [21%] [33%] [27%] [11%] [5%] [4%]
Peer-to-peer loan 0.2 100% [10%] [35%] [22%] [19%] [13%] [2%]
Logbook loan * * * * * * * * Other credit (not FCA regulated) - now or in the last 12 months
Student Loans Company loan 5.8 100% 35% 46% 14% 4% 1% 0%
Loan from friends or family 3.6 100% 18% 33% 25% 15% 6% 2%
Loan from unregistered lender
* * * * * * * *
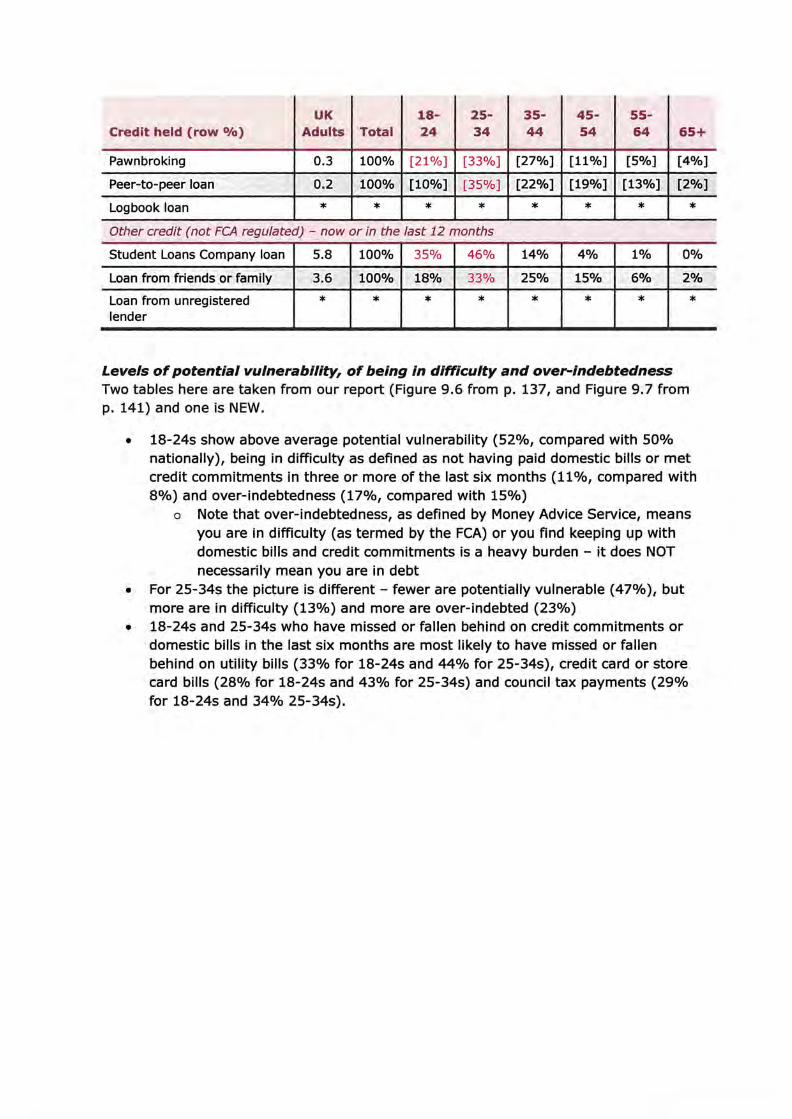
Levels ofpotential vulnerability, of being in difficulty and over-indebtedness Two tables here are taken from our report (Figure 9.6 from p. 137, and Figure 9.7 from p. 141) and one is NEW.
• 18-24s show above average potential vulnerability (52%, compared with 50% nationally), being in difficulty as defined as not having paid domestic bills or met credit commitments in three or more of the last six months (11%, compared with 8%) and over-indebtedness (17%, compared with 15%)
o Note that over-indebtedness, as defined by Money Advice Service, means you are in difficulty (as termed by the FCA) or you find keeping up with domestic bills and credit commitments is a heavy burden - it does NOT necessarily mean you are in debt
• For 25-34s the picture is different - fewer are potentially vulnerable (47%), but more are in difficulty (13%) and more are over-indebted (23%)
• 18-24s and 25-34s who have missed or fallen behind on credit commitments or domestic bills in the last six months are most likely to have missed or fallen behind on utility bills (33% for 18-24s and 44% for 25-34s), credit card or store card bills (28% for 18-24s and 43% for 25-34s) and council tax payments (29% for 18-24s and 34% 25-34s).
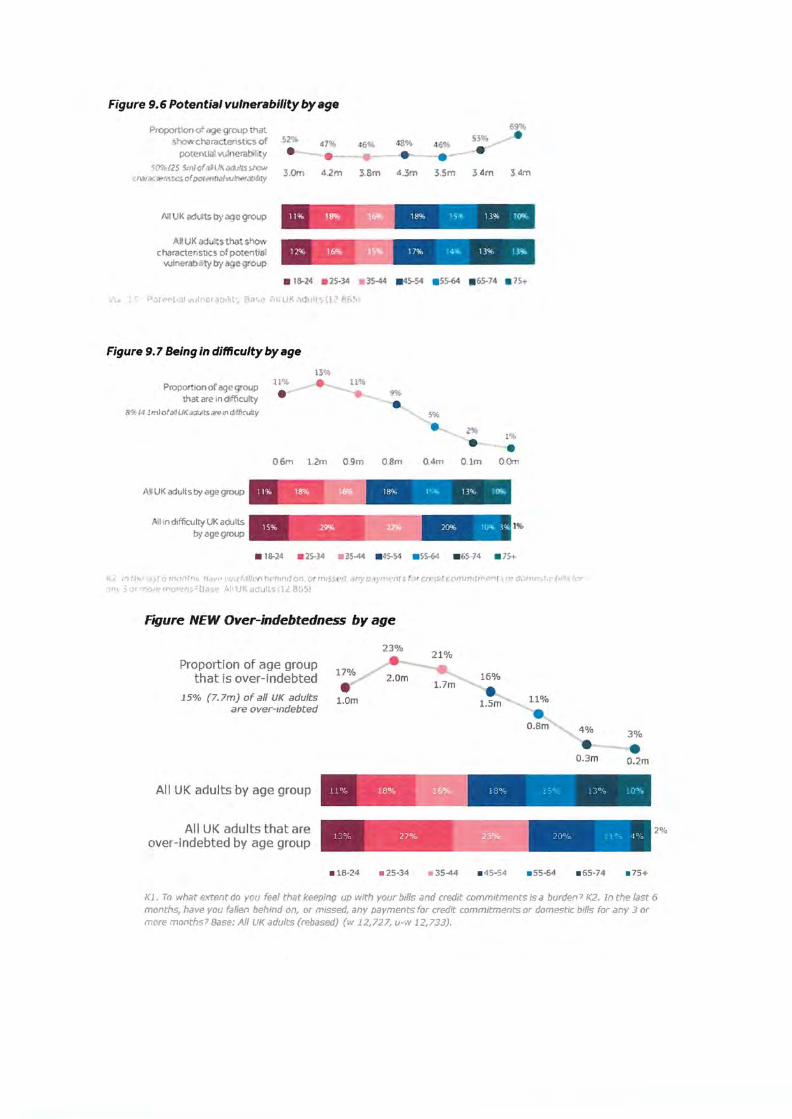
Figure 9. 6 Potential vulnerabllity by age
69'lttProportiono' iJQe gr01.1p that show charactenstcsof 52'!1, •41111, 46~
potential vu1nerabil,t y • ·-·<c,; 12S -<iml of,tHI,~ ,)(i,'tHl>::t.., 3,0m •Urn 3.Sm ,um 3 4rn cn.1.•,Y.r!',,~r,cs ofpcr<Mt1,1hv.n,>,at1\llty
18'1;, 15, 13% l()'l(,Alt UK .v.i1.11ts by age group
AIIUKact tstha show character.sttcs ofpotential 1:t'!i, ~ 17% 1a , 13% 131!
wln.erab,hty by 119egrovp
Figure 9. 7 Being in difficulty by age
13% l l 'lf> 11%
Prop ionofage group 9%
•that are m difficulty • 8% 14 1m)ofii!! UK adtllts "'"m rf,fflrutty 5%
2'41 lr
•m• ...
06m 1.2m 09m o.am 0.4rn Olm O.Orn
18";, l '·"' 13% 109.All UK adults b-/ age grot,1p
A!I m difficulty UK adults 20% 1~ l'lf'. 1%
by age group
• 13-24 • 25-3-4 • 35-44 • 45'-54 • SS-64 • 65-74 • lS+
tt\;; J~ :hL' JS( 6 f'l't(};"lfl\~ tJdlt"•' ••t.,l11t'lf'Cf)(1,•hmdOJ). Of r:ti1$~W d t?fl}'C'of}'nl~·nts f. r e,n.Ji f iL1ft1r!hCrt1f1'1'lf 1 ' ' d'Llftlt;":r.t1C f1JO~ for
1n_!. 5;)• rr.01e r"f'Ol"lths'Bas,t\ .~Ji UK adults ,1.£ 8fj5)
Ftgure NEW Over-indebtedness by age
Proportion of age group that is over-indebted
15% (7.7m) of all UK adults are over-indebted
•0.3m 0.2m
23%
•1.0m
16%
11%
4% 3%
All UK adults by age group
All UK adults that are 2°/o
over-indebted by age group
• 18-24 • 25·34 • 35-44 • 45·54 • 55-54 • 65-74 • 75+
Kl. To what extent do you fee! that keeping up with )lour bills and credit commitments isa burden? K2. In the last 6 months, have you fallen behind on, or missed, any payments for cmdit commitments or domestic bills for any 3 or more months? Base: All UK adults (rebased) (w 12,727, u·w 12,733).
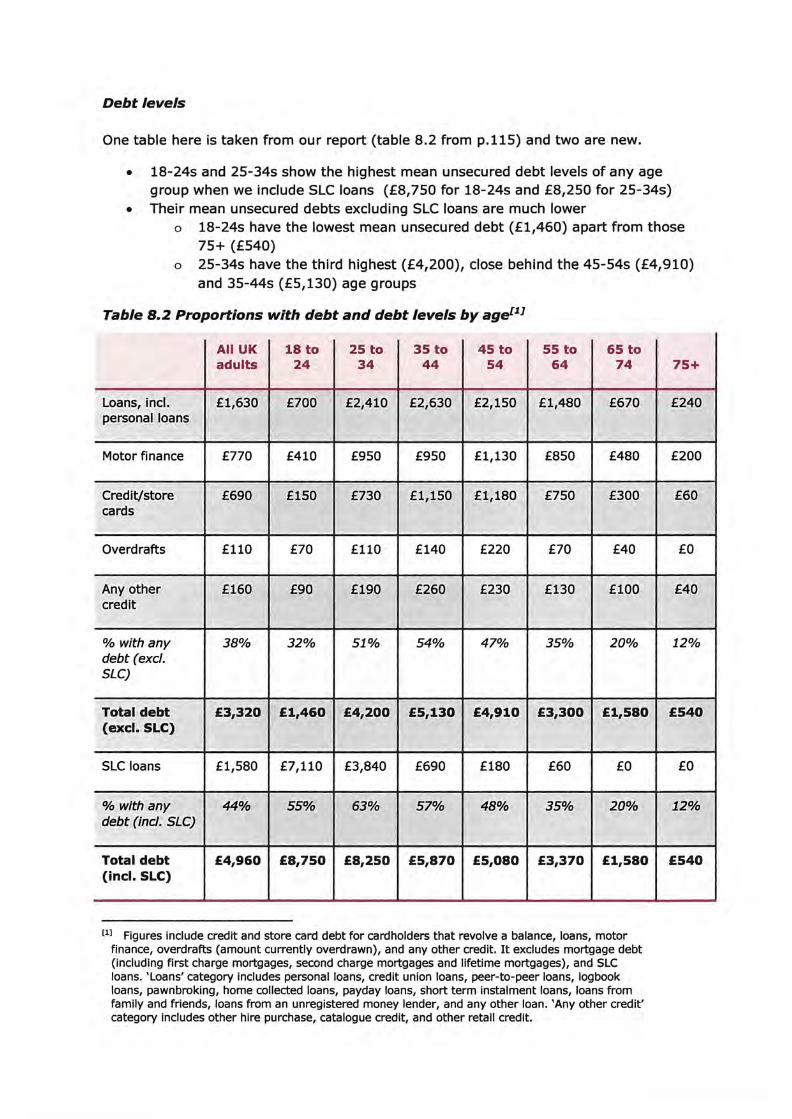
Debt levels
One table here is taken from our report (table 8.2 from p.115) and two are new.
• 18-24s and 25-34s show the highest mean unsecured debt levels of any age group when we include SLC loans (£8,750 for 18-24s and £8,250 for 25-34s)
• Their mean unsecured debts excluding SLC loans are much lower a 18-24s have the lowest mean unsecured debt (£1,460) apart from those
75+ (£540) a 25-34s have the third highest (£4,200), close behind the 45-54s (£4,910)
and 35-44s (£5,130) age groups
Table 8.2 Proportions with debt and debt levels by agec1.1
All UK 18 to 25 to 35 to 45 to 55 to 65 to adults 24 34 44 54 64 74
Loans, incl. £1,630 £700 £2,410 £2,630 £2,150 £1,480 £670 personal loans
Motor finance £770 £410 £950 £950 £1,130 £850 £480
Credit/store £690 £150 £730 £1,150 £1,180 £750 £300 cards
Overdrafts £110 £70 £110 £140 £220 £70 £40
Any other £160 £90 £190 £260 £230 £130 £100 credit
% with any 38% 32% 51% 54% 47% 35% 20% debt (excl. SLC)
Total debt £3,320 £1,460 £4,200 £5,130 £4,910 £3,300 £1,580 (excl. SLC)
SLC loans £1,580 £7,110 £3,840 £690 £180 £60 £0
% with any 44% 55% 63% 57% 48% 35% 20% debt (inc/. SLC)
Total debt £4,960 £8,750 £8,250 £5,870 £5,080 £3,370 £1,580 (incl. SLC)
75+
£240
£200
£60
£0
£40
12%
£540
£0
12%
£540
cii Figures include credit and store card debt for cardholders that revolve a balance, loans, motor finance, overdrafts (amount currently overdrawn), and any other credit. It excludes mortgage debt (including first charge mortgages, second charge mortgages and lifetime mortgages), and SLC loans. 'Loans' category includes personal loans, credit union loans, peer-to-peer loans, logbook loans, pawnbroking, home collected loans, payday loans, short term instalment loans, loans from family and friends, loans from an unregistered money lender, and any other loan. 'Any other credit' category includes other hire purchase, catalogue credit, and other retail credit.
Base: All UK adults (12,865).
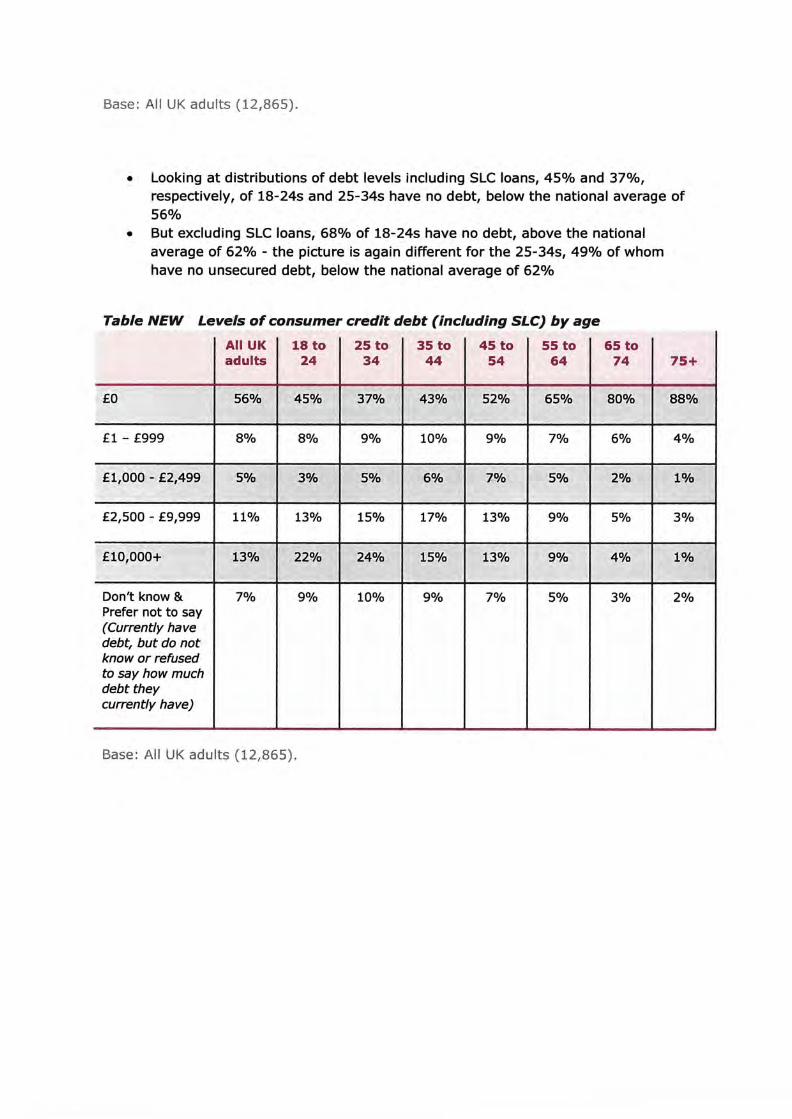
• Looking at distributions of debt levels including SLC loans, 45% and 37%, respectively, of 18-24s and 25-34s have no debt, below the national average of 56%
• But excluding SLC loans, 68% of 18-24s have no debt, above the national average of 62% - the picture is again different for the 25-34s, 49% of whom have no unsecured debt, below the national average of 62%
Table NEW Levels of consumer credit debt (including SLC) by age
All UK adults
18 to 24
25 to 34
35 to 44
45 to 54
55 to 64
65 to 74 75+
£0 56% 45% 37% 43% 52% 65% 80% 88%
£1 - £999 8% 8% 9% 10% 9% 7% 6% 4%
£1,000 - £2,499 5% 3% 5% 6% 7% 5% 2% 1%
£2,500 - £9,999 11% 13% 15% 17% 13% 9% 5% 3%
£10,000+ 13% 22% 24% 15% 13% 9% 4% 1%
Don't know & Prefer not to say (Currently have debt, but do not know or refused to say how much debt they currently have)
7% 9% 10% 9% 7% 5% 3% 2%
Base: All UK adults (12,865).
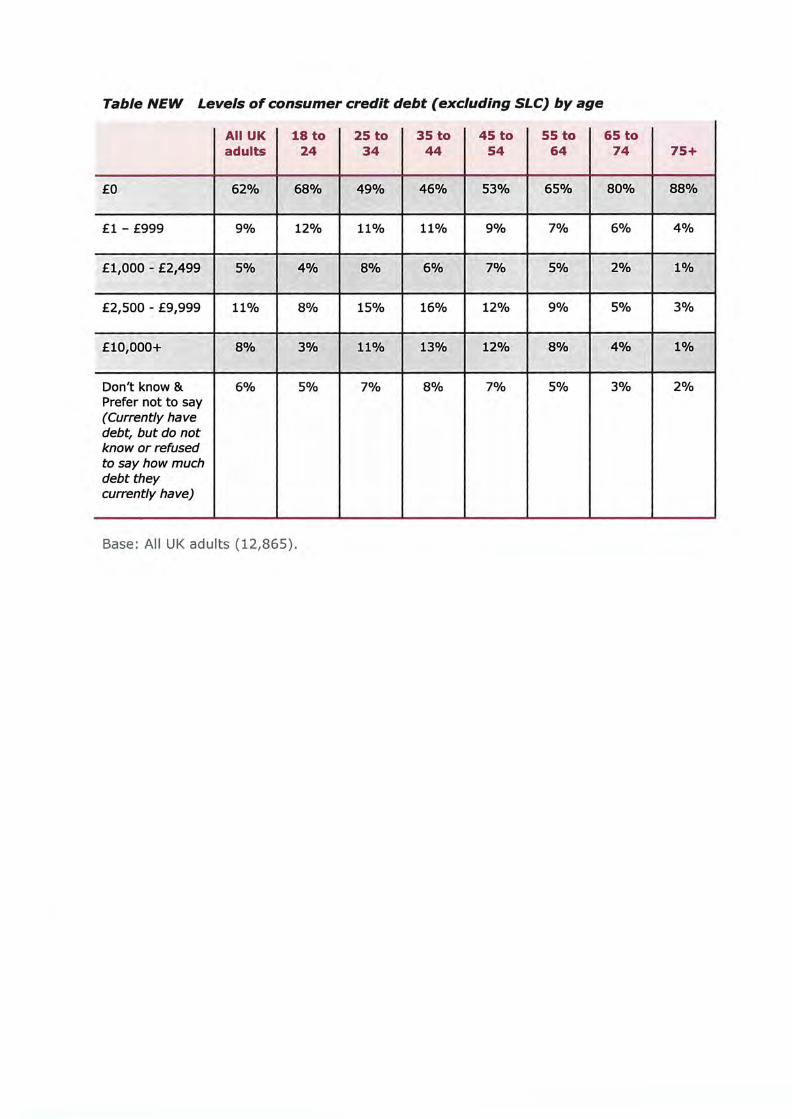
Table NEW Levels of consumer credit debt ( excluding SLC) by age
All UK adults
18 to 24
25 to 34
35 to 44
45 to 54
55 to 64
65 to 74 75+
£0 62% 68% 49% 46% 53% 65% 80% 88%
£1 - £999 9% 12% 11% 11% 9% 7% 6% 4%
£1,000 - £2,499 5% 4% 8% 6% 7% 5% 2% 1%
£2,500 - £9,999 11% 8% 15% 16% 12% 9% 5% 3%
£10,000+ 8% 3% 11% 13% 12% 8% 4% 1%
Don't know & Prefer not to say (Currently have debt, but do not know or refused to say how much debt they currently have)
6% 5% 7% 8% 7% 5% 3% 2%
Base: All UK adults (12,865).
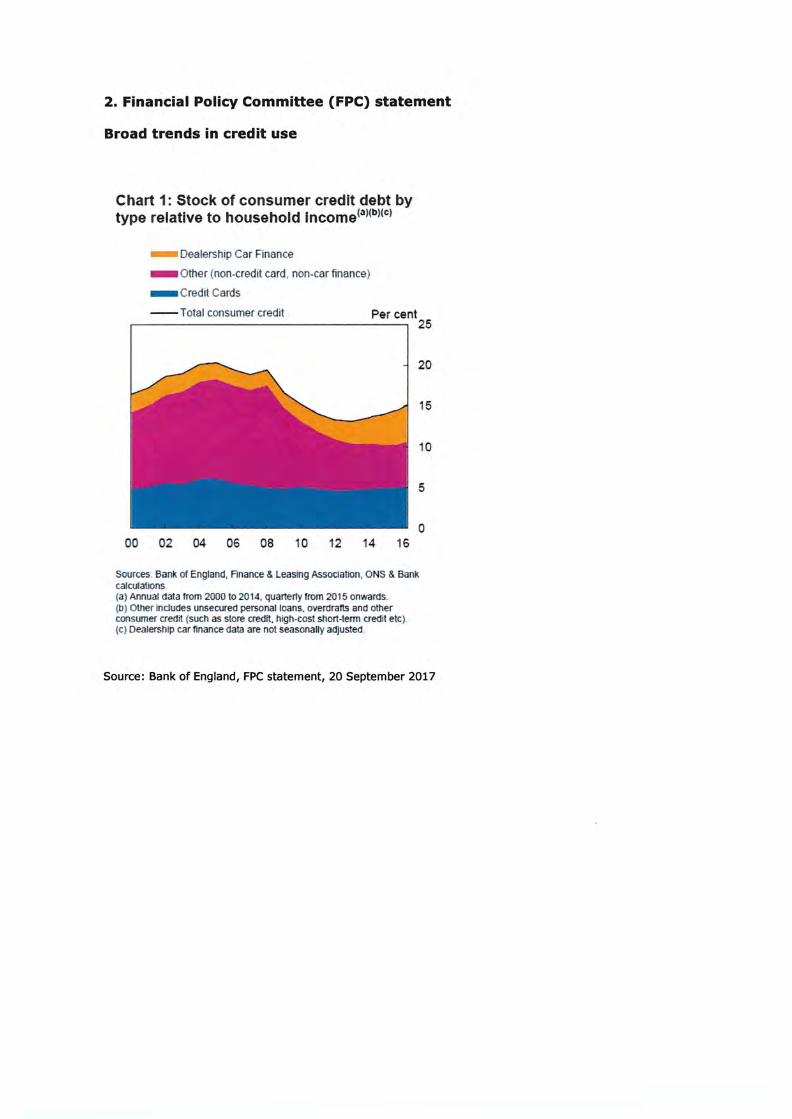
2. Financial Policy Committee (FPC) statement
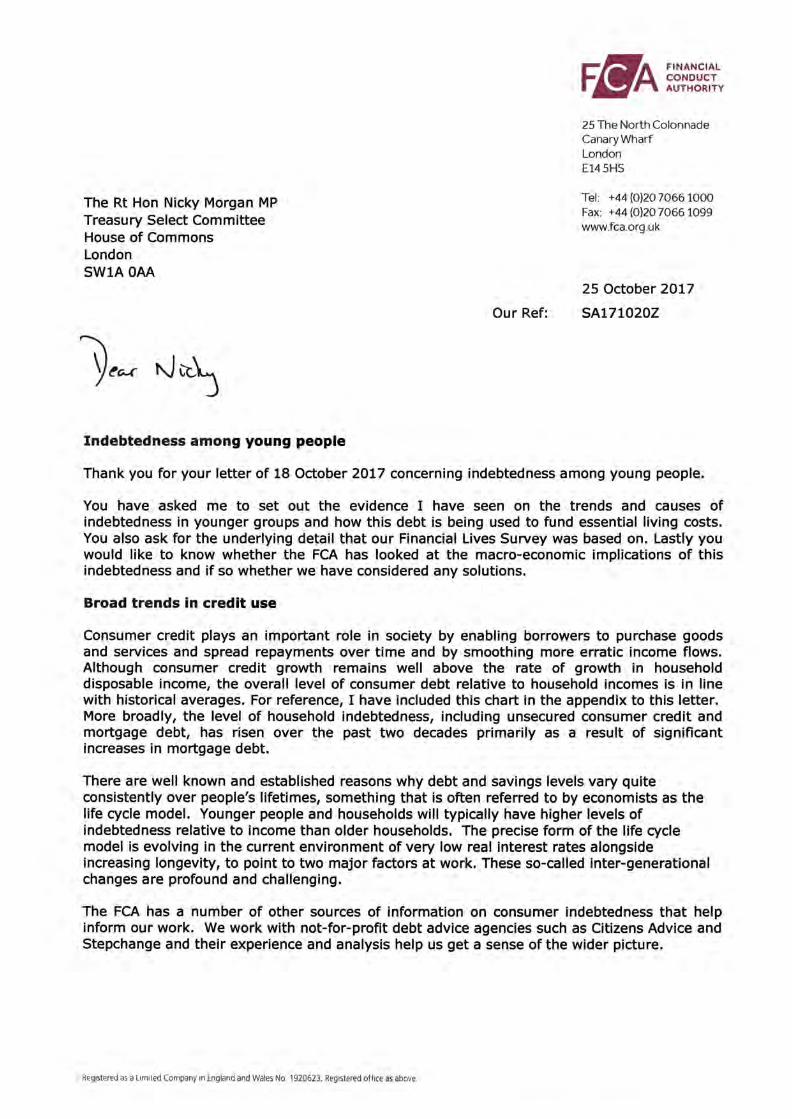
Broad trends in credit use
Chart 1: Stock of consumer credit debt by type relative to household incomela)(b)(cJ
- Dealership Car Finance
- Other ( non-credit card . non-car finance)
- c redit Cards
--Total consumer credit Per cent 25
20
15
10
5
0 00 02 04 06 08 10 12 14 16
Sources: Bank of England. Finance & Leasing Association. ONS & Bank calculatlons. (a) Annual data from 2000 to 2014, quarterly from 201 5 onwards. (b) other indudes unsecured personal loans, overorans anel other consumer credit (such as store credit, high-cost short-term credit etc). (c) Dealership car finance data are not seasonally adjusted.
Source: Bank of England, FPC statement, 20 September 2017