Embed Size (px)
DESCRIPTION
civil
Citation preview
Clemson UniversityTigerPrints
All Theses Theses
1-2014
CORROSION ACTIVITY IN PRECASTCONCRETE ELEMENTS ANDCEMENTITIOUS CLOSURE POURSShabi Abbas UdaipurwalaClemson University, [email protected]
Follow this and additional works at: http://tigerprints.clemson.edu/all_theses
Part of the Civil Engineering Commons
Please take our one minute survey!
This Thesis is brought to you for free and open access by the Theses at TigerPrints. It has been accepted for inclusion in All Theses by an authorizedadministrator of TigerPrints. For more information, please contact [email protected].
Recommended CitationUdaipurwala, Shabi Abbas, "CORROSION ACTIVITY IN PRECAST CONCRETE ELEMENTS AND CEMENTITIOUSCLOSURE POURS" (2014). All Theses. Paper 1784.

CORROSION ACTIVITY IN PRECAST CONCRETE ELEMENTS AND CEMENTITIOUS CLOSURE POURS
A Thesis Presented to
the Graduate School of Clemson University
In Partial Fulfillment of the Requirements for the Degree
Master of Science Civil Engineering
by Shabi Abbas Yusufali Udaipurwala
August 2013
Accepted by: Dr. Scott D. Schiff, Committee Co-Chair Dr. Amir Poursaee, Committee Co-Chair
Dr. Prasad R. Rangaraju
ii
ABSTRACT
The use of prefabricated elements in the construction of highway bridges has been a
common practice in the United States since 1950s. Precast concrete adjacent box beam
girder bridges are quite popular given that the precast elements not only have structural
capacity to span across the supports, but also form the bridge deck. These bridges have
generally performed well during the initial years after construction, but recent failures in
Pennsylvania and Indiana have aroused a nationwide alarm to investigate the causes of
failure and find solutions to repair these bridges or develop design for new replacement
bridges. It was found that the stressed and non-stressed embedded reinforcements were
severely corroded due to the ingress of chloride ions in the bridge deck through the
surface cracks occurring within the closure pours (shear key) and at the interface of the
joints between the precast elements and the shear key. The primary objective of this
research is to find an easy and reliable technique to detect the initiation of corrosion in
embedded rebar with minimal disturbance to the moving traffic and to investigate the
condition of the rebar (active or passive with respect to corrosion) embedded in Ultra
High Performance Fiber Reinforced Concrete (UHPFRC) so that precautionary measures
and maintenance can be applied before the failure of more in-service bridges. The
experimental investigation considered three different samples; ASTM modified G 109
samples (laboratory samples) which served as a control type specimen and large un-
cracked and cracked specimens (field samples) which served as an actual prototype of a
bridge deck. These samples were exposed to 3% of NaCl solution in the wet condition for
duration of two weeks in alternate cycles of wet and dry period to accelerate the
iii
corrosion process. Half-cell potential (HCP) tests and linear polarization resistance (LPR)
tests were carried out on all the samples. HCP test was able to detect the accurate location
of corrosion by measuring the corrosion potential in the rebar and LPR test was able to
confirm the active or passive state of the rebar by measuring the corrosion current in the
rebar. The results of both these tests were validated by observing the physical condition
of the rebar which were obtained from cores extracted from each sample types. It was
found that rebar were mainly corroded at the interface of the joints between two different
materials and areas of the samples which were cracked from the bottom in case of
cracked samples. The corrosion of rebar was most prominently observed in the UHPFRC
with PVA fibers even at places without joints and cracks. More intensive investigation is
needed which will require more time and applications of more detail electro-chemical
techniques to arrive at a more confident conclusion.

iv
DEDICATION
This thesis is dedicated to my parents, Yusufali and Sakina Udaipurwala and my
sister Tasneem Udaipurwala and to my graduate advisors, Dr. Scott D. Schiff and Dr.
Amir Poursaee. I could not have completed my research without their endless help,
advice and support during my graduate course of time in Clemson University.
v
ACKNOWLEDGMENTS
I would like to acknowledge my advisors Dr. Scott D. Schiff and Dr. Amir
Poursaee for their timely advice and support in completing my research and their
assistance in writing my thesis. I would like to thank Dr. Bryant Nielson and technicians
Danny Metz, Scott Black and Warren Scoville for their help in casting my samples for
my research. I want to thank the Glenn Department of Civil Engineering for their faith
and trust in providing me with the opportunity of assistantship for a period of 18 months.
Finally I would like to thank my fellow classmates Matthew Bruno Adamson, Tyler
Kenneth Andrews, Yujie Zhang, Huan Sheng, Tyler Johnson, Evan Whisnant, Sami Pant,
Akshay Galande, Archit Rapaka, Akhil Jayaraj and Sudhir Valsange for their
unconditional help and support in my day-to-day activities during my course of time at
Clemson University.

vi
TABLE OF CONTENTS
Page TITLE PAGE ................................................................................................................... i ABSTRACT ..................................................................................................................... ii DEDICATION ................................................................................................................. iv ACKNOWLEDGMENTS ............................................................................................... v LIST OF TABLES ........................................................................................................... ix LIST OF FIGURES ......................................................................................................... xi CHAPTER I. INTRODUCTION ......................................................................................... 1 1.1 Introduction .............................................................................................. 1 1.2 Corrosion of steel reinforcement bars ...................................................... 7 1.3 Objectives ............................................................................................... 10 1.4 Summary of approach ............................................................................. 12 1.5 Outline of the thesis ................................................................................ 13 II. BACKGROUND ........................................................................................... 15 2.1 Bridges ..................................................................................................... 16 2.2 Corrosion and its mechanism ................................................................... 19 2.2.1 Kinetics and Thermodynamics of corrosion ................................... 22 2.2.2 Influence of cracks on corrosion ..................................................... 24 2.3 Corrosion measuring techniques .............................................................. 26 2.3.1 Half-cell potential test ..................................................................... 26 2.3.2 Linear polarization resistance test ................................................... 28 2.4 Ultra high performance fiber reinforced concrete ................................... 30 2.5 Physical and chemical properties of UHPFRC ........................................ 34 2.5.1 Compressive strength ...................................................................... 35 2.5.2 Tensile and Flexural Strength ......................................................... 37 2.5.3 Toughness test ................................................................................. 39 2.5.4 Creep and shrinkage ........................................................................ 40 2.5.5 Dynamic strength test ..................................................................... 40
vii
Table of Contents (continued) Page 2.5.6 Durability ........................................................................................ 41 2.5.6.1 Rapid chloride ion permeability ............................................. 42 2.5.6.2 Porosity .................................................................................. 42 2.5.6.3 Permeability test..................................................................... 43 2.6 Ductal (grey premix) ................................................................................ 45 2.7 Properties of Ductal with polyvinyl alcohol fibers .................................. 47 2.8 Properties of Ductal with steel fibers ....................................................... 48 2.8.1 Compressive strength test ............................................................... 48 2.8.2 Tensile and flexural test .................................................................. 50 2.8.3 Dynamic testing .............................................................................. 51 2.8.4 Static and dynamic load test ........................................................... 53 2.8.5 Modulus of elasticity and Poisson’s ratio ....................................... 53 2.8.6 Rapid chloride penetration test ....................................................... 54 2.8.7 Shrinkage and creep ........................................................................ 55 2.8.8 Freezing and thawing cyclic test ..................................................... 55 III. EXPERIMENTAL PROGRAM .................................................................... 57 3.1 Materials .................................................................................................. 57 3.1.1 Ductal grey premix ......................................................................... 57 3.1.2 Quikrete® Non-Shrink Precision Grout ......................................... 58 3.1.3 Precast concrete (High early concrete mix) .................................... 59 3.1.4 Mixing ............................................................................................. 60 3.2 Specimens ................................................................................................ 61 3.2.1 Modified ASTM G 109 samples ..................................................... 61 3.2.2 Full-size specimen of a section of bridge deck ............................... 67 3.3 Experimental test setup ............................................................................ 76 3.3.1 Half-cell potential test ..................................................................... 76 3.3.2 Linear polarization test ................................................................... 79 3.3.3 Visual observation .......................................................................... 81 IV. RESULTS AND DISCUSSION .................................................................... 83 4.1 Modified ASTM G 109 sample ............................................................... 83 4.1.1 Precast concrete .............................................................................. 83 4.1.2 Ductal with PVA fibers ................................................................... 86 4.1.3 Ductal with Steel fibers ................................................................... 89 4.1.4 Precast concrete + Ductal with PVA fibers .................................... 92 4.1.5 Precast concrete + Ductal with Steel fibers .................................... 95
viii
Table of Contents (continued) Page 4.2 Uncracked large samples .....................................................................99 4.2.1 Ductal PVA ...............................................................................100 4.2.2 Ductal Steel ...............................................................................105 4.2.3 Quikrete with PVA fibers .........................................................110 4.3 Cracked large samples .......................................................................115 4.3.1 Ductal PVA Static (STA - 04) ..................................................116 4.3.2 Ductal Steel Static (STA - 02) ..................................................122 4.3.3 Ductal Steel Fatigue (FAT - 02) ...............................................127 4.3.4 Quikrete PVA Fatigue (FAT - 01) ............................................132 4.3.5 Quikrete PVA Static (STA - 01) ...............................................138 4.4 Summary of results ............................................................................143 V. CONCLUSION AND FUTURE RECOMMENDATION ......................145 5.1 Conclusions ........................................................................................145 5.2 Recommendation for future works ....................................................146 APPENDICES ...........................................................................................................148 A: Properties for Quikrete® Non-Shrink Precision Grout ...........................149 B: Aggregate properties ................................................................................151 C: Chloride penetration depth figures...........................................................153 D: Visual examination of the rebar (cores) ...................................................163 E: Potential contour maps of large samples .................................................182 REFERENCES ..........................................................................................................192
ix
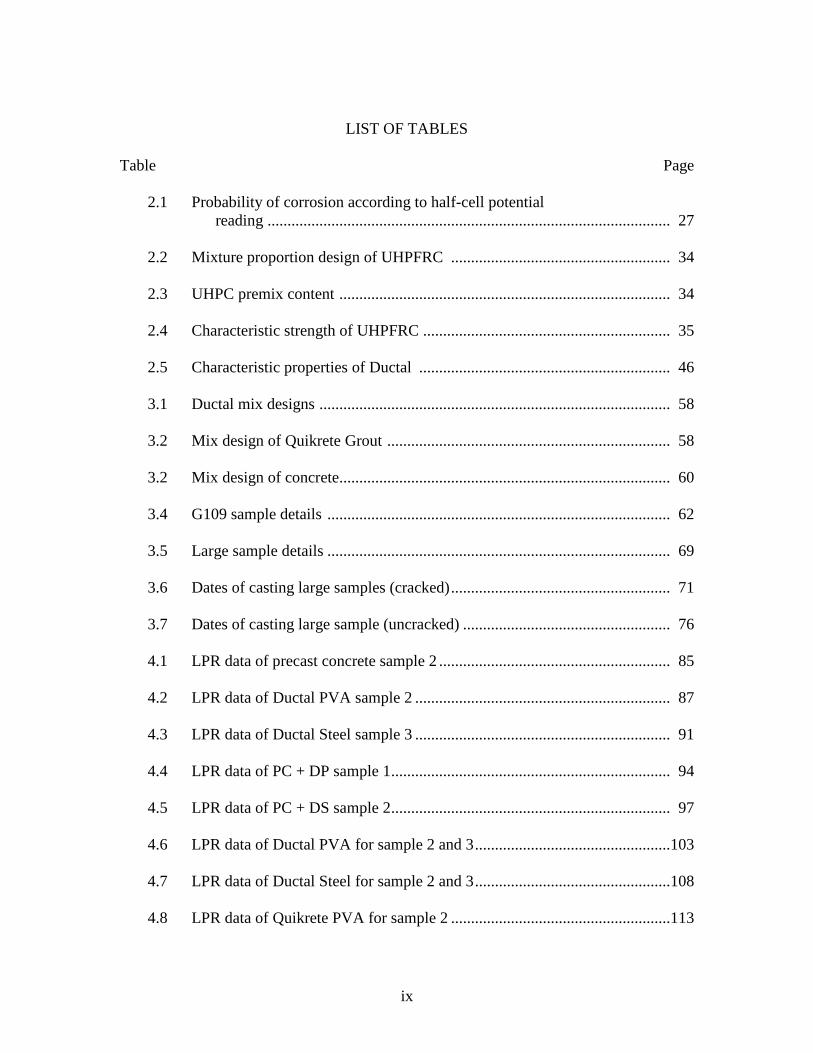
LIST OF TABLES
Table Page 2.1 Probability of corrosion according to half-cell potential
reading ..................................................................................................... 27 2.2 Mixture proportion design of UHPFRC ....................................................... 34 2.3 UHPC premix content ................................................................................... 34 2.4 Characteristic strength of UHPFRC .............................................................. 35 2.5 Characteristic properties of Ductal ............................................................... 46 3.1 Ductal mix designs ........................................................................................ 58 3.2 Mix design of Quikrete Grout ....................................................................... 58 3.2 Mix design of concrete................................................................................... 60 3.4 G109 sample details ...................................................................................... 62 3.5 Large sample details ...................................................................................... 69 3.6 Dates of casting large samples (cracked) ....................................................... 71 3.7 Dates of casting large sample (uncracked) .................................................... 76 4.1 LPR data of precast concrete sample 2 .......................................................... 85 4.2 LPR data of Ductal PVA sample 2 ................................................................ 87 4.3 LPR data of Ductal Steel sample 3 ................................................................ 91 4.4 LPR data of PC + DP sample 1 ...................................................................... 94 4.5 LPR data of PC + DS sample 2 ...................................................................... 97 4.6 LPR data of Ductal PVA for sample 2 and 3 .................................................103 4.7 LPR data of Ductal Steel for sample 2 and 3 .................................................108 4.8 LPR data of Quikrete PVA for sample 2 .......................................................113
x
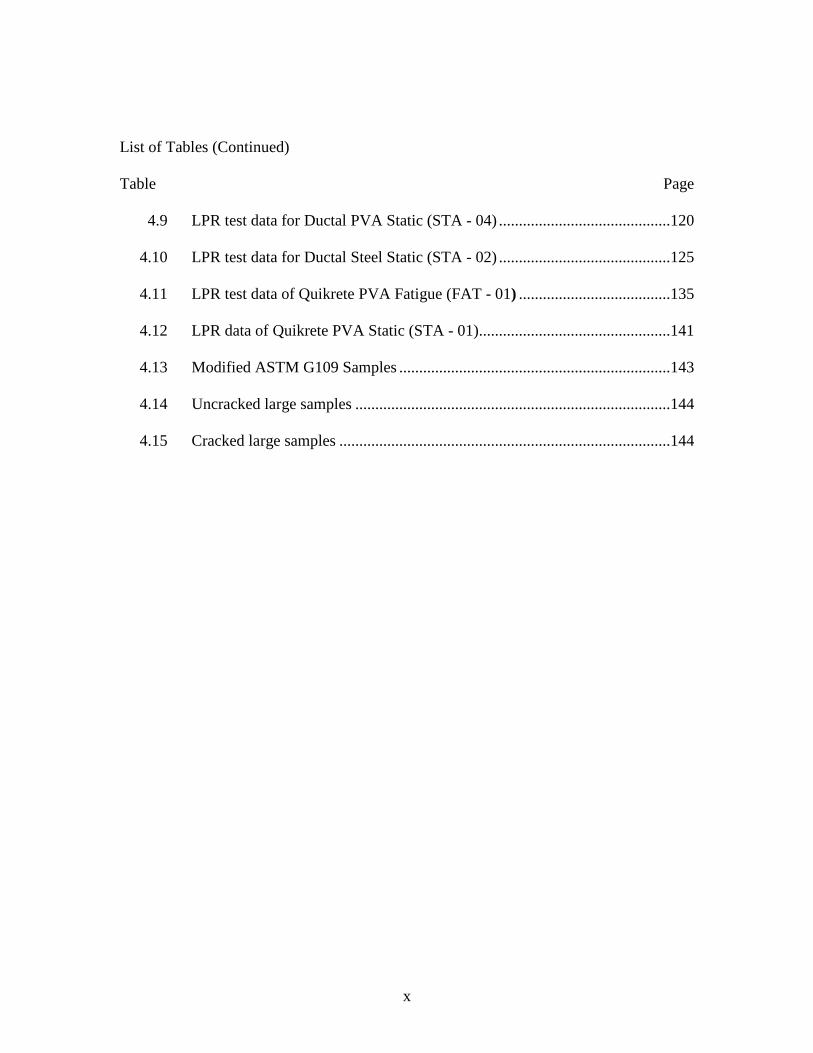
List of Tables (Continued) Table Page 4.9 LPR test data for Ductal PVA Static (STA - 04) ...........................................120 4.10 LPR test data for Ductal Steel Static (STA - 02) ...........................................125 4.11 LPR test data of Quikrete PVA Fatigue (FAT - 01) ......................................135 4.12 LPR data of Quikrete PVA Static (STA - 01)................................................141 4.13 Modified ASTM G109 Samples ....................................................................143 4.14 Uncracked large samples ...............................................................................144 4.15 Cracked large samples ...................................................................................144
xi
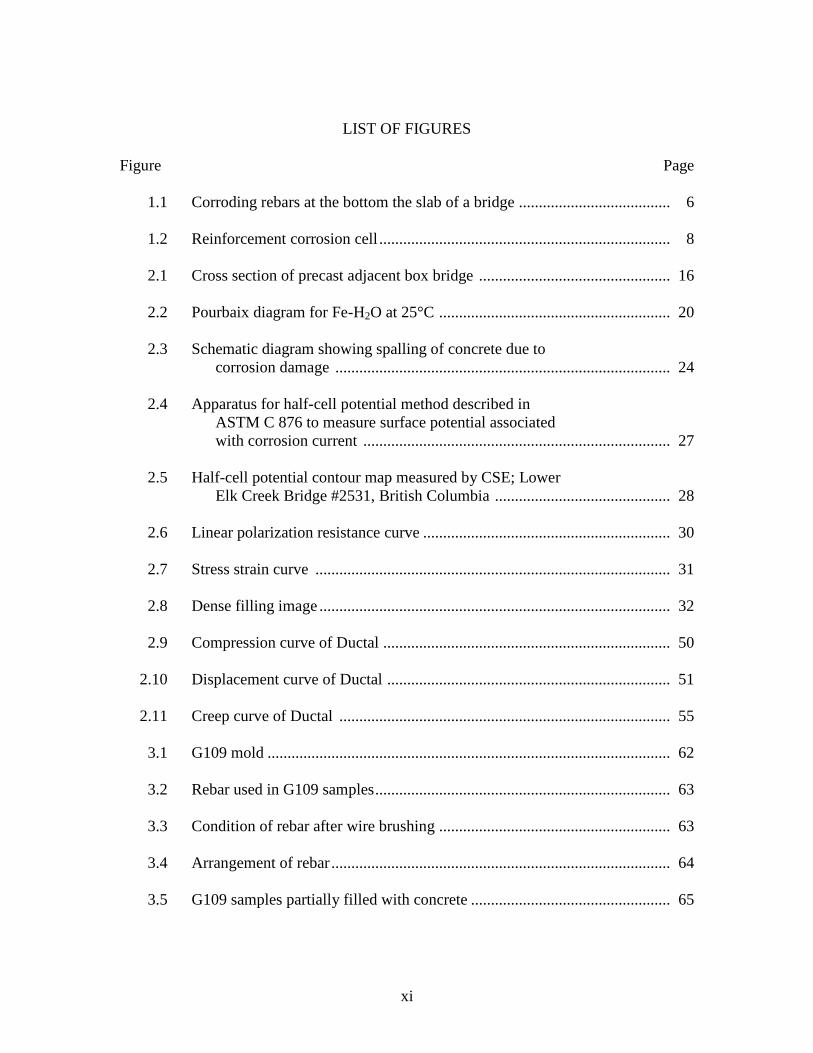
LIST OF FIGURES Figure Page 1.1 Corroding rebars at the bottom the slab of a bridge ...................................... 6 1.2 Reinforcement corrosion cell ......................................................................... 8 2.1 Cross section of precast adjacent box bridge ................................................ 16 2.2 Pourbaix diagram for Fe-H2O at 25°C .......................................................... 20 2.3 Schematic diagram showing spalling of concrete due to
corrosion damage .................................................................................... 24 2.4 Apparatus for half-cell potential method described in
ASTM C 876 to measure surface potential associated with corrosion current ............................................................................. 27
2.5 Half-cell potential contour map measured by CSE; Lower
Elk Creek Bridge #2531, British Columbia ............................................ 28 2.6 Linear polarization resistance curve .............................................................. 30 2.7 Stress strain curve ......................................................................................... 31 2.8 Dense filling image ........................................................................................ 32 2.9 Compression curve of Ductal ........................................................................ 50 2.10 Displacement curve of Ductal ....................................................................... 51 2.11 Creep curve of Ductal ................................................................................... 55 3.1 G109 mold ..................................................................................................... 62 3.2 Rebar used in G109 samples .......................................................................... 63 3.3 Condition of rebar after wire brushing .......................................................... 63 3.4 Arrangement of rebar ..................................................................................... 64 3.5 G109 samples partially filled with concrete .................................................. 65
xii
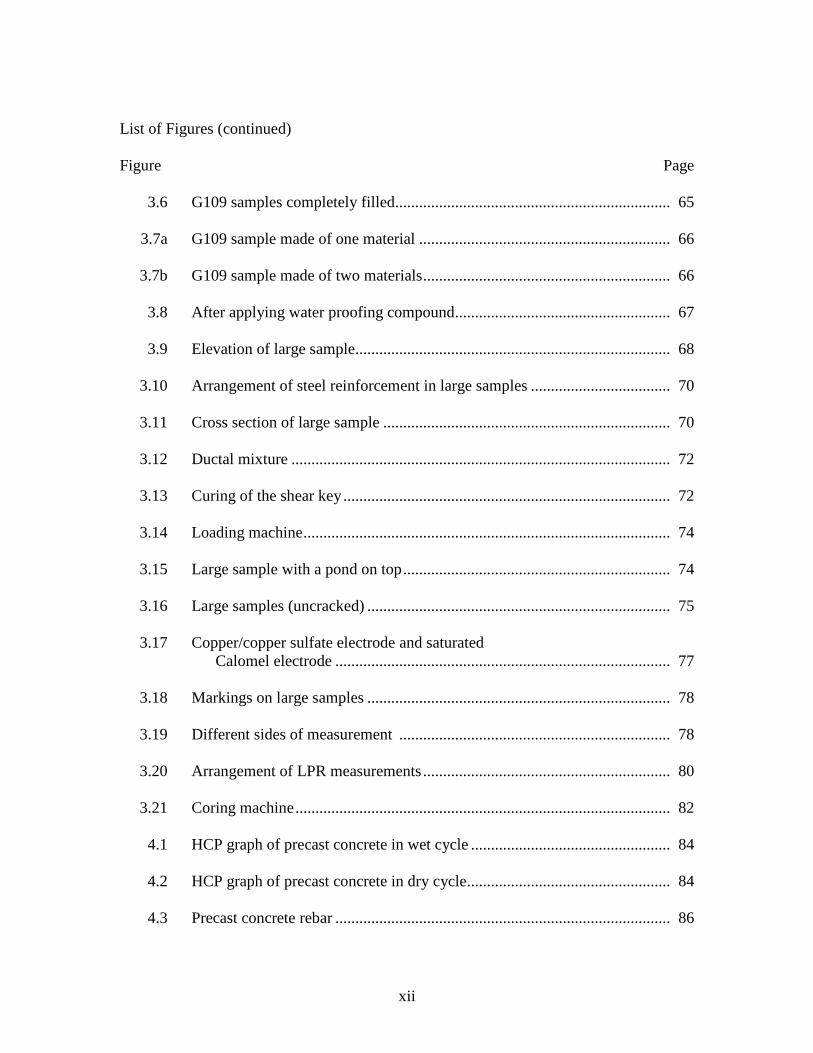
List of Figures (continued) Figure Page 3.6 G109 samples completely filled..................................................................... 65 3.7a G109 sample made of one material ............................................................... 66 3.7b G109 sample made of two materials .............................................................. 66 3.8 After applying water proofing compound ...................................................... 67 3.9 Elevation of large sample ............................................................................... 68 3.10 Arrangement of steel reinforcement in large samples ................................... 70 3.11 Cross section of large sample ........................................................................ 70 3.12 Ductal mixture ............................................................................................... 72 3.13 Curing of the shear key .................................................................................. 72 3.14 Loading machine ............................................................................................ 74 3.15 Large sample with a pond on top ................................................................... 74 3.16 Large samples (uncracked) ............................................................................ 75 3.17 Copper/copper sulfate electrode and saturated
Calomel electrode .................................................................................... 77 3.18 Markings on large samples ............................................................................ 78 3.19 Different sides of measurement .................................................................... 78 3.20 Arrangement of LPR measurements .............................................................. 80 3.21 Coring machine .............................................................................................. 82 4.1 HCP graph of precast concrete in wet cycle .................................................. 84 4.2 HCP graph of precast concrete in dry cycle ................................................... 84 4.3 Precast concrete rebar .................................................................................... 86
xiii
List of Figures (Continued) Figure Page 4.4 HCP graph of Ductal PVA in wet cycle ........................................................ 86 4.5 HCP graph of Ductal PVA in dry cycle ......................................................... 87 4.6 Ductal PVA rebar ........................................................................................... 89 4.7 HCP graph of Ductal Steel in wet cycle ........................................................ 90 4.8 HCP graph of Ductal Steel in dry cycle ......................................................... 90 4.9 Ductal Steel rebar ........................................................................................... 92 4.10 HCP graph of PC + DP in wet cycle .............................................................. 93 4.11 HCP graph of PC + DP in dry cycle .............................................................. 93 4.12 PC + DP rebar ................................................................................................ 95 4.13 HCP graph of PC + DS in wet cycle .............................................................. 96 4.14 HCP graph of PC + DS in dry cycle .............................................................. 96 4.15 Sample A ........................................................................................................ 97 4.16 Sample B ........................................................................................................ 98 4.17 Sample C ........................................................................................................ 98 4.18 Position of cores on the large uncracked samples .........................................100 4.19 Bottom part of Ductal PVA interface ............................................................100 4.20 HCP graph of Ductal PVA in wet cycle ........................................................101 4.21 HCP graph of Ductal PVA in wet cycle ........................................................102 4.22 Top rebar of shear key (sample 1) .................................................................104 4.23 Top rebar of interface (sample 2) ...................................................................104
xiv
List of Figures (Continued) Figure Page 4.24 Top rebar of precast concrete (sample 3) .......................................................105 4.25 Bottom part of Ductal Steel interface ...........................................................106 4.26 HCP graph of Ductal Steel in wet cycle ........................................................107 4.27 HCP graph of Ductal Steel in dry cycle .........................................................107 4.28 Top rebar of sample 1 ....................................................................................109 4.29 Top rebar of sample 2 ....................................................................................109 4.30 Top rebar of sample 3 ....................................................................................110 4.31 Interface of Quikrete PVA .............................................................................111 4.32 HCP graph of Quikrete PVA in wet cycle .....................................................112 4.33 HCP graph of Quikrete PVA in dry cycle .....................................................112 4.34 Top rebar of sample 1 ....................................................................................114 4.35 Top rebar of sample 2 ....................................................................................114 4.36 Top rebar of sample 3 ....................................................................................115 4.37 Bottom surface of Ductal PVA Static ............................................................117 4.38 HCP graph of Ductal PVA in wet cycle ........................................................118 4.39 HCP graph of Ductal PVA in dry cycle .........................................................118 4.40 Top rebar of sample 1 ....................................................................................121 4.41 Top rebar of sample 2 ....................................................................................121 4.42 Top rebar of sample 3 ....................................................................................122 4.43 HCP graph of Ductal Steel in wet cycle ........................................................123
xv
List of Figures (Continued) Figure Page 4.44 HCP graph of Ductal Steel in wet cycle ........................................................123 4.45 Top rebar of sample 1 ....................................................................................126 4.46 Top rebar of sample 2 ....................................................................................126 4.47 Top rebar of sample 3 ....................................................................................127 4.48 Bottom surface of Ductal Steel (FAT - 02) ...................................................128 4.49 HCP graph of Ductal Steel in wet cycle ........................................................129 4.50 HCP graph of Ductal Steel in dry cycle .........................................................129 4.51 Top rebar of sample 1 ....................................................................................131 4.52 Top rebar of sample 2 ....................................................................................131 4.53 Top rebar of sample 3 ....................................................................................132 4.54 Bottom surface of Quikrete PVA Fatigue sample .........................................133 4.55 HCP graph of Quikrete PVA in wet cycle .....................................................134 4.56 HCP graph of Quikrete PVA in dry cycle .....................................................134 4.57 Top rebar of sample 1 ....................................................................................136 4.58 Top rebar of sample 2 ....................................................................................136 4.59 Top rebar of sample 3 ....................................................................................137 4.60 Bottom surface of Quikrete PVA Static (STA - 01) ......................................138 4.61 HCP graph of Quikrete PVA in wet cycle .....................................................139 4.62 HCP graph of Quikrete PVA in dry cycle .....................................................139 4.63 Top rebar of sample 1 ....................................................................................141
xvi
List of Figures (Continued) Figure Page 4.64 Top rebar of sample 2 ....................................................................................142 4.65 Top rebar of sample 3 ....................................................................................142
1
CHAPTER ONE
INTRODUCTION
1.1 Introduction
Corrosion of steel bridges, concrete bridges with embedded steel reinforcement
and concrete pavements with embedded steel reinforcement has a significant impact on
the performance of transportation infrastructure. In a recent study, the total direct cost of
corrosion was estimated to be $276 billion per year out of which the cost associated with
the transportation infrastructure is 16.4 % (Yunovich, Thompson, and Virmani, 2005).
Highway bridges are a critical component of the transportation infrastructure since the
failure or load posting of a bridge can have a dramatic influence on the functionality of a
transportation route. The funds required for repairing or replacing a bridge structure and
the losses associated with the posting or temporary closure of traffic lanes during
construction or maintenance of a bridge can have a substantial cost to a community.
Nearly $8.3 billion is the estimated average annual direct cost of corrosion for highway
bridges. Reinforced concrete bridges account for 40% of all the bridges constructed in the
United States since 1950. There are 543,019 reinforced concrete and steel bridges out of
which 78,448 are classified as structurally deficient leaving rest of them in a working
condition subjected to regular maintenance (Yunovich, Thompson, and Virmani, 2005).
Most of these reinforced concrete bridges are constructed of precast concrete adjacent
box girder bridges. The use of precast concrete elements in the form of adjacent box
girder has been popular since 1950s due to its numerous advantages over the other types
of bridges such as: ease and rapid speed of construction because of the elimination of
2
concrete formwork, a shallow superstructure depth necessary for vertical clearance, low
construction cost, hollow portions inside the box girders that reduce the self-weight of it
and helps to carry electrical, communication cable and various pipe lines (inside the
hollow space in case of large box girders and are hung to the bottom of the soffit beam in
case of small box girders) , and it offers high torsional stiffness (Hanna, Morcous, and
Tadros, 2009).
These bridges have been in service for some time with a reasonable performance
record except for one major issue. Occurrence of cracks on the grouted filler (shear key)
joint which is used to provide continuity between two adjacent box girders together,
results in the reflective cracks on the wearing surface. The cracks can form either during
the construction or during the usage of the bridge. During the construction, the cracks are
induced between the interface of the precast elements and the shear key due to the bridge
deck being subjected to a large amount of dead loads by the placement of raw materials,
heavy cranes and equipment required during the construction process which results in the
subjection of heavy dead loads to the bridge deck leading to unaccounted vibrations
resulting in the formation of undesirable cracks between the two different materials.
While the bridge is in operation and used by the ongoing traffic the cracks are formed on
the wearing surface due to heavy axial loads (running wheel load) and irregular
maintenance of the wearing surface of the deck causing the majority of the cracks to form
directly over the interface of precast elements and the shear key present beneath the
wearing surface since they might have already cracked and weakened during the
construction process. The cracking leads to leakage and seeping of water containing

3
corrosive agents, like chloride, magnesium and sulfate ions and oxygen to the bottom and
sides of the girder which causes the embedded steel reinforcements and the pre-stressing
strands to corrode and thus reduces the structural and serviceable strength of the entire
bridge structure. The first failure of this system type was recorded in Indiana in 1970s.
Other similar failures include a bridge in Cuyahoga County, Ohio that failed in 1989 and
a bridge on Lake View Drive in Pennsylvania that failed in 2005. These three failures
have the same commonality of cracking on the bridge deck resulting in ingress of
chloride-laden water corroding the steel reinforcement (Naito, Jones, and Hodgson,
2011).
The structural elements of a bridge can be primarily classified into three sub-
systems: foundation, sub-structure and super-structure. The foundation (footers, caissons,
piles) provides the load transfer from the sub-structure to the ground supporting the
bridge structure. Abutment walls, columns and column bents, piles and pile caps are
considered to be the sub-structure and support the primary elements of the bridge. The
structural elements and decks within the super-structure tend to be more vulnerable to
corrosion due to greater likelihood of cracking of the concrete. The exposure of deck
elements to the atmosphere supplements the water and oxygen needed to instigate the
corrosion of the embedded reinforcement. The typical concrete cover depth provided for
the reinforcement of the deck (1 to 2 inches) is less as compared to the cover provided for
foundations and columns (3 to 4 inches). The foundation and the sub-structure elements
of the bridge are usually subjected to direct compression loads whereas the bridge deck in
complementary with the former is also subjected to flexural, tension and shear loads at
4
the center of the span and at the supports resulting in cracks at the soffit of the beam
providing an entrance to the corrosive agents to initiate the process of corrosion in the
tension reinforcement (at the bottom of the slab) as shown in Figure 1.1. Precast concrete
has replaced the conventional cast-in-place concrete due to the overwhelming advantages
that the former offers over the latter; speedy construction since there is no need for
placing formworks, grading the aggregates, mixing of ingredients, curing of concrete and
also the cost is reduced since there will be no need for employing foremen to carry out
the above operations. But still precast concrete has some of its own disadvantages over
cast-in-place concrete no cost have to be incurred on the transportation of the
prefabricated elements safely from the casting yard to the site and there will be no need to
expend capital on hiring expert technicians for installation of these prefabricated
elements, the contractor need not worry about careful handling and placing of these
elements on the construction site, but the biggest advantage lies in the fact that the
structure is monolithic with minimum joints between column, beams and slabs since all
of them will be casted at the same time. Structures made up of precast concrete elements
have plenty of segmental joints in the form of shear key and closure pours which are
required to maintain the continuity of the structure so that the structure can behave as
monolithic as possible.
Usually the weakest point of any type of structure can be defined as the
connections or the joints that exists in them and therefore careful design and due
considerations are given to it while designing and construction. Similarly in the case of
precast adjacent box girders the weakest point can be considered as the shear key which
5
helps to join the two adjacent precast elements together so that there is a perfect bond
between them to serve as a single unit for maintaining a continuity of the bridge. The
cracks are formed usually on the interface of the shear key and the precast elements
allowing the ingress of water through them. In the earlier construction process high
precision grouting materials were used as filler joint to act as a shear key between the two
precast elements since they possessed high and improved properties than precast
concrete. But this material was found to be permeable leading to leakages and formation
of surface and bonding cracks making it obsolete and lead to the development of Ultra-
High Performance Fiber Reinforced Concrete (UHPFRC) which is a material that
possesses properties far more superior than the ordinary and high performance concrete
and therefore replacing the (high strength pressure fluid) grouting material as a shear key.
UHPFRC is a fairly new material introduced to the construction industry nearly a decade
ago and hence extensive amount of research on its physical and chemical properties are
being carried out by the government agencies and the construction companies to analyze
its effectiveness in counteracting the problems faced by the conventional grouting
materials. This technology in the US is relatively new that claims to meet the
shortcomings of many types of concrete through its high strength to weight ratio, high
ductility and enhanced durability properties. But still, to gain acceptance by designers,
contractors, precasters, and owners, this material needs to be tested according to ASTM
International and AASHTO standards, and new practices must be developed. Other
parameters like curing methods and practices, age of the specimen on strength, resistance
to environment etc. need to be investigated (Ahlborn, Harris, Misson, and Peuse, 2011).

6
Extensive amount of research has been carried out on the compressive, tensile, flexural,
permeability, shrinkage, curing and microstructure of UHPFRC which have explicitly
surpassed the properties of all its predecessor materials with realistic models and values.
Permanent values and relevant standards of the entire above aforementioned properties
have been established by the results obtained from the experiments conducted on
UHPFRC.
Figure 1.1 Corroding rebars at the bottom the slab of a bridge
7
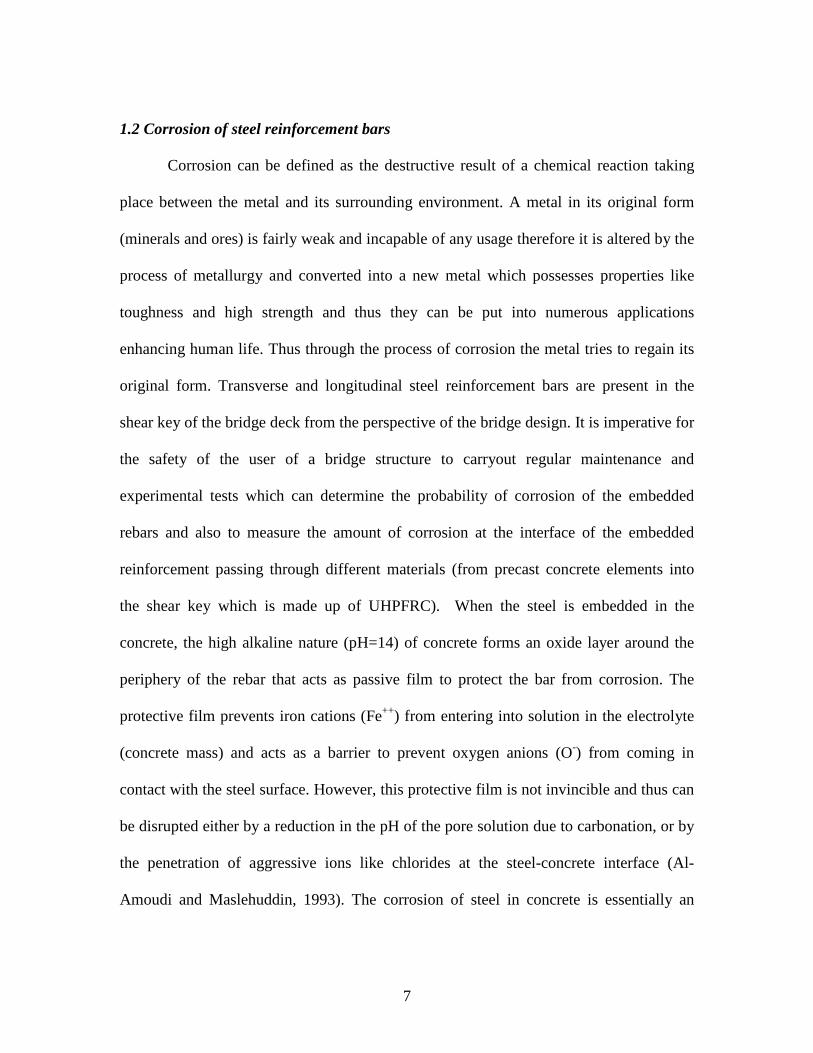
1.2 Corrosion of steel reinforcement bars
Corrosion can be defined as the destructive result of a chemical reaction taking
place between the metal and its surrounding environment. A metal in its original form
(minerals and ores) is fairly weak and incapable of any usage therefore it is altered by the
process of metallurgy and converted into a new metal which possesses properties like
toughness and high strength and thus they can be put into numerous applications
enhancing human life. Thus through the process of corrosion the metal tries to regain its
original form. Transverse and longitudinal steel reinforcement bars are present in the
shear key of the bridge deck from the perspective of the bridge design. It is imperative for
the safety of the user of a bridge structure to carryout regular maintenance and
experimental tests which can determine the probability of corrosion of the embedded
rebars and also to measure the amount of corrosion at the interface of the embedded
reinforcement passing through different materials (from precast concrete elements into
the shear key which is made up of UHPFRC). When the steel is embedded in the
concrete, the high alkaline nature (pH=14) of concrete forms an oxide layer around the
periphery of the rebar that acts as passive film to protect the bar from corrosion. The
protective film prevents iron cations (Fe++) from entering into solution in the electrolyte
(concrete mass) and acts as a barrier to prevent oxygen anions (O-) from coming in
contact with the steel surface. However, this protective film is not invincible and thus can
be disrupted either by a reduction in the pH of the pore solution due to carbonation, or by
the penetration of aggressive ions like chlorides at the steel-concrete interface (Al-
Amoudi and Maslehuddin, 1993). The corrosion of steel in concrete is essentially an
8
electrochemical process, where at the anode, iron, is oxidized to iron ions that pass into
solution and at the cathode oxygen is reduced to hydroxyl ions (Yoo, Park, Kim, and
Chung, 2003). The surface of the corroding steel reinforcement bar which is embedded in
the concrete mass functions as a mixed electrode that is a composite of anodes and
cathodes electrically connected through the body of steel itself, upon which coupled
anodic and cathodic reactions take place while concrete pore water functions as an
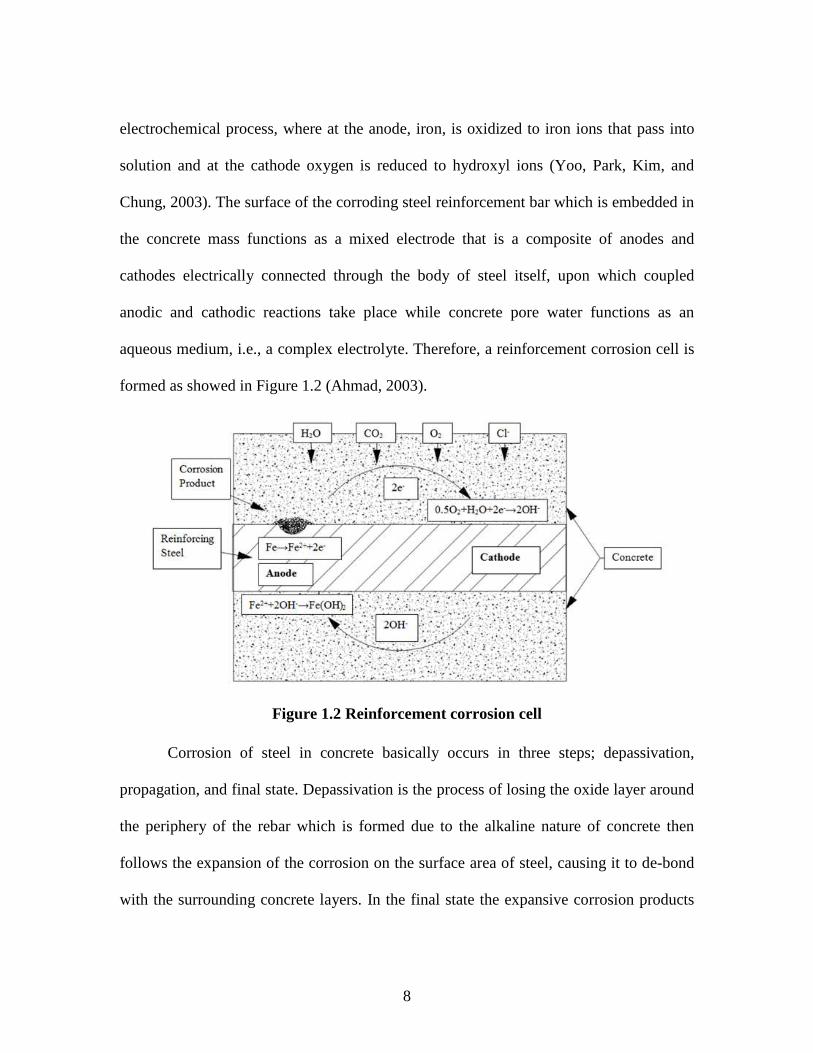
aqueous medium, i.e., a complex electrolyte. Therefore, a reinforcement corrosion cell is
formed as showed in Figure 1.2 (Ahmad, 2003).
Corrosion of steel in concrete basically occurs in three steps; depassivation,
propagation, and final state. Depassivation is the process of losing the oxide layer around
the periphery of the rebar which is formed due to the alkaline nature of concrete then
follows the expansion of the corrosion on the surface area of steel, causing it to de-bond
with the surrounding concrete layers. In the final state the expansive corrosion products
Figure 1.2 Reinforcement corrosion cell
9
(rust) causes the concrete to crack and spall by exceeding its internal tensile stress limits
(Ahmad, 2003).
The first step to identify the ongoing corrosion is the visual inspection of the
structure and then to use the various electrochemical devices available in the market to
find the extent and the rate of corrosion. Quality concrete is able to prevent the embedded
reinforced steel bar from the potential of corrosion in three ways. First, hydration
products of cement in concrete forms a high alkaline pore solution environment, where
the passivated film covering the steel surface remains chemically stable enough to protect
reinforcing steel from corroding. Second, quality concrete usually possesses low porosity
and permeability, which greatly minimizes the penetration of corrosion-induced agents
(such as chloride, carbon dioxide, oxygen, moisture, etc.) through the porous concrete
mass. Third, the high electrical resistivity of quality concrete restricts the corrosion by
reducing the electrical current flow between the anodic and cathodic sites (Chen and
Mahadevan, 2008).
Factors affecting corrosion of steel in concrete may be classified into two major
categories; internal and external factors. The internal factors mainly consist of
environmental parameters; availability of oxygen and moisture at rebar level, relative
humidity and temperature, cement composition, impurities in concrete ingredients, water
cement ratio. The external factors consist of stray currents, bacterial action (Ahmad,
2003). According to the Ueli M. Angst who carried out an experiment in which
reinforcement steel was embedded in six different concrete mixes and exposed to
chloride solutions in cycles of wet and dry periods. Pitting was observed to be formed at

10
the backside (respect to casting direction) of the reinforcement embedded in the concrete.
The concrete in contact with the rebar on the front side was whitish in color while at the
backside was grey in color indicating that there was a good bond at the front side as
compared to back side of the rebar, may be due to bleeding, plastic settlement or higher
w/b ratio. Corrosion occurred at the backside of the rebar even though higher chloride
concentration was present at the front side. Hence he concluded that the most dominant
influencing parameter is the steel-concrete interface with respect to the corrosion
performance of embedded steel bar in concrete environment (Angst, Elsener, Larsen, and
Vennesland, 2011).
1.3 Objectives
Very little research has been carried out on the aspect and the extent of corrosion
of the embedded reinforcement bar and pre-stressing strands in UHPFRC which is the
leading cause for failures of bridge girders. Ample amount of research has been done on
the corrosion of reinforcement embedded in ordinary concrete and on the individual
properties of materials like concrete and UHPFRC but in reality these materials act as a
single unit in a bridge deck. There are number of bars passing between two precast
concrete elements having a shear key or a closure pour between them and hence no
research have been conducted so far by considering the combined effect of precast
concrete and the shear key from the view point of strength and serviceability of the
bridge. UHPFRC and precast concrete are vastly different from each other hence the
reinforcement bar passing through both of them may undergo variable damaging changes
along its length. No such research has been undertaken which evaluates the condition of
11
the embedded reinforcement passing through different medium of materials on the aspect
of strength and durability in order to predict and examine the structural behavior of
precast adjacent box beam girder bridges. Extensive amount of research has been carried
out on the corrosion of steel reinforcement embedded in concrete, while negligible or
practically research has been carried out on the corrosion of the rebar embedded in
UHPFRC. Properties like compressive, tensile and flexural strength, shrinkage, curing,
modulus of elasticity and rupture have been studied in detail and relative standards have
been established for the design and construction purposes. But its performance with
embedded reinforced bars which includes properties like bond strength, workability, and
corrosion of reinforcement have seldom been tested or researched upon. The following
are the objectives of this research;
• To identify the regions of active and passive corrosion of the embedded
reinforcement with the help of non-destructive electrochemical techniques.
• To investigate the extent of corrosion of the rebar by measuring the corrosion
current with half-cell potential and linear polarization resistance technique.
• To investigate the reliability of the above electrochemical technique in the
prediction of corrosion of rebar embedded in UHPFRC.
• To observe the corrosion pattern with respect to cracks formation taking place in
samples made of different materials.
• To identify the performance of various materials with respect to the corrosion
undergone by the rebar.
12
1.4 Summary of approach
Ductal grey premix an ultra-high performance concrete manufactured by
LaFarge, Non-Shrink Precision Grout manufactured by Quikrete and precast concrete
mix design provided by Metromont (Greenville, SC) were used as primary materials in
the casting of all samples. Steel and polyvinyl alcohol (PVA) fibers were used to produce
fiber reinforced concrete and #4 steel deformed bars were used as longitudinal and
transverse reinforcement. The mix designs are similar to the ones used in the actual
construction of a bridge. Utmost care was taken during the mixing of the materials and
casting of the specimens to minimize the variability of the results.
All the samples were subjected to 3% NaCl solution on the top surface of the
specimens for a period of two weeks as a wet cycle and then followed by two weeks of
dry cycle (without direct exposure to the solution). Modified ASTM G 109 samples were
prepared to serve as control specimens from following the procedure of a standardized
test. Full scale bridge deck samples which were structurally tested and had existing
cracks within the precast concrete, within the shear key and in the interface of these
surfaces, where also exposed to the 3% NaCl solution. Similar uncracked specimens were
also tested for comparison to the other specimens.
All the samples were subjected to cyclic wet and dry period of two weeks for a
total period of 44 weeks. Half-cell potential (HCP) measurements were taken once at the
end of each period of G 109 and large samples. After determining the most and the least
corrosive samples of G 109 and points on the large samples with the help of potential
contour charts formed by measuring HCP on a number of selected points on the samples
13
and then electrochemical techniques such as linear polarization test and cyclic
polarization test was carried out to estimate the rate of corrosion. The results so obtained
were compared with condition of the cores extracted from the large samples at the end of
the experiments to observe the condition of the rebar in order to have a visual
confirmation on the results obtained from the electro-chemical techniques. Based on the
results obtained from the above tests on the specimens, valuable information was
obtained which helped in drawing conclusions regarding the performance of UHPFRC in
conjunction with reinforcement bars when subjected to salt solution in the presence and
absence of surface cracks.
1.5 Outline of thesis
Chapter 2 is concerned with the complete background report of the above
problem. The conditions and research carried out on the bridges, corrosion of the rebar in
concrete, the techniques adopted to detect and measure the corrosion of the embedded
reinforcement. Literature review of research carried out on UHPFRC and its properties
along with relevant tests. Chapter 3 discuss about the materials used in this research
along with the properties, type of samples prepared for the research and all the
experiments and various electro-chemical techniques used in this research to predict and
examine the condition of the rebar embedded in precast concrete and UHPFRC. Chapter
4 discusses the results obtained from the experiments in detail. Scrutinizing and
analyzing the results of the test with that of core samples obtained from the samples at the
end of the testing period. Chapter 5 deals with the conclusions of the research along with

14
the recommendations and future works that can be carried out on the same and relevant
topics.

15
CHAPTER TWO
BACKGROUND
Reinforced concrete structures can possess numerous advantages over a steel
frame, plain concrete, masonry and timber structures, such as properties like; higher
durability, better mechanical performance, less permeable to flowing liquids, increased
resistance to abrasion, atmosphere and chemical attacks. Therefore, all these
characteristics concludes that reinforced concrete structures are more efficient, reliable
and have a longer service life than any other type of structures for providing shelter to
human life as of present. However, corrosion of steel reinforcement embedded in
concrete is the main deterioration mechanism for such structures.
Corrosion of the rebar is the one of the most disastrous chronic problems
occurring in reinforced concrete structures. Once initiated it exists in the structure till the
end of its service life. Corrosion is an electrochemical reaction which occurs when the
metal (rebar) is exposed to aggressive species such has chloride ions. To overcome this
problem many investigations have been carried out to minimize the corrosion related
issues in the reinforced concrete so that the structure maintains its integrity. One of the
approaches is to develop less permeable concrete materials to reduce the diffusion of the
corrosive species. High Performance Concrete (HPC), Reactive Powder Concrete (RPC),
Ultra High Performance Concrete (UHPC), and Ultra High Performance Fiber
Reinforced Concrete (UHPFRC) are some of the examples of such materials.
In this Chapter, the information on: the precast concrete adjacent box bridges,
their performance and utilities, corrosion of embedded reinforcement in concrete, the
16
most common corrosion measuring techniques, UHPFRC and its properties and
properties of Ductal grey premix.
2.1 Bridges
According to the National Bridge Inventory database there are nearly 600,000
bridges existing in the United States half of which were constructed between the periods
of 1950 to 1994. There are approximately 543,000 concrete and steel bridges out of
which 78,488 are declared as structurally deficient leaving rest of the bridges on a regular
basis to be maintained. After diligently including all the necessary facts an estimated
figure of $8.3 billion dollars for the average annual direct cost of corrosion for the
highway bridges was worked out (Yunovich et al., 2005). This research is focused on
precast concrete adjacent box beam girder bridges as shown in Figure 2.1, sometimes
they are also referred as hollow precast box bridges due to its cross sectional geometry.
Precast concrete adjacent box girder bridges were constructed in large numbers
since 1950’s due to the technique of Accelerated Bridge Construction (ABC). This was
widely accepted in most parts of northeastern United States due to its innovative
Figure 2.1 Cross section of precast adjacent box bridge (Clay Naito 2011)
17
planning, reduced cost and rapid speed of construction. Hollow concrete bridge decks
with embedded reinforcement were cast at casting yards in bulk quantity which resulted
in decrease of time in construction and the cost of the bridge. These bridges consist of
multiple precast concrete girders that are joined against each other to form the bridge
deck. They were post-tensioned transversely with steel strand wires at the site and the
adjacent slabs were connected using full or partial depth shear keys which consist of high
strength grouting material. The system of load transfer of moving traffic relied on the
strength and stiffness of the shear key and the post-tensioned strands (Hanna et al., 2009;
Yunovich et al., 2005).
Box beam girder bridges have performed well but the major problem arising is the
corrosion of pre-stressing strands and the embedded reinforcement in the bridge deck due
to the ingress of chloride ions in the bridge deck which is caused due to the following
reasons:
1) Longitudinal cracks on the shear key in the grouted joints and on the interface
between the grout material and precast concrete elements arising from temperature
gradients, dynamic loads (imparted from the moving road traffic), and static loads
(imparted during the construction of the bridge from the stationary heavy duty cranes
and other equipment’s like air compressor, wheel rollers, concrete pumping machine
and vibrators.
2) A lack of adequate transverse force within the prestressing strands due to poor
workmanship results in differential movements between the adjacent precast girders
leading to un-anticipated crack patterns on the deck.
18
3) Presences of open vent holes in beams with cardboard form voids collect the water
and clog the drain holes resulting in pooling of stagnant water in the voids present on
the deck.
4) The use of snowplows to remove snow that accumulates on the bridge deck leads to
openings on the coated or uncoated bridge decks due to the physical contact
(abrasion) between the steel blades and the asphalt surface.
The chloride analysis of a corroding bridge deck has revealed that the chloride
content in concrete around the cracks exceed the critical Chloride Threshold Level (CTL)
within the first year of its construction, hence the reinforcing steel must be protected from
corrosion at the time of its construction (Darvin, Browning, O’Reily, Locke Jr. and
Virmani, 2011). Presence of cracks on the bridge decks provides a free path to the
chloride ions to reach the steel reinforcements (tensioned and non-tensioned) and cause
corrosion. Use of de-icing salts, close proximity to coastal salt water, salt sprays from
recreational water vehicles are some of the sources responsible for the presence of
chloride ions on the bridge decks (Naito et al., 2011). Chloride ions alone are innocuous
to rebars but along with oxygen and moisture it can initiate the corrosion process as soon
as they come in contact with the reinforcement surface leading to de-bonding between
steel and concrete forcing the reinforce concrete to forfeit its tension carrying capacity.
Such condition jeopardizes the durability and structural behavior of the precast adjacent
box beam girders and due to the clogged drains the water starts getting collected in the
hollow precast boxes which causes the loaded girders to carry additional load that
exceeds the design load (Hanna et al., 2009).
19
After careful study and examination of the box beam failures that have occurred
in the past following suggestions are put forward to improvise the current design and
construction practices of such bridges to prevent their failures due to the action of
corrosion;
1) Post-tensioned high strength ties should be incorporated in the design since they are
capable of increasing the tensile carrying capacity of the concrete in conjunction with
epoxy coated reinforcement bar which can increase the service life by decreasing the
probability of corrosion.
2) High strength grouting material in the form of ultra-high performance fiber
reinforce grout is used to fill the shear key instead of non-shrink grout.
3) The interface of precast elements to be grouted is sand blasted to improve its bond
strength.
4) The depth of concrete cover at the soffit of the beam and the number of tendons in the
transverse directions are increased.
5) Shear key is provided to the full depth of the girder cross-section.
6) New and improved design methodology is provided by the organization of
Precast/Prestressed Concrete Institute (PCI) in their published journals and articles
(Hanna et al., 2009).
2.2 Corrosion and its mechanism
Concrete gives corrosion resistance to steel reinforcement because it provides
both a physical barrier and chemical protection. Steel is thermodynamically unstable in
atmosphere and tends to revert to a lower energy state such as an oxide or hydroxide by
20
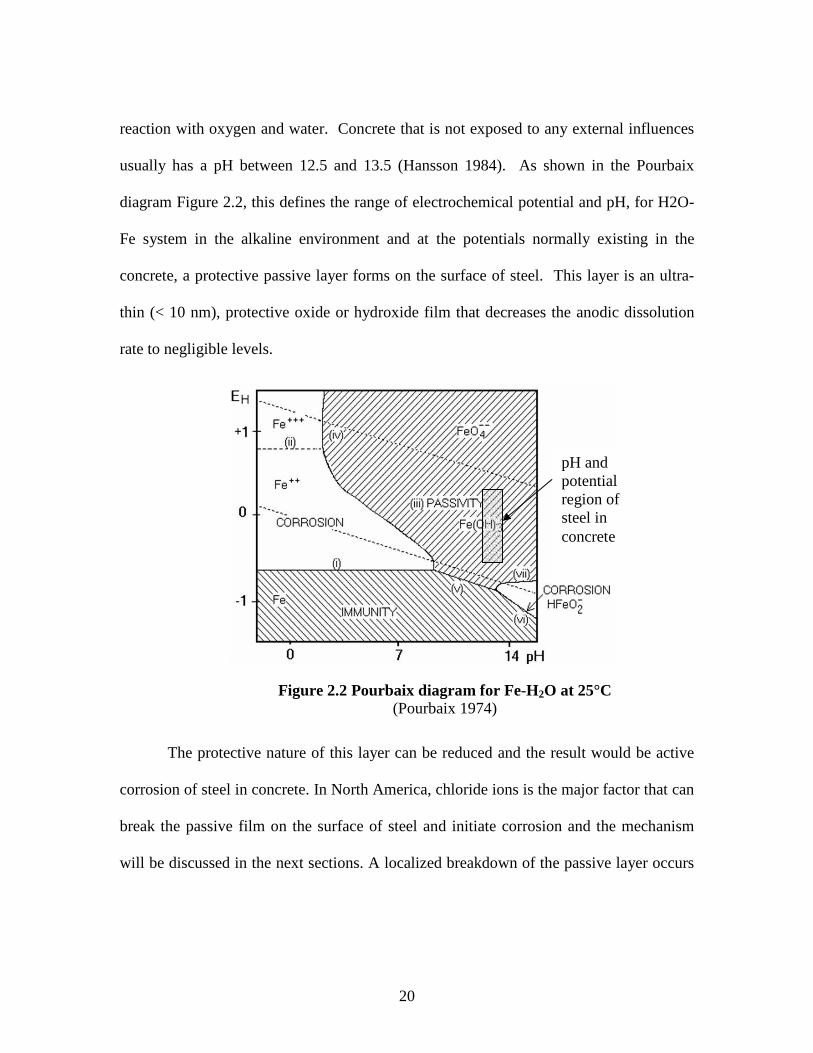
reaction with oxygen and water. Concrete that is not exposed to any external influences
usually has a pH between 12.5 and 13.5 (Hansson 1984). As shown in the Pourbaix
diagram Figure 2.2, this defines the range of electrochemical potential and pH, for H2O-
Fe system in the alkaline environment and at the potentials normally existing in the
concrete, a protective passive layer forms on the surface of steel. This layer is an ultra-
thin (< 10 nm), protective oxide or hydroxide film that decreases the anodic dissolution
rate to negligible levels.
The protective nature of this layer can be reduced and the result would be active
corrosion of steel in concrete. In North America, chloride ions is the major factor that can
break the passive film on the surface of steel and initiate corrosion and the mechanism
will be discussed in the next sections. A localized breakdown of the passive layer occurs
pH and potential region of steel in concrete
Figure 2.2 Pourbaix diagram for Fe-H2O at 25°C (Pourbaix 1974)

21
when sufficient amount of chlorides reach reinforcing bars, and the corrosion process is
then initiated. There are three theories about the chloride attack (ACI 222, 1996):
1. Penetration of chloride ions to the oxide film on steel through pores or defects in
the film is easier than the penetration of other ions.
2. Chloride ions are adsorbed on the metal surface in competition with dissolved O2
or hydroxyl ions.
3. Chloride ions compete with hydroxyl ions for the ferrous ions produced by
corrosion and a soluble complex of iron chloride forms which can diffuse away
from the anode, destroying the protective layer of Fe (OH)2 permitting corrosion
to continue.
The chloride induced corrosion of the steel reinforcement results in the formation
of expansive corrosion products in the concrete which causes cracking and spalling of the
concrete (Yunovich et al., 2005). The volume of corrosion products is greater than that of
original steel bar. This results in expansive stresses around the corroded steel bar
exceeding the tensile strength limit of surrounding concrete mass resulting in cracking,
spalling of concrete cover and loss of bond between steel and concrete (Abosrra et al.,
2011; Abosrra, Ashour, and Youseffi, 2011). A crack facilitates the entry of chloride
ions, moisture and oxygen to the reinforcements (Charron, Denarie, and Bruhwiler,
2007).
Corrosion of reinforcement is controlled by increasing the concrete cover and
crack width limitations by choosing adequate steel bar spacing which will result in
permissible stresses in reinforcement. The availability of ultra-high performance fiber
22
reinforce concrete (UHPFRC) can be utilized in resisting and curtailing the occurrence of
corrosion in the vulnerable parts of any reinforced structures. This can be achieved by
placing this material in the parts of bridge which have high probability of getting infected
of corrosion especially in the bridge super-structure elements like parapet walls, wearing
surface of bridge deck, drain and vent holes. Due to its dense micro-structure and low
porosity it practically becomes impregnable for the even for the stagnant chloride laden
water to penetrate it (Charron et al., 2007). In order to reduce corrosion, selection of
concrete with resistance to chloride penetration is very essential to maintain the integrity
of reinforced concrete structures (Shi, Deng, and Xie, 2006).
2.2.1 Kinetics and thermodynamics of corrosion
Corrosion is an electrochemical reaction which consists of anodic and cathodic
half-cell reactions. Micro-cell corrosion is the term given to the situation where active
dissolution and the corresponding cathodic half-cell reaction take place at adjacent parts
of the same metal part. For a steel reinforcing bar (rebar) in concrete, this process always
occurs in practice. The surface of the corroding steel can act as a mixed electrode
containing both anode and cathode regions which are connected by the bulk steel.
Macro-cells corrosion can also form on a single bar exposed to different environments
within the concrete or where part of the bar extends outside the concrete. In both cases,
concrete pore solution functions as an electrolyte. Figure 1.2 shows a schematic
illustration of corrosion in reinforcing concrete.
23
For steel embedded in concrete, based on the pH of the concrete (electrolyte) and
presence of aggressive ions, the following would be the possible anodic reactions
[Ahmed 2003, Hansson 1984]:
3Fe + 4H2O → Fe3O4 + 8H+ + 8e
2Fe + 3H2O → Fe2O3 + 6H+ + 6e
Fe + 2H2O → HFeO2- + 3H+ + 2e
Fe → Fe2+ + 2e
The possible cathodic reactions depend on the availability of O2 and on the pH
near the steel surface. The most likely reactions are as follows (Ahmed 2003, Hansson
1984):
2H2O + O2 + 4e- → 4OH
2H2O + 2e- → H2 + 2OH
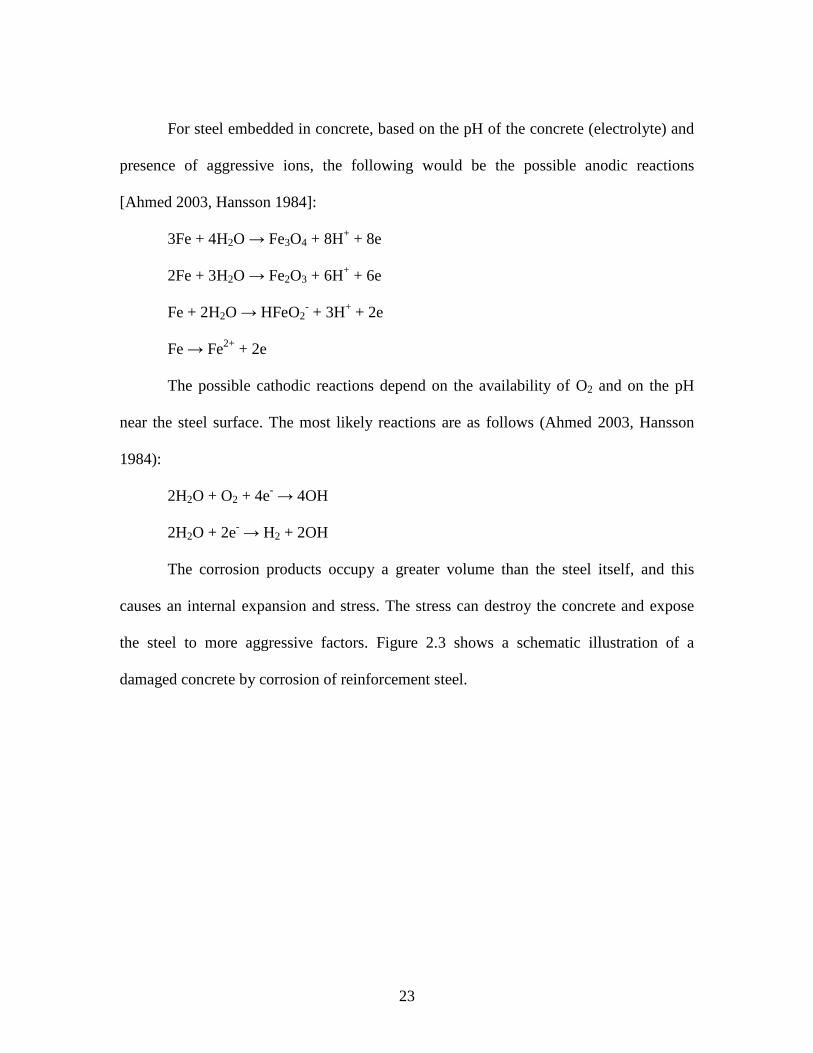
The corrosion products occupy a greater volume than the steel itself, and this
causes an internal expansion and stress. The stress can destroy the concrete and expose
the steel to more aggressive factors. Figure 2.3 shows a schematic illustration of a
damaged concrete by corrosion of reinforcement steel.
24
2.2.2 Influence of cracks on corrosion
Reinforced concrete structures were considered to be a durable and maintenance
free structures; however, concrete is capable of developing cracks on its surface due to
drying shrinkage, alkali silica reaction, thermal effects, and temperature gradient making
it vulnerable to deteriorate before the end of its service life. The cracks can lead to the
entry of water containing corrosive species inside the concrete causing the reinforcements
to corrode (Tsukahara and Uomoto, 2000). Smaller the frequency of cracks the lesser is
the amount of corrosion of steel in concrete irrespective of all other parameters (Arya and
Ofori-Darko, 1996). The corrosion cracks can also form on the concrete surface due to
the formation of corrosion products which are in excessive volume than the base metal
(steel reinforcement) causing the surrounding mass to exceed the tensile limit of the
material (concrete). The appearance of cracks on the concrete surface provides a free
Figure 2.3 Schematic diagram showing spalling of concrete due to corrosion damage (Corrosion-club, 2004)
25
entrance to the corrosive species to travel inside the concrete (Aveldano and Ortega,
2011). Reinforced concrete structures having surface cracks, located in places that
receive snowfall can also undergo the freeze-thaw effect which leads to deeper cracks
that might reach the surface of the rebar, and consequently, act as the free path to
aggressive species. Corrosion of steel reinforcement results in decrease in its cross-
sectional area and also deteriorates the bond between the steel reinforcement and the
concrete which leads to the degradation of the entire structure (Kato, Kato, and Uomoto,
2005). A crack has the ability to accelerate the dynamic action of corrosion and thus
shortens the life of the structure. The corrosion of steel in cracked concrete is localized as
compared to the corrosion in un-cracked concrete (Otieno, Alexander, and Beushausen,
2010).
Most of the research and experiments to establish a relationship between crack
and corrosion have used or focused on unloaded or statically loaded cracks. However in
actual practice reinforced concrete structures are subjected to variable loadings, hence the
cracks in such structures open and close with the application of load which could
influence the corrosion of the steel. This was studied by Jaffer and Hansson, through their
experiments they observed that the corrosion had occurred on the rebar only at places
which were intercepted by cracks, the type of loading has less significance on the process
of corrosion than other parameters like exposure conditions and type of concrete (Jaffer
and Hansson, 2008). It is imperative to remember that concrete always has cracks (in one
form or the other) on its surface which have an immense impact on the corrosion of rebar
26
embedded in it. The presence of cracks also avails the access to oxygen and moisture
which both are required for the corrosion process to occur.
Experiments have shown that in a specimen with multiple cracks, corrosion
initiates earlier at the major (wider) cracks. Defining a crack width limit to minimize
corrosion is a difficult task. However several building codes like ACI 224 (2009) and
ACI 318 (2009) limit crack widths to 0.4 mm (0.016 in.) (Bhaskar, Gettu, Bharatkumar,
and Neelamegam, 2011).
2.3 Corrosion measuring techniques
There are many methods available for evaluating the corrosion of the embedded
reinforcement bar in concrete. The questions arising for selecting a suitable technique for
carrying out the above operation are as follows; technique to be used in the field or the
lab, the amount of accuracy required, the amount of time and funds available for the tests,
and should it be destructive or non-destructive. Below are the details of the techniques
that were sued in this investigation which are the most common corrosion evaluation
methods in steel reinforced concrete structures.
2.3.1 Half-cell Potential Test (HCP)
The half-cell potential technique is the most widely used technique of corrosion
measurement of the steel rebars in concrete. It was introduced in the 1970s by Richard F.
Stratfull in North America and by the Danish Corrosion Centre in Europe (Stratfull
1972). In 1980, the C 876 “Standard Test Method for Half-cell Potentials of Uncoated
Reinforcing Steel in Concrete” test was approved as a standard by ASTM. This
27
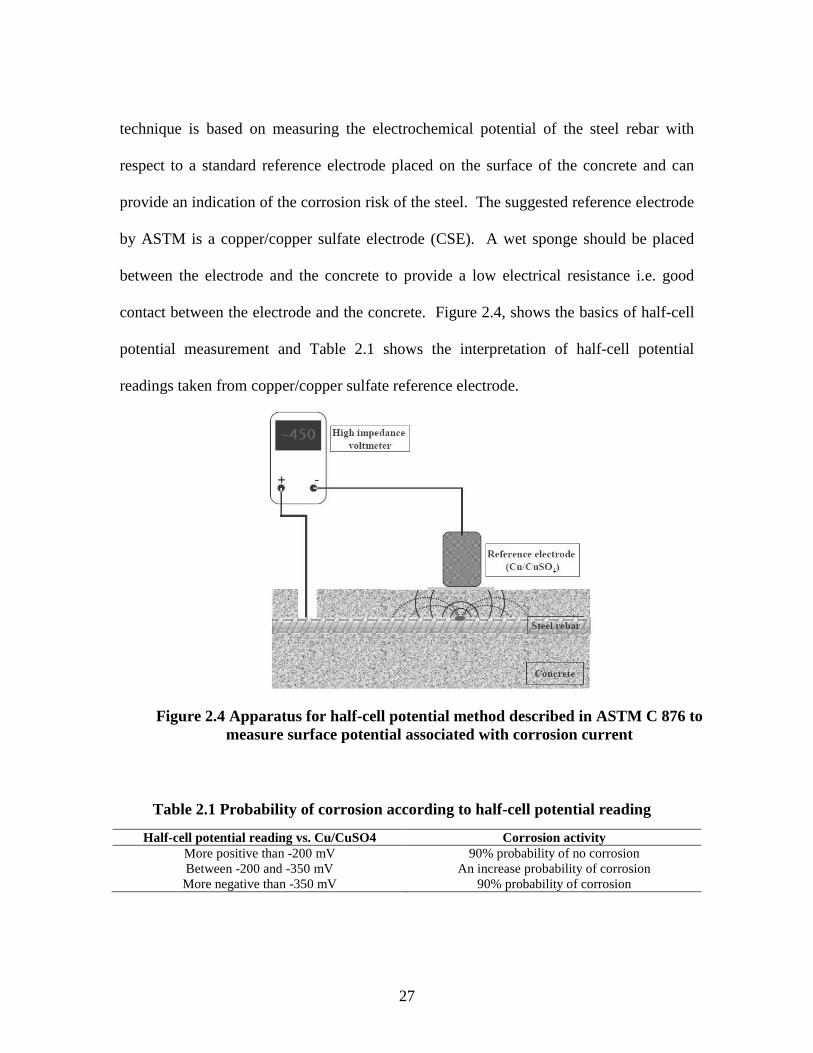
technique is based on measuring the electrochemical potential of the steel rebar with
respect to a standard reference electrode placed on the surface of the concrete and can
provide an indication of the corrosion risk of the steel. The suggested reference electrode
by ASTM is a copper/copper sulfate electrode (CSE). A wet sponge should be placed
between the electrode and the concrete to provide a low electrical resistance i.e. good
contact between the electrode and the concrete. Figure 2.4, shows the basics of half-cell
potential measurement and Table 2.1 shows the interpretation of half-cell potential
readings taken from copper/copper sulfate reference electrode.
Half-cell potential reading vs. Cu/CuSO4 Corrosion activity
More positive than -200 mV 90% probability of no corrosion Between -200 and -350 mV An increase probability of corrosion More negative than -350 mV 90% probability of corrosion
Figure 2.4 Apparatus for half-cell potential method described in ASTM C 876 to measure surface potential associated with corrosion current
Table 2.1 Probability of corrosion according to half-cell potential reading
28
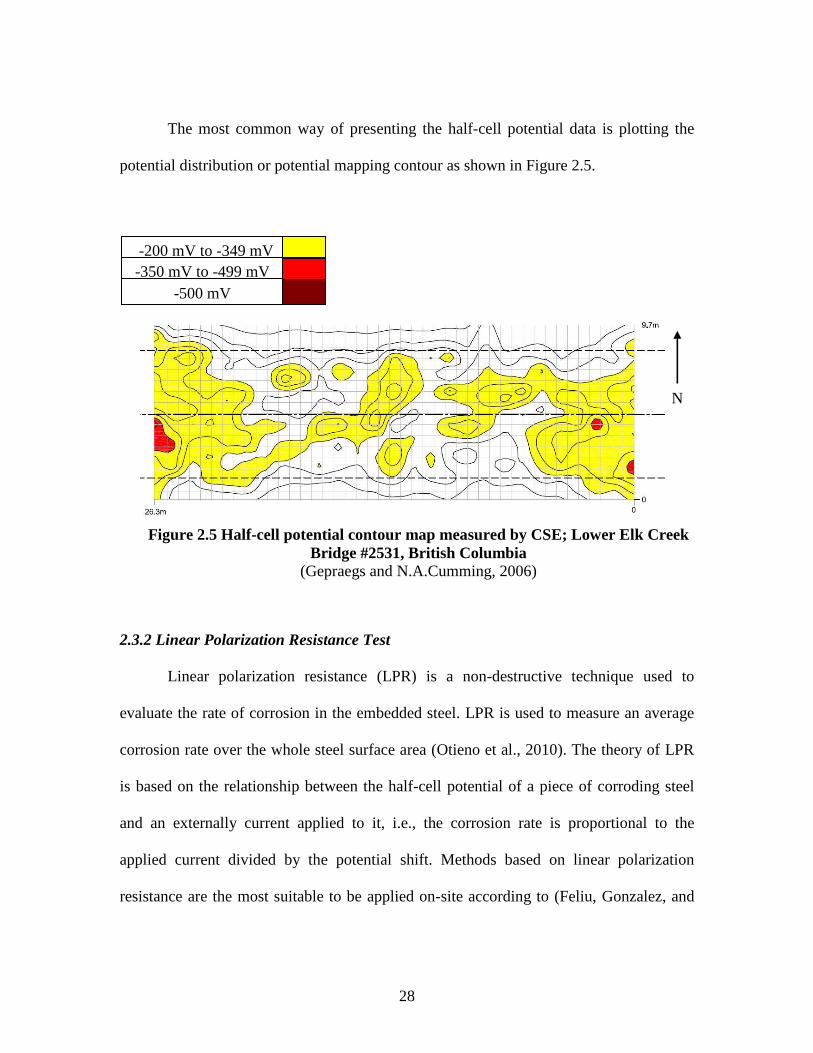
The most common way of presenting the half-cell potential data is plotting the
potential distribution or potential mapping contour as shown in Figure 2.5.
2.3.2 Linear Polarization Resistance Test
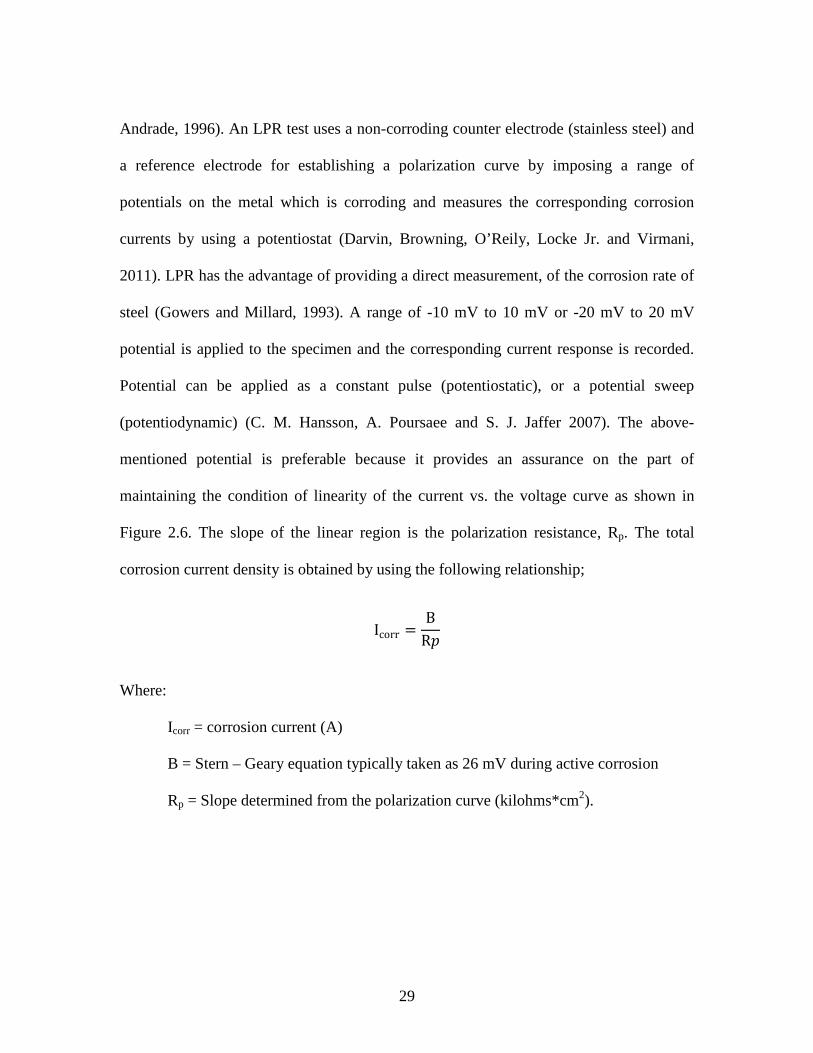
Linear polarization resistance (LPR) is a non-destructive technique used to
evaluate the rate of corrosion in the embedded steel. LPR is used to measure an average
corrosion rate over the whole steel surface area (Otieno et al., 2010). The theory of LPR
is based on the relationship between the half-cell potential of a piece of corroding steel
and an externally current applied to it, i.e., the corrosion rate is proportional to the
applied current divided by the potential shift. Methods based on linear polarization
resistance are the most suitable to be applied on-site according to (Feliu, Gonzalez, and
-200 mV to -349 mV -350 mV to -499 mV
-500 mV
N
Figure 2.5 Half-cell potential contour map measured by CSE; Lower Elk Creek Bridge #2531, British Columbia
(Gepraegs and N.A.Cumming, 2006)
29
Andrade, 1996). An LPR test uses a non-corroding counter electrode (stainless steel) and
a reference electrode for establishing a polarization curve by imposing a range of
potentials on the metal which is corroding and measures the corresponding corrosion
currents by using a potentiostat (Darvin, Browning, O’Reily, Locke Jr. and Virmani,
2011). LPR has the advantage of providing a direct measurement, of the corrosion rate of
steel (Gowers and Millard, 1993). A range of -10 mV to 10 mV or -20 mV to 20 mV
potential is applied to the specimen and the corresponding current response is recorded.
Potential can be applied as a constant pulse (potentiostatic), or a potential sweep
(potentiodynamic) (C. M. Hansson, A. Poursaee and S. J. Jaffer 2007). The above-
mentioned potential is preferable because it provides an assurance on the part of
maintaining the condition of linearity of the current vs. the voltage curve as shown in
Figure 2.6. The slope of the linear region is the polarization resistance, Rp. The total
corrosion current density is obtained by using the following relationship;
Icorr �B
R�
Where:
Icorr = corrosion current (A)
B = Stern – Geary equation typically taken as 26 mV during active corrosion
Rp = Slope determined from the polarization curve (kilohms*cm2).
30
2.4 Ultra High Performance Fiber Reinforced Concrete (UHPFRC)
Since last two decades, astonishing advancements has been made in the field of
concrete technology. Materials like densified small particles concrete (DSP), macro
defect free concrete (MDF) and reactive powdered concrete (RPC) have been marketed
as high performance concrete in various countries. One of the latest advancements in
concrete technology is ultra-high performance fiber reinforced concrete (UHPFRC). In
1990’s UHPFRC was developed by the addition of supplementary materials, elimination
of coarse aggregates, very low water/binder ratio (less than 0.25), application of super-
plasticizer, addition of fine steel fiber reinforcement, heat curing and application of
pressure before and during setting (Gao, Molyneaux, and Patnaikuni, 2008). It is a special
cement based material which behaves like a low porosity ceramic material and is densely
Figure 2.6 Linear polarization resistance curve (Amir Poursaee, 2011)
31
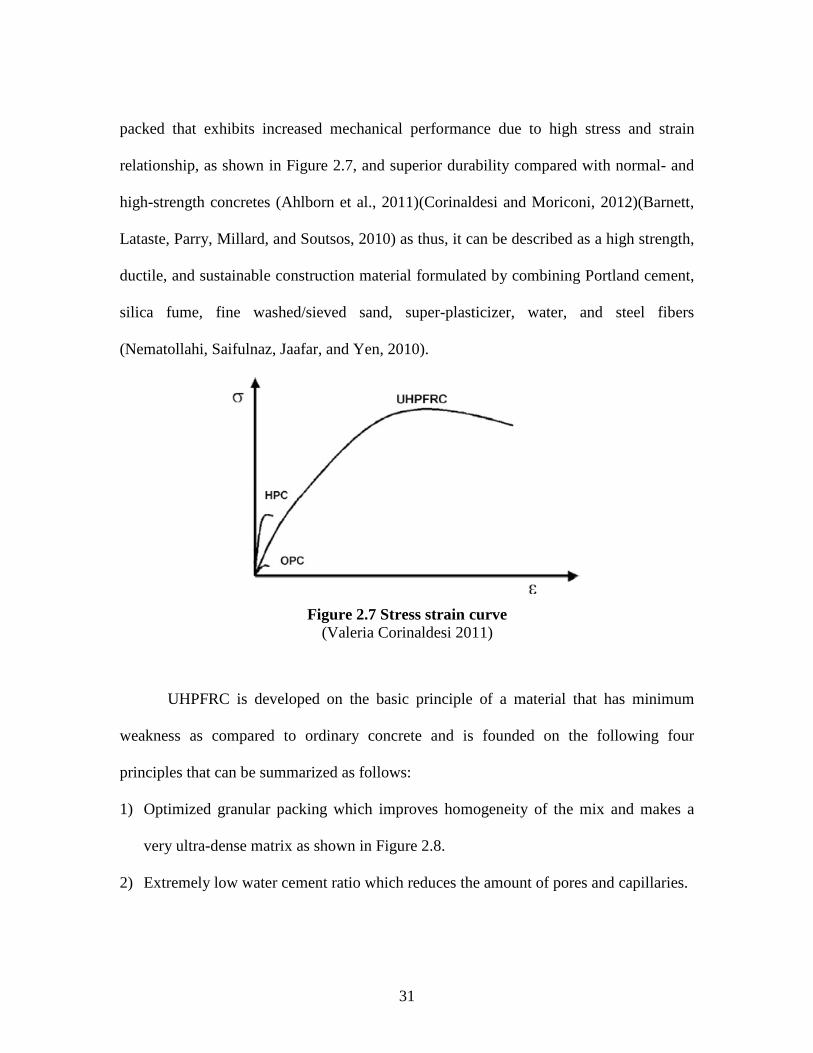
packed that exhibits increased mechanical performance due to high stress and strain
relationship, as shown in Figure 2.7, and superior durability compared with normal- and
high-strength concretes (Ahlborn et al., 2011)(Corinaldesi and Moriconi, 2012)(Barnett,
Lataste, Parry, Millard, and Soutsos, 2010) as thus, it can be described as a high strength,
ductile, and sustainable construction material formulated by combining Portland cement,
silica fume, fine washed/sieved sand, super-plasticizer, water, and steel fibers
(Nematollahi, Saifulnaz, Jaafar, and Yen, 2010).
UHPFRC is developed on the basic principle of a material that has minimum
weakness as compared to ordinary concrete and is founded on the following four
principles that can be summarized as follows:
1) Optimized granular packing which improves homogeneity of the mix and makes a
very ultra-dense matrix as shown in Figure 2.8.
2) Extremely low water cement ratio which reduces the amount of pores and capillaries.
Figure 2.7 Stress strain curve (Valeria Corinaldesi 2011)

32
3) Inclusion of very high strength micro-fibers (steel fiber) which enhances tensile
strength and ductility.
4) Steam curing which accelerates early and drying shrinkage and improves volumetric
stability and creep (Nematollahi et al., 2010).
Resulting matrix is extremely impermeable due to the sealing of pores, providing
resistance to aggressive agents which allows chloride diffusion of only 0.02 x 10⁻¹¹ sf/sec
(Perry, Moore, and Bierwagen, 2006).
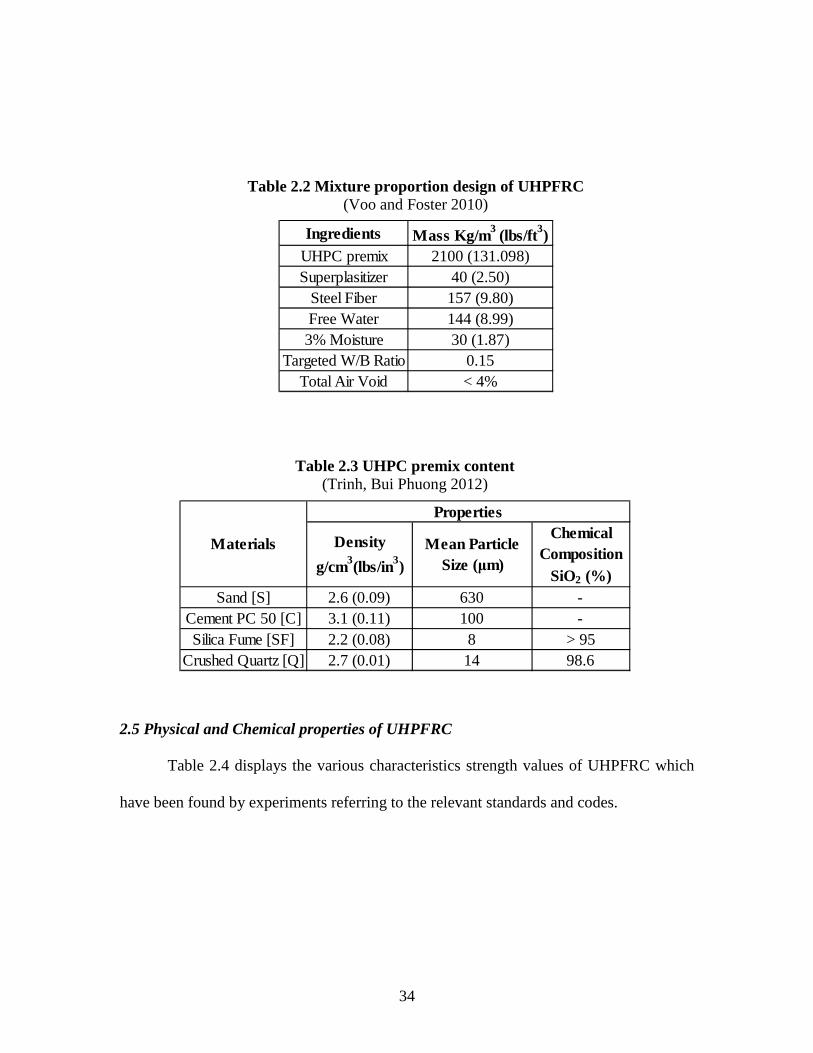
The typical mixture proportion design of UHPFRC is shown in Table 2.2 and
Table 2.3 displays the UHPC premix contents. The only type of aggregate present in it is
fine silica sand with particle sizes in the range 200–600 µm. To enhance the tensile
strength and increase ductility of the cast sections, usually short straight steel fibers are
added to the mixture (Barnett et al., 2010). The tensile strength of the steel fibers is in the
range of 850–2000 MPa (123–290 ksi). The increase in the amount of steel fibers in the
mix also increases the toughness of UHPFRC. The presence of steel fibers increases its
Figure 2.8 Dense filling image
33
peak compressive strength and enhances its post peak behavior (Hassan, Jones, and
Mahmud, 2012) (Skazlic and Bjegovic, 2009) (Kazemi and Lubell, 2011). A few
physical properties of the UHPFRC have already been investigated such as the
compressive strength, which is consistently attained above 270 MPa (30 ksi) regardless
of thermal treatment, flexural strength of 25 to 30 MPa (3.6 to 4.4 ksi), Poisson’s ratio of
0.21, very high resistance to freezing and thawing cycles and negligible permeation to
chloride ions (Ahlborn et al., 2011)(Isaacs, Magallanes, Rebentrost, and Wight, 2009).
UHPFRC is nearly impermeable hence, corrosion of embedded steel, from chemical
ingress due to cracking and deterioration from freeze-thaw can be kept minimum and the
stress-strain values are far more linear than any other type of material in its class, which
allows it to gain an upper hand over normal-strength concrete (NSC) and high-
performance concrete (HPC)(Ahlborn et al., 2011). On a recent account basis it has been
stated that this material exhibits enhanced resilience against shock and impact loads,
which has been established through laboratory and field measurements. Recent ballistic
tests showed that 100 mm (4 in.) thick UHPFRC panels behave similar to a 190 mm (7.48
in.) of concrete block masonry (Isaacs et al., 2009). Since its first appearance in the
market, this material has been used in numerous structural applications such as bridges,
pavements, and architectural structures (Hassan et al., 2012). UHPFRC has great
potential to be used in the bridge market in the United States and its greatest significance
lies in the improved durability of concrete structures that leads to lower bridge repair
costs and less downtime to repair.
34
2.5 Physical and Chemical properties of UHPFRC
Table 2.4 displays the various characteristics strength values of UHPFRC which
have been found by experiments referring to the relevant standards and codes.
Table 2.2 Mixture proportion design of UHPFRC (Voo and Foster 2010)
Ingredients Mass Kg/m3 (lbs/ft3)UHPC premix 2100 (131.098)Superplasitizer 40 (2.50)
Steel Fiber 157 (9.80)Free Water 144 (8.99)3% Moisture 30 (1.87)
Targeted W/B Ratio 0.15Total Air Void < 4%
Table 2.3 UHPC premix content (Trinh, Bui Phuong 2012)
Density
g/cm3(lbs/in3)Mean Particle
Size (µm)
Chemical Composition
SiO2 (%)Sand [S] 2.6 (0.09) 630 -
Cement PC 50 [C] 3.1 (0.11) 100 -Silica Fume [SF] 2.2 (0.08) 8 > 95
Crushed Quartz [Q] 2.7 (0.01) 14 98.6
Properties
Materials
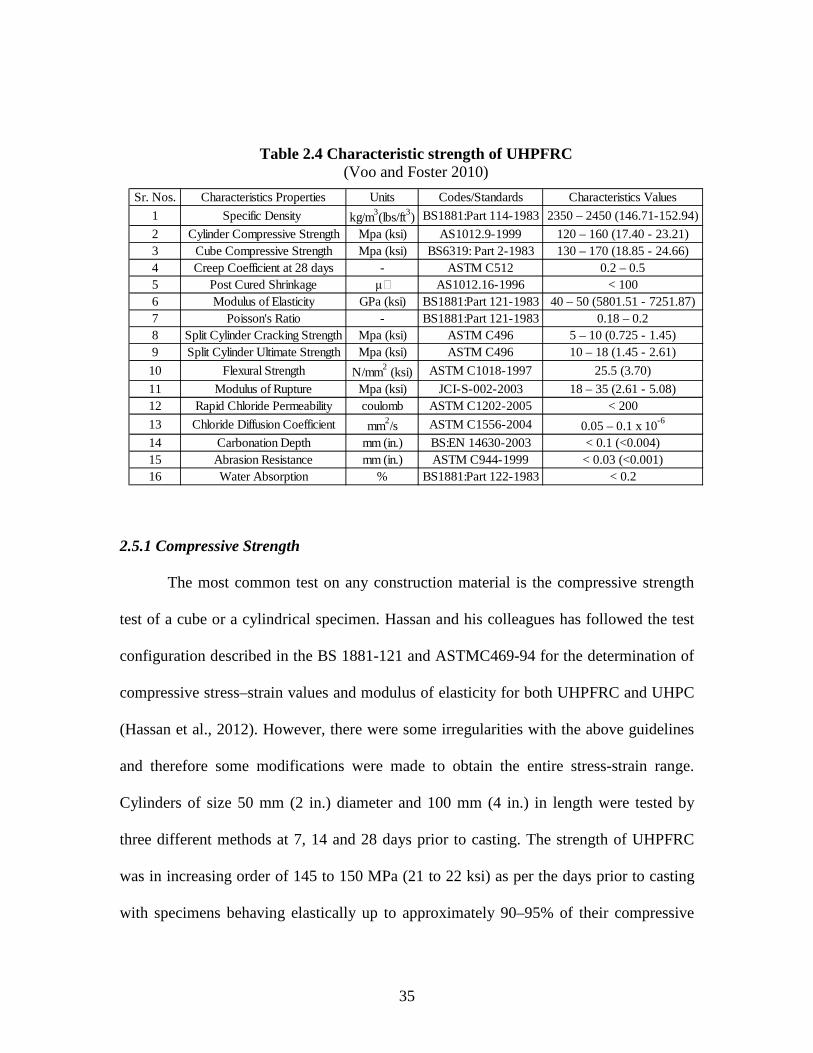
35
2.5.1 Compressive Strength
The most common test on any construction material is the compressive strength
test of a cube or a cylindrical specimen. Hassan and his colleagues has followed the test
configuration described in the BS 1881-121 and ASTMC469-94 for the determination of
compressive stress–strain values and modulus of elasticity for both UHPFRC and UHPC
(Hassan et al., 2012). However, there were some irregularities with the above guidelines
and therefore some modifications were made to obtain the entire stress-strain range.
Cylinders of size 50 mm (2 in.) diameter and 100 mm (4 in.) in length were tested by
three different methods at 7, 14 and 28 days prior to casting. The strength of UHPFRC
was in increasing order of 145 to 150 MPa (21 to 22 ksi) as per the days prior to casting
with specimens behaving elastically up to approximately 90–95% of their compressive
Table 2.4 Characteristic strength of UHPFRC (Voo and Foster 2010)
Sr. Nos. Characteristics Properties Units Codes/Standards Characteristics Values
1 Specific Density kg/m3(lbs/ft3) BS1881:Part 114-1983 2350 – 2450 (146.71-152.94)
2 Cylinder Compressive Strength Mpa (ksi) AS1012.9-1999 120 – 160 (17.40 - 23.21)3 Cube Compressive Strength Mpa (ksi) BS6319: Part 2-1983 130 – 170 (18.85 - 24.66)4 Creep Coefficient at 28 days - ASTM C512 0.2 – 0.55 Post Cured Shrinkage µƐ AS1012.16-1996 < 1006 Modulus of Elasticity GPa (ksi) BS1881:Part 121-198340 – 50 (5801.51 - 7251.87)7 Poisson's Ratio - BS1881:Part 121-1983 0.18 – 0.28 Split Cylinder Cracking Strength Mpa (ksi) ASTM C496 5 – 10 (0.725 - 1.45)9 Split Cylinder Ultimate Strength Mpa (ksi) ASTM C496 10 – 18 (1.45 - 2.61)
10 Flexural Strength N/mm2 (ksi) ASTM C1018-1997 25.5 (3.70)
11 Modulus of Rupture Mpa (ksi) JCI-S-002-2003 18 – 35 (2.61 - 5.08)12 Rapid Chloride Permeability coulomb ASTM C1202-2005 < 200
13 Chloride Diffusion Coefficient mm2/s ASTM C1556-2004 0.05 – 0.1 x 10⁻⁶
14 Carbonation Depth mm (in.) BS:EN 14630-2003 < 0.1 (<0.004)15 Abrasion Resistance mm (in.) ASTM C944-1999 < 0.03 (<0.001)16 Water Absorption % BS1881:Part 122-1983 < 0.2
36
strength, followed by strain hardening behavior (compression hardening) up to peak
strength. While the strength of UHPC was in the range of 121 to 124 MPa (17.5 to 18 ksi)
with the specimens behaving elastically until peak strength and then follow a sudden
strain softening and lost their total strength at first cracking causing it to fail in an abrupt
explosive manner. Trinh and Chanh prepared a cube specimen of size 100 mm (4 in.) for
compression testing (Trinh and Van Chanh, 2012). The specimens were de-molded after
24 hours from casting and exposed to steam curing at 90°C for 2 days. After the end of
curing period all the samples were tested for its compressive strength which was well
above 140 MPa (20 ksi) for all samples and the maximum being 161 MPa (23.5 ksi).
Corinaldesi and Moriconi prepared three prismatic specimens of size 40 x 40 x 160 mm
(1.6 x 1.6 x 6.4 in.) to perform the compressive test with a variable of water to cement
ratio and water to binder ratio (Corinaldesi and Moriconi, 2012). In terms of optimum
workability and mechanical performance they found that the most recent type of acrylic
based super-plasticizer (labeled ‘spB’) and a water to cement ratio of 0.24 were the best
combination yielding compressive value of 156 MPa (22.6 ksi) along with flexural
strength of 38 MPa (5.5 ksi). Kazemi and Lubell had prepared specimens with steel fibers
(4% of volume) have a greater compressive strength of 18% and 6.7% at the age of 28
and 42 days as compared with specimens with no fibers. As the size of the specimens was
doubled it was clearly evident from the data that the compressive strength has decreased
by 13%. Also the cube specimens had higher compressive strength as compared to the
cylindrical specimens of the respective size. For both compressive and tensile strengths,
the mix with fibers 4% volume of steel fibers showed higher size effects than the plain
37
mixture with no fibers. The mechanical properties of UHPFRC were influenced by the
specimen size. Decreases of 13%, 15% and 15% were noted for the compressive,
flexural, and tension strengths respectively as the specimen sizes doubled (Kazemi and
Lubell, 2011).
2.5.2 Tensile and Flexural Strength
UHPFRC can attain a strain hardening value of 0.15% with 2% of steel fiber
(Volume). Hassan and his colleagues performed a direct tensile test on a two un-notched
dog-bone specimens of overall length of 200 mm (8 in.) for UHPFRC and UHPC
(Hassan et al., 2012). The obtained values were in the increasing order of 8 to 10 MPa
(1.2 to 1.5 ksi) for UHPFRC while for UHPC they were in the range of 4 to 6 MPa (0.6 to
0.9 ksi). Trinh and Van Chanh performed a flexural strength test on a beam specimen of
size 100 x 100 x 400 mm (4 x 4 x 16 in.) according to ASTM C1018(Trinh and Van
Chanh, 2012). All the samples yielded the flexural strength ranging between 14.6 to 19.5
MPa (2.1 to 2.8 ksi). Beams with and without steel fibers were tested for four point
bending test which explicitly indicated that the use of steel fibers improves the flexural
strength with an average increase of 31.2%. A 3-point bending test was also performed
100 mm x 100 mm x 400 mm (4 x 4 x 16 in.) specimens with fiber content between 1%
to 5% in an increment of 1% in each sample (Su-Tae Kang, Lee, Yon-Dong Park, and
Jin-Keun Kim, 2010). After failure, it is shown that one large crack exists, accompanying
fibers thus due to the bridging mechanism of fibers, UHPFRC can provide superior
performance especially under tension as compared to UHPC without fibers. It was
observed that the flexural tensile strength of UHPFRC linearly increases as the fiber
38
volume ratio increases from 0% to 5%. According to Nematollahi and colleagues strain
hardening can also be referred as tensile behavior of UHPFRC where the composite
material continues to resist higher residual tensile strength after the concrete matrix has
cracked. The post cracking strength of it is greater than the matrix cracking strength due
to the use of very high strength micro steel fibers (Nematollahi et al., 2010). For the
flexural test Kazemi and Lubell had prepared UHPFRC specimens with and without
fibers which were tested according to ASTM C1609 (Kazemi and Lubell, 2011). Load
versus deflection curves were plotted for all the specimens. The curves thus obtained
showed clearly that the plain UHPFRC exhibited a very brittle behavior, whereas the mix
with 4% of steel fiber showed a ductile behavior. For the specimens with steel fibers the
flexural strength was increasing even after the formation of multiple micro-cracks
whereas the plain mix showed a sudden failure after formation of first crack. The sole
reason behind this extraordinary ability of UHPFRC is its microstructure. Microstructure
of UHPFRC was observed using Scanning Electron Microscope (SEM) at 28 days. It
revealed that the microstructure is very dense and has lower density of pores than
ordinary concrete without silica fume. Portlandite (Ca (OH)2) crystals are reduced
significantly due to the high content of silica fume in the mix which consumes the
crystals during the process of hydration. The CH crystals are then converted to C-S-H gel
(another chemical compound formed during hydration which is responsible for increasing
the strength of concrete) and the transition zone was of very small thickness which
indicates a good bond between the matrix and the aggregate surface as well as between
the matrix and steel fibers.
39
2.5.3 Toughness test
Flexural toughness testing is the most common method of testing toughness of
UHPFRC. The ASTM C 1018 standard has been used for toughness tests of fiber
reinforced concrete according to which test results are made on the basis of
dimensionless parameters of toughness indexes and residual strength factor.
Nevertheless, there were many problems associated with ASTM C1018 and hence in the
year 2005 the ASTM C 1018 standard was replaced with a new standard, i.e. ASTM C
1609 which yielded a more reliable value (Skazlic and Bjegovic, 2009). Marijan Skazlic
and Dubravka Bjegovic performed ASTM C 1609 procedure for testing toughness of
UHPFRC containing a large amount of fiber (more than 2% by volume) and exhibiting
deflection hardening behavior. Flexural toughness and compressive strength tests were
carried out on seven different UHPFRC mixtures having variable factors of steel fiber
volume, its type, length and maximum aggregate grain size. Toughness was tested on 100
x 100 x 400 mm (4 x 4 x 16 in.) beams, while compressive strength was tested on 40 mm
(1.6 in.) cubes. All the mixtures have compressive strength higher than 180 MPa (26.2
ksi) but the mean values of compressive strength exhibited by UHPFRC with 3% and 5%
in volume of steel fibers were higher by 16% and by 17% respectively and by 16% and
by 22% respectively compared with UHPFRC with 2% in volume of fibers. Load–
deflection diagrams obtained from flexural toughness tests; deflection hardening after
first-peak strength was noticed. Such deflection hardening was accompanied by multiple
cracks and absorption of a large amount of energy (Skazlic and Bjegovic, 2009).
40
2.5.4 Creep and shrinkage
The creep behavior test was conducted by Lei Voo and Foster on UHPFRC over a
period of 365 days, as per AS1012.16 (1996) on four pieces of 100 mm (4 in.) diameter
by 200 mm (8 in.) high cylinders and were pre-loaded with at a compressive stress of 64
MPa (9.3 ksi). The test was conducted in an environmentally controlled room where the
ambient temperature was maintained at 25°C and relative humidity at 50%. The creep
coefficient of UHPFRC at 28 days was found to be 0.2 (Lei Voo and Foster, 2010). Trinh
and Van Chanh measured shrinkage with and without steel fibers by casting a beam of
size 100 x 100 x 400 mm (4 x 4 x 16 in.). The shrinkage was measured by using two
LVDT attach to a metal rod 30 mm (1.2 in.) above the concrete surface on either
supports. The sample with higher silica fume content indicates higher shrinkage ability
and samples without steel fibers also had higher shrinkage ability (Trinh and Van Chanh,
2012).
2.5.5 Dynamic strength test
Many researches such as Suaris and Shah (1984), Banthia et. Al (1996),
Gopalaratnam et al. 1986), Dancygier et al. (2007), Luoet al. (2000), Maalej et al. (2005)
have concluded that UHPFRC exhibits better impact resistance than plain concrete after
reviewing the explosive tests, projectile impact tests, drop weight impact tests and
Charpy impact test. It exhibits less damaged area than plain concrete, it performs better
than traditional reinforced concrete in high velocity projectile experiments, it provides
increased shatter resistance with reduced scabbing, spalling, and fragmentation while
exhibiting better energy absorption through distributed micro-cracking. The dynamic
41
behavior of brittle cementitious materials like UHPFRC is difficult to quantify since there
aren’t any standard approach. Gao X., Molyneaux T.C.K. and Patnaikuni, prepared four
types of specimens for dynamic impact loading of UHPFRC; cylindrical 75 mm (3 in.)
diameter x 150 mm (6 in.) length, cube 50 mm (2 in.), prismatic specimens 25 x 25 x 50
mm (1 x 1 x 2 in.) and small beams 280 x 70 x 70 mm (11 x 2.75 x 2.75 in.) for a three
point flexural test. A customized drop hammer apparatus was developed for imparting
impact loading on the test specimens. The results indicated that the flexural tensile
strength Dynamic Increase Factor (DIF) of plain specimens is greater than UHPFRC
specimens and also the compressive strength exhibits higher strain rate sensitivity in plain
concrete compared with UHPFRC. The flexural tensile strength of UHPFRC specimens
increases with the increase of strain rate from quasistatic to 4/sec as compared to 2/sec
for plain concrete (Gao et al., 2008).
2.5.6 Durability
UHPFRC has a very dense matrix with very small and discontinuous pores which
leads to extensively improved durability properties compared to Normal Strength
Concrete (NSC) and High Performance Concrete (HPC). Furthermore steam-based curing
increases the degree of hydration which results in enhancing of microstructure of the
concrete body and reduces the permeability thus increasing the durability properties of
UHPFRC. Durability is an indicator of concrete condition (health) which can be
measured explicitly by performing the following test on the concrete samples.

42
2.5.6.1 Rapid chloride ion permeability
Trinh and Van Chanh carried out ASTM C1202 test for the Electrical indication
of concrete’s ability to resist chloride ion penetration frequently referred to as the rapid
chloride ion penetrability test on UHPFRC samples having 50 mm (2 in.) thickness. The
total charge passing through the samples were less than 100 coulombs which falls under
the category of negligible limit of chloride ion permeability (Trinh and Van Chanh,
2012). Lei Voo and Foster performed chloride diffusion coefficient test on UHPFRC
samples as per ASTM-C1556 (2004). The specimens were immersed in 4% chloride
reagent for a period of 120 days before performing the test. The specimen without steel
fiber has the highest value of Dc = 0.136 x 10⁻⁶ mm2/s and samples with 1% and 2% of
steel fiber have average Dc values of 0.073 x 10⁻⁶ and 0.067 x 10⁻⁶ mm2/s respectively.
The values obtained speak for themselves as the sample without steel fibers has the
highest value of chloride diffusion content. This value decreases as the volume of steel
fibers in the mix increases (Lei Voo and Foster, 2010).
2.5.6.2 Porosity
The pores found in concrete mass can be distinguished into two types; gel pores
and capillary pores. Gel pores occupy 28% of the total C-S-H volume and they are
smaller than the molecule of water and hence it will check the flow of water. In addition
to the above mentioned pores there are air voids, formed due to improper consolidation
during casting or due to entrapped air. As the water to cement ratio increases the capillary
porosity also increases resulting in a more permeable concrete. The interfacial transition
zone is considered to be the most weakest and porous part of concrete. The following five
43
transport mechanisms can be studied to understand the ingress of chloride ions in
concrete; hydrostatic advection, capillary suction, diffusion, thermal and electrical
migration. In the presence of chloride ions if hydrostatic pressure exists on the concrete
surface that can result in chloride penetration due to pressure gradient. Capillary suction
is caused in a structure which is subjected to wet and dry cycles. If an under saturated
concrete is exposed to chloride ions it will be drawn into the pore structure due to
capillary suction. A process allowing aggressive ions to penetrate into concrete under the
action of a concentration gradient is called diffusion. The rate of diffusion depends on the
diffusion coefficient and the physical characteristics of the capillary pore structure
(Ustabas, 2012). The chloride ions or molecules can travel faster in hot regions and
portions of concrete which can be termed as thermal migration while the ions in the
solution will attract towards the opposite electrode (anode) if the concrete specimen is
subjected to electrical field (Shi et al., 2006).
2.5.6.3 Permeability test
There are three suggested mechanisms that explain the water repellent capability
of UHPFRC such as self-sealing, autogenously healing and hydration of residual
chloride. It was observed by Jean-Philippe Charron, Emmanuel Denarie and Eugen
Bruhwiler in that the permeability and absorption increase steadily until a residual tensile
deformation of 0.13% is reached in the material which results in seeping of water more
distinctly. The above results were supported by the permeability test results indicating
that the fluid flow in the UHPFRC rises with the increasing level of damage of the
material. Since permeability is proportional to the cube of the crack width hence it takes
44
only one wide crack to make the material susceptible to transport the water to several
micro-cracks (Charron, Denarie, and Bruhwiler, 2008). The liquid permeability of the
UHPFRC was studied by J.P. Charron, E. Denarie and E. Bruhwiler with permeability
cells constructed on the basis of Ludirdja et al. and Wang et al. work on a core specimen
of UHPFRC without any steam treatment. Generally the liquid used for this kind of test is
water but since it has been proven that UHPFRC has a large amount of un-hydrated
cement which remains in the state of hydrating for many months after casting. Therefore
water may not generate accurate data hence; glycol is used in this experiment instead of
water. The UHPFRC specimens used for this test were obtained after performing the
uniaxial tensile test where the inelastic deformation after unloading (ε) is around 0.13%.
For the first 14 days, the curve is non-linear because the glycol is absorbed by the
partially empty pores within the cracked specimen. After few days the permeability
coefficients become nearly constant; meaning that a steady flow of glycol seeps through
the specimens. The test results were clearly demonstrating that permeability increases
with the level of deformation induced to the material. No significant influence of
cracking can be observed on the equivalent permeability coefficient until deformation of
unloading reaches to 0.13% which corresponds to a cumulated crack opening equal to
0.13 mm (0.005 in.) in UHPFRC sample while a crack opening of 0.05 mm (0.002 in.) is
required to reach the same state of permeability in case of normal concrete. Since
permeability is inversely proportional to surface roughness the value so obtained
indicates that the path followed by water in the cracks is very complex and consequently
long may be due to the presence of multi-branching cracks in the UHPFRC (Charron et
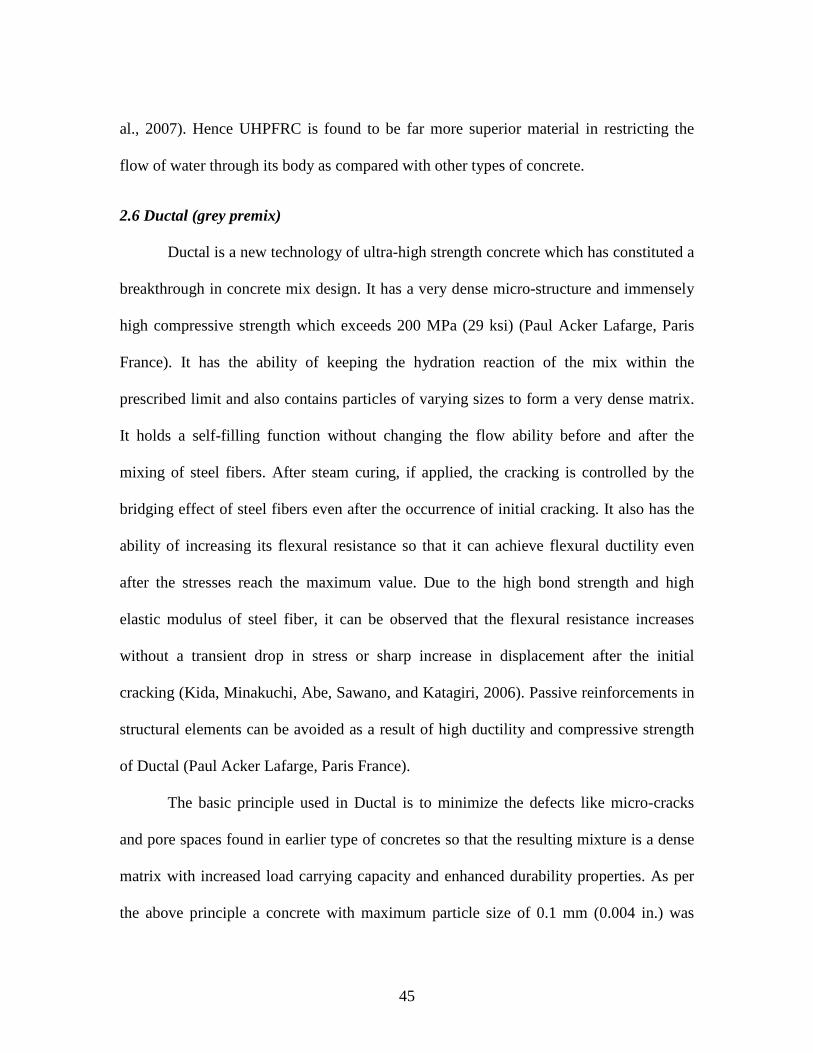
45
al., 2007). Hence UHPFRC is found to be far more superior material in restricting the
flow of water through its body as compared with other types of concrete.
2.6 Ductal (grey premix)
Ductal is a new technology of ultra-high strength concrete which has constituted a
breakthrough in concrete mix design. It has a very dense micro-structure and immensely
high compressive strength which exceeds 200 MPa (29 ksi) (Paul Acker Lafarge, Paris
France). It has the ability of keeping the hydration reaction of the mix within the
prescribed limit and also contains particles of varying sizes to form a very dense matrix.
It holds a self-filling function without changing the flow ability before and after the
mixing of steel fibers. After steam curing, if applied, the cracking is controlled by the
bridging effect of steel fibers even after the occurrence of initial cracking. It also has the
ability of increasing its flexural resistance so that it can achieve flexural ductility even
after the stresses reach the maximum value. Due to the high bond strength and high
elastic modulus of steel fiber, it can be observed that the flexural resistance increases
without a transient drop in stress or sharp increase in displacement after the initial
cracking (Kida, Minakuchi, Abe, Sawano, and Katagiri, 2006). Passive reinforcements in
structural elements can be avoided as a result of high ductility and compressive strength
of Ductal (Paul Acker Lafarge, Paris France).
The basic principle used in Ductal is to minimize the defects like micro-cracks
and pore spaces found in earlier type of concretes so that the resulting mixture is a dense
matrix with increased load carrying capacity and enhanced durability properties. As per
the above principle a concrete with maximum particle size of 0.1 mm (0.004 in.) was
46
proportioned to make a dense mixture with minimal voids and thus capable of yielding
the following properties as shown in Table 2.5. Ductal research program was formulated
on the basis of following principles:
1) Making the concrete mass more homogenous by elimination of coarse aggregate.
2) Having a proper gradation of particle size in the mix to increase the density of the concrete.
3) Application of post steam treatment to enhance its micro-structure.
4) Incorporate steel or PVA fibers in the matrix to add ductility to the concrete.
5) Maintaining mixing and casting procedure with a close proximity to existing practice.
By incorporating the first three principles a concrete matrix was produced with a
very high compressive strength but not very ductile. Hence the inclusion of fibers
increases its ductility and tensile strength. After having done plenty of experiments by the
Lafarge research department a final dosage and size of steel fibers was chosen; a content
of 2% by volume and 13 mm (0.5 in.) in length and 0.2 mm (0.008 in.) in diameter of
TT = Thermal treatment
Table 2.5 Characteristic properties of Ductal (http://www.Ductal-lafarge.com/wps/portal/Ductal/6_5-
Mechanical_performances)
TT No TT
Density Kg/m3(lbs/ft3)Compressive strength Mpa (ksi) 150-200 (21.76-29) 150-180 (21.76-26.11)Elastic limit in tension Mpa (ksi) 9-10 (1.31-1.45) 7-9 (1.01-1.31)
Flexural strength Mpa (ksi) 20-40 (2.90-5.80) 15-30 (2.18-4.35)Young's Modulus Mpa (ksi)
Poisson's coefficient 0.2 0Shrinkage mm/m
Creep 0.2-0.4 0.8-1Thermal dilation (μm/m/°C) 12
Ductal with Steel Fiber Ductal with PVA FiberNo TT
2500 (156.07) 2350 (146.71)
45-55 (6.53-7.98)
100-140 (13-20.31)
35-45 (5.08-6.53)0.2
0.8-11-1.2
0.6-0.8
5-7 (0.725-1.01)10-20 (1.45-2.90)
Characterictics Properties
12
47
steel fiber is the optimum combination to design Ductal for structural applications (Paul
Acker Lafarge, Paris France).
2.7 Properties of Ductal with polyvinyl alcohol (PVA) fibers
The compressive strength and modulus of rupture of Ductal reinforced with poly-
vinyl alcohol fibers was calculated from a total of 67 batches; 152.3±6.3MPa (22.1±0.9
ksi) (mean ± standard deviation) and 17.9±3.4MPa (2.6±0.49 ksi), respectively (Adeeb et
al., 2005). Shaheen and Shrive prepared three cylinders having a diameter of 2 inches (50
mm) and a height of 4 inches (100 mm) to test Ductal which was reinforced with 12 mm
(0.5 in.) polyvinyl alcohol (PVA) fibers for determining its compressive strength. The
average compressive strength of the three cylinders was calculated to be 136 MPa (20
ksi) and the Young’s modulus was 53.3 GPa (7730 ksi). They also performed cyclic
fatigue test on three un-notched beams having dimensions as 40 mm x 40 mm x 160 mm
(1.6 x 1.6 x 6.3 in.). And it was observed that no failure had occurred by the complete
separation of cracked surfaces for any of the specimens tested in fatigue no specimen
broke into two pieces. Higher fatigue life was achieved due to the presence of PVA fibers
which were bridging across the cracks. The fibers in the mix were experiencing different
behavior: some of them were stretched below their elastic limit, some got partially pulled
out, and some underwent plastic deformation while some maintained their geometry with
no signs of loading. Specimens which were subjected to low and medium fatigue cycles
caused their fibers to undergo splitting action but none of the specimens actually broke
even after applying six million cycles hence, it can be concluded that these fibers can
provide sufficient tensile strength. During the fatigue cycle the number of cycles was
48
recorded along with the associated crack length formed at that point of time. The crack
length was increasing rapidly in the beginning but slowed down as the test progressed
mainly because more and more fibers were brought into bridging action. The concrete
tested showed no signs of corrosion due to the use of organic fibers but in the case of
steel fibers the problem of corrosion can be encountered if a crack is exposed to
environment otherwise the chances of corrosion are slim because Ductal mix provides
very dense and low porosity matrix (Shaheen and Shrive, 2007).
2.8 Properties of Ductal with steel fibers
Years of research and experiments were conducted and recorded to come up with
fixed characteristics values which can be applied by the designers and engineers in the
field of designing and construction of realistic structures.
2.8.1 Compressive strength test
Theresa (Tess) M. Ahlborn, Devin K. Harris, Donald L. Misson, and Erron J.
Peuse performed the compression test following the procedure of ASTM C39 as the
baseline for the compression testing of Ductal (BS 1000) specimen. Specimens of size 3
in. x 6 in. (76 x 152 mm) and a compression machine having a capacity of 250 kips (1110
kN) were used and the load was applied at a stress rate of 150 psi/sec. The specimens
were separated out on the basis of curing regimes and age. In order to find the most
effective time for curing of UHPFRC and the best method of curing four different types
of curing regimes were considered; air cured, TT (48-h thermal steam treatment), DTT
(delayed thermal steam treatment: 10-day delay before curing is applied) and DDTT

49
(double-delayed thermal steam treatment: 24-day delay before curing is applied).
Cylinders with fibers and with no fibers were used so that a comparative comparison can
be concluded. The specimen with fibers experienced shear failure as characterized in C39
with fiber pull out and fiber breakage while specimens with no fibers had failed and
broken into small pieces with an explosive noise in the test. The test data clearly
indicated that the compressive stress was independent of curing regimes, age and addition
of fibers. The mean stress of all the specimens was found to be 30.1 ksi (208 MPa).
Although the air-cured specimens gained strength over the 28-day duration, there was no
difference observed in the analysis of compressive stress after thermal treatment was
applied. This trait allows a precaster to cast several elements over a period of time and
then thermally treat them simultaneously, providing more flexibility in the casting and
curing sequence (Ahlborn, Harris, Misson, and Peuse, 2011). Also Tetsukazu Kida and
his collogues carried out the compression test on a specimen having a diameter of 100
mm (4 in.) and length of 200 mm (8 in.). The compressive strength recorded by him was
216.3 MPa (31.4 ksi) (Kida et al., 2006). Compressive strength and bending behavior of
Ductal have been measured and plotted on a graph as shown in Figure 3.1. It clearly
showed that it has an ultimate bending strength which is over twice its first stress cracks
and more than ten times the ultimate stress of conventional concrete. Hence this provides
the designer’s to design structures without any secondary passive and shear
reinforcements (Paul Acker Lafarge, Paris France). Ductal performances exceptionally
well in compression by displaying the fact that its compressive strength is 4 to 8 times
higher than conventional concrete as shown in Figure 2.9. It has a linear elastic
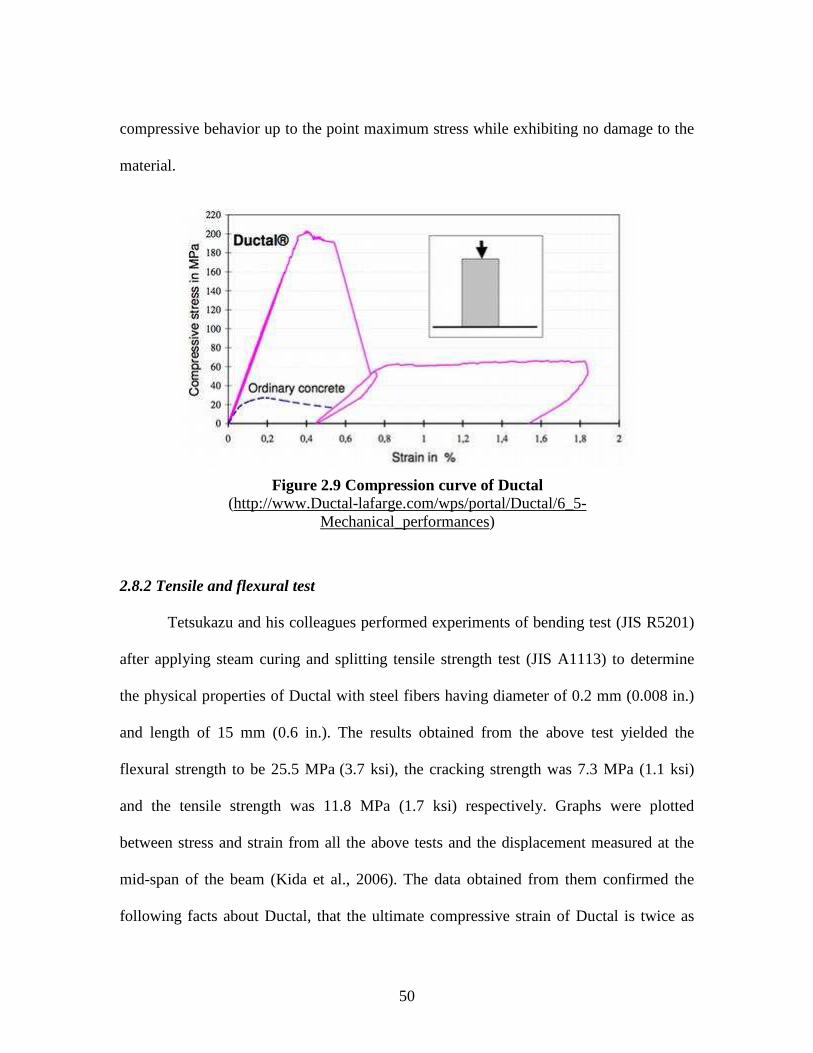
50
compressive behavior up to the point maximum stress while exhibiting no damage to the
material.
2.8.2 Tensile and flexural test
Tetsukazu and his colleagues performed experiments of bending test (JIS R5201)
after applying steam curing and splitting tensile strength test (JIS A1113) to determine
the physical properties of Ductal with steel fibers having diameter of 0.2 mm (0.008 in.)
and length of 15 mm (0.6 in.). The results obtained from the above test yielded the
flexural strength to be 25.5 MPa (3.7 ksi), the cracking strength was 7.3 MPa (1.1 ksi)
and the tensile strength was 11.8 MPa (1.7 ksi) respectively. Graphs were plotted
between stress and strain from all the above tests and the displacement measured at the
mid-span of the beam (Kida et al., 2006). The data obtained from them confirmed the
following facts about Ductal, that the ultimate compressive strain of Ductal is twice as
Figure 2.9 Compression curve of Ductal (http://www.Ductal-lafarge.com/wps/portal/Ductal/6_5-
Mechanical_performances)

51
large of ordinary concrete thus indicating that it is quite deformable, the volumetric strain
was linear up till ultimate state thus indicating that Ductal has no critical points (cracking
along the boundary of coarse aggregate and mortar paste) in the mix. The flexural stress
of Ductal increases even after initial cracking, this tendency is shown by metals after
yielding thus this is because of the bridging effect of steel fibers which are capable of
controlling further cracking and retaining strength. The purpose of fibers in the Ductal
mix is to provide the material a ductile behavior during bending as shown in Figure 2.10.
In a case of flexure when the material is loaded beyond the elastic limit, there will be
micro cracks occurring in the material which are closed tightly by the fibers in the mix
providing a ductile performance rather than a sudden or brittle failure.
2.8.3 Dynamic testing
For performing a dynamic compression test, a device called as split Hopkinson
pressure bar (SPHB) often referred to as Kolsky bar was used. It not only allows the
Figure 2.10 Displacement curve of Ductal (http://www.Ductal-lafarge.com/wps/portal/Ductal/6_5-
Mechanical_performances)
52
loading of specimens at different strain rates but also has the capacity of measuring the
strain and stress of the specimen at various strain rates. It is already a known fact that
UHPFRC exhibits increasing strength with increasing loading rates. But it has been found
that Ductal exhibits higher strengths than UHPFRC data at the same strain rates, in fact
much higher strain rates were obtained in this study. Dynamic recovery tests indicated
that Ductal samples can retain their load carrying capacity when partially damaged by an
initial loading pulse. All the specimens obtained from the test had developed a diagonal
shear plane on their surface which was bridged because of the presence of steel fibers.
The same sample had furthered developed shear planes and was fragmented into small
pieces after the application of second loading. The stress-strain curve generated from the
above tests clearly indicates that Ductal retains significant levels of residual strength and
stiffness when loaded beyond its peak strength (Isaacs, Magallanes, Rebentrost, and
Wight, 2009).
The same test equipment as in the above case was used for the tension test on
unconfined Ductal specimens. Similar to normal strength concrete the strength of Ductal
decreases rapidly after reaching its peak strength but residual tensile strength was
observed. Cracks were localized and assumed to be appearing across the voids or internal
defects. Crack openings were prevented by the placement of steel reinforcing fibers
perpendicular to the crack. The cracks had occurred in both the normal and parallel
direction of the applied tension loading. “In tension, the material exhibits a post peak
softening branch commonly observed in normal strength concrete, but retains over one
third of its peak strength in residual tension strength” (Isaacs et al., 2009).

53
2.8.4 Static and dynamic load test
Static and dynamic (running wheel) load test were carried out on beams of
varying thickness of 100, 150 and 200 mm (4, 6 and 8 in.) made up of Ductal. For the
static case relatively dispersed cracks at the soffit of beam were developed beneath the
point of application of load, ultimately the specimen failed in bending. Even in the
dynamic case the beam failed in bending after causing cracks at wider range as compared
to the former case of the smallest height because of the fact that the radius of curvature is
smaller and hence more bridging effect is produced. An increase in the flexural load
carrying capacity was seen with the increase in cross-sectional height of the beam. If a
comparison can be made between static and dynamic load crack patterns it was observed
that more fine cracks developed in the dynamic than the static case. Also comparing the
flexural load capacity of both the cases the data obtained was very close for both the
cases. There was no drop in the flexural capacity in the dynamic case as it is observed in
the ordinary concrete. Hence it was concluded that Ductal is an excellent structural
material for members subjected to continuous loading (Kida et al., 2006).
2.8.5 Modulus of elasticity and Poisson’s ratio
Cylindrical specimens of size 3 in. x 6 in. (75 x 150 mm) were used and similar
curing regimes were applied as in the case of compression test to act as a variable
quantity. The specimens were prepared as described in Kollmorgen and Ahlborn et al and
ASTM C469 test procedure was followed. The results were found to be similar to the
compressive strength test. The modulus of elasticity of the air cured specimen was less
compared to the other three curing regimes but was increasing by age. Like the
54
compressive stress samples, the three curing regimes had the same modulus of elasticity
mean of 8,150 ksi (56.2 GPa). With thermal curing, the modulus value was increased by
only 3.8%, whereas the compressive stress increased by 25.9% in comparison with air
curing on the basis of 28-day data. When the fibers were removed from the mix the
modulus of elasticity decreased. The four curing regimes had no impact on Poisson’s
ratio, as all specimens, independent of age or curing regimes, had the same mean of 0.21.
So, the compressive strength, modulus of elasticity and Poisson’s ratio are completely
independent of the time at which thermal curing is applied. This information is useful to
the designers, contractors and precasters since there is flexibility of time in casting and
curing of materials (Ahlborn et al., 2011).
2.8.6 Rapid chloride penetration test
For rapid chloride penetration testing, ASTM C1202, Standard Test Method for
Electrical Indication of Concrete’s ability to resist chloride ion penetration, was followed
for both specimen preparation and testing. The specimens were 2 in. (50 mm) in depth
and 4 in. (100 mm) in diameter and exposed to NaCl solution. Three types of curing
regimes were tested for chloride test that is 7-day TT, 28-day air-cured, and 28-day TT.
All the measured data were under the acceptable limits but a key observation was made
that the amount of charge passed for the thermally treated specimens was statistically
lower than the air cured specimens. It should be remembered that the ASTM C1202 test
does not measure any specific type of ion movement and instead measures bulk flow of
ions through the specimen (Ahlborn et al., 2011).
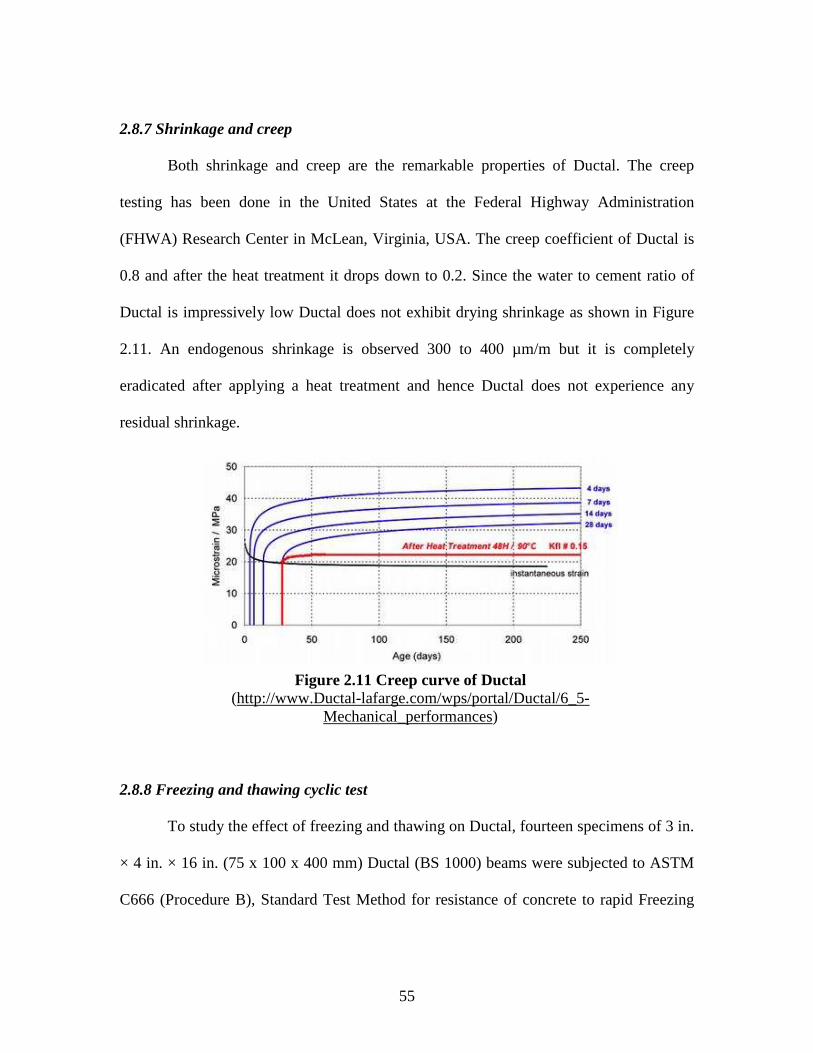
55
2.8.7 Shrinkage and creep
Both shrinkage and creep are the remarkable properties of Ductal. The creep
testing has been done in the United States at the Federal Highway Administration
(FHWA) Research Center in McLean, Virginia, USA. The creep coefficient of Ductal is
0.8 and after the heat treatment it drops down to 0.2. Since the water to cement ratio of
Ductal is impressively low Ductal does not exhibit drying shrinkage as shown in Figure
2.11. An endogenous shrinkage is observed 300 to 400 µm/m but it is completely
eradicated after applying a heat treatment and hence Ductal does not experience any
residual shrinkage.
2.8.8 Freezing and thawing cyclic test
To study the effect of freezing and thawing on Ductal, fourteen specimens of 3 in.
× 4 in. × 16 in. (75 x 100 x 400 mm) Ductal (BS 1000) beams were subjected to ASTM
C666 (Procedure B), Standard Test Method for resistance of concrete to rapid Freezing
Figure 2.11 Creep curve of Ductal (http://www.Ductal-lafarge.com/wps/portal/Ductal/6_5-
Mechanical_performances)
56
and Thawing. Only two curing regimes were used ambient air and 7-day Thermal
Treatment (TT). Available facilities in the laboratories were used each beam was
subjected to at least 300 cycles. The deterioration caused by F-T was observed
mechanically through the monitoring of a specimen’s relative dynamic modulus (RDM)
after every 32 cycles. In addition to the eight beams tested in the F-T chamber, six beams
were cycled in and out of a separate water bath at ambient temperature to compare their
mass change and RDM values to those of the specimens undergoing F-T cycling. All the
measured data were under the acceptable limits of ASTM C666 and showed an increased
RDM values as testing continued. Similar results were obtained with W-D specimens.
The noticeable point was that the increases for the air-cured F-T specimens were
significantly higher than the increases for the thermally treated F-T specimens. All the
specimens were hydrating instead of deteriorating to F-T cycles and the air-cured W-D
specimens RDM increased with a similar trend to that of the air-cured F-T specimens.
However, the increase of the TT specimens was small in comparison to that of the air-
cured specimens. This difference can be primarily attributed to the greater amounts of un-
hydrated cement particles in the air-cured specimens that can become hydrated in the
presence of water. Plenty of other studies evidently indicate that, immersion of UHPFRC
in water can increase its compressive strength and RDM even if the specimens are
subjected to harsh environment (Ahlborn et al., 2011).
57
CHAPTER THREE
EXPERIMENTAL PROGRAM
This Chapter explains the research program in a comprehensive manner by
explaining the type of materials and ingredients used in the preparation of the specimens.
The composition, design and type of specimens used in the experimental test with their
mixing and preparation procedures. Finally it explains the type, duration and number of
experiments that were conducted on the samples to achieve the objectives of the research.
3.1 Materials
Three types of materials were used in this research; Lafarge Ductal, Quikrete®
Non-Shrink Precision Grout and high early concrete mix (precast concrete). Each of them
is explained in detail with their characteristics properties explained in Chapter 2.
3.1.1 Ductal grey premix
Ductal a commercial product name of Ultra High Performance Concrete (UHPC)
manufactured by Lafarge (North America) was used in this research. It was used in
combination with polyvinyl alcohol (PVA) or steel fibers as two different mixtures so as
to produce UHPFRC. In this thesis, these mix designs will be referred to as Ductal PVA
when PVA fibers were used and Ductal Steel when steel fibers were used. The Ductal
mix designs used CHRYSO Fluid Premia 150, a high range water reducer (super-
plasticizer). The two mix designs are shown in Table 3.1.
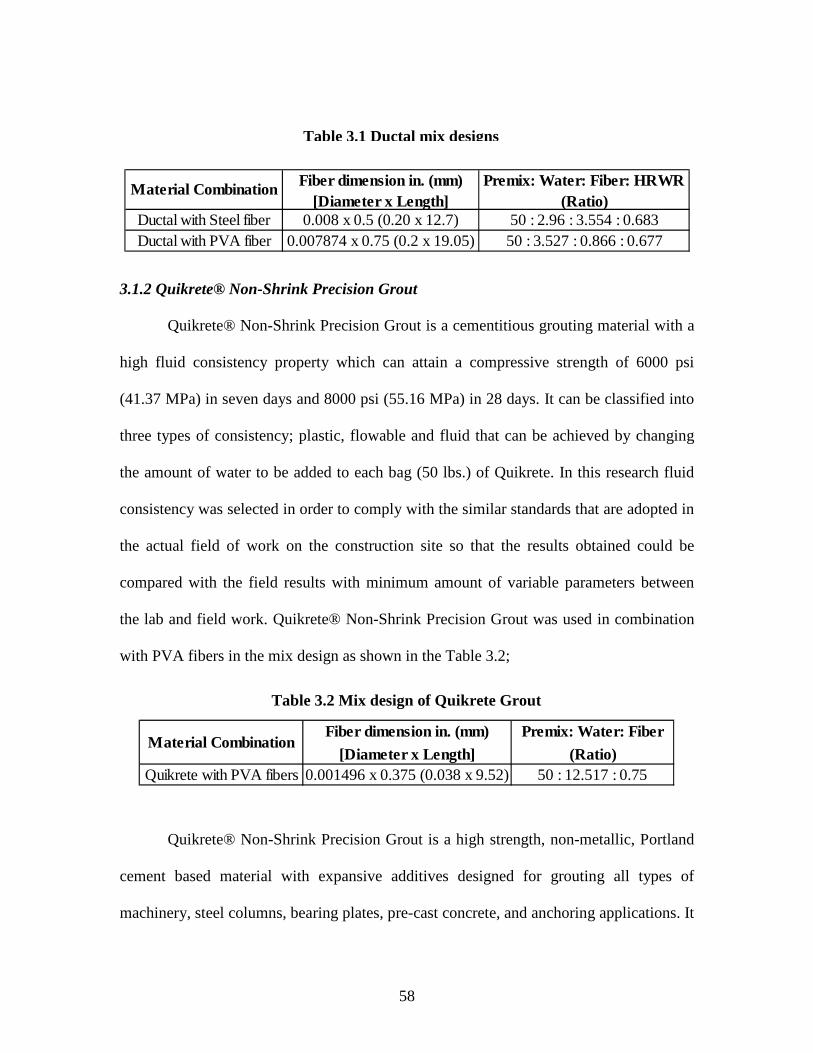
58
3.1.2 Quikrete® Non-Shrink Precision Grout
Quikrete® Non-Shrink Precision Grout is a cementitious grouting material with a
high fluid consistency property which can attain a compressive strength of 6000 psi
(41.37 MPa) in seven days and 8000 psi (55.16 MPa) in 28 days. It can be classified into
three types of consistency; plastic, flowable and fluid that can be achieved by changing
the amount of water to be added to each bag (50 lbs.) of Quikrete. In this research fluid
consistency was selected in order to comply with the similar standards that are adopted in
the actual field of work on the construction site so that the results obtained could be
compared with the field results with minimum amount of variable parameters between
the lab and field work. Quikrete® Non-Shrink Precision Grout was used in combination
with PVA fibers in the mix design as shown in the Table 3.2;
Quikrete® Non-Shrink Precision Grout is a high strength, non-metallic, Portland
cement based material with expansive additives designed for grouting all types of
machinery, steel columns, bearing plates, pre-cast concrete, and anchoring applications. It
Table 3.2 Mix design of Quikrete Grout
Material CombinationFiber dimension in. (mm)
[Diameter x Length]
Premix: Water: Fiber
(Ratio)Quikrete with PVA fibers 0.001496 x 0.375 (0.038 x 9.52) 50 : 12.517 : 0.75
Table 3.1 Ductal mix designs
Material Combination Fiber dimension in. (mm) [Diameter x Length]
Premix: Water: Fiber: HRWR (Ratio)
Ductal with Steel fiber 0.008 x 0.5 (0.20 x 12.7) 50 : 2.96 : 3.554 : 0.683Ductal with PVA fiber 0.007874 x 0.75 (0.2 x 19.05) 50 : 3.527 : 0.866 : 0.677
59
will meet the specifications for ASTM C 1107, Standard Specification for Packaged Dry,
Hydraulic-Cement Grout (Non-shrink), and CRD 621. It is a factory mixed non-metallic
blend of selected fine aggregates, hydraulic cement, plasticizers, and shrinkage
compensating additives. The product is approximately 50% cementitious and 50% high
quality sand. It will not bond to metal. The Quikrete® grout placed around the metal will
expand and act more like a “locking” mechanism where the metal would be tightly
encapsulated within the grout. All material specifications for Quikrete® Non-Shrink
Precision Grout can be found in Appendix A.
3.1.3 Precast concrete (High early concrete mix)
Precast concrete was procured from Metromont (Greenville, SC) for all the
specimens prepared in this research. Mix design for per cubic feet of concrete used in the
preparation of samples is shown in Table 3.3. For the mixing of the ingredients crushed
aggregates and fine sand are mixed with 20% of batching water thoroughly. Then cement
is added along with the rest of the batching water. HRWR is used and added at the end
after cement. Total mix time of the ingredients is about 3 minutes. The average
compressive strength of 28 days is about 7500 psi (51.71 MPa), Modulus of elasticity is
about 4.02 x 10⁶ psi (27716.93 MPa) and a unit weight of the concrete is 142 lbs./ft3
(2274.62 kg/m3). Sieve analysis and aggregate specifications used by Metromont in the
preparation of concrete can be found in Appendix B.

60
3.1.4 Mixing
Mixing UHPFRC (Ductal with steel or PVA fibers) requires special equipment
and procedures to develop consistency in batching, casting, and curing in a timely fashion
due to the low water cement ratio. Usually a mixer with high shear capacity, along with a
vibratory table and a steam cure chamber capable of maintaining 100% humidity at
194°F (90°C), is required (Ahlborn et al., 2011) and recommended by the manufacturing
agencies. On the construction field a high shear capacity mixer is available for mixing the
materials and a needle vibrator or a tapping rod is used for applying compaction and the
grouted concrete work is covered with a plastic sheet to prevent the loss of water from the
mix in to the atmosphere instead of applying steam curing. Similarly, following
procedure was applied in the preparation of specimens for this research a mixer with a
high shear capacity was used to mix the materials and a tapping rod was used for
applying the necessary compaction and in the end the grouted part was covered with
plastic sheeting. Dry material (Ductal or Quikrete premix) were mixed till a homogenous
mixture was built up; then in place of water ice (equivalent quantity) was used in order to
keep the temperature of the mix within the prescribed limit since the mixing was carried
Table 3.3 Mix design of concrete
Material QuantityCement lbs. (kg) 650 (294.84)Fly ash lbs. (kg) 100 (45.36)
Crushed stone lbs. (kg) 1750 (793.79)Fine sand lbs. (kg) 1078 (488.97)
Water lbs. (kg) 280 (127)W/C ratio 0.37
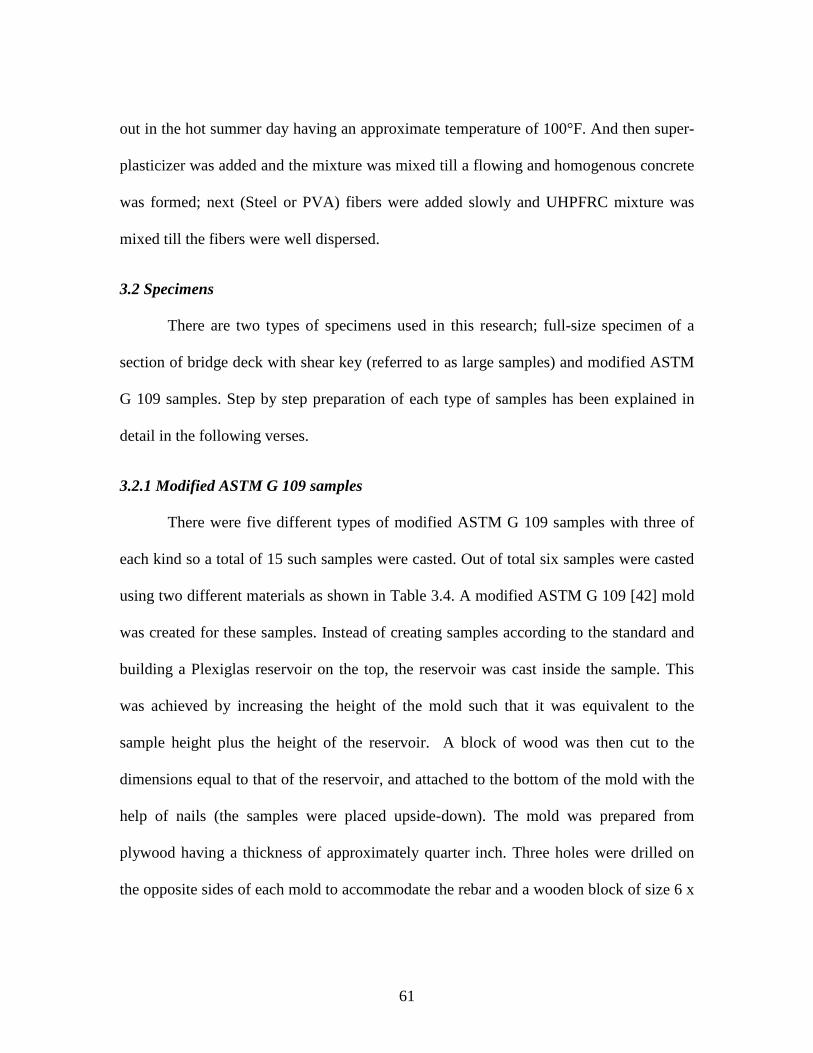
61
out in the hot summer day having an approximate temperature of 100°F. And then super-
plasticizer was added and the mixture was mixed till a flowing and homogenous concrete
was formed; next (Steel or PVA) fibers were added slowly and UHPFRC mixture was
mixed till the fibers were well dispersed.
3.2 Specimens
There are two types of specimens used in this research; full-size specimen of a
section of bridge deck with shear key (referred to as large samples) and modified ASTM
G 109 samples. Step by step preparation of each type of samples has been explained in
detail in the following verses.
3.2.1 Modified ASTM G 109 samples
There were five different types of modified ASTM G 109 samples with three of
each kind so a total of 15 such samples were casted. Out of total six samples were casted
using two different materials as shown in Table 3.4. A modified ASTM G 109 [42] mold
was created for these samples. Instead of creating samples according to the standard and
building a Plexiglas reservoir on the top, the reservoir was cast inside the sample. This
was achieved by increasing the height of the mold such that it was equivalent to the
sample height plus the height of the reservoir. A block of wood was then cut to the
dimensions equal to that of the reservoir, and attached to the bottom of the mold with the
help of nails (the samples were placed upside-down). The mold was prepared from
plywood having a thickness of approximately quarter inch. Three holes were drilled on
the opposite sides of each mold to accommodate the rebar and a wooden block of size 6 x
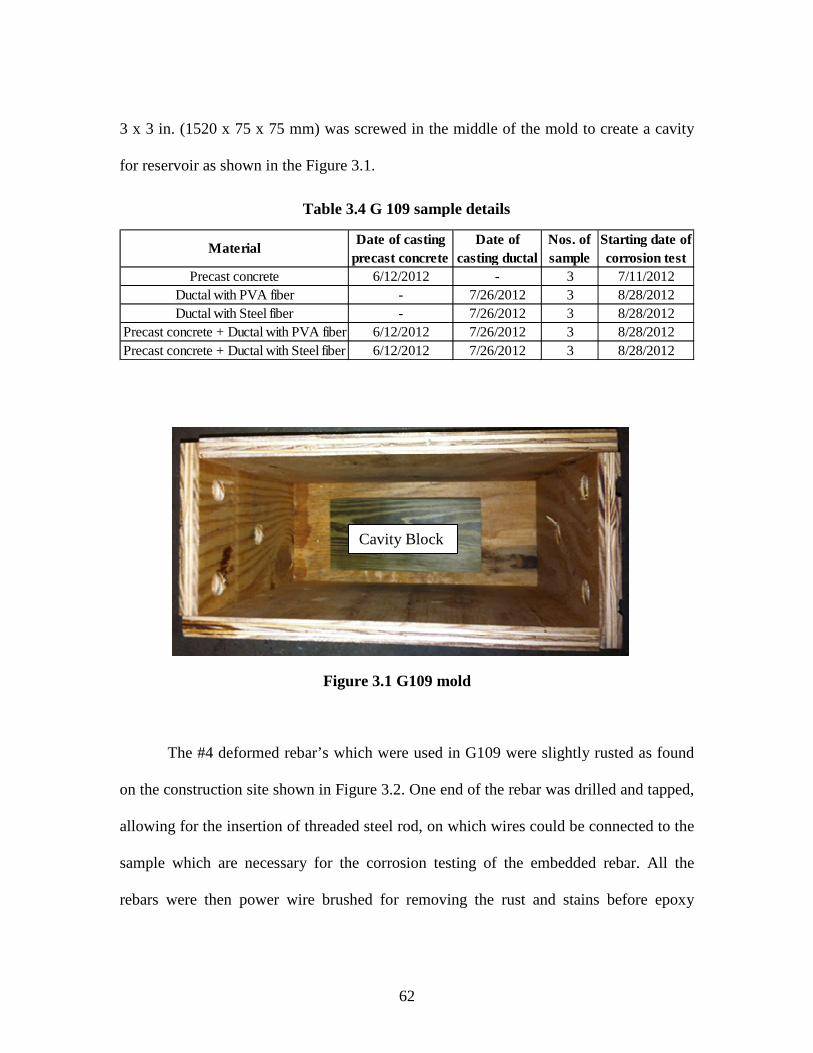
62
3 x 3 in. (1520 x 75 x 75 mm) was screwed in the middle of the mold to create a cavity
for reservoir as shown in the Figure 3.1.
The #4 deformed rebar’s which were used in G109 were slightly rusted as found
on the construction site shown in Figure 3.2. One end of the rebar was drilled and tapped,
allowing for the insertion of threaded steel rod, on which wires could be connected to the
sample which are necessary for the corrosion testing of the embedded rebar. All the
rebars were then power wire brushed for removing the rust and stains before epoxy
Table 3.4 G 109 sample details
Precast concrete 6/12/2012 - 3 7/11/2012Ductal with PVA fiber - 7/26/2012 3 8/28/2012Ductal with Steel fiber - 7/26/2012 3 8/28/2012
Precast concrete + Ductal with PVA fiber 6/12/2012 7/26/2012 3 8/28/2012Precast concrete + Ductal with Steel fiber 6/12/2012 7/26/2012 3 8/28/2012
Date of casting precast concrete
Date of casting ductal
Nos. of sample
Starting date of corrosion test
Material
Figure 3.1 G109 mold
Cavity Block
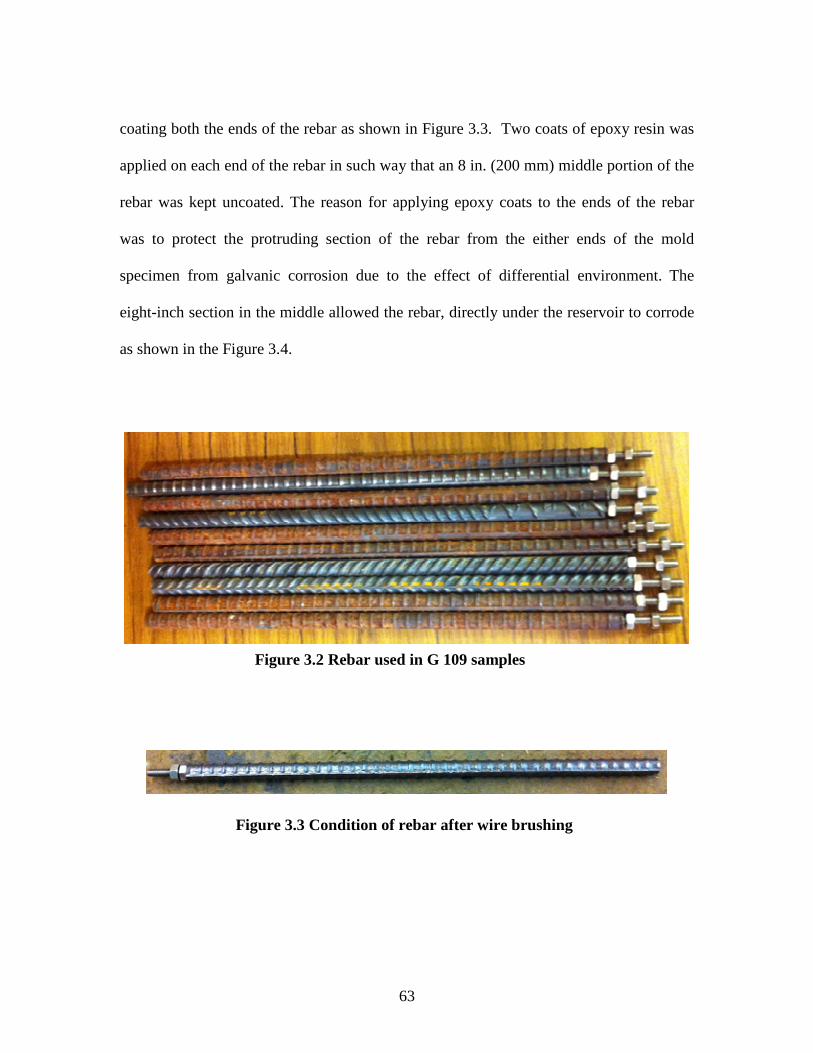
63
coating both the ends of the rebar as shown in Figure 3.3. Two coats of epoxy resin was
applied on each end of the rebar in such way that an 8 in. (200 mm) middle portion of the
rebar was kept uncoated. The reason for applying epoxy coats to the ends of the rebar
was to protect the protruding section of the rebar from the either ends of the mold
specimen from galvanic corrosion due to the effect of differential environment. The
eight-inch section in the middle allowed the rebar, directly under the reservoir to corrode
as shown in the Figure 3.4.
Figure 3.2 Rebar used in G 109 samples
Figure 3.3 Condition of rebar after wire brushing
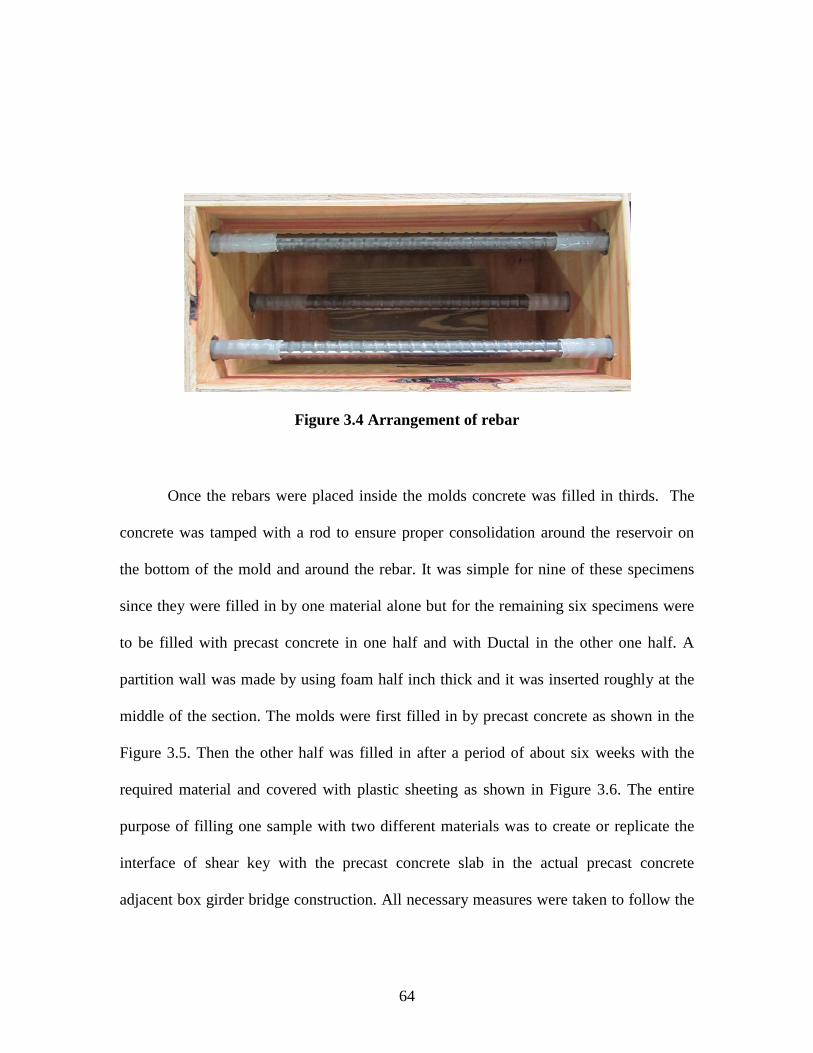
64
Once the rebars were placed inside the molds concrete was filled in thirds. The
concrete was tamped with a rod to ensure proper consolidation around the reservoir on
the bottom of the mold and around the rebar. It was simple for nine of these specimens
since they were filled in by one material alone but for the remaining six specimens were
to be filled with precast concrete in one half and with Ductal in the other one half. A
partition wall was made by using foam half inch thick and it was inserted roughly at the
middle of the section. The molds were first filled in by precast concrete as shown in the
Figure 3.5. Then the other half was filled in after a period of about six weeks with the
required material and covered with plastic sheeting as shown in Figure 3.6. The entire
purpose of filling one sample with two different materials was to create or replicate the
interface of shear key with the precast concrete slab in the actual precast concrete
adjacent box girder bridge construction. All necessary measures were taken to follow the
Figure 3.4 Arrangement of rebar
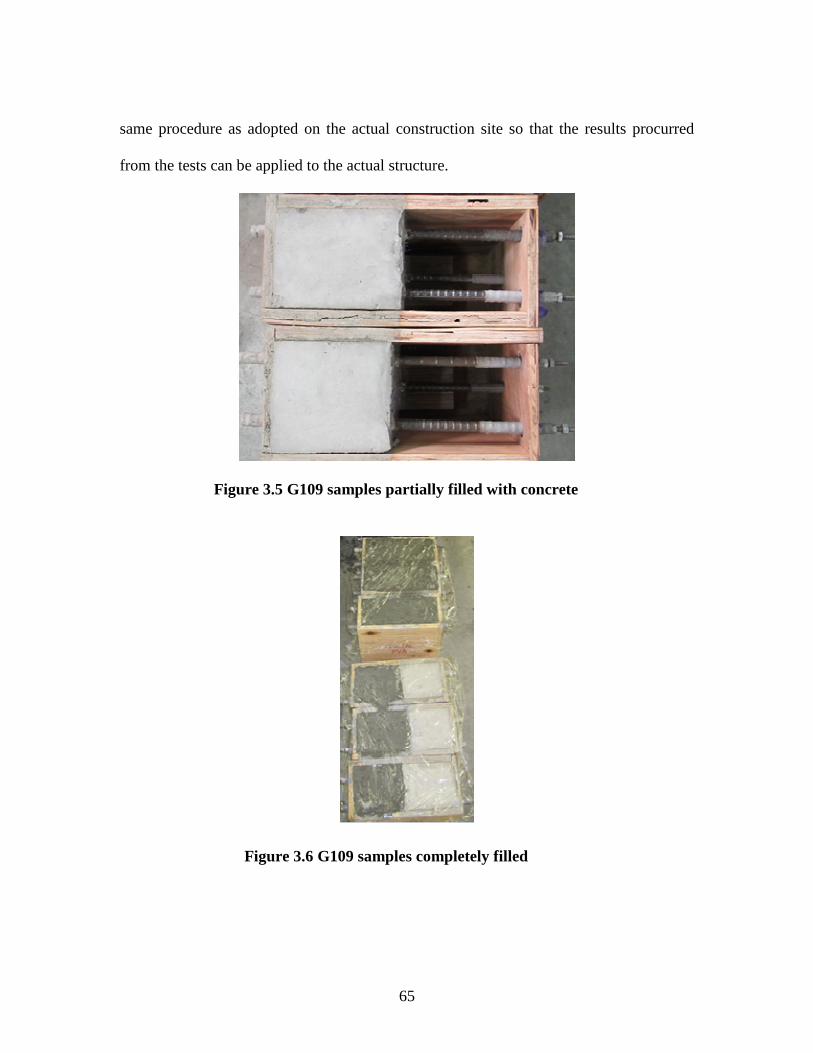
65
same procedure as adopted on the actual construction site so that the results procurred
from the tests can be applied to the actual structure.
Figure 3.5 G109 samples partially filled with concrete
Figure 3.6 G109 samples completely filled
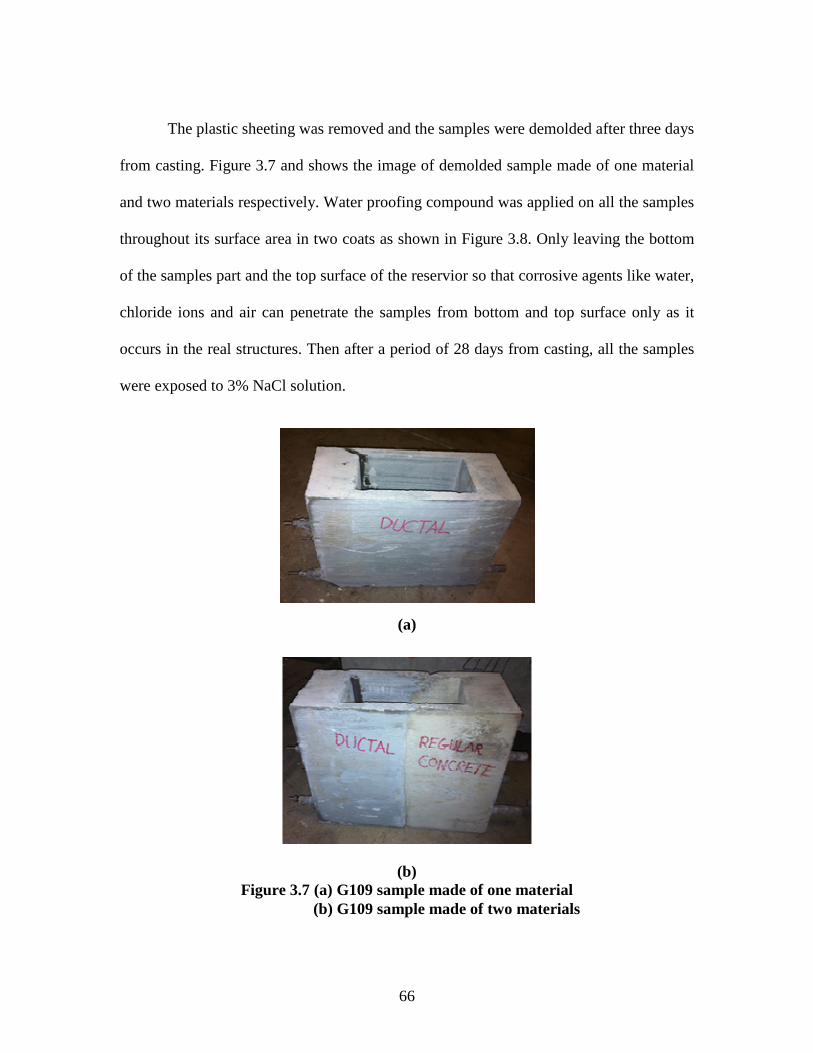
66
The plastic sheeting was removed and the samples were demolded after three days
from casting. Figure 3.7 and shows the image of demolded sample made of one material
and two materials respectively. Water proofing compound was applied on all the samples
throughout its surface area in two coats as shown in Figure 3.8. Only leaving the bottom
of the samples part and the top surface of the reservior so that corrosive agents like water,
chloride ions and air can penetrate the samples from bottom and top surface only as it
occurs in the real structures. Then after a period of 28 days from casting, all the samples
were exposed to 3% NaCl solution.
(b) Figure 3.7 (a) G109 sample made of one material
(b) G109 sample made of two materials
(a)
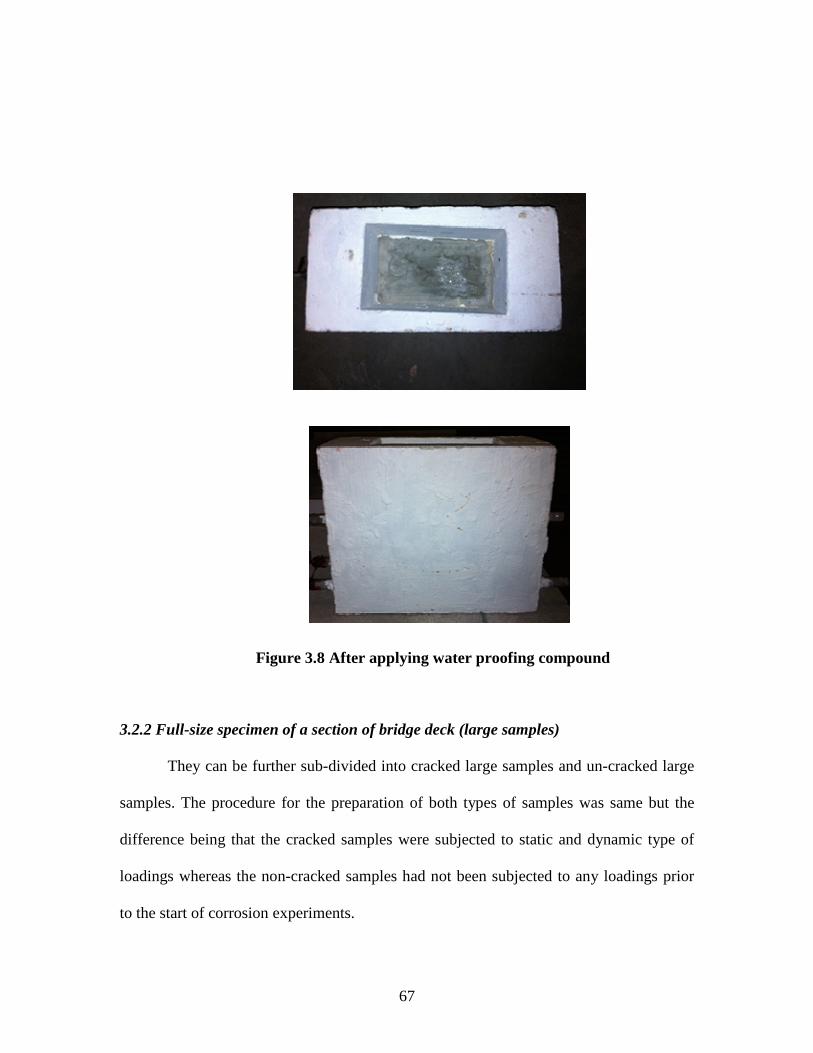
67
3.2.2 Full-size specimen of a section of bridge deck (large samples)
They can be further sub-divided into cracked large samples and un-cracked large
samples. The procedure for the preparation of both types of samples was same but the
difference being that the cracked samples were subjected to static and dynamic type of
loadings whereas the non-cracked samples had not been subjected to any loadings prior
to the start of corrosion experiments.
Figure 3.8 After applying water proofing compound
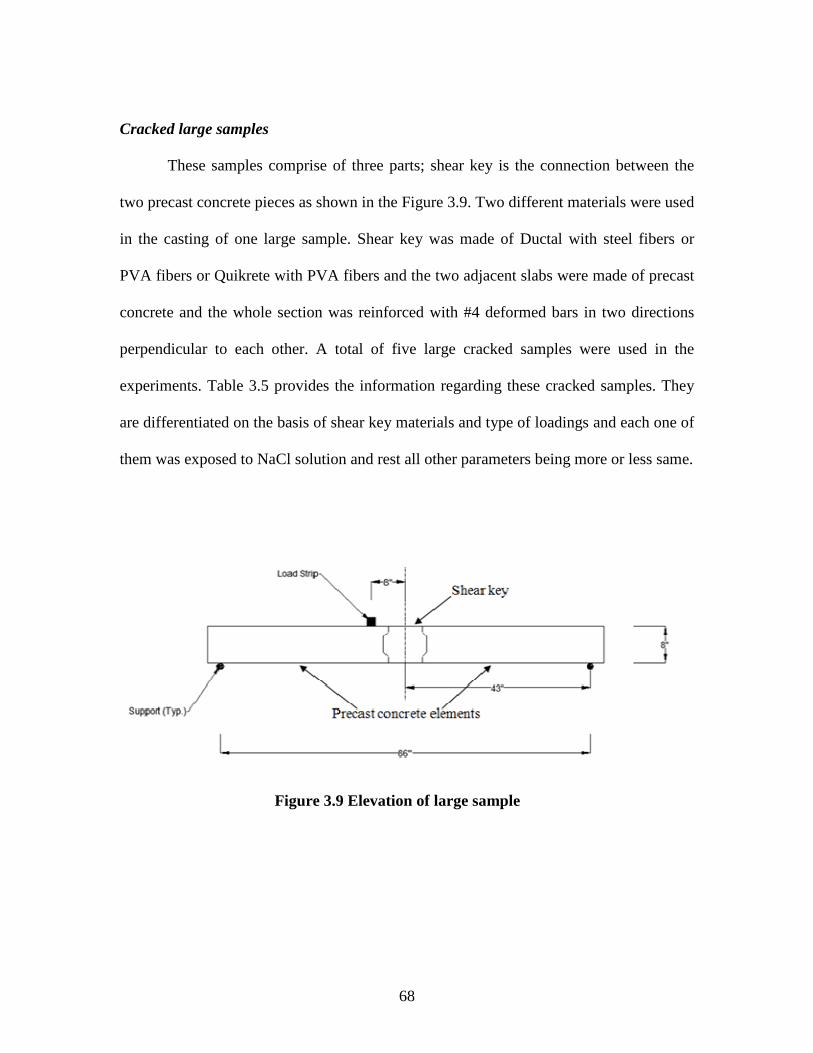
68
Cracked large samples
These samples comprise of three parts; shear key is the connection between the
two precast concrete pieces as shown in the Figure 3.9. Two different materials were used
in the casting of one large sample. Shear key was made of Ductal with steel fibers or
PVA fibers or Quikrete with PVA fibers and the two adjacent slabs were made of precast
concrete and the whole section was reinforced with #4 deformed bars in two directions
perpendicular to each other. A total of five large cracked samples were used in the
experiments. Table 3.5 provides the information regarding these cracked samples. They
are differentiated on the basis of shear key materials and type of loadings and each one of
them was exposed to NaCl solution and rest all other parameters being more or less same.
Figure 3.9 Elevation of large sample
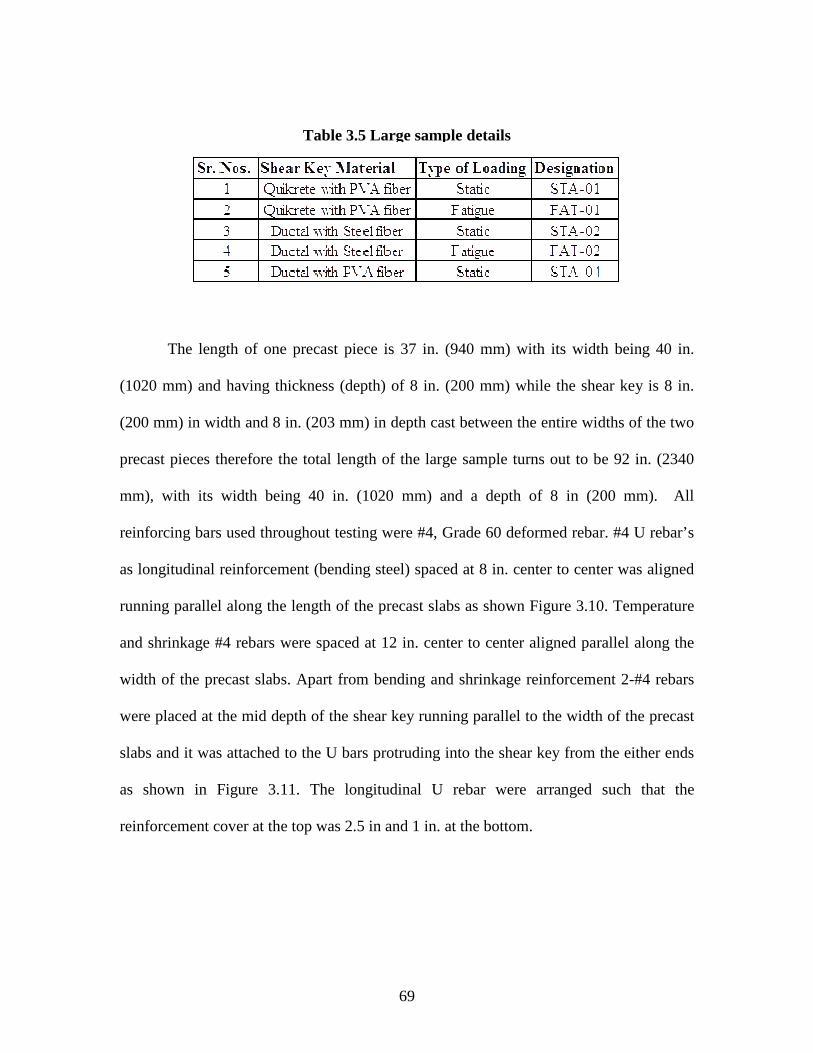
69
The length of one precast piece is 37 in. (940 mm) with its width being 40 in.
(1020 mm) and having thickness (depth) of 8 in. (200 mm) while the shear key is 8 in.
(200 mm) in width and 8 in. (203 mm) in depth cast between the entire widths of the two
precast pieces therefore the total length of the large sample turns out to be 92 in. (2340
mm), with its width being 40 in. (1020 mm) and a depth of 8 in (200 mm). All
reinforcing bars used throughout testing were #4, Grade 60 deformed rebar. #4 U rebar’s
as longitudinal reinforcement (bending steel) spaced at 8 in. center to center was aligned
running parallel along the length of the precast slabs as shown Figure 3.10. Temperature
and shrinkage #4 rebars were spaced at 12 in. center to center aligned parallel along the
width of the precast slabs. Apart from bending and shrinkage reinforcement 2-#4 rebars
were placed at the mid depth of the shear key running parallel to the width of the precast
slabs and it was attached to the U bars protruding into the shear key from the either ends
as shown in Figure 3.11. The longitudinal U rebar were arranged such that the
reinforcement cover at the top was 2.5 in and 1 in. at the bottom.
Table 3.5 Large sample details

70
The precast slabs were cast at Metromont located in Greenville, SC and brought
to the lab for joining the slabs by casting a shear key between them. Casting dates of
slabs and shear keys are mentioned in the Table 3.6. The reinforcement bars used in the
research were slightly rusted as found on a typical construction site. A precision control
Figure 3.10 Arrangement of steel reinforcement in large samples
Figure 3.11 Cross section of large sample

71
protocol was followed in the preparation and casting of the samples throughout the
research so that it can match with equivalent construction of the actual bridge in the field.
Weeks before the casting of the shear key the interfaces of the precast slabs were sand
blasted and then cleaned with air and water pressure. Couple of hours before the casting
of the shear key the interfaces of slabs was rinsed with water using a water sprayer and
care was taken that it remains wet until the casting of shear key. In case of casting
Quikrete with PVA fibers the mixing was carried out in a conventional manner which
lasted about 5 minutes. In case of Ductal with steel or PVA fibers a high shear energy
mixer was used since mixing UHPFRC requires higher energy input to mix its
ingredients to a level of achieving the desired flow ability of Ductal as shown in Figure
3.12. After filling the shear key it was covered with plastic sheeting for three days to
prevent the loss of water content from the wet mix in to the atmosphere as shown in
Figure 3.13.
Table 3.6 Dates of casting large samples (cracked)
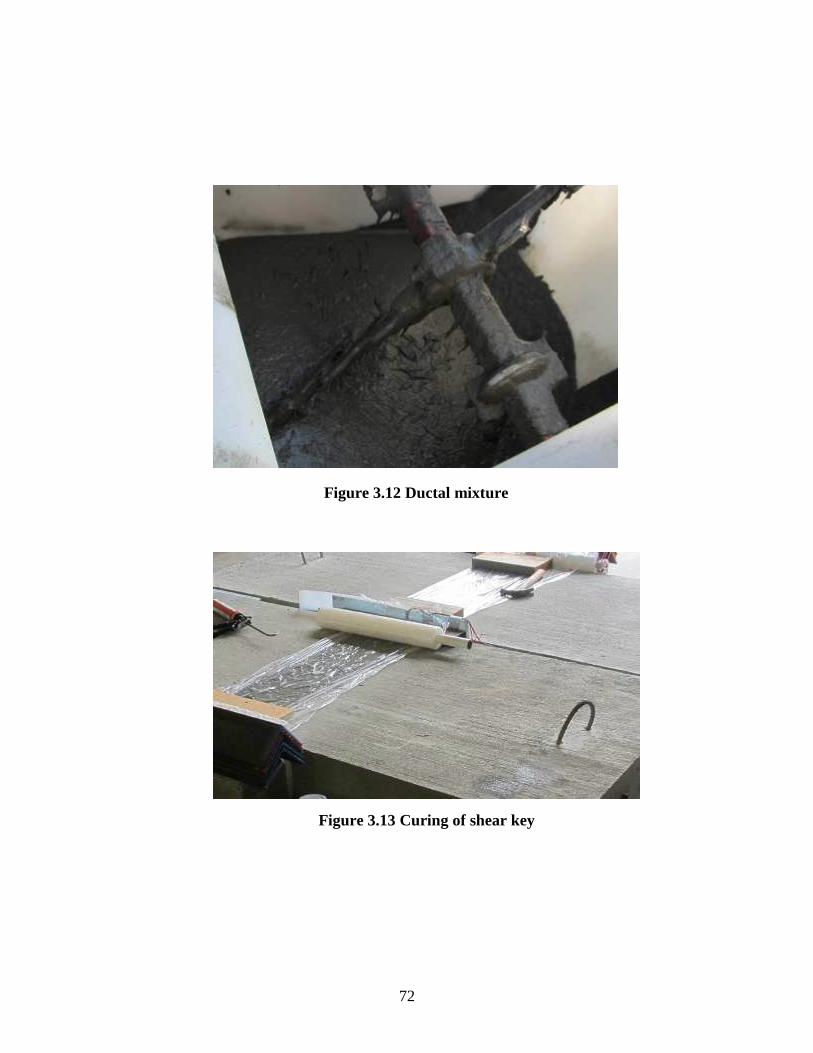
72
Figure 3.12 Ductal mixture
Figure 3.13 Curing of shear key
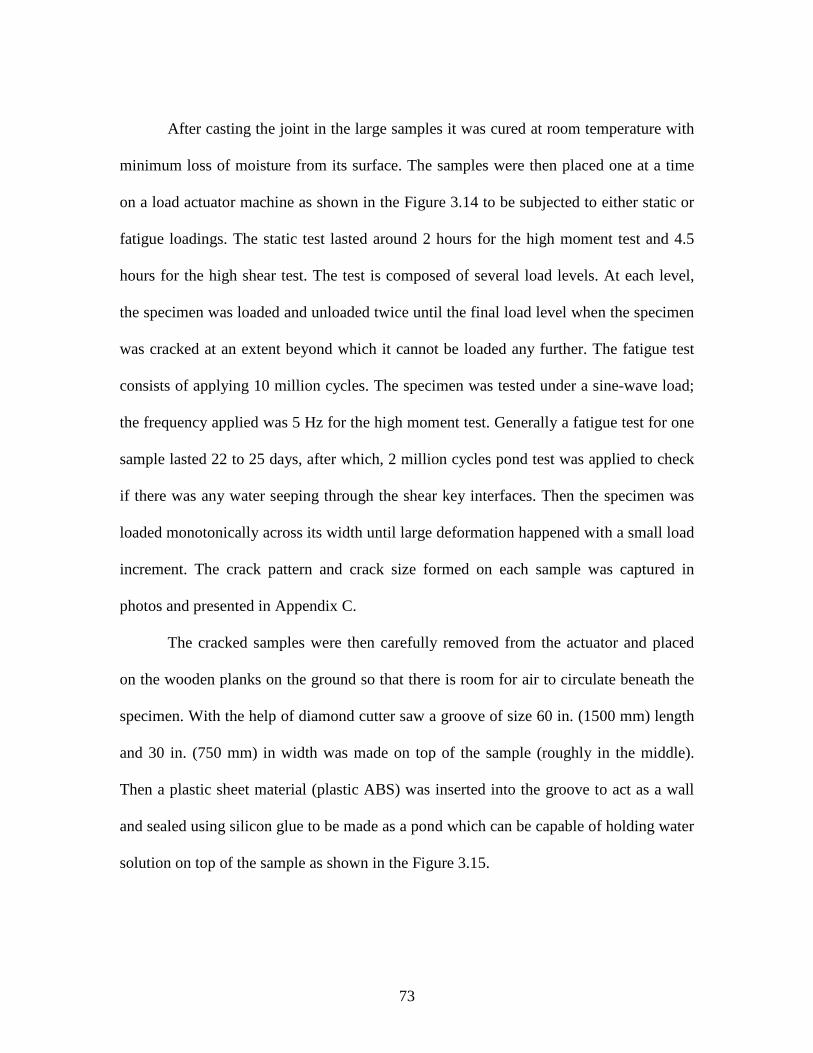
73
After casting the joint in the large samples it was cured at room temperature with
minimum loss of moisture from its surface. The samples were then placed one at a time
on a load actuator machine as shown in the Figure 3.14 to be subjected to either static or
fatigue loadings. The static test lasted around 2 hours for the high moment test and 4.5
hours for the high shear test. The test is composed of several load levels. At each level,
the specimen was loaded and unloaded twice until the final load level when the specimen
was cracked at an extent beyond which it cannot be loaded any further. The fatigue test
consists of applying 10 million cycles. The specimen was tested under a sine-wave load;
the frequency applied was 5 Hz for the high moment test. Generally a fatigue test for one
sample lasted 22 to 25 days, after which, 2 million cycles pond test was applied to check
if there was any water seeping through the shear key interfaces. Then the specimen was
loaded monotonically across its width until large deformation happened with a small load
increment. The crack pattern and crack size formed on each sample was captured in
photos and presented in Appendix C.
The cracked samples were then carefully removed from the actuator and placed
on the wooden planks on the ground so that there is room for air to circulate beneath the
specimen. With the help of diamond cutter saw a groove of size 60 in. (1500 mm) length
and 30 in. (750 mm) in width was made on top of the sample (roughly in the middle).
Then a plastic sheet material (plastic ABS) was inserted into the groove to act as a wall
and sealed using silicon glue to be made as a pond which can be capable of holding water
solution on top of the sample as shown in the Figure 3.15.

74
Figure 3.14 Loading machine
Figure 3.15 Large sample with a pond on top
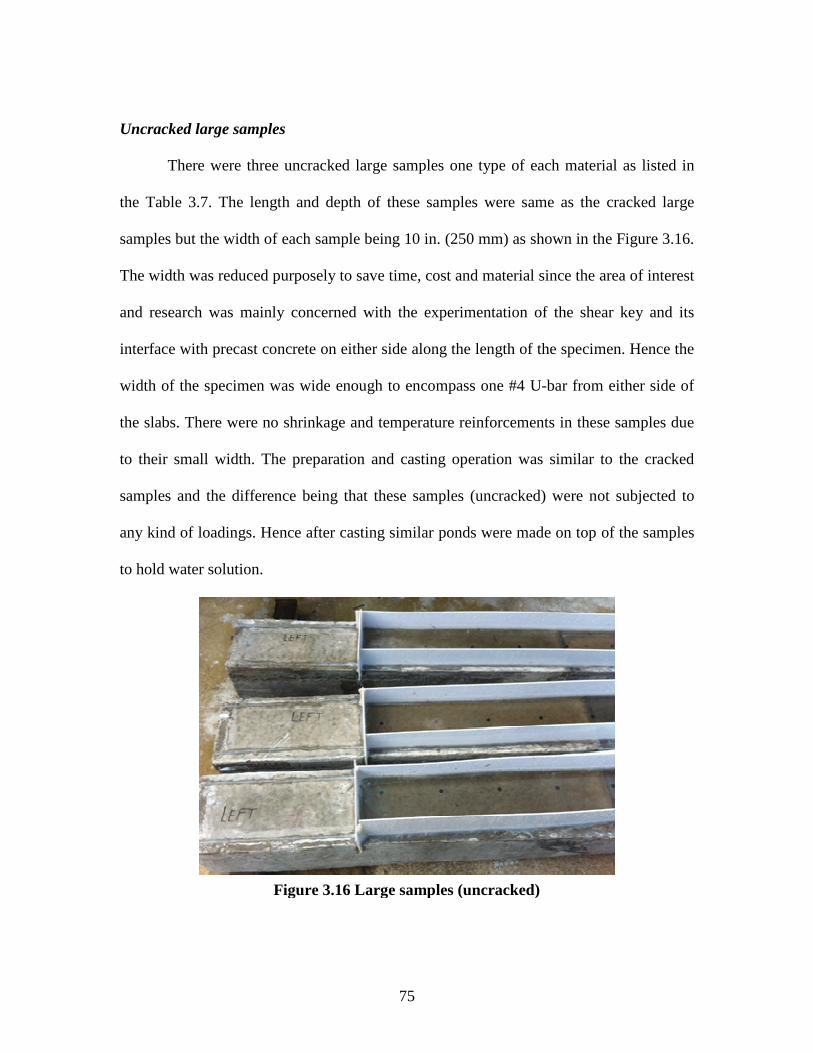
75
Uncracked large samples
There were three uncracked large samples one type of each material as listed in
the Table 3.7. The length and depth of these samples were same as the cracked large
samples but the width of each sample being 10 in. (250 mm) as shown in the Figure 3.16.
The width was reduced purposely to save time, cost and material since the area of interest
and research was mainly concerned with the experimentation of the shear key and its
interface with precast concrete on either side along the length of the specimen. Hence the
width of the specimen was wide enough to encompass one #4 U-bar from either side of
the slabs. There were no shrinkage and temperature reinforcements in these samples due
to their small width. The preparation and casting operation was similar to the cracked
samples and the difference being that these samples (uncracked) were not subjected to
any kind of loadings. Hence after casting similar ponds were made on top of the samples
to hold water solution.
Figure 3.16 Large samples (uncracked)
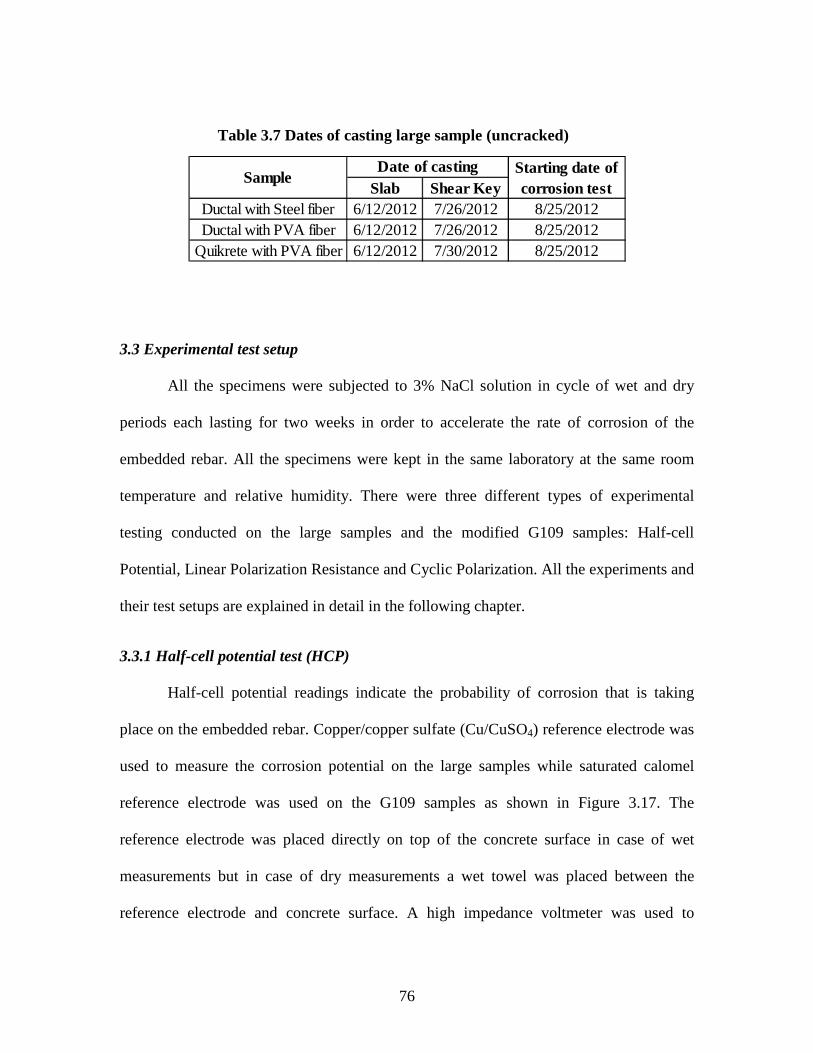
76
3.3 Experimental test setup
All the specimens were subjected to 3% NaCl solution in cycle of wet and dry
periods each lasting for two weeks in order to accelerate the rate of corrosion of the
embedded rebar. All the specimens were kept in the same laboratory at the same room
temperature and relative humidity. There were three different types of experimental
testing conducted on the large samples and the modified G109 samples: Half-cell
Potential, Linear Polarization Resistance and Cyclic Polarization. All the experiments and
their test setups are explained in detail in the following chapter.
3.3.1 Half-cell potential test (HCP)
Half-cell potential readings indicate the probability of corrosion that is taking
place on the embedded rebar. Copper/copper sulfate (Cu/CuSO4) reference electrode was
used to measure the corrosion potential on the large samples while saturated calomel
reference electrode was used on the G109 samples as shown in Figure 3.17. The
reference electrode was placed directly on top of the concrete surface in case of wet
measurements but in case of dry measurements a wet towel was placed between the
reference electrode and concrete surface. A high impedance voltmeter was used to
Table 3.7 Dates of casting large sample (uncracked)
Slab Shear KeyDuctal with Steel fiber 6/12/2012 7/26/2012 8/25/2012Ductal with PVA fiber 6/12/2012 7/26/2012 8/25/2012
Quikrete with PVA fiber 6/12/2012 7/30/2012 8/25/2012
Date of casting Starting date of corrosion test
Sample
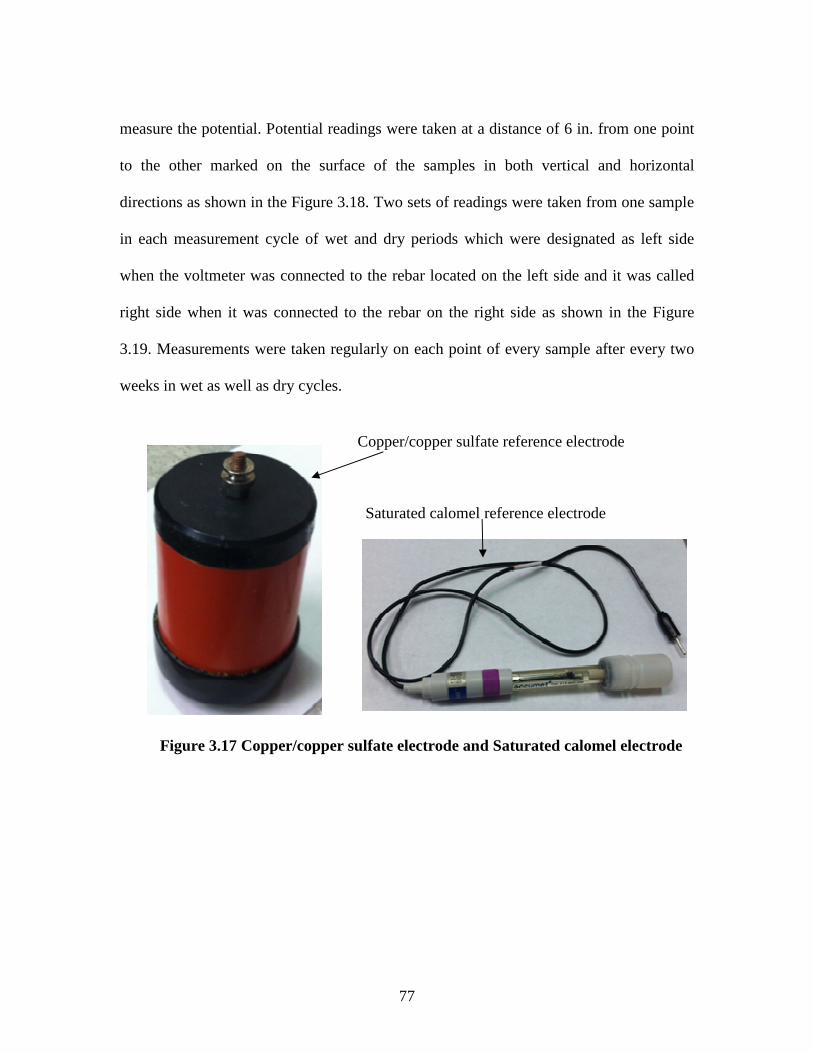
77
measure the potential. Potential readings were taken at a distance of 6 in. from one point
to the other marked on the surface of the samples in both vertical and horizontal
directions as shown in the Figure 3.18. Two sets of readings were taken from one sample
in each measurement cycle of wet and dry periods which were designated as left side
when the voltmeter was connected to the rebar located on the left side and it was called
right side when it was connected to the rebar on the right side as shown in the Figure
3.19. Measurements were taken regularly on each point of every sample after every two
weeks in wet as well as dry cycles.
Copper/copper sulfate reference electrode
Saturated calomel reference electrode
Figure 3.17 Copper/copper sulfate electrode and Saturated calomel electrode
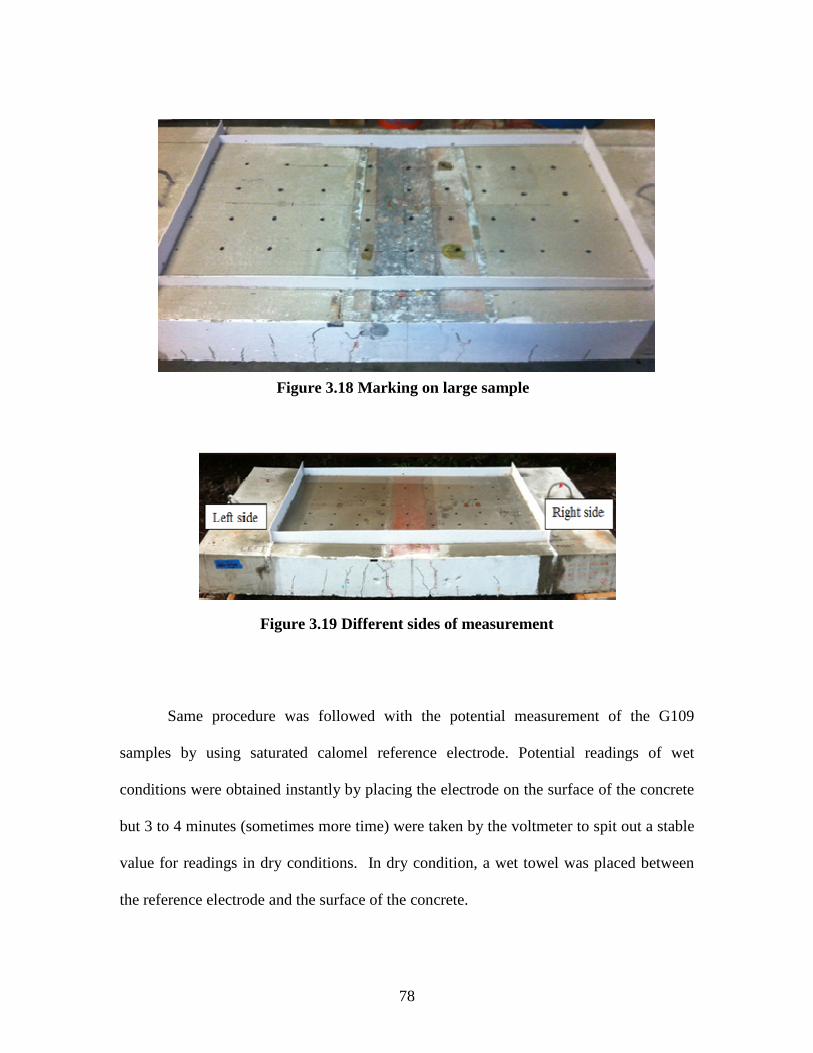
78
Same procedure was followed with the potential measurement of the G109
samples by using saturated calomel reference electrode. Potential readings of wet
conditions were obtained instantly by placing the electrode on the surface of the concrete
but 3 to 4 minutes (sometimes more time) were taken by the voltmeter to spit out a stable
value for readings in dry conditions. In dry condition, a wet towel was placed between
the reference electrode and the surface of the concrete.
Figure 3.18 Marking on large sample
Figure 3.19 Different sides of measurement
79
3.3.2 Linear Polarization test setup
This test was conducted on points which had highest and lowest corrsion potential
indicated by the half-cell potential test. SP -200 potentiostat was used to measure the
polarization resistance (Rp) by using saturated calomel as reference electrode and a
stainless steel shim as counter electrode. The shim was 5 in. (127 mm) long and 0.04 in.
(1 mm) thick. Figure 3.20 shows the test setup used for all the electrochemmical
measuremens, other than half-cell potential. There were three main wire connections to
the equipment; to working electrode (corroding rebar), to counter electrode (steel shim)
and reference electrode and the equipment was connected to the computer for measuring
and recording the graphs by installing the EC-lab software. The reference electrode was
fitted in a small piece of foam for balancing it to stand vertically on the surface. The steel
shim was placed rigth below the electrode but not toching it. Both of these were placed
on a wet cloth in case of dry condition measurement. Both wet and dry measurements
were taken on the same selected points. The duration of the test on one point was about 2
minutes with a scan rate of 0.166 mV/s. Ohmic resistince was atumatically compensadted
by the potentiostat.

80
Figure 3.20 Arrangement of LPR measurements

81
3.3.3 Visual observation
Visual inspection was performed to validate the results from all electrochemical
measurements. Three cores were taken from each large sample at a point of maximum
and minimum corrosion as indicted by the results of various corrosive measurement tests.
The points of coring were selected such that one would lie in the center of the shear key,
one at the interface of shear key and precast slab and one would lie in the precast slabs.
Such variant locations were selected so that comparative results can be generated after
observing the condition of the rebars. A heavy duty coring machine Dymodrill of
Milwaukee brand as shown in Figure 3.21 was employed for the job of obtaining cores
having a diameter of 2.25 in. and 8 in. depth, since the cores were taken throughout the
depth of the sample. Top and bottom rebars were captured in each core sample. Two of
the G109 samples of precast concrete and Ductal with PVA fibers were broken into two
halves with a help of chisel and a hammer to retrieve the embedded top rebar. The
samples made of Ductal with steel fibers were impossible to break with a hammer. Hence
the same coring machine was used to take out cores from the remaining G109 samples.
Each core was dried using compressed air and broken cautiously using a hammer to
retrieve the rebar and concrete imprints. All pieces (concrete and the rebars) labeled and
stored carefully in sealed plastic bag in a refrigerator. This procedure minimized further
atmospheric corrosion.
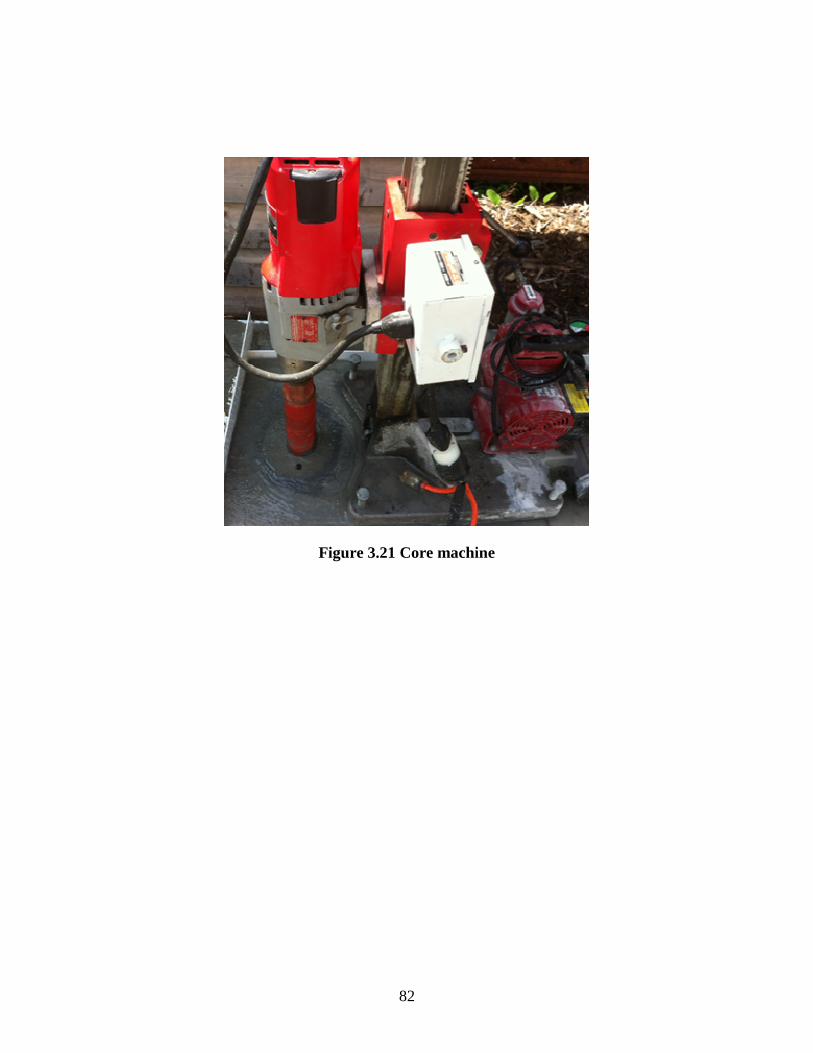
82
Figure 3.21 Core machine
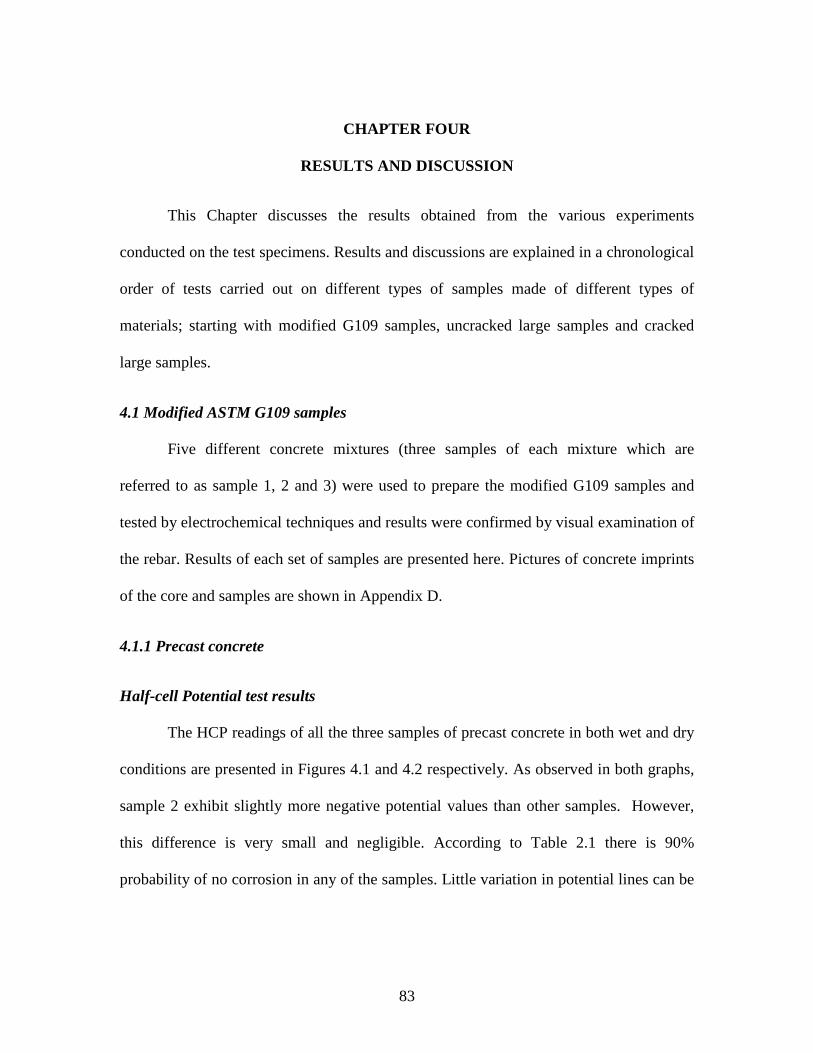
83
CHAPTER FOUR
RESULTS AND DISCUSSION
This Chapter discusses the results obtained from the various experiments
conducted on the test specimens. Results and discussions are explained in a chronological
order of tests carried out on different types of samples made of different types of
materials; starting with modified G109 samples, uncracked large samples and cracked
large samples.
4.1 Modified ASTM G109 samples
Five different concrete mixtures (three samples of each mixture which are
referred to as sample 1, 2 and 3) were used to prepare the modified G109 samples and
tested by electrochemical techniques and results were confirmed by visual examination of
the rebar. Results of each set of samples are presented here. Pictures of concrete imprints
of the core and samples are shown in Appendix D.
4.1.1 Precast concrete
Half-cell Potential test results
The HCP readings of all the three samples of precast concrete in both wet and dry
conditions are presented in Figures 4.1 and 4.2 respectively. As observed in both graphs,
sample 2 exhibit slightly more negative potential values than other samples. However,
this difference is very small and negligible. According to Table 2.1 there is 90%
probability of no corrosion in any of the samples. Little variation in potential lines can be
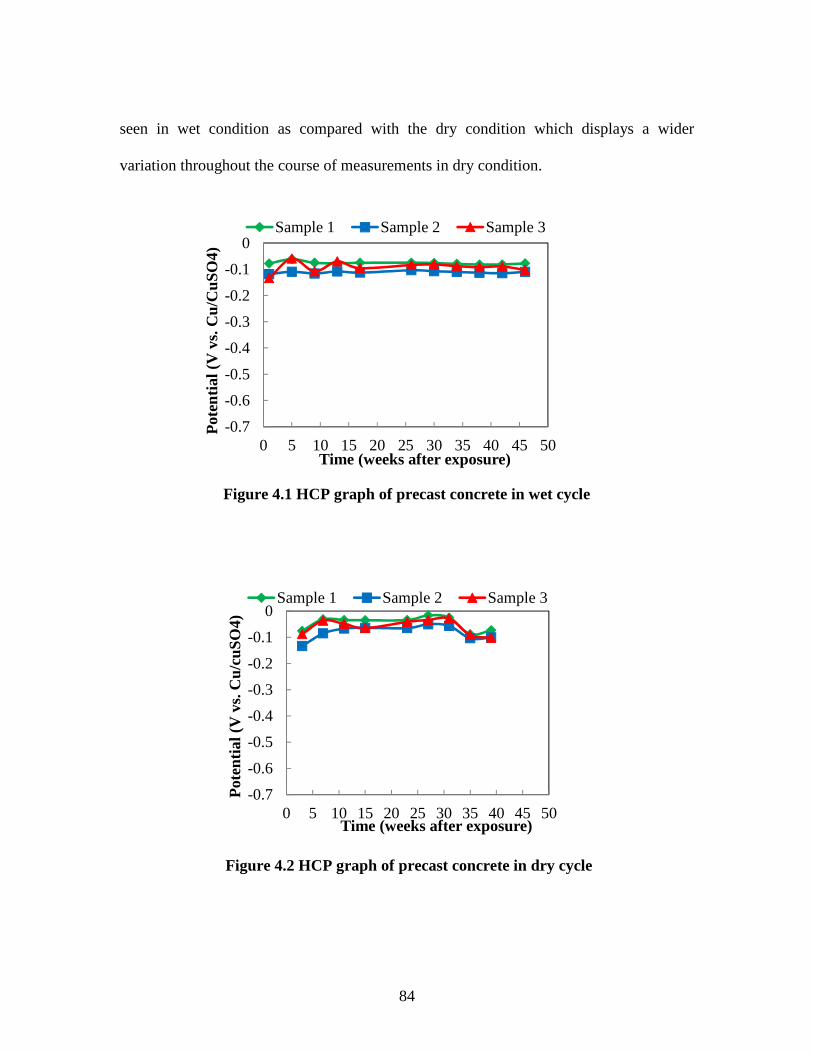
84
seen in wet condition as compared with the dry condition which displays a wider
variation throughout the course of measurements in dry condition.
Figure 4.1 HCP graph of precast concrete in wet cycle
-0.7
-0.6
-0.5
-0.4
-0.3
-0.2
-0.1
0
0 5 10 15 20 25 30 35 40 45 50
Pot
entia
l (V
vs.
Cu/
CuS
O4)
Time (weeks after exposure)
Sample 1 Sample 2 Sample 3
Figure 4.2 HCP graph of precast concrete in dry cycle
-0.7
-0.6
-0.5
-0.4
-0.3
-0.2
-0.1
0
0 5 10 15 20 25 30 35 40 45 50
Pot
entia
l (V
vs.
Cu/
cuS
O4)
Time (weeks after exposure)
Sample 1 Sample 2 Sample 3

85
Linear polarization resistance test results
LPR test was carried out on only sample 2 which was expected to show slightly
higher probability of corrosion activity compare to the other samples based on the HCP
results. LPR test data of sample 2 are presented in Table 4.1.
All the measurements were taken in dry condition. The potentio-dynamic
measurement proceeded as described in Chapter 3. The scan rate in all the cases was
adjusted at 0.166 mV/s. According to the LPR results the rebar is in the active state of
corrosion.
Visual examination (core test)
A complete top rebar was recovered from sample 2 of precast concrete as shown
in Figure 4.3. There were absolutely no traces of corrosion products or corrosion activity
on both the top and bottom part of the rebar along its length. The rebar was in the passive
state and hence the visual test confirms the HCP test results in both conditions whereas it
disapproves the LPR test data. It can be concluded that precast concrete with no cracks is
capable of protecting the rebar from corrosion at least for a period of one year from the
intrusion of chloride ions subjected on its top surface.
Table 4.1 LPR data of precast concrete sample 2
Time (weeks after exposure)icorrosion in A/m2 Condition42 0.01093 Dry43 0.00764 Dry46 0.00763 Dry
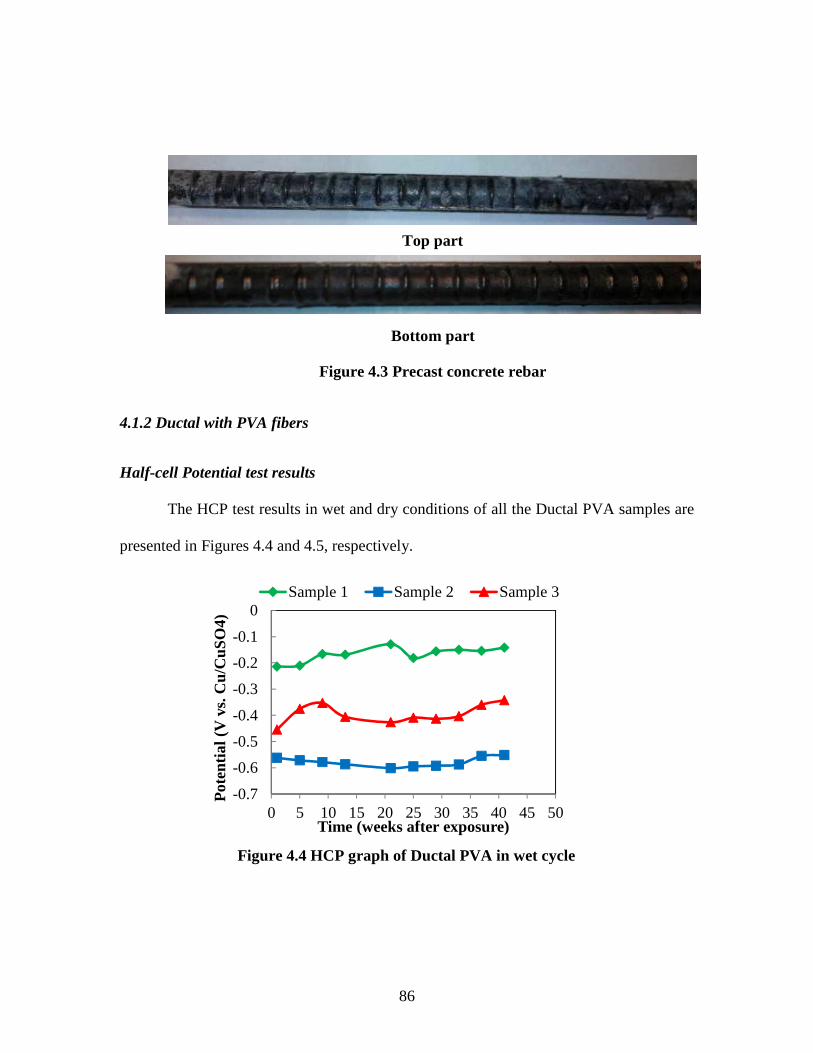
86
4.1.2 Ductal with PVA fibers
Half-cell Potential test results
The HCP test results in wet and dry conditions of all the Ductal PVA samples are
presented in Figures 4.4 and 4.5, respectively.
Top part
Bottom part
Figure 4.3 Precast concrete rebar
Figure 4.4 HCP graph of Ductal PVA in wet cycle
-0.7
-0.6
-0.5
-0.4
-0.3
-0.2
-0.1
0
0 5 10 15 20 25 30 35 40 45 50
Pot
entia
l (V
vs.
Cu/
CuS
O4)
Time (weeks after exposure)
Sample 1 Sample 2 Sample 3
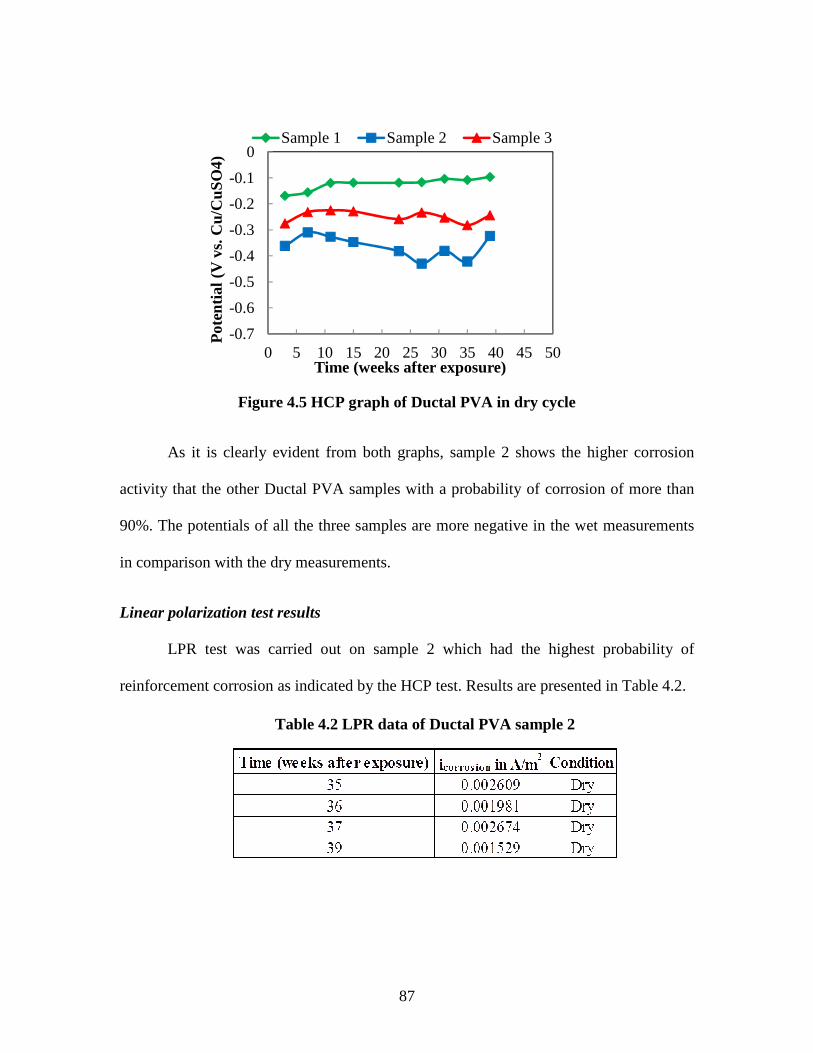
87
As it is clearly evident from both graphs, sample 2 shows the higher corrosion
activity that the other Ductal PVA samples with a probability of corrosion of more than
90%. The potentials of all the three samples are more negative in the wet measurements
in comparison with the dry measurements.
Linear polarization test results
LPR test was carried out on sample 2 which had the highest probability of
reinforcement corrosion as indicated by the HCP test. Results are presented in Table 4.2.
Table 4.2 LPR data of Ductal PVA sample 2
Figure 4.5 HCP graph of Ductal PVA in dry cycle
-0.7
-0.6
-0.5
-0.4
-0.3
-0.2
-0.1
0
0 5 10 15 20 25 30 35 40 45 50
Pot
entia
l (V
vs.
Cu/
CuS
O4)
Time (weeks after exposure)
Sample 1 Sample 2 Sample 3
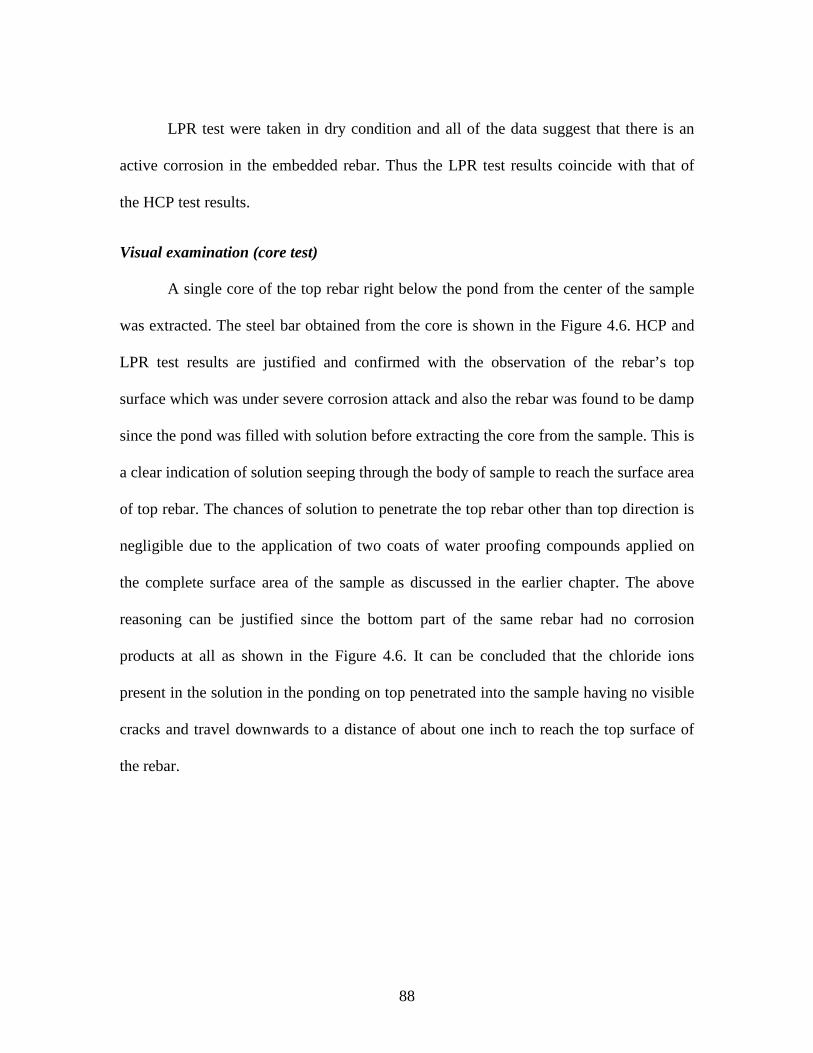
88
LPR test were taken in dry condition and all of the data suggest that there is an
active corrosion in the embedded rebar. Thus the LPR test results coincide with that of
the HCP test results.
Visual examination (core test)
A single core of the top rebar right below the pond from the center of the sample
was extracted. The steel bar obtained from the core is shown in the Figure 4.6. HCP and
LPR test results are justified and confirmed with the observation of the rebar’s top
surface which was under severe corrosion attack and also the rebar was found to be damp
since the pond was filled with solution before extracting the core from the sample. This is
a clear indication of solution seeping through the body of sample to reach the surface area
of top rebar. The chances of solution to penetrate the top rebar other than top direction is
negligible due to the application of two coats of water proofing compounds applied on
the complete surface area of the sample as discussed in the earlier chapter. The above
reasoning can be justified since the bottom part of the same rebar had no corrosion
products at all as shown in the Figure 4.6. It can be concluded that the chloride ions
present in the solution in the ponding on top penetrated into the sample having no visible
cracks and travel downwards to a distance of about one inch to reach the top surface of
the rebar.
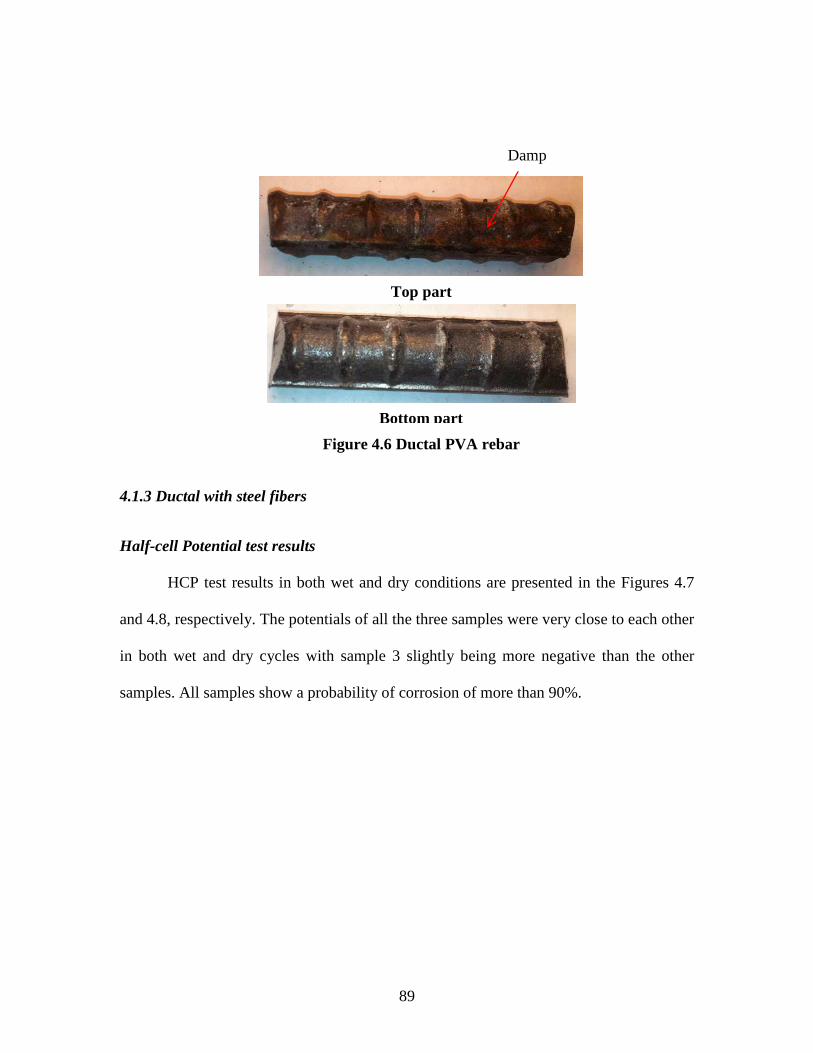
89
4.1.3 Ductal with steel fibers
Half-cell Potential test results
HCP test results in both wet and dry conditions are presented in the Figures 4.7
and 4.8, respectively. The potentials of all the three samples were very close to each other
in both wet and dry cycles with sample 3 slightly being more negative than the other
samples. All samples show a probability of corrosion of more than 90%.
Figure 4.6 Ductal PVA rebar
Top part
Bottom part
Damp

90
Figure 4.7 HCP graph of Ductal Steel in wet cycle
-0.7
-0.6
-0.5
-0.4
-0.3
-0.2
-0.1
0
0 5 10 15 20 25 30 35 40 45 50
Pot
entia
l (V
vs.
Cu/
CuS
O4)
Time (weeks after exposure)
Sample 1 Sample 2 Sample 3
Figure 4.8 HCP graph of Ductal Steel in dry cycle
-0.7
-0.6
-0.5
-0.4
-0.3
-0.2
-0.1
0
0 5 10 15 20 25 30 35 40 45 50
Pot
entia
l (V
vs.
Cu/
CuS
O4)
Time (weeks after exposure)
Sample 1 Sample 2 Sample 3
91
Linear polarization resistance test results
LPR test was carried out on sample 3 of Ductal steel which is supposed to be the
most corrosive of them all as per the HCP test results. LPR test results are presented in
Table 4.3. The LPR test results indicate that the embedded rebar is in passive state and
hence there is no corrosive activity occurring in it.
Visual examination (core test)
Single core was obtained from the center of the sample exactly beneath the pond
to examine the condition of the top rebar as shown in Figure 4.9. No active corrosion was
observed on the rebars. The LPR test results concur with the physical condition of the
rebar. However, HCP test results indicated that there was 90% probability of corrosion.
This could be due to the corrosion of the steel fibers not the embedded steel bar. It seems
that the corrosion of steel fibers does not endanger the structure since corrosion products
of the fibers do not penetrate into the UHPFRC matrix due to its 20 times less
permeability than conventional concrete. Steel fibers will also expand due to corrosion
but due to its small size and the strength of the surrounding matrix (UHPFRC) it will
produce no spall due to internal stresses (Nematollahi et al., 2010).
Table 4.3 LPR data of Ductal Steel sample 3
Time (weeks after exposure)icorrosion in A/m2 Condition35 0.000765 Dry36 0.000771 Dry39 0.000765 Dry
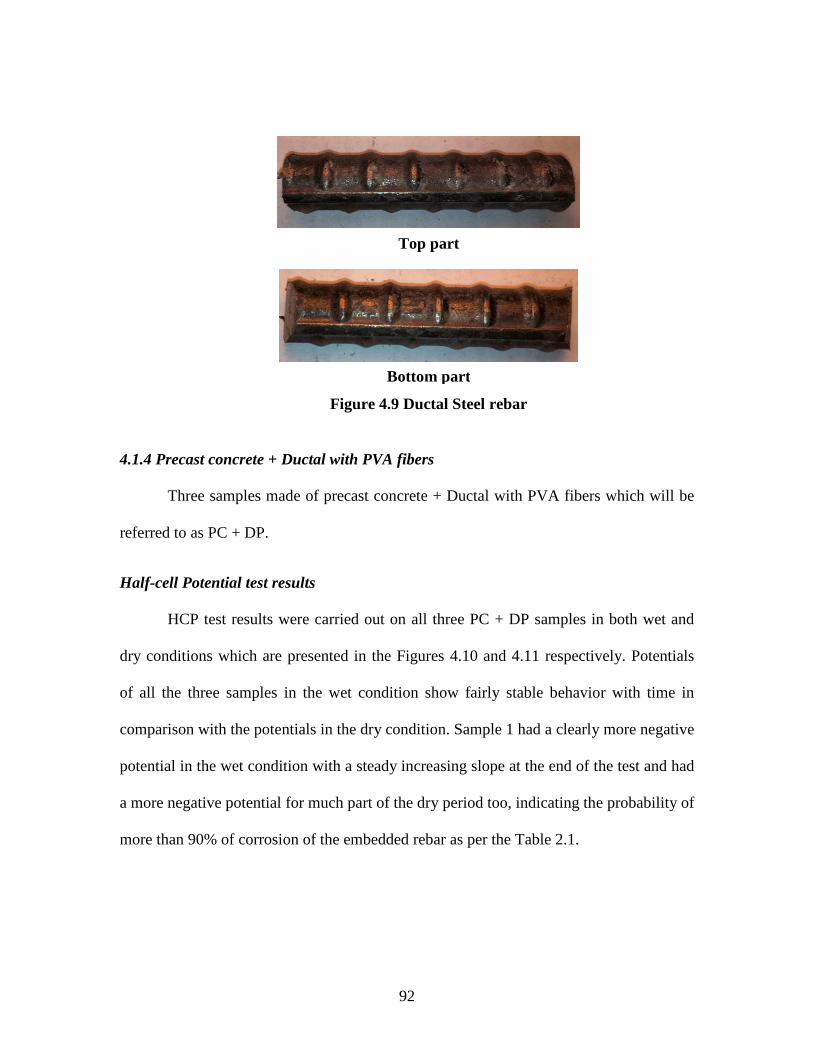
92
4.1.4 Precast concrete + Ductal with PVA fibers
Three samples made of precast concrete + Ductal with PVA fibers which will be
referred to as PC + DP.
Half-cell Potential test results
HCP test results were carried out on all three PC + DP samples in both wet and
dry conditions which are presented in the Figures 4.10 and 4.11 respectively. Potentials
of all the three samples in the wet condition show fairly stable behavior with time in
comparison with the potentials in the dry condition. Sample 1 had a clearly more negative
potential in the wet condition with a steady increasing slope at the end of the test and had
a more negative potential for much part of the dry period too, indicating the probability of
more than 90% of corrosion of the embedded rebar as per the Table 2.1.
Figure 4.9 Ductal Steel rebar
Bottom part
Top part

93
Figure 4.10 HCP graph of PC + DP in wet cycle
-0.7
-0.6
-0.5
-0.4
-0.3
-0.2
-0.1
0
0 5 10 15 20 25 30 35 40 45 50
Pot
entia
l (V
vs.
Cu/
CuS
O4)
Time (weeks after exposure)
Sample 1 Sample 2 Sample 3
Figure 4.11 HCP graph of PC + DP in dry cycle
-0.7
-0.6
-0.5
-0.4
-0.3
-0.2
-0.1
0
0 5 10 15 20 25 30 35 40 45 50
Pot
entia
l (V
vs.
Cu/
CuS
O4)
Time (weeks after exposure)
Sample 1 Sample 2 Sample 3
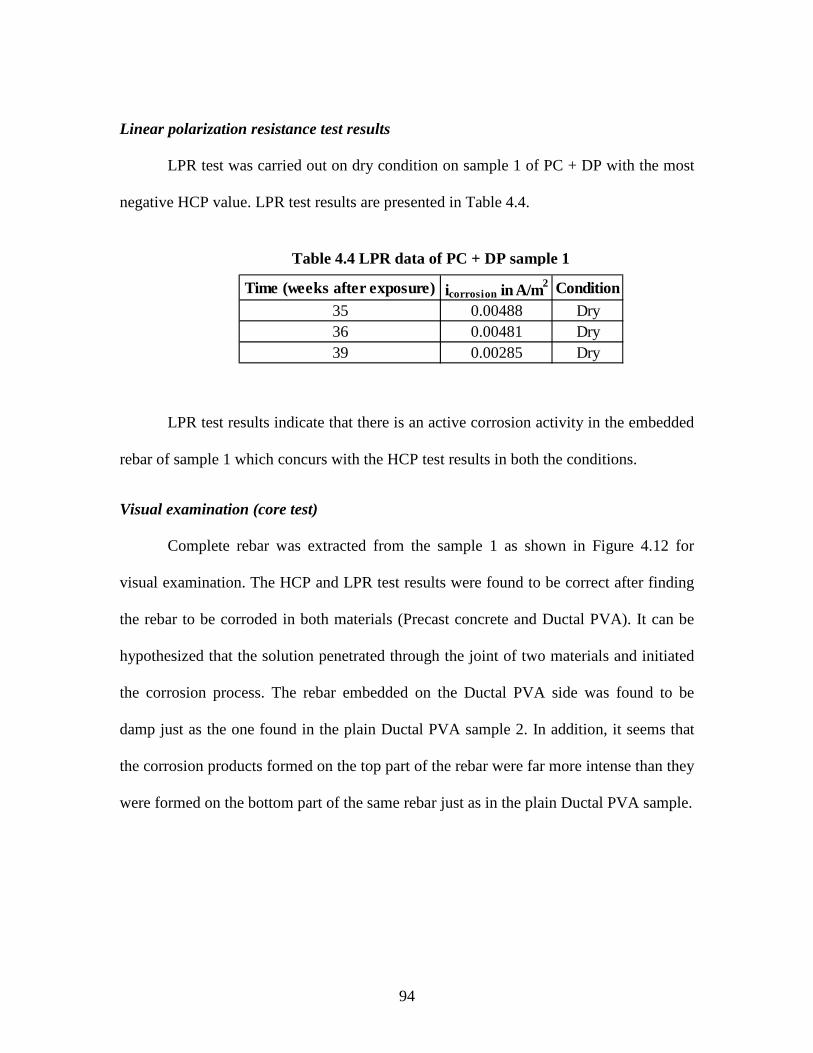
94
Linear polarization resistance test results
LPR test was carried out on dry condition on sample 1 of PC + DP with the most
negative HCP value. LPR test results are presented in Table 4.4.
LPR test results indicate that there is an active corrosion activity in the embedded
rebar of sample 1 which concurs with the HCP test results in both the conditions.
Visual examination (core test)
Complete rebar was extracted from the sample 1 as shown in Figure 4.12 for
visual examination. The HCP and LPR test results were found to be correct after finding
the rebar to be corroded in both materials (Precast concrete and Ductal PVA). It can be
hypothesized that the solution penetrated through the joint of two materials and initiated
the corrosion process. The rebar embedded on the Ductal PVA side was found to be
damp just as the one found in the plain Ductal PVA sample 2. In addition, it seems that
the corrosion products formed on the top part of the rebar were far more intense than they
were formed on the bottom part of the same rebar just as in the plain Ductal PVA sample.
Table 4.4 LPR data of PC + DP sample 1
Time (weeks after exposure)icorrosion in A/m2 Condition35 0.00488 Dry36 0.00481 Dry39 0.00285 Dry
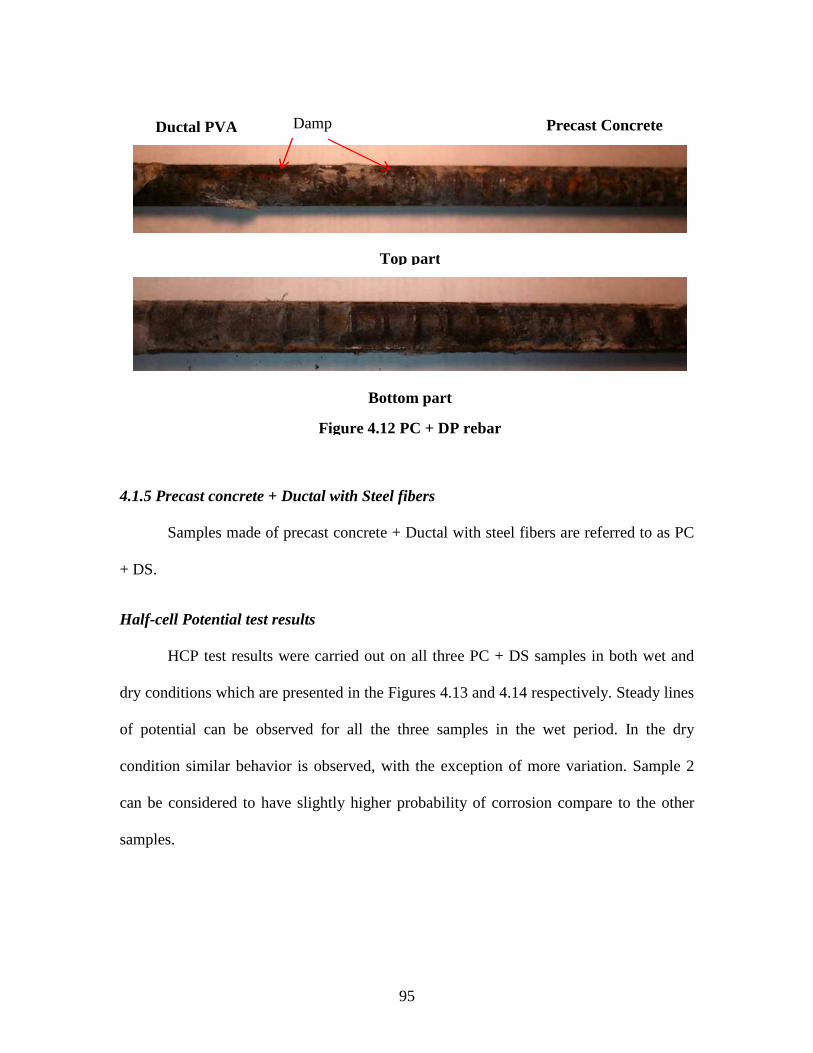
95
4.1.5 Precast concrete + Ductal with Steel fibers
Samples made of precast concrete + Ductal with steel fibers are referred to as PC
+ DS.
Half-cell Potential test results
HCP test results were carried out on all three PC + DS samples in both wet and
dry conditions which are presented in the Figures 4.13 and 4.14 respectively. Steady lines
of potential can be observed for all the three samples in the wet period. In the dry
condition similar behavior is observed, with the exception of more variation. Sample 2
can be considered to have slightly higher probability of corrosion compare to the other
samples.
Top part
Bottom part
Figure 4.12 PC + DP rebar
Ductal PVA Damp Precast Concrete Side
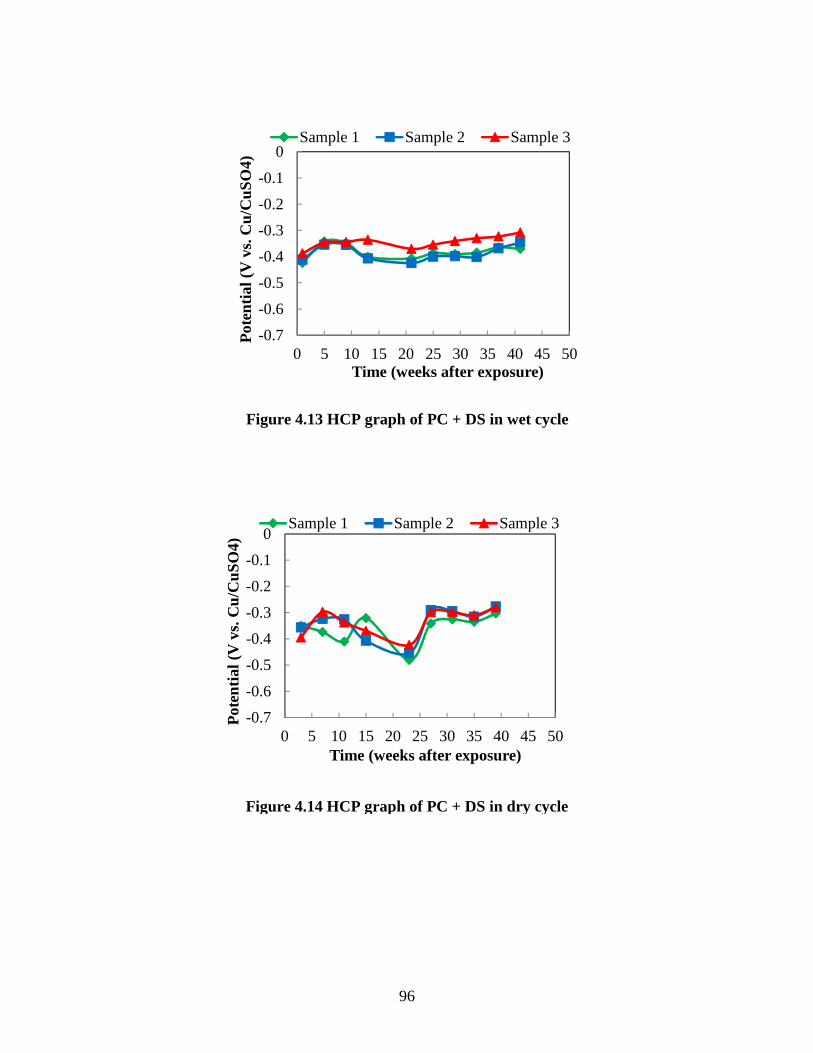
96
Figure 4.13 HCP graph of PC + DS in wet cycle
-0.7
-0.6
-0.5
-0.4
-0.3
-0.2
-0.1
0
0 5 10 15 20 25 30 35 40 45 50
Pot
entia
l (V
vs.
Cu/
CuS
O4)
Time (weeks after exposure)
Sample 1 Sample 2 Sample 3
Figure 4.14 HCP graph of PC + DS in dry cycle
-0.7
-0.6
-0.5
-0.4
-0.3
-0.2
-0.1
0
0 5 10 15 20 25 30 35 40 45 50
Pot
entia
l (V
vs.
Cu/
CuS
O4)
Time (weeks after exposure)
Sample 1 Sample 2 Sample 3

97
Linear polarization test results
LPR test was carried out on sample 2 of PC + DS and the results are presented in
Table 4.5. Comparison between values of Table 4.5 and Figures 4.13 and 4.14, shows
that the LPR test results coincide with those obtained from the HCP test.
Visual examination (core test)
Three cores from each part of the sample were extracted; from Ductal Steel (A),
from the interface (B) and from precast concrete (C). Rebars extracted from the cores are
shown in Figure 4.15, 4.16 and 4.17. Visual examination of the rebars confirms both the
LPR and HCP test results. There was corrosion on the top part of the rebar found at the
interface but no corrosion at the bottom part. Hence the solution must have penetrated
through the joint between the two materials; precast concrete and Ductal steel.
Figure 4.15 Sample A
Top part
Bottom part
Table 4.5 LPR data of PC + DS sample 2
Time (weeks after exposure)icorrosion in A/m2 Condition35 0.002147 Dry36 0.001951 Dry39 0.001892 Dry
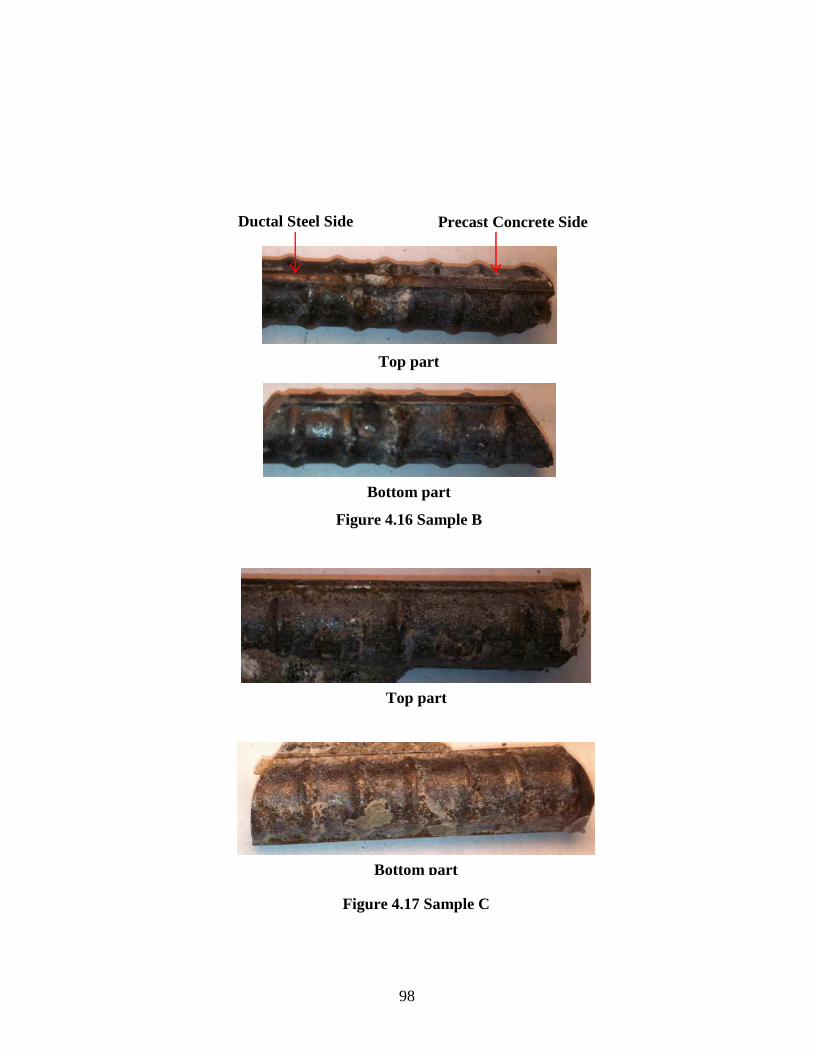
98
Figure 4.17 Sample C
Top part
Bottom part
Figure 4.16 Sample B
Top part
Bottom part
Ductal Steel Side Precast Concrete Side
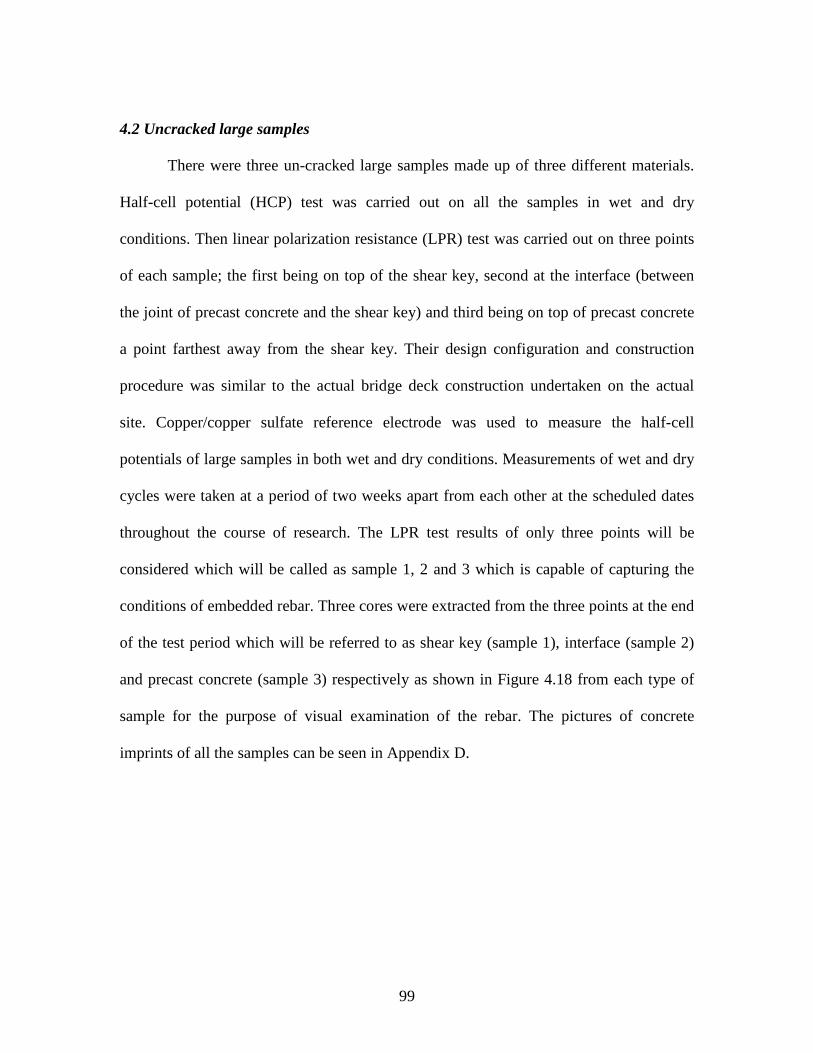
99
4.2 Uncracked large samples
There were three un-cracked large samples made up of three different materials.
Half-cell potential (HCP) test was carried out on all the samples in wet and dry
conditions. Then linear polarization resistance (LPR) test was carried out on three points
of each sample; the first being on top of the shear key, second at the interface (between
the joint of precast concrete and the shear key) and third being on top of precast concrete
a point farthest away from the shear key. Their design configuration and construction
procedure was similar to the actual bridge deck construction undertaken on the actual
site. Copper/copper sulfate reference electrode was used to measure the half-cell
potentials of large samples in both wet and dry conditions. Measurements of wet and dry
cycles were taken at a period of two weeks apart from each other at the scheduled dates
throughout the course of research. The LPR test results of only three points will be
considered which will be called as sample 1, 2 and 3 which is capable of capturing the
conditions of embedded rebar. Three cores were extracted from the three points at the end
of the test period which will be referred to as shear key (sample 1), interface (sample 2)
and precast concrete (sample 3) respectively as shown in Figure 4.18 from each type of
sample for the purpose of visual examination of the rebar. The pictures of concrete
imprints of all the samples can be seen in Appendix D.
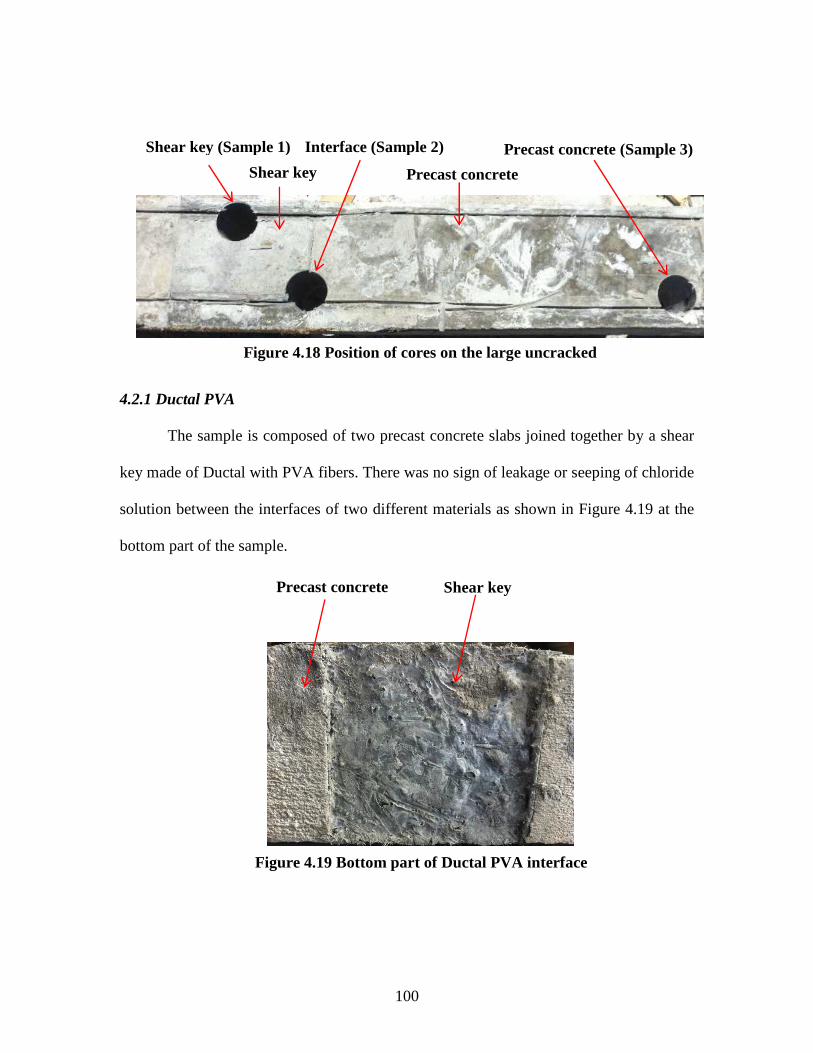
100
4.2.1 Ductal PVA
The sample is composed of two precast concrete slabs joined together by a shear
key made of Ductal with PVA fibers. There was no sign of leakage or seeping of chloride
solution between the interfaces of two different materials as shown in Figure 4.19 at the
bottom part of the sample.
Figure 4.18 Position of cores on the large uncracked samples
Shear key (Sample 1) Interface (Sample 2) Precast concrete (Sample 3)
Precast concrete Shear key
Figure 4.19 Bottom part of Ductal PVA interface
Shear key Precast concrete
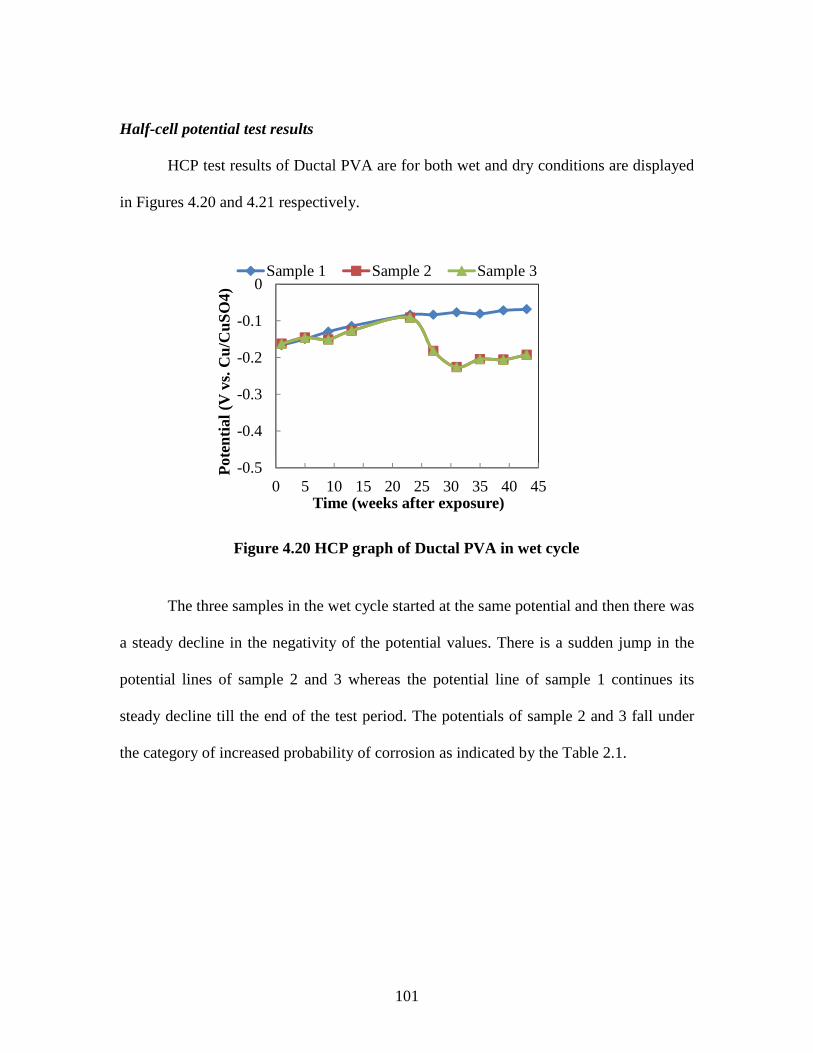
101
Half-cell potential test results
HCP test results of Ductal PVA are for both wet and dry conditions are displayed
in Figures 4.20 and 4.21 respectively.
The three samples in the wet cycle started at the same potential and then there was
a steady decline in the negativity of the potential values. There is a sudden jump in the
potential lines of sample 2 and 3 whereas the potential line of sample 1 continues its
steady decline till the end of the test period. The potentials of sample 2 and 3 fall under
the category of increased probability of corrosion as indicated by the Table 2.1.
Figure 4.20 HCP graph of Ductal PVA in wet cycle
-0.5
-0.4
-0.3
-0.2
-0.1
0
0 5 10 15 20 25 30 35 40 45
Pot
entia
l (V
vs.
Cu/
CuS
O4)
Time (weeks after exposure)
Sample 1 Sample 2 Sample 3
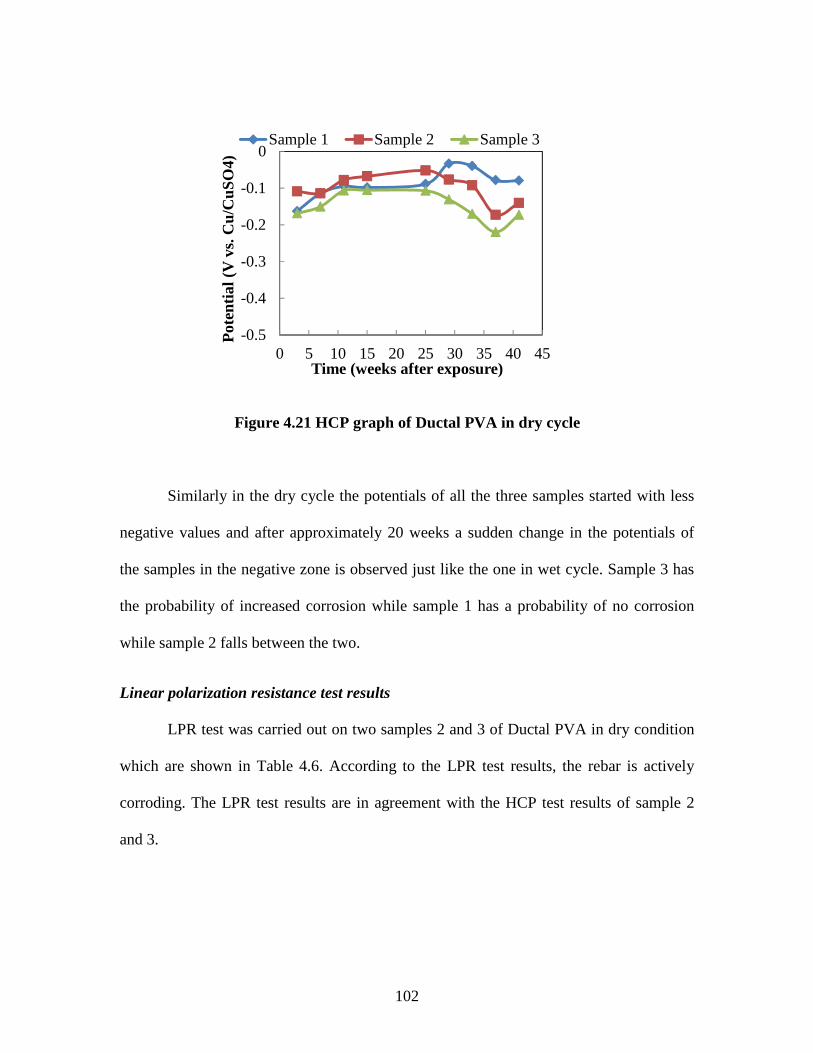
102
Similarly in the dry cycle the potentials of all the three samples started with less
negative values and after approximately 20 weeks a sudden change in the potentials of
the samples in the negative zone is observed just like the one in wet cycle. Sample 3 has
the probability of increased corrosion while sample 1 has a probability of no corrosion
while sample 2 falls between the two.
Linear polarization resistance test results
LPR test was carried out on two samples 2 and 3 of Ductal PVA in dry condition
which are shown in Table 4.6. According to the LPR test results, the rebar is actively
corroding. The LPR test results are in agreement with the HCP test results of sample 2
and 3.
Figure 4.21 HCP graph of Ductal PVA in dry cycle
-0.5
-0.4
-0.3
-0.2
-0.1
0
0 5 10 15 20 25 30 35 40 45
Pot
entia
l (V
vs.
Cu/
CuS
O4)
Time (weeks after exposure)
Sample 1 Sample 2 Sample 3
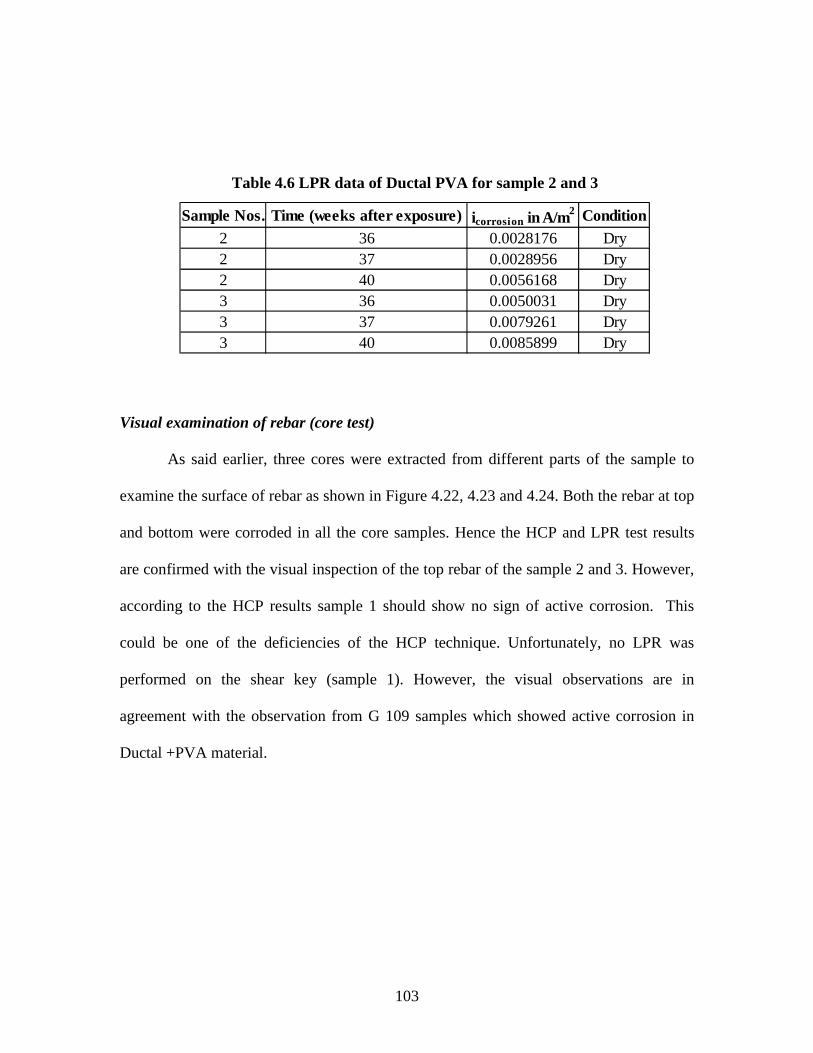
103
Visual examination of rebar (core test)
As said earlier, three cores were extracted from different parts of the sample to
examine the surface of rebar as shown in Figure 4.22, 4.23 and 4.24. Both the rebar at top
and bottom were corroded in all the core samples. Hence the HCP and LPR test results
are confirmed with the visual inspection of the top rebar of the sample 2 and 3. However,
according to the HCP results sample 1 should show no sign of active corrosion. This
could be one of the deficiencies of the HCP technique. Unfortunately, no LPR was
performed on the shear key (sample 1). However, the visual observations are in
agreement with the observation from G 109 samples which showed active corrosion in
Ductal +PVA material.
Table 4.6 LPR data of Ductal PVA for sample 2 and 3
Sample Nos.Time (weeks after exposure)icorrosion in A/m2 Condition2 36 0.0028176 Dry2 37 0.0028956 Dry2 40 0.0056168 Dry3 36 0.0050031 Dry3 37 0.0079261 Dry3 40 0.0085899 Dry

104
Top part
Bottom part
Figure 4.22 Top rebar of shear key (sample 1)
Top part
Bottom part
Figure 4.23 Top rebar of sample 2
Ductal PVA Side Precast Concrete Side
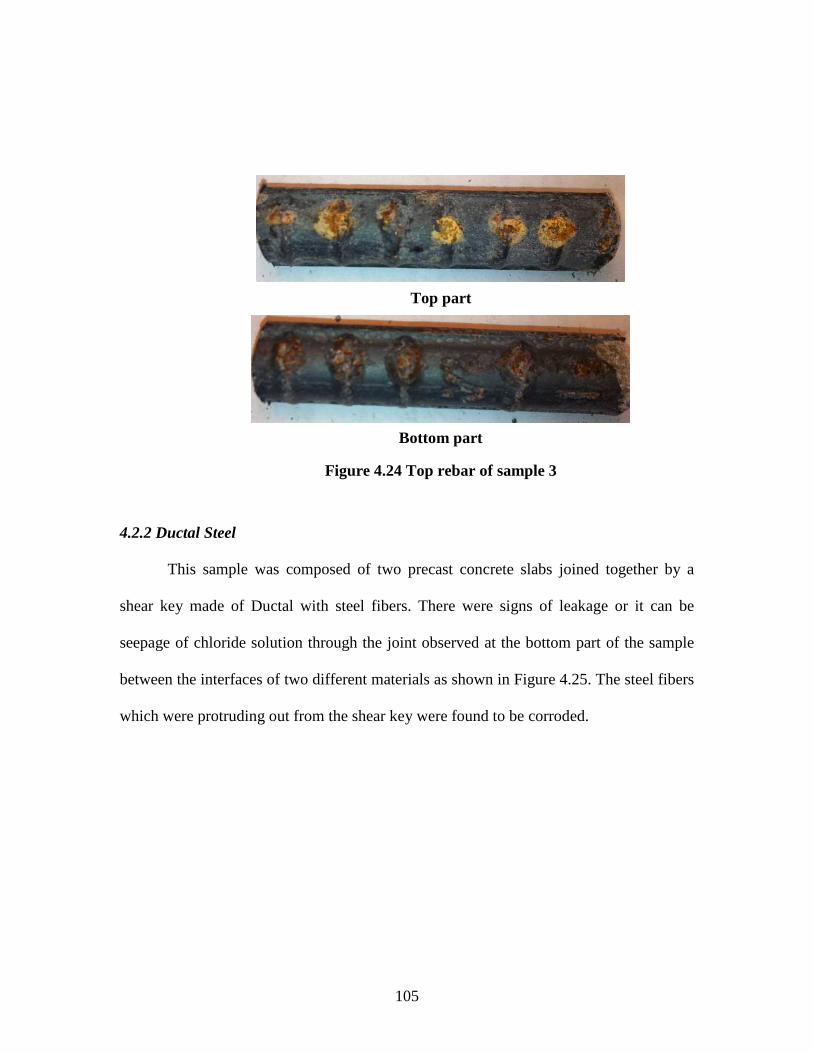
105
4.2.2 Ductal Steel
This sample was composed of two precast concrete slabs joined together by a
shear key made of Ductal with steel fibers. There were signs of leakage or it can be
seepage of chloride solution through the joint observed at the bottom part of the sample
between the interfaces of two different materials as shown in Figure 4.25. The steel fibers
which were protruding out from the shear key were found to be corroded.
Top part
Bottom part
Figure 4.24 Top rebar of sample 3
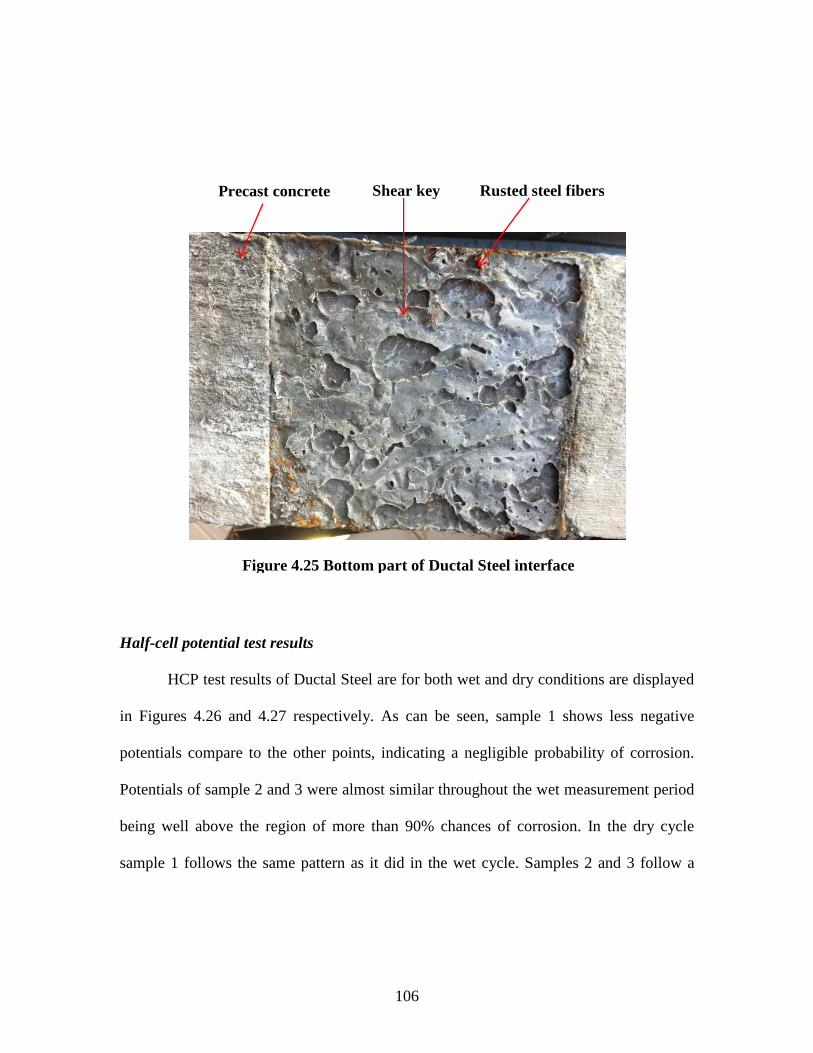
106
Half-cell potential test results
HCP test results of Ductal Steel are for both wet and dry conditions are displayed
in Figures 4.26 and 4.27 respectively. As can be seen, sample 1 shows less negative
potentials compare to the other points, indicating a negligible probability of corrosion.
Potentials of sample 2 and 3 were almost similar throughout the wet measurement period
being well above the region of more than 90% chances of corrosion. In the dry cycle
sample 1 follows the same pattern as it did in the wet cycle. Samples 2 and 3 follow a
Figure 4.25 Bottom part of Ductal Steel interface
Shear key Precast concrete Rusted steel fibers
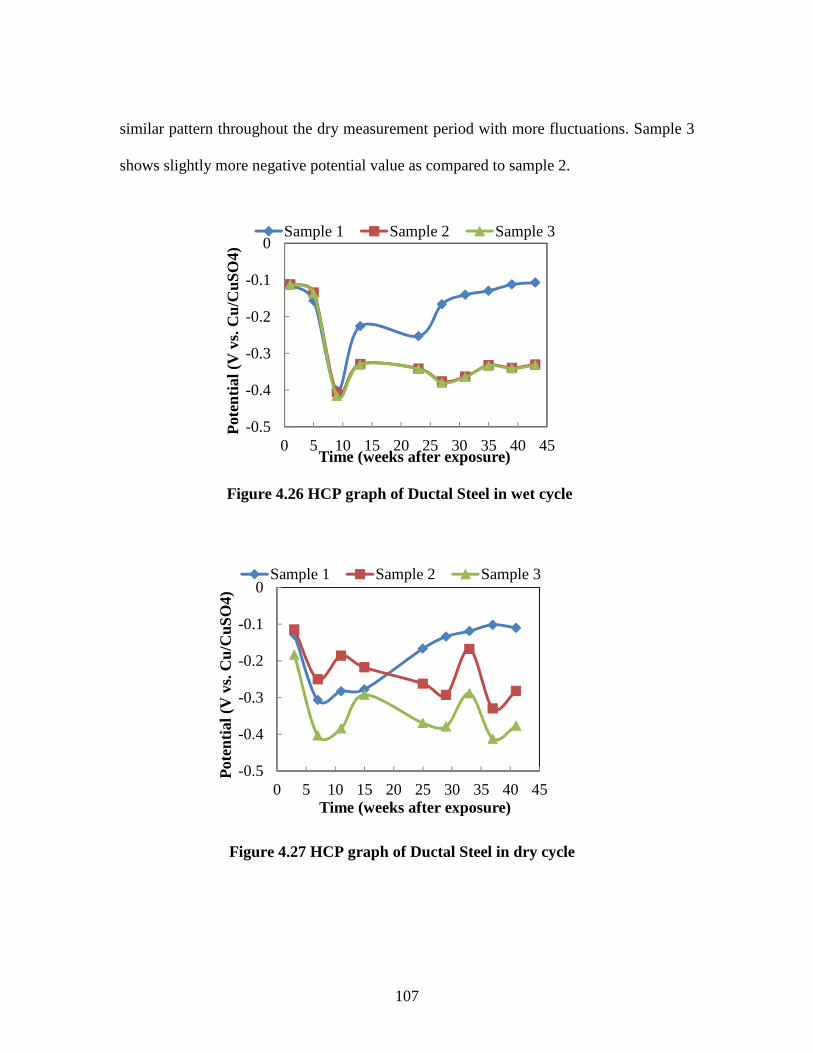
107
similar pattern throughout the dry measurement period with more fluctuations. Sample 3
shows slightly more negative potential value as compared to sample 2.
Figure 4.26 HCP graph of Ductal Steel in wet cycle
-0.5
-0.4
-0.3
-0.2
-0.1
0
0 5 10 15 20 25 30 35 40 45
Pot
entia
l (V
vs.
Cu/
CuS
O4)
Time (weeks after exposure)
Sample 1 Sample 2 Sample 3
Figure 4.27 HCP graph of Ductal Steel in dry cycle
-0.5
-0.4
-0.3
-0.2
-0.1
0
0 5 10 15 20 25 30 35 40 45
Pot
entia
l (V
vs.
Cu/
CuS
O4)
Time (weeks after exposure)
Sample 1 Sample 2 Sample 3
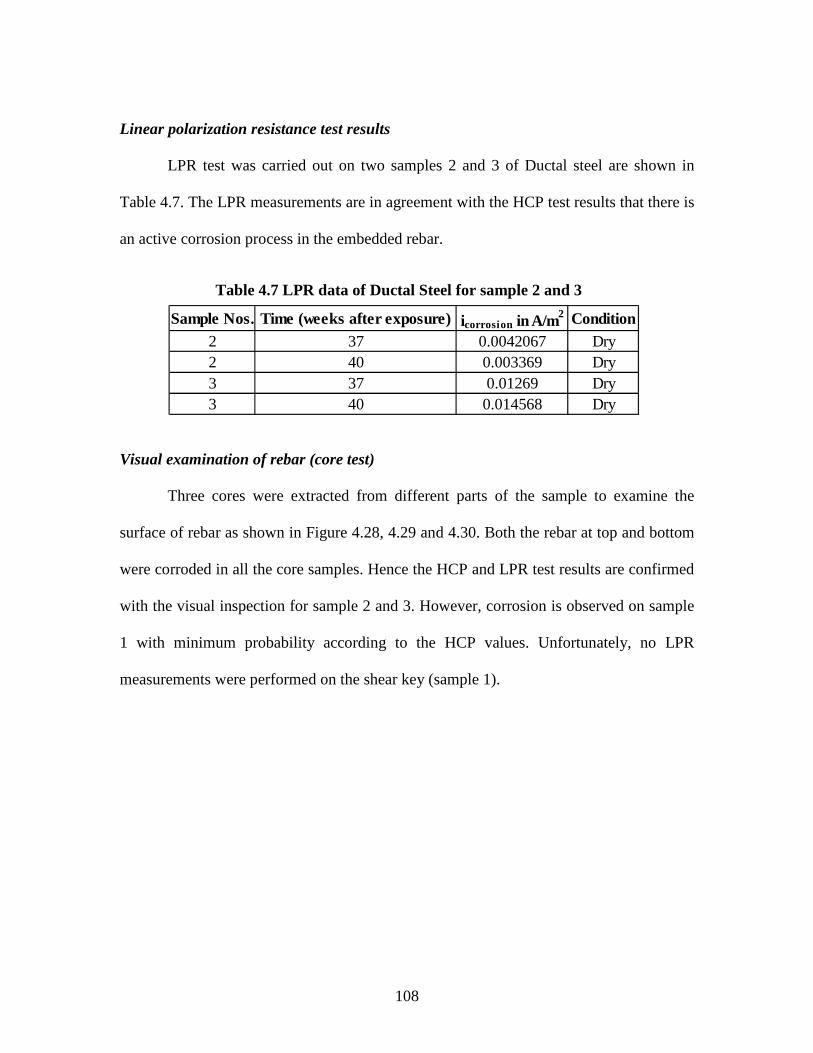
108
Linear polarization resistance test results
LPR test was carried out on two samples 2 and 3 of Ductal steel are shown in
Table 4.7. The LPR measurements are in agreement with the HCP test results that there is
an active corrosion process in the embedded rebar.
Visual examination of rebar (core test)
Three cores were extracted from different parts of the sample to examine the
surface of rebar as shown in Figure 4.28, 4.29 and 4.30. Both the rebar at top and bottom
were corroded in all the core samples. Hence the HCP and LPR test results are confirmed
with the visual inspection for sample 2 and 3. However, corrosion is observed on sample
1 with minimum probability according to the HCP values. Unfortunately, no LPR
measurements were performed on the shear key (sample 1).
Table 4.7 LPR data of Ductal Steel for sample 2 and 3
Sample Nos.Time (weeks after exposure)icorrosion in A/m2 Condition2 37 0.0042067 Dry2 40 0.003369 Dry3 37 0.01269 Dry3 40 0.014568 Dry
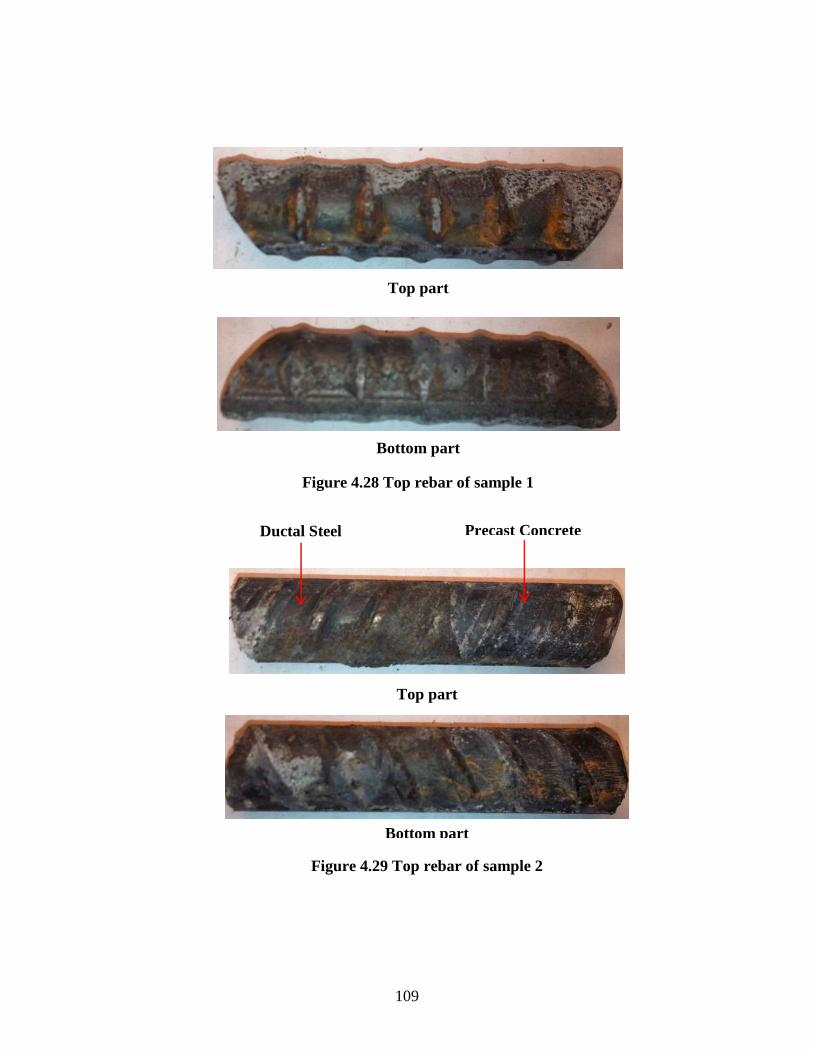
109
Top part
Bottom part
Figure 4.28 Top rebar of sample 1
Top part
Bottom part
Figure 4.29 Top rebar of sample 2
Ductal Steel Precast Concrete
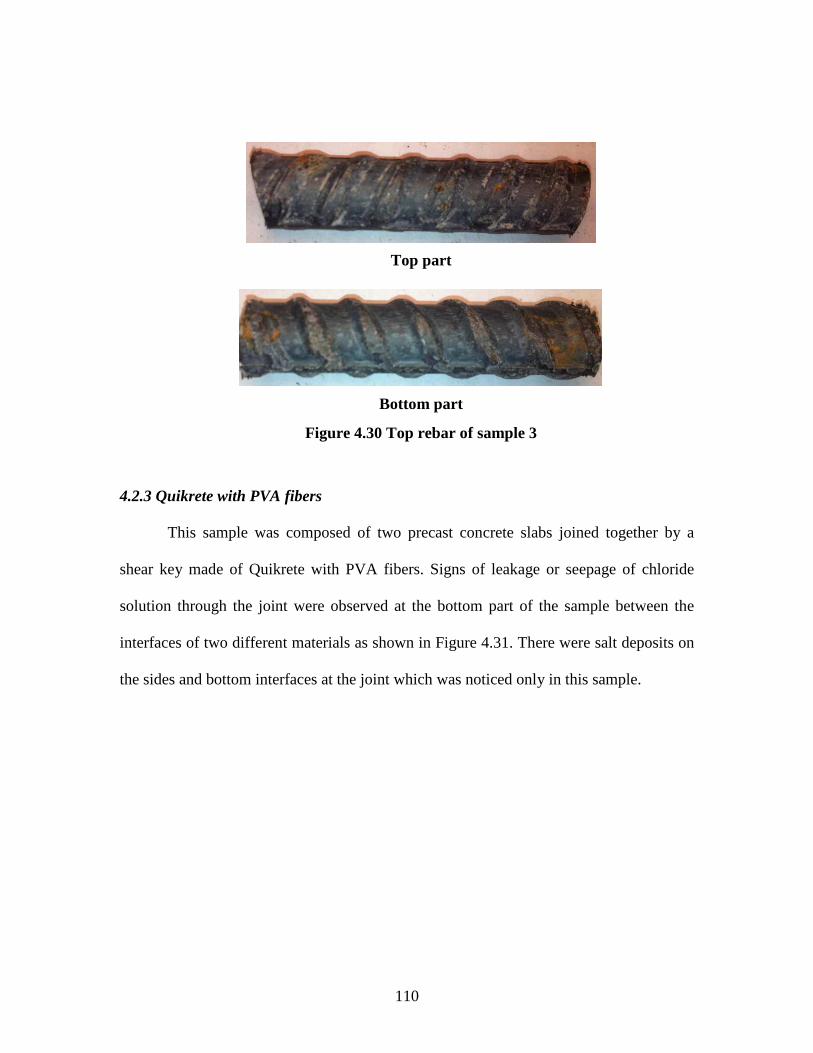
110
4.2.3 Quikrete with PVA fibers
This sample was composed of two precast concrete slabs joined together by a
shear key made of Quikrete with PVA fibers. Signs of leakage or seepage of chloride
solution through the joint were observed at the bottom part of the sample between the
interfaces of two different materials as shown in Figure 4.31. There were salt deposits on
the sides and bottom interfaces at the joint which was noticed only in this sample.
Top part
Bottom part
Figure 4.30 Top rebar of sample 3
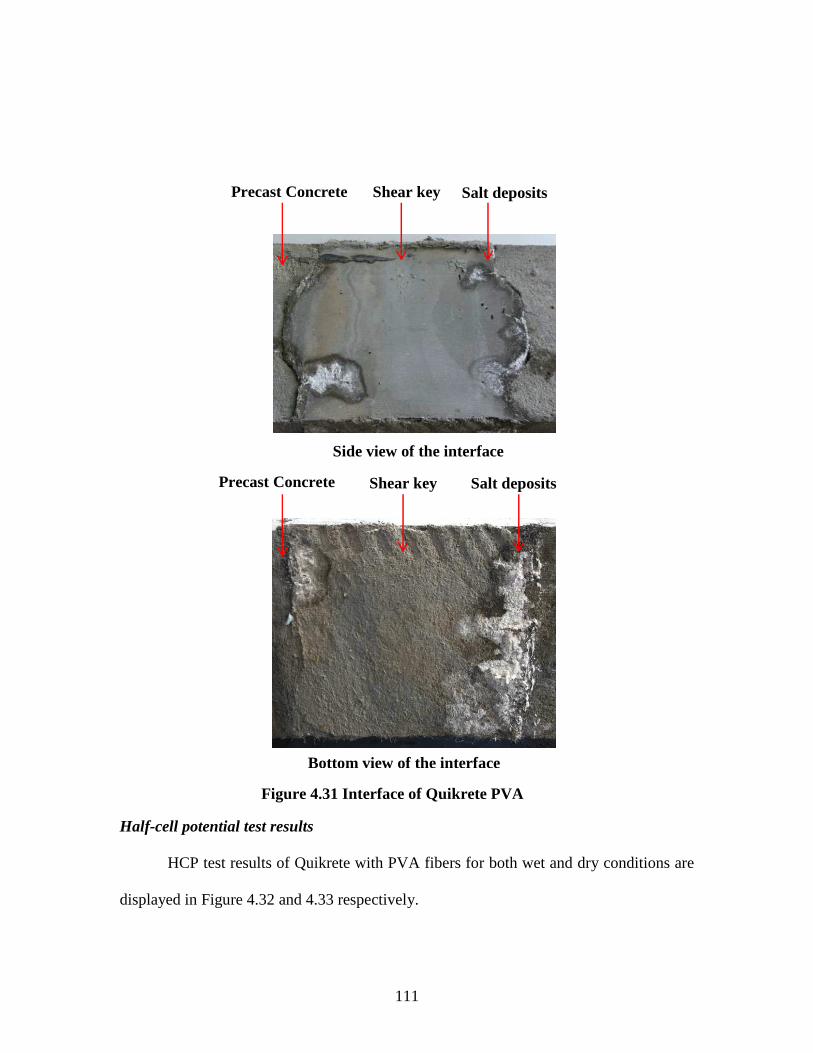
111
Half-cell potential test results
HCP test results of Quikrete with PVA fibers for both wet and dry conditions are
displayed in Figure 4.32 and 4.33 respectively.
Side view of the interface
Shear key Precast Concrete Salt deposits
Figure 4.31 Interface of Quikrete PVA
Bottom view of the interface
Precast Concrete Shear key Salt deposits

112
Figure 4.32 HCP graph of Quikrete PVA in wet cycle
-0.5
-0.4
-0.3
-0.2
-0.1
0
0 5 10 15 20 25 30 35 40 45
Pot
entia
l (V
vs.
Cu/
CuS
O4)
Time (weeks after exposure)
Sample 1 Sample 2 Sample 3
Figure 4.33 HCP graph of Quikrete PVA in dry cycle
-0.5
-0.4
-0.3
-0.2
-0.1
0
0 5 10 15 20 25 30 35 40 45
Pot
entia
l (V
vs.
Cu/
CuS
O4)
Time (weeks after exposure)
Sample 1 Sample 2 Sample 3
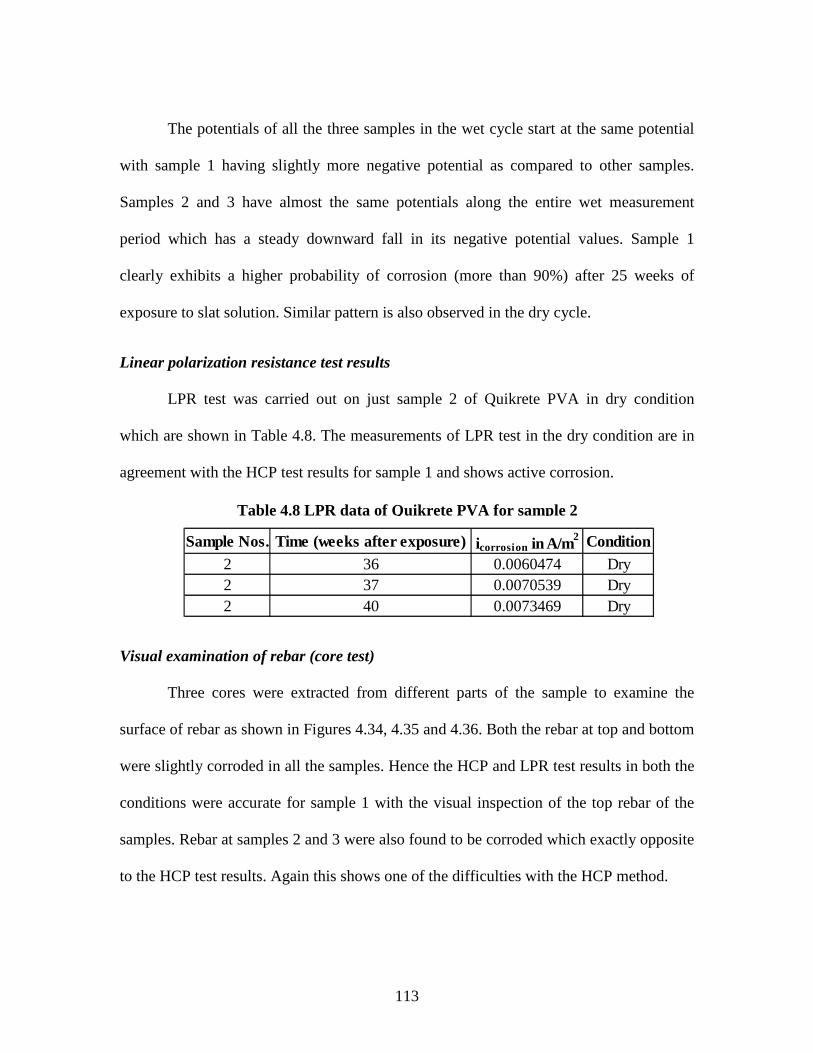
113
The potentials of all the three samples in the wet cycle start at the same potential
with sample 1 having slightly more negative potential as compared to other samples.
Samples 2 and 3 have almost the same potentials along the entire wet measurement
period which has a steady downward fall in its negative potential values. Sample 1
clearly exhibits a higher probability of corrosion (more than 90%) after 25 weeks of
exposure to slat solution. Similar pattern is also observed in the dry cycle.
Linear polarization resistance test results
LPR test was carried out on just sample 2 of Quikrete PVA in dry condition
which are shown in Table 4.8. The measurements of LPR test in the dry condition are in
agreement with the HCP test results for sample 1 and shows active corrosion.
Visual examination of rebar (core test)
Three cores were extracted from different parts of the sample to examine the
surface of rebar as shown in Figures 4.34, 4.35 and 4.36. Both the rebar at top and bottom
were slightly corroded in all the samples. Hence the HCP and LPR test results in both the
conditions were accurate for sample 1 with the visual inspection of the top rebar of the
samples. Rebar at samples 2 and 3 were also found to be corroded which exactly opposite
to the HCP test results. Again this shows one of the difficulties with the HCP method.
Table 4.8 LPR data of Quikrete PVA for sample 2
Sample Nos.Time (weeks after exposure)icorrosion in A/m2 Condition2 36 0.0060474 Dry2 37 0.0070539 Dry2 40 0.0073469 Dry
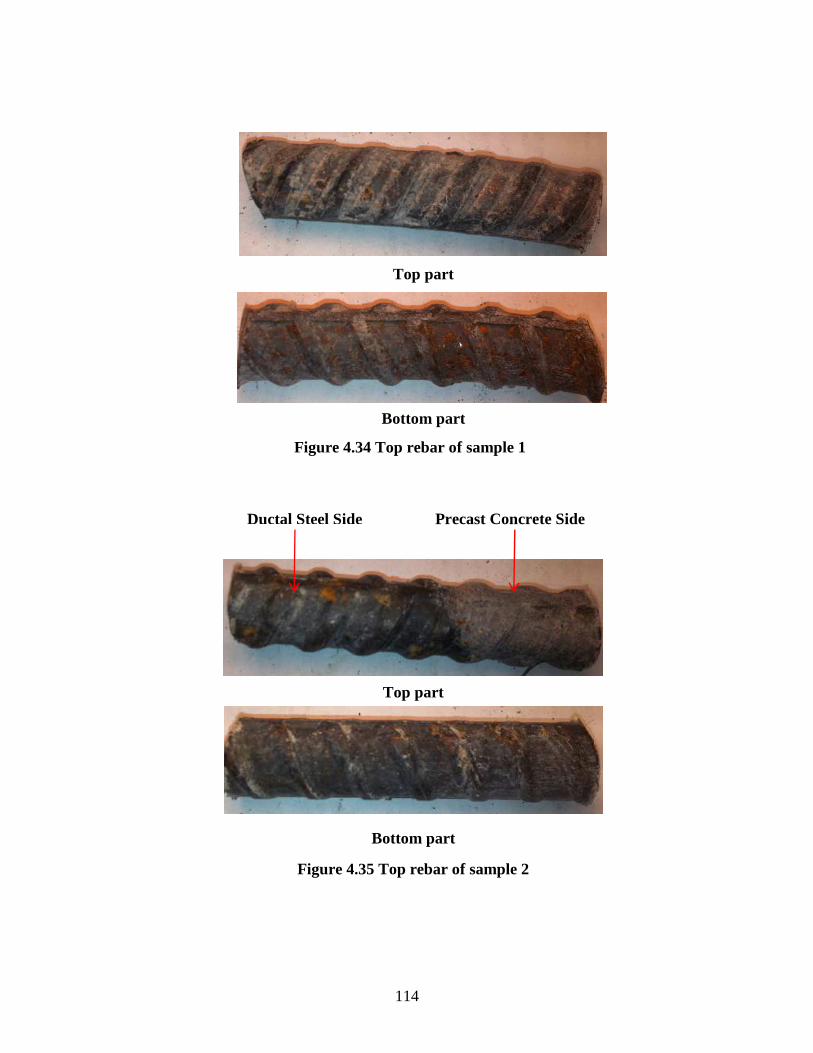
114
Top part
Bottom part
Figure 4.34 Top rebar of sample 1
Top part
Bottom part
Figure 4.35 Top rebar of sample 2
Ductal Steel Side Precast Concrete Side
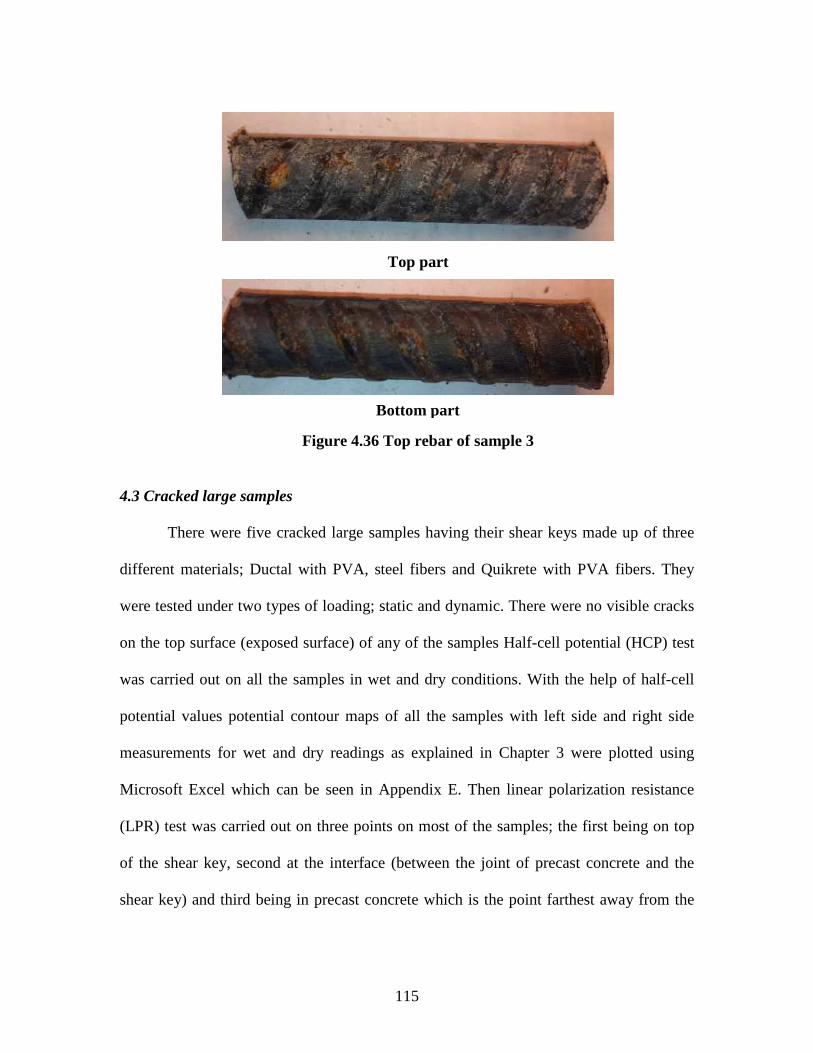
115
4.3 Cracked large samples
There were five cracked large samples having their shear keys made up of three
different materials; Ductal with PVA, steel fibers and Quikrete with PVA fibers. They
were tested under two types of loading; static and dynamic. There were no visible cracks
on the top surface (exposed surface) of any of the samples Half-cell potential (HCP) test
was carried out on all the samples in wet and dry conditions. With the help of half-cell
potential values potential contour maps of all the samples with left side and right side
measurements for wet and dry readings as explained in Chapter 3 were plotted using
Microsoft Excel which can be seen in Appendix E. Then linear polarization resistance
(LPR) test was carried out on three points on most of the samples; the first being on top
of the shear key, second at the interface (between the joint of precast concrete and the
shear key) and third being in precast concrete which is the point farthest away from the
Top part
Bottom part
Figure 4.36 Top rebar of sample 3
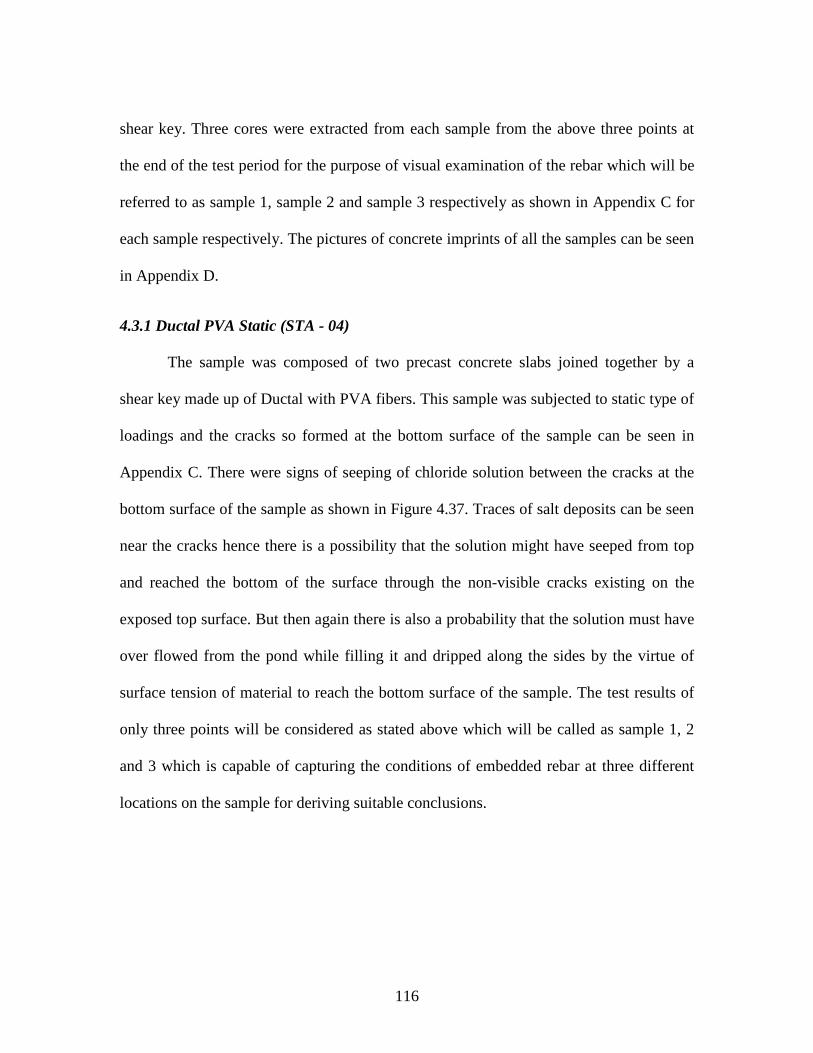
116
shear key. Three cores were extracted from each sample from the above three points at
the end of the test period for the purpose of visual examination of the rebar which will be
referred to as sample 1, sample 2 and sample 3 respectively as shown in Appendix C for
each sample respectively. The pictures of concrete imprints of all the samples can be seen
in Appendix D.
4.3.1 Ductal PVA Static (STA - 04)
The sample was composed of two precast concrete slabs joined together by a
shear key made up of Ductal with PVA fibers. This sample was subjected to static type of
loadings and the cracks so formed at the bottom surface of the sample can be seen in
Appendix C. There were signs of seeping of chloride solution between the cracks at the
bottom surface of the sample as shown in Figure 4.37. Traces of salt deposits can be seen
near the cracks hence there is a possibility that the solution might have seeped from top
and reached the bottom of the surface through the non-visible cracks existing on the
exposed top surface. But then again there is also a probability that the solution must have
over flowed from the pond while filling it and dripped along the sides by the virtue of
surface tension of material to reach the bottom surface of the sample. The test results of
only three points will be considered as stated above which will be called as sample 1, 2
and 3 which is capable of capturing the conditions of embedded rebar at three different
locations on the sample for deriving suitable conclusions.
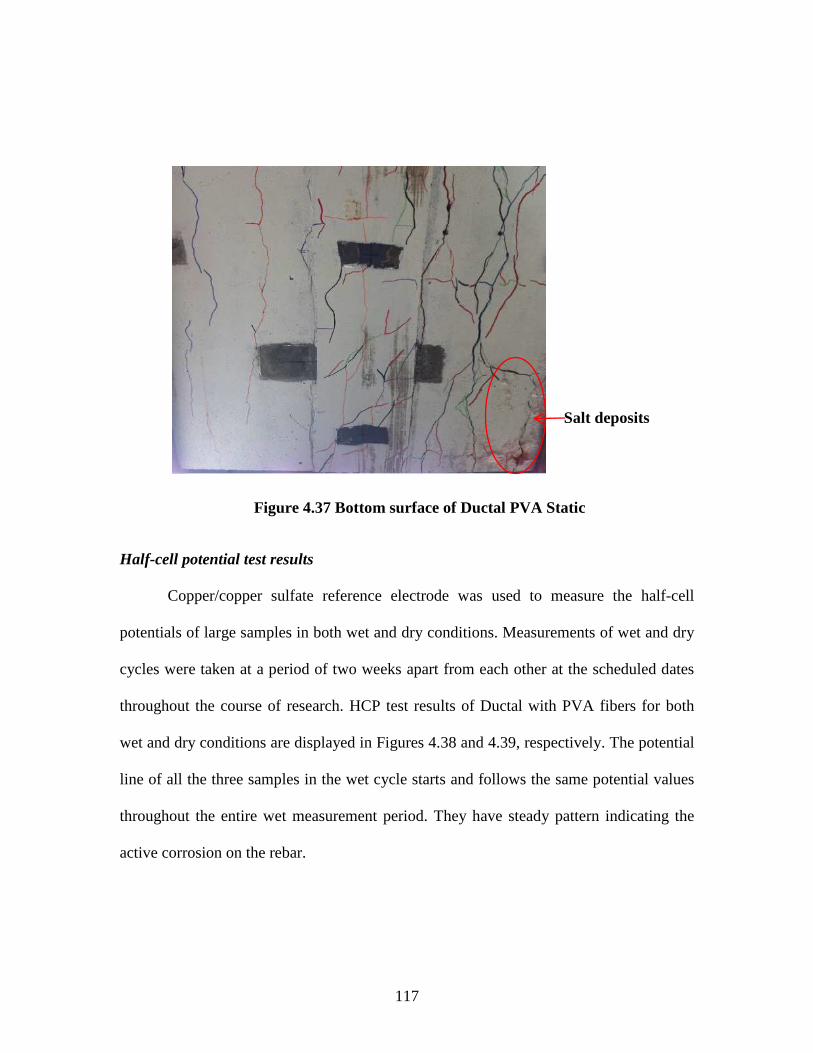
117
Half-cell potential test results
Copper/copper sulfate reference electrode was used to measure the half-cell
potentials of large samples in both wet and dry conditions. Measurements of wet and dry
cycles were taken at a period of two weeks apart from each other at the scheduled dates
throughout the course of research. HCP test results of Ductal with PVA fibers for both
wet and dry conditions are displayed in Figures 4.38 and 4.39, respectively. The potential
line of all the three samples in the wet cycle starts and follows the same potential values
throughout the entire wet measurement period. They have steady pattern indicating the
active corrosion on the rebar.
Figure 4.37 Bottom surface of Ductal PVA Static
Salt deposits
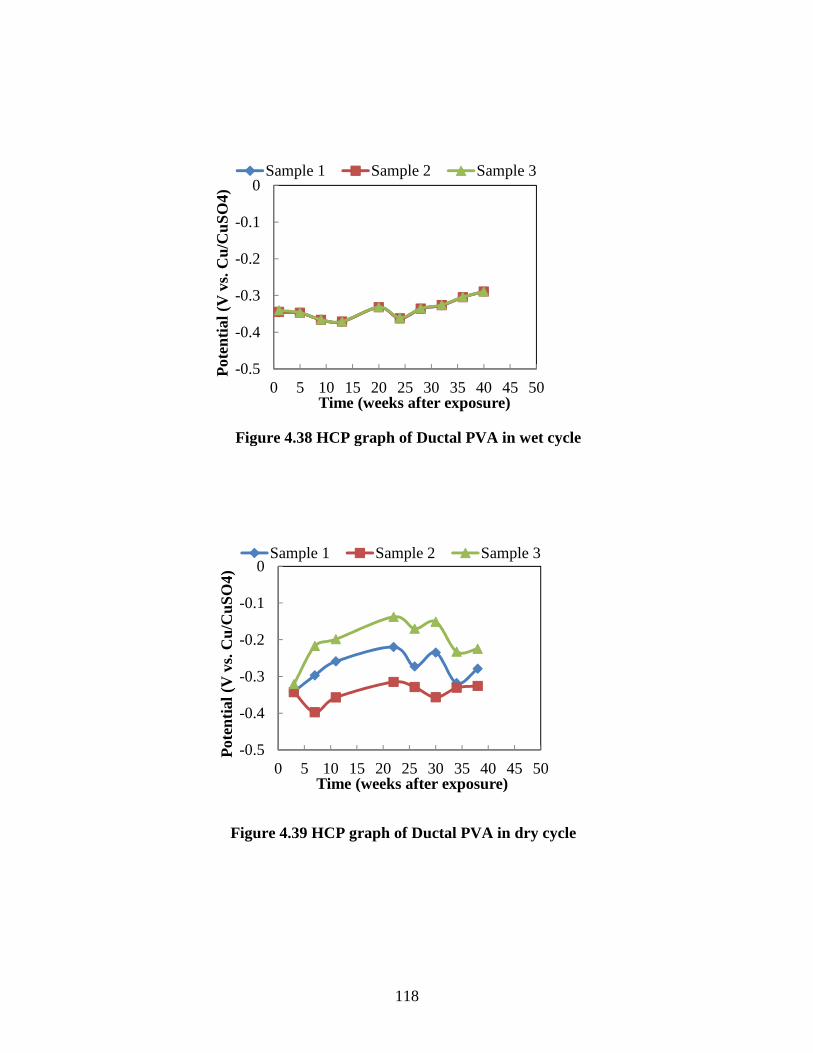
118
Figure 4.38 HCP graph of Ductal PVA in wet cycle
-0.5
-0.4
-0.3
-0.2
-0.1
0
0 5 10 15 20 25 30 35 40 45 50
Pot
entia
l (V
vs.
Cu/
CuS
O4)
Time (weeks after exposure)
Sample 1 Sample 2 Sample 3
Figure 4.39 HCP graph of Ductal PVA in dry cycle
-0.5
-0.4
-0.3
-0.2
-0.1
0
0 5 10 15 20 25 30 35 40 45 50
Pot
entia
l (V
vs.
Cu/
CuS
O4)
Time (weeks after exposure)
Sample 1 Sample 2 Sample 3
119
The three samples in the dry cycle start almost at the same potential and then
follow the different paths all along. Sample 2 has the probability of corrosion of more
than 90% while sample 3 has the least chances of corrosion and sample 1 has its
potentials between samples 2 and 3 with an increase chance of corrosion.
After careful examination of potential contour maps in wet cycle it can be stated
that a uniformity of corrosion potential is achieved with the progress of time along the
entire exposed surface area of the sample irrespective of the crack pattern. Also the
corrosion potential values of each point were same even after changing the working
electrode rebar. However, potential contour maps in the dry cycle are formed in
complement with the crack patterns. The corrosion potential of points located in the areas
of excessive cracks is increasing with the progress of time. Hence dry measurements are
capable of producing more realistic representing models of corrosion potential.
Linear polarization resistance test results
LPR test was carried out on all the three locations of Ductal PVA (STA - 04) in
dry condition which are shown in Table 4.9. As per the LPR test results all the rebar’s are
in an active state of corrosion. Thus LPR test data conveys the same results as HCP tests
data and potential contour maps with sample 3 rebar being less corrosive than sample 2
rebar.

120
Visual examination of rebar (core test)
Cores were extracted from different parts of the sample to examine the surface of
rebar as shown in Figures 4.40, 4.41 and 4.42. Both the rebar at top and bottom of
samples 1 and 2 were corroded with the bottom rebar being more corroded and sample 3
rebar was slightly corroded in comparison with the above samples. Bottom part of the
rebars were more corrosive than the top part mainly because of the crack openings found
at the bottom surface of the sample which allowed sufficient supply of oxygen and
moisture to the bottom part of the rebar as well as the evaporation of the salt water from
the other slab sitting beneath this slab. The HCP and LPR test results in both the
conditions were confirmed with the visual inspection of the top rebar of the samples with
the dry measurements being more accurate.
Table 4.9 LPR data of Ductal PVA Static (STA - 04)
Sample Nos.Time (weeks after exposure)icorrosion in A/m2 Condition1 36 0.010934 Dry1 37 0.010175 Dry2 36 0.020431 Dry2 37 0.023416 Dry2 40 0.032873 Dry3 36 0.028332 Dry3 37 0.02922 Dry3 40 0.03663 Dry
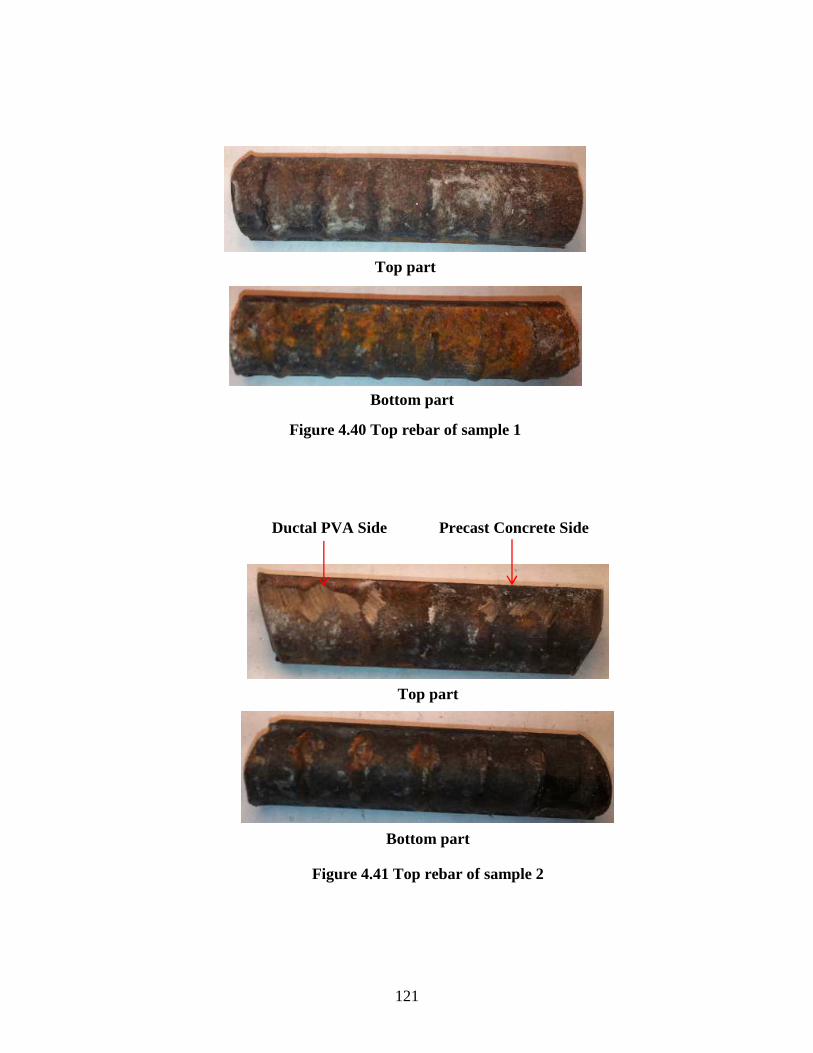
121
Figure 4.40 Top rebar of sample 1
Top part
Bottom part
Top part
Bottom part
Figure 4.41 Top rebar of sample 2
Ductal PVA Side Precast Concrete Side
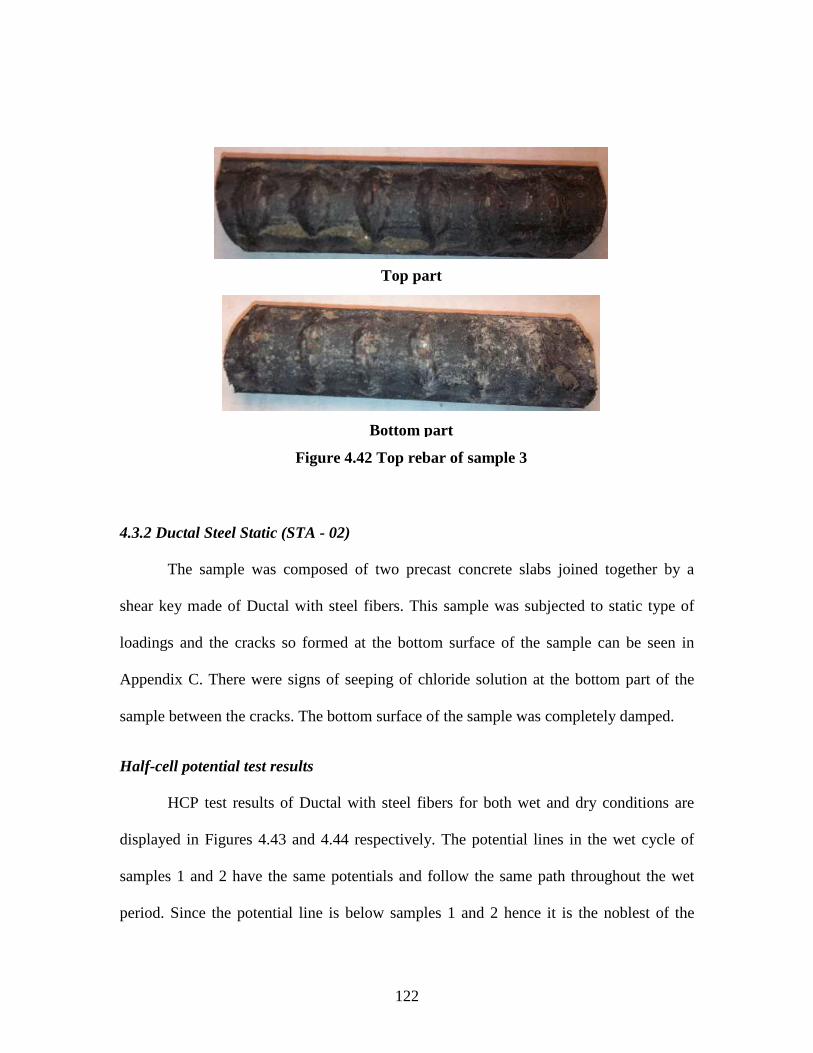
122
4.3.2 Ductal Steel Static (STA - 02)
The sample was composed of two precast concrete slabs joined together by a
shear key made of Ductal with steel fibers. This sample was subjected to static type of
loadings and the cracks so formed at the bottom surface of the sample can be seen in
Appendix C. There were signs of seeping of chloride solution at the bottom part of the
sample between the cracks. The bottom surface of the sample was completely damped.
Half-cell potential test results
HCP test results of Ductal with steel fibers for both wet and dry conditions are
displayed in Figures 4.43 and 4.44 respectively. The potential lines in the wet cycle of
samples 1 and 2 have the same potentials and follow the same path throughout the wet
period. Since the potential line is below samples 1 and 2 hence it is the noblest of the
Top part
Bottom part
Figure 4.42 Top rebar of sample 3
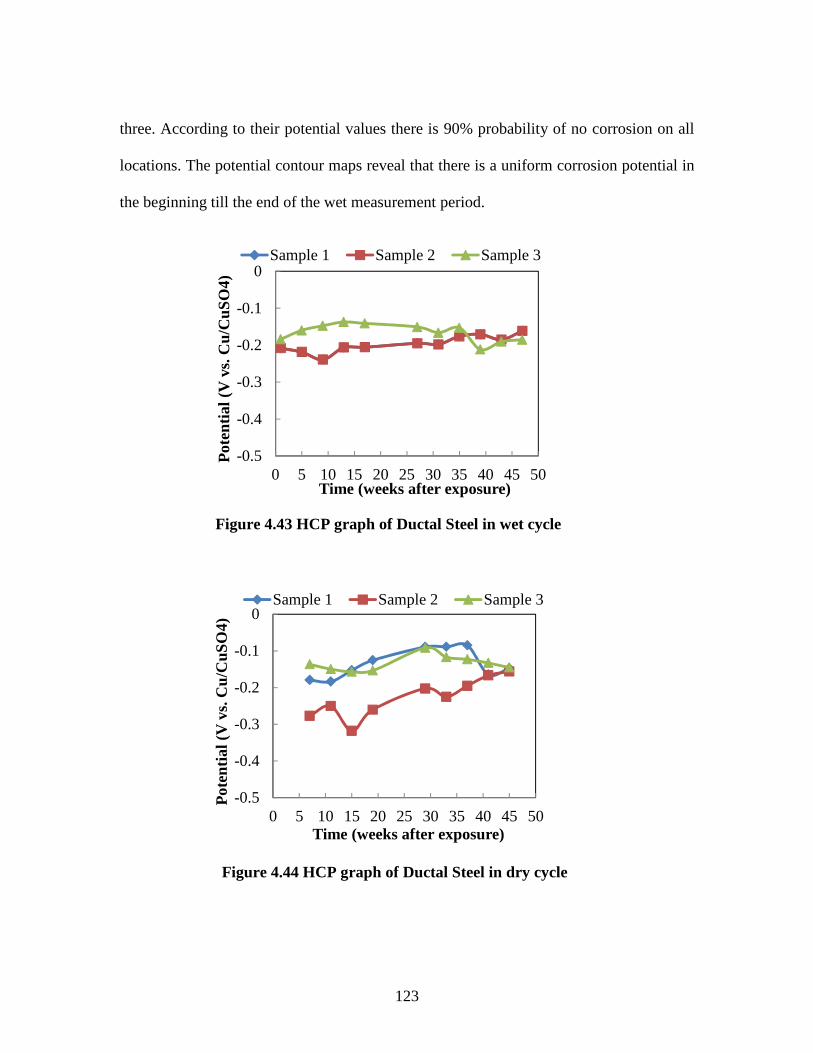
123
three. According to their potential values there is 90% probability of no corrosion on all
locations. The potential contour maps reveal that there is a uniform corrosion potential in
the beginning till the end of the wet measurement period.
Figure 4.43 HCP graph of Ductal Steel in wet cycle
-0.5
-0.4
-0.3
-0.2
-0.1
0
0 5 10 15 20 25 30 35 40 45 50
Pot
entia
l (V
vs.
Cu/
CuS
O4)
Time (weeks after exposure)
Sample 1 Sample 2 Sample 3
Figure 4.44 HCP graph of Ductal Steel in dry cycle
-0.5
-0.4
-0.3
-0.2
-0.1
0
0 5 10 15 20 25 30 35 40 45 50
Pot
entia
l (V
vs.
Cu/
CuS
O4)
Time (weeks after exposure)
Sample 1 Sample 2 Sample 3
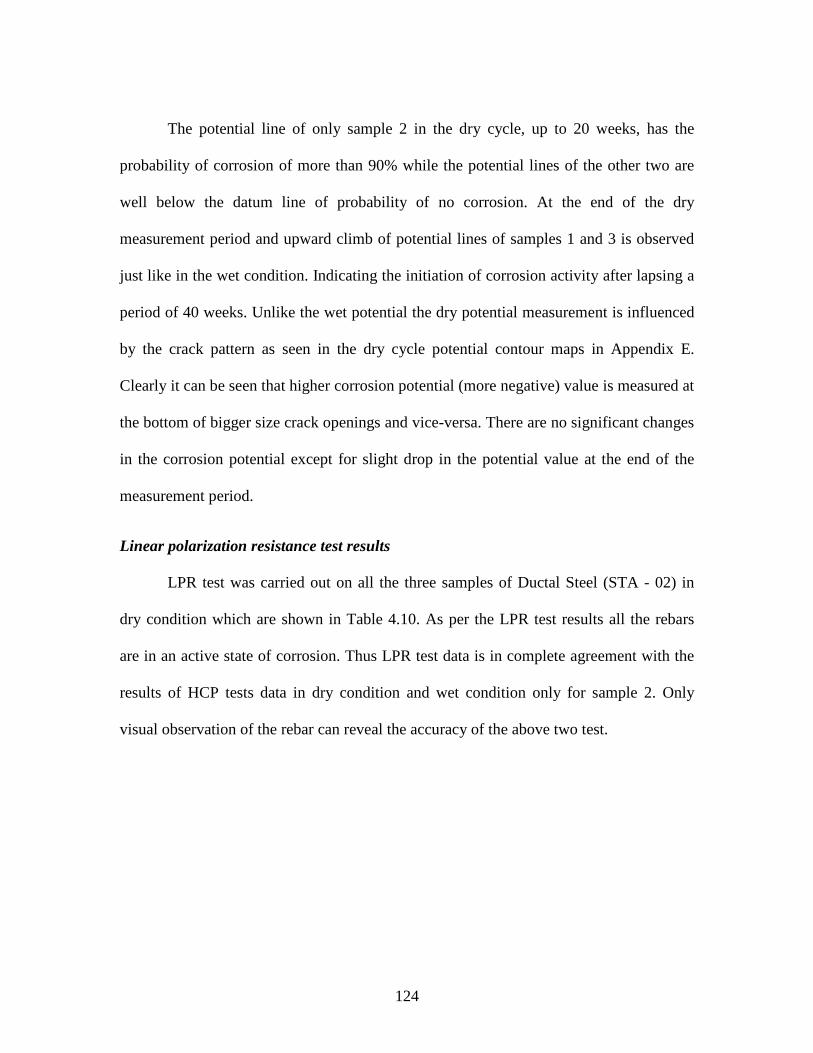
124
The potential line of only sample 2 in the dry cycle, up to 20 weeks, has the
probability of corrosion of more than 90% while the potential lines of the other two are
well below the datum line of probability of no corrosion. At the end of the dry
measurement period and upward climb of potential lines of samples 1 and 3 is observed
just like in the wet condition. Indicating the initiation of corrosion activity after lapsing a
period of 40 weeks. Unlike the wet potential the dry potential measurement is influenced
by the crack pattern as seen in the dry cycle potential contour maps in Appendix E.
Clearly it can be seen that higher corrosion potential (more negative) value is measured at
the bottom of bigger size crack openings and vice-versa. There are no significant changes
in the corrosion potential except for slight drop in the potential value at the end of the
measurement period.
Linear polarization resistance test results
LPR test was carried out on all the three samples of Ductal Steel (STA - 02) in
dry condition which are shown in Table 4.10. As per the LPR test results all the rebars
are in an active state of corrosion. Thus LPR test data is in complete agreement with the
results of HCP tests data in dry condition and wet condition only for sample 2. Only
visual observation of the rebar can reveal the accuracy of the above two test.

125
Visual examination of rebar (core test)
As said earlier three cores were extracted from different parts of the sample to
examine the surface of rebar as shown in Figures 4.45, 4.46 and 4.47. Both the rebar at
top and bottom of samples 1 and 2 were corroded with the bottom rebar being more
corroded and sample 3 rebar had small traces of corrosion products. Bottom part of the
rebars was more corroded than the top part mainly because of the crack openings which
allowed sufficient supply of oxygen and salt water evaporation. Hence the LPR test
results were confirmed with the visual inspection of the top rebar of the samples.
Table 4.10 LPR test data for Ductal Steel Static (STA - 02)
Sample Nos.Time (weeks after exposure)icorrosion in A/m2 Condition1 36 0.003716 Dry1 37 0.003997 Dry1 40 0.002155 Dry2 36 0.010981 Dry2 37 0.008589 Dry2 40 0.012239 Dry3 37 0.016869 Dry3 40 0.016075 Dry
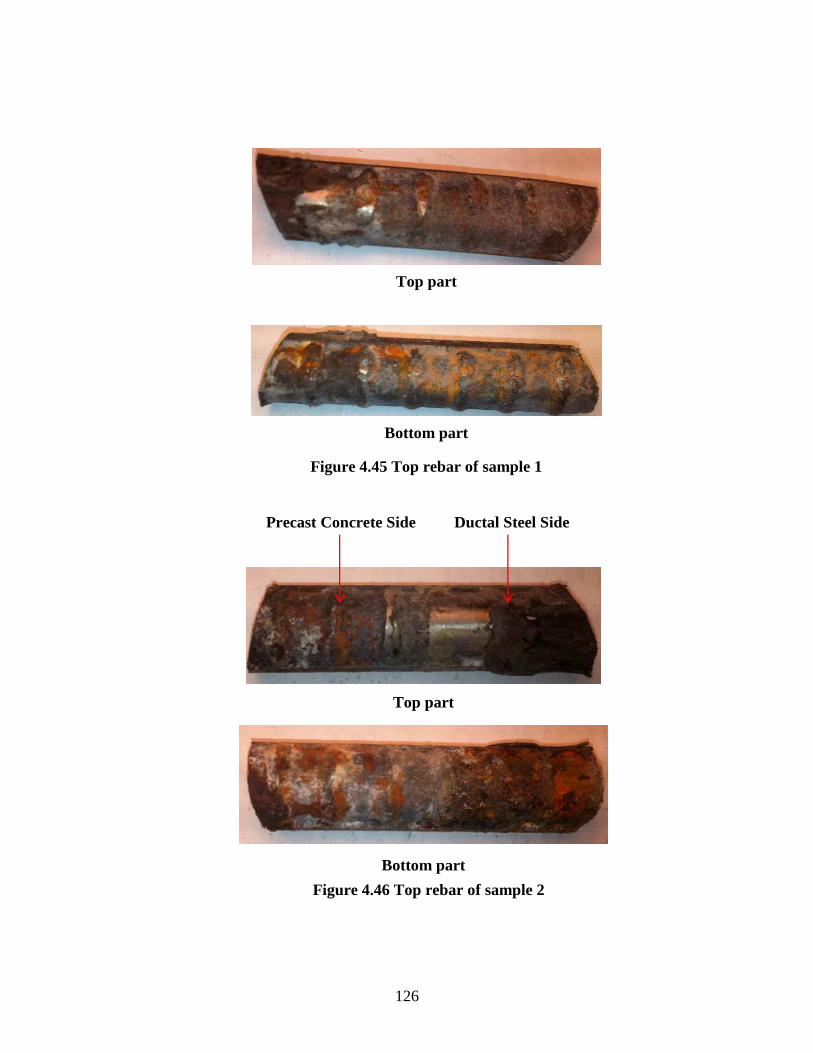
126
Top part
Bottom part
Figure 4.45 Top rebar of sample 1
Top part
Bottom part
Figure 4.46 Top rebar of sample 2
Ductal Steel Side Precast Concrete Side
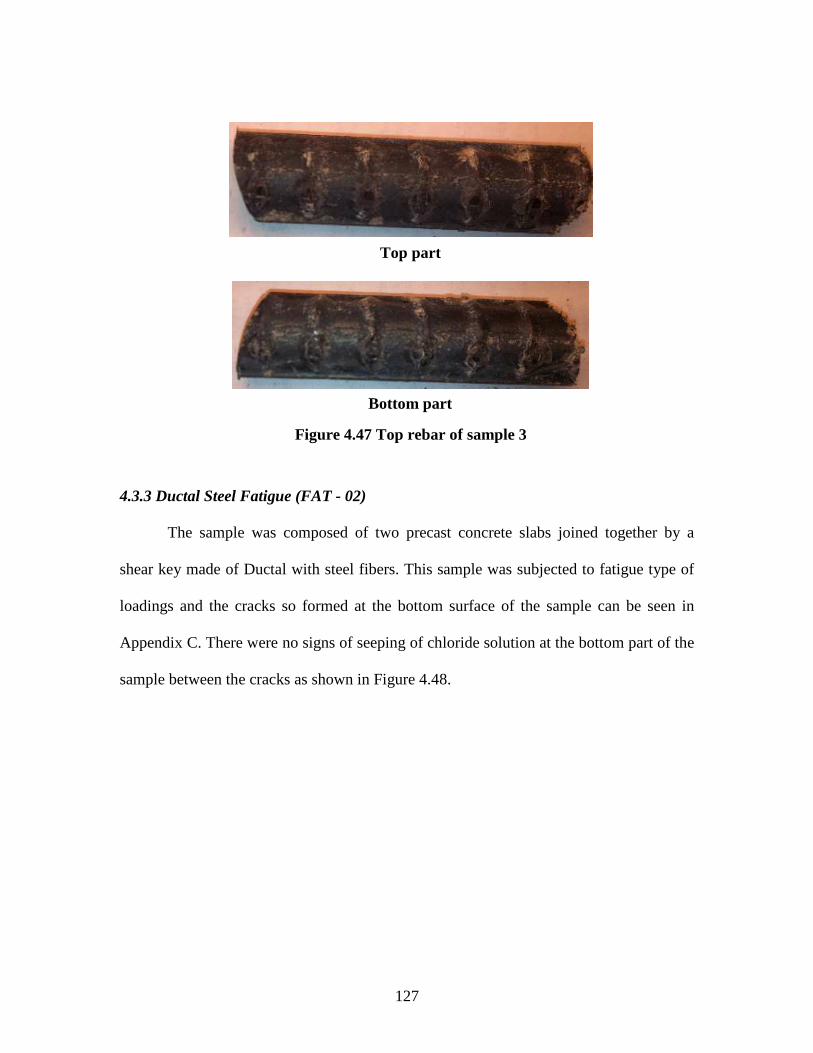
127
4.3.3 Ductal Steel Fatigue (FAT - 02)
The sample was composed of two precast concrete slabs joined together by a
shear key made of Ductal with steel fibers. This sample was subjected to fatigue type of
loadings and the cracks so formed at the bottom surface of the sample can be seen in
Appendix C. There were no signs of seeping of chloride solution at the bottom part of the
sample between the cracks as shown in Figure 4.48.
Figure 4.47 Top rebar of sample 3
Top part
Bottom part

128
Half-cell potential test results
HCP test results of Ductal with steel fibers for both wet and dry conditions are
displayed in Figures 4.49 and 4.50 respectively. Potential lines of all the three samples
start and follow the same path throughout the wet measurement period having a
probability of corrosion of more than 90%. The contour maps reveal that there was
almost uniform corrosion potential throughout the wet period with a decline in their
values at the end of the wet measurement period.
Figure 4.48 Bottom surface of Ductal Steel (FAT - 02)
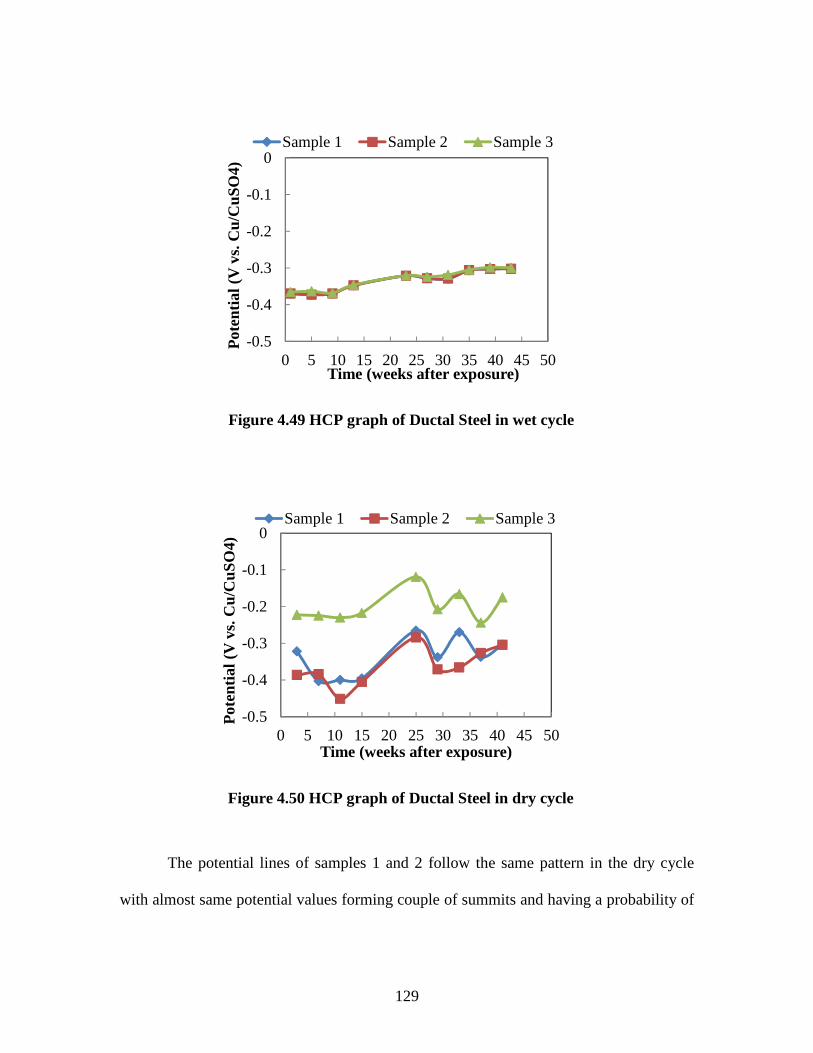
129
The potential lines of samples 1 and 2 follow the same pattern in the dry cycle
with almost same potential values forming couple of summits and having a probability of
Figure 4.49 HCP graph of Ductal Steel in wet cycle
-0.5
-0.4
-0.3
-0.2
-0.1
0
0 5 10 15 20 25 30 35 40 45 50
Pot
entia
l (V
vs.
Cu/
CuS
O4)
Time (weeks after exposure)
Sample 1 Sample 2 Sample 3
Figure 4.50 HCP graph of Ductal Steel in dry cycle
-0.5
-0.4
-0.3
-0.2
-0.1
0
0 5 10 15 20 25 30 35 40 45 50
Pot
entia
l (V
vs.
Cu/
CuS
O4)
Time (weeks after exposure)
Sample 1 Sample 2 Sample 3
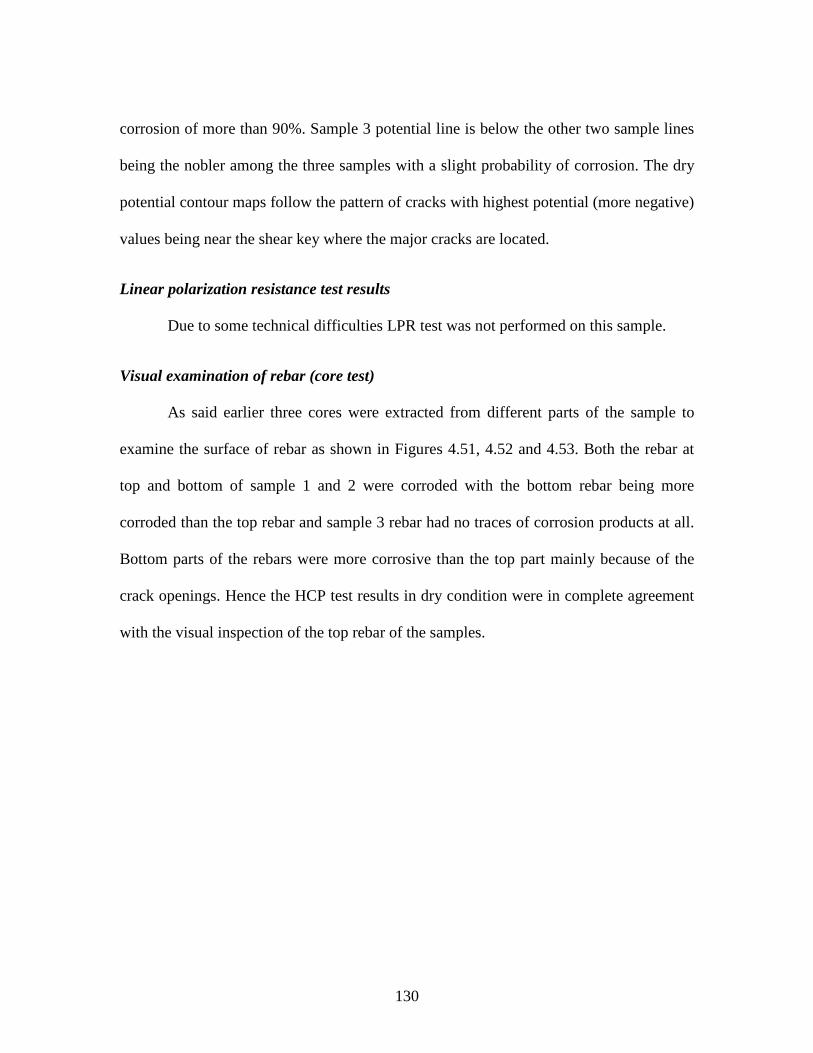
130
corrosion of more than 90%. Sample 3 potential line is below the other two sample lines
being the nobler among the three samples with a slight probability of corrosion. The dry
potential contour maps follow the pattern of cracks with highest potential (more negative)
values being near the shear key where the major cracks are located.
Linear polarization resistance test results
Due to some technical difficulties LPR test was not performed on this sample.
Visual examination of rebar (core test)
As said earlier three cores were extracted from different parts of the sample to
examine the surface of rebar as shown in Figures 4.51, 4.52 and 4.53. Both the rebar at
top and bottom of sample 1 and 2 were corroded with the bottom rebar being more
corroded than the top rebar and sample 3 rebar had no traces of corrosion products at all.
Bottom parts of the rebars were more corrosive than the top part mainly because of the
crack openings. Hence the HCP test results in dry condition were in complete agreement
with the visual inspection of the top rebar of the samples.

131
Top part
Bottom part
Figure 4.51 Top rebar of sample 1
Top part
Bottom part
Figure 4.52 Top rebar of sample 2
Ductal Steel Side Precast Concrete Side
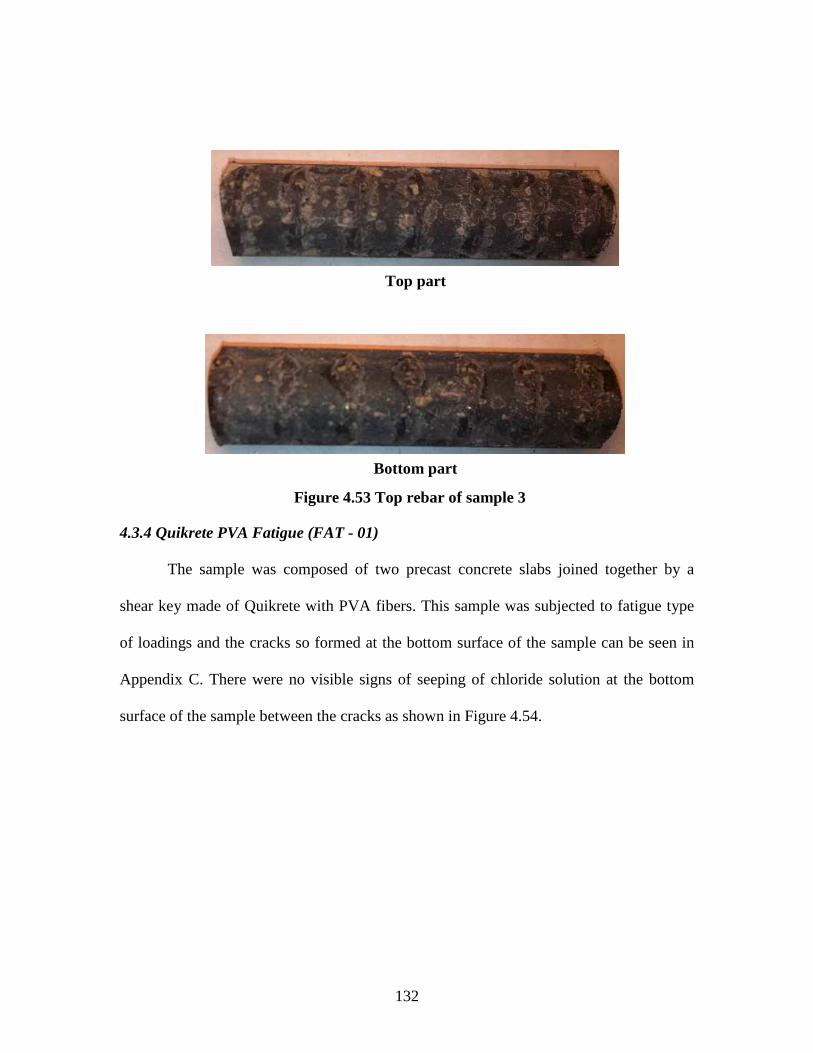
132
4.3.4 Quikrete PVA Fatigue (FAT - 01)
The sample was composed of two precast concrete slabs joined together by a
shear key made of Quikrete with PVA fibers. This sample was subjected to fatigue type
of loadings and the cracks so formed at the bottom surface of the sample can be seen in
Appendix C. There were no visible signs of seeping of chloride solution at the bottom
surface of the sample between the cracks as shown in Figure 4.54.
Top part
Bottom part
Figure 4.53 Top rebar of sample 3
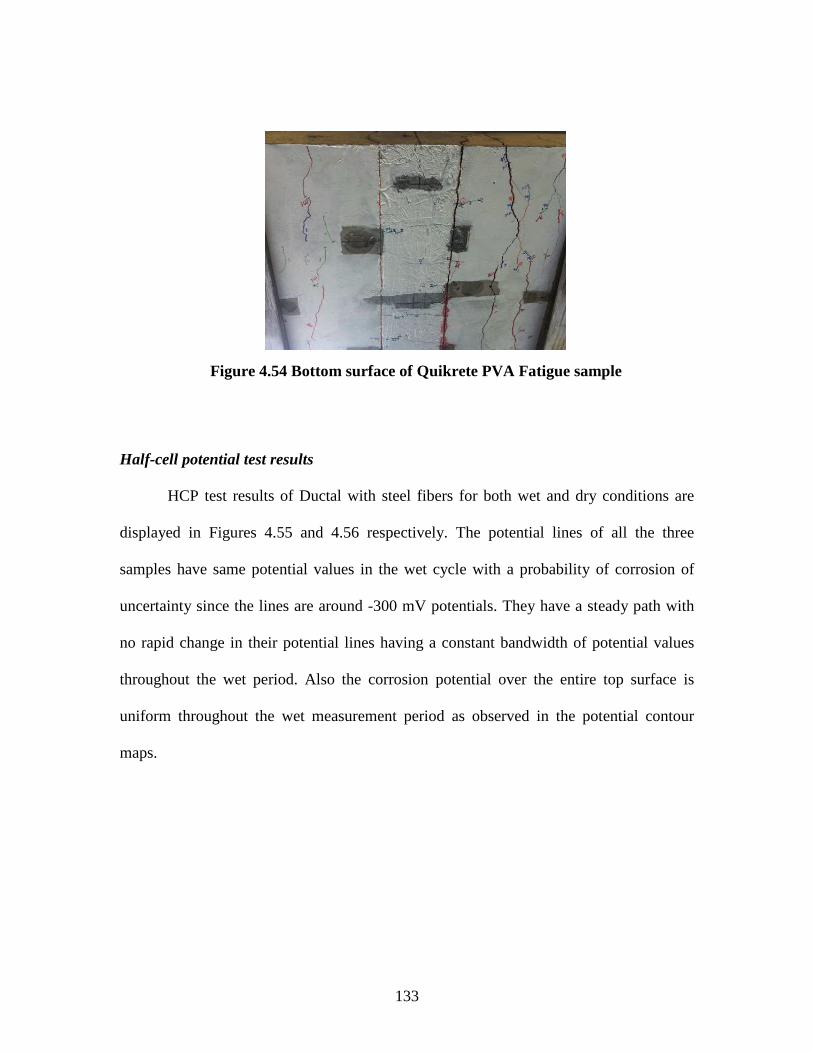
133
Half-cell potential test results
HCP test results of Ductal with steel fibers for both wet and dry conditions are
displayed in Figures 4.55 and 4.56 respectively. The potential lines of all the three
samples have same potential values in the wet cycle with a probability of corrosion of
uncertainty since the lines are around -300 mV potentials. They have a steady path with
no rapid change in their potential lines having a constant bandwidth of potential values
throughout the wet period. Also the corrosion potential over the entire top surface is
uniform throughout the wet measurement period as observed in the potential contour
maps.
Figure 4.54 Bottom surface of Quikrete PVA Fatigue sample
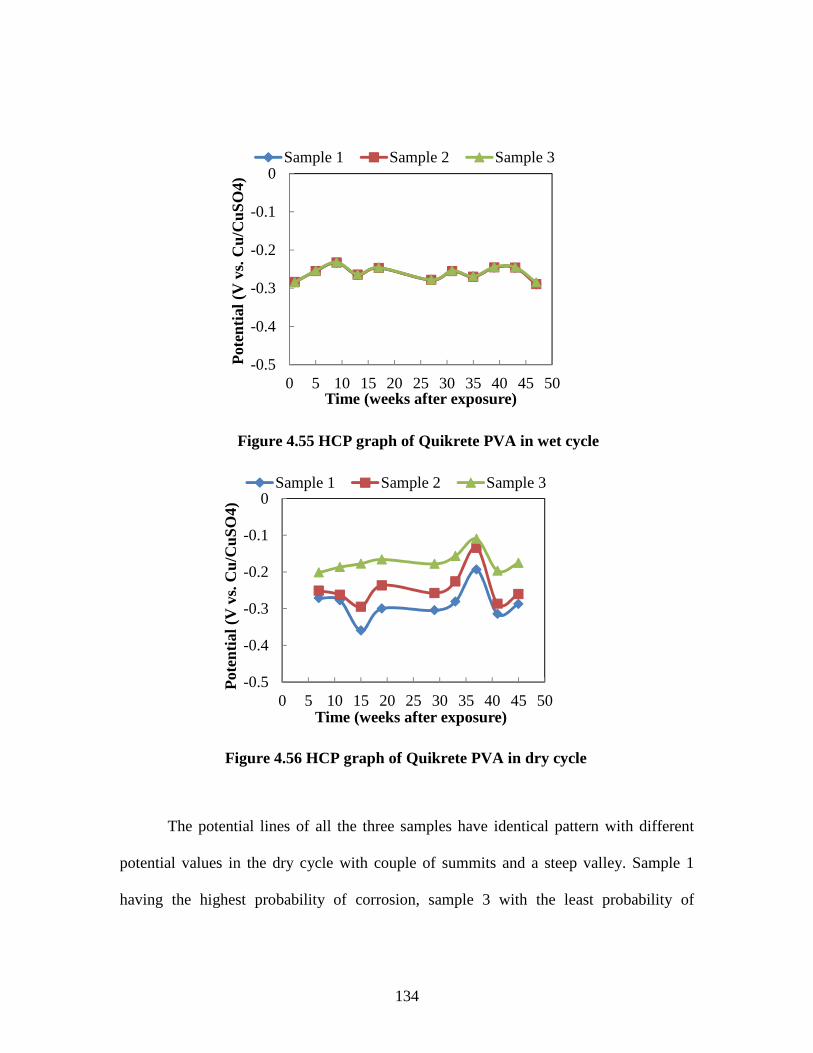
134
The potential lines of all the three samples have identical pattern with different
potential values in the dry cycle with couple of summits and a steep valley. Sample 1
having the highest probability of corrosion, sample 3 with the least probability of
Figure 4.55 HCP graph of Quikrete PVA in wet cycle
-0.5
-0.4
-0.3
-0.2
-0.1
0
0 5 10 15 20 25 30 35 40 45 50
Pot
entia
l (V
vs.
Cu/
CuS
O4)
Time (weeks after exposure)
Sample 1 Sample 2 Sample 3
Figure 4.56 HCP graph of Quikrete PVA in dry cycle
-0.5
-0.4
-0.3
-0.2
-0.1
0
0 5 10 15 20 25 30 35 40 45 50
Pot
entia
l (V
vs.
Cu/
CuS
O4)
Time (weeks after exposure)
Sample 1 Sample 2 Sample 3

135
corrosion and sample 2 sitting between the two. The corrosion potentials in the dry cycle
are found to be highest (more negative) below the crack openings and low (less negative)
at places with no cracks. Hence their pattern is influenced with the presence and absence
of cracks and their opening sizes as shown in the contour map in Appendix E.
Linear polarization resistance test results
LPR test was carried out on two samples of Quikrete PVA (FAT - 01) in dry
condition which are shown in Table 4.11. As per the LPR test data the rebar located at
samples 1 and 3 are in active state of corrosion.
Visual examination of rebar (core test)
Three cores were extracted from different parts of the sample to examine the
surface of rebar as shown in Figures 4.57, 4.58 and 4.59. Both rebars at top and bottom of
sample 2 were corroded with the bottom rebar being more corroded than the top rebar
and bottom rebar of sample 1 was slightly corroded while the top rebar had corrosion
products and similarly there were some traces of corrosion products on sample 3 at
bottom surface of top rebar. Bottom parts of the rebars were more corroded than the top
part mainly because of the crack openings. Hence the HCP and LPR test results were in
agreement with the visual inspection of the top rebar of the samples.
Table 4.11 LPR test data of Quikrete PVA Fatigue (FAT - 01)
Sample Nos.Time (weeks after exposure)icorrosion in A/m2 Condition1 37 0.0192789 Dry1 40 0.0177446 Dry3 36 0.0330851 Dry3 37 0.0298151 Dry3 40 0.0294724 Dry
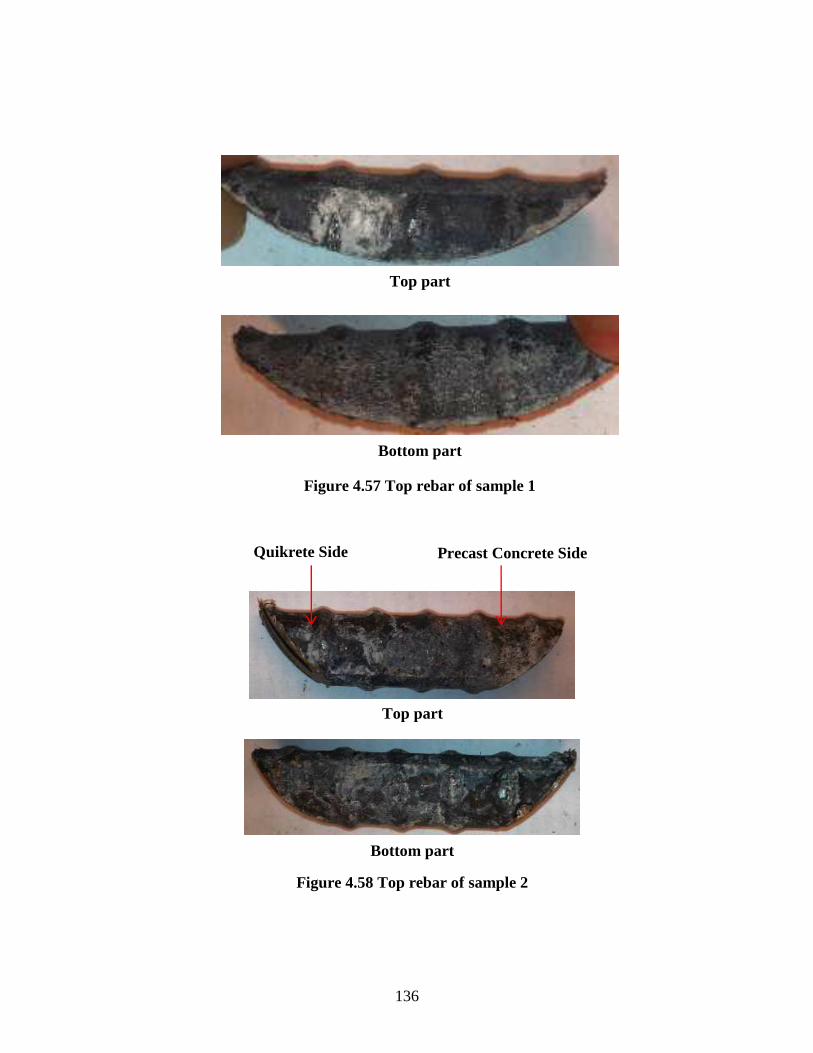
136
Figure 4.57 Top rebar of sample 1
Top part
Bottom part
Top part
Bottom part
Figure 4.58 Top rebar of sample 2
Precast Concrete Side Quikrete Side
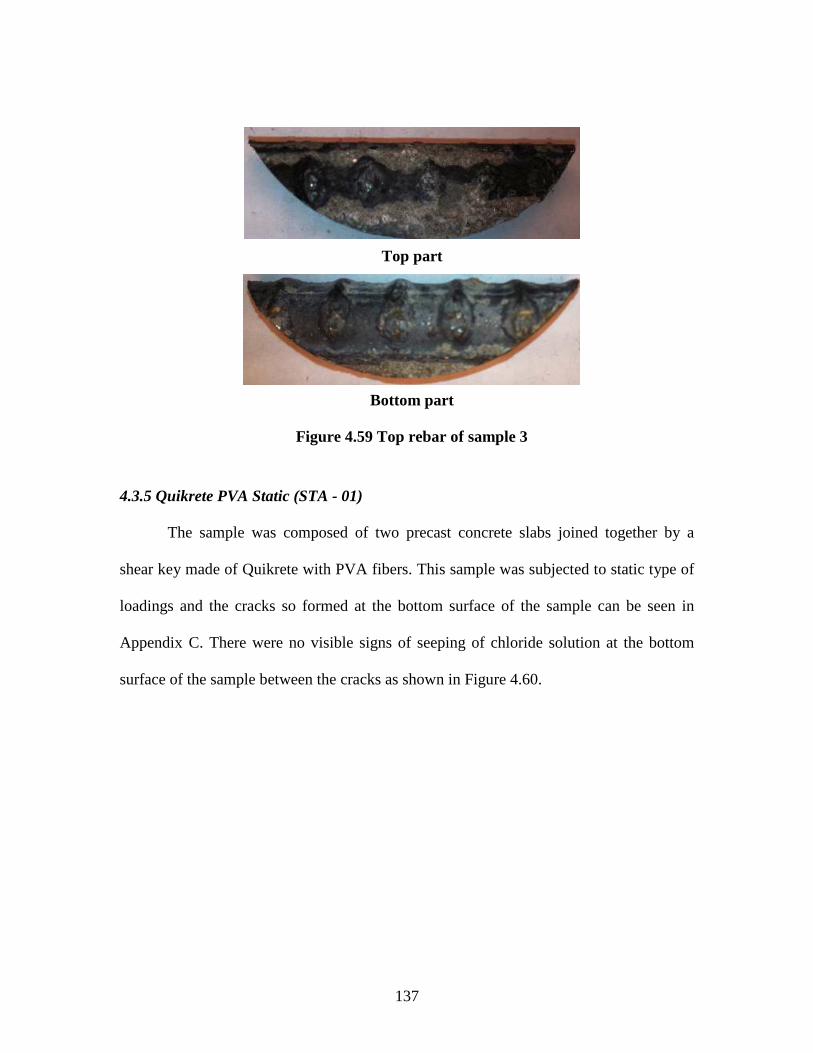
137
4.3.5 Quikrete PVA Static (STA - 01)
The sample was composed of two precast concrete slabs joined together by a
shear key made of Quikrete with PVA fibers. This sample was subjected to static type of
loadings and the cracks so formed at the bottom surface of the sample can be seen in
Appendix C. There were no visible signs of seeping of chloride solution at the bottom
surface of the sample between the cracks as shown in Figure 4.60.
Top part
Bottom part
Figure 4.59 Top rebar of sample 3
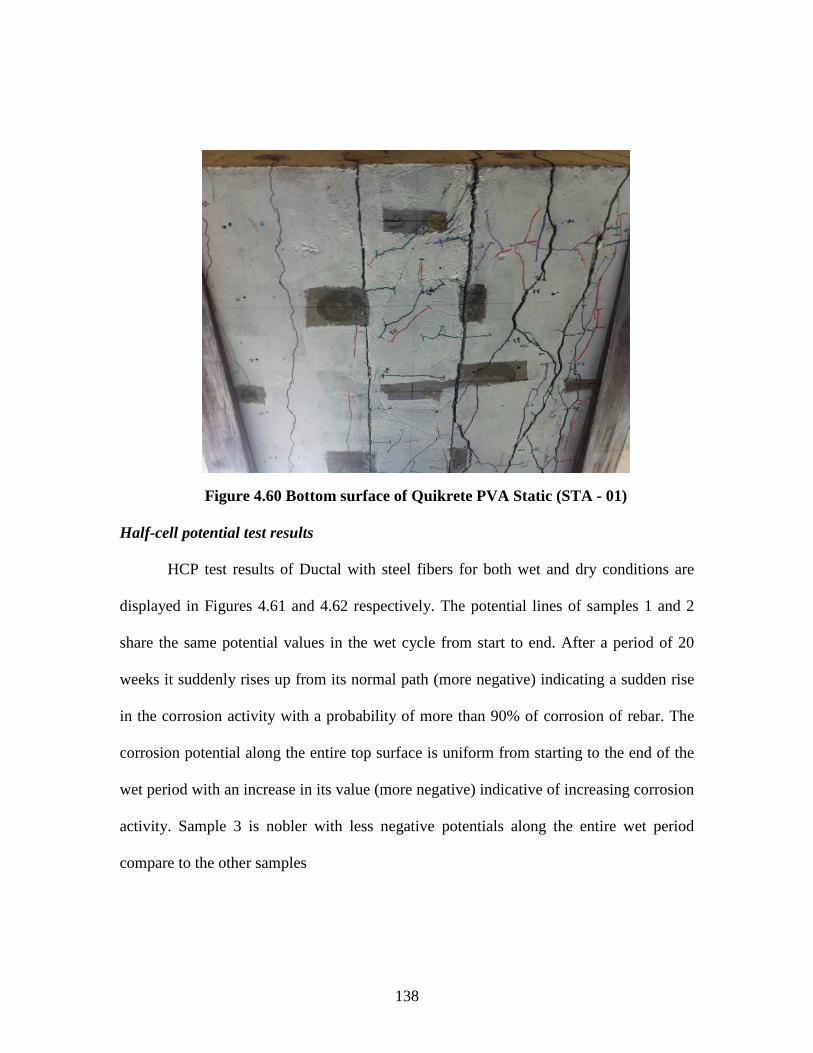
138
Half-cell potential test results
HCP test results of Ductal with steel fibers for both wet and dry conditions are
displayed in Figures 4.61 and 4.62 respectively. The potential lines of samples 1 and 2
share the same potential values in the wet cycle from start to end. After a period of 20
weeks it suddenly rises up from its normal path (more negative) indicating a sudden rise
in the corrosion activity with a probability of more than 90% of corrosion of rebar. The
corrosion potential along the entire top surface is uniform from starting to the end of the
wet period with an increase in its value (more negative) indicative of increasing corrosion
activity. Sample 3 is nobler with less negative potentials along the entire wet period
compare to the other samples
Figure 4.60 Bottom surface of Quikrete PVA Static (STA - 01)
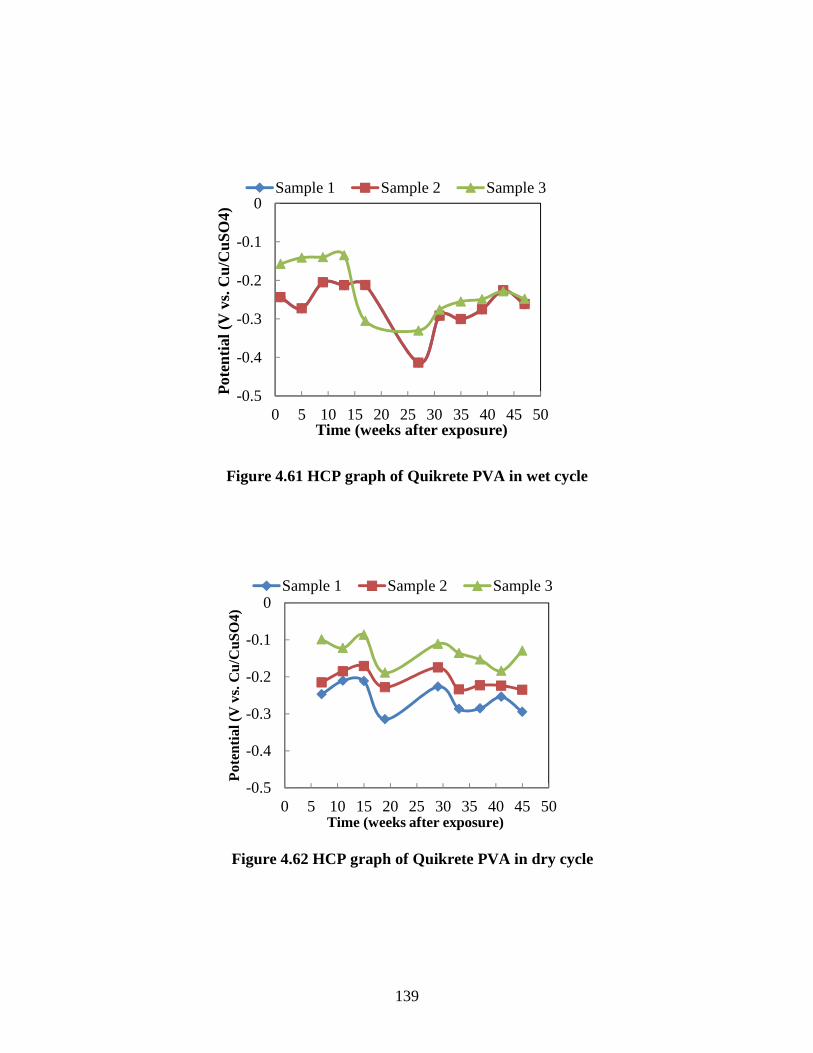
139
Figure 4.61 HCP graph of Quikrete PVA in wet cycle
-0.5
-0.4
-0.3
-0.2
-0.1
0
0 5 10 15 20 25 30 35 40 45 50
Pot
entia
l (V
vs.
Cu/
CuS
O4)
Time (weeks after exposure)
Sample 1 Sample 2 Sample 3
Figure 4.62 HCP graph of Quikrete PVA in dry cycle
-0.5
-0.4
-0.3
-0.2
-0.1
0
0 5 10 15 20 25 30 35 40 45 50
Pot
entia
l (V
vs.
Cu/
CuS
O4)
Time (weeks after exposure)
Sample 1 Sample 2 Sample 3
140
All the three samples in the dry cycle follow a similar pattern. Sample 1 has the
highest probability of corrosion and sample 3 has the least probability of corrosion and
sample 2 has its potential lines between the potential lines of samples 1 and 2. As can be
seen from the potential contour map (Appendix E), the values of corrosion potentials are
highest (more negative) in the areas of cracking and it is lowest (less negative) in the
areas free from cracking which indicates that the corrosion potentials in the dry cycle are
influenced by the crack patterns found at the bottom surface of the sample.
Linear polarization resistance test results
LPR test was carried out on one sample of Quikrete PVA (FAT - 01) in dry
condition which is shown in Table 4.12. According to the LPR data the rebar in sample 1
is under active corrosion process. Thus LPR test data corresponds with the HCP test
results.
Visual examination of rebar (core test)
Three cores were extracted from different parts of the sample to examine the
surface of rebar as shown in Figures 4.63, 4.64 and 4.65. Both the rebar at top and bottom
of samples 1 and 2 had no corrosion instead the top and bottom rebar of sample 3 had
Table 4.12 LPR data of Quikrete PVA Static (STA - 01)
Sample Nos.Time (weeks after exposure)icorrosion in A/m2 Condition1 36 0.044984 Dry1 37 0.046833 Dry1 40 0.05544 Dry
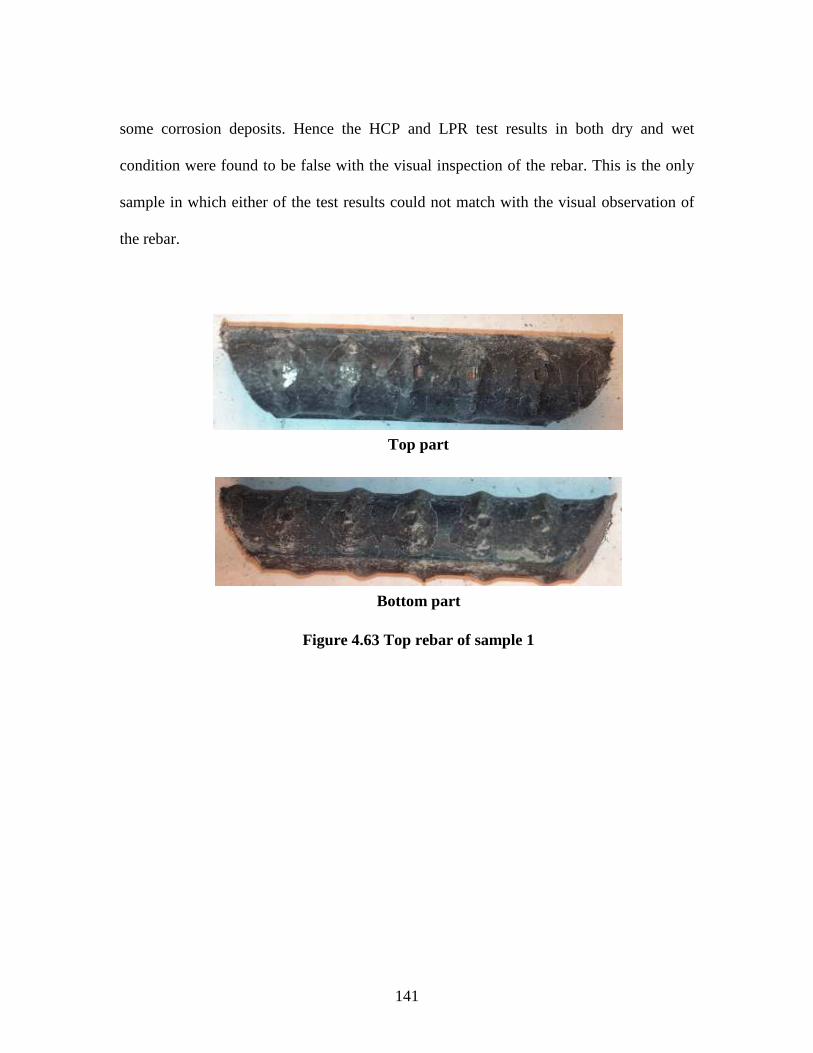
141
some corrosion deposits. Hence the HCP and LPR test results in both dry and wet
condition were found to be false with the visual inspection of the rebar. This is the only
sample in which either of the test results could not match with the visual observation of
the rebar.
Top part
Bottom part
Figure 4.63 Top rebar of sample 1
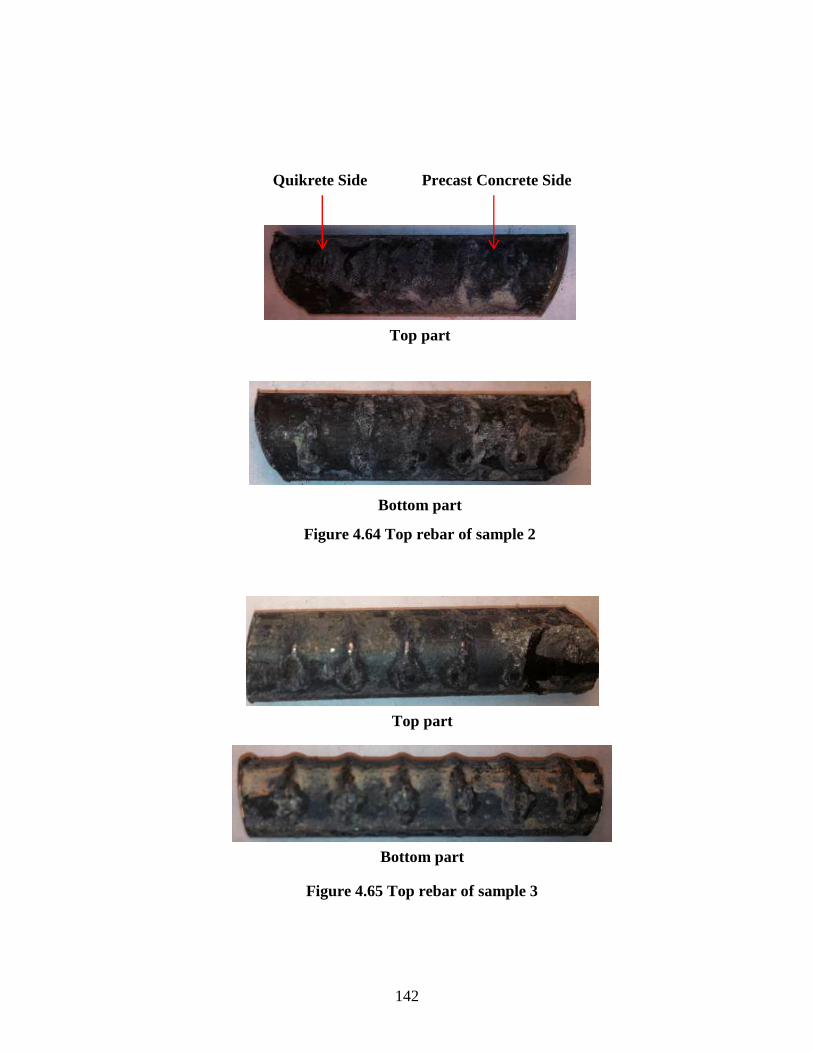
142
Top part
Bottom part
Figure 4.65 Top rebar of sample 3
Top part
Bottom part
Figure 4.64 Top rebar of sample 2
Precast Concrete Side Quikrete Side
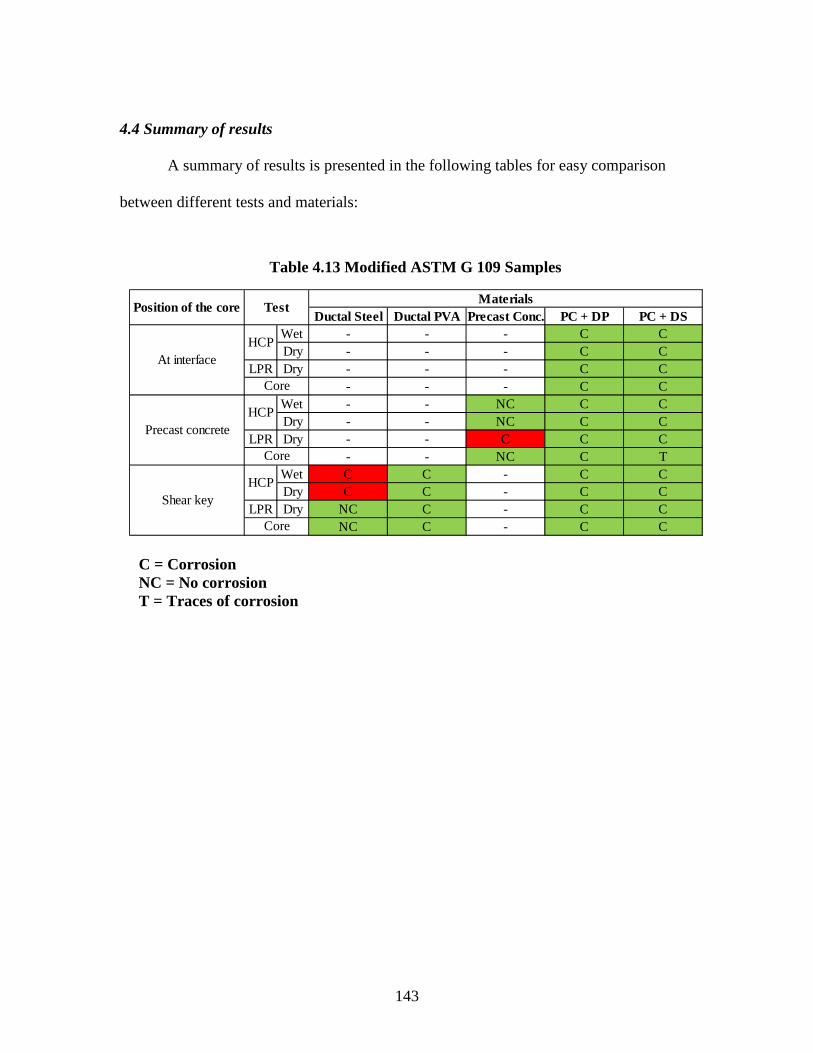
143
4.4 Summary of results
A summary of results is presented in the following tables for easy comparison
between different tests and materials:
Table 4.13 Modified ASTM G 109 Samples
Ductal Steel Ductal PVA Precast Conc. PC + DP PC + DSWet - - - C CDry - - - C C
LPR Dry - - - C C- - - C C
Wet - - NC C CDry - - NC C C
LPR Dry - - C C C- - NC C T
Wet C C - C CDry C C - C C
LPR Dry NC C - C CNC C - C C
Materials
At interface
Precast concrete
Shear key
HCP
HCP
HCP
Position of the core Test
Core
Core
Core
C = Corrosion NC = No corrosion T = Traces of corrosion
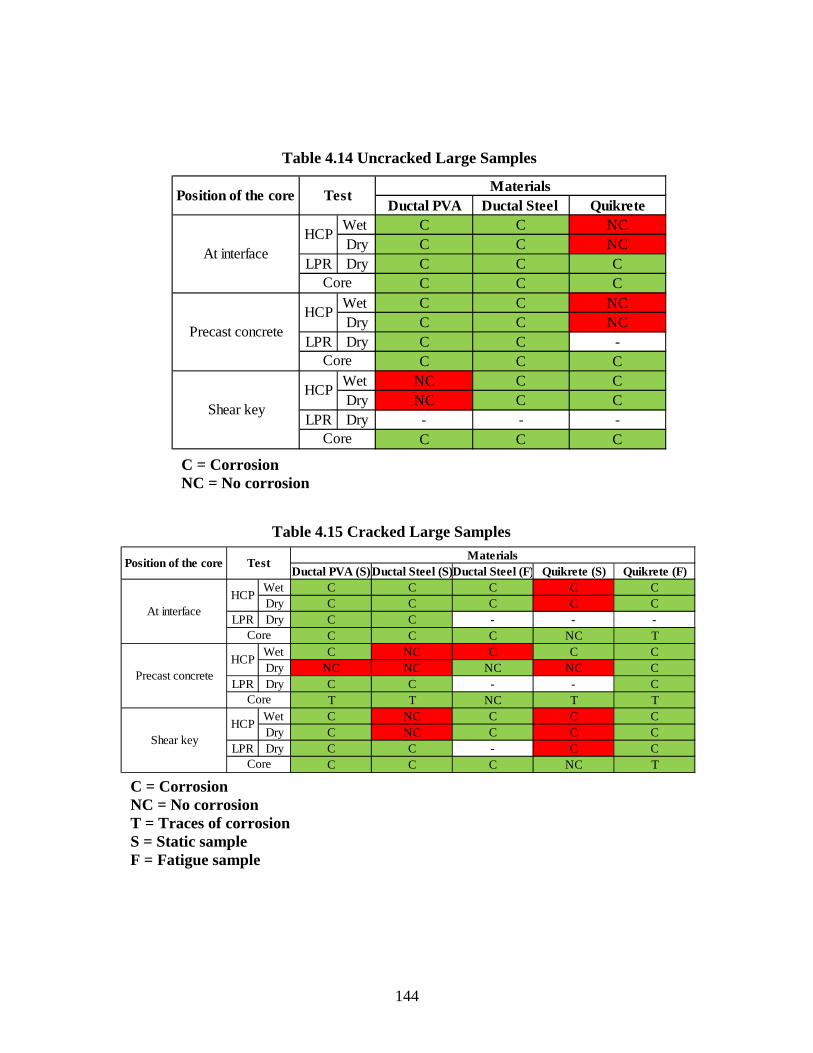
144
Table 4.14 Uncracked Large Samples
Ductal PVA Ductal Steel QuikreteWet C C NCDry C C NC
LPR Dry C C CC C C
Wet C C NCDry C C NC
LPR Dry C C -C C C
Wet NC C CDry NC C C
LPR Dry - - -C C C
Materials
Core
Shear keyHCP
Core
Core
Precast concreteHCP
Position of the core Test
At interfaceHCP
C = Corrosion NC = No corrosion
C = Corrosion NC = No corrosion T = Traces of corrosion S = Static sample F = Fatigue sample
Table 4.15 Cracked Large Samples
Ductal PVA (S)Ductal Steel (S)Ductal Steel (F) Quikrete (S) Quikrete (F)Wet C C C C CDry C C C C C
LPR Dry C C - - -C C C NC T
Wet C NC C C CDry NC NC NC NC C
LPR Dry C C - - CT T NC T T
Wet C NC C C CDry C NC C C C
LPR Dry C C - C CC C C NC T
Position of the core TestMaterials
Precast concreteHCP
Shear keyHCP
Core
Core
HCP
Core
At interface
145
CHAPTER FIVE
CONCLUSIONS AND RECOMMENDATIONS
The conclusions of the whole research has been drawn from the results obtained
from the experimental tests. The necessary suggestions are mentioned for future works
that might be needed to be carried on the same topic in the future.
5.1 Conclusions
1) Generally, the half-cell potential contour map is a useful method in representing
the corrosion activity of the rebars. This method is capable to detect the locations
of the cracks with higher corrosion avtivities. However, it was found that the
actual half-cell potential value cannot be used directly in some cases to determine
the accurate probability of corrosion. HCP readings seems to be more accurate
during measurements in dry periods.
2) The values obtained from the LPR test are more reliable in determining the
corrosion avtivities in all cases.
3) Precast concrete and Ductal with steel fibers are capable of protecting the rebar
from corrosion in the absence of surface cracks.
4) The embedded rebar in Ductal with PVA fibers exhibited corrosion activities.
This could be due to the rapid fluid (salt solution) transport wthin the PVA fibers.
5) Corrosion activity was observed at the interface of two materials, shear key and
precast concrete, regardless of the materials used in shear key. This indicates that
the bothing at the interface is not strong enough to prevent chloride penetration
and consequent corrosion.
146
5.2 Recommendations for the future works
The results and conclusions which have been derived in this preliminary research
is only a starting step for carrying out a much more extensive research in the suitability of
these new materials with the corrosion aspect of the embedded rebar. The following
recommendations are suggested to carry out a detail investigation of the corrosion of the
rebar embedded in such materials:
1) LPR should be performed more frequently probably once a week.
2) After corrosion is observed to be prominent, other corrosion tests such as cyclic
voltammetry, cyclic polarization and other electrochemical techniques should be
carried out on the steel bars for more precise investigation of the corrosion
process.
3) New mix designs with varying fiber contents and varying fiber sizes (different
length and diameter) needs to be adopted for deriving a more comparative results
and conclusions which can be compared in terms of fiber volume and fiber
aspects in the mix.
4) Chloride measurement techniques have to be included in the experimental test
program to calculate the bounded and un-bounded chlorides in the concrete mass
which can unfold many complications related with the various measuring
techniques.
5) A detail investigation is needed for finding the transport property of fluids
through concrete body due to the presences of PVA fibers in the mix by making
147
use of micro-structure techniques like X-ray radiography and X-ray CT scanning
to find the orientation of the fibers in the mix after casting the samples.
6) To carry out the electrical resistance measurement of Ductal with steel and PVA
fibers in comparsion with that precast concrete.
7) Numerical models can be prepared by collecting data from this thesis to represent
in a more realistic and appealing fashion.
8) To present the research in a conference for the purpose of awareness.
148
APPENDICES
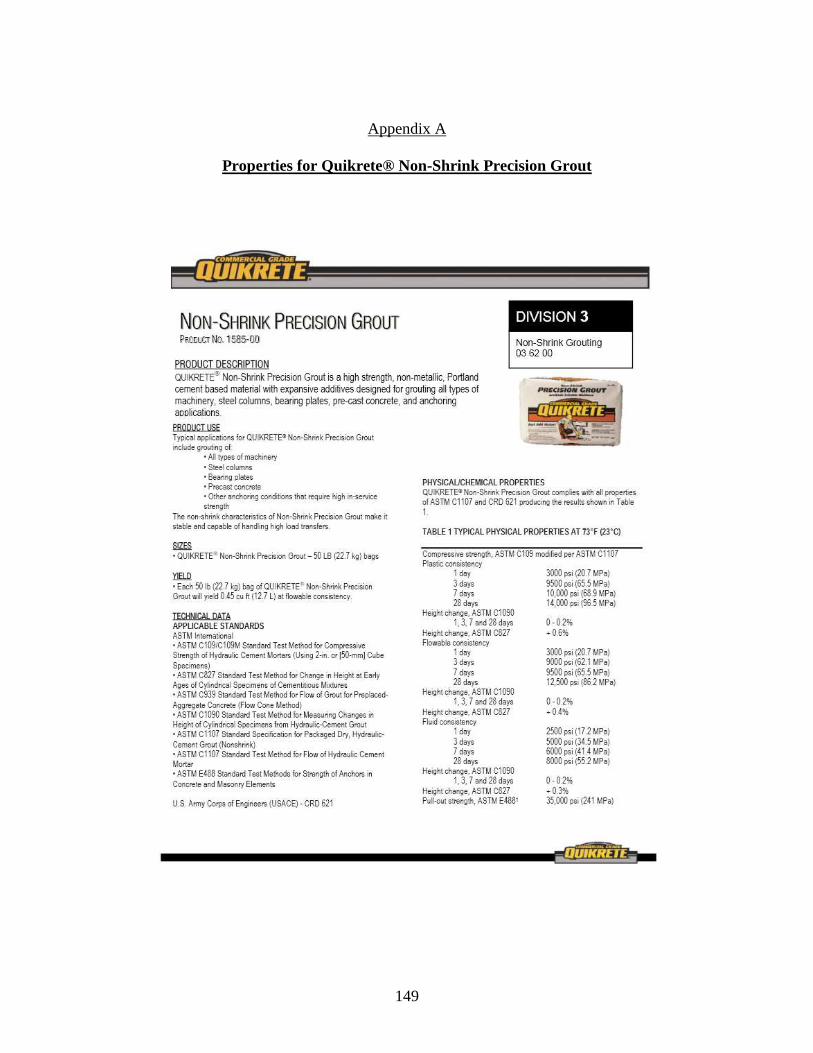
149
Appendix A
Properties for Quikrete® Non-Shrink Precision Grout
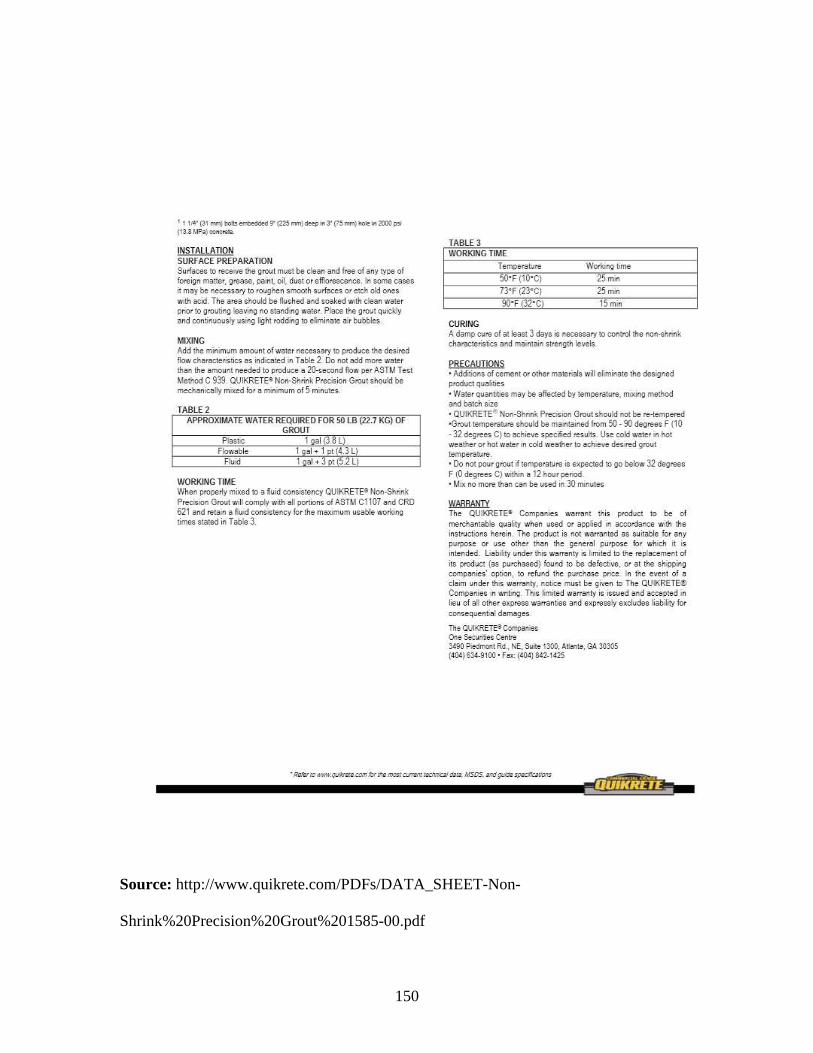
150
Source: http://www.quikrete.com/PDFs/DATA_SHEET-Non-
Shrink%20Precision%20Grout%201585-00.pdf

151
Appendix B
Aggregate Properties
152
Source: Metromont manufacturing plant (Greenville)

153
Appendix C
Crack patterns of large samples
1) Quikrete with PVA fibers (STA - 01)
Plan
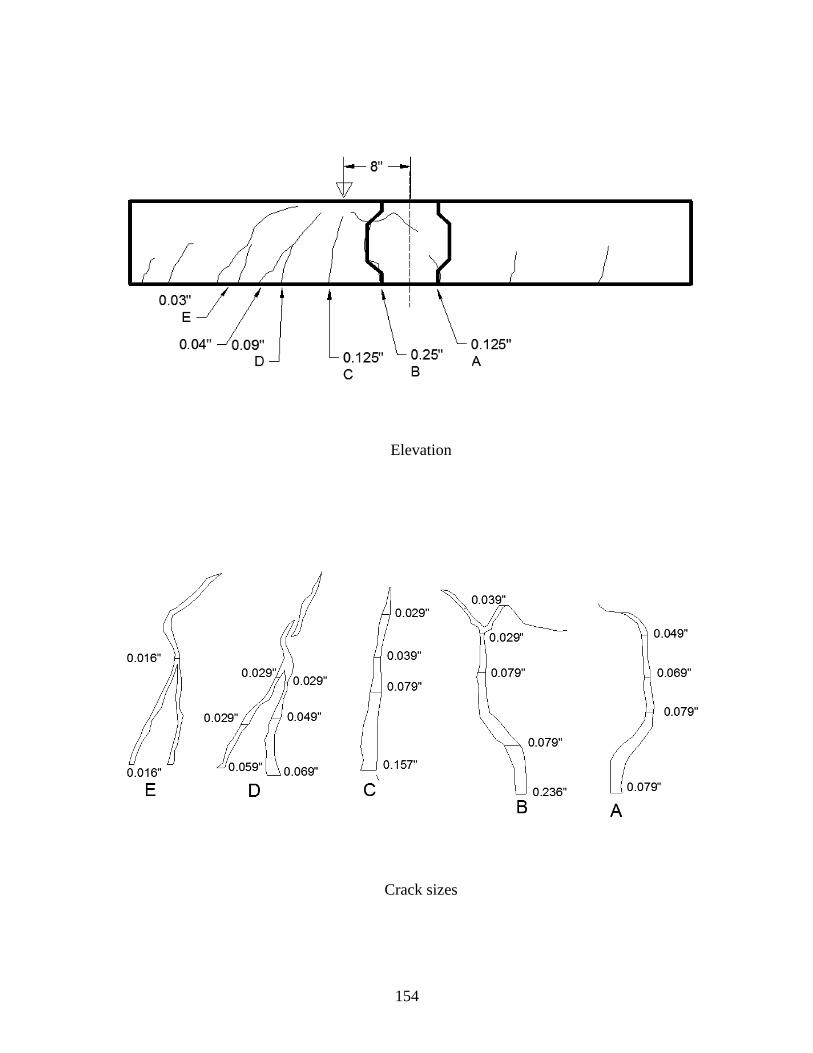
154
Elevation
Crack sizes
155
2) Quikrete with PVA fibers (FAT - 01)
Plan
156
Elevation
Crack sizes
157
3) Ductal with steel fibers (STA - 02)
Plan
158
Elevation
Crack sizes
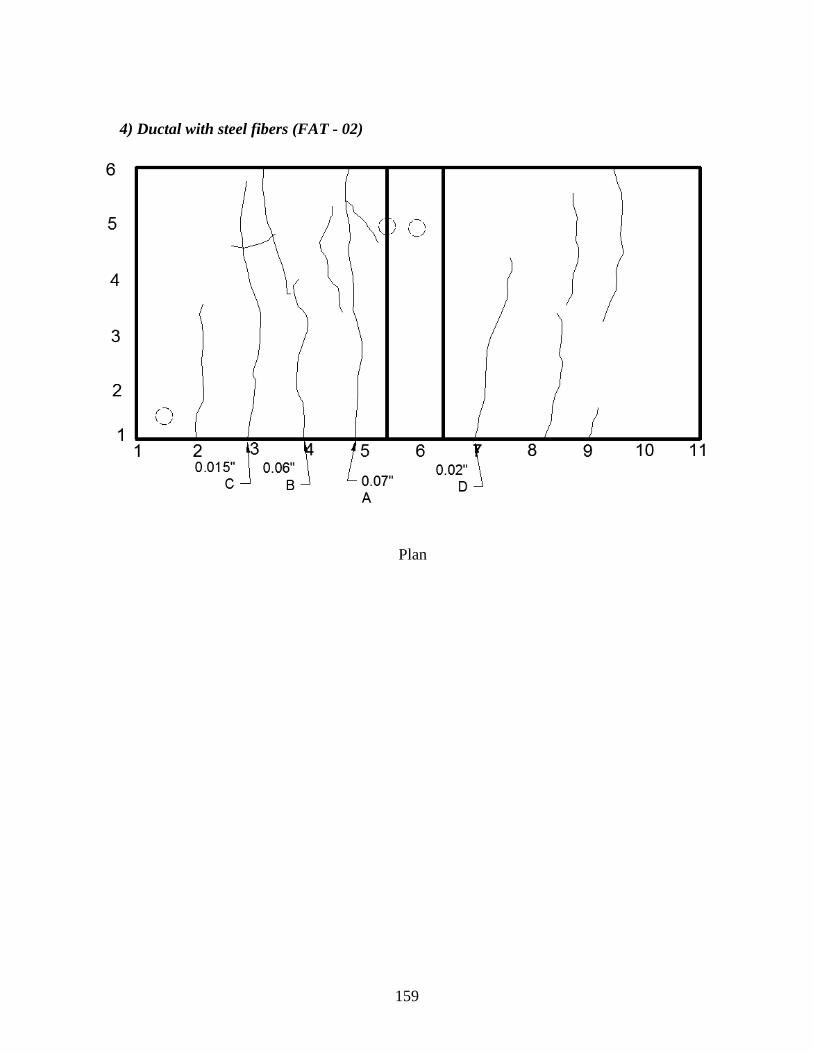
159
4) Ductal with steel fibers (FAT - 02)
Plan
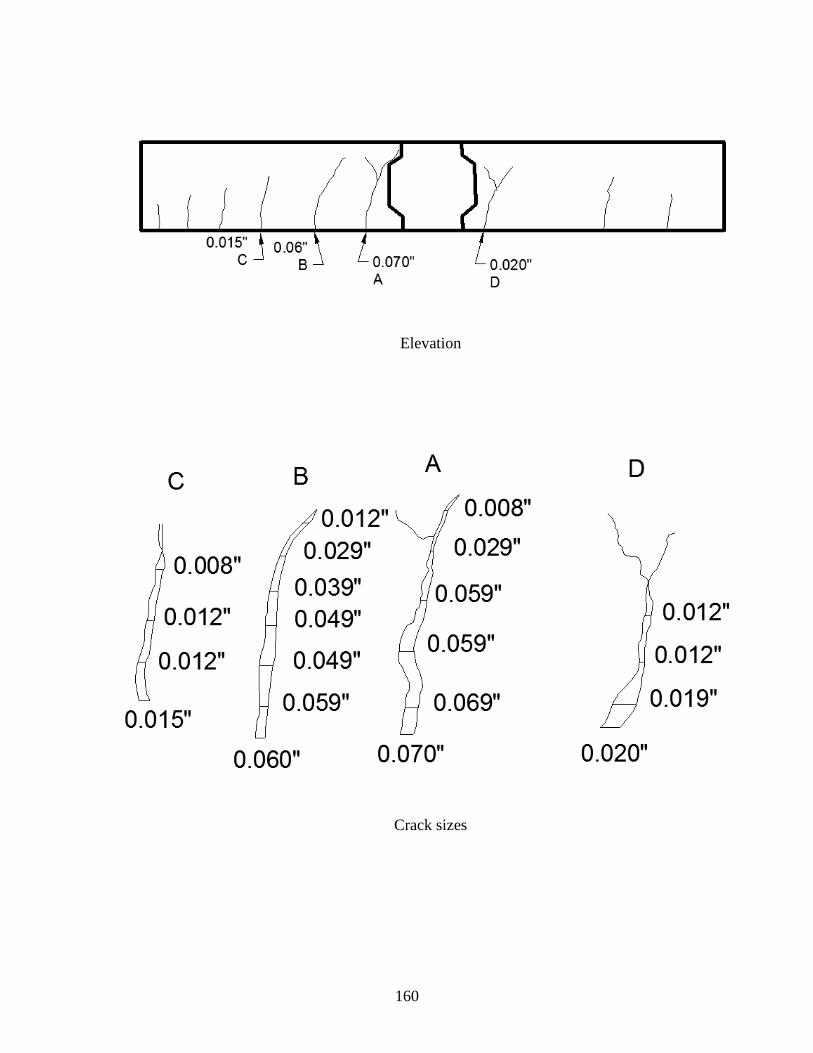
160
Elevation
Crack sizes

161
5) Ductal with PVA fibers (STA - 04)
Plan
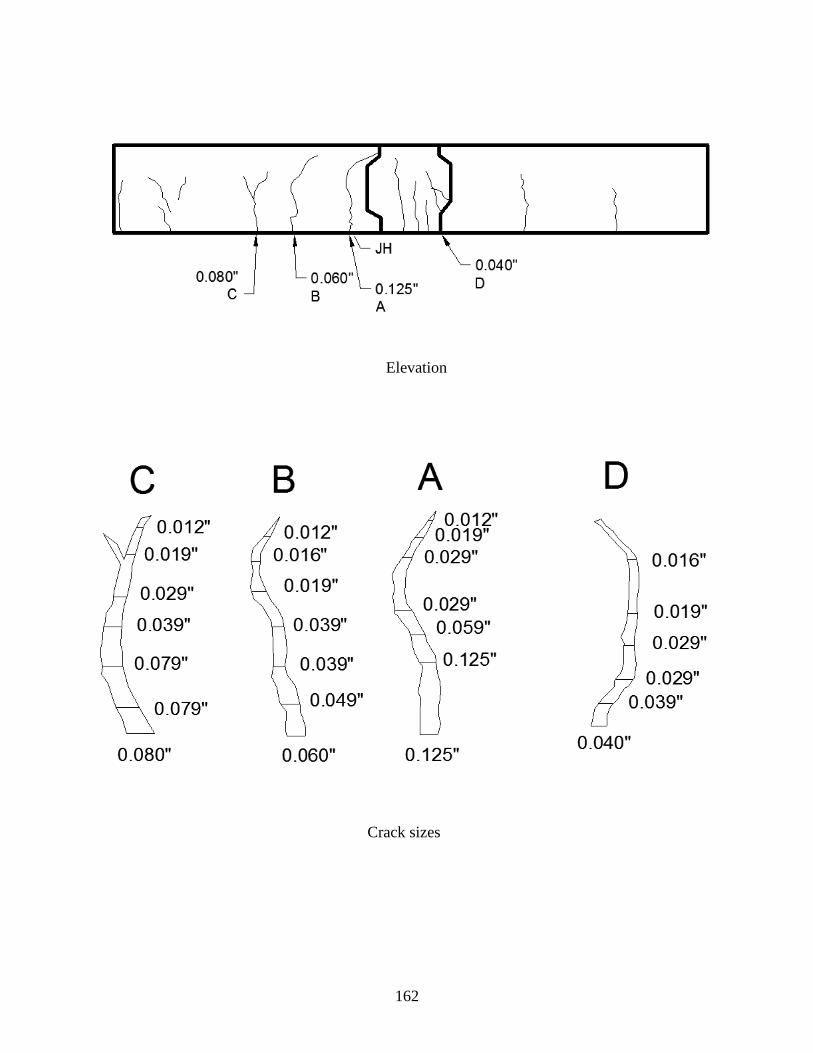
162
Elevation
Crack sizes
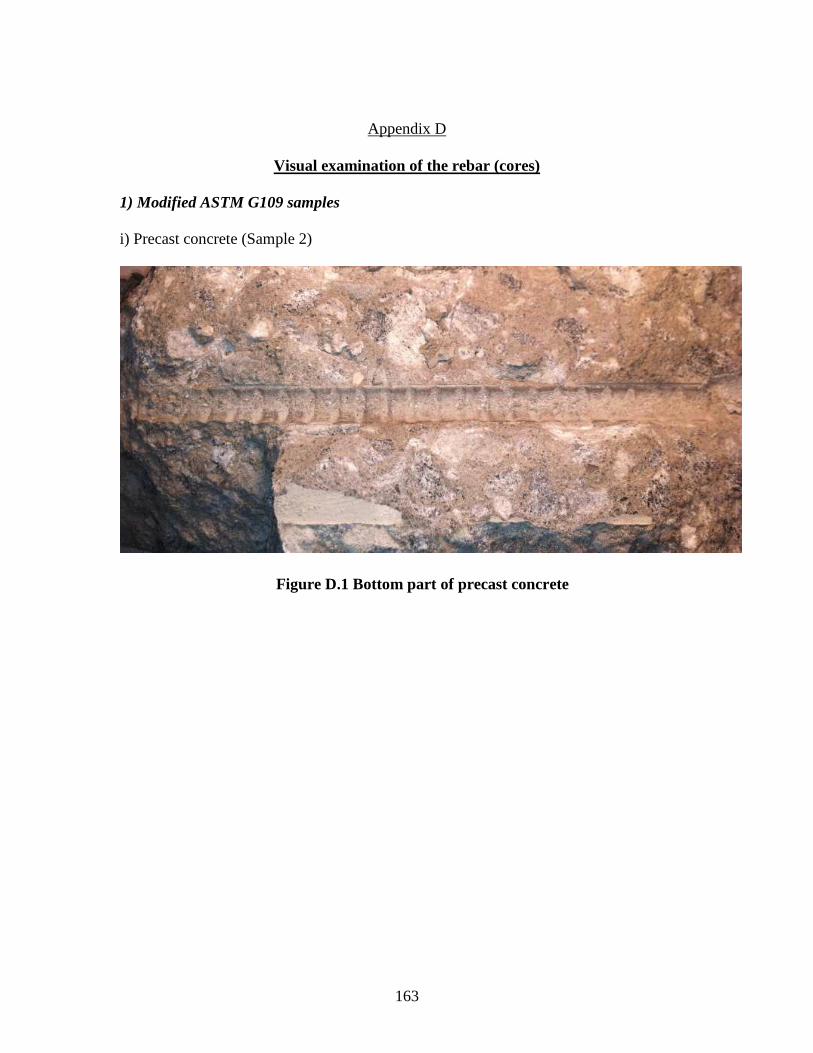
163
Appendix D
Visual examination of the rebar (cores)
1) Modified ASTM G109 samples
i) Precast concrete (Sample 2)
Figure D.1 Bottom part of precast concrete

164
ii) Ductal PVA (Sample 2)
Top part
Bottom part
Figure D.2 Concrete imprints of Ductal PVA

165
iii) Ductal Steel (Sample 3)
Top part
Bottom part
D.3 Concrete imprints of Ductal Steel
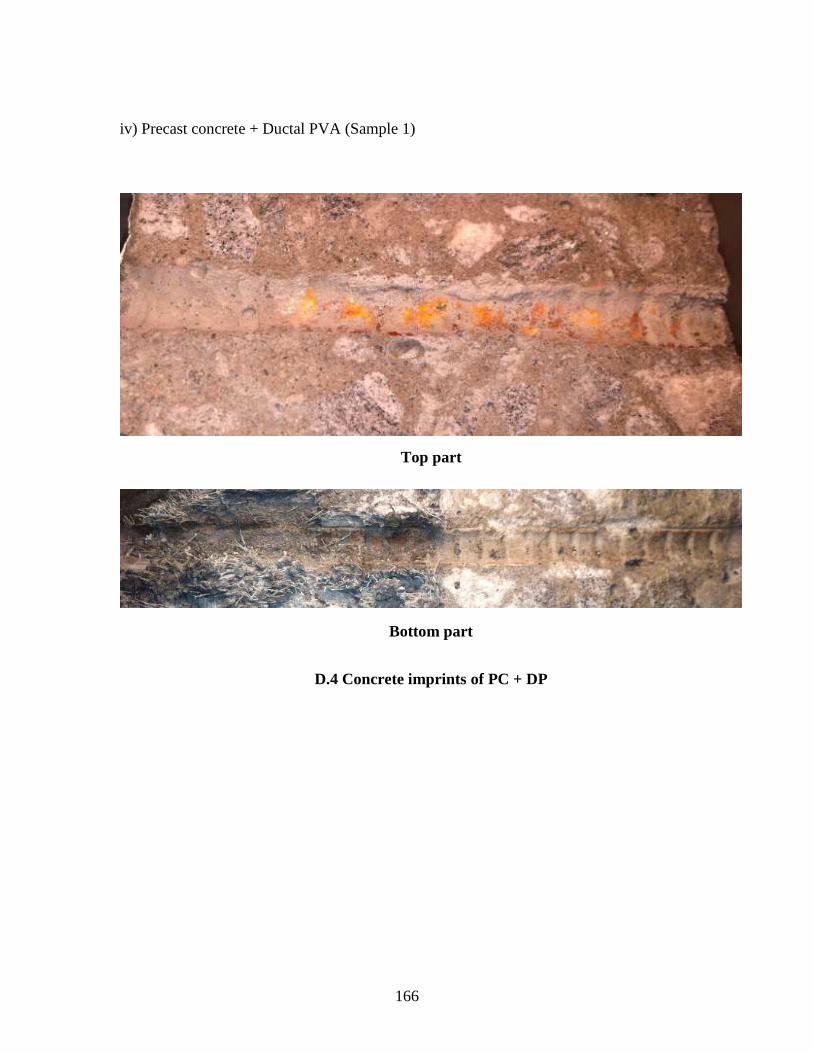
166
iv) Precast concrete + Ductal PVA (Sample 1)
Top part
Bottom part
D.4 Concrete imprints of PC + DP

167
v) Precast concrete + Ductal Steel fibers (Sample 2)
Top part
Bottom part
Figure D.5 Concrete imprints of sample B
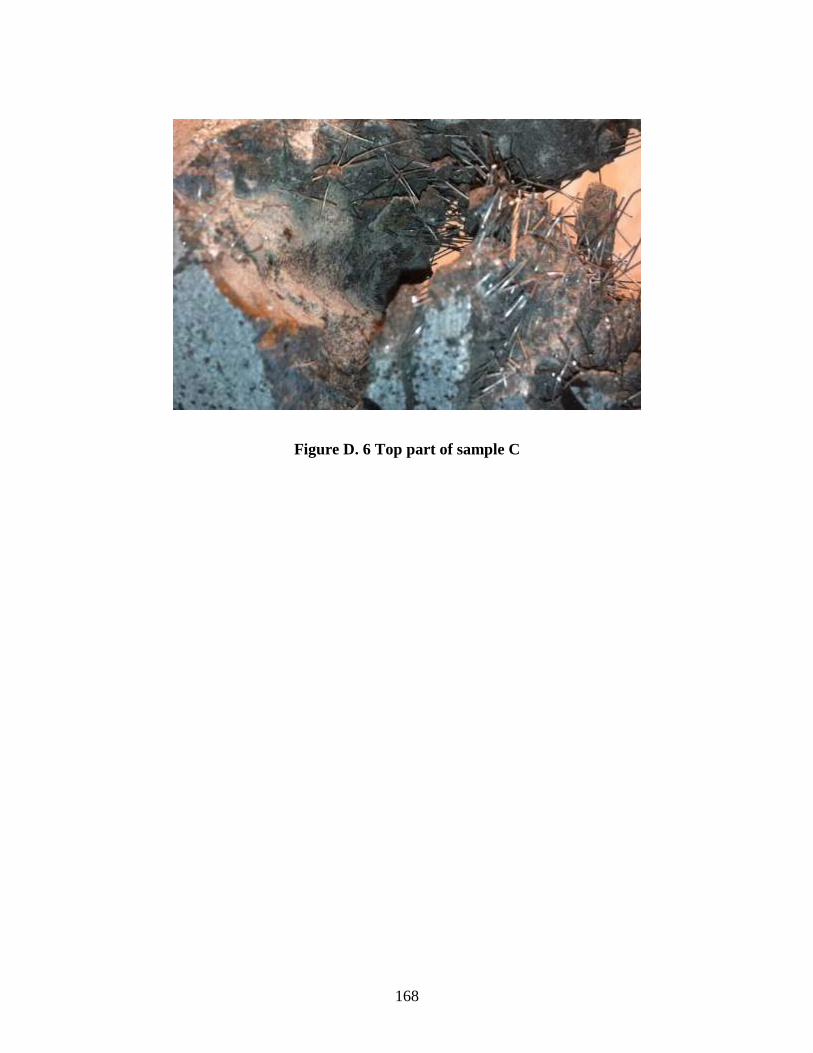
168
Figure D. 6 Top part of sample C

169
2) Un-cracked large samples
i) Ductal PVA
Top part
Bottom part
Figure D.7 Concrete imprints of sample 1
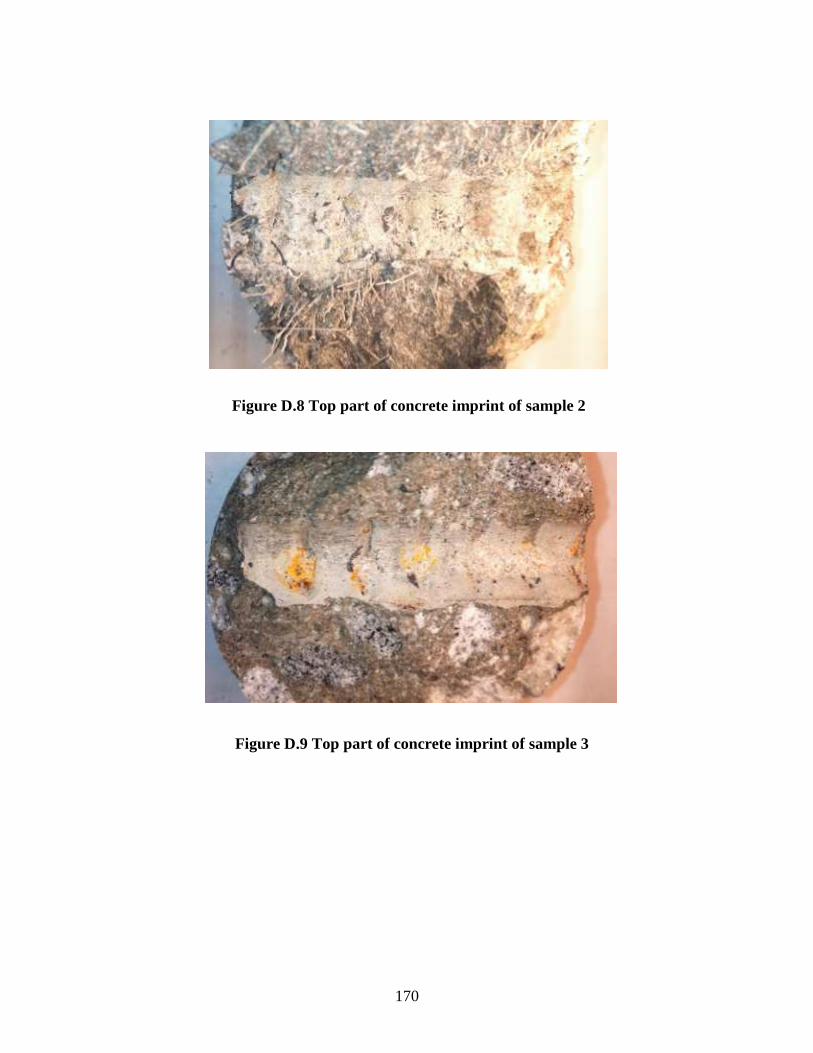
170
Figure D.9 Top part of concrete imprint of sample 3
Figure D.8 Top part of concrete imprint of sample 2
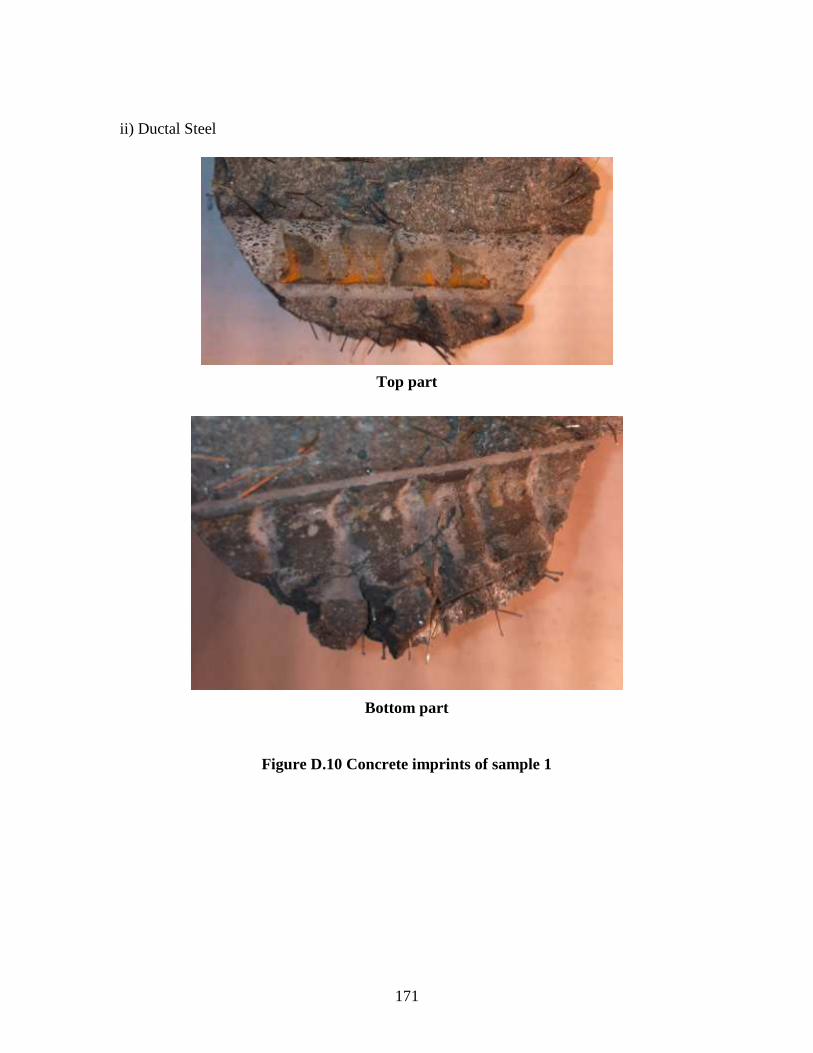
171
ii) Ductal Steel
Top part
Bottom part
Figure D.10 Concrete imprints of sample 1
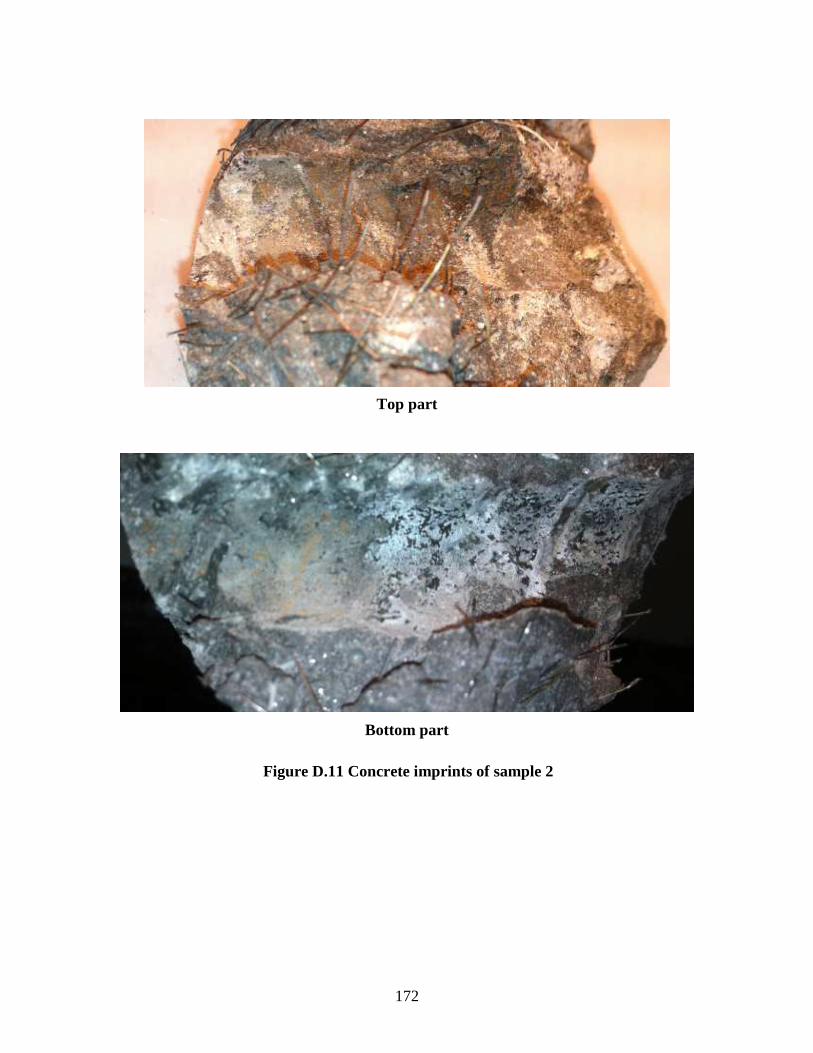
172
Top part
Bottom part
Figure D.11 Concrete imprints of sample 2
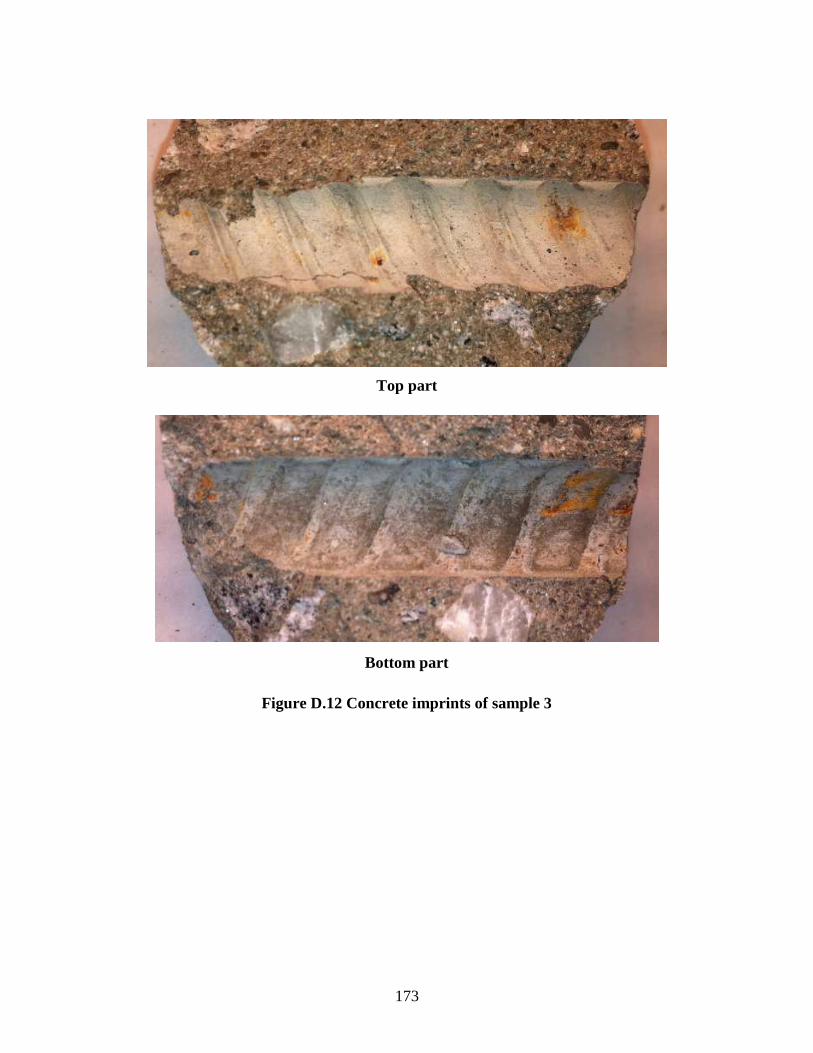
173
Top part
Bottom part
Figure D.12 Concrete imprints of sample 3
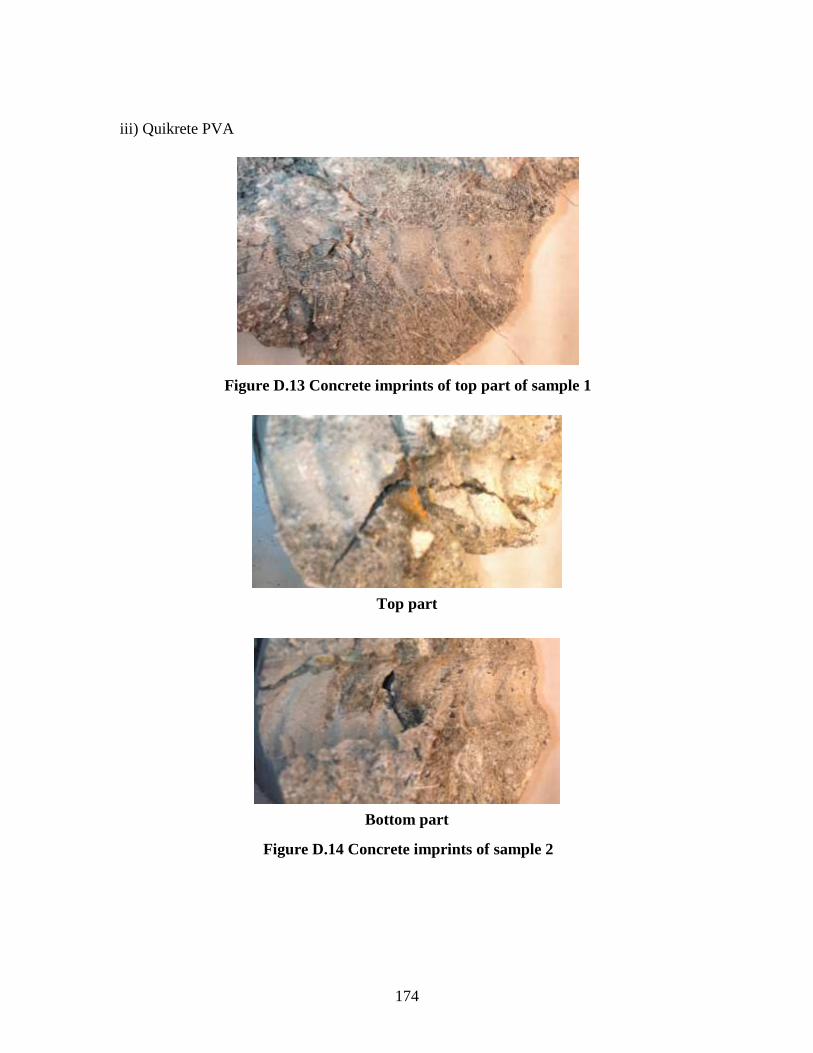
174
iii) Quikrete PVA
Figure D.13 Concrete imprints of top part of sample 1
Top part
Bottom part
Figure D.14 Concrete imprints of sample 2
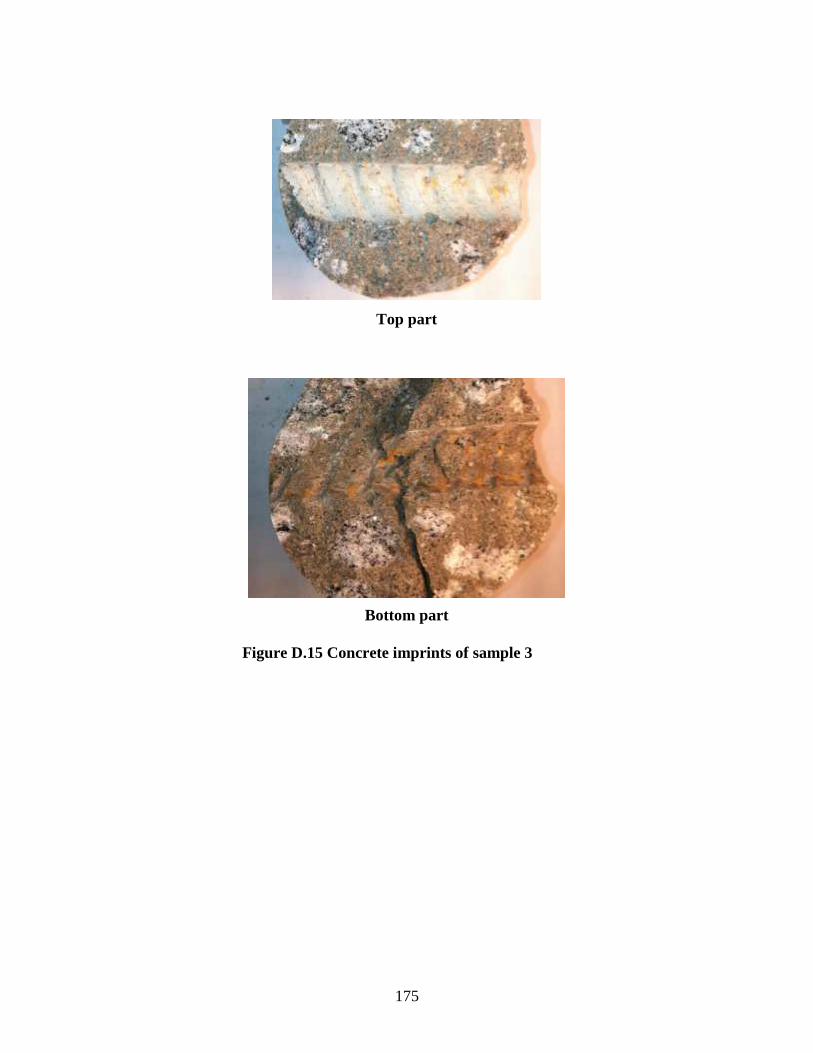
175
Top part
Bottom part
Figure D.15 Concrete imprints of sample 3
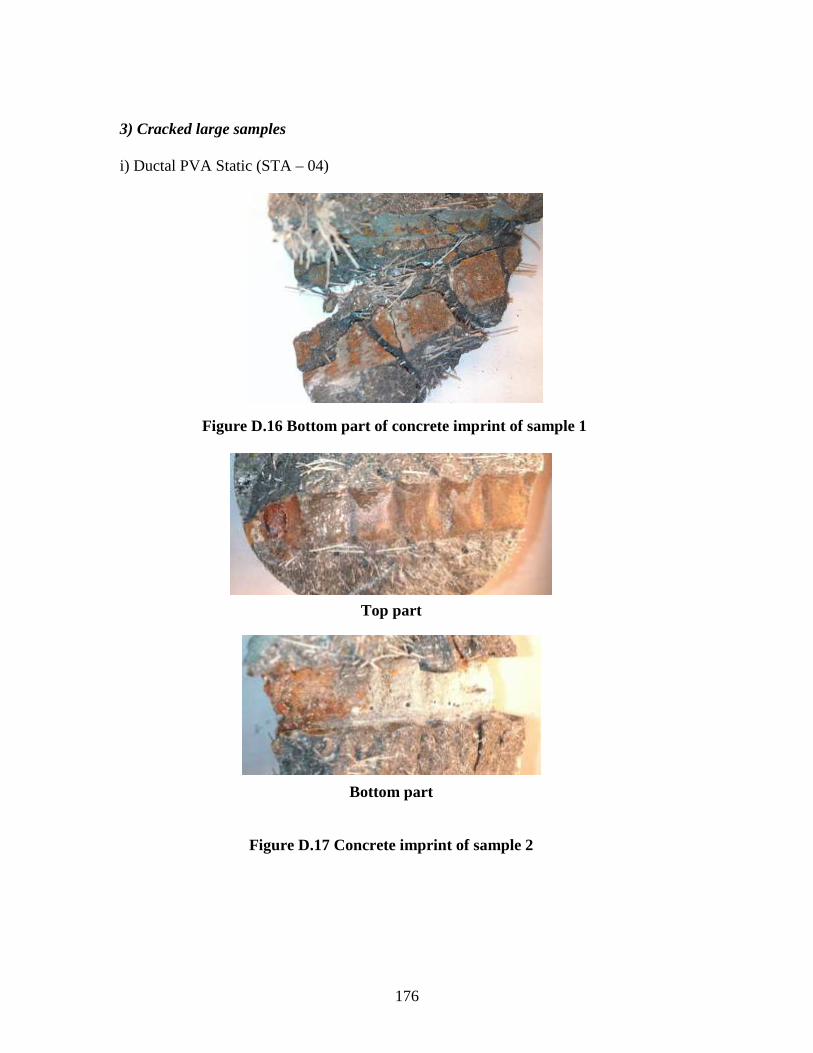
176
3) Cracked large samples
i) Ductal PVA Static (STA – 04)
Figure D.16 Bottom part of concrete imprint of sample 1
Top part
Figure D.17 Concrete imprint of sample 2
Bottom part
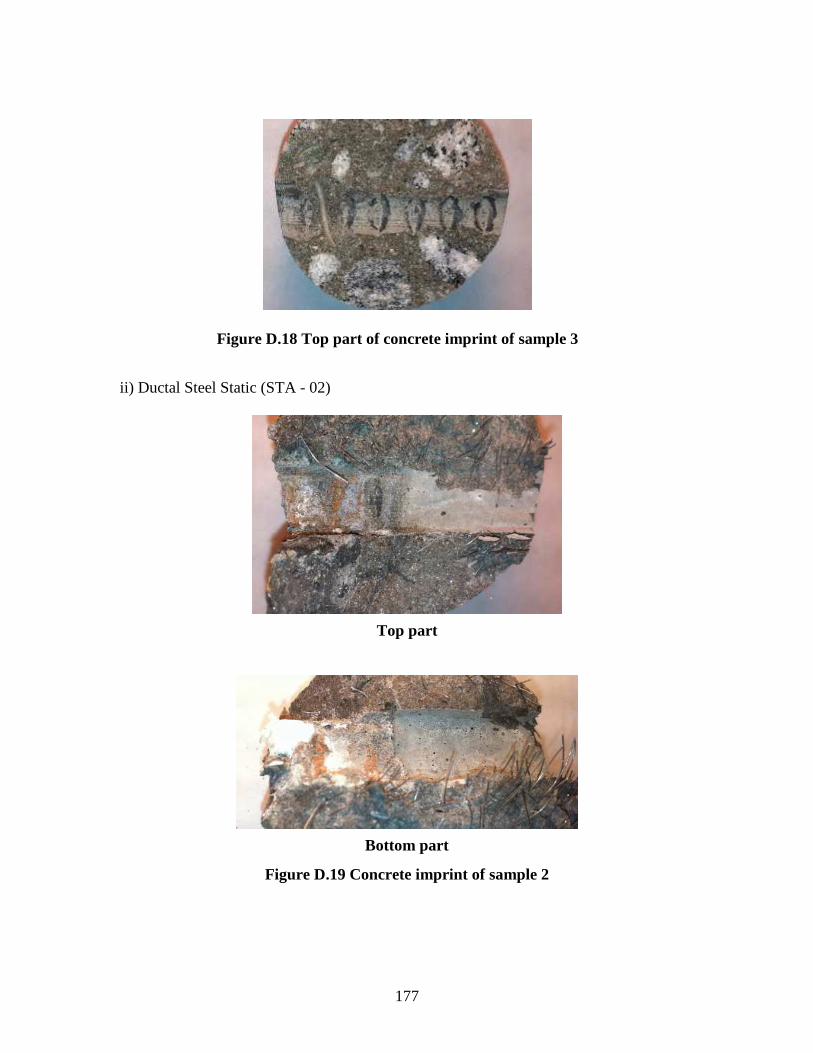
177
ii) Ductal Steel Static (STA - 02)
Figure D.18 Top part of concrete imprint of sample 3
Top part
Bottom part
Figure D.19 Concrete imprint of sample 2
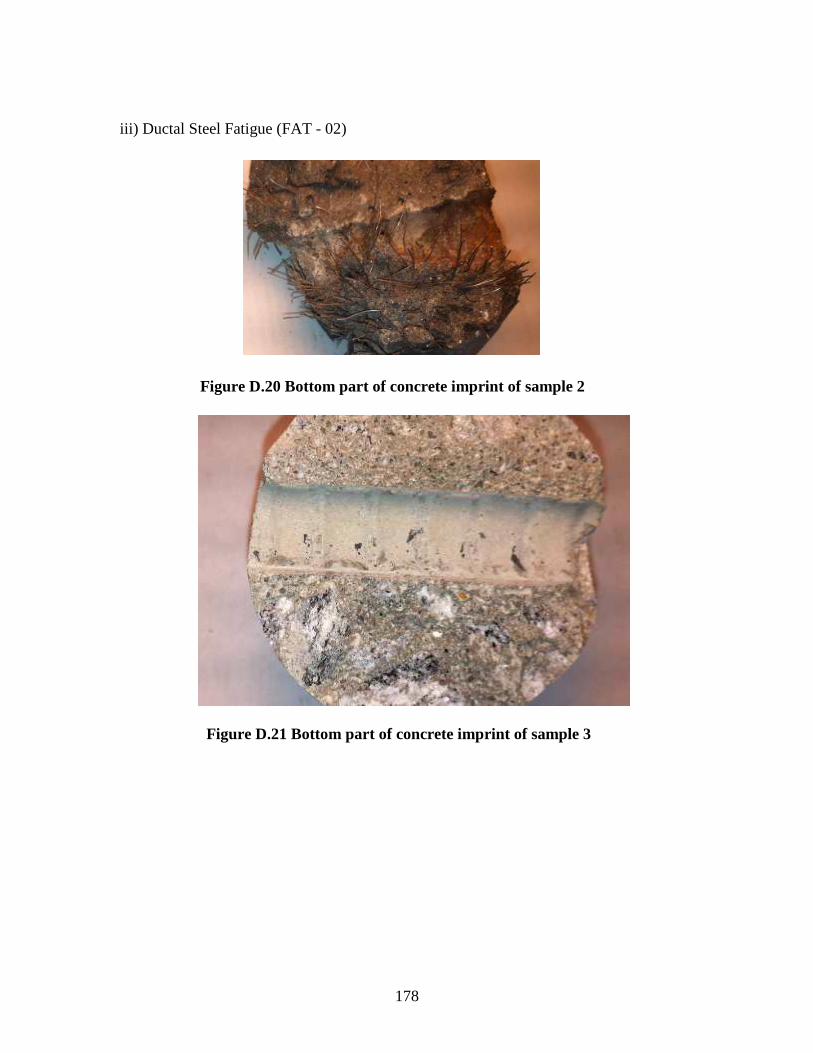
178
iii) Ductal Steel Fatigue (FAT - 02)
Figure D.20 Bottom part of concrete imprint of sample 2
Figure D.21 Bottom part of concrete imprint of sample 3

179
iv) Quikrete PVA Static (STA - 01)
Top part
Bottom part
Figure D.22 Concrete imprint of sample 1
Figure D.23 Concrete imprint of top part of sample 2
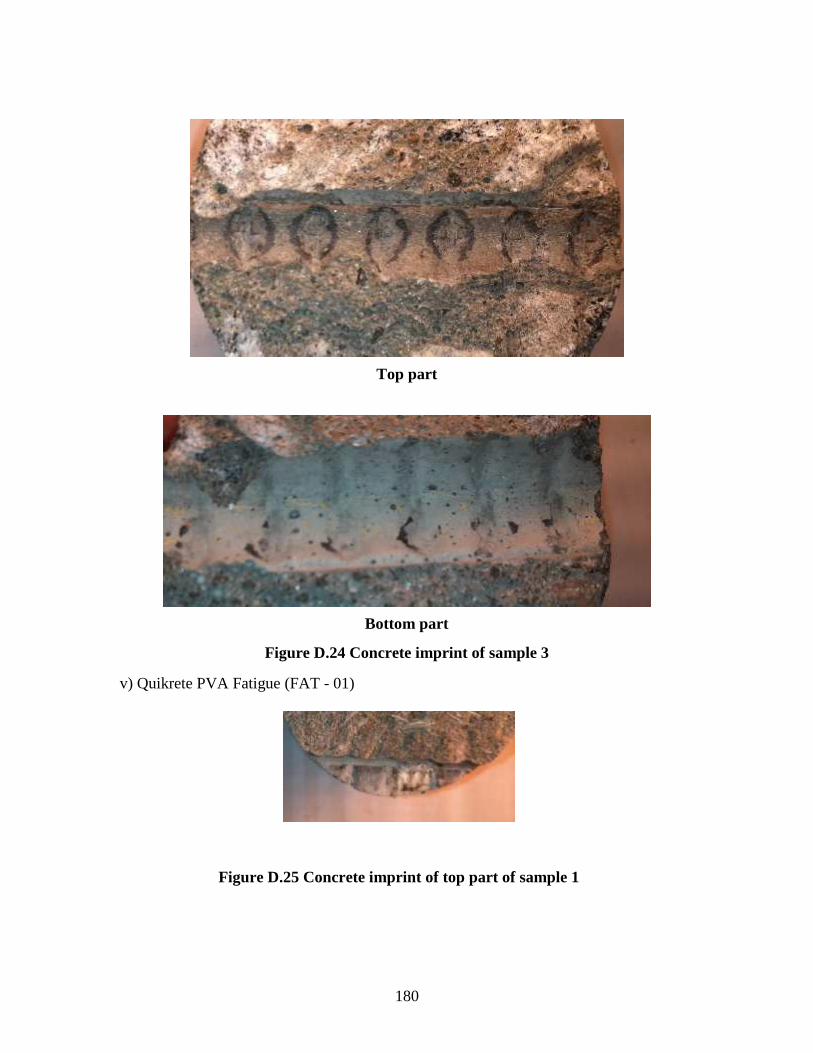
180
v) Quikrete PVA Fatigue (FAT - 01)
Top part
Bottom part
Figure D.24 Concrete imprint of sample 3
Figure D.25 Concrete imprint of top part of sample 1
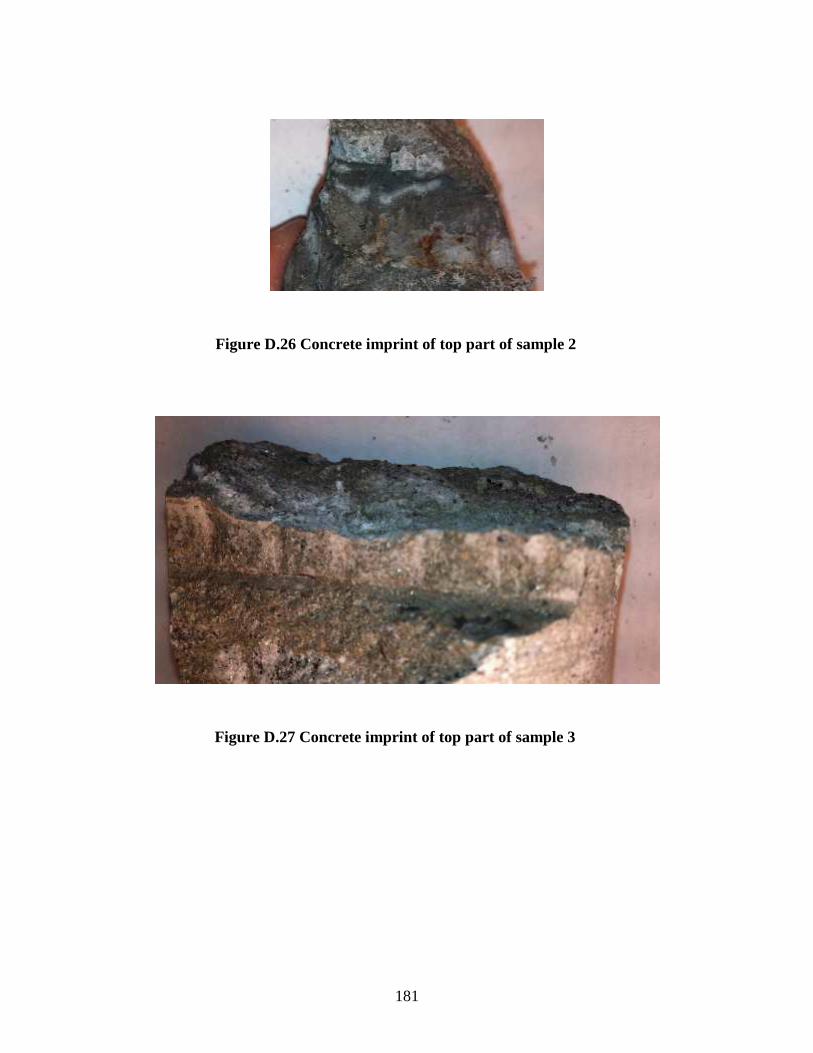
181
Figure D.26 Concrete imprint of top part of sample 2
Figure D.27 Concrete imprint of top part of sample 3
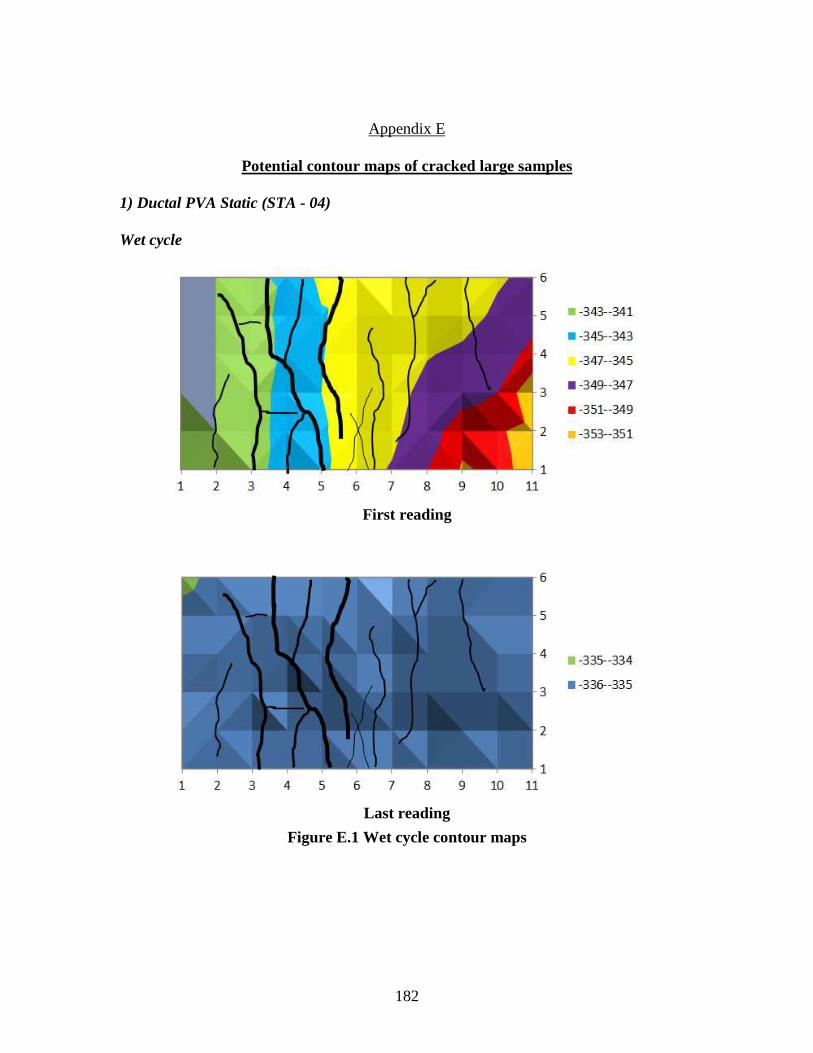
182
Appendix E
Potential contour maps of cracked large samples
1) Ductal PVA Static (STA - 04)
Wet cycle
First reading
Last reading
Figure E.1 Wet cycle contour maps
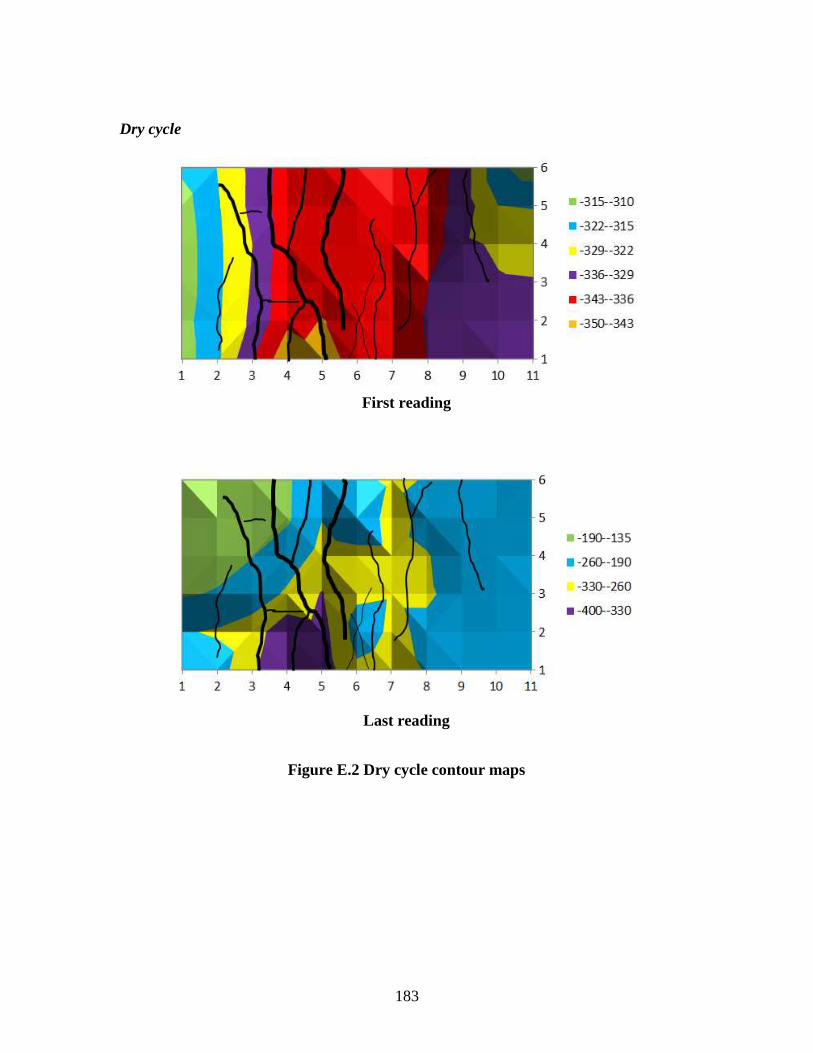
183
Dry cycle
First reading
Figure E.2 Dry cycle contour maps
Last reading

184
2) Ductal Steel Static (STA - 02)
Wet cycle
First reading
Last reading
Figure E.3 Wet cycle contour maps
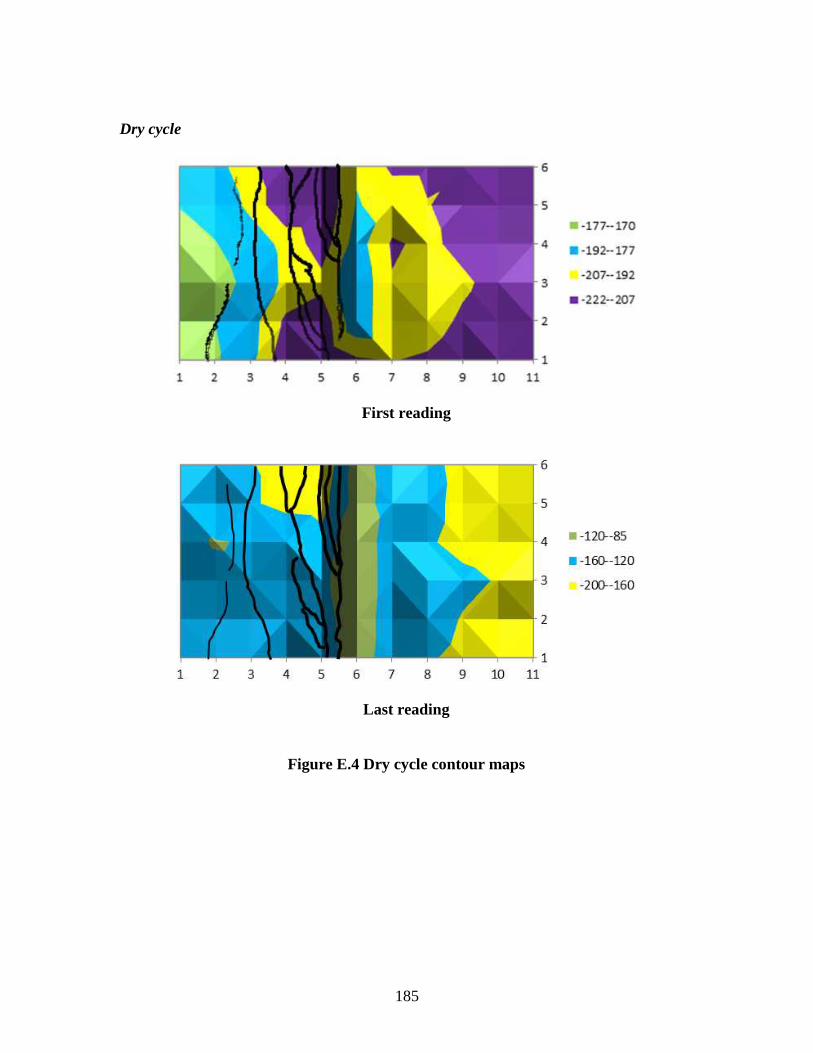
185
Dry cycle
First reading
Last reading
Figure E.4 Dry cycle contour maps
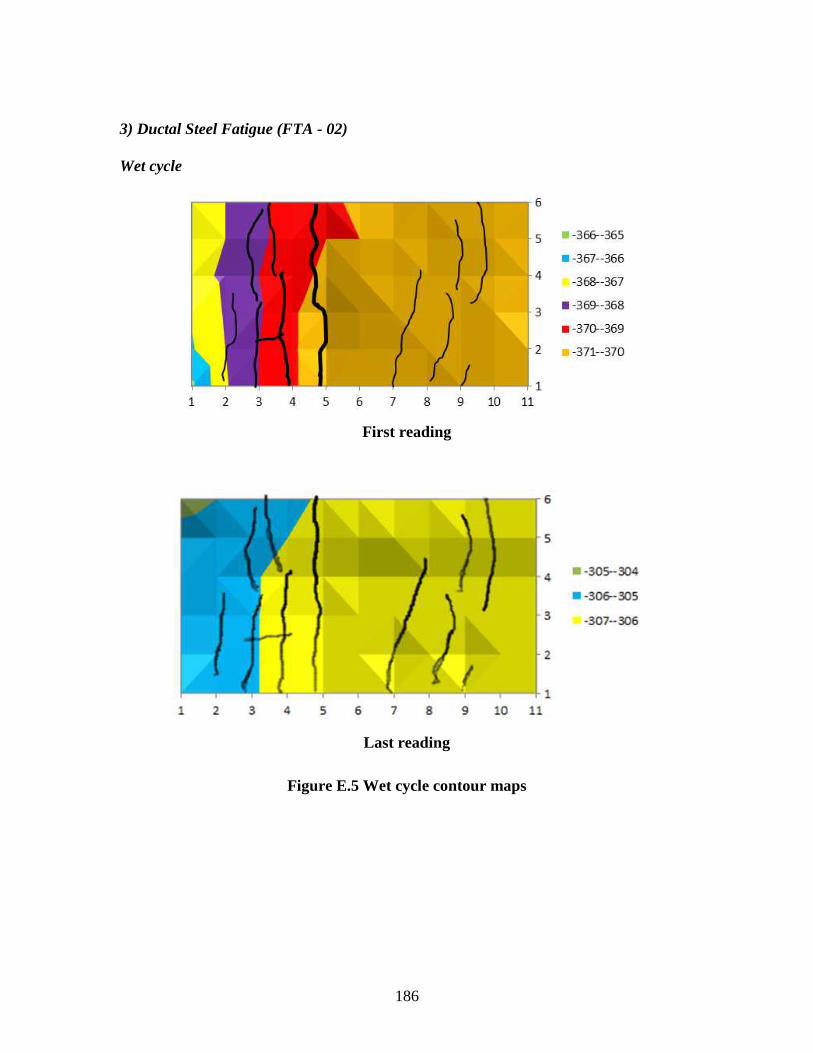
186
3) Ductal Steel Fatigue (FTA - 02)
Wet cycle
First reading
Last reading
Figure E.5 Wet cycle contour maps
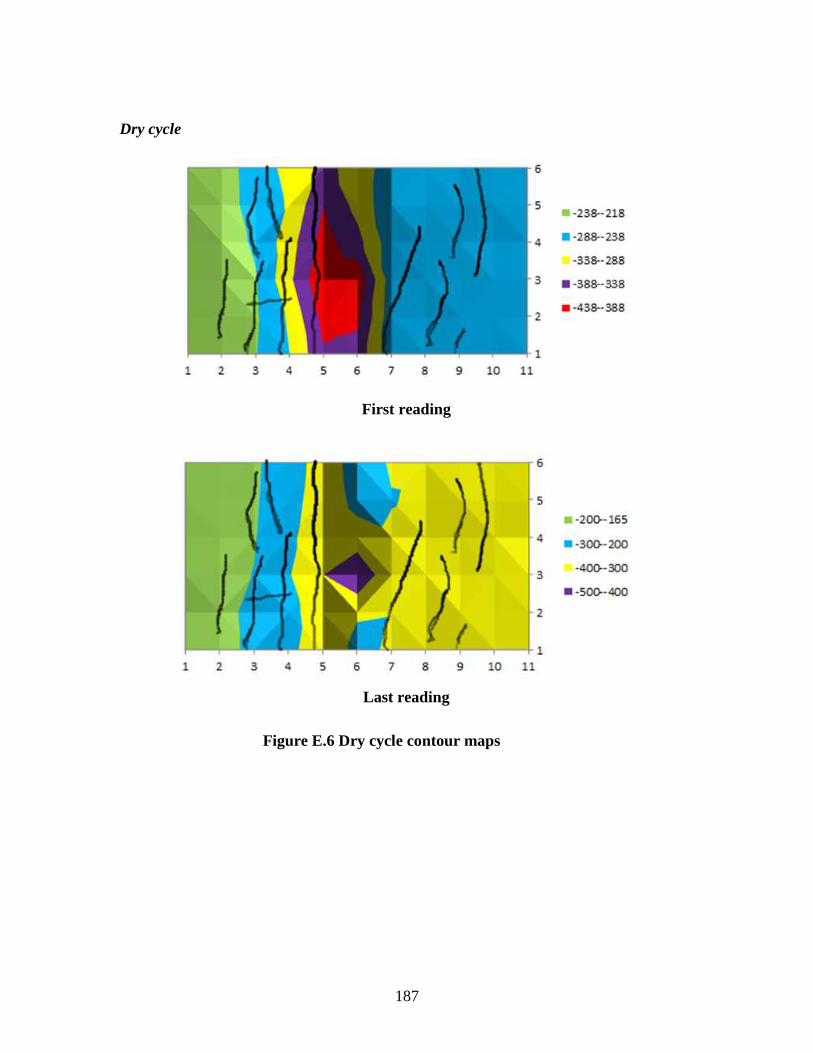
187
Dry cycle
First reading
Last reading
Figure E.6 Dry cycle contour maps
4) Quikrete PVA Fatigue (FAT
Wet cycle
188
4) Quikrete PVA Fatigue (FAT - 01)

Dry cycle
189
5) Quikrete PVA Static (STA
Wet cycle
190
5) Quikrete PVA Static (STA - 01)

Dry cycle
191

192
References
Abosrra, L., Ashour, A. F., & Youseffi, M. (2011). Corrosion of steel reinforcement in
concrete of different compressive strengths. Construction and Building Materials,
25(10), 3915-3925. doi:10.1016/j.conbuildmat.2011.04.023
Adeeb, S. M., Scholefield, B. W. J., Brown, T. G., Shrive, N. G., Kroman, J., Perry, V.
H., & Tadros, G. (2005). Modelling, testing, and construction of the first Ductal®
canopy in the world. Canadian Journal of Civil Engineering, 32(6), 1152-1165.
doi:10.1139/l05-065
Ahlborn, T. M., Harris, D. K., Misson, D. L., & Peuse, E. J. (2011). Characterization of
strength and durability of ultra-high-performance concrete under variable curing
conditions. Transportation Research Record, (2251), 68-75. doi:10.3141/2251-07
Ahmad, S. (2003). Reinforcement corrosion in concrete structures, its monitoring and
service life prediction - A review. Cement and Concrete Composites, 25(4-5), 459-
471. doi:10.1016/S0958-9465(02)00086-0
Al-Amoudi, O., & Maslehuddin, M. (1993). Effect of chloride and sulfate ions on
reinforcement corrosion. Cement and Concrete Research, 23(1), 139-146.
doi:10.1016/0008-8846(93)90144-X
Angst, U. M., Elsener, B., Larsen, C. K., & Vennesland, O. (2011). Chloride induced
reinforcement corrosion: Electrochemical monitoring of initiation stage and chloride

193
threshold values. Corrosion Science, 53(4), 1451-1464.
doi:10.1016/j.corsci.2011.01.025
Ann, K. Y., & Song, H. (2007). Chloride threshold level for corrosion of steel in
concrete. Corrosion Science, 49(11), 4113-4133. doi:10.1016/j.corsci.2007.05.007
Arya, C., & Ofori-Darko, F. (1996). Influence of crack frequency on reinforcement
corrosion in concrete. Cement and Concrete Research, 26(3), 345-353.
Aveldano, R. R., & Ortega, N. F. (2011). Characterization of concrete cracking due to
corrosion of reinforcements in different environments. Construction and Building
Materials, 25(2), 630-637. doi:10.1016/j.conbuildmat.2010.07.029
Barnett, S. J., Lataste, J., Parry, T., Millard, S. G., & Soutsos, M. N. (2010). Assessment
of fibre orientation in ultra high performance fibre reinforced concrete and its effect
on flexural strength. Materials and Structures/Materiaux Et Constructions, 43(7),
1009-1023. doi:10.1617/s11527-009-9562-3
Bhaskar, S., Gettu, R., Bharatkumar, B. H., & Neelamegam, M. (2011). Studies on
chloride induced corrosion of reinforcement steel in cracked concrete. Structural
Durability & Health Monitoring, 7(4), 231-51.
Broomfield, J. P., Davies, K., & Hladky, K. (2002). The use of permanent corrosion
monitoring in new and existing reinforced concrete structures. Cement and Concrete
Composites, 24(1), 27-34. doi:10.1016/S0958-9465(01)00024-5
194
Charron, J. -., Denarie, E., & Bruhwiler, E. (2007). Permeability of ultra high
performance fiber reinforced concretes (UHPFRC) under high stresses. Materials
and Structures/Materiaux Et Constructions, 40(3), 269-277. doi:10.1617/s11527-
006-9105-0
Charron, J. -., Denarie, E., & Bruhwiler, E. (2008). Transport properties of water and
glycol in an ultra high performance fiber reinforced concrete (UHPFRC) under high
tensile deformation. Cement and Concrete Research, 38(5), 689-98.
doi:10.1016/j.cemconres.2007.12.006
Chen, D., & Mahadevan, S. (2008). Chloride-induced reinforcement corrosion and
concrete cracking simulation. Cement and Concrete Composites, 30(3), 227-38.
doi:10.1016/j.cemconcomp.2006.10.007
Cho, S. -., Chung, L., & Roh, Y. (2005). Estimation of rebar corrosion rate in reinforced
concrete structure. Corrosion Reviews, 23(4-6), 329-353.
Corinaldesi, V., & Moriconi, G. (2012). Mechanical and thermal evaluation of ultra high
performance fiber reinforced concretes for engineering applications. Construction
and Building Materials, 26(1), 289-294. doi:10.1016/j.conbuildmat.2011.06.023
Feliu, S., Gonzalez, J. A., & Andrade, C. (1996). Electrochemical methods for on-site
determinations of corrosion rates of rebars. Paper presented at the Proceedings of the
1994 Symposium on Techniques to Assess the Corrosion Activity of Steel Reinforced
Concrete, December 7, 1994 - December 7, , 1276 107-118.

195
Gao, X., Molyneaux, T. C. K., & Patnaikuni, I. (2008). Dynamic impact testing of ultra
high performance fibre reinforced concrete. Paper presented at the 20th Australasian
Conference on the Mechanics of Structures and Materials, ACMSM20, December 2,
2008 - December 5, 631-636.
Gowers, K. R., & Millard, S. G. (1993). On-site linear polarization resistance mapping of
reinforced concrete structures. Corrosion Science, 35(-8), 1593-1600.
Gowers, K. R., & Millard, S. G. (1999). Measurement of concrete resistivity for
assessment of corrosion severity of steel using wenner technique. ACI Materials
Journal, 96(5), 536-541.
Hanna, K. E., Morcous, G., & Tadros, M. K. (2009). Transverse post-tensioning design
and detailing of precast, prestressed concrete adjacentbox-girder bridges. PCI
Journal, 54(4), 160-174.
Hassan, A. M. T., Jones, S. W., & Mahmud, G. H. (2012). Experimental test methods to
determine the uniaxial tensile and compressive behaviour of ultra high performance
fibre reinforced concrete(UHPFRC). Construction and Building Materials, 37, 874-
882. doi:10.1016/j.conbuildmat.2012.04.030
Hussain, S. E., Al-Gahtani, A., & Rasheeduzzafar. (1996). Chloride threshold for
corrosion of reinforcement in concrete. ACI Materials Journal, 93(6), 534-538.

196
Isaacs, J., Magallanes, J., Rebentrost, M., & Wight, G. (2009). Exploratory dynamic
material characterizing tests on ultra-high performance fibre reinforced concrete.
Paper presented at the 8th International Conference on Shock and Impact Loads on
Structures, December 2, 2009 - December 4, 337-344.
Jaffer, S. J., & Hansson, C. M. (2008). The influence of cracks on chloride-induced
corrosion of steel in ordinary portland cement and high performance concretes
subjected to different loading conditions. Corrosion Science, 50(12), 3343-55.
doi:10.1016/j.corsci.2008.09.018
Kato, E., Kato, Y., & Uomoto, T. (2005). Development of simulation model of chloride
ion transportation in cracked concrete. Journal of Advanced Concrete Technology,
3(1), 85-94.
Kazemi, S., & Lubell, A. S. (2011). Size effects on the mechanical properties of
UHPFRC. Paper presented at the Annual Conference of the Canadian Society for
Civil Engineering 2011, CSCE 2011, June 14, 2011 - June 17, , 2 1256-1265.
Kida, T., Minakuchi, K., Abe, T., Sawano, T., & Katagiri, M. (2006). Experimental study
on mechanical properties of ultra high strength fiber reinforced concrete beam.
Theoretical and Applied Mechanics Japan, 55, 83-88.
Kouril, M., Novak, P., & Bojko, M. (2006). Limitations of the linear polarization method
to determine stainless steel corrosion rate in concrete environment. Cement and
Concrete Composites, 28(3), 220-225. doi:10.1016/j.cemconcomp.2006.01.007
197
Law, D. W., Millard, S. G., & Bungey, J. H. (2000). Linear polarization resistance
measurements using a potentiostatically controlled guard ring. NDT and E
International, 33(1), 15-21. doi:10.1016/S0963-8695(99)00015-8
Lei Voo, Y., & Foster, S. J. (2010). Characteristics of ultra-high performance 'ductile'
concrete and its impact on sustainable construction. IES Journal Part A: Civil and
Structural Engineering, 3(3), 168-187. doi:10.1080/19373260.2010.492588
Mangat, P. S., & Molloy, B. T. (1991). Influence of pfa, slag and microsilica on chloride
induced corrosion of reinforcement in concrete. Cement and Concrete Research,
21(5), 819-834. doi:10.1016/0008-8846(91)90177-J
Montemor, M. F., Simoes, A. M. P., & Ferreira, M. G. S. (2003). Chloride-induced
corrosion on reinforcing steel: From the fundamentals to the monitoring techniques.
Cement and Concrete Composites, 25(4-5), 491-502. doi:10.1016/S0958-
9465(02)00089-6
Naito, C., Jones, L., & Hodgson, I. (2011). Development of flexural strength rating
procedures for adjacent prestressed concrete box girder bridges. Journal of Bridge
Engineering, 16(5), 662-670. doi:10.1061/(ASCE)BE.1943-5592.0000186
Nanayakkara, O., & Kato, Y. (2008). Effect of cathodic-anodic ratio and chloride content
on macro-cell corrosion. Seisan Kenkyu, 60(3), 20-3.
198
Nematollahi, B., Saifulnaz, R. M. R., Jaafar, M. S., & Yen, L. V. (2010). A review on
ultra high performance `ductile' concrete (UHPdC) technology. International
Journal of Civil and Structural Engineering, 2(3), 1003-18.
doi:10.6088/ijcser.00202030026
Nishikata, A., Yamashita, Y., Katayama, H., Tsuru, T., Usami, A., Tanabe, K., &
Mabuchi, H. (1995). An electrochemical impedance study on atmospheric corrosion
of steels in a cyclic wet-dry condition. Corrosion Science, 37(12), 2059-69.
doi:10.1016/0010-938X(95)00104-R
Otieno, M. B., Alexander, M. G., & Beushausen, H. D. (2010). Suitability of various
measurement techniques for assessing corrosion in cracked concrete. ACI Materials
Journal, 107(5), 481-489.
Perry, V., Moore, B., & Bierwagen, D. (2006). Revolutionary concrete solutions
understanding ultra-high-performance, fiber-reinforced concrete. Construction
Specifier, 59(10), 40-52.
Pour-Ghaz, M., Isgor, O. B., & Ghods, P. (2009). The effect of temperature on the
corrosion of steel in concrete. part 1. simulated polarization resistance tests and
model development. Corrosion Science, 51(2), 415-25.
doi:10.1016/j.corsci.2008.10.034
Poursaee, A. (2011). Corrosion measurement techniques in steel reinforced concrete.
Journal of ASTM International, 8(5), JAI103283 (15 pp.). doi:10.1520/JAI103283

199
Ralph, B., Burkert, A., & Gerd, E. (2006). Portable equipment for determination of
corrosion stage of concrete structures - comparison of laboratory and on-site
experiences. Paper presented at the Corrosion 2006, September 10, 2006 -
September 14, 064071-0640711.
Reou, J. S., & Ann, K. Y. (2009). Electrochemical assessment on the corrosion risk of
steel embedment in OPC concrete depending on the corrosion detection techniques.
Materials Chemistry and Physics, 113(1), 78-84.
doi:10.1016/j.matchemphys.2008.07.063
Shaheen, E., & Shrive, N. G. (2007). Cyclic loading and fracture mechanics of
Ductal® concrete. International Journal of Fracture, 148(3), 251-260.
doi:10.1007/s10704-008-9199-1
Shi, C., Deng, D., & Xie, Y. (2006). Pore structure and chloride ion transport
mechanisms in concrete. Paper presented at the Environmental Ecology and
Technology of Concrete, , 302-303 528-535.
Skazlic, M., & Bjegovic, D. (2009). Toughness testing of ultra high performance fibre
reinforced concrete. Materials and Structures/Materiaux Et Constructions, 42(8),
1025-1038. doi:10.1617/s11527-008-9441-3
Su-Tae Kang, Lee, Y., Yon-Dong Park, & Jin-Keun Kim. (2010). Tensile fracture
properties of an ultra high performance fiber reinforced concrete (UHPFRC) with
200
steel fiber. Composite Structures, 92(1), 61-71.
doi:10.1016/j.compstruct.2009.06.012
Trinh, B. P., & Van Chanh, N. (2012). Study on the properties of ultra high performance
fiber reinforced concrete. Paper presented at the 2011 International Conference on
Manufacturing Science and Technology, ICMST 2011, September 16, 2011 -
September 18, , 383-390 3305-3312. doi:10.4028/www.scientific.net/AMR.383-
390.3305
Tsukahara, E., & Uomoto, T. (2000). Corrosion rate of reinforcing steel bars in cracked
concrete. Transactions of the Japan Concrete Institute, 22, 155-166.
Ustabas, I. (2012). The effect of capillarity on chloride transport and the prediction of the
accumulation region of chloride in concretes with reinforcement corrosion.
Construction & Building Materials, 28(1), 640-7.
doi:10.1016/j.conbuildmat.2011.10.043
Vedalakshmi, R., Balamurugan, L., Saraswathy, V., Kim, S. -., & Ann, K. Y. (2010).
Reliability of galvanostatic pulse technique in assessing the corrosion rate of rebar in
concrete structures: Laboratory vs field studies. KSCE Journal of Civil Engineering,
14(6), 867-77. doi:10.1007/s12205-010-1023-6
Yoo, J., Park, Z., Kim, J., & Chung, L. (2003). Development of a galvanic sensor system
for detecting the corrosion damage of the steel embedded in concrete structures: Part

201
1. laboratory tests to correlate galvanic current with actual damage. Cement and
Concrete Research, 33(12), 2057-2062. doi:10.1016/S0008-8846(03)00226-6
Yunovich, M., Thompson, N. G., & Virmani, Y. P. (2005). Corrosion protection system
for construction and rehabilitation of reinforced concrete bridges. International
Journal of Materials & Product Technology, 23(3-4), 269-85.
doi:10.1504/IJMPT.2005.007731
Zhang, R., Castel, A., & Francois, R. (2012). Concrete cracking due to chloride-induced
reinforcement corrosion - influence of steel-concrete interface defects due to the
'top-bar effect'. European Journal of Environmental and Civil Engineering, 16(3-4),
402-413. doi:10.1080/19648189.2012.667984
Zhang, R., Castel, A., & Francois, R. (2009). The corrosion pattern of reinforcement and
its influence on serviceability of reinforced concrete members in chloride
environment. Cement and Concrete Research, 39(11), 1077-1086.
doi:10.1016/j.cemconres.2009.07.025
R. F. Stratfull, Half-cell potential and the corrosion of steel in concrete. 1972, California
division of highways, State of California: Sacramento, California.
ACI 222R, Corrosion of Metals in Concrete. 1996
Hansson C. M. , Comments on electrochemical measurements of the rate of corrosion of
steel in concrete. Cement and Concrete Research, 1984. 14: p. 574-584.

202
Paul Acker, Ductal Technology: A LaFarge Spectrum of Properties, A Wide Range of
Applications, Paris, France.
C. M. Hansson, A. Poursaee and S. J. Jaffer (2007), CORROSION OF REINFORCING
BARS IN CONCRETE, Portland Cement Association.
Denny A. Jones (second edition), Principles and Prevention of Corrosion.
David Darwin, JoAnn Browning, Matthew O’Reily, Carl Locke Jr. and Y. Paul Virmani
(2011), Multiple Corrosion Protection Systems for Reinforced Concrete Bridge
Components, Federal Highway Administration.