Embed Size (px)
Citation preview
ORIGINAL RESEARCHpublished: 01 March 2017
doi: 10.3389/fnhum.2017.00090
Frontiers in Human Neuroscience | www.frontiersin.org 1 March 2017 | Volume 11 | Article 90
Edited by:
Klaus Gramann,
Technical University of Berlin,
Germany
Reviewed by:
Evangelos Paraskevopoulos,
Aristotle University of Thessaloniki,
Greece
Grace Leslie,
University of California, San Diego,
USA
*Correspondence:
David A. Bridwell
Received: 28 September 2016
Accepted: 14 February 2017
Published: 01 March 2017
Citation:
Bridwell DA, Leslie E, McCoy DQ,
Plis SM and Calhoun VD (2017)
Cortical Sensitivity to Guitar Note
Patterns: EEG Entrainment to
Repetition and Key.
Front. Hum. Neurosci. 11:90.
doi: 10.3389/fnhum.2017.00090
Cortical Sensitivity to Guitar NotePatterns: EEG Entrainment toRepetition and KeyDavid A. Bridwell 1*, Emily Leslie 1, Dakarai Q. McCoy 1, 2, 3, Sergey M. Plis 1 and
Vince D. Calhoun 1, 2
1 The Mind Research Network, Albuquerque, NM, USA, 2Department of Electrical and Computer Engineering, University of
New Mexico, Albuquerque, NM, USA, 3 The MARC Program, University of New Mexico, Albuquerque, NM, USA
Music is ubiquitous throughout recent human culture, and many individual’s have an
innate ability to appreciate and understand music. Our appreciation of music likely
emerges from the brain’s ability to process a series of repeated complex acoustic
patterns. In order to understand these processes further, cortical responses were
measured to a series of guitar notes presented with a musical pattern or without
a pattern. ERP responses to individual notes were measured using a 24 electrode
Bluetooth mobile EEG system (Smarting mBrainTrain) while 13 healthy non-musicians
listened to structured (i.e., within musical keys and with repetition) or random sequences
of guitar notes for 10 min each. We demonstrate an increased amplitude to the ERP
that appears ∼200 ms to notes presented within the musical sequence. This amplitude
difference between random notes and patterned notes likely reflects individual’s cortical
sensitivity to guitar note patterns. These amplitudes were compared to ERP responses
to a rare note embedded within a stream of frequent notes to determine whether
the sensitivity to complex musical structure overlaps with the sensitivity to simple
irregularities reflected in traditional auditory oddball experiments. Response amplitudes
to the negative peak at ∼175 ms are statistically correlated with the mismatch negativity
(MMN) response measured to a rare note presented among a series of frequent notes
(i.e., in a traditional oddball sequence), but responses to the subsequent positive peak
at ∼200 do not show a statistical relationship with the P300 response. Thus, the
sensitivity to musical structure identified to 4 Hz note patterns appears somewhat distinct
from the sensitivity to statistical regularities reflected in the traditional “auditory oddball”
sequence. Overall, we suggest that this is a promising approach to examine individual’s
sensitivity to complex acoustic patterns, which may overlap with higher level cognitive
processes, including language.
Keywords: mobile EEG, music, oddball, guitar, SSAEP, frequency tagging
INTRODUCTION
Music is composed of a series of repeated, complex acoustic patterns. Thus, our appreciation ofmusic emerges from our ability to identify and represent complex streams of sounds. Traditionalwesternmusic is composed of 12 notes with a fixed frequency interval between them, and a subset ofseven notes comprise a key or diatonic scale (Krumhansl, 1990, 2000). Children and adults without
Bridwell et al. Cortical Sensitivity to Musical Structure
musical training are sensitive to musical beat and scales,suggesting that individuals are predisposed to detect thesemusical features (Trehub et al., 1999; Brattico et al., 2006; Cirelliet al., 2016). Thus, the sensitivity to these features may be relatedto healthy development, and may overlap with the developmentof cognitive systems that support additional complex processessuch as language and memory (Feld and Fox, 1994; Patel, 2011;Peretz et al., 2015).
An individual’s cortical responses to music may be examinedby measuring event-related potentials (ERP’s) to rare sounds(e.g., notes) that differ from the musical context of surroundingsounds (e.g., by being out of key; Brattico et al., 2006; Mirandaand Ullman, 2007). Using this “musical auditory oddball”approach, previous studies have demonstrated ERP responsedifferences for changes in pitch (Brattico et al., 2001), timbre(Christmann et al., 2014), chord quality (Koelsch et al., 1999;Brattico et al., 2009; Tervaniemi et al., 2011; Virtala et al.,2014), harmony (Leino et al., 2007), or combinations of thesefeatures (Vuust et al., 2011, 2016). In general, these ERPresponse differences are reflected in a more negative ERP peak at∼100–250 ms (Koelsch, 2009; Yu et al., 2015), and an increase inthe positive ERP peak that appears∼300–600ms after the deviantstimulus (Besson and Macar, 1987; Nan et al., 2006).
Since ERP’s are traditionally measured to discrete stimuli,the series of notes or chords are often presented one at a time,with intervals between them typically longer than 500 ms (forexceptions see Yabe et al., 1997; Wang et al., 2008; Loizides et al.,2015). This ≤2 Hz presentation rate ensures that traditionalERP peaks [e.g., the so-called “mismatch negativity” (MMN),“early right anterior negativity” (ERAN), and “P300”] to a givenstimulus will not overlap with ERP’s that emerge to subsequentstimuli (Luck, 2004). Unfortunately, the longer interval betweensuccessive notes or chords limits the musical qualities of thestimulus. Thus, there is motivation formeasuring these responsesusing a faster presentation frequency, ensuring that the stimulibetter align with the complexity, tempo, and perceptual qualitiesof traditionalmusic (Tervaniemi and Brattico, 2004; Large, 2008).
Faster presentation rates influence both the neural andperceptual responses to auditory stimuli. With respect toEEG oscillations, qualitative differences in phase alignmentappear when presentation frequencies exceed 1 Hz (Doellingand Poeppel, 2015). The faster presentation rate facilitatesthe entrainment of EEG oscillations to periodic stimuli, i.e.,as demonstrated in frequency-tagging or steady-state evokedpotential (SSEP) studies (Nozaradan et al., 2011, 2012, 2015; Thutet al., 2011; Bridwell and Srinivasan, 2012; Bridwell et al., 2013;Roth et al., 2013; de Graaf et al., 2013; Keitel et al., 2014). These“steady-state” cortical oscillations are related to comprehensionand attention to music (Meltzer et al., 2015) and the abilityto perceptually group stimuli presented close together in time(Carlyon, 2004; Van Zuijen et al., 2004).
Perceptual grouping may facilitate the ability to perceive thepattern within the auditory inputs and the ability to detectcomplex musical relationships (Nozaradan et al., 2011). Forexample, tempo sensitivity is optimal (i.e., follows Weber’s Law)for tempo’s from 1 to 5 Hz (Drake and Botte, 1993), individualsare sensitive to musical pulses up to 10 Hz (Repp, 2003), and
maximum EEG synchronization appears between guitar duosplaying to a metronome between 4 and 7 Hz (Lindenbergeret al., 2009). Faster presentation rates also ensure that the stimulioverlap with temporal segmentation processes necessary forlanguage, since speech prosody changes occur between 0 and 4Hz and speech syllable boundaries occur between 4 and 8 Hz(Poeppel, 2003; Koelsch et al., 2005).
The present approach bridges the gap between traditional ERPdesigns and the steady-state design. Guitar notes were presentedat 4 Hz with a random sequence or a patterned sequencewithin a blocked design. Amplitude reductions to the stimulipresented in musical patterns (compared to stimuli in randomsequences), likely reflects individual’s “cortical sensitivity” tomusical patterns, since it indicates that ERP amplitudes aremodulated by musical features, and greater processing resourcesare required when notes are presented without those features(i.e., randomly). Relationships between ERP amplitudes toguitar note patterns and ERP amplitudes within the traditionalauditory oddball sequence were also examined. These findingsdemonstrate whether the cortical sensitivity to these patternsare distinct from the cortical sensitivity to statistical regularitiesreflected in the traditional “auditory oddball” sequence.
MATERIALS AND METHODS
ParticipantsThirteen individuals (9 males; 1 left handed) between the ages23 and 36 participated in a single experimental session. Eachindividual had normal audition and had no family history ofmental illness. All participants were approved for EEG recordingsby the University of New Mexico Institutional Review Board(HRRC/MCIRB), and provided informed written consent priorto the session at the Mind Research Network.
Experimental Design and StimuliThe session was comprised of five 5 min blocks, and individualswere instructed to listen to the sounds in each block. Withineach block, guitar notes were presented through speakers at 4 Hz(i.e., note onsets are 250 ms apart). Blocks 1 and 2 consisted ofa musical sequence of guitar notes, blocks 3 and 4 consisted ofa random sequence of guitar notes, and block 5 consisted of asingle guitar note presented frequently (90% of the time) and asecond guitar note presented infrequently (10% of the time; seeSupplementary Audio files).
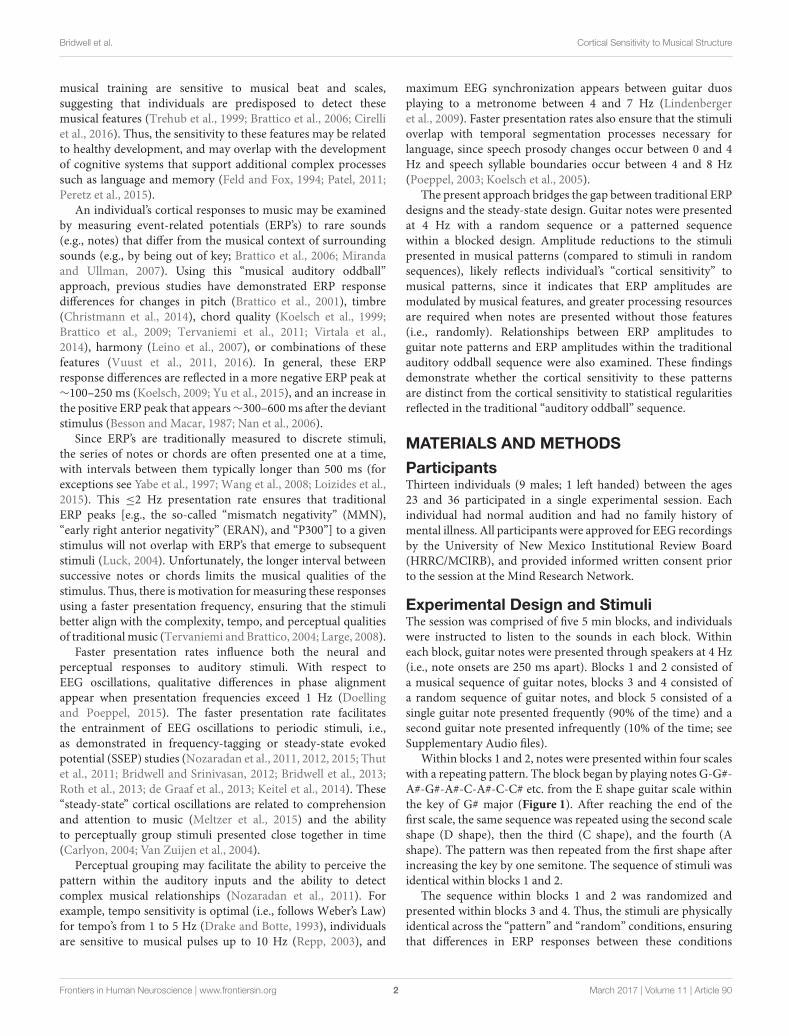
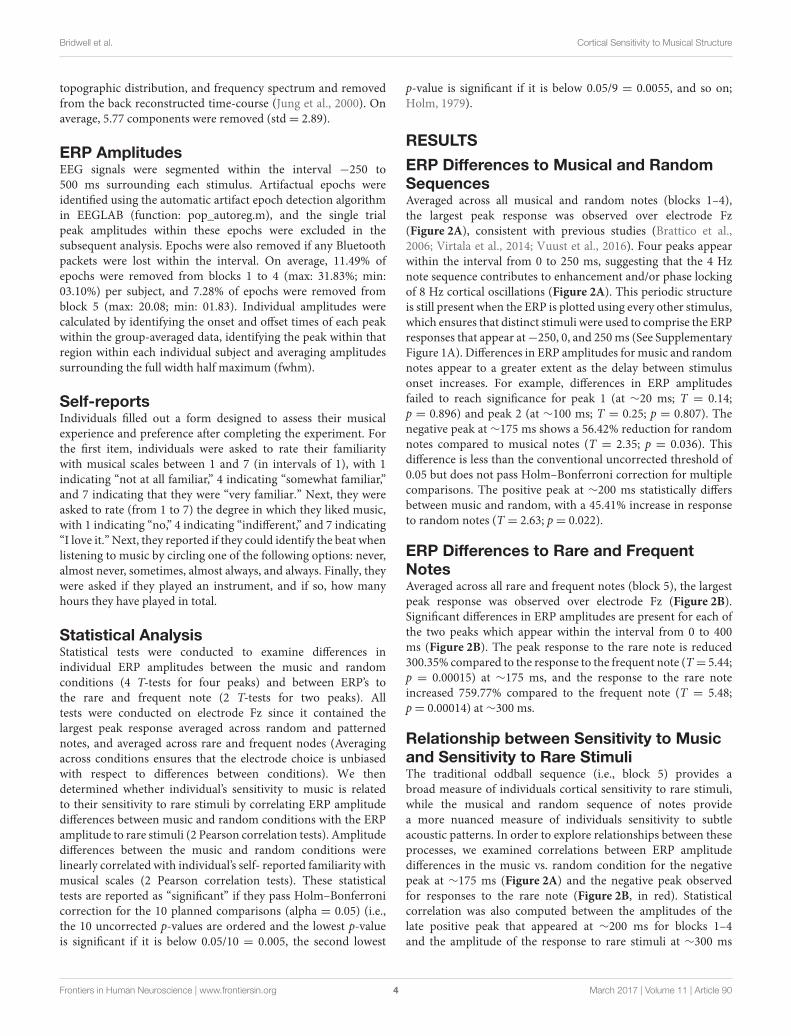
Within blocks 1 and 2, notes were presented within four scaleswith a repeating pattern. The block began by playing notes G-G#-A#-G#-A#-C-A#-C-C# etc. from the E shape guitar scale withinthe key of G# major (Figure 1). After reaching the end of thefirst scale, the same sequence was repeated using the second scaleshape (D shape), then the third (C shape), and the fourth (Ashape). The pattern was then repeated from the first shape afterincreasing the key by one semitone. The sequence of stimuli wasidentical within blocks 1 and 2.
The sequence within blocks 1 and 2 was randomized andpresented within blocks 3 and 4. Thus, the stimuli are physicallyidentical across the “pattern” and “random” conditions, ensuringthat differences in ERP responses between these conditions
Frontiers in Human Neuroscience | www.frontiersin.org 2 March 2017 | Volume 11 | Article 90
Bridwell et al. Cortical Sensitivity to Musical Structure
FIGURE 1 | Guitar note sequence. During the blocks with musical structure (i.e., blocks 1 and 2) the experiment began by playing patterns drawn from the guitar
scales with repetition. The sequence began by presenting notes within G# major drawn from the E major scale shape, as indicated in (A). After the last note of the
scale pattern, the sequence began again using the second scale pattern (D shape), followed by the third (C shape), and the fourth (A shape) pattern (not depicted). At
the end of the fourth pattern the sequence repeated except each scale increased by one semitone (i.e., the pattern repeated in the key of A). The stimulus vector for
the first six guitar notes is indicated in (B) and the spectral content of the entire sequence is indicated in (C). The peak at 4 Hz corresponds to the note repetition
frequency and the subsequent peaks correspond to its harmonics.
are directly related to differences in sensitivity to the musicalsequence (i.e., the order in which the notes appeared). The samesequence of random stimuli was presented across blocks 3 and 4and across all subjects.
In the fifth block, ERP’s were collected within an oddballsequence where the G note on the thickest string is presented90% of the time (i.e., the “standard” stimulus) and the F noteon the thinnest string is presented 10% of the time (i.e., the“oddball” stimulus). The trial sequence was random and identicalacross all subjects. Notes were presented at 4 Hz, consistent withblocks 1–4.
The order of the blocks was counterbalanced acrossparticipants by randomly selecting a sequence of stimuli froma row within a Latin square. The Latin square consisted of a5 × 5 matrix with elements 1, 2, ... 5 such that no elementrepeated within a given row or column. Subjects were instructedto minimize movements and fixate on a central fixation dot forthe duration of the experiment. The mean was removed fromeach audio stimulus, and amplitudes were normalized to 40%of the maximum. Each note took up the entire 250 ms intervalexcept the first and last 10 ms were ramped on and off to avoidclipping (see Figure 1B).
SoftwareWe used the SMARTING Streamer (the software interfacefor mBrainTrain’s Smarting EEG amplifier) to collect data.The amplifier is connected to the computer with Bluetoothmanager BlueSoleil. Experimental stimuli are presented throughMATLAB using the sound.m function. UDP triggers are sent
from MATLAB prior to each stimulus and the Bluetooth EEGwas synchronized to each trigger using the Lab Streaming Layer(LSL) (http://github.com/sccn/labstreaminglayer).
EEG Acquisition and PreprocessingEEG data was collected using a 24-channel SMARTINGamp (mBrainTrain http://www.mbraintrain.com; sample rate =500Hz) and an EasyCap EEG cap. EEG activity was recordedusing sintered Ag–AgCl electrodes placed according to the 10–20International System, with CPz and Pz added [the commonmodesense (CMS) and driven right leg (DRL) electrodes were locatedon FCz and Fpz, respectively]. Electrode impedances were keptbelow 20 k�.
EEG preprocessing was conducted in Matlab (http://www.mathworks.com) using custom functions, built-in functions, andthe EEGLAB toolbox (http://sccn.ucsd.edu/eeglab). The EEGdata was linearly detrended, forward, and backward filteredwith a Butterworth filter (bandpass: 0.01–50 Hz), referenced tochannel CZ for bad channel identification, and re-referencedto the average of the mastoids. Bad channels were identifiedbased on the data distribution and variance of channels, asimplemented in EEGLAB’s pop rejchan.m function (Delormeand Makeig, 2004) and the FASTER toolbox (Nolan et al.,2010), and spherically interpolated. On average, 2.62 channelswere removed (std = 5.06). Blink artifacts were attenuated byconducting a temporal ICA decomposition on the individualrecordings (extended Infomax algorithm in EEGLAB; Bell andSejnowski, 1995; Lee et al., 1999). Artifactual components wereidentified by visual inspection of the component time-course,
Frontiers in Human Neuroscience | www.frontiersin.org 3 March 2017 | Volume 11 | Article 90
Bridwell et al. Cortical Sensitivity to Musical Structure
topographic distribution, and frequency spectrum and removedfrom the back reconstructed time-course (Jung et al., 2000). Onaverage, 5.77 components were removed (std= 2.89).
ERP AmplitudesEEG signals were segmented within the interval −250 to500 ms surrounding each stimulus. Artifactual epochs wereidentified using the automatic artifact epoch detection algorithmin EEGLAB (function: pop_autoreg.m), and the single trialpeak amplitudes within these epochs were excluded in thesubsequent analysis. Epochs were also removed if any Bluetoothpackets were lost within the interval. On average, 11.49% ofepochs were removed from blocks 1 to 4 (max: 31.83%; min:03.10%) per subject, and 7.28% of epochs were removed fromblock 5 (max: 20.08; min: 01.83). Individual amplitudes werecalculated by identifying the onset and offset times of each peakwithin the group-averaged data, identifying the peak within thatregion within each individual subject and averaging amplitudessurrounding the full width half maximum (fwhm).
Self-reportsIndividuals filled out a form designed to assess their musicalexperience and preference after completing the experiment. Forthe first item, individuals were asked to rate their familiaritywith musical scales between 1 and 7 (in intervals of 1), with 1indicating “not at all familiar,” 4 indicating “somewhat familiar,”and 7 indicating that they were “very familiar.” Next, they wereasked to rate (from 1 to 7) the degree in which they liked music,with 1 indicating “no,” 4 indicating “indifferent,” and 7 indicating“I love it.” Next, they reported if they could identify the beat whenlistening to music by circling one of the following options: never,almost never, sometimes, almost always, and always. Finally, theywere asked if they played an instrument, and if so, how manyhours they have played in total.
Statistical AnalysisStatistical tests were conducted to examine differences inindividual ERP amplitudes between the music and randomconditions (4 T-tests for four peaks) and between ERP’s tothe rare and frequent note (2 T-tests for two peaks). Alltests were conducted on electrode Fz since it contained thelargest peak response averaged across random and patternednotes, and averaged across rare and frequent nodes (Averagingacross conditions ensures that the electrode choice is unbiasedwith respect to differences between conditions). We thendetermined whether individual’s sensitivity to music is relatedto their sensitivity to rare stimuli by correlating ERP amplitudedifferences between music and random conditions with the ERPamplitude to rare stimuli (2 Pearson correlation tests). Amplitudedifferences between the music and random conditions werelinearly correlated with individual’s self- reported familiarity withmusical scales (2 Pearson correlation tests). These statisticaltests are reported as “significant” if they pass Holm–Bonferronicorrection for the 10 planned comparisons (alpha = 0.05) (i.e.,the 10 uncorrected p-values are ordered and the lowest p-valueis significant if it is below 0.05/10 = 0.005, the second lowest
p-value is significant if it is below 0.05/9 = 0.0055, and so on;Holm, 1979).
RESULTS
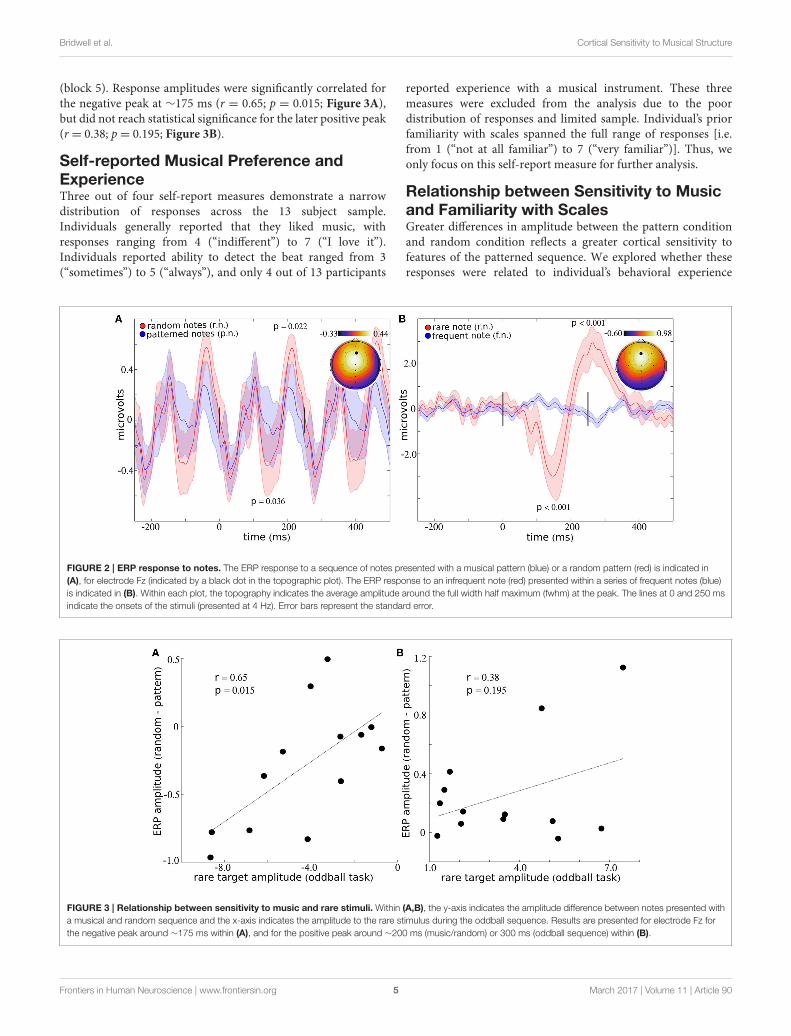
ERP Differences to Musical and RandomSequencesAveraged across all musical and random notes (blocks 1–4),the largest peak response was observed over electrode Fz(Figure 2A), consistent with previous studies (Brattico et al.,2006; Virtala et al., 2014; Vuust et al., 2016). Four peaks appearwithin the interval from 0 to 250 ms, suggesting that the 4 Hznote sequence contributes to enhancement and/or phase lockingof 8 Hz cortical oscillations (Figure 2A). This periodic structureis still present when the ERP is plotted using every other stimulus,which ensures that distinct stimuli were used to comprise the ERPresponses that appear at−250, 0, and 250ms (See SupplementaryFigure 1A). Differences in ERP amplitudes for music and randomnotes appear to a greater extent as the delay between stimulusonset increases. For example, differences in ERP amplitudesfailed to reach significance for peak 1 (at ∼20 ms; T = 0.14;p = 0.896) and peak 2 (at ∼100 ms; T = 0.25; p = 0.807). Thenegative peak at ∼175 ms shows a 56.42% reduction for randomnotes compared to musical notes (T = 2.35; p = 0.036). Thisdifference is less than the conventional uncorrected threshold of0.05 but does not pass Holm–Bonferroni correction for multiplecomparisons. The positive peak at ∼200 ms statistically differsbetween music and random, with a 45.41% increase in responseto random notes (T = 2.63; p= 0.022).
ERP Differences to Rare and FrequentNotesAveraged across all rare and frequent notes (block 5), the largestpeak response was observed over electrode Fz (Figure 2B).Significant differences in ERP amplitudes are present for each ofthe two peaks which appear within the interval from 0 to 400ms (Figure 2B). The peak response to the rare note is reduced300.35% compared to the response to the frequent note (T= 5.44;p = 0.00015) at ∼175 ms, and the response to the rare noteincreased 759.77% compared to the frequent note (T = 5.48;p= 0.00014) at∼300 ms.
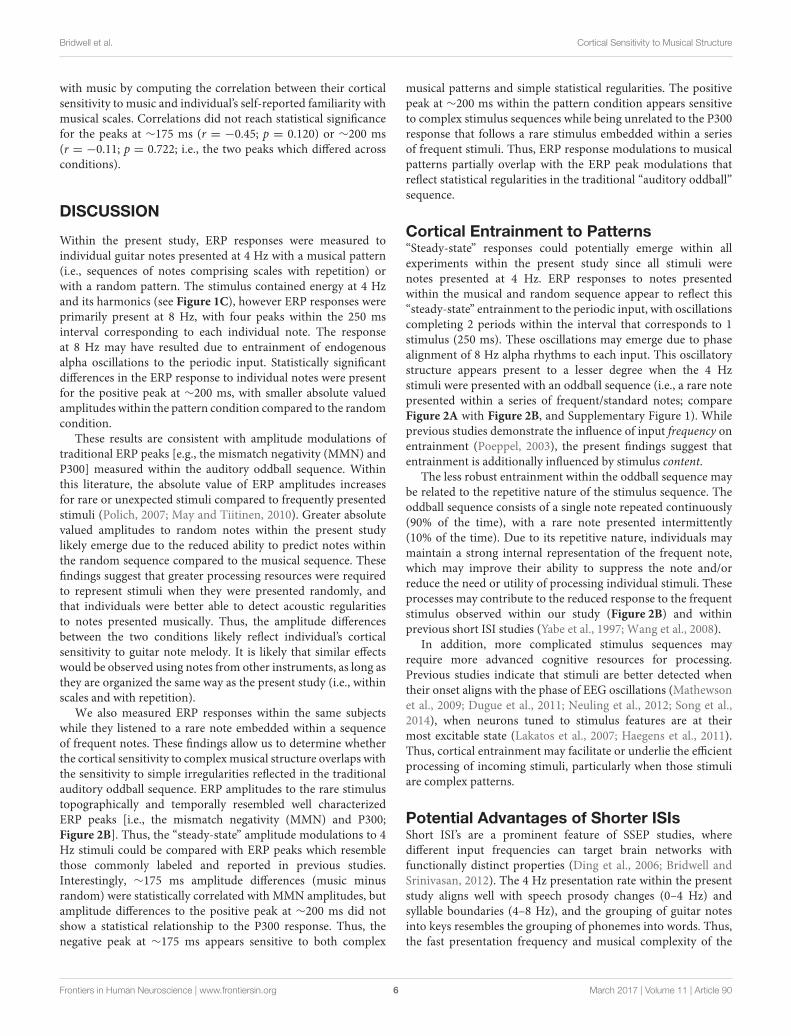
Relationship between Sensitivity to Musicand Sensitivity to Rare StimuliThe traditional oddball sequence (i.e., block 5) provides abroad measure of individuals cortical sensitivity to rare stimuli,while the musical and random sequence of notes providea more nuanced measure of individuals sensitivity to subtleacoustic patterns. In order to explore relationships between theseprocesses, we examined correlations between ERP amplitudedifferences in the music vs. random condition for the negativepeak at ∼175 ms (Figure 2A) and the negative peak observedfor responses to the rare note (Figure 2B, in red). Statisticalcorrelation was also computed between the amplitudes of thelate positive peak that appeared at ∼200 ms for blocks 1–4and the amplitude of the response to rare stimuli at ∼300 ms
Frontiers in Human Neuroscience | www.frontiersin.org 4 March 2017 | Volume 11 | Article 90
Bridwell et al. Cortical Sensitivity to Musical Structure
(block 5). Response amplitudes were significantly correlated forthe negative peak at ∼175 ms (r = 0.65; p = 0.015; Figure 3A),but did not reach statistical significance for the later positive peak(r = 0.38; p= 0.195; Figure 3B).
Self-reported Musical Preference andExperienceThree out of four self-report measures demonstrate a narrowdistribution of responses across the 13 subject sample.Individuals generally reported that they liked music, withresponses ranging from 4 (“indifferent”) to 7 (“I love it”).Individuals reported ability to detect the beat ranged from 3(“sometimes”) to 5 (“always”), and only 4 out of 13 participants
reported experience with a musical instrument. These threemeasures were excluded from the analysis due to the poordistribution of responses and limited sample. Individual’s priorfamiliarity with scales spanned the full range of responses [i.e.from 1 (“not at all familiar”) to 7 (“very familiar”)]. Thus, weonly focus on this self-report measure for further analysis.
Relationship between Sensitivity to Musicand Familiarity with ScalesGreater differences in amplitude between the pattern conditionand random condition reflects a greater cortical sensitivity tofeatures of the patterned sequence. We explored whether theseresponses were related to individual’s behavioral experience
FIGURE 2 | ERP response to notes. The ERP response to a sequence of notes presented with a musical pattern (blue) or a random pattern (red) is indicated in
(A), for electrode Fz (indicated by a black dot in the topographic plot). The ERP response to an infrequent note (red) presented within a series of frequent notes (blue)
is indicated in (B). Within each plot, the topography indicates the average amplitude around the full width half maximum (fwhm) at the peak. The lines at 0 and 250 ms
indicate the onsets of the stimuli (presented at 4 Hz). Error bars represent the standard error.
FIGURE 3 | Relationship between sensitivity to music and rare stimuli. Within (A,B), the y-axis indicates the amplitude difference between notes presented with
a musical and random sequence and the x-axis indicates the amplitude to the rare stimulus during the oddball sequence. Results are presented for electrode Fz for
the negative peak around ∼175 ms within (A), and for the positive peak around ∼200 ms (music/random) or 300 ms (oddball sequence) within (B).
Frontiers in Human Neuroscience | www.frontiersin.org 5 March 2017 | Volume 11 | Article 90
Bridwell et al. Cortical Sensitivity to Musical Structure
with music by computing the correlation between their corticalsensitivity to music and individual’s self-reported familiarity withmusical scales. Correlations did not reach statistical significancefor the peaks at ∼175 ms (r = −0.45; p = 0.120) or ∼200 ms(r = −0.11; p = 0.722; i.e., the two peaks which differed acrossconditions).
DISCUSSION
Within the present study, ERP responses were measured toindividual guitar notes presented at 4 Hz with a musical pattern(i.e., sequences of notes comprising scales with repetition) orwith a random pattern. The stimulus contained energy at 4 Hzand its harmonics (see Figure 1C), however ERP responses wereprimarily present at 8 Hz, with four peaks within the 250 msinterval corresponding to each individual note. The responseat 8 Hz may have resulted due to entrainment of endogenousalpha oscillations to the periodic input. Statistically significantdifferences in the ERP response to individual notes were presentfor the positive peak at ∼200 ms, with smaller absolute valuedamplitudes within the pattern condition compared to the randomcondition.
These results are consistent with amplitude modulations oftraditional ERP peaks [e.g., the mismatch negativity (MMN) andP300] measured within the auditory oddball sequence. Withinthis literature, the absolute value of ERP amplitudes increasesfor rare or unexpected stimuli compared to frequently presentedstimuli (Polich, 2007; May and Tiitinen, 2010). Greater absolutevalued amplitudes to random notes within the present studylikely emerge due to the reduced ability to predict notes withinthe random sequence compared to the musical sequence. Thesefindings suggest that greater processing resources were requiredto represent stimuli when they were presented randomly, andthat individuals were better able to detect acoustic regularitiesto notes presented musically. Thus, the amplitude differencesbetween the two conditions likely reflect individual’s corticalsensitivity to guitar note melody. It is likely that similar effectswould be observed using notes from other instruments, as long asthey are organized the same way as the present study (i.e., withinscales and with repetition).
We also measured ERP responses within the same subjectswhile they listened to a rare note embedded within a sequenceof frequent notes. These findings allow us to determine whetherthe cortical sensitivity to complexmusical structure overlaps withthe sensitivity to simple irregularities reflected in the traditionalauditory oddball sequence. ERP amplitudes to the rare stimulustopographically and temporally resembled well characterizedERP peaks [i.e., the mismatch negativity (MMN) and P300;Figure 2B]. Thus, the “steady-state” amplitude modulations to 4Hz stimuli could be compared with ERP peaks which resemblethose commonly labeled and reported in previous studies.Interestingly, ∼175 ms amplitude differences (music minusrandom) were statistically correlated with MMN amplitudes, butamplitude differences to the positive peak at ∼200 ms did notshow a statistical relationship to the P300 response. Thus, thenegative peak at ∼175 ms appears sensitive to both complex
musical patterns and simple statistical regularities. The positivepeak at ∼200 ms within the pattern condition appears sensitiveto complex stimulus sequences while being unrelated to the P300response that follows a rare stimulus embedded within a seriesof frequent stimuli. Thus, ERP response modulations to musicalpatterns partially overlap with the ERP peak modulations thatreflect statistical regularities in the traditional “auditory oddball”sequence.
Cortical Entrainment to Patterns“Steady-state” responses could potentially emerge within allexperiments within the present study since all stimuli werenotes presented at 4 Hz. ERP responses to notes presentedwithin the musical and random sequence appear to reflect this“steady-state” entrainment to the periodic input, with oscillationscompleting 2 periods within the interval that corresponds to 1stimulus (250 ms). These oscillations may emerge due to phasealignment of 8 Hz alpha rhythms to each input. This oscillatorystructure appears present to a lesser degree when the 4 Hzstimuli were presented with an oddball sequence (i.e., a rare notepresented within a series of frequent/standard notes; compareFigure 2A with Figure 2B, and Supplementary Figure 1). Whileprevious studies demonstrate the influence of input frequency onentrainment (Poeppel, 2003), the present findings suggest thatentrainment is additionally influenced by stimulus content.
The less robust entrainment within the oddball sequence maybe related to the repetitive nature of the stimulus sequence. Theoddball sequence consists of a single note repeated continuously(90% of the time), with a rare note presented intermittently(10% of the time). Due to its repetitive nature, individuals maymaintain a strong internal representation of the frequent note,which may improve their ability to suppress the note and/orreduce the need or utility of processing individual stimuli. Theseprocesses may contribute to the reduced response to the frequentstimulus observed within our study (Figure 2B) and withinprevious short ISI studies (Yabe et al., 1997; Wang et al., 2008).
In addition, more complicated stimulus sequences mayrequire more advanced cognitive resources for processing.Previous studies indicate that stimuli are better detected whentheir onset aligns with the phase of EEG oscillations (Mathewsonet al., 2009; Dugue et al., 2011; Neuling et al., 2012; Song et al.,2014), when neurons tuned to stimulus features are at theirmost excitable state (Lakatos et al., 2007; Haegens et al., 2011).Thus, cortical entrainment may facilitate or underlie the efficientprocessing of incoming stimuli, particularly when those stimuliare complex patterns.
Potential Advantages of Shorter ISIsShort ISI’s are a prominent feature of SSEP studies, wheredifferent input frequencies can target brain networks withfunctionally distinct properties (Ding et al., 2006; Bridwell andSrinivasan, 2012). The 4 Hz presentation rate within the presentstudy aligns well with speech prosody changes (0–4 Hz) andsyllable boundaries (4–8 Hz), and the grouping of guitar notesinto keys resembles the grouping of phonemes into words. Thus,the fast presentation frequency and musical complexity of the
Frontiers in Human Neuroscience | www.frontiersin.org 6 March 2017 | Volume 11 | Article 90
Bridwell et al. Cortical Sensitivity to Musical Structure
present paradigm may better reveal cortical processes specializedfor speech and language (Yrttiaho et al., 2011).
The standard auditory oddball ERP response appearspreserved despite the 4 Hz presentation rate of the presentstudy, while the ERP response to guitar note sequences appearsperiodic (i.e., suggesting phase entrainment). Thus, the ERPresponse to the rare (i.e., oddball) stimulus extends temporallyinto the regions where the next stimulus appears (i.e., beyond250 ms) indicating that cortical processes to the rare stimulus arepreserved and prioritized at the expense of processes related tothe subsequent frequent stimulus.
Generally, these findings indicate that ERP responses maybe measured with a fast presentation rate, where a greaternumber of responses to rare stimuli may be measured withina fixed time interval. For example, 120 ERP responses to rarestimuli and 1,080 ERP responses to frequent stimuli werecollected in 5 min within the present study. It is likely that theamplitude of these responses may be reduced with the fasterpresentation rate, as suggested by previous studies (Gonsalvezand Polich, 2002; Gomes et al., 2008; Rosburg et al., 2010;Pereira et al., 2014), but further studies may investigate whetherthese amplitude differences may be offset by reduced errorestimates and enhanced statistical differences between the rareand frequent stimuli due to the larger number of responsescollected.
ERP’s and Self-reported MusicalExperience and PreferenceThe limited sample size and absence of a “musician” groupmay have limited our ability to identify relationships betweenERP’s and self-reportedmusical experience and preference. Thereappears to be a robust relationship between musicianship andcortical responses tomusic (Yu et al., 2015), with previous studiesindicating more negative MMN amplitudes to pitch differencesin violinists than non-violinists (Koelsch et al., 1999), and amore negative MMN to abstract changes in relative pitch withinshort melodies within musicians compared to non-musicians(Seppänen et al., 2007). Fujioka et al. (2004) reported thatmusicians MMN responses were more negative for changes inrelative pitch within melodies, but did not statistically differ fromnon-musicians for pitch changes in a series of pure tones (Fujiokaet al., 2004).
Generally, ERP response modulations may appear for bothmusicians and non-musicians for relatively simple musicalfeatures, but differences for more complicated musical patternsmay only emerge when participants have a more extensiveexposure tomusic (Brattico et al., 2009; Herholz et al., 2009; Hoveet al., 2014; Vuust et al., 2016). The present findings indicatethat ERP responses are modulated by guitar notes presented
within musical scales with repetition, suggesting that non-musicians are sensitive to the musical features that are prominentwithin Western musical culture. Nevertheless, it is possible thatmusicians may have demonstrated a greater cortical sensitivity tothese features compared to a sample of non-musicians.
CONCLUSION
Individuals sensitivity to musical patterns were examined bycomparing ERP responses to guitar notes presented at 4 Hzwithin a sequence with a musical pattern (i.e., within scalesand with repetition) or within a random sequence. Corticalresponses appeared to entrain to the periodic input, with twoperiods (i.e., four peaks) appearing within the 250 ms intervalfollowing each guitar note. The absolute value of ERP responsemagnitudes was reduced at ∼200 ms for notes that appearedwithin the musical context. This amplitude difference betweenrandom and pattern conditions likely reflects individual’s corticalsensitivity to guitar note melody. The negative peak at ∼175 mswas statistically correlated with the MMN response, measuredusing a traditional oddball sequence, but the positive peakat ∼200ms did not statistically differ with P300 amplitudesmeasured within the same subject. Thus, the cortical sensitivityto musical patterns appears somewhat distinct from the corticalsensitivity to statistical regularities reflected in the traditional“auditory oddball” sequence.
AUTHOR CONTRIBUTIONS
DB and DM were involved in conception and design of research;DB and DM analyzed data; DB and VC interpreted resultsof experiments; DB and DM prepared figures; DB drafted themanuscript; DB and VC edited and revised the manuscript; SPand VC supplied materials; DB, EL, DM, SP, and VC approvedthe final version of the manuscript; EL performed experiments.
ACKNOWLEDGMENTS
Supported by NIH grants R01EB005846 and 5P20GM103472,and NSF grants 1539067 and IIS-1318759. DM was supportedby a Minority Access to Research Careers award (T34GM008751) from the NIH/National Institute of General MedicalSciences.
SUPPLEMENTARY MATERIAL
The Supplementary Material for this article can be foundonline at: http://journal.frontiersin.org/article/10.3389/fnhum.2017.00090/full#supplementary-material
REFERENCES
Bell, A. J., and Sejnowski, T. J. (1995). An information-maximization approach
to blind separation and blind deconvolution. Neural Comput. 7, 1129–1159.
doi: 10.1162/neco.1995.7.6.1129
Besson,M., andMacar, F. (1987). An event-related potential analysis of incongruity
in music and other non-linguistic contexts. Psychophysiology 24, 14–25.
doi: 10.1111/j.1469-8986.1987.tb01853.x
Brattico, E., Näätänen, R., and Tervaniemi, M. (2001). Context effects
on pitch perception in musicians and nonmusicians: evidence from
Frontiers in Human Neuroscience | www.frontiersin.org 7 March 2017 | Volume 11 | Article 90
Bridwell et al. Cortical Sensitivity to Musical Structure
event-related-potential recordings. Music Percept. 19, 199–222. doi: 10.1525/
mp.2001.19.2.199
Brattico, E., Pallesen, K. J., Varyagina, O., Bailey, C., Anourova, I., Järvenpää,
M., et al. (2009). Neural discrimination of nonprototypical chords in music
experts and laymen: an MEG study. J. Cogn. Neurosci. 21, 2230–2244.
doi: 10.1162/jocn.2008.21144
Brattico, E., Tervaniemi, M., Näätänen, R., and Peretz, I. (2006). Musical scale
properties are automatically processed in the human auditory cortex. Brain Res.
1117, 162–174. doi: 10.1016/j.brainres.2006.08.023
Bridwell, D. A., Hecker, E. A., Serences, J. T., and Srinivasan, R. (2013).
Individual differences in attention strategies during detection, fine
discrimination, and coarse discrimination. J. Neurophysiol. 110, 784–794.
doi: 10.1152/jn.00520.2012
Bridwell, D. A., and Srinivasan, R. (2012). Distinct attention networks for
feature enhancement and suppression in vision. Psychol. Sci. 23, 1151–1158.
doi: 10.1177/0956797612440099
Carlyon, R. P. (2004). How the brain separates sounds. Trends Cogn. Sci. 8,
465–471. doi: 10.1016/j.tics.2004.08.008
Christmann, C. A., Lachmann, T., and Berti, S. (2014). Earlier timbre processing
of instrumental tones compared to equally complex spectrally rotated
sounds as revealed by the mismatch negativity. Neurosci. Lett. 581, 115–119.
doi: 10.1016/j.neulet.2014.08.035
Cirelli, L. K., Spinelli, C., Nozaradan, S., and Trainor, L. J. (2016). Measuring neural
entrainment to beat and meter in infants: effects of music background. Front.
Neurosci. 10:229. doi: 10.3389/fnins.2016.00229
de Graaf, T. A., Gross, J., Paterson, G., Rusch, T., Sack, A. T., and Thut, G. (2013).
Alpha-band rhythms in visual task performance: phase-locking by rhythmic
sensory stimulation. PLoS ONE 8:e60035. doi: 10.1371/journal.pone.0060035
Delorme, A., and Makeig, S. (2004). EEGLAB: an open source toolbox for analysis
of single-trial EEG dynamics including independent component analysis.
J. Neurosci. Methods 134, 9–21. doi: 10.1016/j.jneumeth.2003.10.009
Ding, J., Sperling, G., and Srinivasan, R. (2006). Attentional modulation of SSVEP
power depends on the network tagged by the flicker frequency. Cereb. Cortex
16, 1016. doi: 10.1093/cercor/bhj044
Doelling, K. B., and Poeppel, D. (2015). Cortical entrainment to music and
its modulation by expertise. Proc. Natl. Acad. Sci. U.S.A. 112, E6233–E6242.
doi: 10.1073/pnas.1508431112
Drake, C., and Botte, M.-C. (1993). Tempo sensitivity in auditory sequences:
evidence for a multiple-look model. Percept. Psychophys. 54, 277–286.
doi: 10.3758/BF03205262
Dugue, L., Marque, P., and VanRullen, R. (2011). The phase of ongoing oscillations
mediates the causal relation between brain excitation and visual perception.
J. Neurosci. 31, 11889–11893. doi: 10.1523/JNEUROSCI.1161-11.2011
Feld, S., and Fox, A. A. (1994). Music and language. Annu. Rev. Anthropol. 23,
25–53. doi: 10.1146/annurev.an.23.100194.000325
Fujioka, T., Trainor, L. J., Ross, B., Kakigi, R., and Pantev, C. (2004). Musical
training enhances automatic encoding of melodic contour and interval
structure. J. Cogn. Neurosci. 16, 1010–1021. doi: 10.1162/0898929041502706
Gomes, H., Barrett, S., Duff, M., Barnhardt, J., and Ritter, W. (2008). The effects
of interstimulus interval on event-related indices of attention: an auditory
selective attention test of perceptual load theory. Clin. Neurophysiol. 119,
542–555. doi: 10.1016/j.clinph.2007.11.014
Gonsalvez, C. J., and Polich, J. (2002). P300 amplitude is determined by target-to-
target interval. Psychophysiology 39, 388–396. doi: 10.1017/S0048577201393137
Haegens, S., Nacher, V., Luna, R., Romo, R., and Jensen, O. (2011). α-Oscillations
in the monkey sensorimotor network influence discrimination performance by
rhythmical inhibition of neuronal spiking. Proc. Natl. Acad. Sci. U.S.A. 108,
19377–19382. doi: 10.1073/pnas.1117190108
Herholz, S. C., Lappe, C., and Pantev, C. (2009). Looking for a pattern: an MEG
study on the abstract mismatch negativity in musicians and nonmusicians.
BMC Neurosci. 10:42. doi: 10.1186/1471-2202-10-42
Holm, S. (1979). A simple sequentially rejective multiple test procedure. Scand.
J. Stat. 6, 65–70.
Hove, M. J., Marie, C., Bruce, I. C., and Trainor, L. J. (2014). Superior time
perception for lower musical pitch explains why bass-ranged instruments
lay down musical rhythms. Proc. Natl. Acad. Sci. U.S.A. 111, 10383–10388.
doi: 10.1073/pnas.1402039111
Jung, T. P., Makeig, S., Humphries, C., Lee, T. W., McKeown, M. J., Iragui, V., et al.
(2000). Removing electroencephalographic artifacts by blind source separation.
Psychophysiology 37, 163–178. doi: 10.1111/1469-8986.3720163
Keitel, C., Quigley, C., and Ruhnau, P. (2014). Stimulus-driven brain oscillations
in the alpha range: entrainment of intrinsic rhythms or frequency-
following response? J. Neurosci. 34, 10137–10140. doi: 10.1523/JNEUROSCI.
1904-14.2014
Koelsch, S. (2009). Music-syntactic processing and auditory memory: similarities
and differences between ERAN and MMN. Psychophysiology 46, 179–190.
doi: 10.1111/j.1469-8986.2008.00752.x
Koelsch, S., Gunter, T. C., Wittfoth, M., and Sammler, D. (2005). Interaction
between syntax processing in language and in music: an ERP study. J. Cogn.
Neurosci. 17, 1565–1577. doi: 10.1162/089892905774597290
Koelsch, S., Schröger, E., and Tervaniemi, M. (1999). Superior pre-attentive
auditory processing in musicians. Neuroreport 10, 1309–1313. doi: 10.1097/
00001756-199904260-00029
Krumhansl, C. L. (1990). Cognitive Foundations of Musical Pitch. New York, NY:
Oxford University Press.
Krumhansl, C. L. (2000). Rhythm and pitch in music cognition. Psychol. Bull. 126,
159–179. doi: 10.1037/0033-2909.126.1.159
Lakatos, P., Chen, C.-M., O’Connell, M. N., Mills, A., and Schroeder, C. E. (2007).
Neuronal oscillations and multisensory interaction in primary auditory cortex.
Neuron 53, 279–292. doi: 10.1016/j.neuron.2006.12.011
Large, E. W. (2008). “Resonating to musical rhythm: theory and experiment,” in
The Psychology of Time, ed S. Grondin (Bingley, UK: Emerald Group), 189–232.
Lee, T. W., Girolami, M., and Sejnowski, T. J. (1999). Independent
component analysis using an extended infomax algorithm for mixed
subgaussian and supergaussian sources. Neural Comput. 11, 417–441.
doi: 10.1162/089976699300016719
Leino, S., Brattico, E., Tervaniemi, M., and Vuust, P. (2007). Representation
of harmony rules in the human brain: further evidence from event-
related potentials. Brain Res. 1142, 169–177. doi: 10.1016/j.brainres.2007.
01.049
Lindenberger, U., Li, S.-C., Gruber, W., and Müller, V. (2009). Brains swinging
in concert: cortical phase synchronization while playing guitar. BMC Neurosci.
10:22. doi: 10.1186/1471-2202-10-22
Loizides, C., Achilleos, A., Iannetti, G. D., and Mitsis, G. D. (2015). Assessment of
nonlinear interactions in event-related potentials elicited by stimuli presented
at short interstimulus intervals using single-trial data. J. Neurophysiol. 113,
3623–3633. doi: 10.1152/jn.00523.2014
Luck, S. (2004).An Introduction to the Event-Related Potential Technique, 2nd Edn.
Boston, MA: MIT Press.
Mathewson, K. E., Gratton, G., Fabiani, M., Beck, D. M., and Ro, T. (2009). To
see or not to see: prestimulus phase predicts visual awareness. J. Neurosci. 29,
2725–2732. doi: 10.1523/JNEUROSCI.3963-08.2009
May, P. J., and Tiitinen, H. (2010). Mismatch negativity (MMN), the
deviance-elicited auditory deflection, explained. Psychophysiology 47, 66–122.
doi: 10.1111/j.1469-8986.2009.00856.x
Meltzer, B., Reichenbach, C. S., Braiman, C., Schiff, N. D., Hudspeth, A. J., and
Reichenbach, T. (2015). The steady-state response of the cerebral cortex to the
beat of music reflects both the comprehension of music and attention. Front.
Hum. Neurosci. 9:436. doi: 10.3389/fnhum.2015.00436
Miranda, R. A., and Ullman, M. T. (2007). Double dissociation between rules and
memory in music: an event-related potential study. Neuroimage 38, 331–345.
doi: 10.1016/j.neuroimage.2007.07.034
Nan, Y., Knösche, T. R., and Friederici, A. D. (2006). The perception of musical
phrase structure: a cross-cultural ERP study. Brain Res. 1094, 179–191.
doi: 10.1016/j.brainres.2006.03.115
Neuling, T., Rach, S., Wagner, S., Wolters, C. H., and Herrmann, C. S. (2012).
Good vibrations: oscillatory phase shapes perception. Neuroimage 63, 771–778.
doi: 10.1016/j.neuroimage.2012.07.024
Nolan, H., Whelan, R., and Reilly, R. B. (2010). FASTER: fully automated statistical
thresholding for EEG artifact rejection. J. Neurosci. Methods 192, 152–162.
doi: 10.1016/j.jneumeth.2010.07.015
Nozaradan, S., Peretz, I., and Mouraux, A. (2012). Selective neuronal entrainment
to the beat and meter embedded in a musical rhythm. J. Neurosci. 32,
17572–17581. doi: 10.1523/JNEUROSCI.3203-12.2012
Frontiers in Human Neuroscience | www.frontiersin.org 8 March 2017 | Volume 11 | Article 90
Bridwell et al. Cortical Sensitivity to Musical Structure
Nozaradan, S., Peretz, I., Missal, M., and Mouraux, A. (2011). Tagging the
neuronal entrainment to beat and meter. J. Neurosci. 31, 10234–10240.
doi: 10.1523/JNEUROSCI.0411-11.2011
Nozaradan, S., Zerouali, Y., Peretz, I., and Mouraux, A. (2015). Capturing
with EEG the neural entrainment and coupling underlying sensorimotor
synchronization to the beat. Cereb. Cortex 25, 736–747. doi: 10.1093/cercor/
bht261
Patel, A. D. (2011). Why would musical training benefit the neural
encoding of speech? The OPERA hypothesis. Front. Psychol. 2:142.
doi: 10.3389/fpsyg.2011.00142
Pereira, D. R., Cardoso, S., Ferreira-Santos, F., Fernandes, C., Cunha-Reis, C.,
Paiva, T. O., et al. (2014). Effects of inter-stimulus interval (ISI) duration
on the N1 and P2 components of the auditory event-related potential. Int.
J. Psychophysiol. 94, 311–318. doi: 10.1016/j.ijpsycho.2014.09.012
Peretz, I., Vuvan, D., Lagrois, M.-E., and Armony, J. L. (2015). Neural overlap in
processing music and speech. Philos. Trans. R. Soc. B Biol. Sci. 370, 20140090.
doi: 10.1098/rstb.2014.0090
Poeppel, D. (2003). The analysis of speech in different temporal integration
windows: cerebral lateralization as “asymmetric sampling in time.” Speech
Commun. 41, 245–255. doi: 10.1016/S0167-6393(02)00107-3
Polich, J. (2007). Updating P300: an integrative theory of P3a and P3b. Clin.
Neurophysiol. 118, 2128–2148. doi: 10.1016/j.clinph.2007.04.019
Repp, B. H. (2003). Rate limits in sensorimotor synchronization with
auditory and visual sequnces: the synchronization threshold and the
benefits and costs of interval subdivision. J. Mot. Behav. 35, 355–370.
doi: 10.1080/00222890309603156
Rosburg, T., Zimmerer, K., and Huonker, R. (2010). Short-term habituation
of auditory evoked potential and neuromagnetic field components in
dependence of the interstimulus interval. Exp. Brain Res. 205, 559–570.
doi: 10.1007/s00221-010-2391-3
Roth, C., Gupta, C. N., Plis, S. M., Damaraju, E., Khullar, S., Calhoun, V. D., et al.
(2013). The influence of visuospatial attention on unattended auditory 40 Hz
responses. Front. Hum. Neurosci. 7:370. doi: 10.3389/fnhum.2013.00370
Seppänen, M., Brattico, E., and Tervaniemi, M. (2007). Practice strategies of
musicians modulate neural processing and the learning of sound-patterns.
Neurobiol. Learn. Mem. 87, 236–247. doi: 10.1016/j.nlm.2006.08.011
Song, K., Meng, M., Chen, L., Zhou, K., and Luo, H. (2014). Behavioral
oscillations in attention: rhythmic pulses mediated through band. J. Neurosci.
34, 4837–4844. doi: 10.1523/JNEUROSCI.4856-13.2014
Tervaniemi, M., and Brattico, E. (2004). From sounds to music towards
understanding the neurocognition of musical sound perception. J. Conscious.
Stud. 11, 9–27.
Tervaniemi, M., Sannemann, C., Noyranen, M., Salonen, J., and Pihko, E.
(2011). Importance of the left auditory areas in chord discrimination in
music experts as demonstrated by MEG: importance of the left auditory areas
in chord discrimination. Eur. J. Neurosci. 34, 517–523. doi: 10.1111/j.1460-
9568.2011.07765.x
Thut, G., Schyns, P. G., and Gross, J. (2011). Entrainment of perceptually relevant
brain oscillations by non-invasive rhythmic stimulation of the human brain.
Front. Psychol. 2:170. doi: 10.3389/fpsyg.2011.00170
Trehub, S. E., Schellenberg, E. G., and Kamenetsky, S. B. (1999). Infants’ and adults’
perception of scale structure. J. Exp. Psychol. Hum. Percept. Perform. 25:965.
doi: 10.1037/0096-1523.25.4.965
Van Zuijen, T. L., Sussman, E., Winkler, I., Näätänen, R., and Tervaniemi,
M. (2004). Grouping of sequential sounds—an event-related potential study
comparing musicians and nonmusicians. J. Cogn. Neurosci. 16, 331–338.
doi: 10.1162/089892904322984607
Virtala, P., Huotilainen, M., Partanen, E., and Tervaniemi, M. (2014).
Musicianship facilitates the processing of Western music chords—an
ERP and behavioral study. Neuropsychologia 61, 247–258. doi: 10.1016/
j.neuropsychologia.2014.06.028
Vuust, P., Brattico, E., Glerean, E., Seppänen, M., Pakarinen, S., Tervaniemi, M.,
et al. (2011). New fast mismatch negativity paradigm for determining the neural
prerequisites for musical ability. Cortex 47, 1091–1098. doi: 10.1016/j.cortex.
2011.04.026
Vuust, P., Liikala, L., Näätänen, R., Brattico, P., and Brattico, E. (2016).
Comprehensive auditory discrimination profiles recorded with a
fast parametric musical multi-feature mismatch negativity paradigm.
Clin. Neurophysiol. 127, 2065–2077. doi: 10.1016/j.clinph.2015.
11.009
Wang, A. L., Mouraux, A., Liang, M., and Iannetti, G. D. (2008). The Enhancement
of the N1 wave elicited by sensory stimuli presented at very short inter-stimulus
intervals is a general feature across sensory systems. PLoS ONE 3:e3929.
doi: 10.1371/journal.pone.0003929
Yabe, H., Tervaniemi, M., Reinikainen, K., and Näätänen, R. (1997). Temporal
window of integration revealed by MMN to sound omission. Neuroreport 8,
1971–1974. doi: 10.1097/00001756-199705260-00035
Yrttiaho, S., May, P. J. C., Tiitinen, H., and Alku, P. (2011). Cortical encoding of
aperiodic and periodic speech sounds: evidence for distinct neural populations.
Neuroimage 55, 1252–1259. doi: 10.1016/j.neuroimage.2010.12.076
Yu, X., Liu, T., and Gao, D. (2015). The mismatch negativity: an indicator
of perception of regularities in music. Behav. Neurol. 2015, 1–12.
doi: 10.1155/2015/469508
Conflict of Interest Statement: The authors declare that the research was
conducted in the absence of any commercial or financial relationships that could
be construed as a potential conflict of interest.
Copyright © 2017 Bridwell, Leslie, McCoy, Plis and Calhoun. This is an open-access
article distributed under the terms of the Creative Commons Attribution License (CC
BY). The use, distribution or reproduction in other forums is permitted, provided the
original author(s) or licensor are credited and that the original publication in this
journal is cited, in accordance with accepted academic practice. No use, distribution
or reproduction is permitted which does not comply with these terms.
Frontiers in Human Neuroscience | www.frontiersin.org 9 March 2017 | Volume 11 | Article 90