Embed Size (px)
Citation preview
Clinical Neurophysiology 125 (2014) 1182–1191
Contents lists available at ScienceDirect
Clinical Neurophysiology
journal homepage: www.elsevier .com/locate /c l inph
Corticomuscular coherence in acute and chronic stroke
1388-2457/$36.00 � 2013 International Federation of Clinical Neurophysiology. Published by Elsevier Ireland Ltd. All rights reserved.http://dx.doi.org/10.1016/j.clinph.2013.11.006
⇑ Corresponding author at: Charité – Universitätsmedizin Berlin, Campus Ben-jamin Franklin, Department of Neurology, Neurophysics Group, Hindenburgdamm30, 12203 Berlin, Germany. Tel.: +49 30 8445 4727; fax: +49 30 8445 4264.
E-mail address: [email protected] (V.V. Nikulin).1 These authors have contributed equally to the work.
Katherina von Carlowitz-Ghori a,b,c,1, Zubeyir Bayraktaroglu a,d,1, Friederike U. Hohlefeld a, Florian Losch a,Gabriel Curio a,d,e, Vadim V. Nikulin a,d,e,⇑a Neurophysics Group, Department of Neurology, Charité – University Medicine Berlin, Germanyb Institute of Science and Ethics, University of Bonn, Germanyc Department of Software Engineering and Theoretical Computer Science, Berlin Institute of Technology, Berlin, Germanyd Center for Stroke Research Berlin, Charité – University Medicine Berlin, Germanye Bernstein Center for Computational Neuroscience, Berlin, Germany
a r t i c l e i n f o h i g h l i g h t s
Article history:Accepted 5 November 2013Available online 16 November 2013
Keywords:CMCReorganizationMotor recoveryEEGEMGSynchronizationOscillations
� We studied corticomuscular coherence (CMC) in the acute and chronic stroke following up the courseof recovery.
� In acute stroke CMC frequency was decreased on the affected side and CMC amplitude was increasedon the unaffected side.
� In the chronic period there was no inter-hemispheric difference in CMC parameters.
a b s t r a c t
Objective: Motor recovery after stroke is attributed to neuronal plasticity, however not all post-strokeneuronal changes relate to regaining fine motor control. Corticomuscular coherence (CMC) is a measureallowing to trace neuronal reorganizations which are functionally relevant for motor recovery. Contraryto previous studies which were performed only in chronic stage, we measured CMC in patients withstroke at both acute and chronic stroke stages.Methods: For the detection of CMC we used multichannel EEG and EMG recordings along with anoptimization algorithm for the detection of corticomuscular interactions.Results: In acute stroke, the CMC amplitude was larger on the unaffected side compared to the affectedside and also larger compared to the unaffected side in the chronic period. Additionally, CMC peak fre-quencies on both sides decreased in the acute compared to the chronic period and to control subjects.In chronic stage, there were no inter-hemispheric or group differences in CMC amplitude or frequency.Conclusions: The changes in CMC parameters in acute stroke could result from a temporary decrease ininhibition, which normalizes in the course of recovery. As all patients showed very good motor recovery,the modulation of CMC amplitude and frequency over time might thus reflect the process of motor recov-ery.Significance: We demonstrate for the first time the dynamical changes of corticomuscular interactionboth at acute and chronic stage of stroke.� 2013 International Federation of Clinical Neurophysiology. Published by Elsevier Ireland Ltd. All rights
reserved.
1. Introduction
Motor dysfunction is the most frequent consequence of stroke(Rathore et al., 2002) that dramatically affects the everyday life
of patients. Appropriate treatment and rehabilitation proceduresof motor paresis strongly depend on our understanding of the neu-ronal processes related to recovery of normal motor functioning. Itis generally believed that motor recovery after stroke is due tomassive neuronal reorganization occurring both locally and remo-tely to the lesion site (Talelli et al., 2006; Jang, 2007; Nudo, 2007;Grefkes and Fink, 2011). Thus, new areas that were previously notengaged are recruited in a motor activity. Neuroimaging studies re-ported the involvement of ipsi- and contralesional brain regions inthe recovery process (Ward, 2005; Dancause, 2006; Nudo, 2007).
K. von Carlowitz-Ghori et al. / Clinical Neurophysiology 125 (2014) 1182–1191 1183
However, not every change in brain activation and wiring afterstroke can be considered as functionally relevant for re-establish-ing motor performance. Some alterations in the neuronal dynamicscan be unspecific/maladaptive – as a consequence of compensatorymovements, ipsilateral involvement and inter-hemispheric com-petitive interaction (Takeuchi and Izumi, 2012). Maladaptive plas-ticity interferes with motor recovery and should be differentiatedfrom neuronal processes which are specifically associated withregaining normal motor control. Studies utilizing neuroimagingtechniques such as fMRI and PET provide rather an indirect refer-ence with respect to the involvement of activated cortical areasinto the recovery processes (Calautti and Baron, 2003; Assaf andPasternak, 2008).
In the present study we use corticomuscular coherence (CMC)as a tool to identify functionally relevant contributions of reorga-nized cortical areas to motor recovery. CMC is a well-establishedneurophysiological measure, which indicates the amount of syn-chronization between cortical and spinal cord activities duringthe execution of a movement (Brown et al., 1998; Mima and Hal-lett, 1999; Salenius and Hari, 2003). CMC appears predominantlyduring periods of isometric contraction (Kilner et al., 2000; Riddleand Baker, 2006) and reaches its maximum in the beta frequencyrange (16–32 Hz) over the primary sensorimotor cortices contra-lateral to the innervated limb (Salenius et al., 1997; Tsujimotoet al., 2009; Witham et al., 2010).
There are only a few stroke-related CMC studies (Mima et al.,2001; Braun et al., 2007; Fang et al., 2009; Meng et al., 2009;Graziadio et al., 2012) and all of them were performed at thechronic stage, mostly at least 1 year after the stroke when manycompensatory processes already took place (Rijntjes, 2006). Cur-rently, longitudinal CMC studies following stroke patients fromacute to chronic period are missing. Such studies could providenew insight into the temporal evolution of corticomuscular inter-action after stroke and add to the understanding of mechanismsunderlying motor recovery. The present study demonstrates forthe first time the changes in the dynamics of corticomuscularinteraction both at acute and early chronic stage of stroke.
2. Materials and methods
The experimental protocol was approved by the InstitutionalReview Board of the Charité, Berlin, and the subjects gave theirwritten informed consent prior to the experiments. All subjectswere right-handed according to the Edinburgh Handedness Inven-tory (Oldfield, 1971) and had normal or corrected to normal vision.
2.1. Patients
Eleven ischemic stroke patients (5 female, mean age ± SD:71.7 ± 11.3 years) with hemiparesis were recruited in 12 monthsof the study. Only patients with first ever acute ischemic lesionslocalized in cortical or subcortical regions were included in thestudy. The lesion location was confirmed with MRI; four patientshad left, seven right hemispheric strokes. Exclusion criteria weremultiple scattered lesions, previous stroke or lesion, muscle disor-ders, peripheral neuropathy, hemorrhagic stroke, cognitive impair-ment and complete plegia. The mean time for the recordings was3.5 (range: 2–5) days after the stroke. Motor strength of the targetmuscles (abductor pollicis brevis, APB) was graded according to theMedical Research Council (MRC) scale. To be selected for the study,the patients had to have moderate to severe hemiparesis at the on-set of the stroke. On the day of experiment, patients had regainedtheir muscle strength such that it was greater than 3 on the MRCscale except for one patient. The details of the patients are summa-rized in Table 1.
The same group of patients was contacted 6 months post-stroke and asked to participate in the follow-up study. Seven pa-tients agreed and were recorded 194.6 (range: 174–250) daysafter the first experiment. In the follow-up period the force levelwas assessed again and found to be 5 (on the MRC scale) for allpatients.
2.2. Controls
Fourteen healthy subjects (4 female, mean age ± SD:51.7 ± 10.35 years) without any history of neurological or psychiat-ric disease served as control.
2.3. Paradigm
We used a digit displacement paradigm, which includes themanipulation of a compliant object because CMC was found tobe larger when the task involved a compliant object compared toa simple isometric condition (Kilner et al., 2000; Riddle and Baker,2006).
During the experiment the patients stayed in the bed, reclinedat 60�. Control subjects were seated in a comfortable chair withtheir arms resting on the chair handles. The subjects were in-structed to press a spring-loaded lever with the left or right thumbwith 0.5 N force, requiring a lever displacement of �3.5 cm. Theforce was measured with a load sensor (FSG15N1A, Honeywell,USA). Visual feedback of the force level was provided on a com-puter screen as a horizontal bar of varying lateral extent propor-tional to the exerted force with fixed vertical lines indicating thetarget value. A cross in the center of the screen served as an eye-fixation point.
The task was performed with each hand separately and thehand order was counter-balanced between the subjects. The sub-jects were instructed to reach the required force level as fast aspossible after a single tone and hold it constant until the presenta-tion of a double tone. Subjects performed 4 blocks of 25 trials perhand with 60 s of rest between the blocks. Each trial lasted 9 s con-sisting of 5 s pressing and 4 s rest.
2.4. Data acquisition
EEG and EMG data were acquired with BrainAmp MR-plus(Brain Products, Germany) amplifiers, filtered in the frequencyrange of 0.015–250 Hz and sampled at 1000 Hz. The voltage reso-lution for the EEG and EMG channels was 0.1 lV and 0.5 lV,respectively.
2.4.1. EEGDuring the acquisition, the EEG was referenced to physically
linked earlobes and recorded using an EEG cap (61 Ag/AgCl sin-tered ring electrodes, EasyCap, Germany) with a denser electrodeconfiguration complying with the 10–5 system (Oostenveld andPraamstra, 2001) above the sensorimotor cortices. Ocular artifactswere recorded with two electrodes placed on the right zygomaticand supraorbital processes.
2.4.2. EMGEMG was recorded from the abductor pollicis brevis (APB) mus-
cle with three EMG electrodes (Ag/AgCl sintered electrodes 4 mmin diameter) over the thenar side of each hand. The skin surfacewas abraded with NuPrep (Weaver & Co., USA) before the electrodeapplication. The electrode–skin conductive contact was establishedwith Ten20 electrode paste (Weaver & Co., USA) and the electrodeswere secured to the skin with adhesive medical tape.
An EMG reference electrode was placed on the styloid processof the ulnar bone and a ground electrode on the inner surface of
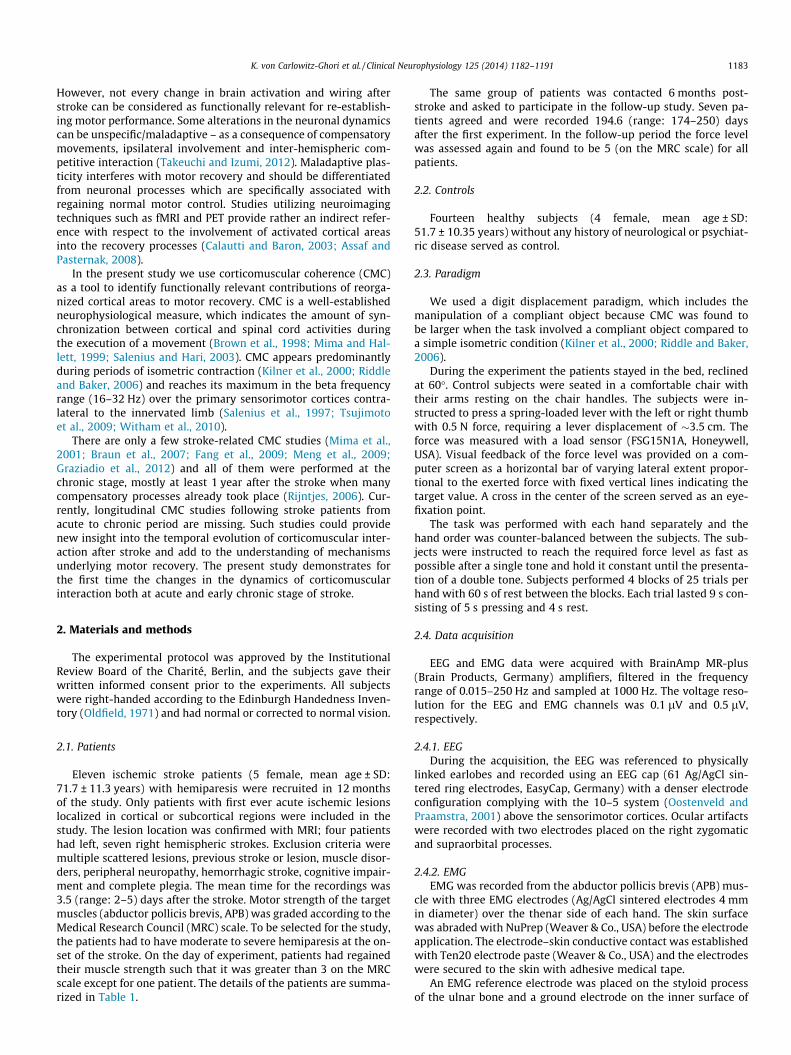
Table 1Clinical information of patients.a
Subject Age Sex MRC Lesion location Recording day
Affected Unaffected Acute Chronic
1 70 F 4 5 Right gyrus pre and post centralis, MCA, M3 occlusion Cortical 5 1812 72 F 4 5 Right MCA, subcortical, gyrus frontalis inferior and precentralis, M1 stenosis Cortical 3 1833 76 M 4 4 Right gyrus precentralis, subcortical boundary, MCA, M2 stenosis Cortical 5 –4 44 M 5 5 Right gyrus precentralis, gyrus frontalis medius, ACA/MCA boundary Cortical 3 2205 81 F 5 5 Right gyrus precentralis and parietal cortex, MCA, M4 occlusion Cortical 4 1786 90 F 3 5 Left juxtacortical postcentral Subcortical 3 –7 74 M 4 5 Right capsulothalamic Subcortical 3 1868 71 M 5 5 Left AChA, posterior limb of capsula interna Subcortical 3 –9 68 M 5 5 Left centrum semiovale Subcortical 3 253
10 67 M 5 5 Right centrum semiovale Subcortical 5 18711 76 F 4 5 MCA M2, left corona radiata, superior parietal lobul left > right Subcortical 3 –
a F, female; M, male; MCA, middle cerebral artery; M1–4, segments of MCA; ACA, anterior cerebral artery; AchA, anterior choroidal artery.
1184 K. von Carlowitz-Ghori et al. / Clinical Neurophysiology 125 (2014) 1182–1191
the wrist at the midline. Ag/AgCl sintered electrodes 12 mm indiameter were used for reference and ground.
2.5. Data analysis
2.5.1. PreprocessingData analyses were performed offline in MATLAB (Mathworks
Inc., USA) environment with custom written functions. The analy-sis was based on the stable hold period of the task, during whichthe strongest coherent activity in the beta band has been shownbefore (Baker et al., 1997; Riddle and Baker, 2006; Kristeva et al.,2007). We chose the post-stimulus interval between 2 and 4 s afterthe tone onset as a period showing a stable force production (Bay-raktaroglu et al., 2011, 2013). The data were visually inspected forthe presence of major abrupt force changes in the hold period. Ifthe force output deviated from the range 0.5 ± 0.1 N, the epochwas discarded. Further, epochs containing large-amplitude arti-facts in the frequency range of interest (8–44 Hz) were excludedby means of visual inspection. After artifact rejection, the 2-sepochs were divided into segments of 500 ms length yielding206.5 ± 62.3 and 208.4 ± 62.8 segments for the affected and unaf-fected hand of the patients, respectively, in the acute period, and259.4 ± 17.1 and 270.3 ± 18.6 segments for affected and unaffectedhand of the patients, respectively, in the chronic period. To takeinto account that differences in CMC strength may relate to thenumber of epochs across the subjects, we performed bootstrappingto select an equal number of epochs. The lowest number of arti-fact-free 2-s epochs among all subjects was 34. Therefore, we se-lected 30 epochs randomly one-hundred times from all artifact-free epochs and then calculated the CMC spectrum on the resulting120 segments (30 epochs � 4 = 120 segments). The CMC peak wasfinally calculated as the average of one hundred bootstrapsequences.
2.5.2. Corticomuscular coherenceIn this study, we used our recently developed technique –
Regression CMC (R-CMC) – for the optimal detection of cortico-muscular coherence (Bayraktaroglu et al., 2011, 2013). The coreidea of R-CMC is to find a spatial filter for multichannel EEG datawhich maximally explains EMG activity in a given frequency range.Such an optimization is performed in the time domain where thecorrelation of narrow-band signals is equivalent to the calculationof phase coherence in the Fourier domain. For CMC estimation theEMG signal was not rectified as EMG rectification has been recentlyshown to have a detrimental effect on CMC estimation in bothexperimental and theoretical studies (Stegeman et al., 2010; Bay-raktaroglu et al., 2011; McClelland et al., 2012; Farina et al., 2013).
R-CMC analysis is performed in two steps: (1) to avoid collin-earity of the predictors and to make the estimation of covariancematrices more robust, a dimension reduction was performed usingPrincipal Component Analysis (PCA). PCA components were se-lected to account for 99% variability of the data. (2) To accountfor the conduction delay between cortex and muscle, least-squaresassessments were performed for different delays. The delay wasestimated for frequencies between 8 and 44 Hz with 2 Hz stepsand 4 Hz band-width. For this estimation EMG was shifted relativeto EEG between �p and +p in p/6 steps. Separately for each EMGelectrode and delay, multiple regression was performed and thecoherence corresponding to the best EMG channel and delay wasselected for further analysis.
Let y be projected EEG data which is maximally synchronouswith the EMG data in g, then the coherence between projected data(y) and EMG (g) across segments is estimated as:
Cohg;y ¼jsg;yj2
sg � syð1Þ
where sg and sy are averaged Fourier powers for EMG and projectedEEG data, respectively, and sg,y is the averaged cross-spectrum. Forthe calculation of the Fourier transforms, the data was divided into500-ms non-overlapping segments and windowed with a Hanningwindow. When presenting results, we refer to CMC amplitude andfrequency corresponding to the highest peak in the coherencespectrum.
In order to calculate the spatial pattern of the optimized EEGvector, i.e. the topographical distribution corresponding to thestrongest coherent activity, we utilized an approach proposed byParra et al. (2002). During the optimization procedure we excludedcomponents with patterns showing abnormal activity such as mo-saic like high-frequency spatial features or strong activity at thetemporal or frontal edges of the patterns (a typical indication forthe presence of the scalp muscle activity).
We used permutation tests for determining the significance le-vel of the coherence (Hesterberg et al., 2005). For this procedure,we repeated all the steps of R-CMC but used EMG segments thatwere shuffled with respect to the EEG data. One-hundred permuta-tions were performed for each set of data, and a specific coherencevalue was obtained on 30 epochs randomly chosen for each per-mutation. The coherence was considered significant if the hundredcoherence values of unpermuted data (see above) were signifi-cantly larger than the coherence values of permuted data (t-test).
Further, we calculated the temporal evolution of CMC from �2to 7 s around the start tone. The coherence was calculated with500-ms windows which were translated along the whole epochlength with 100-ms steps. The spatial filter obtained for the stableactive period (2–4 s) was used for all time windows.

K. von Carlowitz-Ghori et al. / Clinical Neurophysiology 125 (2014) 1182–1191 1185
2.5.3. Localization of cortical CMC sourcesPatterns corresponding to the optimized EEG components were
used for finding neuronal sources with the sLORETA algorithm(Pascual-Marqui, 2002). For comparing sources of the affectedand unaffected side, the data were mapped to correspond to thesame hand side of performance. The individual EEG patterns wereflipped such that the lesion was always in the right hemispherecorresponding to left hand performance. Accordingly, performanceof the unaffected hand was mapped to right hand performance.Consequently, the sources were mapped using the standardMNI305 head (Collins et al., 1994). For comparative purposes, sLO-RETA maps were normalized by dividing the power in each voxelby the sum of power from all voxels.
2.5.4. Event-related desynchronization (ERD)The EEG signals were segmented around the starting tone from
�2 to 7 s and bandpass-filtered around the peak frequency ob-tained for the highest CMC value with a bandwidth of ±2 Hz. Thenthe spatial filter obtained from CMC estimation was applied. There-after, the absolute value of the Hilbert transformed signal was ob-tained and the epochs were averaged. We refer to the response ofthe post-stimulus amplitude expressed in percentage with respectto the pre-stimulus (�700 to �200 ms) amplitude as event-relateddesynchronization (ERD; Pfurtscheller and Lopes da Silva, 1999).
2.5.5. Power and frequency of ongoing oscillationsWe determined also two measures of ongoing oscillations in the
pre-stimulus interval (�2 to 0 s). For both measures, the analysis ofspectral power of ongoing oscillations was based on the projectedEEG component, which was optimized for CMC estimation. For thefirst measure, relative spectral power (RSP) corresponded to the ra-tio of the mean power in the 4 Hz-wide frequency band around thehighest CMC value to the mean power in the broad frequencyrange of 5–35 Hz. For the second measure, we determined the larg-est spectral peak (of the R-CMC projected component) in the 8–35 Hz range; this peak was not necessarily corresponding to thepeak of the strongest CMC but rather reflecting the largest powerin ongoing EEG.
2.5.6. Statistical analysisStatistical analyses of values for CMC amplitude and frequency
were carried out in SPSS (IBM SPSS Inc., USA). For statistical com-parison of the CMC parameters within the patient group, a linearmixed model was employed including the repeated variables SIDE(affected and unaffected) and TIME (acute and chronic). The sameanalysis was performed for force, coefficients of variation of force,ERD amplitude and latency, pre-stimulus RSP, and peak frequencyof power. If not indicated otherwise, statistical results are given asmean values ± standard error of mean (SEM).
3. Results
3.1. Performance
All patients were able to perform the task and maintain the re-quired force level. When all epochs were taken into account, theforce level in the 2–4 s interval (which was used for the calculationof CMC) was 0.46 ± 0.03 N and 0.49 ± 0.02 N for the affected andunaffected side of the patients, respectively, in the acute period,and 0.53 ± 0.03 N and 0.50 ± 0.03 N for the affected and unaffectedside, respectively, in the chronic period. As mentioned in Section 2,epochs which deviated by more than 0.1 N from the required levelwere rejected in order to avoid attenuation of CMC due to ongoingmovement (Kilner et al., 2000; Riddle and Baker, 2006). After re-moval of such epochs the mean level of force was 0.50 ± 0.01 N
and 0.52 ± 0.02 N for the affected and unaffected side, respectively,in the acute period, and 0.53 ± 0.03 N and 0.51 ± 0.03 N for the af-fected and unaffected side, respectively, in the chronic period. Nei-ther before nor after the artifact removal the mean force leveldiffered statistically between side of lesion or time points. Beforeartifact removal, the coefficients of variation of force levels were0.36 ± 0.07 and 0.29 ± 0.05 for the affected and unaffected side,respectively, in the acute period, and 0.15 ± 0.02 and 0.15 ± 0.03in the chronic stage. There was a significant effect of the factorTIME (p < 0.01). Pairwise comparison between acute and chronicperiod was significant for both unaffected (p < 0.05) and affectedsides (p < 0.05). After the removal of artifacts, the coefficients ofvariation of force levels were 0.13 ± 0.02 and 0.13 ± 0.01 for the af-fected and unaffected side, respectively, in the acute period, and0.10 ± 0.01 and 0.10 ± 0.02 for the affected and unaffected side,respectively, in the chronic period. There was still a significantinteraction effect of SIDE � TIME (p < 0.05). On the affected side,the difference between acute and chronic period was near signifi-cant (p = 0.05).
3.2. Corticomuscular coherence
3.2.1. CMC amplitudeIn the acute period, CMC amplitude in patients was 0.15 ± 0.02
and 0.20 ± 0.02 for the affected and unaffected side, respectively;and in the chronic period CMC amplitude was 0.16 ± 0.03 and0.14 ± 0.02 for the affected and unaffected side, respectively. Forthe 7 patients, that were measured at both time points, the CMCspectra of both sides in acute and chronic stroke are shown inFig. 1 to illustrate the observed changes in CMC amplitude and fre-quencies. As an example, the spatial CMC patterns of subject 10 areshown for both sides and both stroke stages in SupplementaryFig. S2. The time course of CMC (averaged across subjects) is dis-played in Fig. 2 confirming that the post-stimulus interval 2–4 swas optimal for the calculation of CMC since it corresponded tothe strongest coherence. Fig. 3 shows the grand average (acrossall subjects) for sLORETA solutions separately for the affected andunaffected sides at both acute (A) and chronic (B) stages. For com-parative purposes, the single sLORETA solutions were mapped suchthat the lesion was always in the right hemisphere. For both sidesand time points of measurement, CMC sources were localized inthe sensorimotor cortices contralateral to the performing hand.
In controls, CMC amplitude was 0.16 ± 0.02 and 0.17 ± 0.02 forleft and right hands, respectively. There were no differences inCMC amplitude or frequency between hands. For comparison withthe patient group, CMC values corresponding to left and righthands of the controls were therefore averaged to obtain one valuefor each subject, resulting in a CMC amplitude of 0.16 ± 0.02.
In patients, statistical comparison showed a significant effectfor the factor TIME (p < 0.05). The interaction effect of TIME � SIDEwas also near significant (p = 0.056). Pairwise comparison showedthat in the acute period, the CMC amplitude for the unaffected sideof the patients was significantly larger than for the affected side(p < 0.01). Additionally, on the unaffected side, the CMC amplitudewas significantly larger in the acute period compared to thechronic period (p < 0.01). The comparison with the control group,showed no difference of CMC amplitude between controls and af-fected or unaffected side of patients for acute and chronic stage (t-tests). Fig. 4A illustrates the statistical results for the comparison ofCMC amplitudes.
3.2.2. CMC frequencyIn the acute period of stroke, CMC was in the range of 8–18 Hz
and 8–26 Hz on the affected and unaffected side, respectively, themean CMC peak frequency being 12.0 ± 0.8 Hz and 14.4 ± 1.5 Hz,respectively. In the chronic period, CMC ranges were 12.5–28 Hz
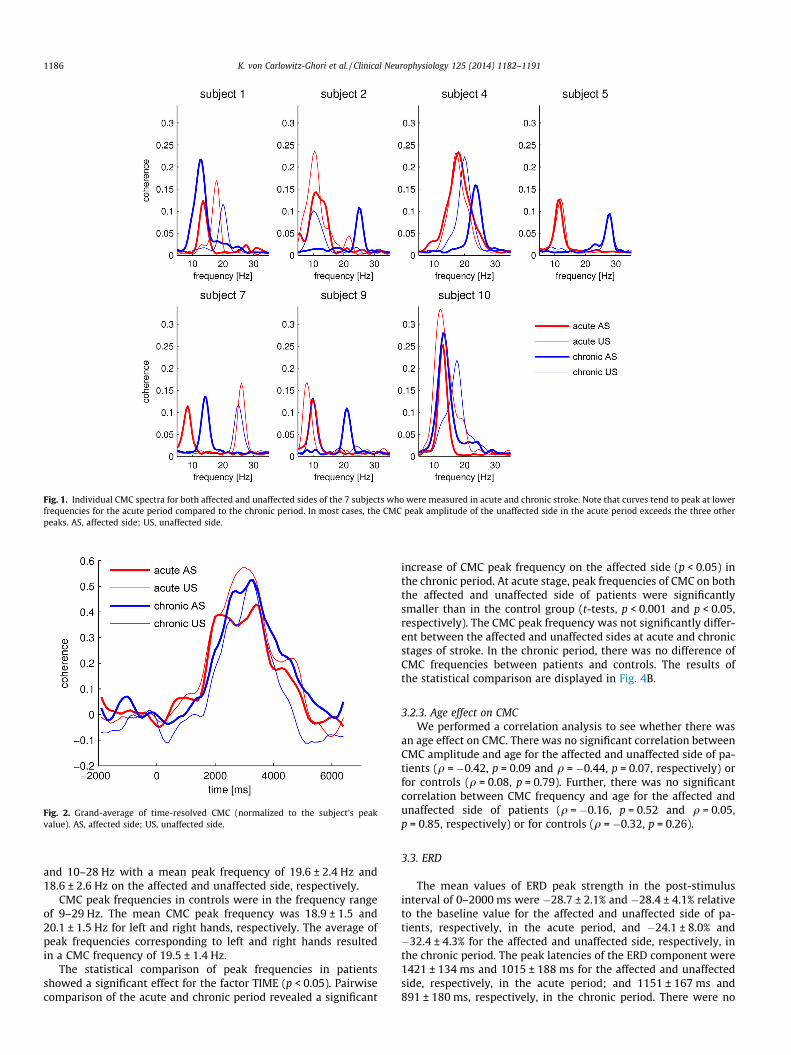
Fig. 1. Individual CMC spectra for both affected and unaffected sides of the 7 subjects who were measured in acute and chronic stroke. Note that curves tend to peak at lowerfrequencies for the acute period compared to the chronic period. In most cases, the CMC peak amplitude of the unaffected side in the acute period exceeds the three otherpeaks. AS, affected side; US, unaffected side.
Fig. 2. Grand-average of time-resolved CMC (normalized to the subject’s peakvalue). AS, affected side; US, unaffected side.
1186 K. von Carlowitz-Ghori et al. / Clinical Neurophysiology 125 (2014) 1182–1191
and 10–28 Hz with a mean peak frequency of 19.6 ± 2.4 Hz and18.6 ± 2.6 Hz on the affected and unaffected side, respectively.
CMC peak frequencies in controls were in the frequency rangeof 9–29 Hz. The mean CMC peak frequency was 18.9 ± 1.5 and20.1 ± 1.5 Hz for left and right hands, respectively. The average ofpeak frequencies corresponding to left and right hands resultedin a CMC frequency of 19.5 ± 1.4 Hz.
The statistical comparison of peak frequencies in patientsshowed a significant effect for the factor TIME (p < 0.05). Pairwisecomparison of the acute and chronic period revealed a significant
increase of CMC peak frequency on the affected side (p < 0.05) inthe chronic period. At acute stage, peak frequencies of CMC on boththe affected and unaffected side of patients were significantlysmaller than in the control group (t-tests, p < 0.001 and p < 0.05,respectively). The CMC peak frequency was not significantly differ-ent between the affected and unaffected sides at acute and chronicstages of stroke. In the chronic period, there was no difference ofCMC frequencies between patients and controls. The results ofthe statistical comparison are displayed in Fig. 4B.
3.2.3. Age effect on CMCWe performed a correlation analysis to see whether there was
an age effect on CMC. There was no significant correlation betweenCMC amplitude and age for the affected and unaffected side of pa-tients (q = �0.42, p = 0.09 and q = �0.44, p = 0.07, respectively) orfor controls (q = 0.08, p = 0.79). Further, there was no significantcorrelation between CMC frequency and age for the affected andunaffected side of patients (q = �0.16, p = 0.52 and q = 0.05,p = 0.85, respectively) or for controls (q = �0.32, p = 0.26).
3.3. ERD
The mean values of ERD peak strength in the post-stimulusinterval of 0–2000 ms were �28.7 ± 2.1% and �28.4 ± 4.1% relativeto the baseline value for the affected and unaffected side of pa-tients, respectively, in the acute period, and �24.1 ± 8.0% and�32.4 ± 4.3% for the affected and unaffected side, respectively, inthe chronic period. The peak latencies of the ERD component were1421 ± 134 ms and 1015 ± 188 ms for the affected and unaffectedside, respectively, in the acute period; and 1151 ± 167 ms and891 ± 180 ms, respectively, in the chronic period. There were no
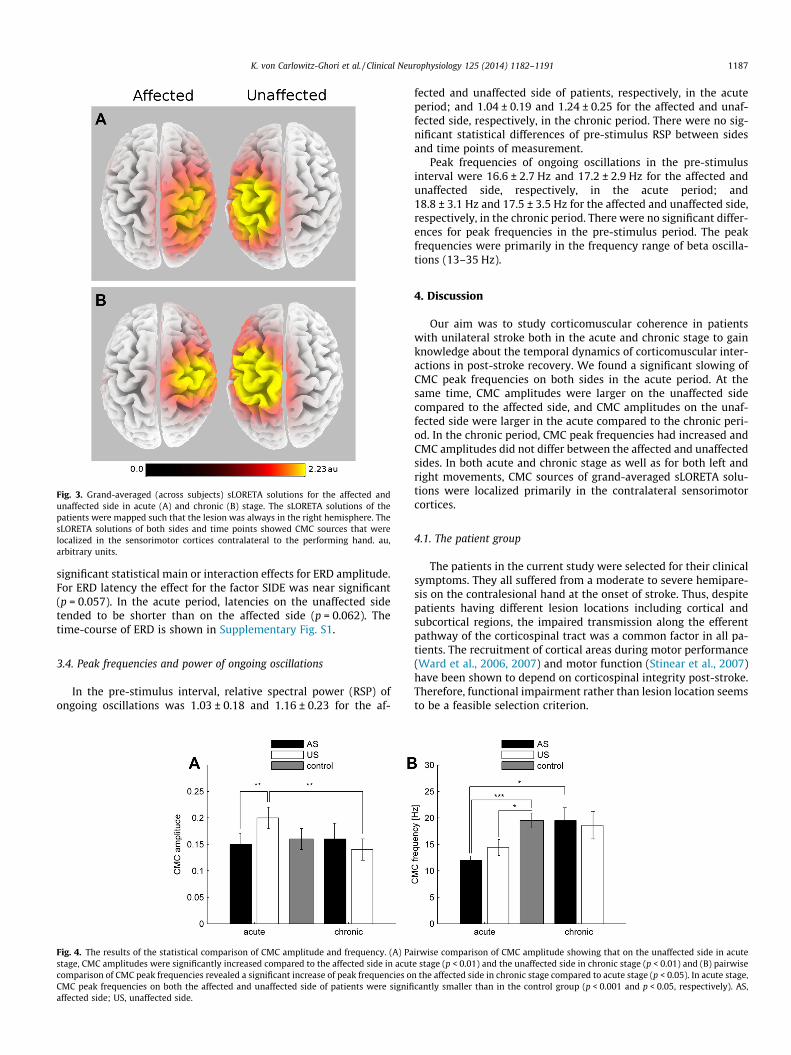
Fig. 3. Grand-averaged (across subjects) sLORETA solutions for the affected andunaffected side in acute (A) and chronic (B) stage. The sLORETA solutions of thepatients were mapped such that the lesion was always in the right hemisphere. ThesLORETA solutions of both sides and time points showed CMC sources that werelocalized in the sensorimotor cortices contralateral to the performing hand. au,arbitrary units.
K. von Carlowitz-Ghori et al. / Clinical Neurophysiology 125 (2014) 1182–1191 1187
significant statistical main or interaction effects for ERD amplitude.For ERD latency the effect for the factor SIDE was near significant(p = 0.057). In the acute period, latencies on the unaffected sidetended to be shorter than on the affected side (p = 0.062). Thetime-course of ERD is shown in Supplementary Fig. S1.
3.4. Peak frequencies and power of ongoing oscillations
In the pre-stimulus interval, relative spectral power (RSP) ofongoing oscillations was 1.03 ± 0.18 and 1.16 ± 0.23 for the af-
Fig. 4. The results of the statistical comparison of CMC amplitude and frequency. (A) Pastage, CMC amplitudes were significantly increased compared to the affected side in acutcomparison of CMC peak frequencies revealed a significant increase of peak frequencies oCMC peak frequencies on both the affected and unaffected side of patients were signifiaffected side; US, unaffected side.
fected and unaffected side of patients, respectively, in the acuteperiod; and 1.04 ± 0.19 and 1.24 ± 0.25 for the affected and unaf-fected side, respectively, in the chronic period. There were no sig-nificant statistical differences of pre-stimulus RSP between sidesand time points of measurement.
Peak frequencies of ongoing oscillations in the pre-stimulusinterval were 16.6 ± 2.7 Hz and 17.2 ± 2.9 Hz for the affected andunaffected side, respectively, in the acute period; and18.8 ± 3.1 Hz and 17.5 ± 3.5 Hz for the affected and unaffected side,respectively, in the chronic period. There were no significant differ-ences for peak frequencies in the pre-stimulus period. The peakfrequencies were primarily in the frequency range of beta oscilla-tions (13–35 Hz).
4. Discussion
Our aim was to study corticomuscular coherence in patientswith unilateral stroke both in the acute and chronic stage to gainknowledge about the temporal dynamics of corticomuscular inter-actions in post-stroke recovery. We found a significant slowing ofCMC peak frequencies on both sides in the acute period. At thesame time, CMC amplitudes were larger on the unaffected sidecompared to the affected side, and CMC amplitudes on the unaf-fected side were larger in the acute compared to the chronic peri-od. In the chronic period, CMC peak frequencies had increased andCMC amplitudes did not differ between the affected and unaffectedsides. In both acute and chronic stage as well as for both left andright movements, CMC sources of grand-averaged sLORETA solu-tions were localized primarily in the contralateral sensorimotorcortices.
4.1. The patient group
The patients in the current study were selected for their clinicalsymptoms. They all suffered from a moderate to severe hemipare-sis on the contralesional hand at the onset of stroke. Thus, despitepatients having different lesion locations including cortical andsubcortical regions, the impaired transmission along the efferentpathway of the corticospinal tract was a common factor in all pa-tients. The recruitment of cortical areas during motor performance(Ward et al., 2006, 2007) and motor function (Stinear et al., 2007)have been shown to depend on corticospinal integrity post-stroke.Therefore, functional impairment rather than lesion location seemsto be a feasible selection criterion.
irwise comparison of CMC amplitude showing that on the unaffected side in acutee stage (p < 0.01) and the unaffected side in chronic stage (p < 0.01) and (B) pairwisen the affected side in chronic stage compared to acute stage (p < 0.05). In acute stage,cantly smaller than in the control group (p < 0.001 and p < 0.05, respectively). AS,

1188 K. von Carlowitz-Ghori et al. / Clinical Neurophysiology 125 (2014) 1182–1191
Note that on the day of the first recording, patients had alreadyregained enough muscle strength (assessed by MRC scores) to per-form the experiment. Thus, we were able to detect changes in CMCbetween acute and chronic stage while MRC scores were not sen-sitive enough for this differentiation.
4.2. CMC in acute stroke
To our knowledge, this study is the first to measure CMC in theacute stage of stroke. We found lower CMC frequencies on bothsides compared to the chronic period and the control subjects.
It is unlikely that the shift to lower frequencies is caused by anartifact such as scalp muscle activity. We addressed the problem ofinterfering strong sources already in our previous study(Bayraktaroglu et al., 2011) where we performed simulations usingrealistic head modeling. In these simulations we had one corticaldipole interacting with muscle activity and an interfering, uncorre-lated dipole which was up to 20 times stronger. For backgroundneuronal noise, we added 500 dipoles producing 1/f noise. Our re-sults showed that R-CMC reliably extracted the cortical sourcesshowing CMC, avoiding the extraction of the interfering source.
Interestingly, Mima et al. (2001), Fig. 1B) showed the exampleof a chronic stroke patient with CMC frequency at lower frequency(11 Hz) which they however did not elaborate on. Slowing of CMCfrequencies can be interpreted in two different ways. Firstly, theCMC peak in the low frequency range might reflect an underlyingprocess different from the CMC peak in the higher frequency range.In this case, the relation between these two processes would havechanged in the post-stroke period: while in the acute period theprocess at low frequency was more dominant than the process atthe higher frequency, in the chronic period the relation was re-versed. Secondly, the CMC peak might have progressively shiftedfrom lower to higher frequencies in the course of post-strokerecovery. As the current study involved only two measurements,both possibilities could apply. Thus, by referring to slowing ofCMC frequencies we imply both interpretations. Slowing of CMCfrequencies and increased CMC amplitudes have been related tohealthy aging (Graziadio et al., 2010; Kamp et al., 2011). Theauthors argue that M1 power increase and the shift towards lowerfrequencies might represent a neurophysiological marker ofhealthy aging which is possibly compensated by an increasedCMC amplitude. The underlying functional alterations causingthese changes in CMC in aging could be the same as for stroke. Thiswould affirm that in the current study the CMC amplitude is in-creased on the unaffected side in the acute period rather thanCMC amplitudes being decreased on the other side/time point ofmeasurement. An increase in CMC amplitude on the unaffectedside is also supported by the comparison with the control groupin the current study (Fig. 4A). Graziadio et al. (2010) related abroader spread of frequencies including coherence in the alpharange in elderly (>55 years) to a breakdown of recurrent inhibition.They found that a greater deviation from 23 Hz corresponded topoorer performance. We hypothesize that slowing of CMC fre-quency in the acute stage of stroke might result from a temporarydecrease of inhibition. A potential role of inhibition leading to thechanges in CMC will be addressed in further detail below.
4.3. CMC in chronic stroke
Previous CMC studies were performed at the chronic stage ofstroke and included patients with various degrees of recovery(Mima et al., 2001; Braun et al., 2007; Fang et al., 2009; Menget al., 2009; Graziadio et al., 2012). They consistently indicated afunctional involvement of the lesioned hemisphere; the resultsabout the CMC amplitude and peak frequency were however lessconsistent. Mima et al. (2001) and Meng et al. (2009) reported sig-
nificantly lower CMC amplitudes for affected hand movements,including spatial shifts without any changes in CMC peak fre-quency. Braun et al. (2007) showed that CMC amplitudes did notdiffer between recovered patients and controls, but in patientsCMC was larger in amplitude and distributed over a broader fre-quency interval on the affected side compared to the unaffectedside. In a dynamic reaching task, Fang et al. (2009) comparedCMC between cortical regions and upper limb muscles in poorlyrecovered stroke patients and controls. They found that while mo-tor coordination deficits abolished gamma band CMC in stroke pa-tients, there were only small differences in beta-band CMCbetween the two groups. Graziadio et al. (2012), who included pa-tients with various degrees of recovery, found no difference be-tween stroke patients and controls in CMC amplitudes orfrequencies but hemispheric symmetry of CMC correlated withrecovery. Only Fang et al. (2009), who found no hemispheric differ-ences in CMC amplitude, included poorly recovered patients but atthe same time also used a different experimental task. The others(Mima et al., 2001; Braun et al., 2007; Meng et al., 2009) found dif-ferences in CMC amplitude despite good recovery. Therefore, thedegree of recovery does not seem to be the only explanation forthe differences in CMC amplitude. It is more likely that a mixtureof several parameters including the recovery of the patients, thetime elapsed after the stroke occurrence and specific motor para-digms utilized by different researchers led to the diverse outcomesin CMC amplitude in these studies, making a comparison of the re-sults difficult.
Although the results of CMC amplitude in stroke vary, a com-mon finding – consistent with the results of the present study –is that there are no inter-hemispheric differences in CMC peak fre-quency in chronic stroke among the studies that report on CMCpeak frequencies (Mima et al., 2001; Meng et al., 2009; Graziadioet al., 2012).
Our measurements at chronic stage were performed on average194.6 days after the stroke, this time interval being the earliestamong the time intervals used in the previous studies on CMC instroke. Importantly, our results showed that already after this com-paratively short time interval there were no inter-hemispheric dif-ferences in the amplitude of CMC or its peak frequencies.
4.4. Factors potentially contributing to the modulation of CMC
Although we found the stated significant differences in theparameters of CMC between sides and between stroke stages,one could also observe a certain variability across subjects inamplitude and frequency of CMC. The inhomogeneity among thepatients can most likely be attributed to the general inter-individ-ual variability of CMC which also occurs in healthy people includ-ing the occurrence of CMC in alpha range in some cases (Mima andHallett, 1999; Ushiyama et al., 2011).
In the following we elaborate on factors that were shown to berelated to differences in CMC and which might be of relevance forthe current study.
4.4.1. AgePrevious studies have shown an age effect on CMC (Graziadio
et al., 2010; Kamp et al., 2011). Kamp et al. (2011) found CMC fre-quency to be negatively and CMC amplitude to be positively corre-lated with age. For the age groups above 40 years there washowever no difference in CMC frequency. Yet, there was a trendof CMC amplitude to be higher in elderly (58–77 years) comparedto middle-aged people (41–55 years). Graziadio et al. (2010) didnot find a difference in CMC amplitude when comparing elderly(>55 years) with young adults (20–35 years). In the current studythe control group was younger than the patients group; however,there was no correlation of CMC amplitude or frequency with

K. von Carlowitz-Ghori et al. / Clinical Neurophysiology 125 (2014) 1182–1191 1189
age. A possible explanation would be that the youngest subject inthe control group was 39 years old. Thus, both patient and controlgroup corresponded to those studies’ middle-aged and elderlygroups where no significant differences were found. Takentogether, the CMC changes found in the current study cannot berelated to age. Changes in CMC amplitude occurred for the with-in-subject comparison and related only to the unaffected side.Moreover, while at acute stage peak frequencies were significantlylower, they aligned with the peak frequencies of controls at chronicstage. The increase in the chronic period thus argues against an ef-fect of age.
4.4.2. Motor performanceCMC changes depend on the exerted force (Brown et al., 1998;
Mima et al., 1999), however CMC amplitude is not affected byweak to moderate forces (Mima et al., 1999). To ensure further thatour findings were not due to different motor performance of theparetic and non-paretic hands, we excluded trials deviating morethan 0.1 N from the required force level such that there were nosignificant differences between the mean force levels either be-tween affected/unaffected hand or between time points of mea-surement (acute vs. chronic stages). Coefficients of variation offorce had a tendency to be larger on the affected side in acute com-pared to chronic stage. CMC amplitude changes, however, occurredon the unaffected side and can therefore not be attributed to vari-ations in force levels.
We controlled for equal force levels by choosing a fixed force le-vel of 0.5 N rather than, as often used, a percentage of maximumvoluntary contraction (MVC). A certain percentage, i.e. 5%, ofMVC could have led to very small force levels for some of the pa-tients, especially at acute stage, making performance difficult. Fur-ther, while the motor system in the stroke patients was affected,the majority of patients did not show any tactile impairment. Tak-ing MVC as a reference for the target force level would have in-creased the tactile stimulation (due to recovered motor strength)in the second measurement. As feedback afferent pathways poten-tially play a role in CMC generation (Riddle and Baker, 2005; Baker,2007), thus equal force levels in the current study ensured thatsomatosensory feedback did not induce the differences in the mea-sured CMC.
4.4.3. ERD and power of beta oscillationsFindings on movement-related ERD in paretic stroke subjects
vary (Platz et al., 2000; Gerloff et al., 2006; Stepien et al., 2011).Here, we did not find any significant differences in the magnitudesor latencies of ERD comparing sides and time point of measure-ment. Thus, ERD, which is considered to be an electrophysiologicalcorrelate of activated neuronal networks (Pfurtscheller and Lopesda Silva, 1999), is unlikely to explain the differences in the CMCparameters.
Engel and Fries (2010) suggested that beta oscillations relate tothe maintenance of the current sensorimotor set, while in contrast,an abnormal enhancement of beta activity would be likely to resultin a persistence of the current sensorimotor set and a deteriorationof flexible behavioral and cognitive control. Previously, the recov-ery of stroke patients was shown to be positively correlated withthe hemispheric symmetry of beta-band power (Graziadio et al.,2012). In acute stroke patients, Tecchio et al. (2005) found smallerrelative beta-band power at rest in the affected compared to theunaffected hemisphere. This inter-hemispheric difference in rela-tive but not in absolute beta-band power was also observed inchronic patients (Tecchio et al., 2006). Here, we compared relativespectral power (RSP) of beta oscillations before movement onsetand found it to be not different between sides and time points ofmeasurement (acute vs. chronic stage). We therefore can excludethat changes in CMC are caused by changes in the amplitude of
neuronal oscillations, which in turn relate to the signal-to-noise ra-tio (Nikulin et al., 2011) and thus can effect the estimation of CMC(Bayraktaroglu et al., 2013).
4.5. Dissociation of CMC and beta oscillations
Our finding is in line with the earlier studies suggesting a func-tional dissociation between different components of beta oscilla-tions (Pfurtscheller et al., 1997; Hall et al., 2011) as well asbetween the power of beta oscillations and CMC (Baker and Baker,2003; Riddle et al., 2004). Diazepam, a GABAA receptor agonist,slightly reduced beta CMC amplitude while EEG beta power dou-bled (Baker and Baker, 2003). On the contrary, Riddle et al.(2004) showed the opposite reaction when administering the anti-convulsive drug Carbamazepine: CMC amplitude increasedwhereas beta power and also CMC frequency remained unchanged.
In the present study not only the magnitude of beta power, butalso the peak frequencies of ongoing pre-stimulus beta oscillationsduring rest remained unchanged between the sides and timepoints of measurement. In comparison, CMC frequencies were low-er on both sides in acute stage thus further reinforcing the assump-tion of a dissociation between beta oscillation and CMC.
4.6. Potential role of GABA-mediated inhibition
We hypothesize that the changes in CMC, observed in the presentstudy, might relate to the time-course of changes in cortical inhibi-tion following stroke. The modulation of GABA availability isthought to be important for the cortical reorganization in the acuteperiod of functional recovery after a lesion (Levy et al., 2002). This issupported by Clarkson et al. (2010) who showed that reducingexcessive GABA-mediated tonic (extrasynaptic) inhibition pro-motes the recovery after stroke in mice. Such a reduced tonic inhibi-tion might lead to slowing frequency of beta oscillations as shownby Jensen et al. (2005). They demonstrated in a simulation thatinhibitory current to inhibitory interneurons led to an increase inbeta power, widening of the spectral peak and slowing of frequency.Consistent with this finding, in another simulation study lackingrecurrent inhibition was shown to result in an enlarged CMC peakat 10 Hz (Williams and Baker, 2009). Here we argue that in success-ful motor recovery the general slowing of CMC frequency and the in-crease of coherence amplitude on the unaffected side might reflect areduction of tonic inhibition by GABAA receptors. Inhibition wasshown to be decreased in either only ipsilesional (Swayne et al.,2008) or both contra- and ipsilesional motor cortices (Bütefischet al., 2008; Huynh et al., 2013) in acute and subacute stroke patientsand became correlated with functional recovery 3 months post-stroke (Swayne et al., 2008). An imbalance of transcallosal inhibition(Bütefisch et al., 2008) could explain the hemispheric asymmetry ofCMC amplitudes in the acute period shown in the current study.These CMC changes in amplitude and frequency potentially mightbe a sign of cortical reorganization in the acute period after strokeand beneficial for motor recovery as, on the contrary, the GABA-ago-nist Diazepam slightly reduces CMC (Baker and Baker, 2003) and hasa negative effect on stroke recovery (Goldstein, 1998). The changesof CMC at acute stage are then followed by the return to higher CMCpeak frequencies and inter-hemispherically symmetric amplitudesin the chronic phase of stroke. The modulation of CMC amplitudeand frequency over time might thus reflect the course of motorrecovery.
Acknowledgements
Z.B. was supported by the Center for Stroke Research Berlin.V.V.N. and G.C. were supported by the Berlin Bernstein Center forComputational Neuroscience.

1190 K. von Carlowitz-Ghori et al. / Clinical Neurophysiology 125 (2014) 1182–1191
Appendix A. Supplementary data
Supplementary data associated with this article can be found, inthe online version, at http://dx.doi.org/10.1016/j.clinph.2013.11.006.
References
Assaf Y, Pasternak O. Diffusion tensor imaging (DTI)-based white matter mapping inbrain research: a review. J Mol Neurosci 2008;34:51–61.
Baker SN. Oscillatory interactions between sensorimotor cortex and the periphery.Curr Opin Neurobiol 2007;17:649–55.
Baker MR, Baker SN. The effect of diazepam on motor cortical oscillations andcorticomuscular coherence studied in man. J Physiol 2003;546:931–42.
Baker SN, Olivier E, Lemon RN. Coherent oscillations in monkey motor cortex andhand muscle EMG show task-dependent modulation. J Physiol1997;501:225–41.
Bayraktaroglu Z, von Carlowitz-Ghori K, Losch F, Nolte G, Curio G, Nikulin VV.Optimal imaging of cortico-muscular coherence through a novel regressiontechnique based on multi-channel EEG and un-rectified EMG. NeuroImage2011;57:1059–67.
Bayraktaroglu Z, von Carlowitz-Ghori K, Curio G, Nikulin VV. It is not all aboutphase: amplitude dynamics in corticomuscular interactions. NeuroImage2013;64:496–504.
Braun C, Staudt M, Schmitt C, Preissl H, Birbaumer N, Gerloff C. Crossed cortico-spinal motor control after capsular stroke. Eur J Neurosci 2007;25:2935–45.
Brown P, Salenius S, Rothwell JC, Hari R. Cortical correlate of the piper rhythm inhumans. J Neurophysiol 1998;80:2911–7.
Bütefisch CM, Webling M, Netz J, Seitz RJ, Hömberg V. Relationship betweeninterhemispheric inhibition and motor cortex excitability in subacute strokepatients. Neurorehabil Neural Repair 2008;22:4–21.
Calautti C, Baron J-C. Functional neuroimaging studies of motor recovery afterstroke in adults a review. Stroke 2003;34:1553–66.
Clarkson AN, Huang BS, MacIsaac SE, Mody I, Carmichael ST. Reducing excessiveGABA-mediated tonic inhibition promotes functional recovery after stroke.Nature 2010;468:305–9.
Collins DL, Neelin P, Peters TM, Evans AC. Automatic 3D intersubject registration ofMR volumetric data in standardized Talairach space. J Comput Assist Tomogr1994;18:192–205.
Dancause N. Vicarious function of remote cortex following stroke: recent evidencefrom human and animal studies. Neuroscientist 2006;12:489–99.
Engel AK, Fries P. Beta-band oscillations – signalling the status quo? Curr OpinNeurobiol 2010;20:156–65.
Fang Y, Daly JJ, Sun J, Hvorat K, Fredrickson E, Pundik S, et al. Functionalcorticomuscular connection during reaching is weakened following stroke.Clin Neurophysiol 2009;120:994–1002.
Farina D, Negro F, Jiang N. Identification of common synaptic inputs to motorneurons from the rectified electromyogram. J Physiol (London)2013;591:2403–18.
Gerloff C, Bushara K, Sailer A, Wassermann EM, Chen R, Matsuoka T, et al.Multimodal imaging of brain reorganization in motor areas of thecontralesional hemisphere of well recovered patients after capsular stroke.Brain 2006;129:791–808.
Goldstein LB. Potential effects of common drugs on stroke recovery. Arch Neurol1998;55:454–6.
Graziadio S, Basu A, Tomasevic L, Zappasodi F, Tecchio F, Eyre JA. Developmentaltuning and decay in senescence of oscillations linking the corticospinal system.J Neurosci 2010;30:3663–74.
Graziadio S, Tomasevic L, Assenza G, Tecchio F, Eyre JA. The myth of the‘‘unaffected’’ side after unilateral stroke: is reorganisation of the non-infarcted corticospinal system to re-establish balance the price for recovery?Exp Neurol 2012;238:168–75.
Grefkes C, Fink GR. Reorganization of cerebral networks after stroke: new insightsfrom neuroimaging with connectivity approaches. Brain 2011;134:1264–76.
Hall SD, Stanford IM, Yamawaki N, McAllister CJ, Rönnqvist KC, Woodhall GL, et al.The role of GABAergic modulation in motor function related neuronal networkactivity. NeuroImage 2011;56:1506–10.
Hesterberg T, Moore DS, Monaghan S, Clipson A, Epstein R. Bootstrap methods andpermutation tests. In: Moore DS, McCabe GP, editors. Introduction to thePractice of Statistics. 5th ed. New York: W. H. Freeman; 2005. p. 1–70.
Huynh W, Vucic S, Krishnan AV, Lin CS-Y, Hornberger M, Kiernan MC. Longitudinalplasticity across the neural axis in acute stroke. Neurorehabil Neural Repair2013;27:219–29.
Jang SH. A review of motor recovery mechanisms in patients with stroke.NeuroRehabilitation 2007;22:253–9.
Jensen O, Goel P, Kopell N, Pohja M, Hari R, Ermentrout B. On the humansensorimotor-cortex beta rhythm: sources and modeling. NeuroImage2005;26:347–55.
Kamp D, Krause V, Butz M, Schnitzler A, Pollok B. Changes of cortico-muscularcoherence: an early marker of healthy aging? AGE 2011;35:49–58.
Kilner JM, Baker SN, Salenius S, Hari R, Lemon RN. Human cortical muscle coherenceis directly related to specific motor parameters. J Neurosci 2000;20:8838–45.
Kristeva R, Patino L, Omlor W. Beta-range cortical motor spectral power andcorticomuscular coherence as a mechanism for effective corticospinalinteraction during steady-state motor output. NeuroImage 2007;36:785–92.
Levy LM, Ziemann U, Chen R, Cohen LG. Rapid modulation of GABA in sensorimotorcortex induced by acute deafferentation. Ann Neurol 2002;52:755–61.
McClelland VM, Cvetkovic Z, Mills KR. Rectification of the EMG is an unnecessaryand inappropriate step in the calculation of corticomuscular coherence. JNeurosci Methods 2012;205:190–201.
Meng F, Tong K-Y, Chan S-T, Wong W-W, Lui K-H, Tang K-W, et al. Cerebralplasticity after subcortical stroke as revealed by cortico-muscular coherence.IEEE Trans Neural Syst Rehabil Eng 2009;17:234–43.
Mima T, Hallett M. Corticomuscular coherence: a review. J Clin Neurophysiol1999;16:501–11.
Mima T, Simpkins N, Oluwatimilehin T, Hallett M. Force level modulates humancortical oscillatory activities. Neurosci Lett 1999;275:77–80.
Mima T, Toma K, Koshy B, Hallett M. Coherence between cortical and muscularactivities after subcortical stroke. Stroke 2001;32:2597–601.
Nikulin VV, Nolte G, Curio G. A novel method for reliable and fast extraction ofneuronal EEG/MEG oscillations on the basis of spatio-spectral decomposition.NeuroImage 2011;55:1528–35.
Nudo RJ. Postinfarct cortical plasticity and behavioral recovery. Stroke2007;38:840–5.
Oldfield RC. The assessment and analysis of handedness: the Edinburgh inventory.Neuropsychologia 1971;9:97–113.
Oostenveld R, Praamstra P. The five percent electrode system for high-resolutionEEG and ERP measurements. Clin Neurophysiol 2001;112:713–9.
Parra L, Alvino C, Tang A, Pearlmutter B, Yeung N, Osman A, et al. Linear spatialintegration for single-trial detection in encephalography. NeuroImage2002;17:223–30.
Pascual-Marqui RD. Standardized low-resolution brain electromagnetictomography (sLORETA): technical details. Methods Find Exp Clin Pharmacol2002;24(Suppl D):5–12.
Pfurtscheller G, Lopes da Silva FH. Event-related EEG/MEG synchronization anddesynchronization: basic principles. Clin Neurophysiol 1999;110:1842–57.
Pfurtscheller G, Stancák Jr A, Edlinger G. On the existence of different types ofcentral beta rhythms below 30 Hz. Electroenceph Clin Neurophysiol1997;102:316–25.
Platz T, Kim IH, Pintschovius H, Winter T, Kieselbach A, Villringer K, et al.Multimodal EEG analysis in man suggests impairment-specific changes inmovement-related electric brain activity after stroke. Brain 2000;123:2475–90.
Rathore SS, Hinn AR, Cooper LS, Tyroler HA, Rosamond WD. Characterization ofincident stroke signs and symptoms: findings from the atherosclerosis risk incommunities study. Stroke 2002;33:2718–21.
Riddle CN, Baker SN. Manipulation of peripheral neural feedback loops altershuman corticomuscular coherence. J Physiol 2005;566:625–39.
Riddle CN, Baker SN. Digit displacement, not object compliance, underlies taskdependent modulations in human corticomuscular coherence. NeuroImage2006;33:618–27.
Riddle CN, Baker MR, Baker SN. The effect of carbamazepine on humancorticomuscular coherence. NeuroImage 2004;22:333–40.
Rijntjes M. Mechanisms of recovery in stroke patients with hemiparesis or aphasia:new insights, old questions and the meaning of therapies. Curr Opin Neurol2006;19:76–83.
Salenius S, Hari R. Synchronous cortical oscillatory activity during motor action.Curr Opin Neurobiol 2003;13:678–84.
Salenius S, Portin K, Kajola M, Salmelin R, Hari R. Cortical control of humanmotoneuron firing during isometric contraction. J Neurophysiol1997;77:3401–5.
Stegeman DF, van de Ven WJM, van Elswijk GA, Oostenveld R, Kleine BU. The alpha-motoneuron pool as transmitter of rhythmicities in cortical motor drive. ClinNeurophysiol 2010;121:1633–42.
Stepien M, Conradi J, Waterstraat G, Hohlefeld FU, Curio G, Nikulin VV. Event-related desynchronization of sensorimotor EEG rhythms in hemipareticpatients with acute stroke. Neurosci Lett 2011;488:17–21.
Stinear CM, Barber PA, Smale PR, Coxon JP, Fleming MK, Byblow WD. Functionalpotential in chronic stroke patients depends on corticospinal tract integrity.Brain 2007;130:170–80.
Swayne OBC, Rothwell JC, Ward NS, Greenwood RJ. Stages of motor outputreorganization after hemispheric stroke suggested by longitudinal studies ofcortical physiology. Cereb Cortex 2008;18:1909–22.
Takeuchi N, Izumi S-I. Maladaptive plasticity for motor recovery after stroke:mechanisms and approaches. Neural Plast 2012;2012:1–9.
Talelli P, Greenwood RJ, Rothwell JC. Arm function after stroke: neurophysiologicalcorrelates and recovery mechanisms assessed by transcranial magneticstimulation. Clin Neurophysiol 2006;117:1641–59.
Tecchio F, Zappasodi F, Pasqualetti P, Tombini M, Salustri C, Oliviero A, et al.Rhythmic brain activity at rest from rolandic areas in acute mono-hemisphericstroke: a magnetoencephalographic study. NeuroImage 2005;28:72–83.
Tecchio F, Zappasodi F, Pasqualetti P, Tombini M, Caulo M, Ercolani M, et al. Long-term effects of stroke on neuronal rest activity in rolandic cortical areas. JNeurosci Res 2006;83:1077–87.
Tsujimoto T, Mima T, Shimazu H, Isomura Y. Directional organization ofsensorimotor oscillatory activity related to the electromyogram in themonkey. Clin Neurophysiol 2009;120:1168–73.
Ushiyama J, Suzuki T, Masakado Y, Hase K, Kimura A, Liu M, et al. Between-subjectvariance in the magnitude of corticomuscular coherence during tonic isometric

K. von Carlowitz-Ghori et al. / Clinical Neurophysiology 125 (2014) 1182–1191 1191
contraction of the tibialis anterior muscle in healthy young adults. JNeurophysiol 2011;106:1379–88.
Ward NS. Neural plasticity and recovery of function. In: Laureys S, editor. Progressin brain research. The boundaries of consciousness: neurobiology andneuropathology. Elsevier; 2005. p. 527–35.
Ward NS, Newton JM, Swayne OBC, Lee L, Thompson AJ, Greenwood RJ, et al. Motorsystem activation after subcortical stroke depends on corticospinal systemintegrity. Brain 2006;129:809–19.
Ward NS, Newton JM, Swayne OBC, Lee L, Frackowiak RSJ, Thompson AJ, et al. Therelationship between brain activity and peak grip force is modulated by
corticospinal system integrity after subcortical stroke. Eur J Neurosci2007;25:1865–73.
Williams ER, Baker SN. Renshaw cell recurrent inhibition improves physiologicaltremor by reducing corticomuscular coupling at 10 Hz. J Neurosci2009;29:6616–24.
Witham CL, Wang M, Baker SN. Corticomuscular coherence between motor cortex,somatosensory areas and forearm muscles in the monkey. Front Syst Neurosci2010;4:1–14.


![[Coherence] coherence 모니터링 v 1.0](https://img.pdfslide.net/doc/110x75/54c1fc894a79599f448b456b/coherence-coherence-v-10.jpg)