Embed Size (px)
Citation preview
COS 338
Day 20
2
DAY 19 Agenda
Assignment 6 Due
Lab 7 due next Monday
Assignment 7 Posted Due Dec 1
Capstone Progress reports due
Exam 3 on November 21 Chap 8&9, open book, open notes, 60 min, 25 M/c questions. Quiz can be taken from anywhere. Availability, time and password will be sent via WebCT e-mail
Today we will do discuss network management
Chapter 10
Copyright 2004 Prentice-HallPanko’s Business Data Networks and Telecommunications, 5th edition
Network Management
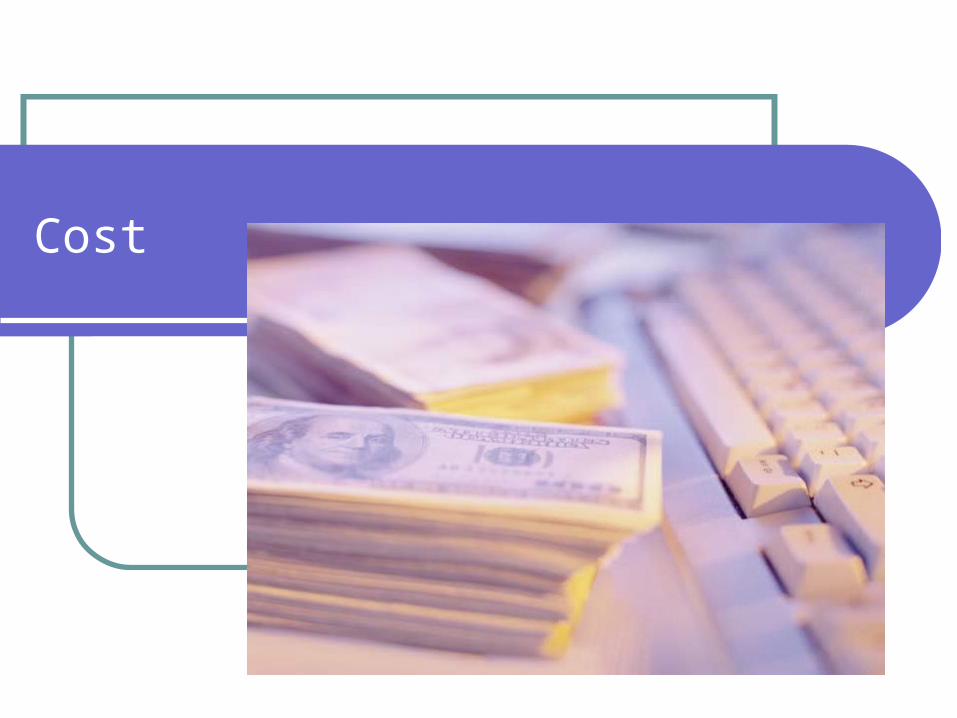
Cost
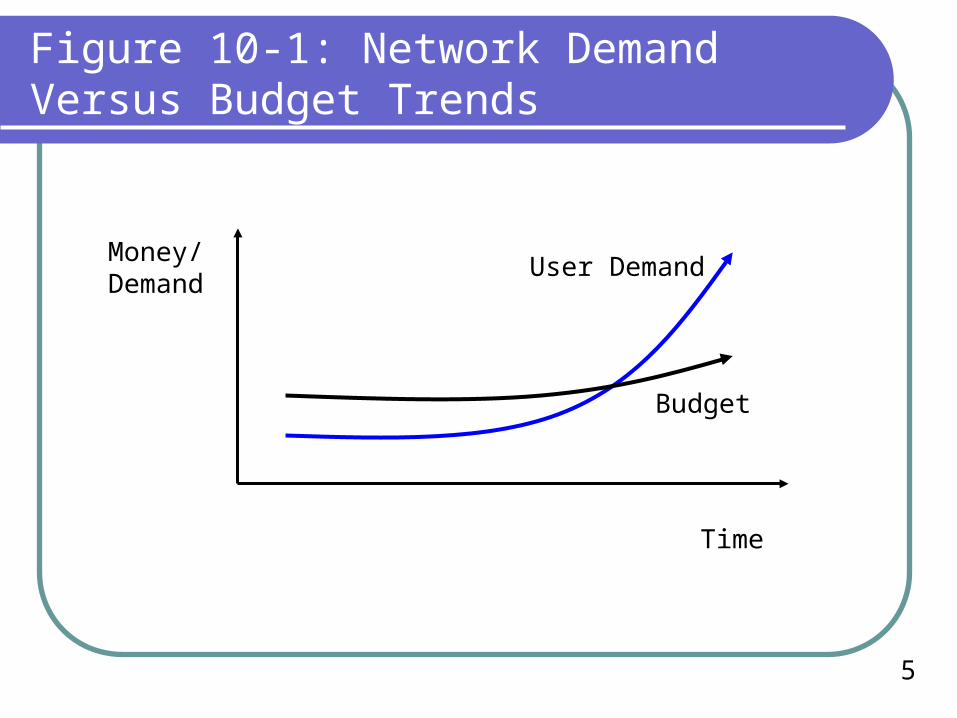
5
Figure 10-1: Network Demand Versus Budget Trends
Money/Demand
Time
User Demand
Budget
6
Figure 10-2: Cost Issues
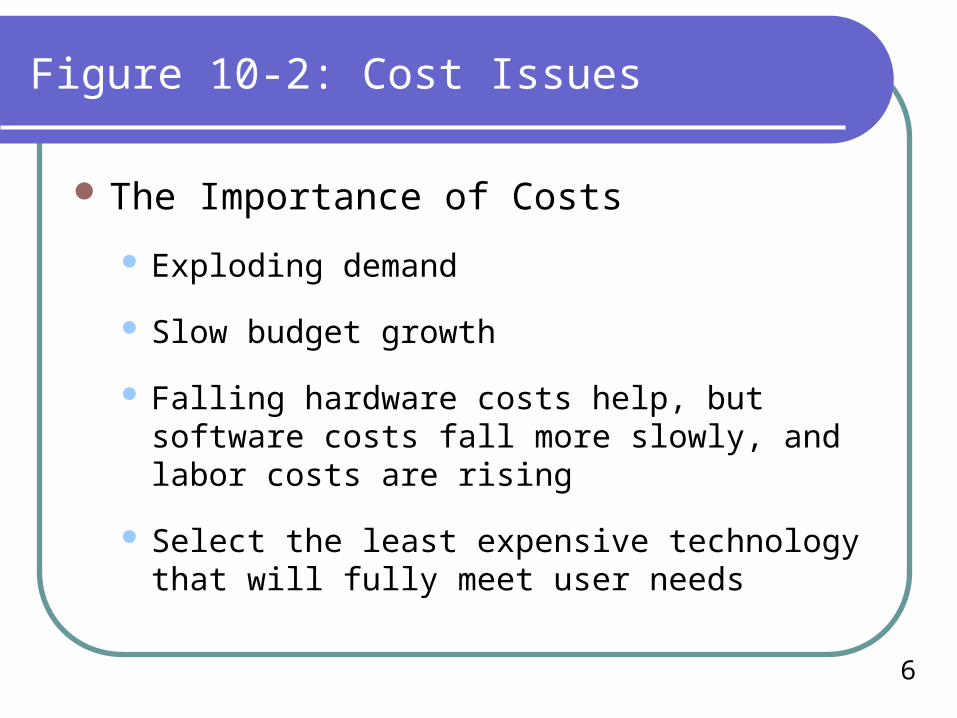
The Importance of Costs
Exploding demand
Slow budget growth
Falling hardware costs help, but software costs fall more slowly, and labor costs are rising
Select the least expensive technology that will fully meet user needs
7
Figure 10-2: Cost Issues
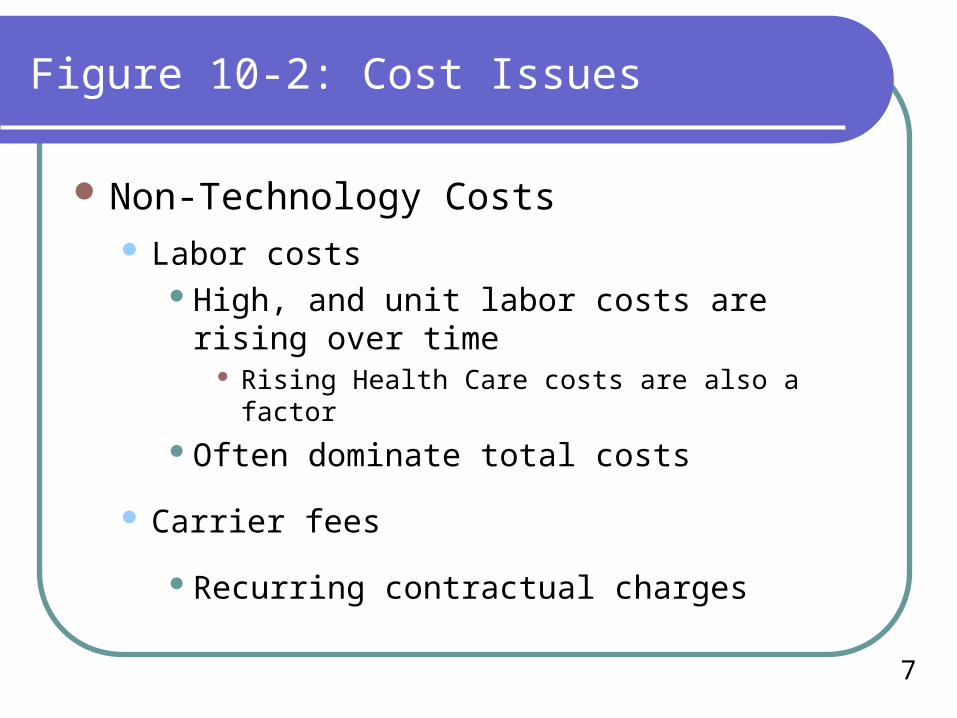
Non-Technology Costs Labor costs
High, and unit labor costs are rising over time Rising Health Care costs are also a factor
Often dominate total costs
Carrier fees
Recurring contractual charges
8
Figure 10-2: Cost Issues
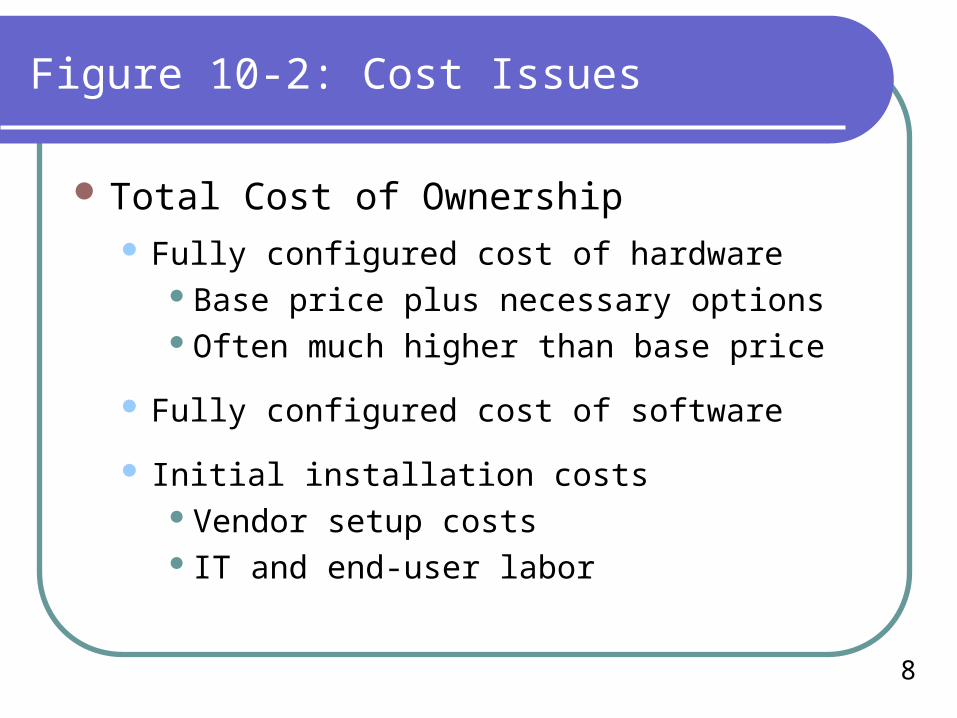
Total Cost of Ownership Fully configured cost of hardware
Base price plus necessary optionsOften much higher than base price
Fully configured cost of software
Initial installation costsVendor setup costs IT and end-user labor
9
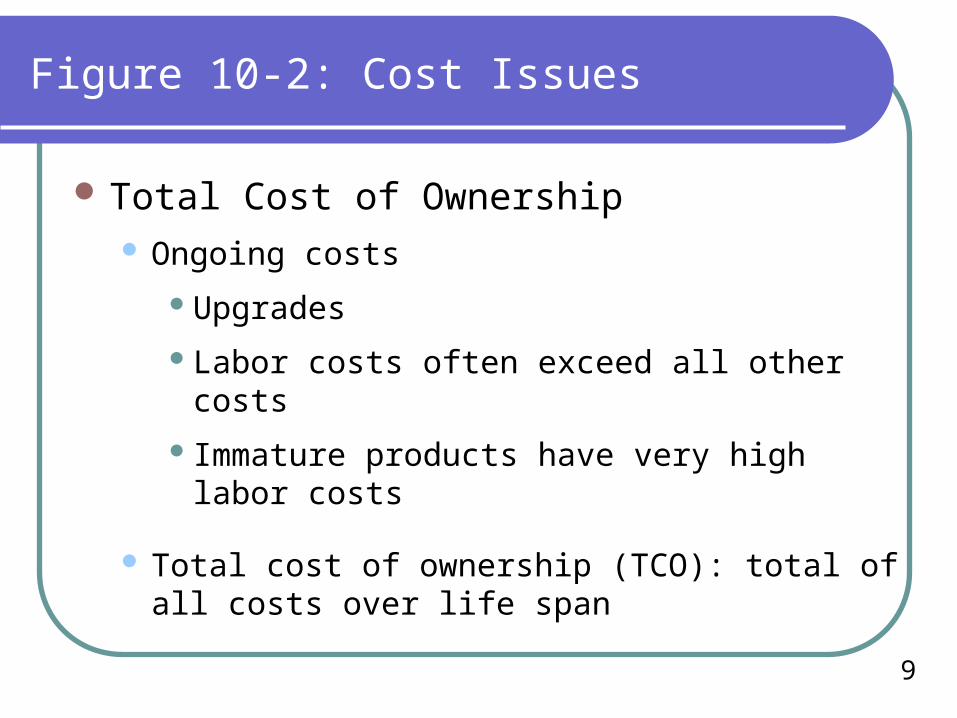
Figure 10-2: Cost Issues
Total Cost of Ownership Ongoing costs
Upgrades
Labor costs often exceed all other costs
Immature products have very high labor costs
Total cost of ownership (TCO): total of all costs over life span
10
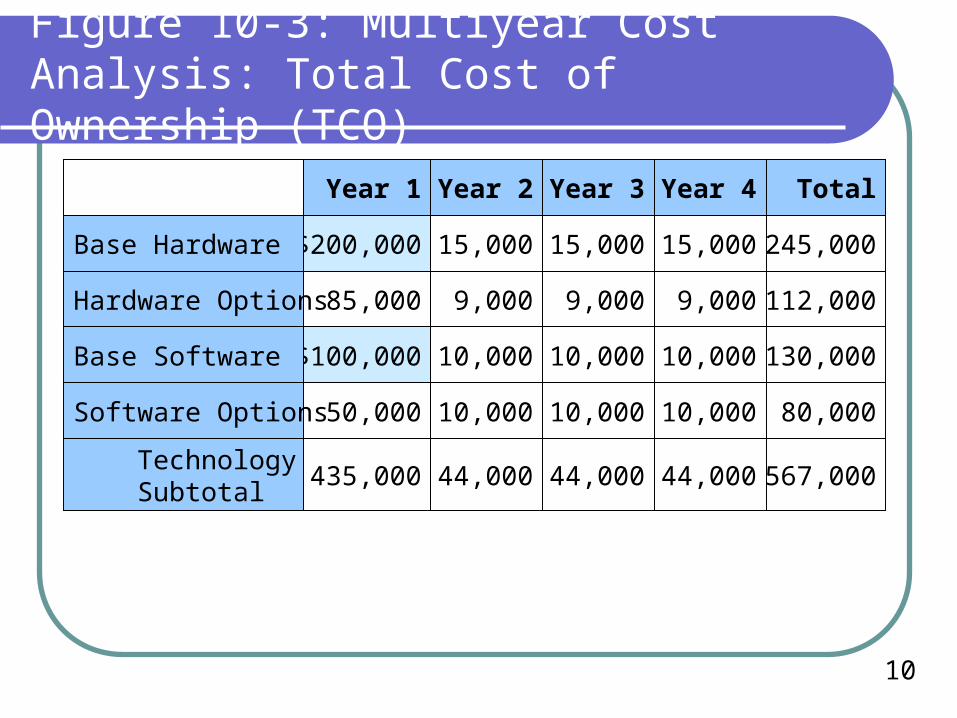
Figure 10-3: Multiyear Cost Analysis: Total Cost of Ownership (TCO)
Year 1 Year 2 Year 3 Year 4
$200,000 15,000 15,000 15,000Base Hardware
85,000 9,000 9,000 9,000Hardware Options
Total
245,000
112,000
$100,000 10,000 10,000 10,000Base Software 130,000
50,000 10,000 10,000 10,000Software Options 80,000
435,000 44,000 44,000 44,000 Technology Subtotal
567,000
11
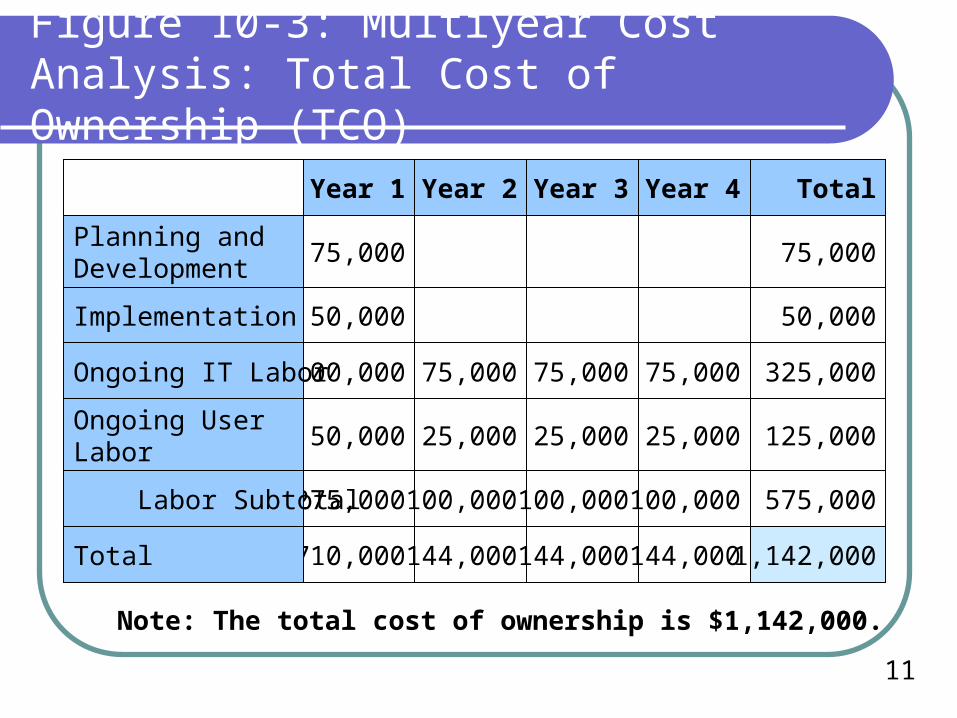
Figure 10-3: Multiyear Cost Analysis: Total Cost of Ownership (TCO)
Year 1 Year 2 Year 3 Year 4
50,000Implementation
100,000 75,000 75,000 75,000Ongoing IT Labor
Total
50,000
325,000
50,000 25,000 25,000 25,000Ongoing UserLabor
125,000
275,000 100,000 100,000 100,000 Labor Subtotal 575,000
710,000 144,000 144,000 144,000Total 1,142,000
Note: The total cost of ownership is $1,142,000.
75,000Planning andDevelopment
75,000
Network Simulation
13
Figure 10-4: Network Simulation
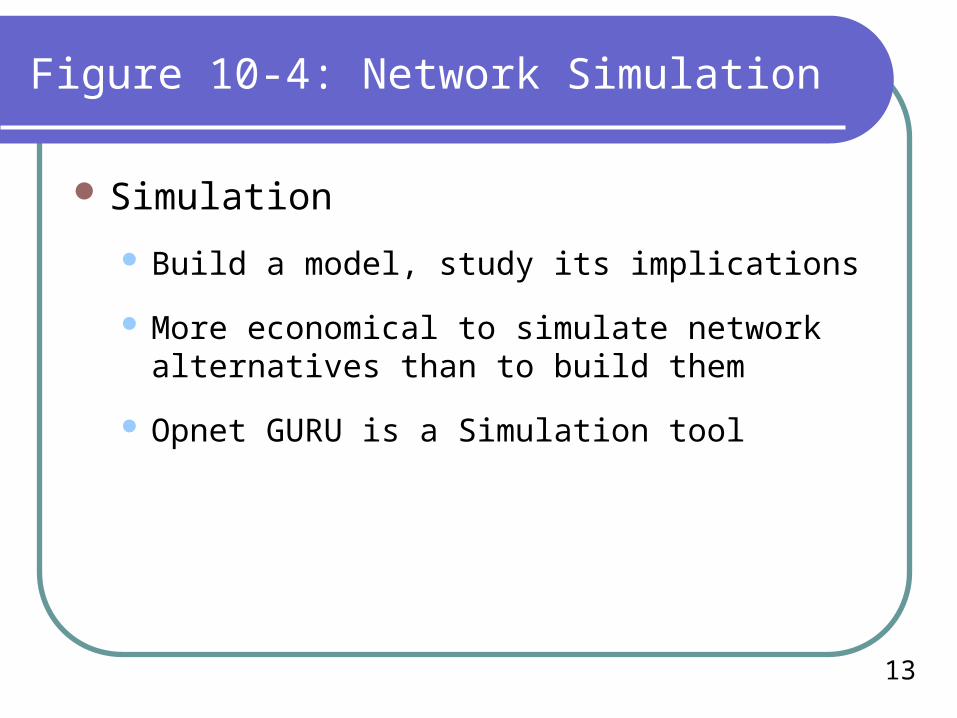
Simulation
Build a model, study its implications
More economical to simulate network alternatives than to build them
Opnet GURU is a Simulation tool
14
Figure 10-4: Network Simulation
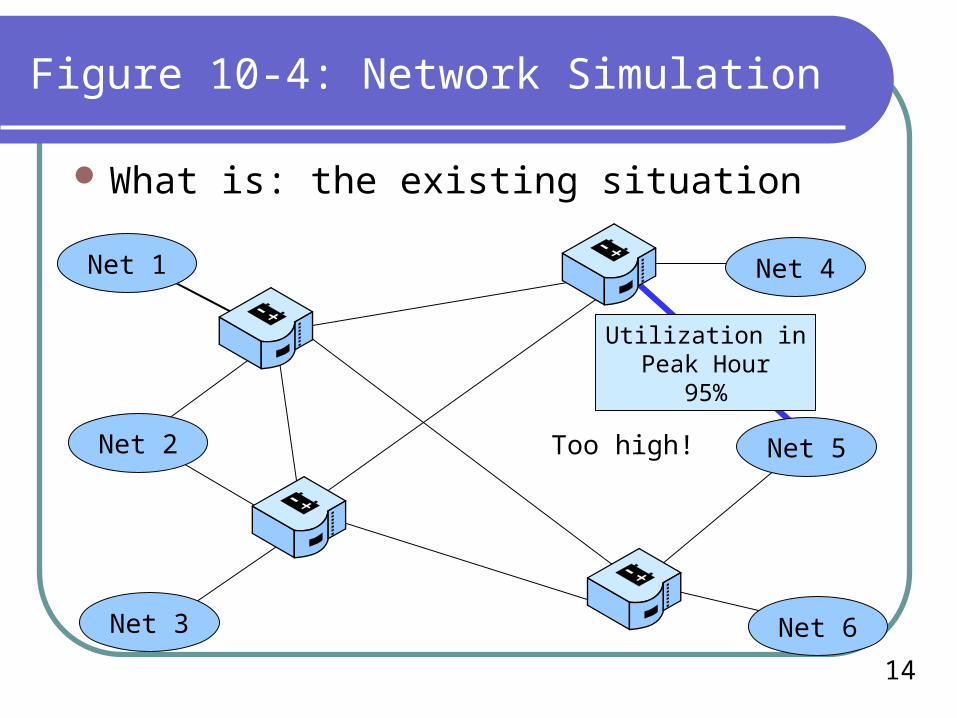
What is: the existing situation
Net 1
Net 2
Net 3
Net 4
Net 5
Net 6
Utilization inPeak Hour
95%
Too high!
15
Figure 10-4: Network Simulation
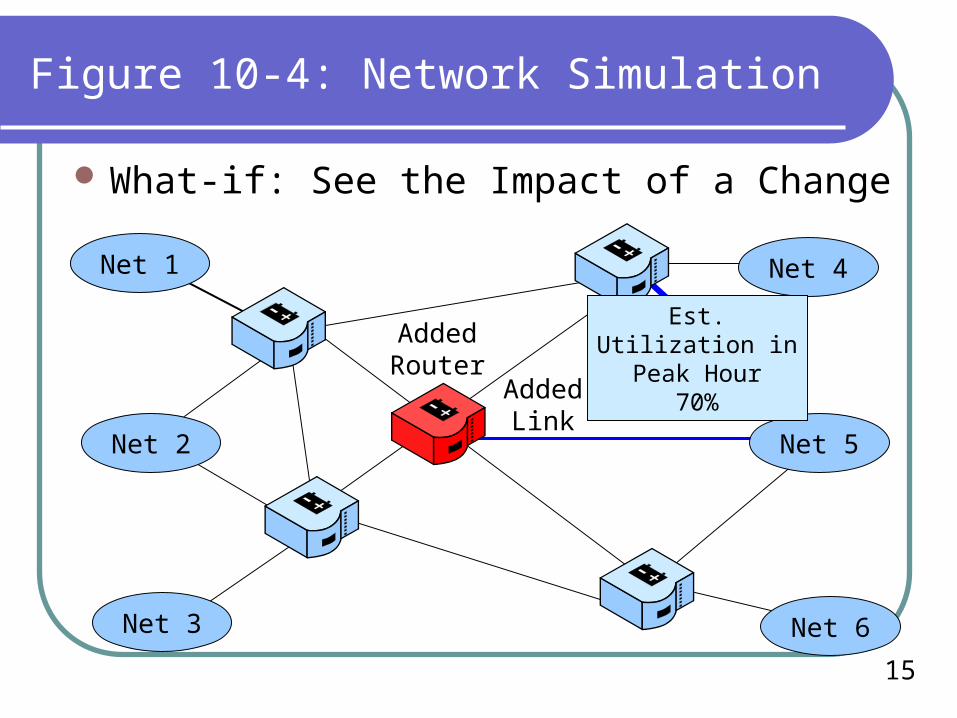
What-if: See the Impact of a Change
Net 1
Net 2
Net 3
Net 4
Net 5
Net 6
Est.Utilization inPeak Hour
70%
AddedRouter
AddedLink
16
Figure 10-4: Network Simulation
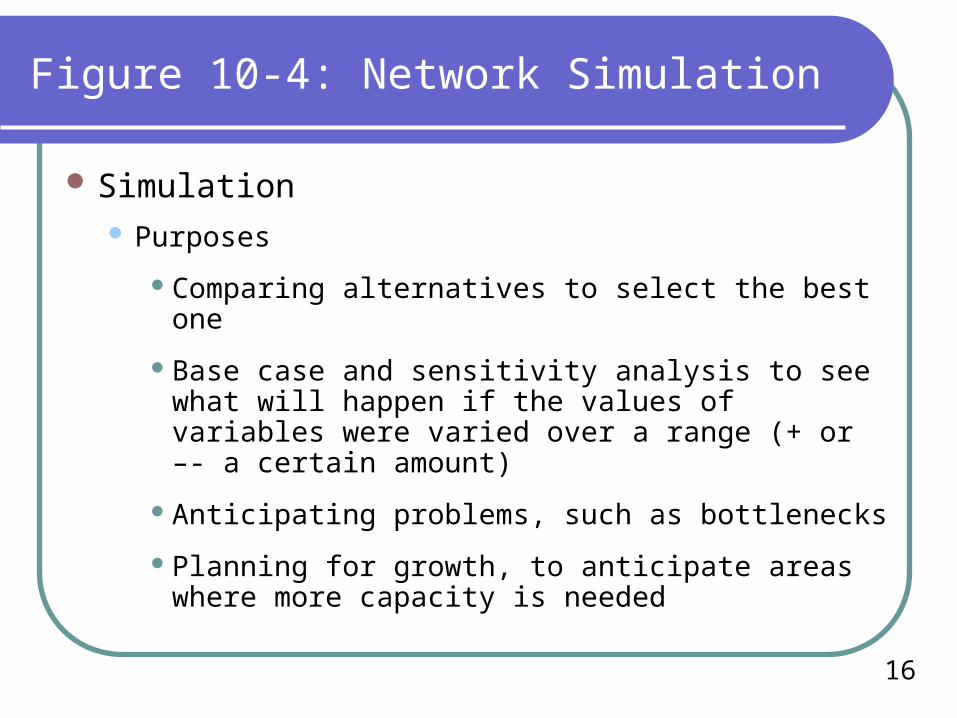
Simulation Purposes
Comparing alternatives to select the best one
Base case and sensitivity analysis to see what will happen if the values of variables were varied over a range (+ or –- a certain amount)
Anticipating problems, such as bottlenecks
Planning for growth, to anticipate areas where more capacity is needed
17
Figure 10-4: Network Simulation
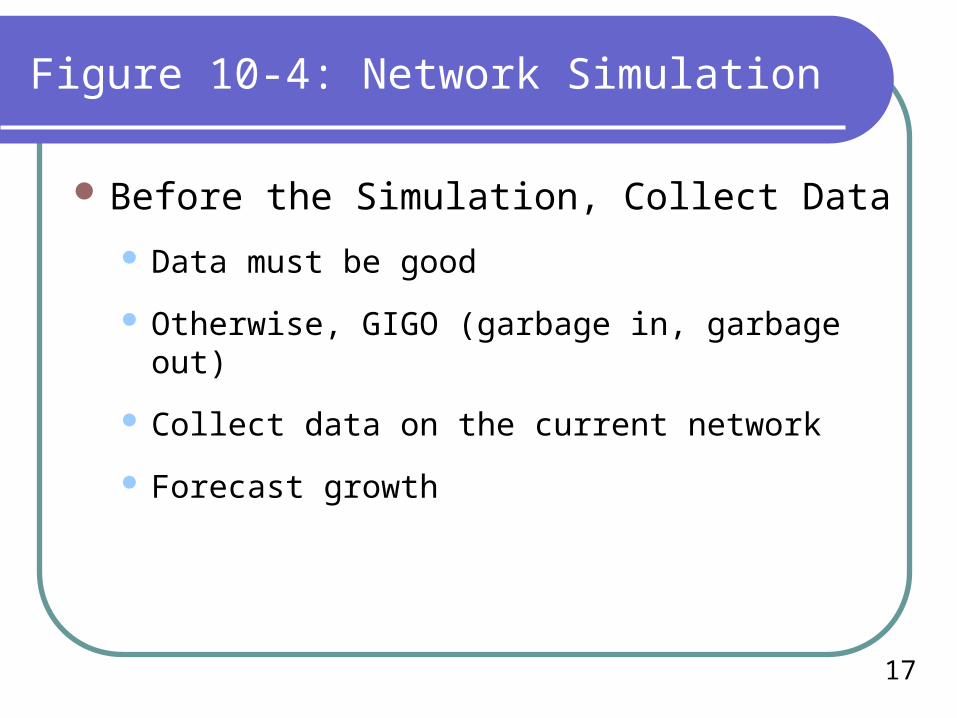
Before the Simulation, Collect Data
Data must be good
Otherwise, GIGO (garbage in, garbage out)
Collect data on the current network
Forecast growth
18
Figure 10-4: Network Simulation
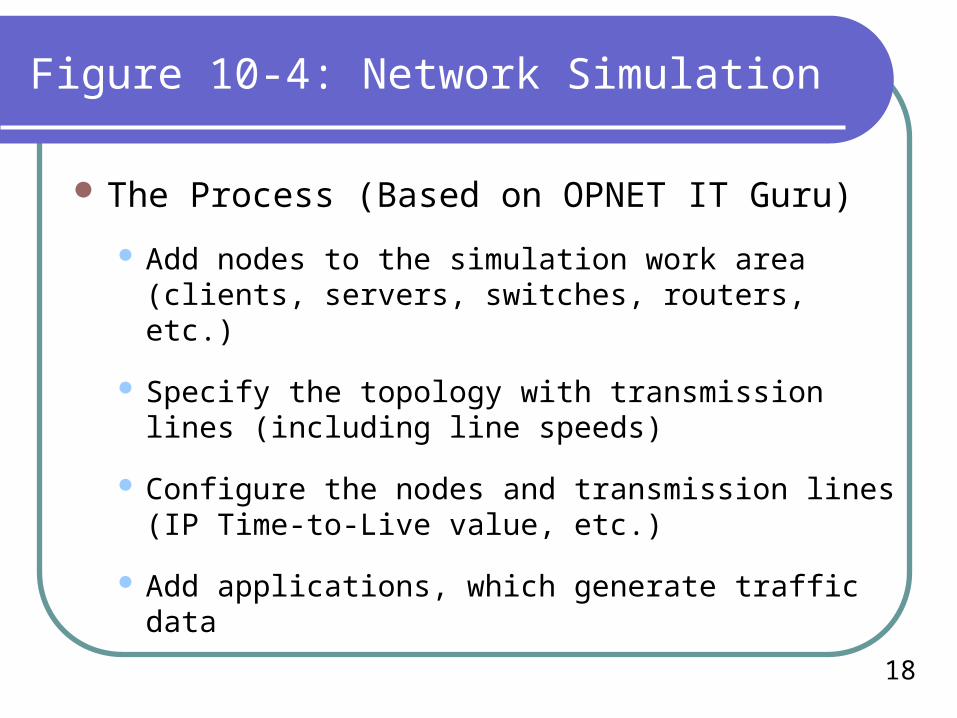
The Process (Based on OPNET IT Guru)
Add nodes to the simulation work area (clients, servers, switches, routers, etc.)
Specify the topology with transmission lines (including line speeds)
Configure the nodes and transmission lines (IP Time-to-Live value, etc.)
Add applications, which generate traffic data
19
Figure 10-4: Network Simulation
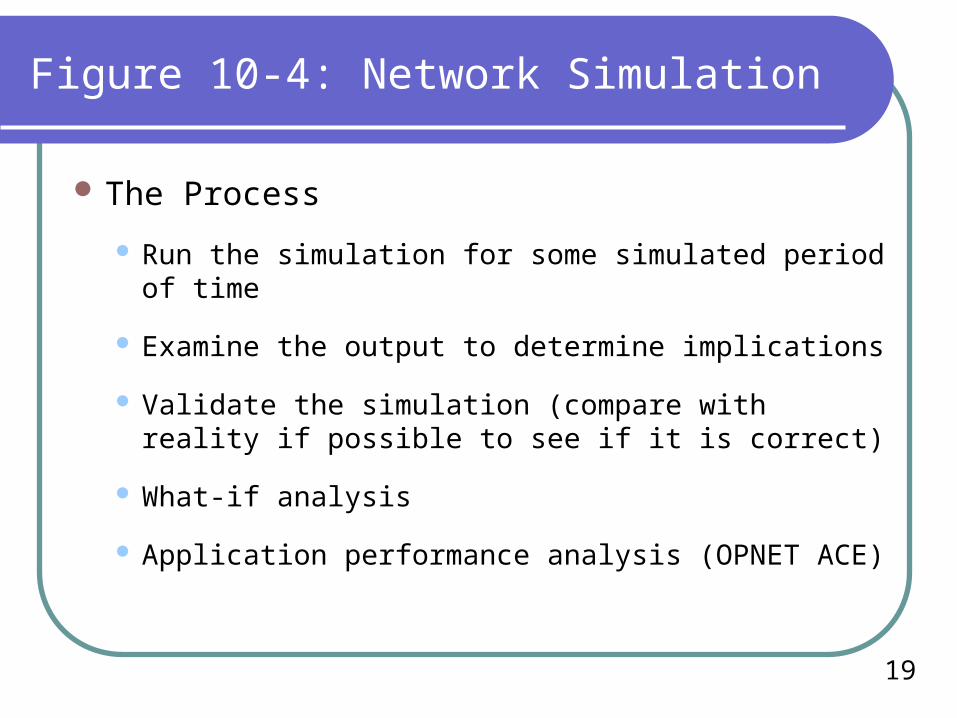
The Process
Run the simulation for some simulated period of time
Examine the output to determine implications
Validate the simulation (compare with reality if possible to see if it is correct)
What-if analysis
Application performance analysis (OPNET ACE)
20
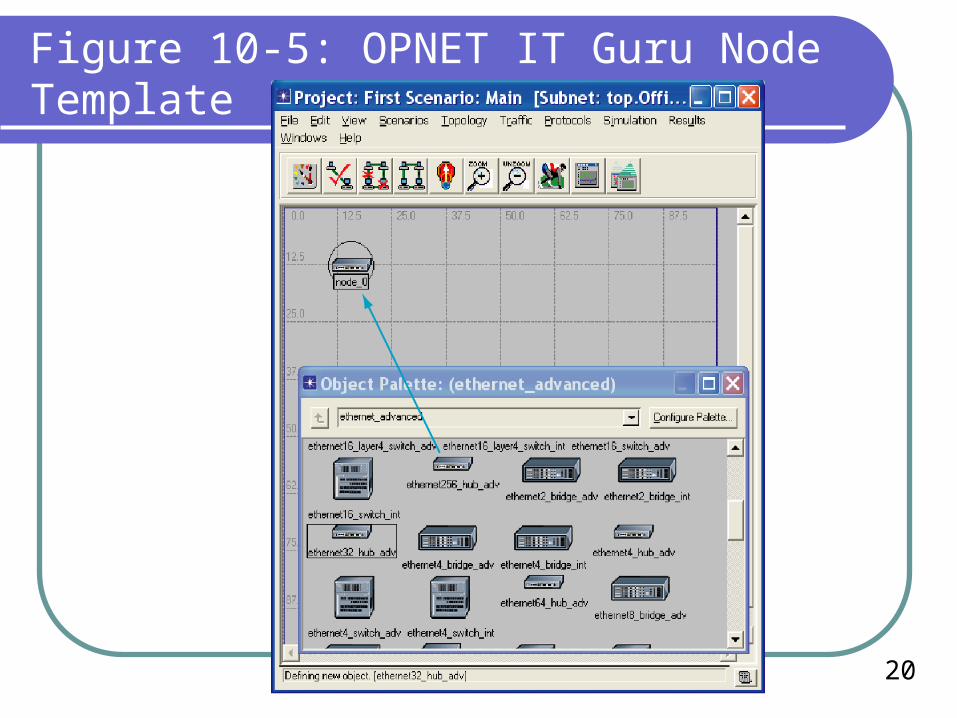
Figure 10-5: OPNET IT Guru Node Template
21
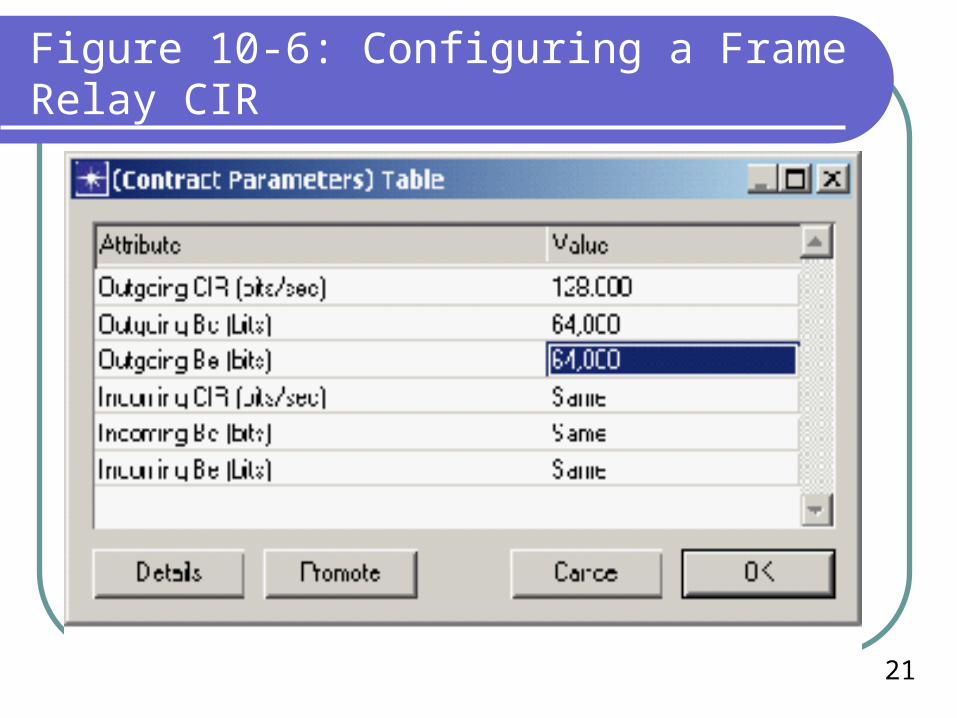
Figure 10-6: Configuring a Frame Relay CIR
22
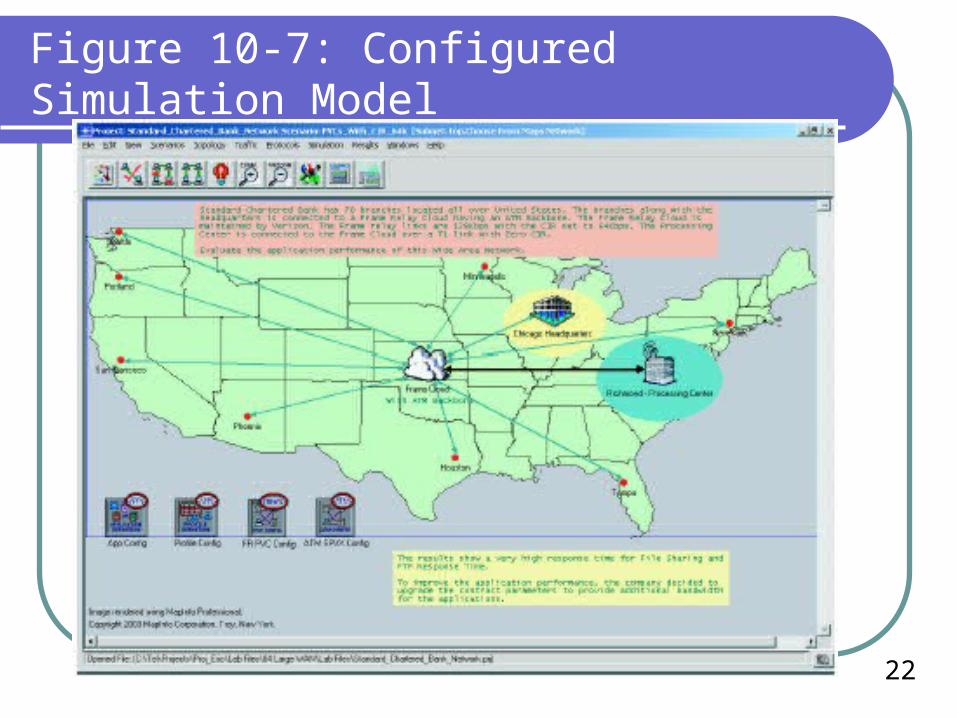
Figure 10-7: Configured Simulation Model
23
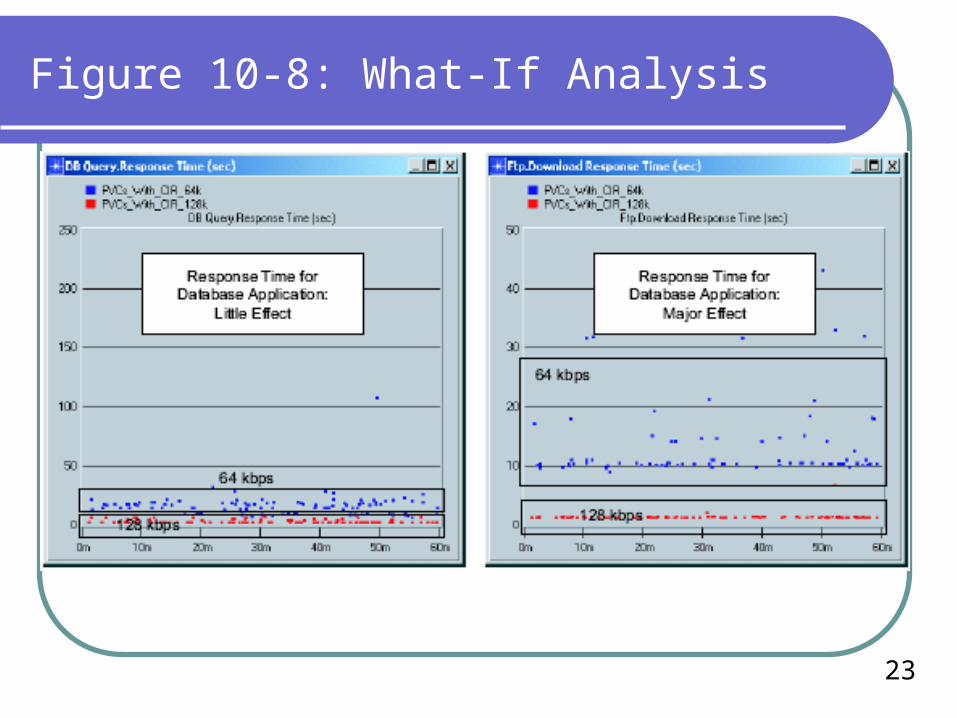
Figure 10-8: What-If Analysis
IP Subnetting
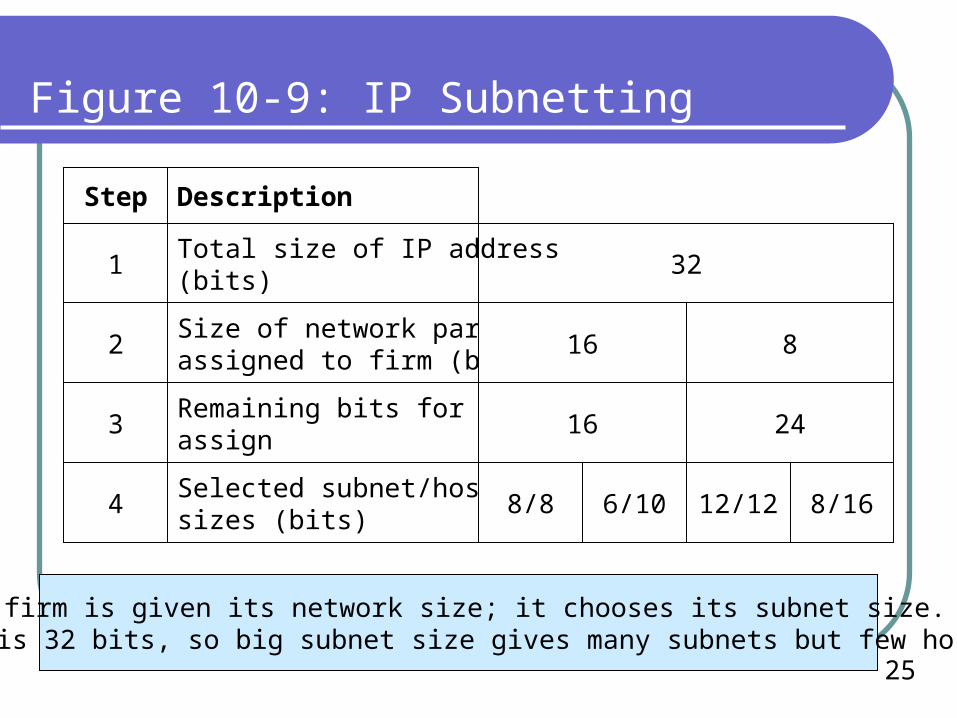
25
Figure 10-9: IP Subnetting
DescriptionStep
32Total size of IP address(bits)
1
Size of network partassigned to firm (bits)
2 16 8
Remaining bits for firm toassign
3 16 24
Selected subnet/host partsizes (bits)
4 8/8 6/10 12/12 8/16
A firm is given its network size; it chooses its subnet size.Total is 32 bits, so big subnet size gives many subnets but few hosts.
26
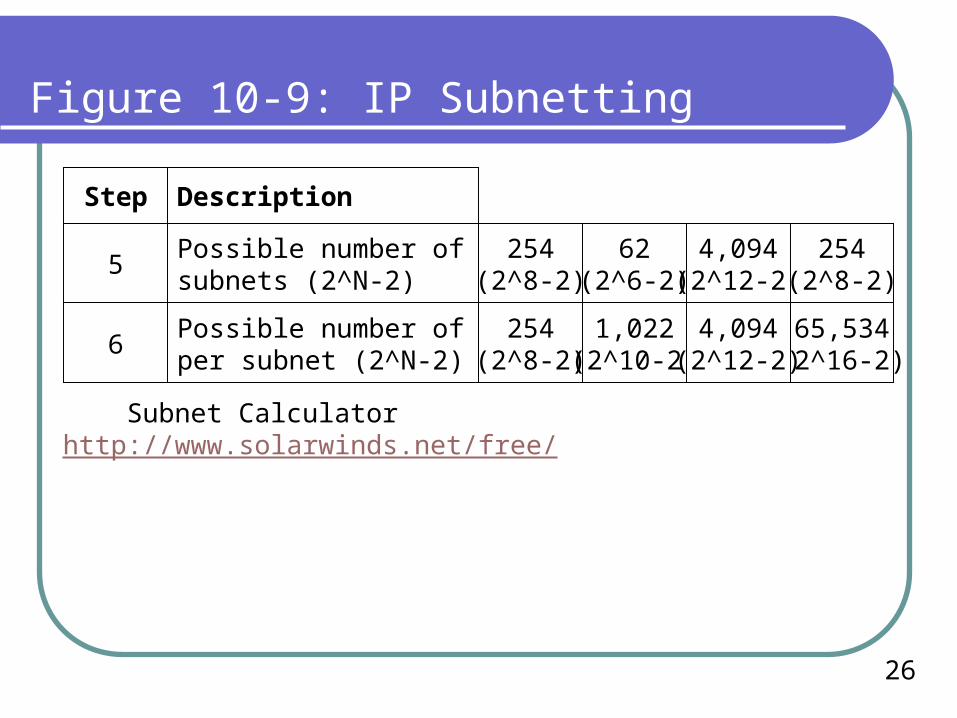
Figure 10-9: IP Subnetting
DescriptionStep
Possible number ofsubnets (2^N-2)
5254
(2^8-2)62
(2^6-2)4,094
(2^12-2)254
(2^8-2)
Possible number of hostsper subnet (2^N-2)
6254
(2^8-2)1,022
(2^10-2)65,534
(2^16-2)4,094
(2^12-2)
Subnet Calculatorhttp://www.solarwinds.net/free/
27
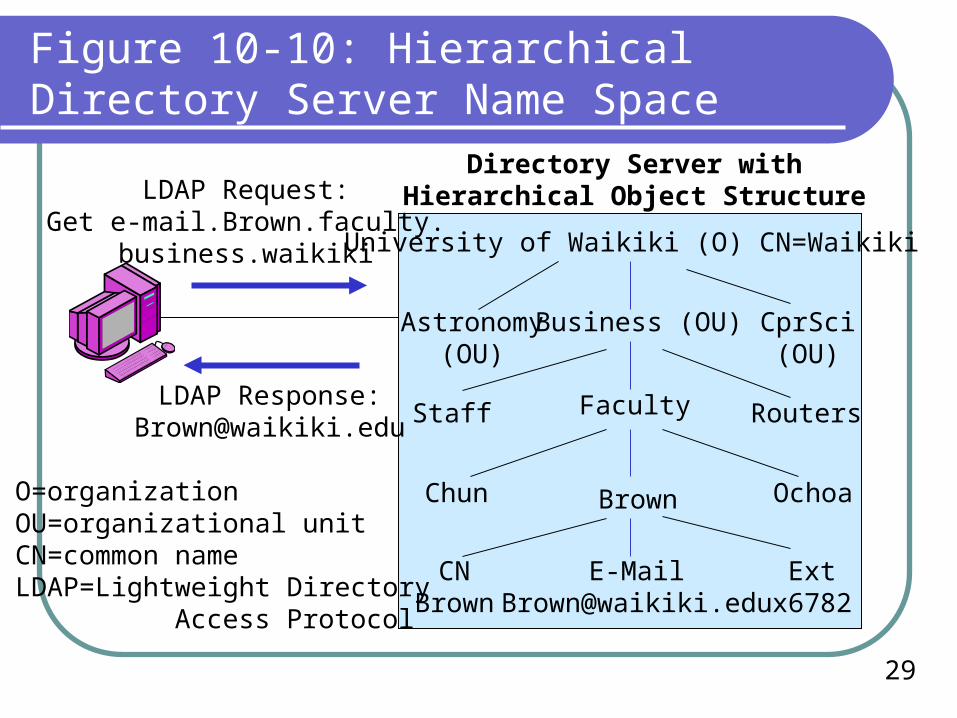
Directory Servers
Store corporate information
Hierarchical organization of content
LDAP standard to access directory servers
29
Figure 10-10: Hierarchical Directory Server Name Space
University of Waikiki (O) CN=Waikiki
Astronomy(OU)
Staff
Chun
CNBrown
Extx6782
Directory Server withHierarchical Object Structure
Ochoa
Routers
CprSci(OU)
Brown
Faculty
Business (OU)
LDAP Request:Get e-mail.Brown.faculty.
business.waikiki
LDAP Response:[email protected]
O=organizationOU=organizational unitCN=common nameLDAP=Lightweight Directory Access Protocol
Needed to set up new routers
Needed to change operation of old routers
Time consuming and an important skill
Configuring Routers
31
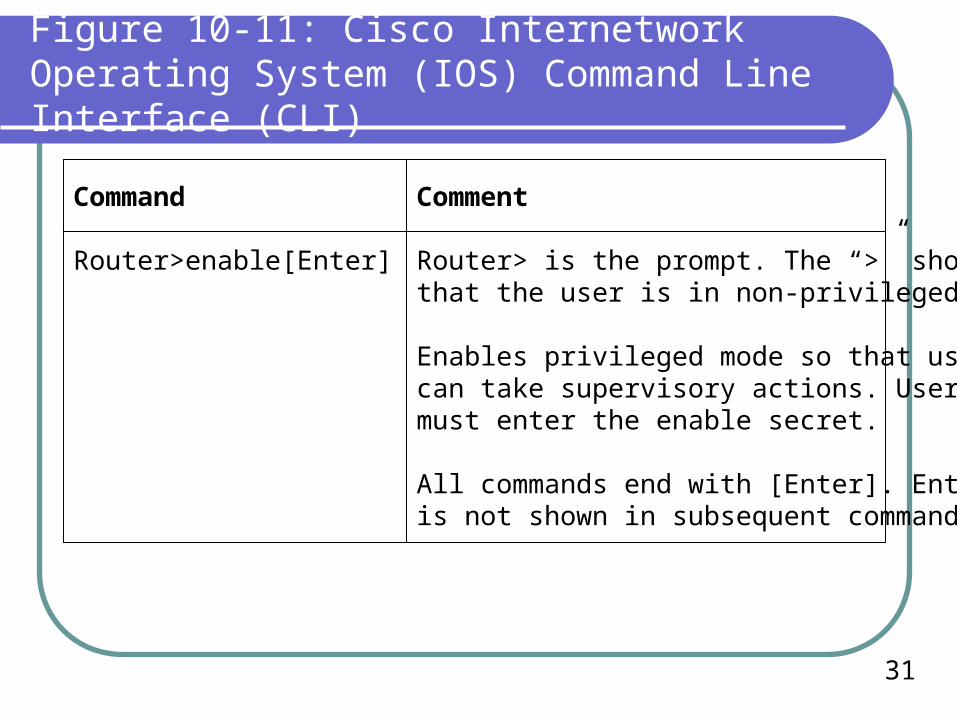
Figure 10-11: Cisco Internetwork Operating System (IOS) Command Line Interface (CLI)
Command Comment
Router>enable[Enter] Router> is the prompt. The “>” showsthat the user is in non-privileged mode.
Enables privileged mode so that usercan take supervisory actions. Usermust enter the enable secret.
All commands end with [Enter]. Enteris not shown in subsequent commands.
32
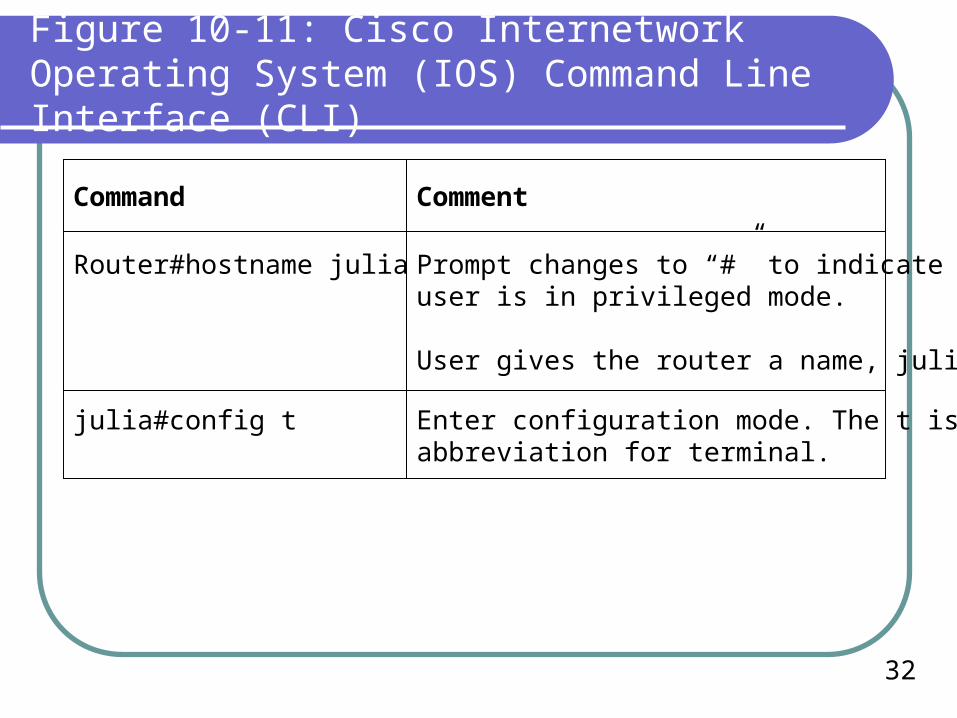
Figure 10-11: Cisco Internetwork Operating System (IOS) Command Line Interface (CLI)
Command Comment
Router#hostname julia
Prompt changes to “#” to indicate thatuser is in privileged mode.
User gives the router a name, julia.
julia#config t
Enter configuration mode. The t is anabbreviation for terminal.
33
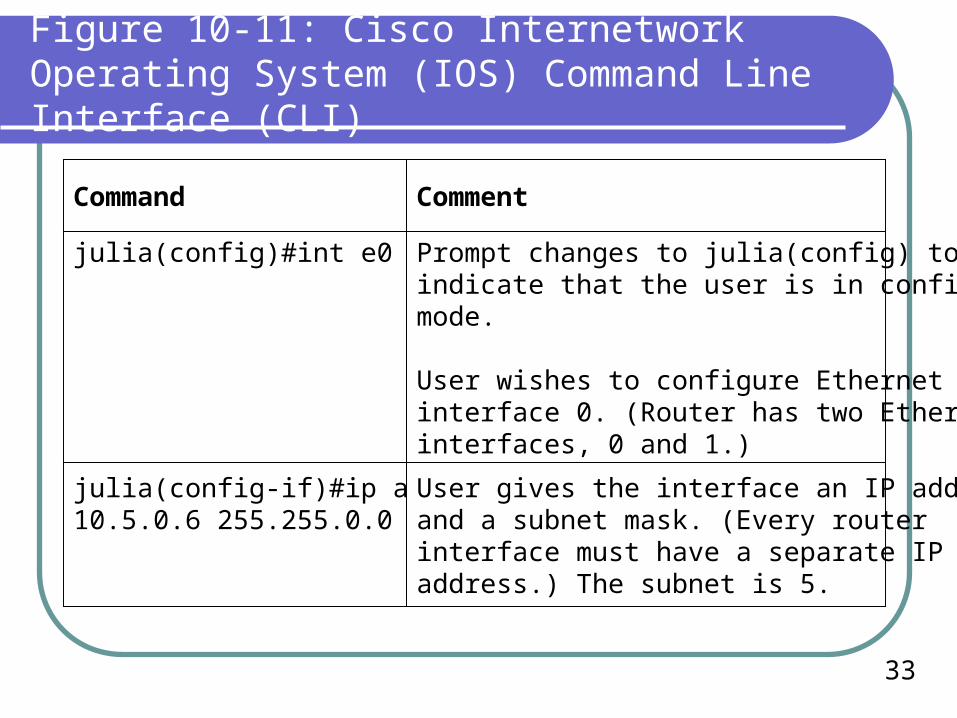
Figure 10-11: Cisco Internetwork Operating System (IOS) Command Line Interface (CLI)
Command Comment
julia(config)#int e0
Prompt changes to julia(config) toindicate that the user is in configurationmode.
User wishes to configure Ethernetinterface 0. (Router has two Ethernetinterfaces, 0 and 1.)
julia(config-if)#ip address10.5.0.6 255.255.0.0
User gives the interface an IP addressand a subnet mask. (Every routerinterface must have a separate IPaddress.) The subnet is 5.
34
Figure 10-11: Cisco Internetwork Operating System (IOS) Command Line Interface (CLI)
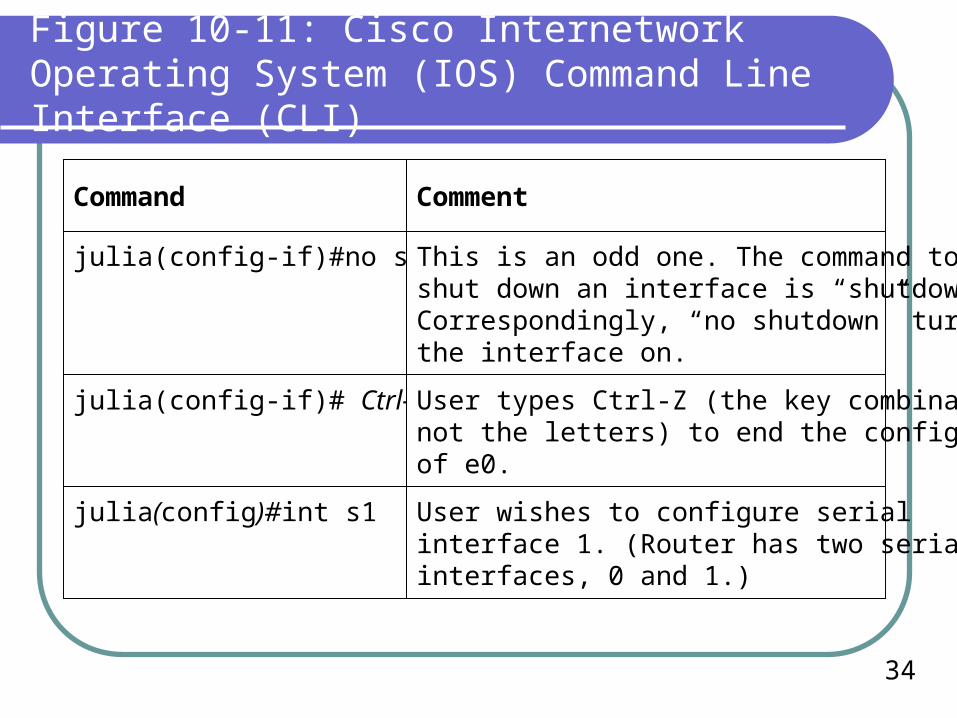
Command Comment
julia(config-if)#no shutdown
This is an odd one. The command toshut down an interface is “shutdown”.Correspondingly, “no shutdown” turnsthe interface on.
julia(config-if)# Ctrl-Z
User types Ctrl-Z (the key combination,not the letters) to end the configurationof e0.
julia(config)#int s1
User wishes to configure serialinterface 1. (Router has two serialinterfaces, 0 and 1.)
35
Figure 10-11: Cisco Internetwork Operating System (IOS) Command Line Interface (CLI)
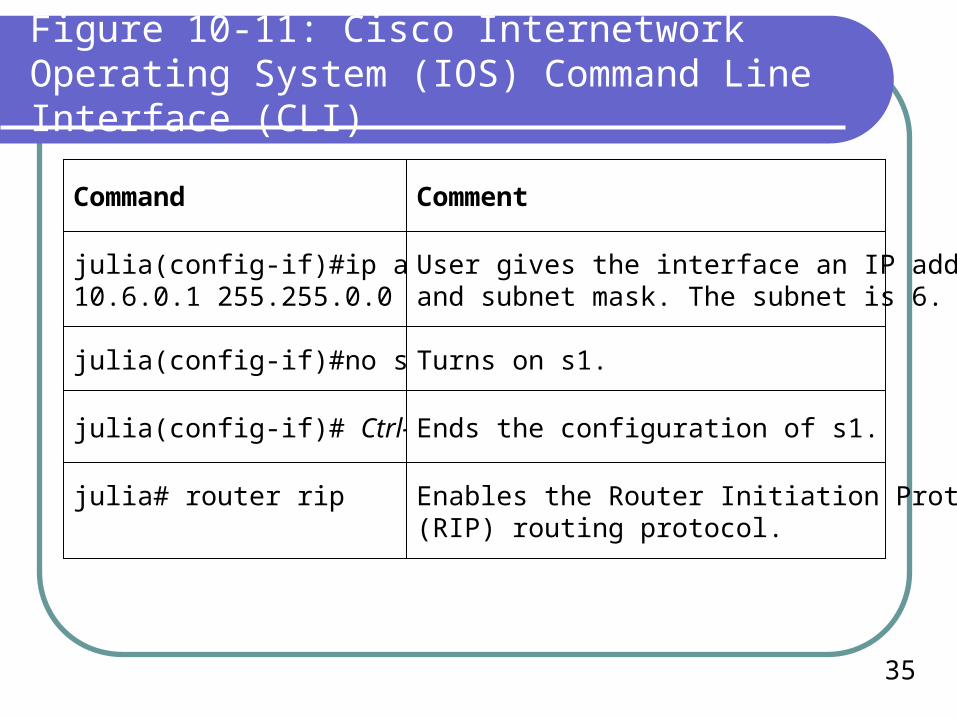
Command Comment
julia(config-if)#ip address10.6.0.1 255.255.0.0
User gives the interface an IP addressand subnet mask. The subnet is 6.
julia(config-if)#no shutdown Turns on s1.
julia(config-if)# Ctrl-Z Ends the configuration of s1.
julia# router rip
Enables the Router Initiation Protocol(RIP) routing protocol.
36
Figure 10-11: Cisco Internetwork Operating System (IOS) Command Line Interface (CLI)
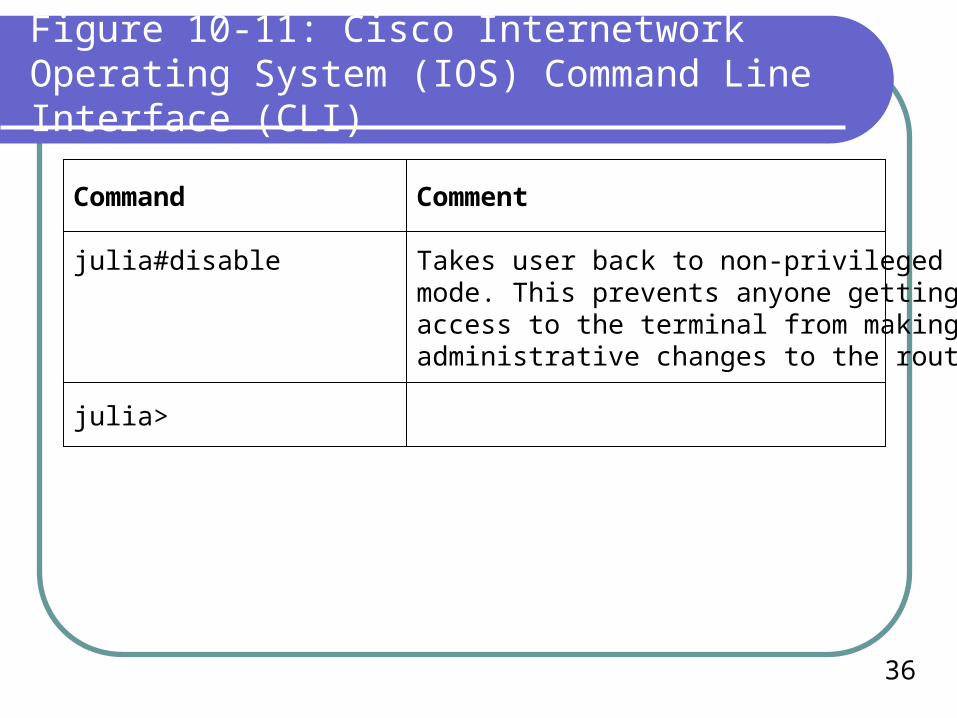
Command Comment
julia#disable
Takes user back to non-privilegedmode. This prevents anyone gettingaccess to the terminal from makingadministrative changes to the router.
julia>
Network Management Utilities
38
Figure 10-12: Network Management Utilities
Network management utilities are programs to help network managers administer the network
Security
Management tools can be used to make attacks
Policies should limit these tools to certain employees and for certain purposes
Firewalls block many network management tools to avoid attacks
39
Figure 10-12: Network Management Utilities
Host Diagnostic Tools
Network Setup Wizard works most of the time; need tools if it does not
Testing the connectionOpen a connection to a website using a browserPing a host to see if latency is acceptable
40
Figure 10-12: Network Management Utilities
Host Diagnostic Tools Loopback testing and ipconfig/winipconfig
Go to the command line
Ping 127.0.0.1. This is the loopback interface (you ping yourself)
For detailed information: ipconfig /all or winipconfig (older versions of Windows)
41
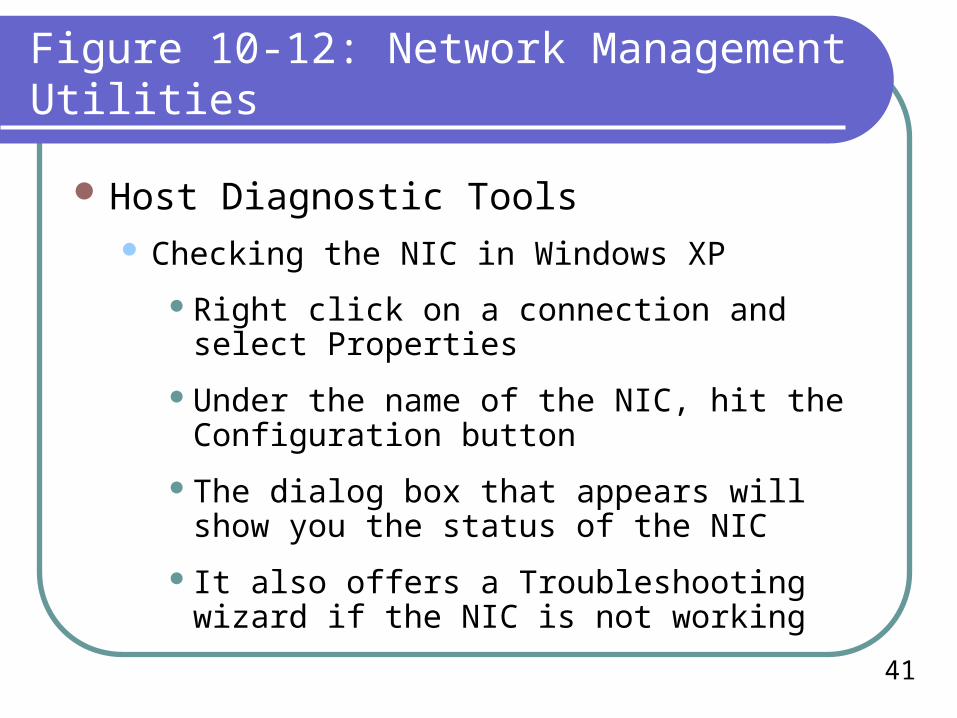
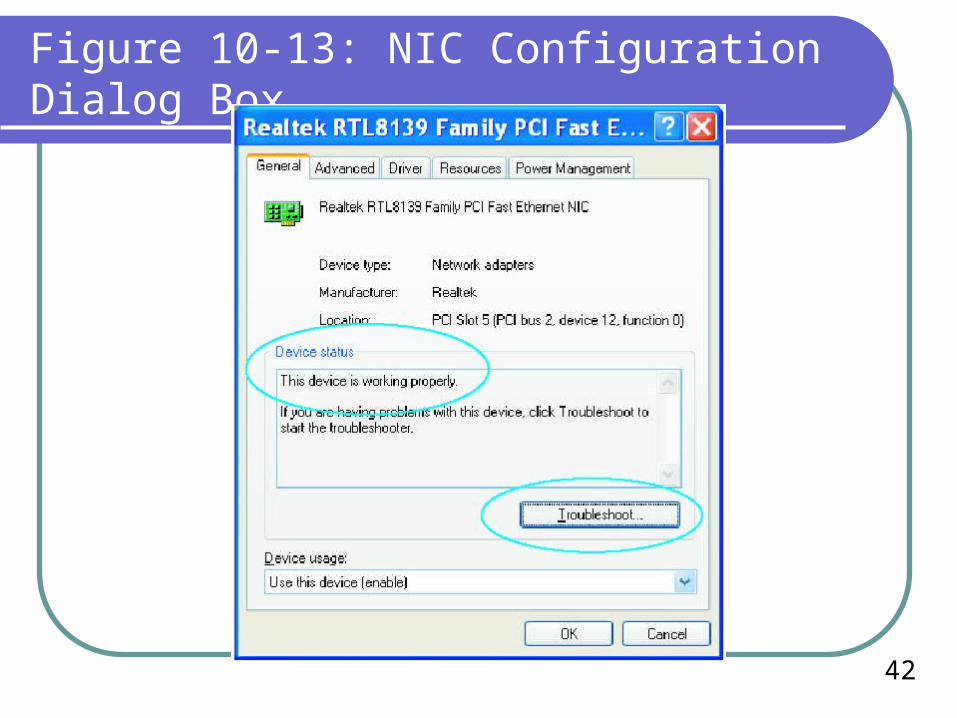
Figure 10-12: Network Management Utilities
Host Diagnostic Tools Checking the NIC in Windows XP
Right click on a connection and select Properties
Under the name of the NIC, hit the Configuration button
The dialog box that appears will show you the status of the NIC
It also offers a Troubleshooting wizard if the NIC is not working
42
Figure 10-13: NIC Configuration Dialog Box
43
Figure 10-12: Network Management Utilities
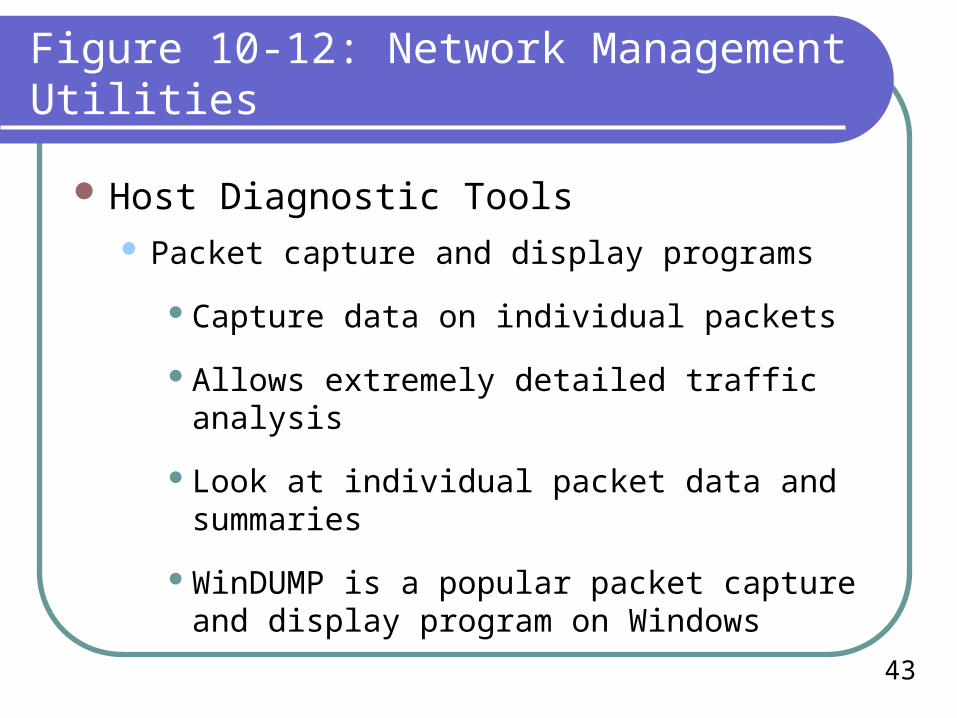
Host Diagnostic Tools Packet capture and display programs
Capture data on individual packets
Allows extremely detailed traffic analysis
Look at individual packet data and summaries
WinDUMP is a popular packet capture and display program on Windows
44
Figure 10-12: Network Management Utilities
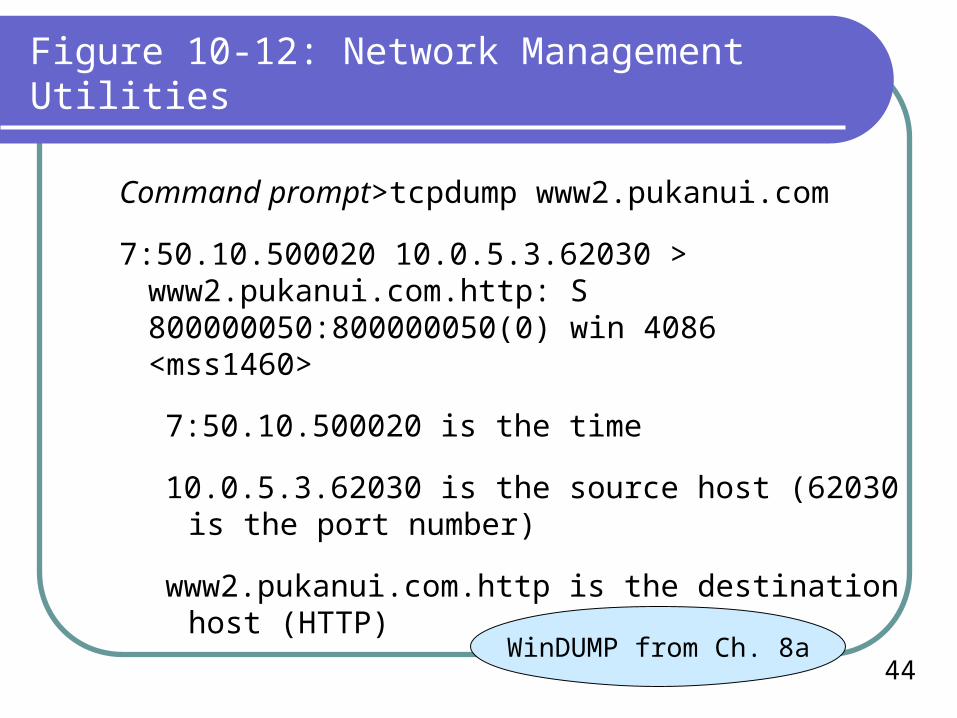
Command prompt>tcpdump www2.pukanui.com
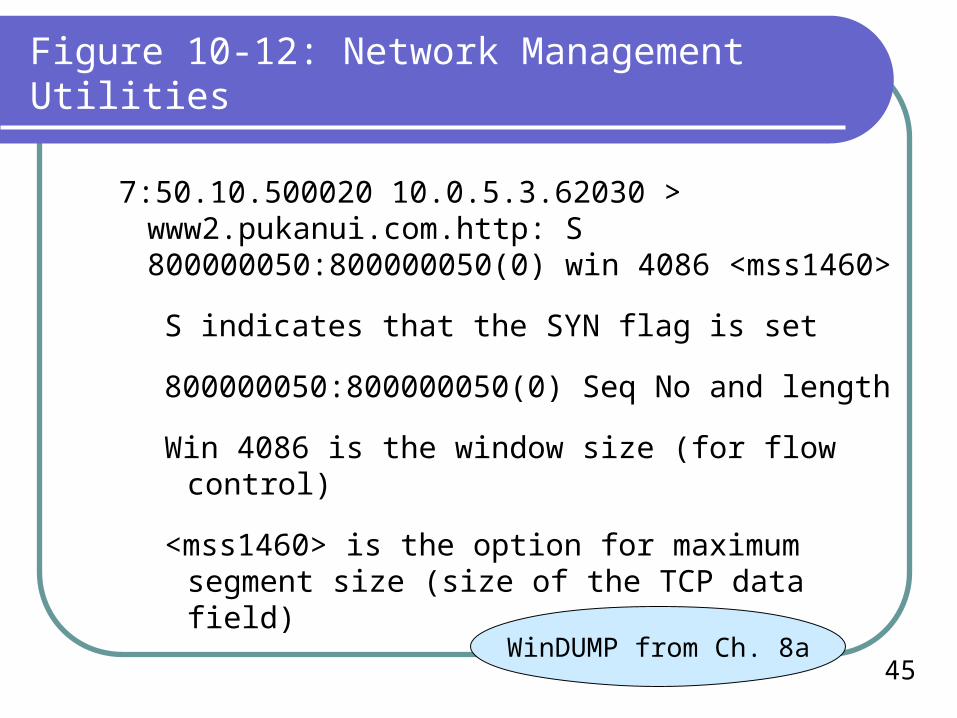
7:50.10.500020 10.0.5.3.62030 >www2.pukanui.com.http: S 800000050:800000050(0) win 4086 <mss1460>
7:50.10.500020 is the time
10.0.5.3.62030 is the source host (62030 is the port number)
www2.pukanui.com.http is the destination host (HTTP)
WinDUMP from Ch. 8a
45
Figure 10-12: Network Management Utilities
7:50.10.500020 10.0.5.3.62030 > www2.pukanui.com.http: S 800000050:800000050(0) win 4086 <mss1460>
S indicates that the SYN flag is set
800000050:800000050(0) Seq No and length
Win 4086 is the window size (for flow control)
<mss1460> is the option for maximum segment size (size of the TCP data field)
WinDUMP from Ch. 8a
46
Figure 10-12: Network Management Utilities
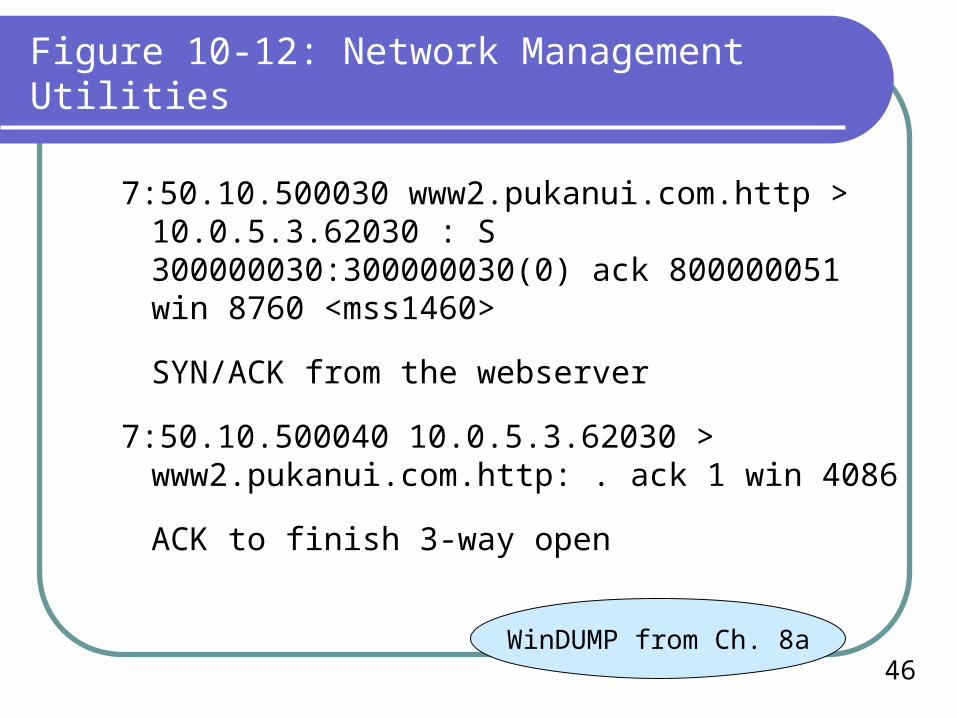
7:50.10.500030 www2.pukanui.com.http > 10.0.5.3.62030 : S 300000030:300000030(0) ack 800000051 win 8760 <mss1460>
SYN/ACK from the webserver
7:50.10.500040 10.0.5.3.62030 > www2.pukanui.com.http: . ack 1 win 4086
ACK to finish 3-way open
WinDUMP from Ch. 8a
47
Figure 10-12: Network Management Utilities
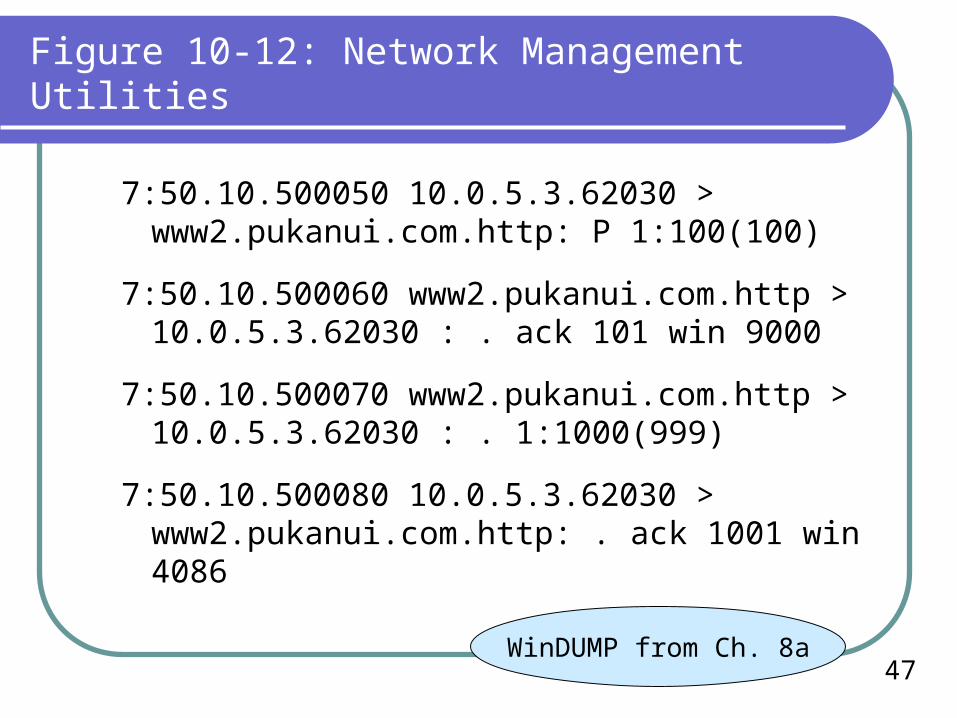
7:50.10.500050 10.0.5.3.62030 > www2.pukanui.com.http: P 1:100(100)
7:50.10.500060 www2.pukanui.com.http > 10.0.5.3.62030 : . ack 101 win 9000
7:50.10.500070 www2.pukanui.com.http > 10.0.5.3.62030 : . 1:1000(999)
7:50.10.500080 10.0.5.3.62030 > www2.pukanui.com.http: . ack 1001 win 4086
WinDUMP from Ch. 8a
48
Figure 10-12: Network Management Utilities
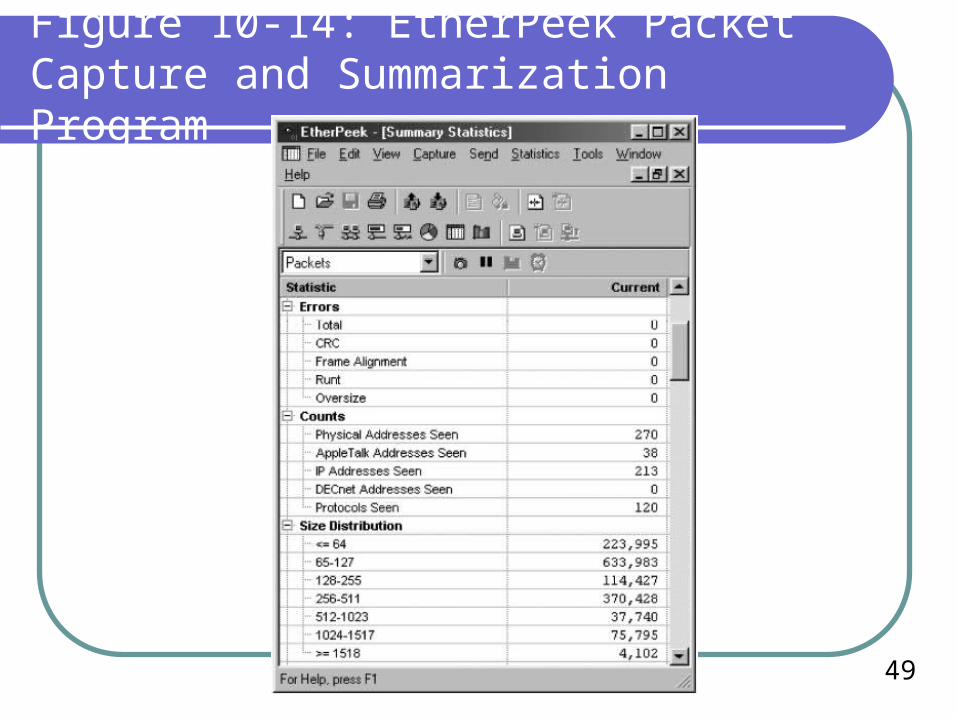
Host Diagnostic Tools Traffic summarization
Shows statistical data on traffic going into and out of the host
EtherPeek is a popular commercial traffic summarization program
49
Figure 10-14: EtherPeek Packet Capture and Summarization Program
50
Figure 10-12: Network Management Utilities
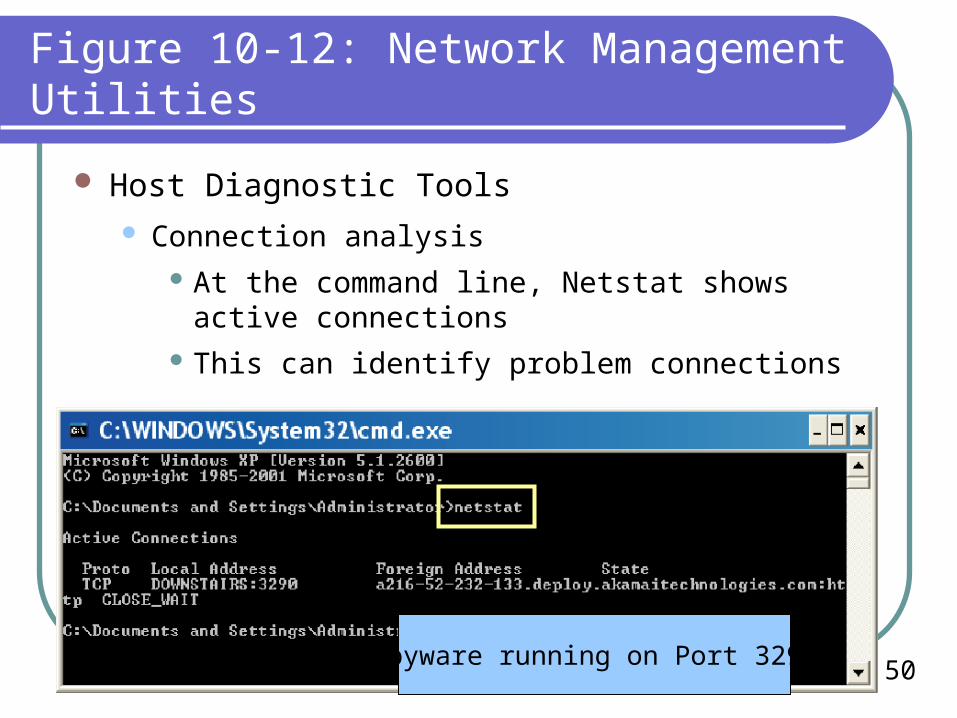
Host Diagnostic Tools Connection analysis
At the command line, Netstat shows active connections
This can identify problem connections
Spyware running on Port 3290
51
Figure 10-12: Network Management Utilities
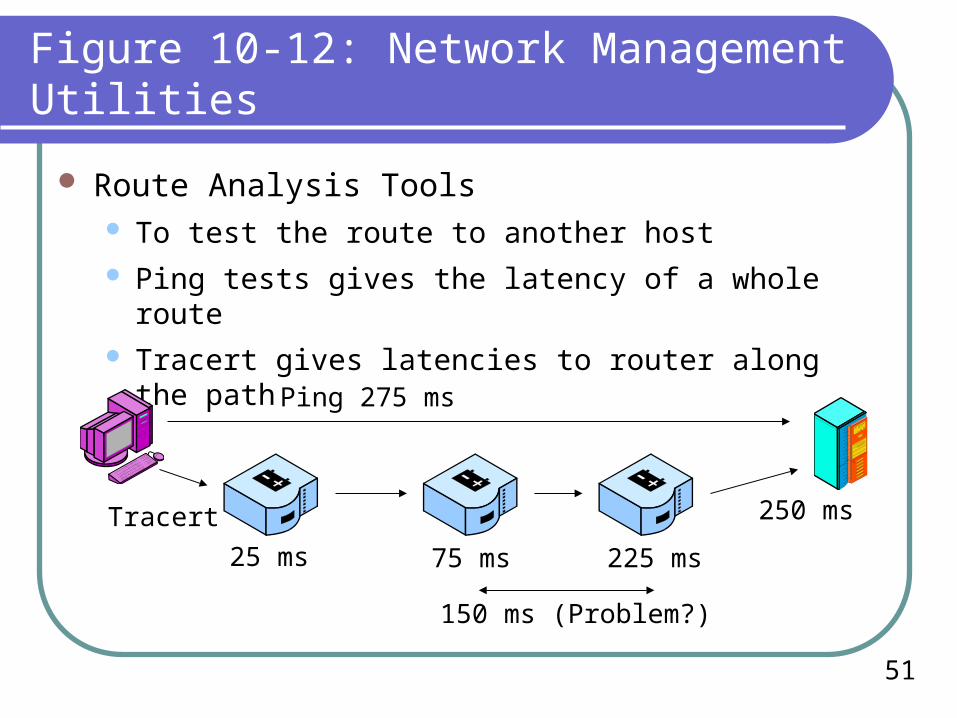
Route Analysis Tools To test the route to another host Ping tests gives the latency of a whole route Tracert gives latencies to router along the path
Ping 275 ms
Tracert
25 ms 75 ms
250 ms
225 ms
150 ms (Problem?)
52
Figure 10-12: Network Management Utilities
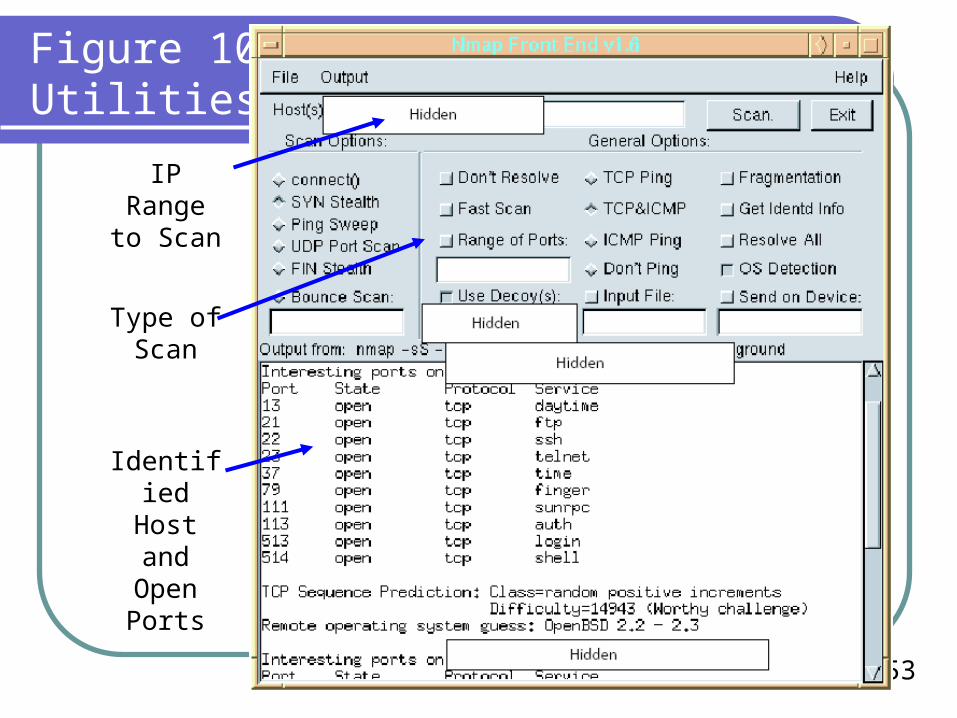
Network Mapping Tools To understand how the network is organized
Discovering IP addresses with active devices
Fingerprinting them to determine their operating system (client, server, or router)
A popular network mapping program is Nmap (Figure 10-4)
53
Figure 10-12: Network Management Utilities
IP Range to Scan
Type of Scan
Identified Host and
Open Ports
54
Figure 10-16: Simple Network Management Protocol (SNMP)
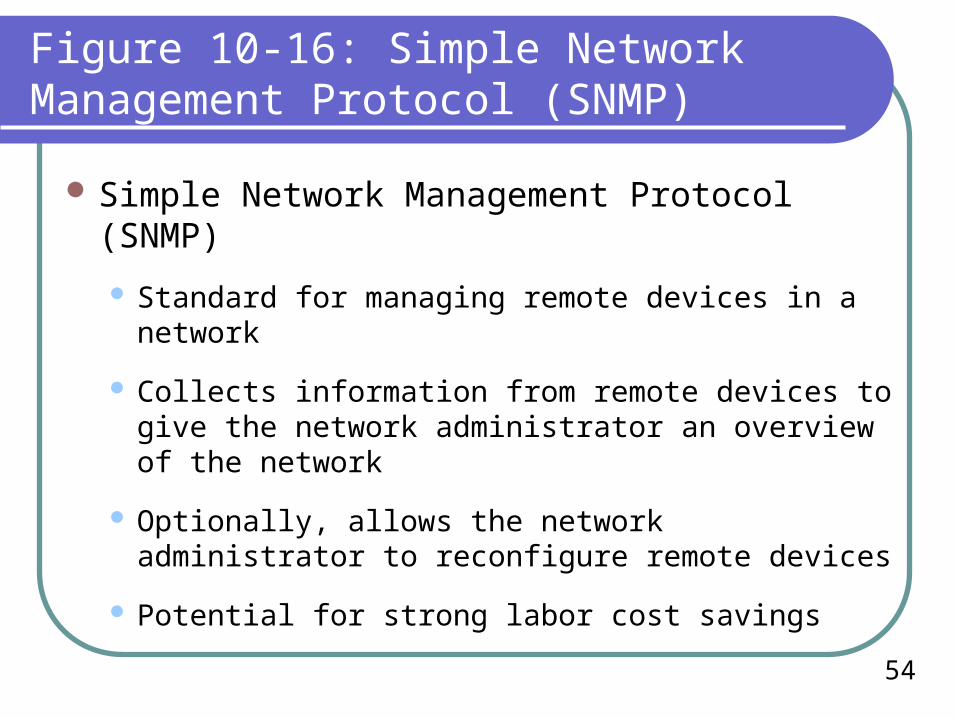
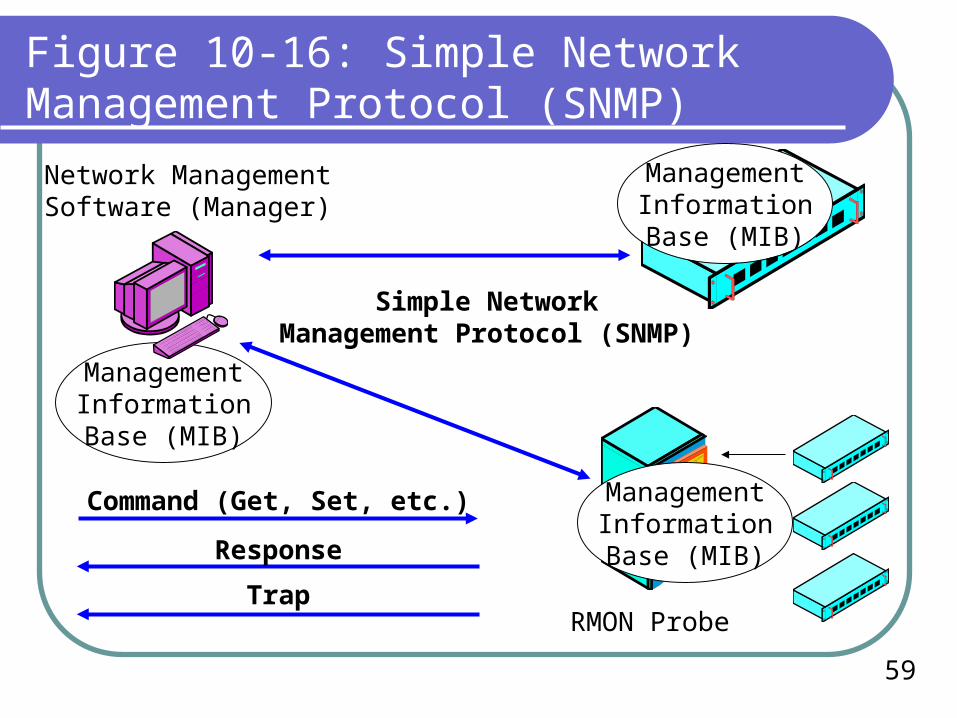
Simple Network Management Protocol (SNMP)
Standard for managing remote devices in a network
Collects information from remote devices to give the network administrator an overview of the network
Optionally, allows the network administrator to reconfigure remote devices
Potential for strong labor cost savings
55
Figure 10-16: Simple Network Management Protocol (SNMP)
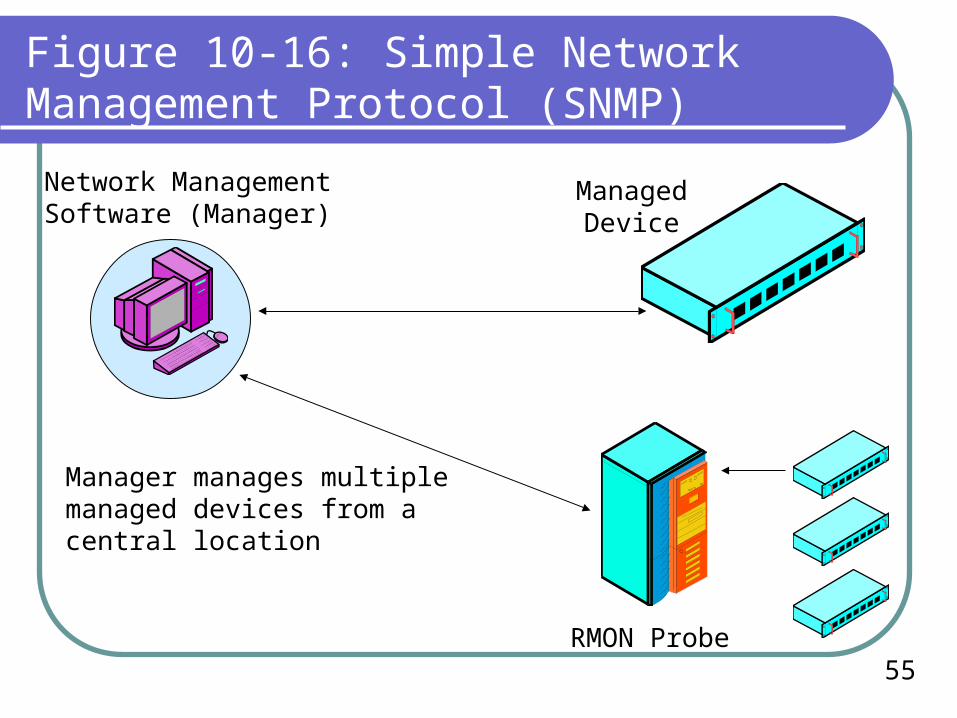
Network ManagementSoftware (Manager)
RMON Probe
ManagedDevice
Manager manages multiple managed devices from a central location
56
Figure 10-16: Simple Network Management Protocol (SNMP)
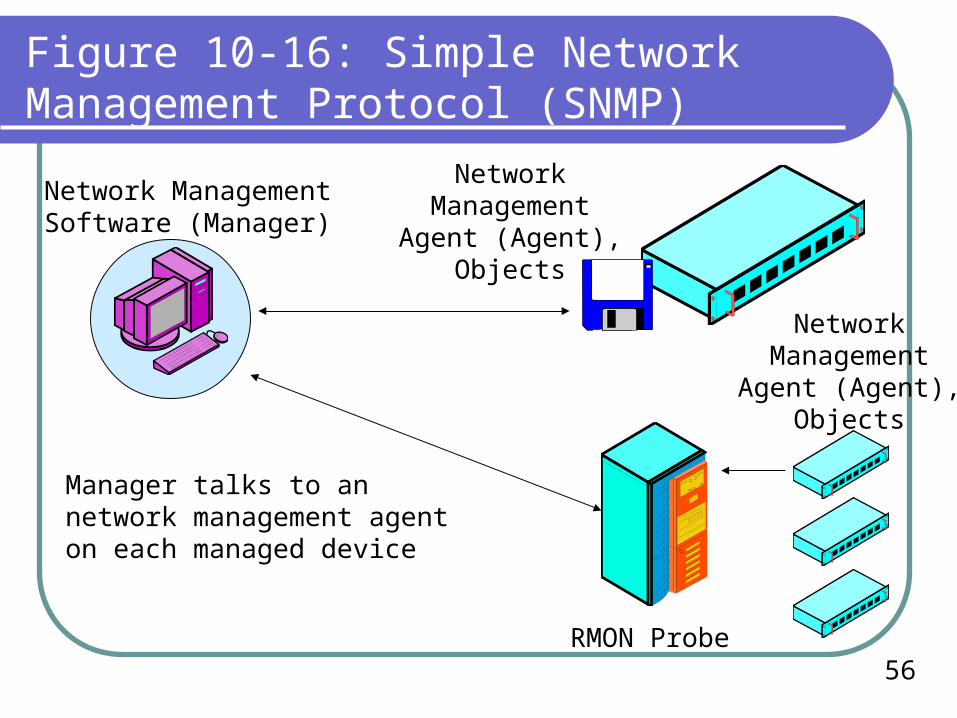
Network ManagementSoftware (Manager)
NetworkManagement
Agent (Agent),Objects
RMON Probe
NetworkManagement
Agent (Agent),Objects
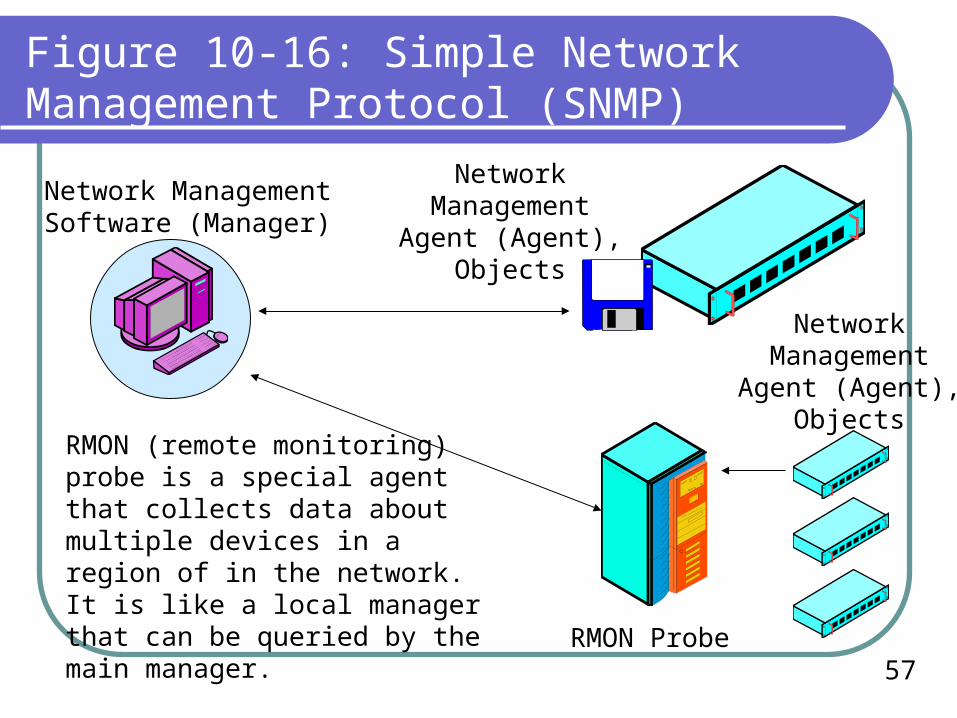
Manager talks to an network management agent on each managed device
57
Figure 10-16: Simple Network Management Protocol (SNMP)
Network ManagementSoftware (Manager)
NetworkManagement
Agent (Agent),Objects
RMON Probe
NetworkManagement
Agent (Agent),Objects
RMON (remote monitoring) probe is a special agent that collects data about multiple devices in a region of in the network. It is like a local manager that can be queried by the main manager.
58
Figure 10-16: Simple Network Management Protocol (SNMP)
ManagementInformationBase (MIB)
ManagementInformationBase (MIB)
ManagementInformationBase (MIB)
Network ManagementSoftware (Manager)
RMON Probe
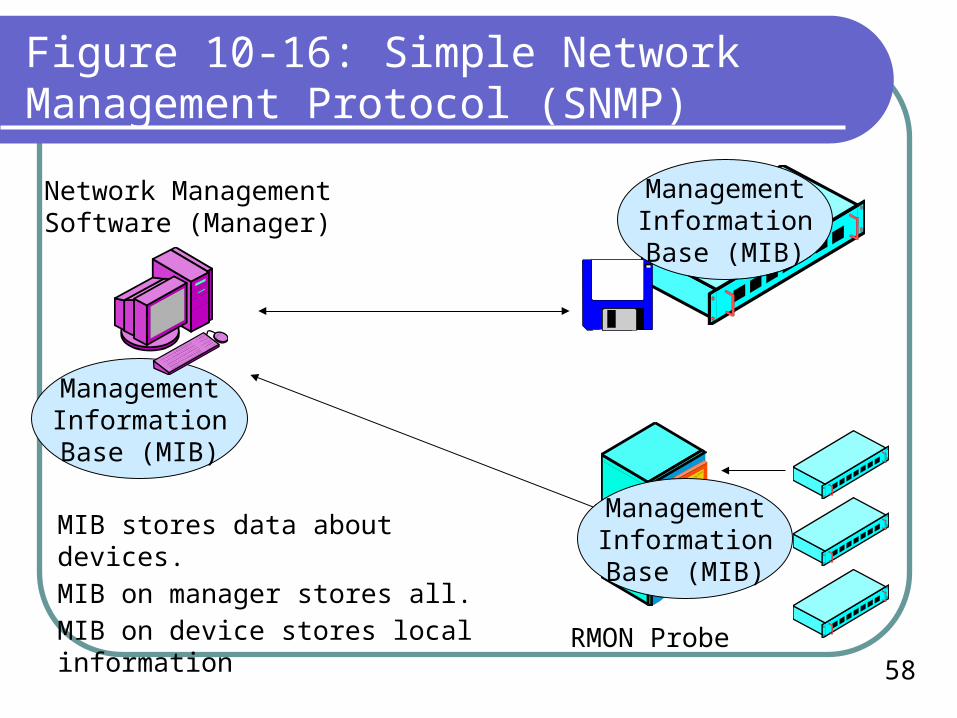
MIB stores data about devices.MIB on manager stores all.MIB on device stores local information
59
Figure 10-16: Simple Network Management Protocol (SNMP)
ManagementInformationBase (MIB)
ManagementInformationBase (MIB)
ManagementInformationBase (MIB)
Network ManagementSoftware (Manager)
Simple NetworkManagement Protocol (SNMP)
RMON Probe
Command (Get, Set, etc.)
Response
Trap
60
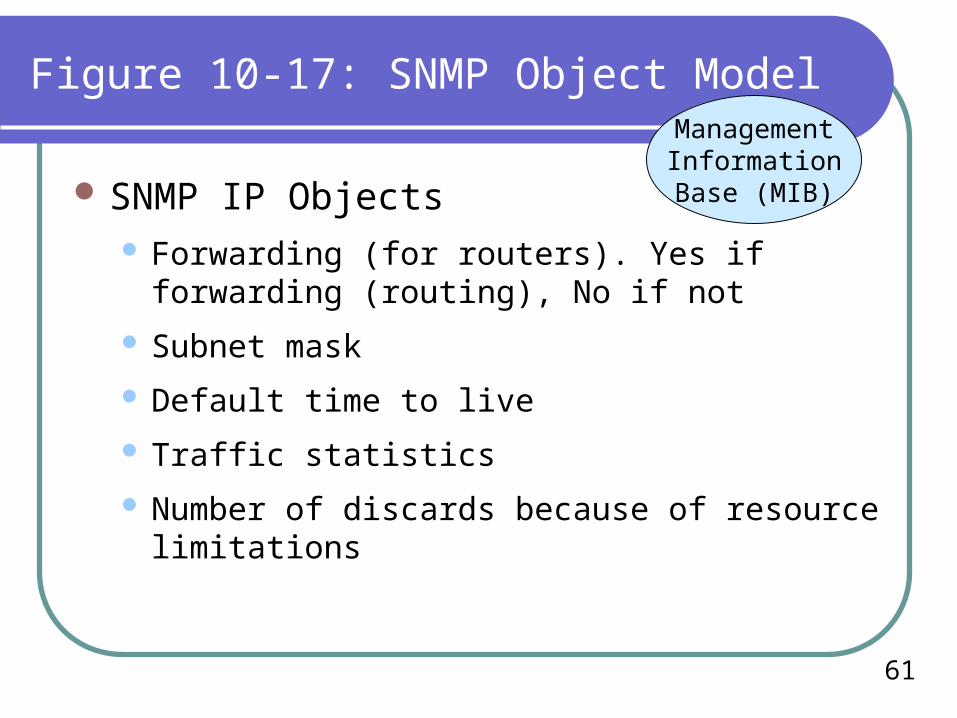
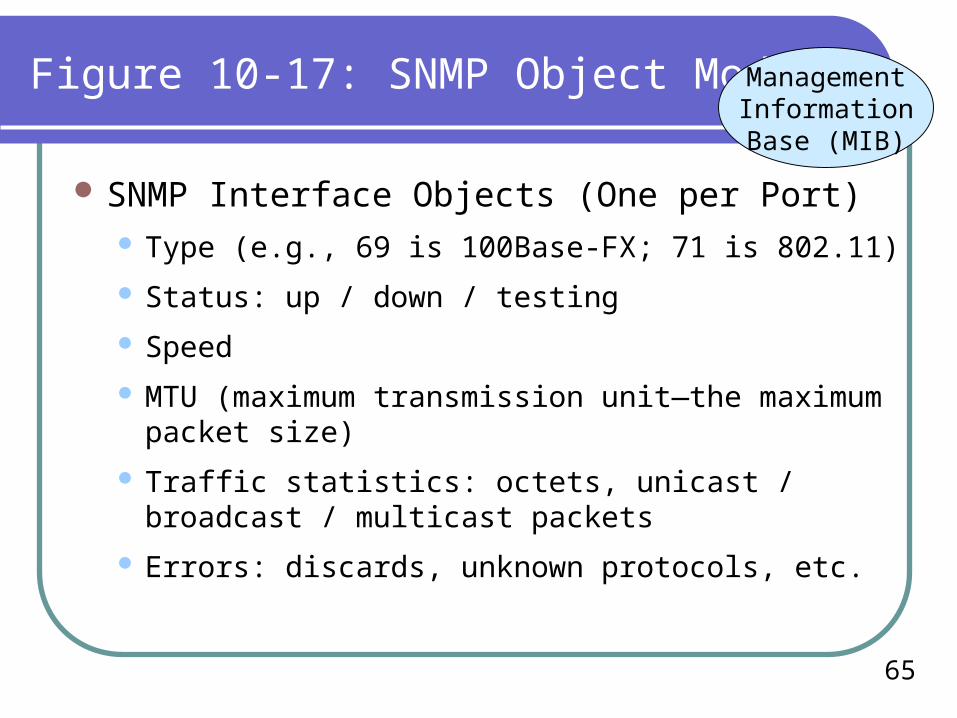
Figure 10-17: SNMP Object Model
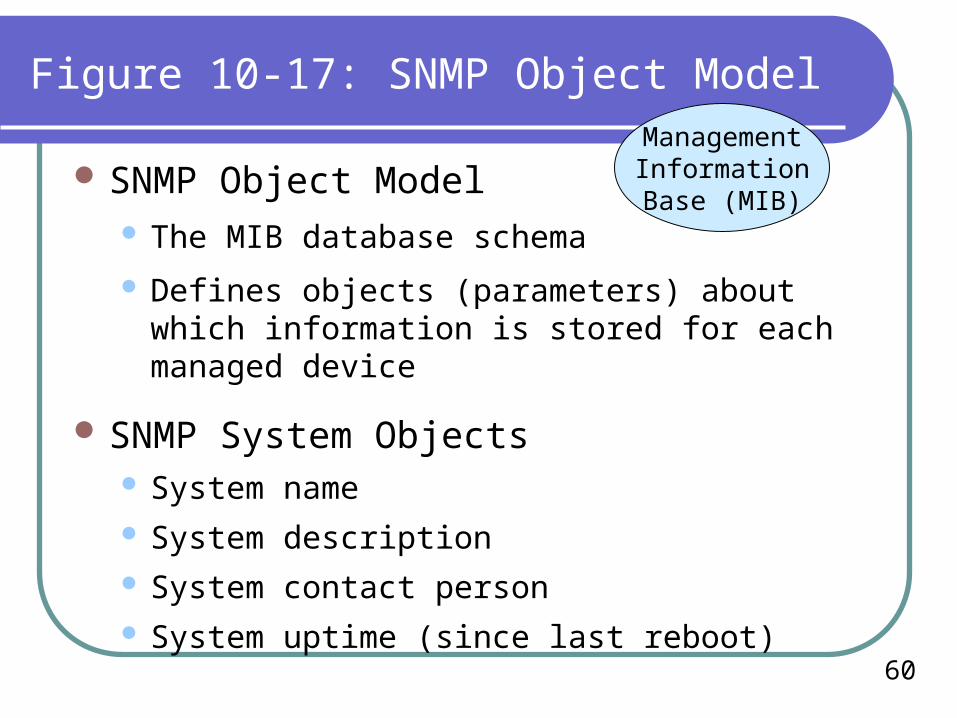
SNMP Object Model The MIB database schema
Defines objects (parameters) about which information is stored for each managed device
SNMP System Objects System name System description System contact person System uptime (since last reboot)
ManagementInformationBase (MIB)
61
Figure 10-17: SNMP Object Model
SNMP IP Objects Forwarding (for routers). Yes if forwarding (routing),
No if not
Subnet mask
Default time to live
Traffic statistics
Number of discards because of resource limitations
ManagementInformationBase (MIB)
62
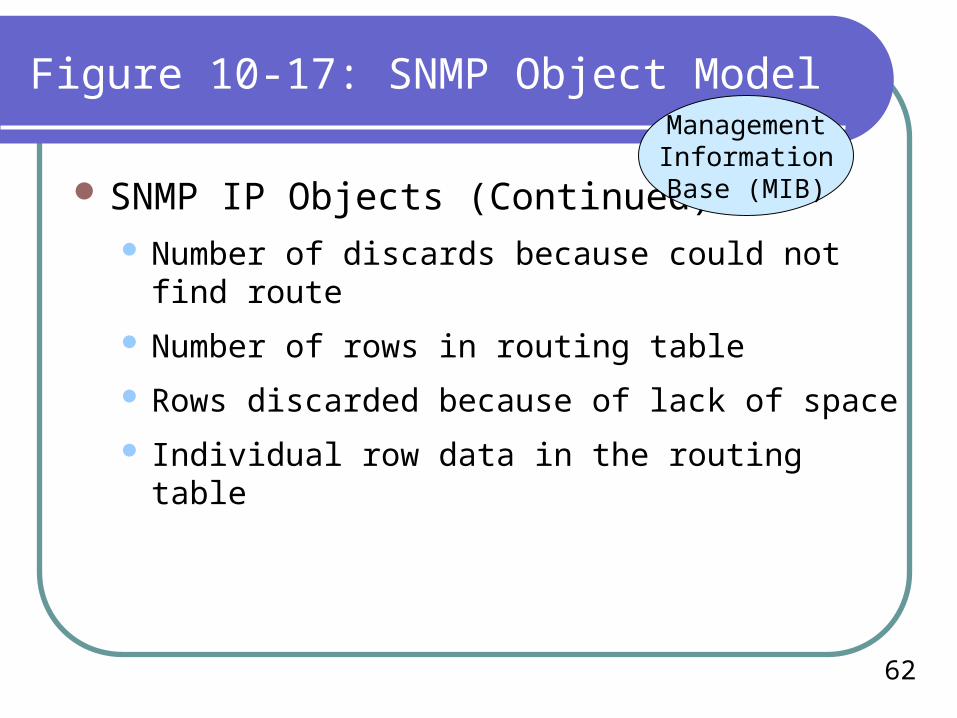
Figure 10-17: SNMP Object Model
SNMP IP Objects (Continued) Number of discards because could not find route
Number of rows in routing table
Rows discarded because of lack of space
Individual row data in the routing table
ManagementInformationBase (MIB)
63
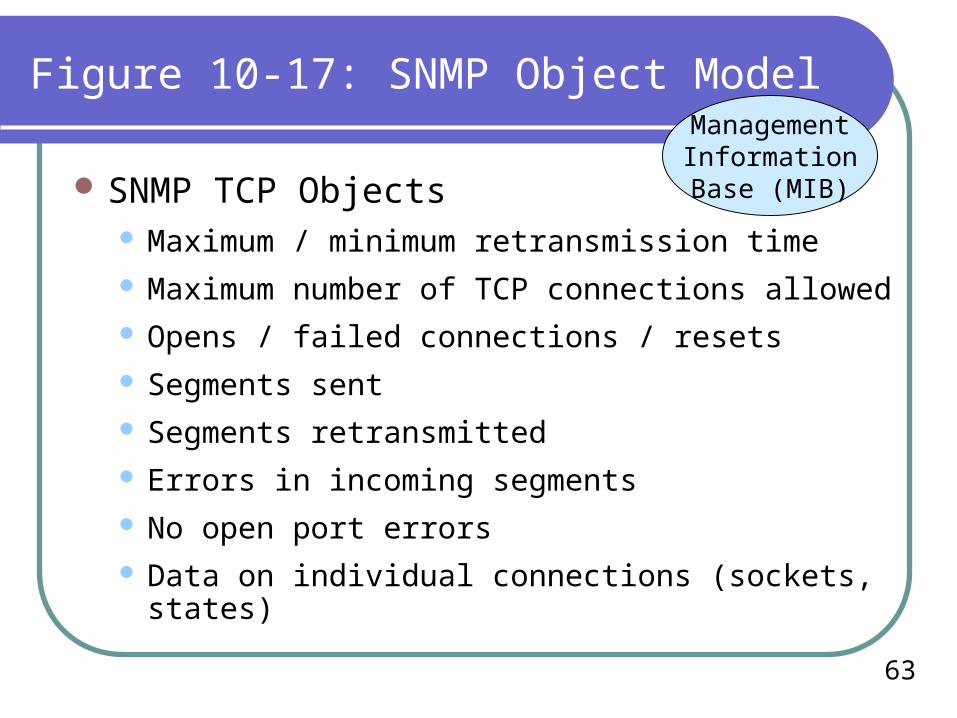
Figure 10-17: SNMP Object Model
SNMP TCP Objects Maximum / minimum retransmission time Maximum number of TCP connections allowed Opens / failed connections / resets Segments sent Segments retransmitted Errors in incoming segments No open port errors Data on individual connections (sockets, states)
ManagementInformationBase (MIB)
64
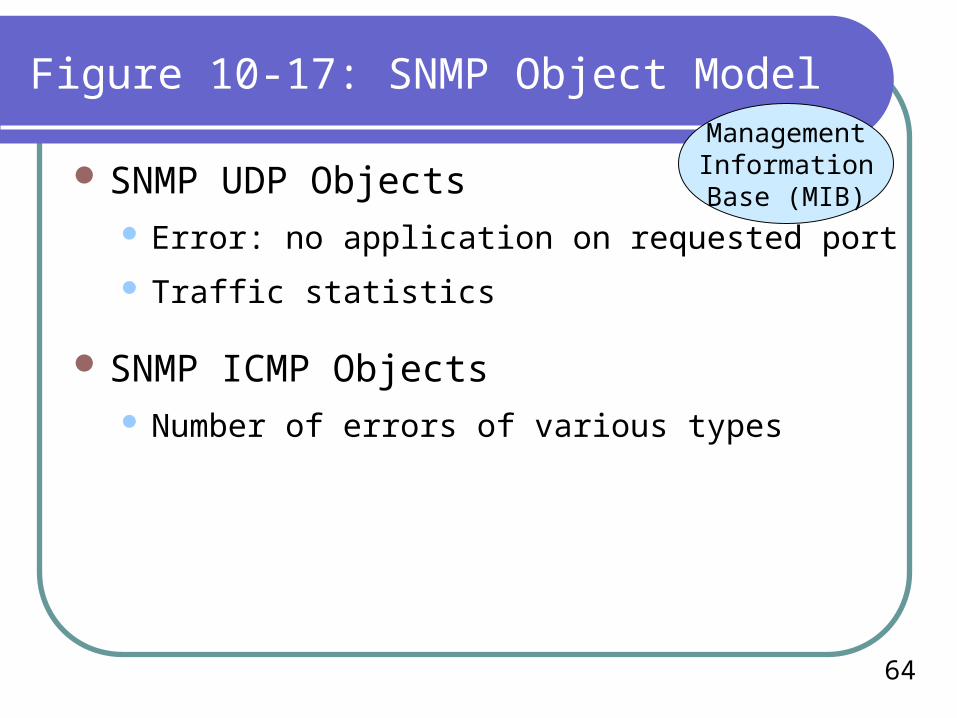
Figure 10-17: SNMP Object Model
SNMP UDP Objects Error: no application on requested port
Traffic statistics
SNMP ICMP Objects Number of errors of various types
ManagementInformationBase (MIB)
65
Figure 10-17: SNMP Object Model
SNMP Interface Objects (One per Port) Type (e.g., 69 is 100Base-FX; 71 is 802.11)
Status: up / down / testing
Speed
MTU (maximum transmission unit—the maximum packet size)
Traffic statistics: octets, unicast / broadcast / multicast packets
Errors: discards, unknown protocols, etc.
ManagementInformationBase (MIB)
Remote Switch and Router Management
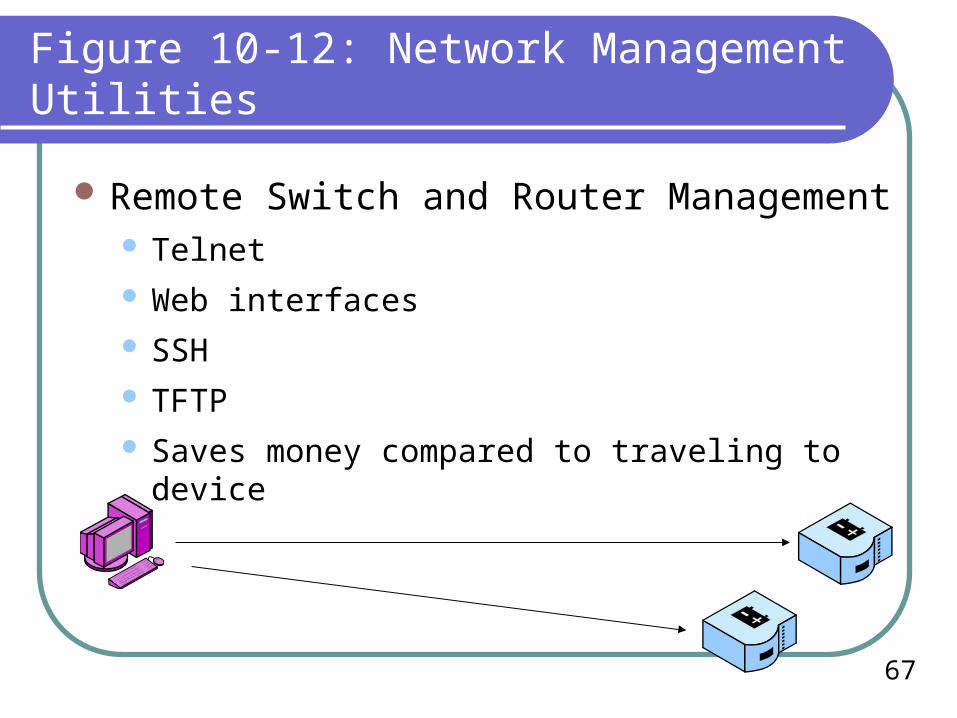
67
Figure 10-12: Network Management Utilities
Remote Switch and Router Management Telnet Web interfaces SSH TFTP Saves money compared to traveling to device
68
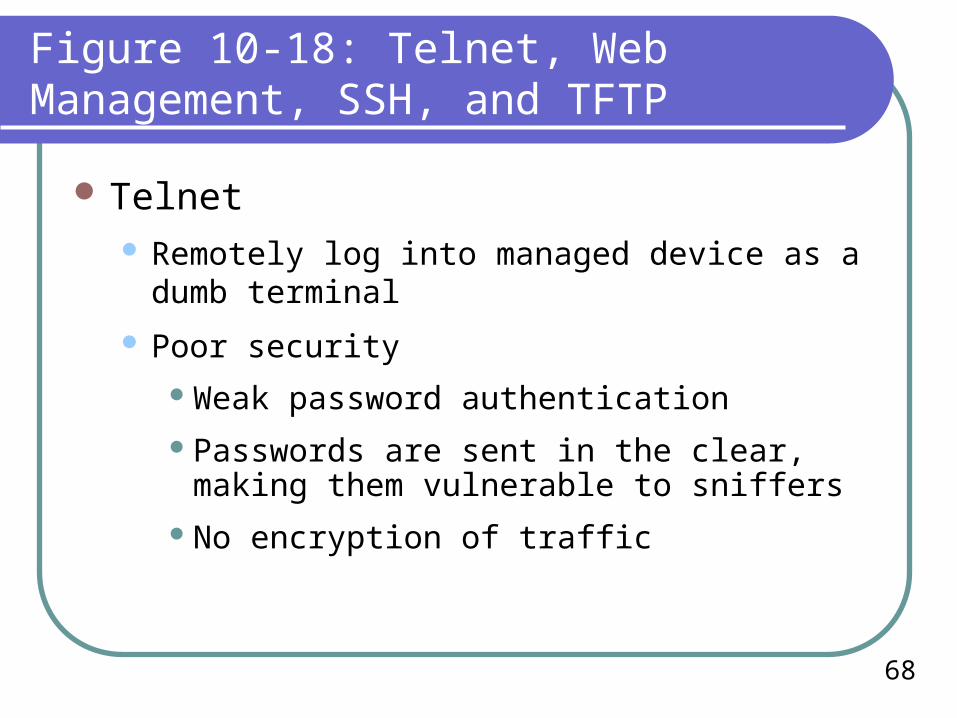
Figure 10-18: Telnet, Web Management, SSH, and TFTP
Telnet Remotely log into managed device as a dumb
terminal
Poor securityWeak password authentication
Passwords are sent in the clear, making them vulnerable to sniffers
No encryption of traffic
69
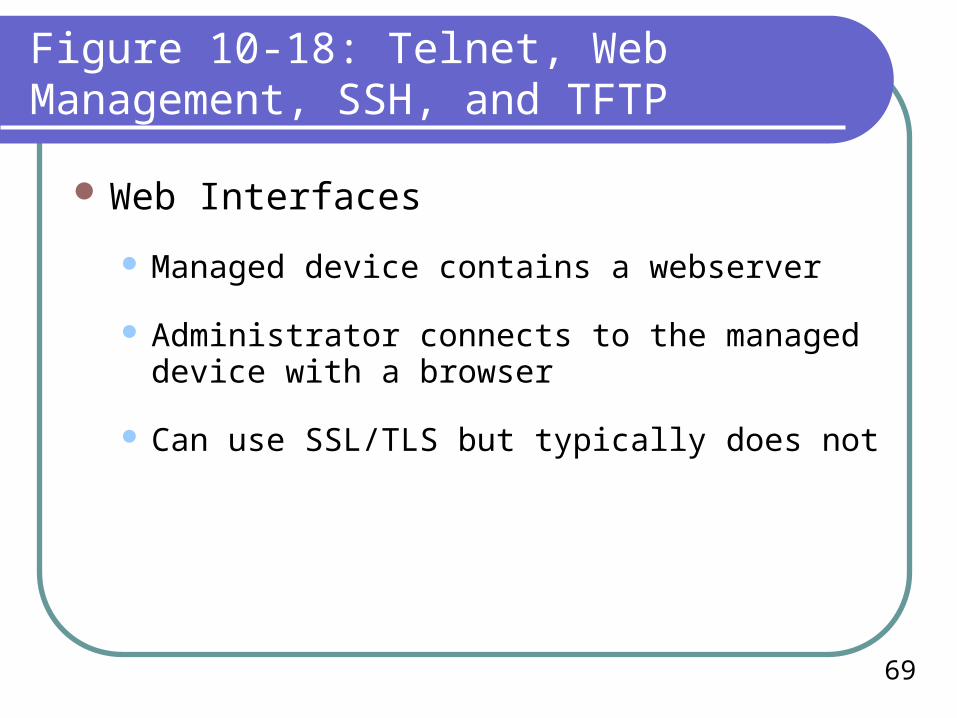
Figure 10-18: Telnet, Web Management, SSH, and TFTP
Web Interfaces
Managed device contains a webserver
Administrator connects to the managed device with a browser
Can use SSL/TLS but typically does not
70
Figure 10-18: Telnet, Web Management, SSH, and TFTP
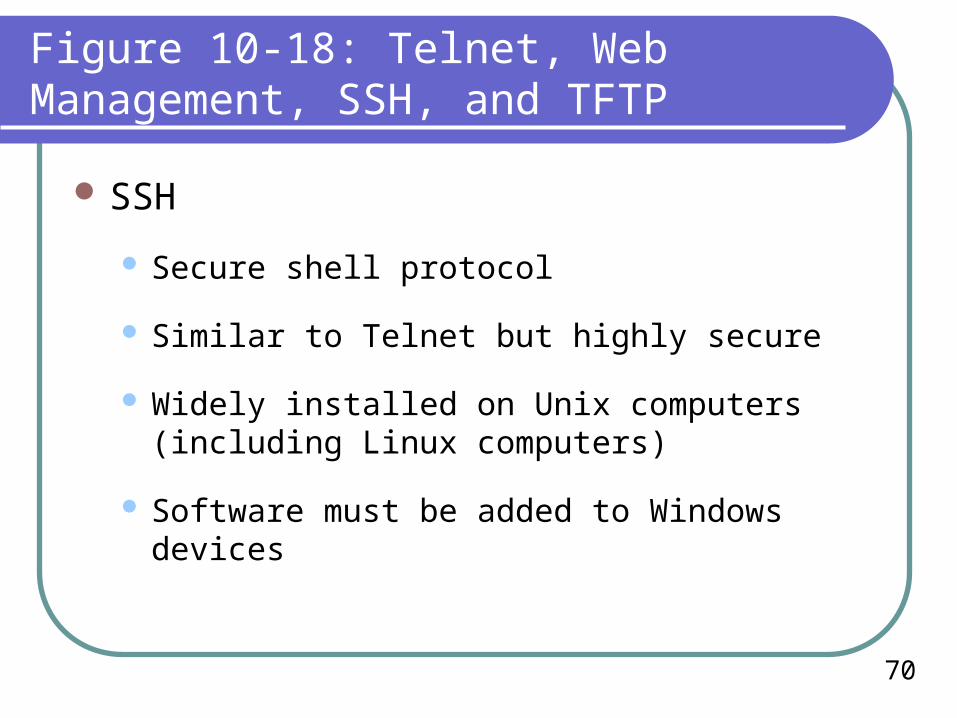
SSH
Secure shell protocol
Similar to Telnet but highly secure
Widely installed on Unix computers (including Linux computers)
Software must be added to Windows devices
71
Figure 10-18: Telnet, Web Management, SSH, and TFTP
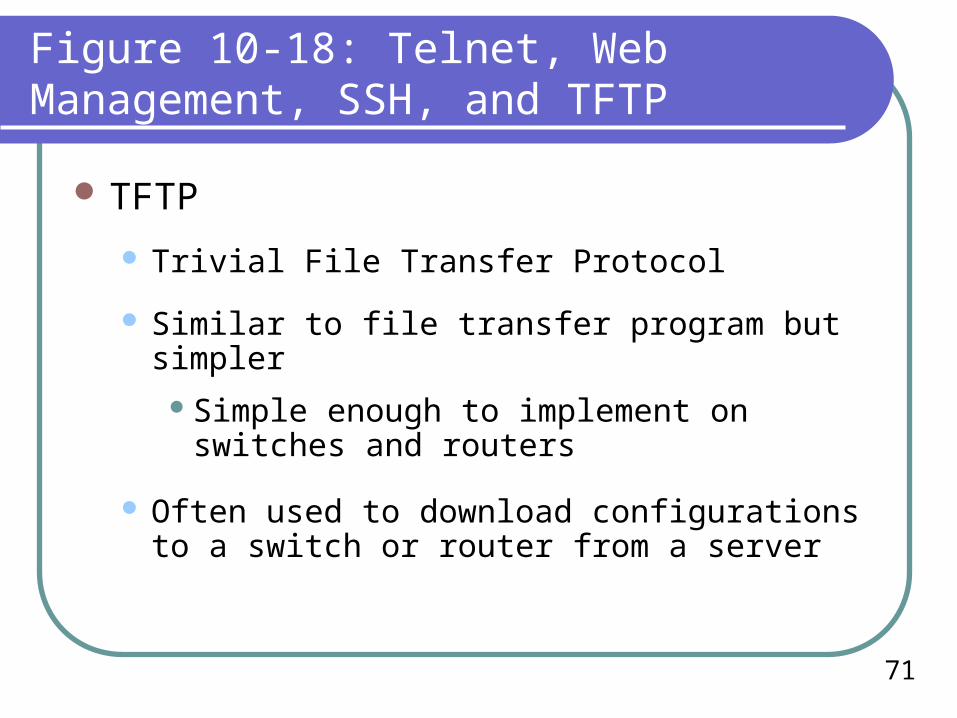
TFTP
Trivial File Transfer Protocol
Similar to file transfer program but simpler
Simple enough to implement on switches and routers
Often used to download configurations to a switch or router from a server
72
Figure 10-18: Telnet, Web Management, SSH, and TFTP
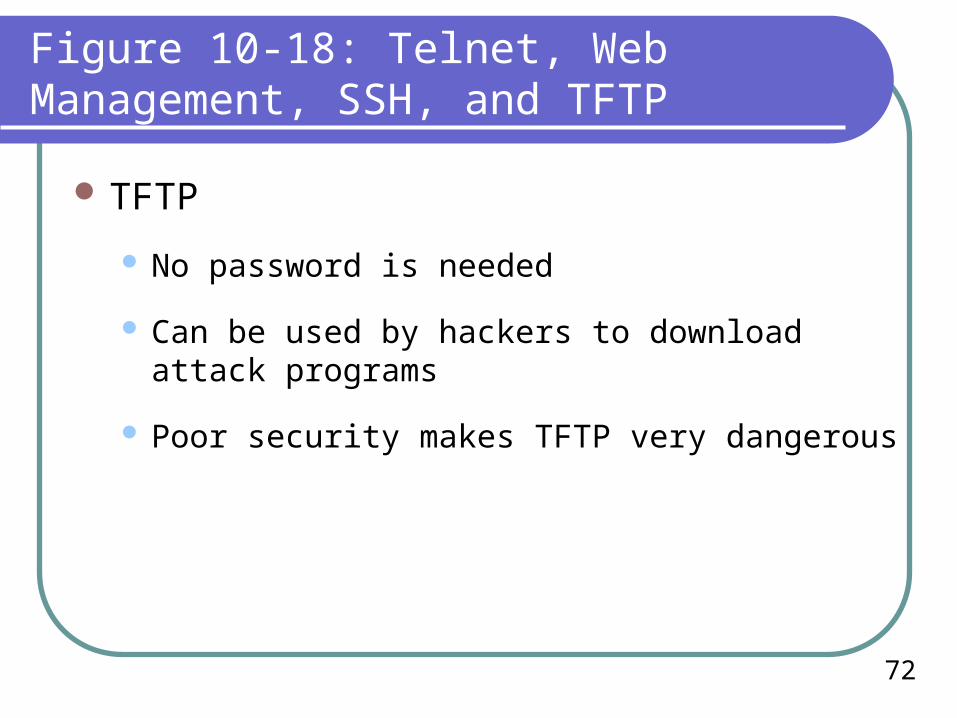
TFTP
No password is needed
Can be used by hackers to download attack programs
Poor security makes TFTP very dangerous
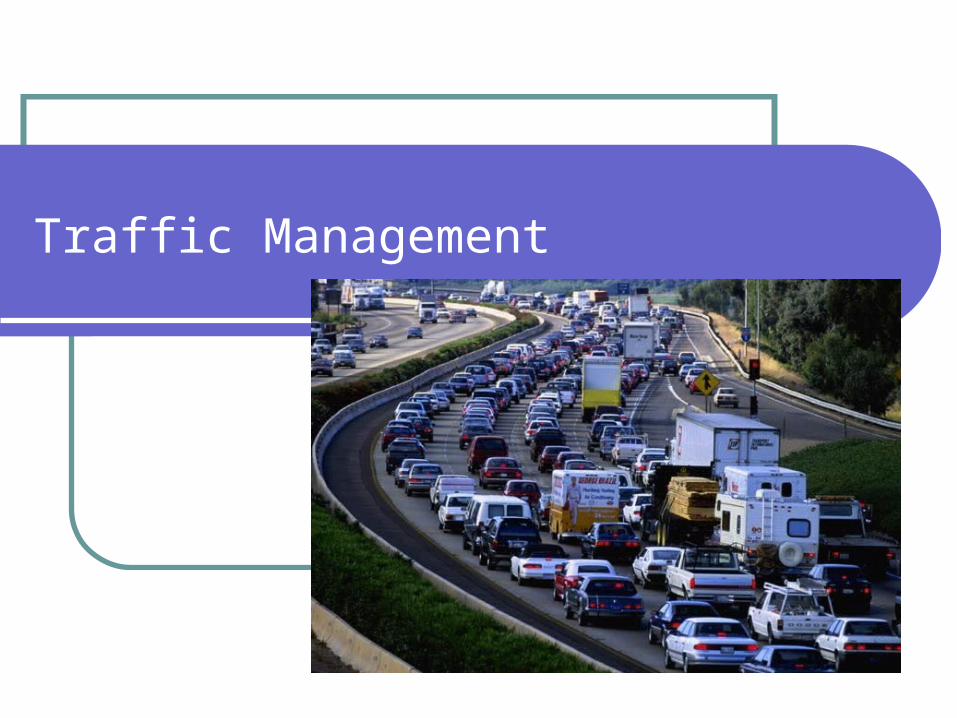
Traffic Management
74
Figure 10-19: Traffic Management Methods
Traffic Management
Capacity is expensive; it must be used wisely
Especially in WANs
75
Figure 10-19: Traffic Management Methods
Traditional Approaches Overprovisioning
In Ethernet, install much more capacity than is needed most of the time
This is wasteful of capacity
Does not require much ongoing management labor
76
Figure 10-19: Traffic Management Methods
Traditional Approaches Priority
In Ethernet, assign priority to applications based on sensitivity to latency
In momentary periods of congestion, send high-priority frames through
Substantial ongoing management labor
77
Figure 10-19: Traffic Management Methods
Traditional Approaches QoS Reservations
In ATM, reserve capacity on each switch and transmission line for an application
Allows strong QoS guarantees for voice traffic
Highly labor-intensive
Data gets the scraps—capacity that is not reserved for voice
78
Figure 10-19: Traffic Management Methods
Traffic Shaping The Concept
Control traffic coming into the network at access switches
Filter out unwanted applications
Give a maximum percentage of traffic to other applications
79
Figure 10-19: Traffic Management Methods
Traffic Shaping Advantages and Disadvantages
Traffic shaping alone reduces traffic coming into the network to control costs
Very highly labor intensive
Creates political battles (as do priority and QoS reservations to a lesser degree)
Topics Covered
81
Topics Covered
Cost Exploding demand, slow budget growth Hardware, software, labor costs Fully-configured hardware versus base prices Total cost of ownership: cost over entire life cycle
Network Simulation Model the network on a computer Explore alternatives Cheaper than building alternatives
82
Topics Covered
IP Subnet Planning Organization is given its network part
Divides remaining bits of IP address into subnet and host part
Must balance number of subnets with hosts per subnet
Directory Servers Hierarchical data storage
LDAP
83
Topics Covered
Configuring Routers Time-consuming; important skill
Cisco IOS is the dominant router operating system
Command-line interface (CLI)
Network Management Utilities Both network managers and hackers love them
Host diagnostic tools. Is the connection working?127.0.0.1Windows XP: Connection Properties
84
Topics Covered
Network Management Utilities Packet capture and display programs
Traffic summarization program (Etherpeek)
Netstat to show active connections
Route analysis: Ping and Tracert
Network mapping tools (nmap)
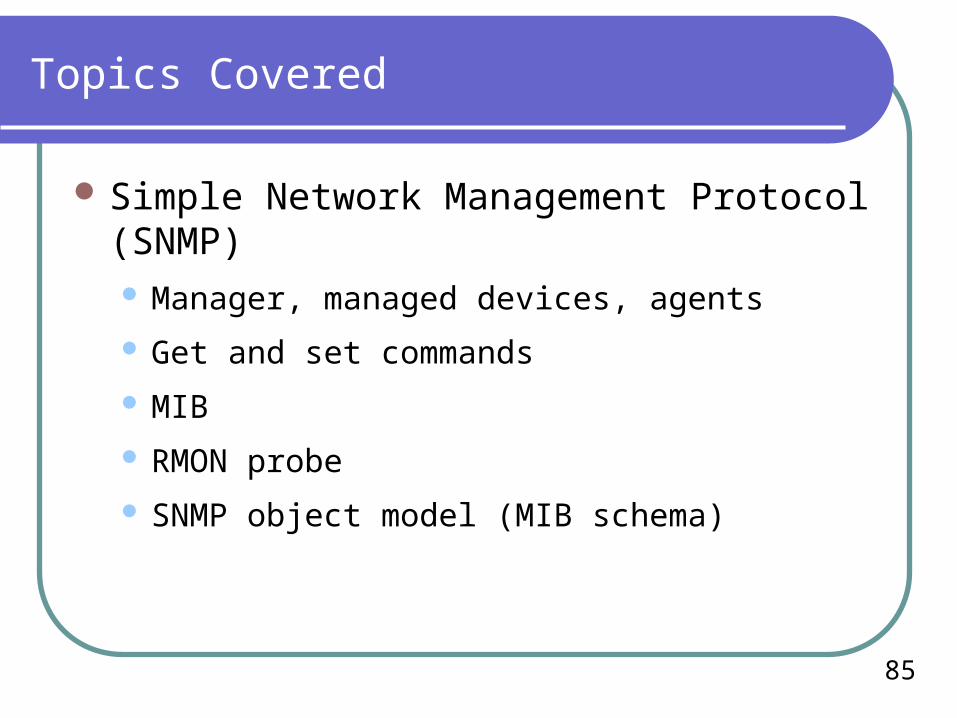
85
Topics Covered
Simple Network Management Protocol (SNMP) Manager, managed devices, agents
Get and set commands
MIB
RMON probe
SNMP object model (MIB schema)
86
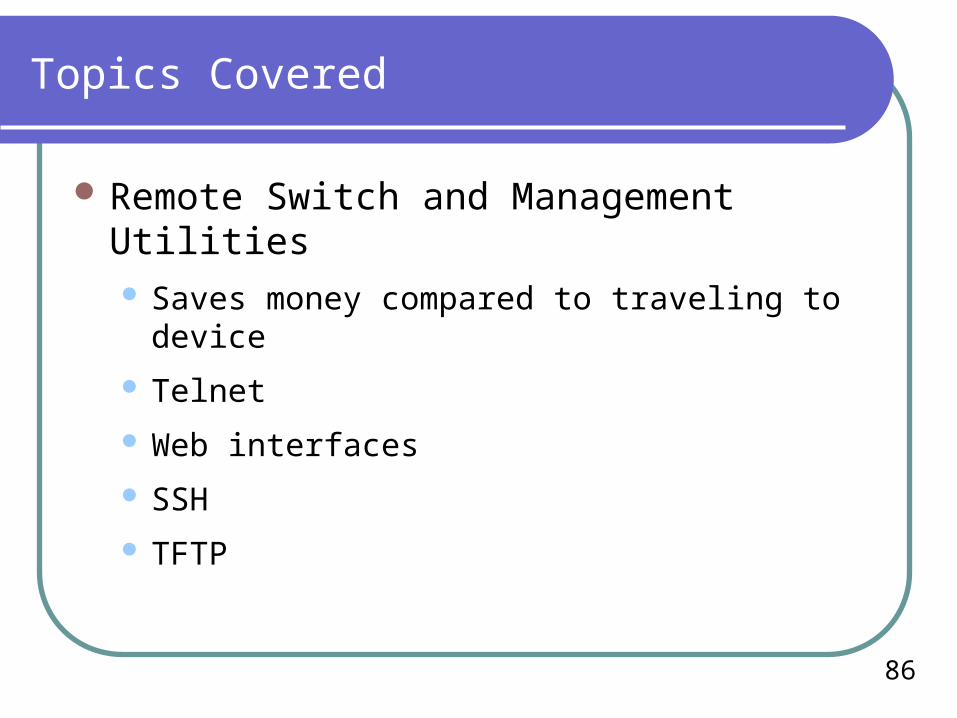
Topics Covered
Remote Switch and Management Utilities Saves money compared to traveling to device
Telnet
Web interfaces
SSH
TFTP
87
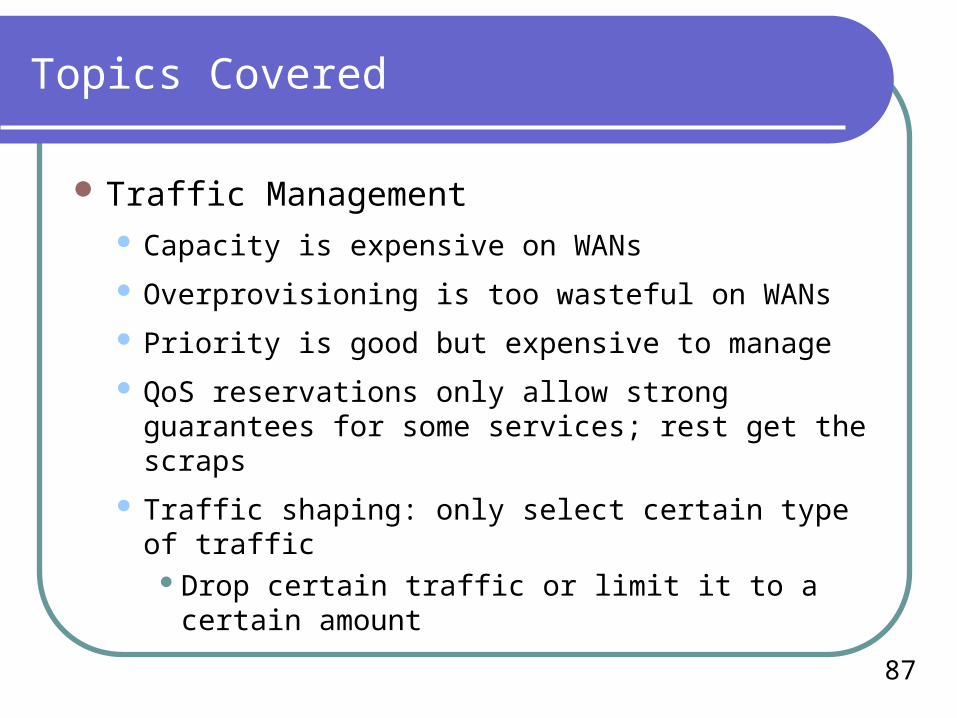
Topics Covered
Traffic Management Capacity is expensive on WANs
Overprovisioning is too wasteful on WANs
Priority is good but expensive to manage
QoS reservations only allow strong guarantees for some services; rest get the scraps
Traffic shaping: only select certain type of trafficDrop certain traffic or limit it to a certain amount