Embed Size (px)
Citation preview

Resolution No. ____
RESOLUTION NO. ______
A RESOLUTION OF THE CITY COUNCIL OF THE CITY OF MILPITAS
APPROVING THE 2014 COST ALLOCATION PLAN UPDATE
WHEREAS, the City Council previously reviewed and approved the City of Milpitas Cost Allocation Plan in
2007 (the “Plan”); and WHEREAS, the Plan identified the full cost of providing specific City services and included not only the direct
costs of servicing a program but also administrative and overhead costs (also known as indirect costs) which are assigned
to each program indirectly using cost allocation formulas; and WHEREAS, since 2007 there have been various changes in the City that include dissolution of the
Redevelopment Agency, outsourcing of certain City’s services, and organizational changes requiring a review and update
of the Plan; and WHEREAS, the City of Milpitas Finance Department, along with all City departments, have reviewed and
updated the Plan for City Council review and approval (“2014 Plan Update”); and WHEREAS, the 2014 Plan Update was computed using the cost data from the Fiscal Year 2013-2014 Budget and
Financial Plan and reasonably reflects the current full cost of each employee providing specific City services as further
detailed in the attached 2014 Plan Update; and WHEREAS, the 2014 Plan Update will be used by the City for various updates including to provide the basis (i)
for adjustment of City’s Schedule of fees and charges, (ii) for administration and overhead cost reimbursements from the
utility enterprise funds to ensure that the General Fund tax revenues are not used to subsidize utility service charges, and
(iii) for a transparent and consistent methodology on how hourly rates are determined for each direct service staff position
for cost recovery purposes; and
WHEREAS, the City of Milpitas Finance Subcommittee reviewed the 2014 Plan Update on January 14, 2014 and
recommended the City Council adopt a resolution to approve the 2014 Plan Update; NOW, THEREFORE, the City Council of the City of Milpitas hereby finds, determines, and resolves as follows:
1. The City Council has considered the full record before it, which may include but is not limited to such
things as the staff report, testimony by staff and the public, and other materials and evidence submitted or
provided to it. Furthermore, the recitals set forth above are found to be true and correct and are
incorporated herein by reference.
2. The City Council hereby approves the 2014 Cost Allocation Plan Update attached to this Resolution as
Exhibit A. The 2014 Cost Allocation Plan Update is fully incorporated in this Resolution by reference.
PASSED AND ADOPTED this day of 2014, by the following vote:
AYES:
NOES:
ABSENT:
ABSTAIN:
ATTEST: APPROVED:
Mary Lavelle, City Clerk Jose S. Esteves, Mayor
APPROVED AS TO FORM:
Michael J. Ogaz, City Attorney
9

DRAFT 1-9-14
COST ALLOCATION PLAN UPDATED 2014
Exhibit A

DRAFT 1-9-14
CITY OF MILPITAS COST ALLOCATION PLAN
UPDATED 2014
TABLE OF CONTENTS
INTRODUCTION
Overview
Background 1
Purpose of the Plan 1
Determining Direct and Indirect Costs 1
Basis of Allocation 2
Determining the Hourly Billing Rate
Citywide Indirect Cost Rate 2
Departmental Indirect Cost Rate 2
Uses of the Plan 3
Summary 3
INDIRECT COST ALLOCATIONS
Summary of Direct and Indirect Costs 4
Basis of Indirect Cost Allocations 5
Summary of Indirect Cost Allocations 6
Indirect Program Cost Allocation
Legislation & Policy 7
General Administration
City Manager 8
City Clerk 9
City Attorney 10
Human Resources 11
General Liability 12
Financial Services 13
Information Technology
Citywide Support 14
Telephones 15
Cell Phones 16
Retiree Medical Reserve and Other Non-Department
Salaries & Benefits 17
Leave Cashout 18
Audit Fees 19
Uncollectible Accounts/Collection Fee 20
Contingent Reserve 21
Contractual Services 22
Facilities Maintenance 23
Utilities 24
Buildings and Building Improvements Amortization 25
HOURLY LABOR RATES
Police 26
Fire 27
Building and Safety 28
Public Works 29
Engineering 30
Planning & Neighborhood Services 31
Recreation Services 32
General Government 33

DRAFT 1-9-14
INTRODUCTION
OVERVIEW
Background
The City’s Municipal Code requires that staff review City’s fees and charges
periodically to ensure that the costs of providing certain City services are
reasonably recovered through fees and charges. The first step of making
such determination is to calculate the total cost (also known as full cost) of
providing City’s services. Total cost includes two components: direct costs
and indirect costs. While direct costs are easy to identify because they are
the operation costs associated with providing a particular service, indirect
costs are typically allocated through a Cost Allocation Plan. The City’s last
Cost Allocation Plan was updated and approved by the City Council in
2007. Since then, there have been various changes in the City: dissolution
of the Redevelopment Agency, outsourcing of certain City’s services,
organizational changes and improvement of technology. As a result of these
changes, the Cost Allocation Plan must be reviewed and updated to ensure
its relevancy. It is also recommended by the Government Finance Officers
Association that the Cost Allocation Plan be updated every few years.
The 2014 Cost Allocation Plan (“Plan”) has been completed by the Finance
Department, reviewed by all City departments and recommended by the
Finance Subcommittee. The 2014 Cost Allocation Plan is computed by
using the cost data from the FY 2013-14 Budget and Financial Plan. Once
the Plan has been adopted by the City council, the formulation of the Plan
will remain intact but the cost data will be derived from each fiscal year’s
operating budget. It is intended that the City’s fees and charges be reviewed
each fiscal year in conjunction with the adoption of the operating budget. If
warranted, staff will recommend fee adjustments at that time.
Purpose of the Plan
The purpose of the City’s cost allocation plan is to identify the full cost of
providing specific City services. It also provides the basis for adjustment of
City fees and charges. The cost of delivering City services can be classified
into two basic categories: direct and indirect costs.
Direct costs are those that can be specifically identified with a particular
cost objective or program, such as street maintenance, police and fire
protection, recreation, water and sewer services. Indirect costs are not
readily identifiable with a direct operating program, but rather, are incurred
in order to enable the operation of a program or service.
Common examples of indirect costs include technology, accounting,
purchasing, legal services, personnel administration and building
maintenance. Although indirect costs are generally not readily identifiable
with direct cost programs, their costs should be reflected as an integral part
of the total cost of providing specific goods or services.
In order to determine the total cost of delivering specific services, some
methodology for determining and allocating indirect costs must be
developed, and that is the purpose of cost allocation plans: to identify
indirect costs and to allocate them to benefiting direct cost programs in a
logical and uniform manner.
DETERMINING DIRECT AND INDIRECT COSTS
The first step in preparing the City's cost allocation plan is to determine
direct and indirect costs. Program costs that primarily provide service to the
public are identified as direct costs, whereas the cost of programs that
primarily provide services to the organization are identified as indirect costs.
Within City’s organization, majority of the services performed by the City
Council, City Manager, City Clerk, City Attorney, Finance, Human
Resources, Information Services, Facility and Fleet Maintenance are internal
and are considered indirect costs. These costs are distributed to various
direct services or programs to determine the total cost of each program or
service.
Other City’s organizational units such as Police, Fire, Building, Planning,
Recreation Services, Public Works and Engineering provide services to the
public and are considered direct cost programs. Additionally, costs directly
related to utilities services such as water purchase cost and City’s share of
the San Jose Waste Water Treatment Plant operating costs are also
considered direct cost programs. Once the direct cost programs are
1

DRAFT 1-9-14
INTRODUCTION
identified, the indirect costs of program administration, building occupancy,
facility and equipment maintenance are then allocated to each direct cost
program using some logical and commonly accepted allocation factors.
It should be noted that in accordance with generally accepted accounting
principles, only operating costs are considered in preparing the cost
allocation plan. As such, capital outlay and debt service costs are excluded
from the calculations. However, the depreciation cost for the use of certain
City facilities is included. In addition, certain costs that are one-time in
nature and costs funded by special assessments such as Community Facility
Districts and Light and Landscape Maintenance Districts are also excluded.
BASIS OF ALLOCATION
Allocating indirect costs via the citywide indirect cost rate assumes that all
indirect costs are incurred proportionately to the direct cost of the program.
However, this may not be a reasonable assumption in all cases, as the
benefit received from certain types of support service programs may be
more closely related to an indicator of activity other than cost.
For example, if a program service is primarily delivered through contract
and does not have any City staffing directly associated with it, distributing
personnel administration and payroll preparation costs to it may result in an
inequitable allocation of costs. Because of this, the cost allocation plan
prepared for City of Milpitas establishes separate basis of allocation for
each major indirect cost category. With this approach, indirect costs can be
allocated to each direct cost program in a fair, equitable, and most
importantly, consistent manner. Provided on page 6 is a summary of the
primary methods of allocation used in distributing indirect costs to direct
cost programs.
Some of the indirect costs lend themselves to an easily justified, rational
approach of distribution. For example, human resources administration is
related to the number of employees serviced. Other cost allocation factors
such as size of the program budget, work load analysis, square footage of
the occupied space, or number of equipment assigned are also directly
proportionate to the benefits provided to each direct cost program.
DETERMINING THE HOURLY BILLING RATE
There are two components of indirect rate that must be considered in
determining the hourly billing rate for the employees that provide the direct
cost service. They are the citywide indirect cost rate and departmental
indirect cost rate.
Citywide Indirect Cost Rate
After all the citywide indirect costs have been allocated, each direct cost
program or service will have a citywide indirect cost rate which is simply
the ratio of the allocated citywide indirect costs divided by the direct
program costs.
Page 6 of this report provides a summary table of citywide indirect cost
allocation. The last row of the summary table specifically identifies the
citywide indirect cost rate pertaining to each direct cost program. The cost
data is derived from the Adopted FY 2013-14 Budget and Financial Plan,
with adjustments to include the depreciation cost for the use of certain City
facilities.
Departmental Indirect Cost Rate
Within each direct cost program, there are also departmental indirect costs.
These will include the costs of management and support personnel, plus
other operating costs such as supplies, consultant services, and training.
These costs must be included to determine the hourly billing rate of the
employees providing the direct services. The departmental indirect cost rate
is simply the ratio of the costs of management, support personnel and other
operating costs divided by the salary and benefits costs and other direct
operating costs of the employees that staff the program or service.
To determine the hourly billing rate, the annual direct cost of the employees
who provide the program or service is divided by the number chargeable
hours. A multiplier of the citywide indirect cost rate is then applied to the
result. A multiplier of the departmental indirect cost rate is further applied to
the result of the previous step.
2

DRAFT 1-9-14
INTRODUCTION
Pages 26 through 33 of this report provide the detail of the computation of
the hourly rate for each department that is identified as provider of direct
cost program and service. Again, the cost date is derived from the Adopted
FY 2013-14 Budget and Financial Plan, adjusted to include depreciation
cost for the use of certain City facilities. For example on page 26, based on
the applicable citywide and departmental indirect cost rates for Police
Department of 21.7% and 22.8% respectively, the calculated “full cost”
hourly rate of a Patrol Officer is $168.60 per hour. The full cost includes
annual salary, benefits, and departmental and citywide indirect costs.
USES OF THE PLAN
By identifying the total program costs, the Cost Allocation Plan can be used
as a basic analytical tool in a wide range of financial decision-making
situations, including:
� Enterprise Fund Accounting. The cost allocation plan can be used to
identify the costs incurred by the General Fund in providing
administrative support services to the City's enterprise operations. For
example, although the City's legislative, legal, accounting, human
resources, and building maintenance programs are budgeted in the
General Fund, these programs also provide support services to the water
and sewer enterprise funds. In order for these enterprise funds to fully
recover their operating costs, it is essential that the support costs be
allocated to the enterprise funds.
� User Fees. User fee services are those performed by a governmental
agency on behalf of a private citizen or group. Examples of City’s user
fees include private job service charges, building plan check and permit
fees, and recreation fees. The assumption underlying most fee
recommendations is that the costs of services benefiting individuals, and
not city as a whole, should be borne by the individual receiving the
benefit. Setting user fees, therefore, is essentially equivalent to
establishing prices for services.
The City has adjusted some of its user fees in the past but the fees have
not been consistently reviewed or adjusted annually. The cost allocation
plan can be used to determine the appropriate user fees for various City
services and achieve cost recovery of providing such services.
� Labor Rates. The City has developed hourly labor rate schedules that
identify the total hourly cost of all direct service staff positions. Key
components of the “full cost” rate include indirect costs, both citywide
and departmental wide for program administration. These hourly rates
are computed based on chargeable hours and exclude non-chargeable
hours such as paid vacation and sick leave hours.
SUMMARY
The cost allocation plan makes determining total program costs possible by
establishing a rational and consistent methodology for identifying and
allocating indirect costs to direct cost programs. Because of this, the cost
allocation plan can be a valuable analytical tool in a number of situations,
including allocating organizational resources, performing expense analyses,
and evaluating the costs of performing services. It also provides the basis
for administration and overhead cost reimbursements from various funds
including Water and Sewer utility enterprise funds to ensure that the General
Fund tax revenues are not used to subsidize utility service charges.
Additionally, it provides transparency on how the hourly rates are
determined for each direct service staff position and consequently the full
costs of providing programs or services. The Plan can be used by the City to
review and update City fees and charges on an annual basis to establish fee
structures that are designed for full cost recovery.
3

DRAFT 1-9-14
INDIRECT COST ALLOCATIONSSUMMARY OF DIRECT AND INDIRECT COSTS
Public Safety Legislation & Policy 244,798
Police 22,503,737 General Administration
Fire 15,281,487 City Manager 477,200
Public Utilities City Clerk 343,222
Water 19,276,716 City Attorney 723,816
Sewer 9,179,279 Human Resources 926,175
Solid Waste 619,457 General Liability 463,000
Building & Safety 2,960,160 Financial Services 2,113,110
Recreation 3,386,714 Information Technology
Public Works 3,084,277 Citywide Support 1,999,708
Engineering 1,820,377 Telephones 223,000
Neighborhood & Planning Services 2,336,634 Cell Phones 27,000
Retiree Medical Reserve and Other Non-Department Salaries & Benefits 2,981,600
Leave Cashout 642,258
Audit Fees 90,600
Uncollectible Accounts/Collection Fee 17,000
Contingent Reserve 328,000
Contractual Services 116,800
Facilities Maintenance 1,933,134
Utilities 2,297,046
Buildings and Building Improvements Amortization 1,445,748
TOTAL DIRECT COSTS 80,448,839$ TOTAL INDIRECT COSTS 17,393,215$
OVERALL INDIRECT COST RATE
(Indirect Costs Divided by Direct Costs) 21.6%
DIRECT COSTS INDIRECT COSTS
4

DRAFT 1-9-14
INDIRECT COST ALLOCATIONSBASIS OF INDIRECT COST ALLOCATIONS
Legislation & Policy Council agenda items
General Administration
City Manager Based on workload analysis
City Clerk Council agenda items
City Attorney Based on workload analysis
Human Resources Full-time equivalent staffing
General Liability Full-time equivalent staffing
Financial Services Operating budget
Information Technology
Citywide Support Full-time equivalent staffing
Telephones Assigned number of phones
Cell Phones Assigned cell phones
Retiree Medical Reserve and Other Non-Department Salaries & Benefits Operating budget
Leave Cashout Based on actual experience
Audit Fees Operating budget
Uncollectible Accounts/Collection Fee Based on prior three fiscal years actual experience
Contingent Reserve Operating budget
Contractual Services Operating budget
Facilities Maintenance Assigned square footage
Utilities Assigned square footage
Buildings and Building Improvements Amortization Full-time equivalent staffing
INDIRECT COST PROGRAM BASIS OF ALLOCATION
5

DRAFT 1-9-14
INDIRECT COST ALLOCATIONSSUMMARY OF INDIRECT COST ALLOCATIONS
Police Fire Water Sewer Solid Waste Building & Safety Recreation Public Works EngineeringNeighborhood &
Planning ServicesTotal
Legislation & Policy 24,237 20,602 13,331 6,059 6,059 19,390 26,661 52,110 43,627 32,721 244,798
General Administration
City Manager 47,720 47,720 47,720 47,720 23,860 47,720 47,720 71,580 23,860 71,580 477,200
City Clerk 33,982 28,885 18,690 8,496 8,496 27,186 37,381 73,062 61,168 45,876 343,222
City Attorney 43,429 43,429 43,429 43,429 43,429 43,429 65,143 43,429 108,572 246,097 723,816
Human Resources 356,548 203,742 58,983 46,623 3,735 57,727 43,295 79,120 40,748 35,655 926,175
General Liability 178,240 101,852 29,486 23,307 1,867 28,858 21,643 39,552 20,370 17,824 463,000
Financial Services 591,095 401,391 506,332 241,108 16,271 77,753 88,957 81,013 47,815 61,375 2,113,110
Information Technology
Citywide Support 769,823 439,899 127,351 100,664 8,065 124,638 93,479 170,827 87,980 76,982 1,999,708
Telephones 96,735 17,311 11,201 11,201 1,018 17,311 21,384 17,311 15,274 14,256 223,000
Cell Phones 3,453 2,826 2,198 2,512 5,337 2,198 6,279 1,570 628 27,000
Retiree Medical Reserve and Other Non-
Department Salaries & Benefits 834,035 566,363 714,435 340,203 22,958 109,710 125,519 114,310 67,467 86,600 2,981,600
Leave Cashout 284,229 201,047 16,394 13,072 21,460 28,699 49,070 24,309 3,978 642,258
Audit Fees 25,343 17,210 21,709 10,338 698 3,334 3,814 3,473 2,050 2,631 90,600
Uncollectible Accounts/Collection Fee 1,500 2,458 729 564 10,575 1,173 17,000
Contingent Reserve 91,751 62,305 78,594 37,425 2,526 12,069 13,808 12,575 7,422 9,527 328,000
Contractual Services 32,672 22,186 27,987 13,327 899 4,298 4,917 4,478 2,643 3,392 116,800
Facilities Maintenance 418,174 295,778 146,713 105,924 3,221 27,698 681,451 185,165 35,141 33,868 1,933,134
Utilities 496,896 351,458 174,332 125,865 3,828 32,912 809,734 220,022 41,756 40,244 2,297,046
Buildings and Building Improvements
Amortization 556,567 318,038 92,072 72,778 5,831 90,111 67,583 123,505 63,608 55,657 1,445,748
TOTAL INDIRECT COSTS 4,886,430 3,144,498 2,130,956 1,250,048 152,761 750,939 2,184,115 1,347,446 705,956 840,066 17,393,215
TOTAL DIRECT COSTS 22,503,737 15,281,487 19,276,716 9,179,279 619,457 2,960,160 3,386,714 3,084,277 1,820,377 2,336,634 80,448,839
TOTAL COSTS 27,390,166 18,425,986 21,407,673 10,429,327 772,218 3,711,099 5,570,829 4,431,723 2,526,333 3,176,700 97,842,054
INDIRECT COST RATE 21.7% 20.6% 11.1% 13.6% 24.7% 25.4% 64.5% 43.7% 38.8% 36.0% 21.6%
DIRECT COST PROGRAMS
6

DRAFT 1-9-14
INDIRECT PROGRAM COST ALLOCATION
Indirect Cost Program Legislation & Policy
Budget 244,798
Base of Allocation Council agenda items
Base of Percent Cost
Direct Cost Program Allocation of Total Allocation
Public Safety
Police 20 9.9% 24,237
Fire 17 8.4% 20,602
Public Utilities
Water 11 5.4% 13,331
Sewer 5 2.5% 6,059
Solid Waste 5 2.5% 6,059
Building & Safety 16 7.9% 19,390
Recreation 22 10.9% 26,661
Public Works 43 21.3% 52,110
Engineering 36 17.8% 43,627
Neighborhood & Planning Services 27 13.4% 32,721
Total Direct Cost Programs 202 100% 244,798
7

DRAFT 1-9-14
INDIRECT PROGRAM COST ALLOCATION
Indirect Cost Program General Administration - City Manager
Budget 477,200
Base of Allocation Based on workload analysis
Base of Percent Cost
Direct Cost Program Allocation of Total Allocation
Public Safety
Police 10 10.0% 47,720
Fire 10 10.0% 47,720
Public Utilities
Water 10 10.0% 47,720
Sewer 10 10.0% 47,720
Solid Waste 5 5.0% 23,860
Building & Safety 10 10.0% 47,720
Recreation 10 10.0% 47,720
Public Works 15 15.0% 71,580
Engineering 5 5.0% 23,860
Neighborhood & Planning Services 15 15.0% 71,580
Total Direct Cost Programs 100 100% 477,200
8
DRAFT 1-9-14
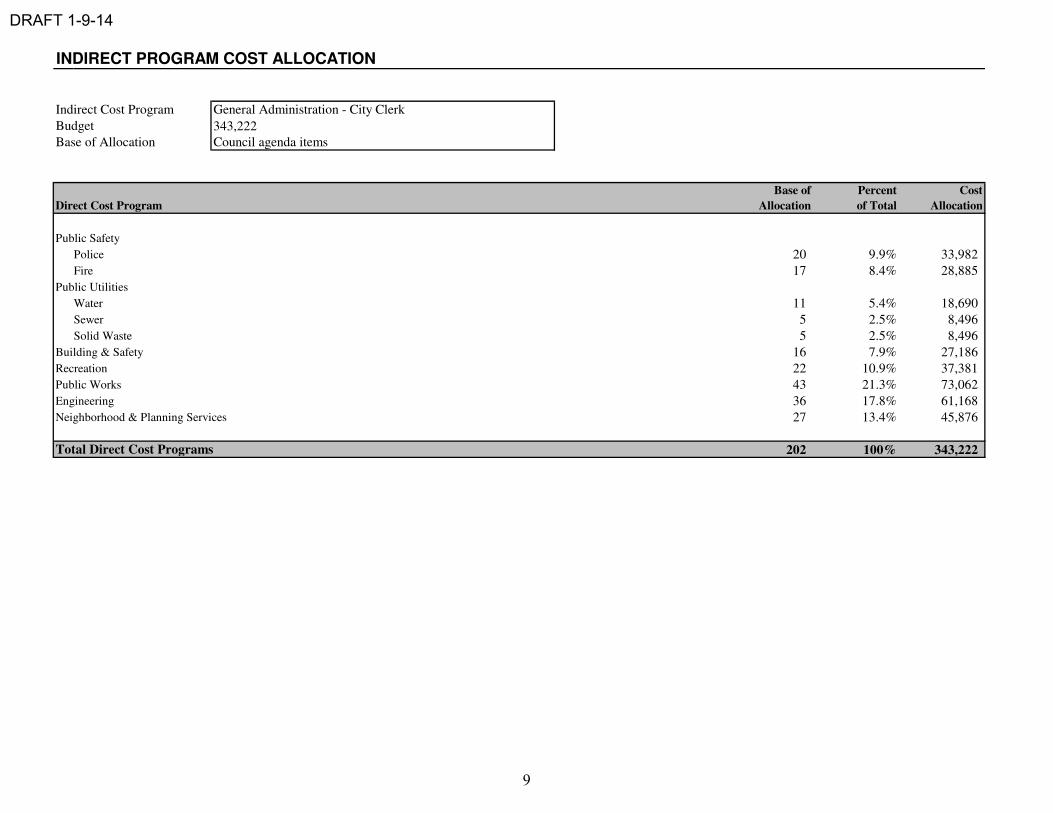
INDIRECT PROGRAM COST ALLOCATION
Indirect Cost Program General Administration - City Clerk
Budget 343,222
Base of Allocation Council agenda items
Base of Percent Cost
Direct Cost Program Allocation of Total Allocation
Public Safety
Police 20 9.9% 33,982
Fire 17 8.4% 28,885
Public Utilities
Water 11 5.4% 18,690
Sewer 5 2.5% 8,496
Solid Waste 5 2.5% 8,496
Building & Safety 16 7.9% 27,186
Recreation 22 10.9% 37,381
Public Works 43 21.3% 73,062
Engineering 36 17.8% 61,168
Neighborhood & Planning Services 27 13.4% 45,876
Total Direct Cost Programs 202 100% 343,222
9

DRAFT 1-9-14
INDIRECT PROGRAM COST ALLOCATION
Indirect Cost Program General Administration - City Attorney
Budget 723,816
Base of Allocation Based on workload analysis
Base of Percent Cost
Direct Cost Program Allocation of Total Allocation
Public Safety
Police 6 6.0% 43,429
Fire 6 6.0% 43,429
Public Utilities
Water 6 6.0% 43,429
Sewer 6 6.0% 43,429
Solid Waste 6 6.0% 43,429
Building & Safety 6 6.0% 43,429
Recreation 9 9.0% 65,143
Public Works 6 6.0% 43,429
Engineering 15 15.0% 108,572
Neighborhood & Planning Services 34 34.0% 246,097
Total Direct Cost Programs 100 100% 723,816
10

DRAFT 1-9-14
INDIRECT PROGRAM COST ALLOCATION
Indirect Cost Program General Administration - Human Resources
Budget 926,175
Base of Allocation Full-time equivalent staffing
Base of Percent Cost
Direct Cost Program Allocation of Total Allocation
Public Safety
Police 105.00 38.5% 356,548
Fire 60.00 22.0% 203,742
Public Utilities
Water 17.37 6.4% 58,983
Sewer 13.73 5.0% 46,623
Solid Waste 1.10 0.4% 3,735
Building & Safety 17.00 6.2% 57,727
Recreation 12.75 4.7% 43,295
Public Works 23.30 8.5% 79,120
Engineering 12.00 4.4% 40,748
Neighborhood & Planning Services 10.50 3.8% 35,655
Total Direct Cost Programs 272.75 100% 926,175
11

DRAFT 1-9-14
INDIRECT PROGRAM COST ALLOCATION
Indirect Cost Program General Liability
Budget 463,000
Base of Allocation Full-time equivalent staffing
Base of Percent Cost
Direct Cost Program Allocation of Total Allocation
Public Safety
Police 105.00 38.5% 178,240
Fire 60.00 22.0% 101,852
Public Utilities
Water 17.37 6.4% 29,486
Sewer 13.73 5.0% 23,307
Solid Waste 1.10 0.4% 1,867
Building & Safety 17.00 6.2% 28,858
Recreation 12.75 4.7% 21,643
Public Works 23.30 8.5% 39,552
Engineering 12.00 4.4% 20,370
Neighborhood & Planning Services 10.50 3.8% 17,824
Total Direct Cost Programs 272.75 100% 463,000
12

DRAFT 1-9-14
INDIRECT PROGRAM COST ALLOCATION
Indirect Cost Program Financial Services
Budget 2,113,110
Base of Allocation Operating budget
Base of Percent Cost
Direct Cost Program Allocation of Total Allocation
Public Safety
Police 22,503,737$ 28.0% 591,095
Fire 15,281,487 19.0% 401,391
Public Utilities
Water 19,276,716 24.0% 506,332
Sewer 9,179,279 11.4% 241,108
Solid Waste 619,457 0.8% 16,271
Building & Safety 2,960,160 3.7% 77,753
Recreation 3,386,714 4.2% 88,957
Public Works 3,084,277 3.8% 81,013
Engineering 1,820,377 2.3% 47,815
Neighborhood & Planning Services 2,336,634 2.9% 61,375
Total Direct Cost Programs 80,448,839$ 100% 2,113,110
13

DRAFT 1-9-14
INDIRECT PROGRAM COST ALLOCATION
Indirect Cost Program Information Technology - Citywide Support
Budget 1,999,708
Base of Allocation Full-time equivalent staffing
Base of Percent Cost
Direct Cost Program Allocation of Total Allocation
Public Safety
Police 105.00 38.5% 769,823
Fire 60.00 22.0% 439,899
Public Utilities
Water 17.37 6.4% 127,351
Sewer 13.73 5.0% 100,664
Solid Waste 1.10 0.4% 8,065
Building & Safety 17.00 6.2% 124,638
Recreation 12.75 4.7% 93,479
Public Works 23.30 8.5% 170,827
Engineering 12.00 4.4% 87,980
Neighborhood & Planning Services 10.50 3.8% 76,982
Total Direct Cost Programs 272.75 100% 1,999,708
14

DRAFT 1-9-14
INDIRECT PROGRAM COST ALLOCATION
Indirect Cost Program Information Technology - Telephones
Budget 223,000
Base of Allocation Assigned number of phones
Base of Percent Cost
Direct Cost Program Allocation of Total Allocation
Public Safety
Police 95 43.4% 96,735
Fire 17 7.8% 17,311
Public Utilities
Water 11 5.0% 11,201
Sewer 11 5.0% 11,201
Solid Waste 1 0.5% 1,018
Building & Safety 17 7.8% 17,311
Recreation 21 9.6% 21,384
Public Works 17 7.8% 17,311
Engineering 15 6.8% 15,274
Neighborhood & Planning Services 14 6.4% 14,256
Total Direct Cost Programs 219 100% 223,000
15

DRAFT 1-9-14
INDIRECT PROGRAM COST ALLOCATION
Indirect Cost Program Information Technology - Cell Phones
Budget 27,000
Base of Allocation Assigned cell phones
Base of Percent Cost
Direct Cost Program Allocation of Total Allocation
Public Safety
Police 11 12.8% 3,453
Fire 9 10.5% 2,826
Public Utilities
Water 7 8.1% 2,198
Sewer 8 9.3% 2,512
Solid Waste
Building & Safety 17 19.8% 5,337
Recreation 7 8.1% 2,198
Public Works 20 23.3% 6,279
Engineering 5 5.8% 1,570
Neighborhood & Planning Services 2 2.3% 628
Total Direct Cost Programs 86 100% 27,000
16

DRAFT 1-9-14
INDIRECT PROGRAM COST ALLOCATION
Indirect Cost Program Retiree Medical Reserve and Other Non-Department Salaries & Benefits
Budget 2,981,600
Base of Allocation Operating budget
Base of Percent Cost
Direct Cost Program Allocation of Total Allocation
Public Safety
Police 22,503,737$ 28.0% 834,035
Fire 15,281,487 19.0% 566,363
Public Utilities
Water 19,276,716 24.0% 714,435
Sewer 9,179,279 11.4% 340,203
Solid Waste 619,457 0.8% 22,958
Building & Safety 2,960,160 3.7% 109,710
Recreation 3,386,714 4.2% 125,519
Public Works 3,084,277 3.8% 114,310
Engineering 1,820,377 2.3% 67,467
Neighborhood & Planning Services 2,336,634 2.9% 86,600
Total Direct Cost Programs 80,448,839$ 100% 2,981,600
17

DRAFT 1-9-14
INDIRECT PROGRAM COST ALLOCATION
Indirect Cost Program Leave Cashout
Budget 642,258
Base of Allocation Based on actual experience
Base of Percent Cost
Direct Cost Program Allocation of Total Allocation
Public Safety
Police 1,242,563$ 44.3% 284,229
Fire 878,916 31.3% 201,047
Public Utilities
Water 71,671 2.6% 16,394
Sewer 57,145 2.0% 13,072
Solid Waste
Building & Safety 93,818 3.3% 21,460
Recreation 125,462 4.5% 28,699
Public Works 214,518 7.6% 49,070
Engineering 106,273 3.8% 24,309
Neighborhood & Planning Services 17,389 0.6% 3,978
Total Direct Cost Programs 2,807,756$ 100% 642,258
18

DRAFT 1-9-14
INDIRECT PROGRAM COST ALLOCATION
Indirect Cost Program Audit Fees
Budget 90,600
Base of Allocation Operating budget
Base of Percent Cost
Direct Cost Program Allocation of Total Allocation
Public Safety
Police 22,503,737$ 28.0% 25,343
Fire 15,281,487 19.0% 17,210
Public Utilities
Water 19,276,716 24.0% 21,709
Sewer 9,179,279 11.4% 10,338
Solid Waste 619,457 0.8% 698
Building & Safety 2,960,160 3.7% 3,334
Recreation 3,386,714 4.2% 3,814
Public Works 3,084,277 3.8% 3,473
Engineering 1,820,377 2.3% 2,050
Neighborhood & Planning Services 2,336,634 2.9% 2,631
Total Direct Cost Programs 80,448,839$ 100% 90,600
19

DRAFT 1-9-14
INDIRECT PROGRAM COST ALLOCATION
Indirect Cost Program Uncollectible Accounts/Collection Fee
Budget 17,000
Base of Allocation Based on prior three fiscal years actual experience
Base of Percent Cost
Direct Cost Program Allocation of Total Allocation
Public Safety
Police 9,019$ 8.8% 1,500
Fire 14,779 14.5% 2,458
Public Utilities
Water
Sewer
Solid Waste
Building & Safety
Recreation 4,386 4.3% 729
Public Works 3,394 3.3% 564
Engineering 63,588 62.2% 10,575
Neighborhood & Planning Services 7,056 6.9% 1,173
Total Direct Cost Programs 102,222$ 100% 17,000
20

DRAFT 1-9-14
INDIRECT PROGRAM COST ALLOCATION
Indirect Cost Program Contingent Reserve
Budget 328,000
Base of Allocation Operating budget
Base of Percent Cost
Direct Cost Program Allocation of Total Allocation
Public Safety
Police 22,503,737$ 28.0% 91,751
Fire 15,281,487 19.0% 62,305
Public Utilities
Water 19,276,716 24.0% 78,594
Sewer 9,179,279 11.4% 37,425
Solid Waste 619,457 0.8% 2,526
Building & Safety 2,960,160 3.7% 12,069
Recreation 3,386,714 4.2% 13,808
Public Works 3,084,277 3.8% 12,575
Engineering 1,820,377 2.3% 7,422
Neighborhood & Planning Services 2,336,634 2.9% 9,527
Total Direct Cost Programs 80,448,839$ 100% 328,000
21

DRAFT 1-9-14
INDIRECT PROGRAM COST ALLOCATION
Indirect Cost Program Contractual Services
Budget 116,800
Base of Allocation Operating budget
Base of Percent Cost
Direct Cost Program Allocation of Total Allocation
Public Safety
Police 22,503,737$ 28.0% 32,672
Fire 15,281,487 19.0% 22,186
Public Utilities
Water 19,276,716 24.0% 27,987
Sewer 9,179,279 11.4% 13,327
Solid Waste 619,457 0.8% 899
Building & Safety 2,960,160 3.7% 4,298
Recreation 3,386,714 4.2% 4,917
Public Works 3,084,277 3.8% 4,478
Engineering 1,820,377 2.3% 2,643
Neighborhood & Planning Services 2,336,634 2.9% 3,392
Total Direct Cost Programs 80,448,839$ 100% 116,800
22

DRAFT 1-9-14
INDIRECT PROGRAM COST ALLOCATION
Indirect Cost Program Facilities Maintenance
Budget 1,933,134
Base of Allocation Assigned square footage
Base of Percent Cost
Direct Cost Program Allocation of Total Allocation
Public Safety
Police 59,636 21.6% 418,174
Fire 42,181 15.3% 295,778
Public Utilities
Water 20,923 7.6% 146,713
Sewer 15,106 5.5% 105,924
Solid Waste 459 0.2% 3,221
Building & Safety 3,950 1.4% 27,698
Recreation 97,182 35.3% 681,451
Public Works 26,406 9.6% 185,165
Engineering 5,011 1.8% 35,141
Neighborhood & Planning Services 4,830 1.8% 33,868
Total Direct Cost Programs 275,685 100% 1,933,134
23

DRAFT 1-9-14
INDIRECT PROGRAM COST ALLOCATION
Indirect Cost Program Utilities
Budget 2,297,046
Base of Allocation Assigned square footage
Base of Percent Cost
Direct Cost Program Allocation of Total Allocation
Public Safety
Police 59,636 21.6% 496,896
Fire 42,181 15.3% 351,458
Public Utilities
Water 20,923 7.6% 174,332
Sewer 15,106 5.5% 125,865
Solid Waste 459 0.2% 3,828
Building & Safety 3,950 1.4% 32,912
Recreation 97,182 35.3% 809,734
Public Works 26,406 9.6% 220,022
Engineering 5,011 1.8% 41,756
Neighborhood & Planning Services 4,830 1.8% 40,244
Total Direct Cost Programs 275,685 100% 2,297,046
24

DRAFT 1-9-14
INDIRECT PROGRAM COST ALLOCATION
Indirect Cost Program Buildings and Building Improvements Amortization
Budget 1,445,748
Base of Allocation Full-time equivalent staffing
Base of Percent Cost
Direct Cost Program Allocation of Total Allocation
Public Safety
Police 105.00 38.5% 556,567
Fire 60.00 22.0% 318,038
Public Utilities
Water 17.37 6.4% 92,072
Sewer 13.73 5.0% 72,778
Solid Waste 1.10 0.4% 5,831
Building & Safety 17.00 6.2% 90,111
Recreation 12.75 4.7% 67,583
Public Works 23.30 8.5% 123,505
Engineering 12.00 4.4% 63,608
Neighborhood & Planning Services 10.50 3.8% 55,657
Total Direct Cost Programs 272.75 100% 1,445,748
25

DRAFT 1-9-14
HOURLY LABOR RATES - POLICE
Citywide Department
Operations
Patrol Officer 119,074 60.6% 191,252 17,280 208,533 1,848 112.84 21.7% 22.8% 168.60
Police Officer 129,160 60.6% 207,452 17,280 224,732 1,848 121.61 21.7% 22.8% 181.69
Police Sergeant 163,496 60.6% 262,602 17,280 279,882 1,848 151.45 21.7% 22.8% 226.28
Police Lieutenant 195,936 60.6% 314,706 17,280 331,986 1,848 179.65 21.7% 22.8% 268.41
Support
Chief of Police 215,878 49.6% 322,927 17,280 340,207 1,744 195.07 21.7% 237.43
Police Commander 157,698 49.6% 235,897 17,280 253,177 1,744 145.17 21.7% 176.69
Communication Dispatch Supervisor 122,480 49.2% 182,739 17,280 200,019 1,848 108.24 21.7% 131.74
Communication Dispatcher 106,982 49.2% 159,616 17,280 176,896 1,848 95.72 21.7% 116.51
Police Property Clerk 86,940 49.2% 129,713 17,280 146,994 1,744 84.29 21.7% 102.59
Police Clerk Supervisor 94,624 49.2% 141,178 17,280 158,458 1,744 90.86 21.7% 110.59
Police Clerk 79,894 49.2% 119,201 17,280 136,481 1,744 78.26 21.7% 95.25
Executive Secretary 94,308 42.6% 134,477 17,280 151,757 1,744 87.02 21.7% 105.91
Office Assistant 60,768 42.6% 86,651 17,280 103,931 1,744 59.59 21.7% 72.53
Chargeable Hours Paid Benefit Rate Sworn Operations Management Office
Total Hours 2,080 PERS 32.9% 21.1% 25.9% 8.5%
Non-Chargeable Hours Medicare 1.5% 1.5% 1.5% 1.5%
Training (16) Group Insurance 14.7% 20.1% 10.7% 26.1%
Vacations2 (168) Retiree Medical Reserve 6.0% 6.0% 6.0% 6.0%
Sick (12 days @ 50% usage) (48) Worker's Compensation 5.5% 0.5% 5.5% 0.5%
Holidays3 (13 days) (104) Total Paid Benefit Rate 60.6% 49.2% 49.6% 42.6%
Total Chargeable Hours 1,744
Indirect Cost Allocation Amount Percent Services & Supplies
Citywide Indirect Costs 4,886,430 21.7% Total Budgeted 1,763,611
Total Funded FTE 102.1
Operations Services & Supplies Per FTE 17,280
Salaries and Benefits 17,093,582
Supplies and Contractual Services 1,365,131 NOTE:
Total Operations 18,458,713 1, 3
Support4
Salaries and Benefits 3,801,669
Supplies and Contractual Services 398,480
Total Support 4,200,149 22.8% 2
Total Program Costs 22,658,862 4 Based on workload analysis, allocate 21% Communication Dispatch to Fire Department.
Hourly Billing
Rate
Annual salary amount includes Supplemental Pay such as longevity ranging from 3% to 15.1% over
base pay and educational incentive of 5% or 7.5% for employees that hold POST certificates.
Uniform Allowance of $1,350, Holiday in Lieu pay of 6% for employees that do not have City
holiday leave, Motorcycle and SWAT each at 5% over base pay are also included in the annual
salary amount.
Indirect Cost Rate
Annual Salary1 Paid Benefit
Rate
Services &
Supplies Per
FTE
Total Cost Per
FTE
Chargeable
Hours3 Hourly Rate
Total
Compensation
Vacation accrual rate varies depending on years of service. As of 7/1/13, average vacation hours of
Police was 168 hours.
26
DRAFT 1-9-14
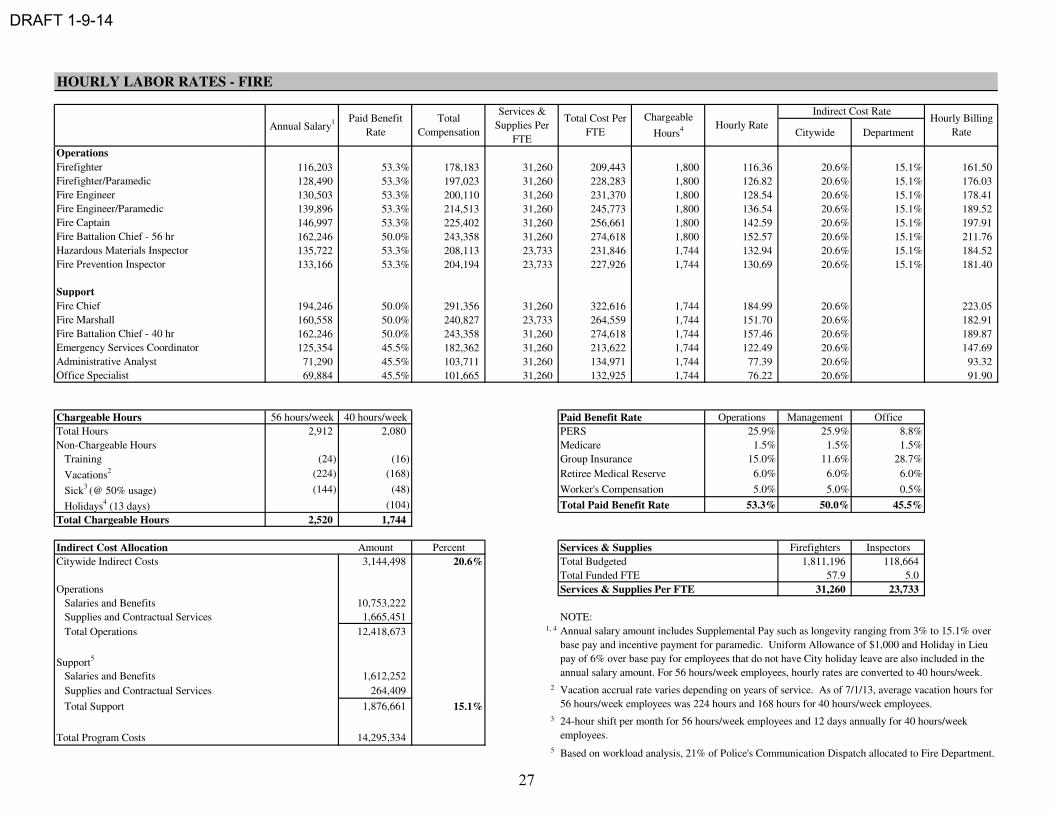
HOURLY LABOR RATES - FIRE
Citywide Department
Operations
Firefighter 116,203 53.3% 178,183 31,260 209,443 1,800 116.36 20.6% 15.1% 161.50
Firefighter/Paramedic 128,490 53.3% 197,023 31,260 228,283 1,800 126.82 20.6% 15.1% 176.03
Fire Engineer 130,503 53.3% 200,110 31,260 231,370 1,800 128.54 20.6% 15.1% 178.41
Fire Engineer/Paramedic 139,896 53.3% 214,513 31,260 245,773 1,800 136.54 20.6% 15.1% 189.52
Fire Captain 146,997 53.3% 225,402 31,260 256,661 1,800 142.59 20.6% 15.1% 197.91
Fire Battalion Chief - 56 hr 162,246 50.0% 243,358 31,260 274,618 1,800 152.57 20.6% 15.1% 211.76
Hazardous Materials Inspector 135,722 53.3% 208,113 23,733 231,846 1,744 132.94 20.6% 15.1% 184.52
Fire Prevention Inspector 133,166 53.3% 204,194 23,733 227,926 1,744 130.69 20.6% 15.1% 181.40
Support
Fire Chief 194,246 50.0% 291,356 31,260 322,616 1,744 184.99 20.6% 223.05
Fire Marshall 160,558 50.0% 240,827 23,733 264,559 1,744 151.70 20.6% 182.91
Fire Battalion Chief - 40 hr 162,246 50.0% 243,358 31,260 274,618 1,744 157.46 20.6% 189.87
Emergency Services Coordinator 125,354 45.5% 182,362 31,260 213,622 1,744 122.49 20.6% 147.69
Administrative Analyst 71,290 45.5% 103,711 31,260 134,971 1,744 77.39 20.6% 93.32
Office Specialist 69,884 45.5% 101,665 31,260 132,925 1,744 76.22 20.6% 91.90
Chargeable Hours 56 hours/week 40 hours/week Paid Benefit Rate Operations Management Office
Total Hours 2,912 2,080 PERS 25.9% 25.9% 8.8%
Non-Chargeable Hours Medicare 1.5% 1.5% 1.5%
Training (24) (16) Group Insurance 15.0% 11.6% 28.7%
Vacations2 (224) (168) Retiree Medical Reserve 6.0% 6.0% 6.0%
Sick3 (@ 50% usage) (144) (48) Worker's Compensation 5.0% 5.0% 0.5%
Holidays4 (13 days) (104) Total Paid Benefit Rate 53.3% 50.0% 45.5%
Total Chargeable Hours 2,520 1,744
Indirect Cost Allocation Amount Percent Services & Supplies Firefighters Inspectors
Citywide Indirect Costs 3,144,498 20.6% Total Budgeted 1,811,196 118,664
Total Funded FTE 57.9 5.0
Operations Services & Supplies Per FTE 31,260 23,733
Salaries and Benefits 10,753,222
Supplies and Contractual Services 1,665,451 NOTE:
Total Operations 12,418,673 1, 4
Support5
Salaries and Benefits 1,612,252
Supplies and Contractual Services 264,409 2
Total Support 1,876,661 15.1%3
Total Program Costs 14,295,3345 Based on workload analysis, 21% of Police's Communication Dispatch allocated to Fire Department.
Chargeable
Hours4 Hourly Rate
Indirect Cost RatePaid Benefit
Rate
Total
Compensation
Services &
Supplies Per
FTE
Total Cost Per
FTEAnnual Salary
1
Annual salary amount includes Supplemental Pay such as longevity ranging from 3% to 15.1% over
base pay and incentive payment for paramedic. Uniform Allowance of $1,000 and Holiday in Lieu
pay of 6% over base pay for employees that do not have City holiday leave are also included in the
annual salary amount. For 56 hours/week employees, hourly rates are converted to 40 hours/week.
Vacation accrual rate varies depending on years of service. As of 7/1/13, average vacation hours for
56 hours/week employees was 224 hours and 168 hours for 40 hours/week employees.
24-hour shift per month for 56 hours/week employees and 12 days annually for 40 hours/week
employees.
Hourly Billing
Rate
27

DRAFT 1-9-14
HOURLY LABOR RATES - BUILDING AND SAFETY
Citywide Department
Operations
Electrical Building Inspector 97,700 35.6% 132,497 13,809 146,306 1,744 83.89 25.4% 31.5% 138.33
Building/NP Inspector 102,584 35.6% 139,121 13,809 152,930 1,744 87.69 25.4% 31.5% 144.59
Senior Building Inspector 118,482 35.6% 160,681 13,809 174,490 1,744 100.05 25.4% 31.5% 164.97
Public Work Inspector 102,584 35.6% 139,121 13,809 152,930 1,744 87.69 25.4% 31.5% 144.59
Plan Checker 102,584 35.6% 139,121 13,809 152,930 1,744 87.69 25.4% 31.5% 144.59
Plan Check Engineer 119,832 35.6% 162,512 13,809 176,321 1,744 101.10 25.4% 31.5% 166.70
Building Permit Technician 75,664 35.6% 102,613 13,809 116,422 1,744 66.76 25.4% 31.5% 110.07
Support
Chief Building Official 165,900 34.3% 222,821 13,809 236,630 1,744 135.68 25.4% 170.10
Permit Center Manager 133,432 39.5% 186,116 13,809 199,925 1,744 114.64 25.4% 143.72
Office Specialist 69,884 39.5% 97,477 13,809 111,286 1,744 63.81 25.4% 80.00
Office Assistant 60,768 39.5% 84,761 13,809 98,570 1,744 56.52 25.4% 70.86
Chargeable Hours Paid Benefit Rate Operations Management Support
Total Hours 2,080 PERS 8.2% 14.1% 8.5%
Non-Chargeable Hours Medicare 1.5% 1.5% 1.5%
Training (16) Group Insurance 19.5% 12.2% 23.0%
Vacations2 (168) Retiree Medical Reserve 6.0% 6.0% 6.0%
Sick (12 days @ 50% usage) (48) Worker's Compensation 0.5% 0.5% 0.5%
Holidays (104) Total Paid Benefit Rate 35.6% 34.3% 39.5%
Total Chargeable Hours 1,744
Indirect Cost Allocation Amount Percent Services & Supplies
Citywide Indirect Costs 750,939 25.4% Total Budgeted 234,753
Total Funded FTE 17.0
Operations Services & Supplies Per FTE 13,809
Salaries and Benefits 1,853,100
Supplies and Contractual Services 179,517 NOTE:
Total Operations 2,032,617 1
Support 2
Salaries and Benefits 585,494
Supplies and Contractual Services 55,236
Total Support 640,730 31.5%
Total Program Costs 2,673,347
Hourly Billing
Rate
Indirect Cost RateTotal Cost Per
FTE
Chargeable
HoursAnnual Salary
1 Paid Benefit
Rate
Total
Compensation
Services &
Supplies Per
FTE
Hourly Rate
Annual salary amount includes Bilingual premium of 2.5% over base pay and $900/year in deferred
compensation contribution for employees that qualified.
Vacation accrual rate varies depending on years of service. As of 7/1/13, average vacation hours of
Building and Safety was 168 hours.
28

DRAFT 1-9-14
HOURLY LABOR RATES - PUBLIC WORKS
Citywide Department
Operations
Maintenance Worker II 57,124 64.0% 93,664 13,078 106,742 1,598 66.82 43.7% 12.0% 107.51
Maintenance Worker III 64,982 64.0% 106,548 13,078 119,626 1,598 74.88 43.7% 12.0% 120.48
Equipment Maintenance Worker II 72,014 64.0% 118,079 13,078 131,157 1,598 82.10 43.7% 12.0% 132.10
Equipment Maintenance Worker III 79,472 64.0% 130,307 13,078 143,385 1,598 89.75 43.7% 12.0% 144.41
Fleet Maintenance Worker II 67,506 64.0% 110,687 13,078 123,765 1,598 77.47 43.7% 12.0% 124.65
Fleet Maintenance Worker III 78,062 64.0% 127,995 13,078 141,073 1,598 88.31 43.7% 12.0% 142.08
Maintenance Custodian II 53,044 64.0% 86,974 13,078 100,052 1,598 62.63 43.7% 12.0% 100.77
Maintenance Custodian III 60,178 64.0% 98,671 13,078 111,749 1,598 69.95 43.7% 12.0% 112.55
Assistant Water Operator 73,526 64.0% 120,558 13,078 133,636 1,598 83.65 43.7% 12.0% 134.59
Water System Operator 78,674 64.0% 128,999 13,078 142,077 1,598 88.94 43.7% 12.0% 143.09
Support
Public Works Director 186,444 35.9% 253,450 13,078 266,528 1,744 152.82 43.7% 219.58
Public Works Manager 106,261 35.9% 144,450 13,078 157,528 1,744 90.32 43.7% 129.78
Office Assistant 60,768 49.5% 90,854 13,078 103,932 1,744 59.59 43.7% 85.63
Chargeable Hours 40 hour/week 37.5 hour/week Paid Benefit Rate Operations Management Office
Total Hours 2,080 1,950 PERS 21.1% 14.1% 8.2%
Non-Chargeable Hours Medicare 1.5% 1.5% 1.5%
Training (16) (15) Group Insurance 31.4% 13.8% 33.3%
Vacations2 (168) (195) Retiree Medical Reserve 6.0% 6.0% 6.0%
Sick3 (@ 50% usage) (48) (45) Worker's Compensation 4.0% 0.5% 0.5%
Holidays (104) (98) Total Paid Benefit Rate 64.0% 35.9% 49.5%
Total Chargeable Hours 1,744 1,598
Services & Supplies
Indirect Cost Allocation Amount Percent Total Budgeted4 523,120
Citywide Indirect Costs 1,347,446 43.7% Total Funded FTE 40.0
Services & Supplies Per FTE 13,078
Operations
Salaries and Benefits 3,891,278 NOTE:
Supplies and Contractual Services 483,886 1
Total Operations 4,375,164
Support
Salaries and Benefits 484,762 2
Supplies and Contractual Services 39,234
Total Support 523,996 12.0% 3 3.46 hours biweekly for 37.5 hours/week employees and 3.69 hours for 40 hours/week employees.4
Total Program Costs 4,899,160
Hourly Billing
Rate
Indirect Cost Rate
Annual Salary1 Paid Benefit
Rate
Total
Compensation
Services &
Supplies Per
FTE
Excludes 1) outsourced maintenance services; 2) direct charges to LLMD, CFD, Water and Sewer
funds; and 3) Fleet and Facilities Maintenance costs have been allocated and accounted for in
respective direct cost programs and Citywide Indirect Costs.
Vacation accrual rate varies depending on years of service. As of 7/1/13, average vacation hours for
40 hours/week employees was 168 hours and 195 hours for 37.5 hours/week employees.
Annual salary amount includes Supplemental Pay such as longevity ranging from 0.5% to 1.5% over
base pay and incentive payment of 4% for special certificates/licenses. Bilingual premium of 2.5%
over base pay and $900/year in deferred compensation contribution for employees that qualified are
also included.
Total Cost Per
FTE
Chargeable
HoursHourly Rate
29

DRAFT 1-9-14
HOURLY LABOR RATES - ENGINEERING
Citywide Department
Operations
Engineering Aide 84,054 34.0% 112,663 18,958 131,621 1,744 75.47 38.8% 38.2% 144.70
Assistant Civil Engineer 105,702 34.0% 141,679 18,958 160,637 1,744 92.11 38.8% 38.2% 176.60
Associate Civil Engineer 121,558 34.0% 162,931 18,958 181,890 1,744 104.29 38.8% 38.2% 199.96
Traffic Engineer 140,278 34.0% 188,023 18,958 206,981 1,744 118.68 38.8% 38.2% 227.55
Principal Civil Engineer 140,278 34.0% 188,023 18,958 206,981 1,744 118.68 38.8% 38.2% 227.55
Support
Assistant City Engineer 149,820 36.1% 203,844 18,958 222,802 1,744 127.75 38.8% 177.30
CIP Manager 140,366 36.1% 190,981 18,958 209,939 1,744 120.38 38.8% 167.06
Public Information Specialist 98,366 36.1% 133,836 18,958 152,794 1,744 87.61 38.8% 121.59
Administrative Analyst 98,356 38.5% 136,256 18,958 155,214 1,744 89.00 38.8% 123.51
Secretary 94,156 38.5% 130,438 18,958 149,396 1,744 85.66 38.8% 118.88
Office Specialist 69,884 38.5% 96,813 18,958 115,771 1,744 66.38 38.8% 92.13
Chargeable Hours Paid Benefit Rate Operations Support Office
Total Hours 2,080 PERS 8.2% 14.1% 8.5%
Non-Chargeable Hours Medicare 1.5% 1.5% 1.5%
Training (16) Group Insurance 17.9% 13.9% 22.0%
Vacations2 (168) Retiree Medical Reserve 6.0% 6.0% 6.0%
Sick (12 days @ 50% usage) (48) Worker's Compensation 0.5% 0.5% 0.5%
Holidays (104) Total Paid Benefit Rate 34.0% 36.1% 38.5%
Total Chargeable Hours 1,744
Indirect Cost Allocation Amount Percent Services & Supplies
Citywide Indirect Costs 705,956 38.8% Total Budgeted3 398,121
Total Funded FTE 21.0
Operations Services & Supplies Per FTE 18,958
Salaries and Benefits 2,274,475
Supplies and Contractual Services 265,414 NOTE:
Total Operations 2,539,889 1
Support3 2
Salaries and Benefits 857,169
Supplies and Contractual Services 111,853 3
Total Support 969,022 38.2%
Total Program Costs 3,508,911
Hourly Billing
RateHourly RateAnnual Salary
1 Paid Benefit
Rate
Total
Compensation
Services &
Supplies Per
FTE
Excludes 1) contractual services for VTA; and 2) direct charges to LLMD, Water, Sewer and Solid
Waste funds.
Indirect Cost Rate
Vacation accrual rate varies depending on years of service. As of 7/1/13, average vacation hours of
Engineering was 168 hours.
Total Cost Per
FTE
Chargeable
Hours
Annual salary amount includes deferred compensation contribution of $900/year and Bilingual
premium of 2.5% over base pay for employees that qualified.
30

DRAFT 1-9-14
HOURLY LABOR RATES - PLANNING & NEIGHBORHOOD SERVICES
Citywide Department
Operations
Assistant Planner 95,702 35.5% 129,707 28,774 158,481 1,744 90.87 36.0% 28.8% 159.13
Senior Planner 124,146 35.5% 168,258 28,774 197,032 1,744 112.98 36.0% 28.8% 197.84
Principal Planner 135,642 35.5% 183,839 28,774 212,612 1,744 121.91 36.0% 28.8% 213.49
Housing Neighborhood Specialist 81,682 35.5% 110,706 28,774 139,479 1,744 79.98 36.0% 28.8% 140.05
Senior Housing Specialist 97,014 35.5% 131,485 28,774 160,259 1,744 91.89 36.0% 28.8% 160.92
Support
Planning & Neighborhood Svcs Director 165,900 34.3% 222,821 28,774 251,594 1,744 144.26 36.0% 196.13
Office Specialist 69,884 45.2% 101,448 28,774 130,221 1,744 74.67 36.0% 101.51
Chargeable Hours Paid Benefit Rate Operations Management Office
Total Hours 2,080 PERS 8.2% 14.1% 8.2%
Non-Chargeable Hours Medicare 1.5% 1.5% 1.5%
Training (16) Group Insurance 19.4% 12.2% 29.0%
Vacations2 (168) Retiree Medical Reserve 6.0% 6.0% 6.0%
Sick (12 days @ 50% usage) (48) Worker's Compensation 0.5% 0.5% 0.5%
Holidays (104) Total Paid Benefit Rate 35.5% 34.3% 45.2%
Total Chargeable Hours 1,744
Indirect Cost Allocation Amount Percent Services & Supplies
Citywide Indirect Costs 840,066 36.0% Total Budgeted3 287,736
Total Funded FTE 10.0
Operations Services & Supplies Per FTE 28,774
Salaries and Benefits 1,126,200
Supplies and Contractual Services 230,189 NOTE:
Total Operations 1,356,389 1
Support 2
Salaries and Benefits 333,216
Supplies and Contractual Services 57,547 2
Total Support 390,763 28.8%
Total Program Costs 1,747,152
Hourly Billing
Rate
Chargeable
HoursHourly Rate
Indirect Cost Rate
Annual Salary1 Paid Benefit
Rate
Total
Compensation
Services &
Supplies Per
FTE
Total Cost Per
FTE
Annual salary amount includes deferred compensation contribution of $900/year and Bilingual
premium of 2.5% over base pay for employees that qualified.
Vacation accrual rate varies depending on years of service. As of 7/1/13, average vacation hours of
Planning & Neighborhood Services was 168 hours.
Excludes CDBG grants and contract with City of San Jose for animal control services.
31

DRAFT 1-9-14
HOURLY LABOR RATES - RECREATION SERVICES
Citywide Department
Operations
Recreation Services I 35,913 45.1% 52,103 29,286 81,388 1,744 46.67 64.5% 9.6% 84.11
Recreation Services IV 58,226 45.1% 84,474 29,286 113,760 1,744 65.23 64.5% 9.6% 117.56
Public Services Assistant II 69,884 45.1% 101,388 29,286 130,674 1,744 74.93 64.5% 9.6% 135.04
Program Coordinator 82,480 45.1% 119,662 29,286 148,948 1,744 85.41 64.5% 9.6% 153.92
Recreation Services Supervisor4 98,366 40.2% 137,873 29,286 167,159 1,744 95.85 64.5% 157.66
Support
Recreation Services Supervisor4 98,366 40.2% 137,873 29,286 167,159 1,744 95.85 64.5% 157.66
Chargeable Hours Paid Benefit Rate Operations Support
Total Hours 2,080 PERS 8.2% 8.8%
Non-Chargeable Hours Medicare 1.5% 1.5%
Training (16) Group Insurance 28.4% 23.3%
Vacations2 (168) Retiree Medical Reserve 6.0% 6.0%
Sick (12 days @ 50% usage) (48) Worker's Compensation 1.0% 0.5%
Holidays (104) Total Paid Benefit Rate 45.1% 40.2%
Total Chargeable Hours 1,744
Indirect Cost Allocation Amount Percent Services & Supplies
Citywide Indirect Costs 2,184,115 64.5% Total Budgeted3 373,393
Total Funded FTE 12.8
Operations Services & Supplies Per FTE 29,286
Salaries and Benefits 1,221,479
Supplies and Contractual Services 344,107 NOTE:
Total Operations 1,565,586 1
Support4 2
Salaries and Benefits 120,449
Supplies and Contractual Services 29,286 3 Excludes Nutrition Meals for seniors, instructor fees for classes, and Elan Espirit Preschool.
Total Support 149,735 9.6% 4 Based on workload analysis, 50% of Recreation Services Supervisor is for Operation Support.
Total Program Costs 1,715,321
Hourly Billing
Rate
Indirect Cost Rate
Annual Salary1 Paid Benefit
Rate
Total
Compensation
Services &
Supplies Per
FTE
Vacation accrual rate varies depending on years of service. As of 7/1/13, average vacation hours of
Recreation Services was 168 hours.
Annual salary amount includes deferred compensation contribution of $900/year and Bilingual
premium of 2.5% over base pay for employees that qualified.
Total Cost Per
FTE
Chargeable
HoursHourly Rate
32

DRAFT 1-9-14
HOURLY LABOR RATES - GENERAL GOVERNMENT
Council Appointed
City Manager 227,824 46.6% 334,054 334,054 1,744 191.54 21.6% 232.96
City Attorney 195,302 46.6% 286,368 286,368 1,744 164.20 21.6% 199.70
General and Administration
Accountant 94,794 38.7% 131,499 131,499 1,744 75.40 21.6% 91.70
Accounting Technician 76,882 38.7% 106,652 106,652 1,744 61.15 21.6% 74.37
Assistant City Attorney 158,900 34.1% 213,117 213,117 1,744 122.20 21.6% 148.62
Budget Manager 123,510 38.7% 171,334 171,334 1,744 98.24 21.6% 119.48
City Clerk 132,000 34.1% 177,039 177,039 1,744 101.51 21.6% 123.46
Confidential Fiscal Analyst II 75,596 38.7% 104,868 104,868 1,744 60.13 21.6% 73.13
Deputy City Clerk 95,971 34.1% 128,717 128,717 1,744 73.81 21.6% 89.76
Desktop Technician 84,092 38.7% 116,653 116,653 1,744 66.89 21.6% 81.35
Director of Financial Services 178,718 34.1% 239,697 239,697 1,744 137.44 21.6% 167.16
Director of Human Resources 165,900 34.1% 222,506 222,506 1,744 127.58 21.6% 155.17
Executive Secretary 96,600 38.7% 134,005 134,005 1,744 76.84 21.6% 93.45
Finance Manager 142,290 34.1% 190,840 190,840 1,744 109.43 21.6% 133.08
Financial Analyst II 98,356 38.7% 136,440 136,440 1,744 78.23 21.6% 95.15
Fiscal Assistant II 70,635 38.7% 97,986 97,986 1,744 56.18 21.6% 68.33
GIS Manager 133,252 38.7% 184,849 184,849 1,744 105.99 21.6% 128.91
Human Resources Technician 73,472 38.7% 101,921 101,921 1,744 58.44 21.6% 71.08
IS Operations Manager 153,020 38.7% 212,271 212,271 1,744 121.72 21.6% 148.03
IS Telecommunication Manager 133,262 38.7% 184,862 184,862 1,744 106.00 21.6% 128.92
Purchasing Agent 115,004 38.7% 159,535 159,535 1,744 91.48 21.6% 111.25
Senior Accountant 107,512 38.7% 149,142 149,142 1,744 85.52 21.6% 104.01
Senior Fiscal Analyst 76,872 38.7% 106,638 106,638 1,744 61.15 21.6% 74.37
Senior Human Resource Analyst 114,042 38.7% 158,200 158,200 1,744 90.71 21.6% 110.32
System Administrator 120,590 38.7% 167,284 167,284 1,744 95.92 21.6% 116.66
Video Media Specialist 98,366 38.7% 136,454 136,454 1,744 78.24 21.6% 95.16
Water Meter Reader II 54,913 38.7% 76,176 76,176 1,744 43.68 21.6% 53.12
Chargeable Hours Paid Benefit RateCouncil
AppointedManagement Support
Total Hours 2,080 PERS 29.1% 14.1% 8.5%
Non-Chargeable Hours Medicare 1.5% 1.5% 1.5%
Training (16) Group Insurance 9.6% 13.0% 22.2%
Vacations2 (168) Retiree Medical Reserve 6.0% 5.0% 6.0%
Sick (12 days @ 50% usage) (48) Worker's Compensation 0.5% 0.5% 0.5%
Holidays (104) Total Paid Benefit Rate 46.6% 34.1% 38.7%
Total Chargeable Hours 1,744
NOTE:1
2 Vacation accrual rate varies depending on years of service. As of 7/1/13, average vacation hours was 168 hours.
Citywide
Indirect Cost
Rate
Hourly Billing
Rate
Annual salary amount includes deferred compensation contribution of $900/year and Bilingual premium of 2.5% over base pay for
employees that qualified.
Chargeable
HoursHourly RateAnnual Salary
1 Paid Benefit
Rate
Total
Compensation
Total Cost Per
FTE
33