Embed Size (px)
Citation preview
i
Cost Analysis and Efficiency Indicators forHealth Care:
Report Number 1Summary Output for Bani Suef General Hospital, 1993-1994
Department of Planning, Ministry of Health and Population,Data for Decision Making, Harvard School of Public Health,University of California, Berkeley, School of Public Health
January 1997
viii
Cost Analysis Team
Bani Suef Health Directorate
Dr. Akef OmarDr. Sarwat HelmyMr. Abd El Rouf SadekDr. Mohamed Eid
Bani Suef General Hospital
Dr. Mohamed ZoherDr. Shahera SlemMr. Faiz Malak
Department of Planning
Dr. Samer FouadDr. Emad EzatDr. Mahmoud YousriMr. Khaled SharawayMr. Hager FathyMr. Ihad MoustafaDr. Fathi MadkourMs. Abeer IsmailMs. Azza Ab El LatifMr. Hassan SolimanDr. Mamoud Houseen
Consultants
Prof. Yousef WahebProf. Liala KamelDr. Ramsses Mena
DDM
Hassan SalahJulia WalshNanda Kumar
ix
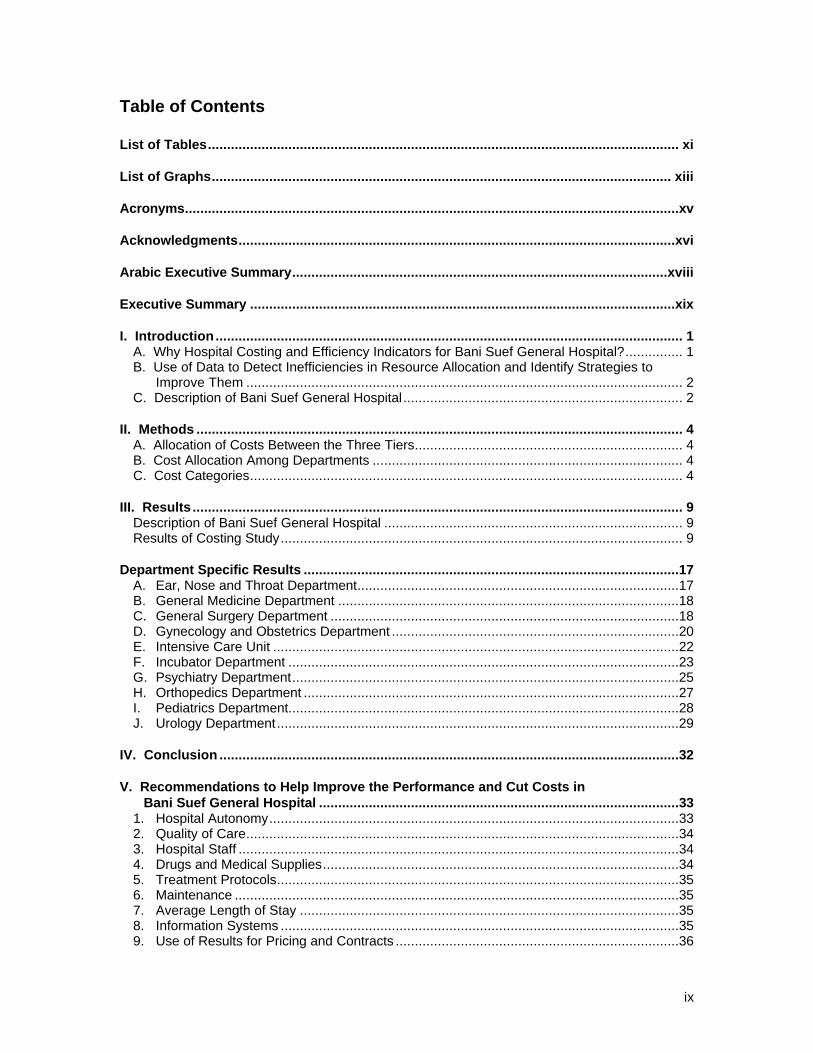
Table of Contents
List of Tables........................................................................................................................... xi
List of Graphs........................................................................................................................ xiii
Acronyms.................................................................................................................................xv
Acknowledgments..................................................................................................................xvi
Arabic Executive Summary..................................................................................................xviii
Executive Summary ...............................................................................................................xix
I. Introduction.......................................................................................................................... 1A. Why Hospital Costing and Efficiency Indicators for Bani Suef General Hospital?............... 1B. Use of Data to Detect Inefficiencies in Resource Allocation and Identify Strategies to
Improve Them .................................................................................................................. 2C. Description of Bani Suef General Hospital ......................................................................... 2
II. Methods ............................................................................................................................... 4A. Allocation of Costs Between the Three Tiers...................................................................... 4B. Cost Allocation Among Departments ................................................................................. 4C. Cost Categories................................................................................................................. 4
III. Results ................................................................................................................................ 9Description of Bani Suef General Hospital .............................................................................. 9Results of Costing Study......................................................................................................... 9
Department Specific Results ..................................................................................................17A. Ear, Nose and Throat Department....................................................................................17B. General Medicine Department .........................................................................................18C. General Surgery Department ...........................................................................................18D. Gynecology and Obstetrics Department ...........................................................................20E. Intensive Care Unit ..........................................................................................................22F. Incubator Department ......................................................................................................23G. Psychiatry Department.....................................................................................................25H. Orthopedics Department ..................................................................................................27I. Pediatrics Department......................................................................................................28J. Urology Department.........................................................................................................29
IV. Conclusion ........................................................................................................................32
V. Recommendations to Help Improve the Performance and Cut Costs inBani Suef General Hospital ..............................................................................................33
1. Hospital Autonomy...........................................................................................................332. Quality of Care.................................................................................................................343. Hospital Staff ...................................................................................................................344. Drugs and Medical Supplies.............................................................................................345. Treatment Protocols.........................................................................................................356. Maintenance ....................................................................................................................357. Average Length of Stay ...................................................................................................358. Information Systems ........................................................................................................359. Use of Results for Pricing and Contracts ..........................................................................36
x
10. Ambulatory Surgery .........................................................................................................3611. Nosocomial Infection........................................................................................................36
Bibliography ............................................................................................................................38
Annex I: Text Tables ..............................................................................................................40
Annex II: Text Figures............................................................................................................76
Annex III: Definitions and Data Notes ..................................................................................108
Annex IV: Data Sources ........................................................................................................111
Annex V: Data Collection Forms .........................................................................................113
xi
List of Tables
Table 1 Functional departments at Bani Suef General Hospital
Table 2 Equipment and furniture
Table 3 Total building space by functional departments
Table 4 Personnel allocated for cost centers
Table 5 Physician allocation for each department
Table 6 Allocation criteria for distributing of hospital personnel
Table 7 Allocation of overhead department personnel to medical services
Table 8 Allocation of intermediate services department personnel to medical services
Table 9 Personnel allocation to final services departments
Table 10 Utilities, maintenance, meals, stationery and travel per diem
Table 11 Drugs and medical supplies
Table 12 Average length of stay ranked alphabetically
Table 13 ALOS ranked by number of cases
Table 14 ALOS ranked by days of stay
Table 15 ALOS ranked by average days of stay
Table 16 Costs by category and functional departments
Table 17 Allocation criteria for distributing overhead and intermediate services costs
Table 18 Allocation of overhead departments costs to medical services(drugs and medical supplies costs are included)
Table 19 Allocation of intermediate services departments costs to medical services(drugs and medical supplies costs are included)
Table 20 Allocation of overhead departments costs to medical services(drugs and medical supplies costs are not included)
Table 21 Allocation of intermediate services departments costs to medical services(drugs and medical supplies costs are not included)
Table 22 Distribution of costs by cost category for inpatient departments
Table 23 Percentage of distribution of costs by cost category for inpatient departments
Table 24 Distribution of costs per admission by cost categoriesTable 25 Distribution of costs by cost categories for outpatient clinics

xii
Table 26 Percentage of distribution of costs by cost categories for outpatient clinics
Table 27 Distribution of costs per outpatient visit by cost categories
Table 28 Average costs per outpatient visit
Table 29 Efficiency indicators
xiii
List of Graphs
Graph 1 Allocation of full-time equivalent physicians to final departments
Graph 2 Distribution of hospital staff for inpatient departments
Graph 3 Distribution of hospital staff of outpatient clinics
Graph 4 Average lengths of stay for the highest causes for admissions
Graph 5 Average distribution of annual hospital costs
Graph 6 Distribution of annual hospital costs to functional departments
Graph 7 Distribution of hospital staff
Graph 8 Distribution of personnel costs for each staff category
Graph 9 Average distribution of utilities costs
Graph 10 Distribution of annual costs to direct services departments
Graph 11 Distribution of costs by category for inpatient departments
Graph 12 Average distribution of costs per admission for general medicine department
Graph 13 Average distribution of costs per admission for general surgery department
Graph 14 Annual number of hospital admissions
Graph 15 Costs per admission
Graph 16 Distribution of costs per admission by cost category
Graph 17 Distribution of annual costs by category in outpatient clinics
Graph 18 Annual costs by category in renal dialysis unit
Graph 19 Distribution of costs per outpatient visit by cost category
Graph 20 Costs per outpatient visit
Graph 21 Occupancy rate versus costs per day
Graph 22 Annual costs per bed
Graph 23 Annual bed-days versus costs per day
Graph 24 Annual admissions per FTE physician versus cost per admission
Graph 26 Annual number of admission per FTE physician
Graph 27 Annual outpatient visitsGraph 28 Annual outpatient visit per doctor

xiv
Graph 29 Drugs costs versus annual number of visits
Graph 30 Drugs costs versus annual bed days
Graph 31 Average length of stay versus costs per admission
xv
Acronyms
ALOS Average Length of Stay
CEA Cost-Effectiveness Analysis
DALY Disability Adjusted Life Year
DOP Department of Planning
DDM Data for Decision Making
ENT Ear, Nose, and Throat
FTE Full Time Equivalent
L.E. Egyptian Pound
Gyn/Obs Gynecology and Obstetrics
ICU Intensive Care Unit
CCO Occupancy Rate
MOHP Ministry of Health and Population
PWAF Present Worth of Annuity Factor
PV Present Value
QALY Quality Adjusted Life Years
RP Reference Period
GGH Gamhuria General Hospital
TC Total Cost
na Not available/not applicable

xvi
Acknowledgments
This Cost-Effectiveness Analysis study has been developed with the support of the United StatesAgency for International Development (USAID) through the Data for Decision Making Project(DDM), Harvard School of Public Health. We would like to acknowledge the continuing supportof USAID/Cairo in upholding this significant work in Egypt. Special thanks goes to Dr. Sameh ElGayyar, DDM Project Officer, for his strong support since the beginning of this project in Egypt.
The Cost Analysis team is grateful for the strong leadership and assistance of Dr. Magda ElSherbini, First Undersecretary for Curative Care, Ministry of Health and Population. Dr. Magda ElSherbini's interest in this study has motivated all the team to successfully finish the study in ourbest efforts.
The Cost Analysis Team is also appreciative for the support of Dr. Moshera El Shafei,Undersecretary for Population and Family Planning of the Ministry of Health and Population. Dr.Moshera initiated the cost analysis and efficiency allocation study for health facilities in responseto the Ministry's needs for accurate information in comparing public and private hospitals inEgypt.
Dr. Nanda Kumar, former Resident Advisor and now Project Manager for Egypt, Harvard Schoolof Public Health, provided his invaluable ideas and direction to support the project.
This work would not have been possible without the cooperation and hard work of our colleaguesin Bani Suef Health Directorate. Dr. Akef Omar, General Director of Bani Suef HealthDirectorate, Dr. Sarwat Helmy, Director of Statistics Department, Mr. Abd El Raouf Sadek,Planning Officer, Dr. Mohamed Zoher, Former Director of Bani Suef General Hospital, Dr.Shahera Salem, Director of Pharmacy and Mr. Faiz Malak, Director of Statistics Department atBani Suef General Hospital.
Dr. Samir Fouad, DDM Project Coordinator, has been a key person in this cost analysis study.The Cost Analysis Team would like to highlight his hard work in training our staff and followingup with each data collection stage. Dr. Samir is now in the US. finishing up his master's degreeat Boston University, School of Public Health.
The Cost Analysis Team would like to recognize the work achieved by the staff of theDepartment of Planning at the Ministry of Health, Dr. Emad Ezat, Mr. Mahmoud Yousri, Mr.Khaled Sharawy, Mr. Hager Fathy, Mr. Ihab Moustafa and Ms. Abeer Ismail.
Dr. Julia Walsh, Professor at the University of California, Berkeley, School of Public Health,provided the technical experience to initiate the study and teach the cost analysis to the team.Her strong support, effective coordination, and many valuable suggestions have made this workpossible. Jon Bain, Research Associate at the School of Public Health in Berkeley, providedassistance in proof reading this study.
The Cost Analysis Team wishes to acknowledge Peter Berman, DDM Director; Andrew Creese,Head of Health Systems and Policy Division of Strengthening of Health Services, WHO Geneva;Dr. Ishak Al Khwashky, WHO Representative, Egypt; and Dr. Abdelhay Mechbal, WHORepresentative, Lebanon, for their valuable comments on this report.
Final thanks go to all the DDM staff in Boston; Chris Hale, Kristen Purdy, Catherine Haskell,Nicola Cummings and Christina Oltmer who have provided overall administrative and logisticalsupport for this work that has made it possible to publish the report.
Comments and questions on the report are welcome:

xvii
Dr. Hassan SalahData for Decision Making ProjectDepartment of population and International HealthHarvard School of Public Health665 Huntington AveBoston, MA 02115Tel: (617) 432-4610Fax: (617) 432-2181
Or
9 Rustom St., Suite 13Garden City, Cairo, EgyptTel: (202) 355-8679Fax (202) 354-8042Email: [email protected]

xviii
Arabic Executive Summary
xix
Executive Summary
The governorates of Alexandria, Suez, Bani Suef, Dakahlia, Port Said, North Sinai, South Sinaiand Aswan undertook detailed costing studies for eighty health facilities to analyze costs andefficiency in Ministry of Health and Population hospitals. This study presents the results of thecosting analysis for the Bani Suef General Hospital in the Bani Suef Governorate. The datacollection and analysis were conducted by a team from the Bani Suef Health Directorate incollaboration with the Data for Decision Making Project (DDM). The DDM project is acollaborative effort between the Department Of Planning (DOP), Ministry Of Health andPopulation (MOHP), United States Agency for International Development (USAID), the HarvardSchool of Public Health, and the University of California, Berkeley, School of Public Health.
The operating costs of the Bani Suef General Hospital from July 1993 to June 1994 wereallocated to individual cost centers. These cost centers are classified as overhead, intermediateservices and final services departments. The overhead departments such as personnel, finance,and maintenance provide support to intermediate and final services departments. Theintermediate services departments, such as laboratory and operating theaters, provideprocedures and services to patients in final services departments in the inpatient wards andoutpatient clinics.
Fifty-four functional departments were identified as cost centers at the hospital. Overhead,intermediate, and final services departments account for 12, 19, and 69 percent, respectively, oftotal hospital-wide costs.
Five major categories of costs were selected to estimate the total costs: building and permanentstructures, equipment and furniture, personnel, drugs and medical supplies, utilities, and foodand clothing.
The study uses the step-down technique for allocating overhead and intermediate servicesdepartments costs to final services departments. The step-down technique was also used toallocate overhead and intermediate services department staff to final services departments,and to estimate the full-time equivalents for each department and clinic.
In general, the highest expenditure in hospitals is on personnel. These costs include take-homepay and all related benefits. Annual personnel costs account for 58 percent of the totalexpenditures at the Bani Suef General Hospital. Costs for personnel at intermediate servicesand final services departments constitute 86 percent of personnel costs, while salaries forpersonnel at overhead departments represent 14 percent of the total cost of personnel.Physicians' and nurses' salaries account for 64 percent, while other staff categories constitute 36percent of the total costs of personnel.
Fourteen percent of the total annual costs for 1993-94 was spent on drugs and medical supplies.The total annual cost of drugs and medical supplies is estimated at 760,114 L.E., which includesnot only the drugs actually used but also donated and wasted drugs. This estimate does notinclude prescription drugs purchased by patients out-of-pocket. The average cost of drugs perinpatient day is 2.8 L.E. This low expenditure suggests either the magnitude of the dependencyof the system on patient drug purchases outside the hospital, or it suggests low quality of care. Asmall portion of the drugs and medical supplies (2 percent of the annual total) is consumed bythe renal dialysis unit. The cost of drugs and medical supplies varies significantly across finalservices departments. For example, they constitute 22 percent of expenditures in the ENTdepartment, while they account for only 5 percent of the inpatient treatment for general medicinepatients.
The study assessed the actual cost of renal dialysis as an example of one of the interventionsfinancially supported by the MOHP in spite of its high cost. The average cost per visit is 165
xx
L.E., which totals 17,000 L.E. per patient annually taking into account that the renal failurepatient needs 2 weekly visits (104 visits yearly on average, 4-6 hours for each visit). The cost ofdrugs and medical supplies constitute 16 percent of the total cost. See Table 27 for thedistribution of costs per outpatient visit.
The average cost per admission is 147 L.E. Costs range from 76 L.E. for the pediatricsdepartment to 4,064 L.E. for the intensive care unit (ICU). The cost per admission is highest indepartments with low occupancy rates and long average lengths of stay (see Table 29). Somedepartments are very well staffed with an average of 1.35 staff for every occupied bed;however, the average occupancy rate is 55 percent resulting in high admission costs (seeGraph 24 for annual admissions per full time physician output versus cost per admission).
The average cost per day, 31 L.E., varies depending on the occupancy rate. This daily costranges from 15 L.E. (psychiatry) to 549 L.E. (ICU) due to lower occupancy rates and higher inputcosts in these departments.
The average annual cost per bed is 6,192 L.E.. This ranges from 3,739 L.E. in the psychiatrydepartment to 18,539 L.E. in the Incubator department (see Graph 22 for the total annual costper bed).
The total maintenance cost in this hospital is about 83,100 L.E., which represents 1.83 percent ofthe annual recurrent costs. The international average percentage of maintenance costs rangesfrom between 10 to 15 percent of the annual recurrent costs to maintain effective hospitaloperation (Mills 1991).
Outpatient visits in this hospital cost an average of 7.34 L.E. Drugs account for 12 percent ( 0.88L.E.) of the total amount, while personnel costs consume more than 41 percent. The cost ofoutpatient visits depends on the number of visits to each clinic. In general surgery it is 7 L.E. and19 L.E. for gynecology and obstetrics, which respectively treat 63 and 12 patients daily (seeTable 26 for the distribution of costs per outpatient visit). The cost per visit for the emergencyunit is 5.73 L.E. Drugs and medical supplies make up 21 percent, which is more than the cost ofdrugs and medical supplies for outpatient clinics. Outpatient care at BSGH absorbs 58 percent(2,612,336 L.E.) of total hospital recurrent expenditures.
The average occupancy rate in 1993-94 was 55 percent. This rate ranges from 6 percent in theICU department to 66 percent in the psychiatry department. The departments of gynecology andobstetrics and orthopedics have the highest turnover rates, 63 and 54 patients per bed, per year,respectively. Turnover rates decrease in the psychiatry department with 8 patients per bed peryear and is at its lowest in the ICU at 3 patients per bed per year. The turnover rate in the BaniSuef General Hospital is 42 patients per bed per year.
This study assessed the average length of stay for 113 diagnoses to help determine the diseaseswith the longest lengths of stay. Deliveries account for the highest number of admissions (9.19percent of total hospital annual admissions, ALOS 1.4 days), and wounds, contusions andabrasions represent the second highest number of admissions (8.63 percent of total hospitalannual admissions, ALOS 2.83 days). Abortion is the seventh highest cause of admission withALOS 1.62. In general, average lengths of stay appear appropriate for the most commondiagnoses. Patients in the psychiatry department stay an average of 29 days, while they stayonly 2 days in the gynecology and obstetric and pediatric departments. These figures are basedon an analysis of the admission and discharge sheets of the hospital, which were reviewed toensure the accuracy of results. (See Tables 12, 13, 14 and 15 for a list of average lengths ofstay at the Bani Suef General Hospital).
The average number of inpatient days per full-time equivalent (FTE) physician was 1,707patient days. Based on the fact that each physician works 270 days a year, each physician
xxi
attends to 6 patients during his/her 6 hour day. This number decreases to 94 patient days for aphysician in the ICU, meaning he/she is responsible for fewer than one patient per working day.
Recommendations: Improving the efficiency of this hospital will require an increase in occupancyrate. This can be achieved through a number of changes in management.
Recommended changes include:
1. Increase hospital autonomy and decision-making by the hospital director in budgetallocations, staffing, drugs purchases, etc. A performance-based incentive system is onefeasible and practical method for rewarding good management practices and performance.
2. Staffing ratios per bed or bed day are not an infallible proxy for quality of service. Training
and skill level, supporting technology, team work, and organization of services are allessential complementary co-determinants of quality. In addition, differences in the case mixinside and between departments has an important role. For example, ICU patients needmore staff than orthopedics patients.
3. Increases in the budget for drugs and medical supplies. This will increase the total annual
costs of the hospital, but, on the other hand, the availability of drugs will likely increase thequality of care and the utilization rate (number of admissions); this, in turn, will decrease thetotal cost per admission.
4. Treatment protocols for the same cause of admission vary among physicians of the same
department. The average length of stay can be reduced by more than 50 percent bychanging the standard practice for specific cases of admissions.
5. Increases in the budget for maintenance. Maintenance has important implications for the
overall technical efficiency of the hospital. Unfortunately, maintenance costs are directedmainly towards repairing hospital equipment and not towards regular and preventivemaintenance, for which there are no plans.
6. Increasing occupancy rates by reducing the average lengths of stay would increase the
turnover rate that would enable a greater number of people to benefit from hospital services.The study investigated the main causes of long average lengths of stay for differentdiagnoses.
The following factors contribute to extended lengths of stay:
• Patients admitted for diagnostic tests remain in the hospital until the results are receivedbefore undergoing medical or surgical treatments.
• Physicians are often late or absent because of conflicts in appointments between their
hospital service and private practice. It is critical for the hospital to work out arrangementswith the physicians to ensure that such conflicts are minimized.
• An absence of standard practices and protocols for the same cause of admission creates
variations in treatment among the physicians of the same department.
• Hospital infections as a result of poor sterilization (although there is little data available onthe magnitude of hospital infections and their effect on ALOS).
7. It is evident that the existing information systems rarely produce the required information.Research is required into how routine systems can best be altered and augmented. Reliable
xxii
data will help in identifying resource allocation problems and in planning changes to healthsector resource allocation patterns.
8. The results of this study will provide a definitive basis for negotiating a price for the daily
reimbursement rate for private patients based upon the average cost per day of 31 L.E. Thestudy can also be used for negotiating a reimbursement rate from health insurancecompanies and for health insurance companies to set insurance prices based on estimatedannual costs for hospitalization and utilization in the population covered.
9. Increasing the capacity of the Bani Suef General Hospital to perform ambulatory surgery and
other treatments. This would potentially assist in increasing hospital occupancy andefficiency, while fulfilling the patient demand for improved hospital care. This would requireupgraded skills on the part of the surgeons and anesthesiologists, and possibly require somespecialized equipment.
However, the current system of hospital admissions and management, which is divided betweenthe governorate, the Ministry of Health and Population, and the hospital administration, providesno incentive to improve management, quality, and efficiency. Changing the decision-makingsystem so that efficient, high quality care is rewarded will likely have the greatest impact. Thischange will require increased decision-making autonomy in the hospital regarding staffingpatterns, maintenance budgets, and drug purchases, among other considerations. Thesechanges might also lead to the hospital’s increased accountability to provide efficient andpatient-oriented services. The role of the central- and governorate-level health administrationwould expand to developing hospital policy and to monitoring and assuring quality services.

1
I. Introduction
In Egypt, as in other developing countries, the demographic and epidemiological transition isputting increasing pressure on scarce government resources.
Government spending on health care in Egypt, as a percentage of the gross domestic product,has remained fairly constant in the last decade. The budget tracking system of the Department ofPlanning demonstrates that scarce health resources are allocated towards services which arecostly and result in limited benefits in terms of increased life expectancy. Only 5 percent isallocated to primary care services which are known to be most cost-effective. Under thesecircumstances, the challenge facing policy makers is to optimize returns on investments in healthcare.
Two major avenues for increasing health benefits from scarce resources are 1) increasing theefficiency and improving the management of existing health facilities and health programs and2) increasing the allocation of resources to those programs that are most cost-effective. In orderto increase the use of scarce resources for more cost-effective and efficient services, theMinistry of Health and Population undertook a cost-effectiveness exercise.
Cost-Effectiveness Analysis is a method for identifying interventions that achieve the greatestlevel of health impact per unit of expenditure. Effectiveness is typically measured in terms ofimprovements in health status. Various measures, including years of life gained throughreduced mortality, Disability Adjusted Life Years (DALYs), and Quality Adjusted Life Years(QALYs) are used to assess effectiveness. An important aspect of cost-effectiveness analysis isthat it can be used to assess technical and allocative efficiency.
Allocative efficiency measures the optimal distribution of resources among a number ofcompeting uses. Technical efficiency is the extent to which the choice and utilization of inputresources produce a specific health output, intervention or service at the lowest cost (WDR1993). Inefficiency of inputs can lead to high costs per unit of service delivered to patients.Technical inefficiency occurs when output is less than is technically possible with the mix ofinputs used by the hospital (Barnum 1993).
To define costs and efficiency in hospitals the governorates of Alexandria, Suez, Bani Suef,Dakahlia, Port Said, North Sinai, South Sinai and Aswan undertook detailed costing studies foreighty health facilities. This study presents results for the costing of Bani Suef General Hospitalat Bani Suef Governorate. The data collection and analysis was conducted by a team from BaniSuef Health Directorate in collaboration with the Data for Decision Making Project (DDM). TheDDM project is a collaborative effort between the Department of Planning (DOP), Ministry ofHealth and Population (MOHP), Harvard University School of Public Health, and the Universityof California Berkeley, School of Public Health.
The study uses step-down analysis to cost hospital-based services in general hospitals run by theMOHP. Efficiency indicators point to significant technical and economic inefficiencies. Nearlyhalf of the expenditures in the hospital go to paying for salaries of personnel, leaving less thanoptimal resources for drugs and medical supplies. Major intra-hospital differences exist in costsper admission, total full time equivalent staff per bed, output per physician, bed turnover rate andbed occupancy rate. The analysis shows that with better allocation of resources (human andfinancial), major efficiency gains can be achieved.
A. Why Hospital Costing and Efficiency Indicators for Bani Suef General Hospital?
The main objectives of the cost and allocative efficiency study of the Bani Suef General Hospitalare to:
2
• Develop a clear and appropriate methodology for calculating the service cost. • Increase the technical capability of professionals at the governorate in undertaking costing
studies and using the information for decision making. • Estimate the actual economic costs of services delivered by each medical department of the
hospital. • Increase the efficiency of resource use by not only understanding the costs of services under
the current operating system, but also providing some understanding of how resources canbe used to provide the optimal level of service.
• Create a basis for a pricing system of medical services delivered by the hospital that can be
used to establish fees for services and contracts.
B. Use of Data to Detect Inefficiencies in Resource Allocation and IdentifyStrategies to Improve Them
The data from the Bani Suef General Hospital can be used to identify areas of inefficiencies bycomparing the costs and outputs with other similar facilities, both nationally and internationally.
By comparing the results of the various facilities, the range of costs for outpatient and inpatientservices becomes evident and reasons for the differences can be better analyzed: low utilization,high administrative costs, differences in personnel staffing, differences in equipment andmaintenance budgets, etc. Strategies can then be developed to treat the identified problemswhich may include increasing utilization of under-utilized facilities, changing staffing patterns,closing under-utilized facilities, etc.
C. Description of Bani Suef General Hospital
The Bani Suef Governorate is located 124 km south of Cairo. It is a mostly rural governorate(only 26 percent is urban) with a total population of 1.8 million. Bani Suef General Hospital(BSGH) is the only general hospital for the Bani Suef governorate. It was built in 1960 andcurrently houses about 576 beds. The hospital is operated by the MOHP and its primaryobjective is to provide general medical and surgical services to the local community.
Bani Suef hospital is a full-service general hospital with the following specialties: ear, nose, andthroat (ENT), general medicine, general surgery, gynecology and obstetrics (Gyn/Obs), intensivecare (ICU), incubator, orthopedics, pediatrics, urology and psychiatry. The hospital also housesoperating theaters, a laboratory, radiology services, and a renal dialysis unit. Outpatient servicesare provided in all of these specialties, as well as in dentistry, dermatology, rehydration, treatingrabies, psychiatry, diabetes and cardiology.
Being an MOHP hospital, BSGH is administered under MOHP regulations and guidelines, as wellas those of the Ministry of Manpower. Funds allocated from the Ministry of Finance to theMOHP for personnel, including physicians, are controlled by the Ministry of Manpower andassigned by the MOHP to the Bani Suef governorate. The governorate, through the office ofMedical Affairs, assigns individuals to local health facilities. This system does not give hospitalssufficient control to select the numbers and quality of appointed personnel. This puts hospitals ina difficult position in terms of management autonomy and financial decision making.
The primary mission of the Bani Suef General Hospital, as of other MOHP hospitals, is toprovide free medical care. Unfortunately, in recent years, the MOHP’s budget has not been
3
adequate to defray the financial needs of such hospitals and other health units across thecountry. In order to help counterbalance overall costs, some facilities have introduced limiteduser fees. During the fiscal year of 1993-94, the BSGH revenues from these fees were 649,164L.E. (for total admissions which represents 5 percent of the total annual admissions of thehospital). In addition, BSGH charges hospital visitors L.E. 0.50 per visit. These fees collectedfrom inpatients and outpatient visitors are used as bonuses for physicians and other staff, fordrug purchases and other expenditures.
The staff consists of 1,098 employees (including 174 physicians and 454 nurses). This staffinglevel provides a ratio of employees to occupied beds (assuming Bani Suef hospital’s most recentoccupancy rate of 55.28 percent) of 1.35 to 1. In relation to total beds, this ratio decreases to0.74 to 1.
The total annual admissions in 1993-94 was 24,298 patients, with an average length of stay of4.78 days. Total annual outpatient visits (including emergency and renal dialysis units) was253,759 visits.
4
II. Methods
A. Allocation of Costs Between the Three Tiers
Economic costs are used for the purpose of this analysis. The Bani Suef General Hospital isorganized into three tiers based upon the nature of service provided. These are identified asoverhead departments, intermediate services, and final services departments. Intermediateservices departments provide support and services to patients in final services departments.Table 1 identifies the functional departments of the hospital in the overhead, intermediate andfinal services categories.
The costs of the overhead departments are distributed to the intermediate and final servicesdepartments through a step-down method, according to allocation criteria devised to reflect asclosely as possible the actual use of resources by each of the departments. The resources forthe director’s office, the overhead department serving the most departments, are distributedfirst; the resources for finance, the overhead department serving the second-largest number ofdepartments is distributed next. Resources are then allocated to the intermediate services andfinal services departments.
B. Cost Allocative Among Departments
Total costs consist of recurrent costs and the discounted present value of capital costs. Theseare allocated to the overhead, intermediate services, and final services departments accordingto the proportion of support required by each department. Data collected for costs estimationwere grouped under five broad categories: major and minor equipment, building and permanentstructures, labor (personnel costs), utilities, drugs and medical supplies.
1. Capital Costs are the annual costs of resources that have a life expectancy of more than oneyear. They include depreciated annual costs for buildings, equipment and furniture. Thestudy uses replacement costs for capital items, which is the cost of the item if it were to bereplaced at the current market price. The study was conducted between 1 July 1993 to 30June 1994.
The costs of buildings and equipment are depreciated according to the unified accountingmethod currently practiced in Egypt, with 25 years useful life for the building.
2. Recurrent Costs are costs associated with inputs that will be consumed or replaced in oneyear or less, such as personnel salaries, training (refresher courses), drugs, food and utilities.
C. Cost Categories
Capital Costs
1. Annual Depreciation Costs For Equipment and Furniture
The study used the replacement costs of equipment and furniture during the period of datacollection from July 1, 1993 to June 30, 1994. (See appendix V for the data collection sheet forequipment). Six categories of equipment and furniture, each with a secondary categorization of2, 3, 5, 10, 15 or 20 working life years, were assessed. This categorizing system was designedwith the assistance of MOHP experts in the field of medical supplies who are familiar with the
5
actual productive lifetime for equipment and furniture in Egypt according to the level ofmaintenance and use of the equipment.
The number of units of equipment and furniture and their locations were obtained through aphysical inventory and technical description in log books no. 118, 112, 121. Table 2 shows thetotal costs of equipment and the annual depreciation costs.
2. Annual Building Depreciation Costs
The study used the replacement cost for the building during the period of time the data wascollected. The replacement cost was 575 L.E. per sq. meter (including the cost of elevators andoxygen lines). These figures were obtained from the DOP at the MOHP, which is responsible forbudget allocation in different governorates to establish and renovate health facilities. Thebuilding costs that are depreciated assume an effective life of 25 years. The price of the landhas not been included in this estimation.
For allocation of corridors to cost centers (departments), we first allocated the special corridors,or the spaces located between departments. (See the diagram at the bottom of Table 3). Thesecorridors were allocated according to the following rules:
• For overhead and intermediate services departments, allocation was set according to thepercentage of personnel using the corridors within each department.
• For inpatient departments (691 sq. m.), allocation was set according to the percentage of
admissions using the corridors within each department • For outpatient clinics (593 sq. m.) allocation was set according to the percentage of
outpatient visits using the corridors within each clinic.
The other type of corridors are general corridors (1,504 sq. m.), which include all space outsidethe departments. These corridors have been allocated to the three main departments (overhead,intermediate and final services departments) of the hospital according to the proportion ofoccupied space from the total space area of the hospital. Again, inside each department of thethree main departments, general corridors have been allocated according to the number ofpersonnel at each cost center. This data was collected by preparing a floor plan of the hospitalidentifying and categorizing rooms according to their activities, and estimating the size of eachroom and corridors. The information about building characteristics was obtained from theengineering (maintenance) department.
Table 3 shows the base cost center space and the total space for each cost center afterallocating special and general corridors. It also shows the total cost of the building for each costcenter and the annual depreciation cost using 25 years as useful life and 3 percent for thePresent Worth Annuity Factor (PWAF).
Recurrent Costs
1. Annual Personnel Costs
Staff are allocated to five categories, (see Table 4 for personnel allocation):
1. Physicians: Includes all medical doctors working in the intermediate and final servicesdepartments, in addition to dentists. Pharmacists are not included in this category.
2. Nurses: Includes all nurses who graduated either from the school of nursing or from the high
institute of nursing.
6
3. Technicians/ skilled personnel: Includes personnel with a university degree or a special skill.
They include lab technicians, dietitians, pharmacists and drivers for vehicles or ambulances.The largest numbers of personnel included in this category work in the intermediate servicesdepartment, while a minimal number work in the final services department.
4. Administration: Includes personnel performing administrative work. Most personnel in this
category are working in the overhead department while very few work in the final servicesdepartment.
5. Unskilled personnel: Includes all personnel working as janitors and messengers.
The annual personnel costs or the “total pay” for each person working at the hospital, whichincludes:
• Take-home pay. • Benefits (including exceptional honoraria and family planning), health insurance
contributions, labor day allowance, feast honoraria, pay for working overnight,accommodation and food for doctors and nurses.
• Deductions such as insurance, pension and income tax.
All staff have been assigned to the three main departments. The Full-Time Equivalent (FTE)was calculated dividing the physician’s work by the ratio of his/her work in outpatient, inpatient,operations and emergency departments. The numbers shown in the personnel column are equalto the full time equivalent of personnel working at each cost center. Table 5 shows thebreakdown of the cost centers and final services expenditures by percentage of each specialty’sworking hours amongst different departments. Graph 7 shows the distribution of hospital staff forinpatient departments. Nurses accounted for the highest percentage (41percent) of annualpersonnel costs, followed by physician costs (25 percent of annual personnel costs). See Graph8 for the distribution of personnel costs for each staff category. Table 6 shows the criteria for thedistribution of overhead and intermediate services department personnel to final servicesdepartments. Tables 7 and 8 display the proportion of overhead and intermediate servicesdepartment used by the final services departments. The average number of hospital personnelper bed is 1.09. Since the occupancy rate is 55 percent, this means an FTE staff of 1.98 peroccupied bed. The ICU has the highest number with 13.77 FTE staff per occupied bed. SeeTable 9 and graphs 1,2 and 3 for the total number of personnel working at final servicesdepartments before and after using the step-down technique for hospital staff.
Data on personnel salaries were collected from Sheets no. 50 and 132 A.H. at the finance andpersonnel departments. Cost analysis shows that 58 percent of annual hospital expenditure wasspent on personnel.
In addition, trying to allocate personnel not working in specific cost centers was somewhatambiguous. For example, there are 25 head nurses working in inpatient departments, who arenot affiliated with a specific department. The allocation of these personnel was computedaccording to the percentage of admissions for each inpatient department in which they work.
The allocation rules of such personnel are:
7
• In overhead departments: Because all of the non-allocated personnel in this department arenon-skilled workers (working in cleaning services), they are allocated according to the spacearea in each cost center.
• In intermediate services departments: The same rule as in overhead departments. • In direct service departments: Allocation is assigned according to the percentage of days of
stay for inpatient departments or outpatient visits for outpatient clinics.
2. Annual Utility Costs
This category includes electricity, water, telephone lines, vehicle gas, and kitchen oil. Theannual costs of meals, patient and personnel apparel, stationery, building and equipmentmaintenance and travel per diem were also added to this category. Data on the cost of utilitiesand the official records of invoices was obtained from the financial department. Table 10 showsthe total annual cost of utilities and their allocation to cost centers. Cost analysis shows that 11percent of annual hospital expenditures was spent in annual utility costs (see Annex IV for datasources).
The following are the criteria for the allocation of each utility cost to cost centers:
• Personnel food costs: Allocated according to the number of meals for personnel in eachdepartment.
• Patient food costs: Allocated according to the annual number of patient days in each
department. The total annual cost of food for patients and personnel accounted for 59percent of the utility costs (see Graph 9).
• Personnel apparel: Allocated to intermediate and final services departments according to
the number of personnel in each of them. Personnel in overhead departments do notreceive apparel.
• Stationery: Allocated to the overhead department according to the percentage of personnel
at each cost center. • Equipment maintenance: Allocated to each department according to the equipment cost at
each cost center as a total cost of equipment at the hospital. • Building maintenance: Allocated to different cost centers according to the space area as a
percentage of the total space area of the hospital. • Vehicles maintenance: Completely allocated to the vehicle and ambulatory departments. • Travel per diem and mail: Allocated completely to the personnel department. • Fuel and oil: Allocated completely to vehicles. • Natural gas: 70percent allocated to the kitchen, the rest to the generators (which are
allocated to all departments according to the space area of each). • Water: Allocated to all departments according to space area. • Electricity: Allocated according to the electricity consumption measured by using an
avometer. The highest consumers of electricity are the laundry and operating theaters.
8
• Telephone: Allocated according to the number of phone sets in each cost center.
3. Annual Cost of Drugs and Medical Supplies
This category includes drugs and medical supplies provided by the hospital. It does not includeprescribed drugs that patients purchase outside of the hospital. Table 11 shows the total annualcost of drugs and medical supplies in each department and outpatient clinic. The study used theprice list of Drugs and Medical Supplies Department at MOHP for purchasing drugs and medicalsupplies for its health facilities. Data related to drugs and medical supplies consumed by thefinal services departments were collected from the Pharmacy and Store Departments. Costanalysis shows that 14 percent of annual hospital expenditure was spent on drugs and medicalsupplies.
The operating theater department accounts for 20 percent of the total expenditure on drugs andsupplies. The second highest consumer is the emergency unit at 15spercent, followed byinpatient departments at 43percent (the general surgery department uses 14 percent), outpatientclinics at 17percent ( of which the general surgery clinic is the highest consumer at 3 percent).The renal dialysis unit is at 2 percent of the annual cost of drugs and medical supplies of thehospital.
9
III. Results
Description of Bani Suef General Hospital
Bani Suef General Hospital (BSGH) is a full service general hospital with 576 beds and 54functional departments. Of these, 12 are overhead departments, 14 intermediate servicesdepartments, and the remaining 28 are direct services departments. The hospital has a totalarea of approximately 17,160 square meters, with inpatient departments making up 29 percent ofthe total area. BSGH has 1,098 employees made up of 174 physicians, 454 nurses, and 470other employees. Put another way, 190 employees are in the overhead departments, 188 are inintermediate services departments, and 720 are in final services departments. The emergencyunit is the largest department in the hospital with 90 full-time equivalent employees. Operatingtheaters are the largest intermediate services department with 58 employees, and the generalsurgery department is the largest direct services department with 108 full-time equivalentemployees. See Table 4 for the allocation of hospital personnel. In 1993-94 there were a totalof 24,298 admissions with an average length of stay of 4.78 days. Total outpatient visits(including the emergency and renal dialysis units) was 253,759 visits.
Results of Costing Study
This section presents the main findings from the cost study. To recapitulate, the total annualcost is the sum of the annualized capital costs and recurrent costs. In turn, capital costs andrecurrent costs are subdivided into five subcategories. The total annual cost for BSGH in 1993-94 was L.E. 5,473,463.
Cost by Budget Category
Graph 5 presents the breakdown of total costs by capital and recurrent costs.
• Annualized capital costs represented 17percent of total costs. Of these, building costsaccounted for 7percent and equipment and furniture 10 percent. For the analysis, the cost ofland is not taken into consideration.
• Recurrent costs represent 83 percent of the total cost. Personnel accounted for 58 percent
of the total cost, followed by drugs and medical supplies at 14 percent and utilities at 11percent.
− Nurses make up 41 percent of personnel costs followed by physicians at 25 percent, andother personnel making up the remaining 34 percent.
− A large portion of the cost of drugs and medical supplies - 20 percent - is attributable to
the operating theaters department. − Only 1.83 percent of the total annual recurrent costs are spent on maintenance.
Cost by Department
Hospital costs were initially broken down into three departments: overhead, intermediateservices and final services. Graph 6 gives the breakdown of costs by these three departments.
• 12 percent of total annual costs are attributable to overhead departments. From Table 16 itcan be seen that of this 25 percent are for capital costs, 67 percent for personnel costs, and8 percent are for other recurrent costs.
10
• 19 percent of total annual costs are attributable to intermediate services departments.
Again, from Table 16 it can be seen that, of this, 22 percent are for capital costs, 55 percentare for personnel costs, and 23 percent are for other recurrent costs.
• 69 percent of total costs are attributable to direct service departments. Of these, 14 percent
are for capital costs, 57 percent are for personnel costs, and 29 percent are for otherrecurrent costs.
Step-down Allocation of Overhead and Intermediate services Departments Costs
Capital and recurrent costs are assigned to overhead, intermediate services and final servicesdepartments through direct distribution (as in the dental lab and emergency pharmacy) or bystep-down allocation.
Costs of the overhead departments are first allocated to intermediate services and finalservices departments. Total costs of the intermediate services departments after allocation ofoverhead costs are then allocated to the final services departments. Finally, final servicesdepartment costs are allocated to inpatient departments, outpatient clinics, emergency and renalunits. (See Graph 10 for the distribution of annual hospital costs to the direct servicesdepartments after step-down allocation).
a. Allocation of the Overhead Departments
Table 17 shows the allocation criteria for the distribution of overhead and intermediate servicesdepartments costs to the final departments. Fifty percent of cost centers within overheaddepartments are allocated according to their proportion of the total annual costs of the hospital.Table 18 shows the allocation of overhead departments and the total costs of intermediateservices and final services departments after the allocation of overhead department costs.Approximately 15 percent of overhead department costs were distributed among intermediateservices and 85 percent to final services departments. The operation theaters, emergency unit,and gynecology and obstetric department received the largest share of overhead departmentallocations (3, 5 and 7 percent, respectively).
b. Allocation of Intermediate services Departments
intermediate services departments costs were distributed among the final services departmentsaccording to the number of procedures or services used. The proportion of intermediateservices department procedures and services used by the final services departments and theamount of the costs distributed are shown in Table 19. The orthopedic department is the largestuser (10 percent) of intermediate services department, followed by 9 percent for the generalsurgery department. The emergency unit uses 3 percent of intermediate services departmentservices.
c. Composition of Costs for Inpatient Departments
The distribution of costs and percentages for inpatient departments by major categories ispresented in Tables 22 and 23. Overhead departments represent 10 percent of the total finalcosts of inpatient departments, while intermediate services departments procedures and servicesrepresent 27 percent. Cost of FTE personnel within inpatient departments (hospital staff workingonly at inpatient departments) represent 32 percent of total annual costs of inpatient departments(See Graph 11 for the average distribution of costs by category in inpatient departments).
11
d. Allocation of Costs for Inpatient Departments
Estimates were made of the number of admissions in inpatient departments from July 1993 toJune 1994 (see Graph 14). The average cost per admission for inpatient care at Bani SuefHospital (ALOS 4.78 days) was L.E. (see Graph 15 for the average cost per admission). Thereis a substantial variation in inpatient admission costs by department (see Table 24 and Graph 16for the distribution of costs per admission).
The highest cost per admission is in the ICU department (L.E. 4,064) which is the result of a lowturnover rate (3 patients per bed per year). The lowest cost per admission is for the pediatricdepartment (L.E. 76), which is the result of a low average length of stay (2.21 days) and a highnumber of admissions and turnover rate.
The average cost of an inpatient day is estimated to be L.E. 31. The annual cost per bedreached L.E. 12,529 for the ICU with an average annual cost per bed of L.E. 6,192. See the costanalysis and efficiency indicators for inpatient departments for more details.
e. Composition of Costs for Outpatient Clinics
The distribution of costs and percentages by major categories of outpatient clinics are presentedin Tables 25 and 26. Outpatient clinics, including the emergency and renal dialysis units,represent 35 percent of annual hospital costs. The cost of FTE personnel, hospital staff workingonly in outpatient clinics, 62 percent, and the cost of drugs, 13 percent of the total cost, are thelargest cost items allocated to outpatient clinics (see Graph 17 for the average distribution ofcost by category at outpatient clinics).
There are, however, wide variations in the composition of costs among different clinics. About77 percent of the cost for obs/gyn outpatient visits are personnel costs. In the renal dialysis unit,personnel costs represented the lowest percentage of the total cost of outpatient visits (25percent), while drugs and medical supplies costs represented only 10 percent (see Graph 18 andTables 25 and 26 for the distribution of the annual cost by category).
f. Allocation of Costs for Outpatient Clinics
Estimations were made according to the number of outpatient visits in outpatient clinics andemergency units from July 1, 1993 to June 30, 1994. There is substantial variation in outpatientvisit costs (see Table 26 and Graph 19 for the distribution of costs per outpatient visit).
The gynecology and obstetric and family planning outpatient clinics have the highest cost peroutpatient visit, L.E. 19. Personnel costs account for more than 65 percent of the total visit cost,which is due to a low to utilization rate (less than 5,000 visits per year). The lowest cost per visitis for the ENT, dermatology and endemic diseases clinics where drugs represent 17 percent ofthe total visit costs, followed by 51 to 59 percent for personnel costs. The average cost peroutpatient visit at Bani Suef Hospital is L.E. 7.34; the average cost of drugs per visit is L.E. 0.86.
The average cost per visit for renal dialysis patients is L.E. 165; of this, drugs and medicalsupplies cost L.E. 15. For the emergency unit, the average cost per visit is L.E. 5.73 whichincludes L.E. 1.22 for drugs and medical supplies. See Table 28 for the average cost per visitfor the dental clinic, outpatient clinics, and the emergency unit.
Step-Down Allocation of Hospital Staff To Final services Departments
The total hospital staff of the Bani Suef Hospital is comprised of five categories of personnel:physician, nurse, technician, administrative and unskilled workers. Each category of personnel isassigned to overhead, intermediate services and final services departments through directdistribution. They are then converted to FTEs.
12
Personnel of the overhead departments were first allocated to intermediate services and finalservices departments. The total personnel of the intermediate services departments, after theallocation of overhead departments, is then allocated to the final services departments. Finally,personnel of the final services departments are allocated to the inpatient department, outpatientclinics, emergency and renal units. See Graph 2 and 3 for the distribution of hospital staff todirect service departments after step-down allocation.
a. Allocation of Overhead Departments Personnel
Table 6 gives the criteria used to allocate personnel within overhead departments to intermediateand final services departments. Eighty percent of hospital staff within overhead departmentsare allocated according to the proportion to total annual admissions for each department (oneadmission is equal to three outpatient visits). Table 7 illustrates the allocation statistics ofoverhead departments and personnel of intermediate and final services departments after theallocation of overhead department personnel. Only 1.57 percent of overhead departmentpersonnel was distributed amongst intermediate services departments; 98.43 percent wasdistributed to final services departments. The emergency unit received the largest share ofoverhead department allocations (26.84 percent).
b. Allocation of Intermediate services Departments Personnel to Final servicesDepartments:
Personnel within intermediate services departments were distributed among the final servicesdepartments according to the number of procedures or services used (see Table 6 for allocationcriteria for distributing intermediate services department personnel). The distribution of costsfrom intermediate services departments to final services departments for procedures andservices are shown in Table 8.
Cost Analysis and Efficiency Indicators
Cost Analysis
For the year 1993-1994 the total annual cost for the Bani Suef General Hospital was L.E. 5.5million. Personnel costs amounted to 58 percent of the total annual cost, followed by 14 percentfor drugs and medical supplies (these figures represent averages for the hospital). Inpatientdepartments varied from 7 to 49 percent for FTE personnel, and from 5 to 22 percent for drugsand medical supplies, depending on the total number of annual admissions (see Graph 14).Table 24 presents the distribution of costs per admission by cost categories.
The study included the actual cost of renal dialysis patients as an example of an interventionfinancially supported by the MOHP in spite of its high cost. The average cost per visit for renaldialysis is L.E. 165 which adds up to L.E. 17,160 per patient per year as a renal failure patientrequires 2 visits weekly (104 visits yearly). The cost of drugs and medical supplies constitute 10percent of the total cost which is a lower drug and medical supply cost compared with otherMOHP general hospitals.
The average cost per admission is L.E. 147. The highest cost per admission is L.E. 4,064 for theICU department, while the cost is L.E. 76 for the pediatric department. The variations in costdepend on the occupancy rate and average length of stay in the departments (see Table 29).Some departments were very well-staffed with an average of one physician per two beds.The average cost per day is L.E. 31, which varies depending on the occupancy and turnoverrates. It was found that this daily cost could vary from L.E. 21 (orthopedics department) to L.E.549 (ICU) due to the large difference in the annual admissions in these departments.
13
The average annual bed cost is L.E. 6,192 and varies between L.E. 4,000 in the urologydepartment to L.E. 18,000 in the incubator department. The psychiatry department had thelowest cost of L.E. 3,739 per bed (see Graph 22 for total annual cost per bed).
The total cost of maintenance in this hospital is about L.E. 83,100, which represents 1.83 percentof the annual recurrent cost. The international average percentage of maintenance costs rangesbetween 10 to 15 percent of the recurrent cost.
In general, personnel costs absorb the largest proportion of total costs for outpatient visits: 25 to78 percent of total costs for outpatient visits, versus 7 to 49 percent of total costs per admission.These variations are due to the absence of ambulance, operating rooms, food costs and therelatively fewer diagnostic procedures in outpatient clinics. Salaries and drugs together take upa higher share of outpatient clinics. Salaries and drugs together take up a higher share ofoutpatient than inpatient expenditures.
Outpatient visits in the Bani Suef Hospital cost an average of L.E. 7.34. The cost of drugsreaches 12 percent of the total amount, while personnel costs consume more than 62 percent.The costs for outpatient visits depend on the number of visits to each clinic. The cost variesfrom L.E. 4 per visit in the skin clinic, which see 63 patients daily, to L.E. 19 per visit in thegynecology and obstetric clinic, which sees 12 patients daily (see Table 27 for the distribution ofcosts per outpatient visit; see Graph 20 for the cost of an outpatient visit).
The cost per visit for the emergency unit is L.E. 5.73. Drugs and medical supplies represent 17percent of the total costs, which is more than the cost of drugs and medical supplies foroutpatient clinics.
Efficiency Indicators in Inpatient Departments
The study prepared some efficiency indicators in the general hospitals that will help decision -makers to evaluate the level of performance in both the inpatient and outpatient departments.
Occupancy Rate
The average occupancy rate in 1993-94 was 55 percent. This rate varies from 64 percent in theorthopedics department to 6 percent in the ICU department. See Graph 21 for the occupancyrate versus the turnover rate.
Turnover Rate
Both the pediatrics and gynecology and obstetric departments have the highest turnover rate (74and 63 patients per bed per year, respectively). This rate decreases for the psychiatrydepartment with 8 patients and 3 patients in the ICU department, the lowest rate in the hospital.This translates into an average length of stay of 29 to 7 days, respectively, for thesedepartments. The average turnover rate in the Bani Suef General Hospital is 42 patients per bedper year.
Number of Inpatient Days per FTE Physician
The average number of inpatient days per full-time equivalent physician was 1,707 patient days.Based on the fact that each physician works 270 days a year, each physician treats 94 patientsduring his/her 6 hour working day. This number decreases to 13 treatment days per year for aphysician in the ICU, meaning he/she is responsible for only one patient per month, which is avery low ratio.
14
Number of Physicians per Bed
If we base our computations on an occupancy rate of 55 percent, there are 0.21 physicians foreach occupied bed or an average number of 0.12 FTE physicians per bed.
Hospital Staff
Using the step-down technique for the allocation of overhead and intermediate servicesdepartments, the study obtained an estimation of the total hospital staff working for finalservices departments. The general medicine, general surgery and obstetrics and gynecologydepartments have the largest number of hospital FTE staff (more than 100 FTE personnel foreach). The emergency unit absorbs 13 percent of FTE hospital staff or 51 personnel.
Number of FTE staff per Bed
The study used the step-down technique to allocate the personnel of the overhead andintermediate services departments to the final services departments. The average number ofhospital personnel per bed is 1.09 or 1.98 staff per occupied bed. The ICU department has thehighest number of staff per bed, or 13.77 FTE staff.
Number of Nurses per Physician
The average number of nurses per physician is 4.07. This number varies from 17 nurses in thepsychiatry department to 0.36 nurses in the ICU department.
Number of Annual Admissions per FTE Physician
The average annual admissions per FTE physician is 357, or 30 admissions per month. Thisfigure drops to 13 admissions per year (one case a month) in the ICU department. See Figure26 for the annual number of admissions per FTE physician.
Average Length of Stay By Diagnosis
The study measured the average lengths of stay for 113 diagnoses at Bani Suef GeneralHospital from July 1993 to June 1994. The data was collected from the admissions anddischarge sheets of the hospital to assure the accuracy of results. Unfortunately, the diagnosesdo not follow the international classification of diseases. Deliveries comprise the highest numberof admissions (9.19 percent of total hospital annual admissions, ALOS 1.4 days), and wounds;contusions and abrasions were the second highest cause of admissions (8.63 percent of totalhospital annual admissions, ALOS 2.83 days). Abortions are the seventh highest cause ofadmission with ALOS 1.62. In general, average lengths of stay appear appropriate for many ofthe diagnoses. However, without further information about the severity of cases, it is notpossible to assume that the patients are hospitalized appropriately. One third to one half of thediagnoses appear to require longer lengths of stay than commonly occurs in U.S. hospitals. Forexample, patients in the psychiatry department stay an average of 29 days, while they stay only2 days in the gynecology and obstetric and pediatric departments (See Tables 12, 13, 14, and15), for a list of average lengths of stay for Bani Suef Hospital.
Graph 21 summarizes some of the efficiency indicators of the Bani Suef General Hospital. Thex-axis represents the occupancy rate, while the y-axis represents the annual turnover rate. Thegraph is divided into four regions by two intersecting lines, the vertical line representing theaverage bed occupancy rate and the horizontal line representing the average turnover rate. As itdeals only with two indicators, the graph is more useful for descriptive than policy purposes as itdoes not answer the question of whether a given department is performing efficiently. Otherefficiency indicators, such as unit cost, number of FTE personnel, are required for policypurposes (see Appendix I for glossary).
15
Departments in Region I accounted for 52 percent of the total annual cost of inpatientdepartments and 57 percent of total annual admissions. Departments in this region (orthopedics,general surgery, general medicine and incubator) may be characterized by:
• Small proportion of unused beds. • High bed turnover rate.
Departments in Region II (urology and psychiatry) accounted for 13 percent of the total annualcost of inpatient departments and 7 percent of total annual admissions. Departments in thisregion may be characterized by:
• Small proportion of unused beds. • Low bed turnover rate. • Long lengths of stay.
Departments in Region III (pediatrics, gynecology and obstetrics) accounted for 28 percent of thetotal annual cost of inpatient departments and 33 percent of total annual admissions.Departments in this region may be characterized by:
• Excess bed availability. • High bed turnover rate.
Departments in Region IV (ENT and ICU) account for 7 percent of the total annual costs ofinpatient departments and 3 percent of total annual admissions. Departments in this region maybe characterized by:
• Excess bed availability. • Low bed turnover rate.
Efficiency Indicators In Outpatient Clinics
Using the step-down technique, the study was able to obtain some indicators of the efficiencylevel in the outpatient departments.
The average number of visits per physician in outpatient clinics is 9 visits a day (see Graph 27for annual outpatient visits for each clinic). The highest number of visits was in thephysiotherapy and orthopedic clinics with 58 and 49, respectively on average daily visits (seeGraph 28 for annual outpatient visits per physician). Orthopedics and physical therapy only haveone physician, who is assisted by nurses and other health personnel.
The number of staff in each clinic (physicians, nurses, administration and support services whichincludes personnel at overhead and intermediate services departments) can reach 33, as in thegeneral surgery clinic with 7.5 physicians and 25.5 support services personnel. The total numberof personnel working for outpatient clinics (including overhead and intermediate servicespersonnel) is 316, with an average of 482 personnel per outpatient visit per staff. In theemergency unit there are 151 personnel with an average of 600 personnel per emergency unitvisits per staff.
Department Specific Results

16
A. Ear, Nose and Throat Department
Cost Analysis
• Annual cost of the department; L.E. 95,094 (2.67 percent of total annual expenditures ofinpatient departments)
• Cost per inpatient admission: L.E. 163 • Cost per day: L.E. 45 • Annual cost per bed: L.E. 5,005
Efficiency Indicators
• Annual admissions: 582 (2.40 percent of total annual admissions) • Number of beds: 19 (3.30 percent of total hospital beds) • Annual patient-days of stay: 2,107 (1.81 percent of annual patient-days) • Occupancy rate: 30.38 • Bed turnover rate: 31 • Average length of stay: 3.62
Department Staff
• Number of full time equivalent physicians: 405 • Annual admissions per FTE physician: 144 • Annual patient-days per FTE physician: 520 • Number of FTE physicians per bed: 0.21 • Number of nurses per FTE physician: 0.16 • Staff in the department (including overhead and intermediate services departments
personnel):
− Number of FTE staff: 12.78− Number of FTE staff per bed: 0.67 − Number of FTE staff per bed (according to occupancy rate): 2.21
• Staff in the inpatient department (not including overhead and intermediate servicesdepartment personnel):
17
− Number of FTE staff: 5.7 − Number of FTE staff per bed: 0.3
These departments have the lowest annual total cost or L.E. 96,094 (2.67 percent of total annualexpenditures for inpatient departments). Occupancy rate is quite low at 30 percent, which is thesecond lowest occupancy rate after the ICU department at 6 percent. Inpatient departments arelocated in Region V in graph 21, which includes departments having excess bed availability anda low bed turnover rate.
The annual cost per bed in this department is L.E. 5,005, which is relatively low because of thelow annual total expenditure of the department (L.E. 95,094) Note that the number of beds isquite low, 19 or 3 percent of total hospital beds.
Drugs and medical supplies constitute 21.63 percent or L.E. 35.35 of admission costs, thehighest percentage cost of all inpatient departments. Personnel costs accounted for 13.30percent. This department is the only one where drug and medical supplies were greater thanpersonnel costs. The operating rooms absorb only 12 percent of the total admission costs perpatient, L.E 20.
The numbers of nurses per FTE physician is 0.90. This is the lowest figure in the hospital. Step-down allocation of hospital staff shows that the total number of FTE staff for the ENT departmentis only 12.78, which is the second smallest number for inpatient departments after the ICUdepartment (10.34).
B. General Medicine Department
Cost Analysis
• Annual cost of the department: L.E. 473,863 (13.29 percent of total annual expenditure ofinpatient departments).
• Cost per inpatient admission: L.E. 108 • Cost per day: L.E. 21 • Annual cost per bed: L.E. 4,646
Efficiency Indicators
• Annual admissions: 4,406 (18.13 percent of total annual admissions). • Number of beds: 102 (17.7 percent of total hospital beds) • Annual patient-days of stay: 22,050 (18.97 percent of total annual patient-days) • Occupancy rate: 59.23• Bed turnover rate: 43 • Average length of stay: 5
18
Department Staff
• Number of full-time equivalent physicians: 8.70 • Annual admissions per FTE physician: 506 • Annual patient-days per FTE physician: 2,534 • Number of FTE physicians per bed: 0.09 • Number of nurses per FTE physician: 6.53 • Staff at the department (including overhead and intermediate services department
personnel):
− Number of FTE staff: 105.07 − Number of FTE staff per bed: 1.03 − Number of FTE staff per bed (according to occupancy rate): 1.74
• Staff within the inpatient department (not including overhead and intermediate servicesdepartments personnel):
− Number of FTE staff: 82.55 − Number of FTE staff per bed: 0.81
The cost of 21 L.E. per day is the lowest of the inpatient departments in the hospital due to thelarge number of admissions, 4,406 per year, and the long duration of stay, 22,050 days. This isthe second highest ALOS rate after the general surgery department at 22,942.
Personnel working in the general medicine inpatient department only receive 49 percent of thecost of admission. This is the highest percentage of personnel costs for the inpatientdepartments, followed by utilities and accounting at 16 percent. Drugs and medical suppliesaccounted for only 5 percent or 5 L.E. of the total cost of admission. See Graph 12 for theaverage distribution of the cost per admission for the general medicine department. See Table24 for the distribution of costs per admission at BSGH.
The occupancy rate in the department is one of the highest in the hospital. The turnover rate isrelatively high as well, at 43 patients, due to the relatively long lengths of stay.
The general medicine and gyn/obs departments have the second highest number of admissions,50 patients, per FTE physician. The highest number of admissions, 819 patients, is in theorthopedic department.
C. General Surgery Department
Cost Analysis
• Annual cost of the department: 795,643 L.E. (22.31 percent of total expenditures of inpatientdepartments).
19
• Cost per inpatient admission: 185 L.E. • Cost per day: 35 L.E. • Annual cost per bed: 7,506 L.E.
Efficiency Indicators
• Annual admissions: 4,307 (17.73 percent of total annual admissions) • Number of beds: 106 (18.4 percent of total hospital beds) • Annual patient-days of stay: 22,942 (19.74 percent of total annual patient-days) • Occupancy rate: 59.3 • Bed turnover rate: 41 • Average length of stay: 5.33
Department Staff
• Number of full-time equivalent physicians: 13.5 • Annual admissions per FTE physician: 319 • Annual patient-days per FTE physician: 1,699 • Number of FTE physicians per bed: 0.13 • Number of nurses per FTE physician: 6.59 • Staff of the department (including overhead and intermediate services departments
personnel):
− Number of FTE staff: 154.12 − Number of FTE staff per bed: 1.45 − Number of FTE staff per bed (according to occupancy rate): 2.45
• Staff of the inpatient department (not including overhead and intermediate servicesdepartments personnel):
− Number of FTE staff: 115.43− Number of FTE staff per bed: 1.09
This department has the highest annual expenditure in the hospital at 795,643 L.E. representing22 percent of the total annual expenditures for inpatient departments of the hospital. The higherannual costs are due to the following:
− High annual patient-days of stay. General surgery has the highest annual patient-daysof stay, or 20 percent of total annual days of stay.
20
− High number of staff working at the department. The department has 115.43 personnel,
the highest number of staff of any inpatient department. − High number of hospital staff. Using the step-down technique for the allocation of
hospital personnel, the number of personnel serving this department, includingoverhead and intermediate services departments, is equal to about 154.12 FTEpersonnel. This is the highest number of FTE personnel for an inpatient department(see Graph 2 for the distribution of hospital personnel to final services departments).
− Large number of beds. The department has 109 beds, or 18.4 percent of the total
hospital beds, which is highest number of beds for an inpatient department.
In spite of the long lengths of stay, the number of patient-days per physician is still low. This isbecause the department has a large number of FTE physicians, 13.5, which is the secondhighest number of FTE physicians after the gynecology and obstetrics department at 15 FTEphysicians.
In spite of the high annual cost of the department, the annual total cost per bed is relatively lowat 7,506 L.E. due to the large number of beds (see Graph 22 for annual cost per bed).
The cost per admission is 185 L.E. (see Graph 15 for the cost per admission). Of this, theoperating theater absorbs 18 percent (32 L.E.) and drugs and medical supplies absorb 13percent (26 L.E.) of the total cost per admission. Graph 13 shows the average distribution ofcosts per admission for the general surgery department.
D. Gynecology and Obstetrics Department
Cost Analysis
• Annual cost of the department: 767,652 L.E. (21.52 percent of total annual expenditures ofinpatient departments)
• Cost per inpatient admission: 161 L.E. • Cost per day: 67 L.E. • Annual cost per bed: 10,101 L.E.
Efficiency Indicators
• Annual admissions: 4,780 (19.67 percent of total annual admissions) • Number of beds: 76 (13.19 percent of total hospital beds) • Annual patient-days of stay: 11,528 (9.92 percent of total annual patient-days) • Occupancy rate: 41.56 • Bed turnover rate: 63 • Average length of stay: 2.41
21
Department Staff
• Number of full time equivalent physicians: 15.00 • Annual admissions per FTE physician: 319 • Annual patient-days per FTE physician: 769 • Number of FTE physicians per bed: 0.20 • Number of nurses per FTE physician: 4.62 • Staff at the department (including overhead and intermediate services departments
personnel):
− Number of FTE staff: 143.52 − Number of FTE staff per bed: 1.89 − Number of FTE staff per bed (according to occupancy rate): 4.54
• Staff within the inpatient department (not including overhead and intermediate servicesdepartment personnel):
− Number of FTE staff: 99.36 − Number of FTE staff per bed: 1.31
This department has the second highest annual total cost or L.E. 767,652 constituting 22 percentof the total annual expenditures for inpatient departments. In spite of the high annual admissionsrate of 4,780 patients, which is the second highest annual admission after orthopedics at 4,914patients per year, the cost is high at 67 L.E. per day. This high cost per day is a result of the lowaverage length of stay at 2.4 days, resulting from the relatively low total annual days of stay.
The high annual total cost in the department is a result of:
• High number of FTE staff, 99, which is the second highest number of personnel after thegeneral surgery department. Using the step-down method, the number of personnel servingthis department (including overhead and intermediate services departments) is equal toabout 143.52 FTE personnel. See Graph 2 for the distribution of hospital personnel to finalservices departments.
• Operating theaters absorb 41 L.E. per admission, which is the highest in the hospital. Note
that operating theaters account for only 25 percent of the admission cost. • The OB/GYN department has 76 beds or 13 percent of total hospital beds.
The number of annual patient days and admissions per physician is relatively low at 769 and 319respectively due to the high number of FTE physicians (15.00 FTE physicians within the inpatientdepartment).
intermediate services departments, including the operating theaters, account for 33.63 percentof the total cost per admission, while overhead departments account for 8.72 percent. The fivecost categories -- equipment, building, personnel, utilities and drugs -- of the Gyn/Obs
22
department represent 57.65 percent of the total cost per admission. See Table 24 for thedistribution of costs per admission.
E. Intensive Care Unit
Cost Analysis
• Annual cost of the department: 150,351 L.E. (4.22 percent of total expenditures for inpatientdepartments)
• Cost per inpatient admission: 4,064 L.E. • Cost per day: 549 L.E. • Annual cost per bed: 12,529 L.E.
Efficiency Indicators
• Annual admissions: 37 (0.15 percent of total annual admissions) • Number of beds: 12 (2.08 percent of total hospital beds) • Annual patient-days of stay: 274 (0.24 percent of total annual patient-days) • Occupancy rate: 6.26 • Bed turnover rate: 3 • Average length of stay: 7.41
Department Staff
• Number of full time equivalent physicians: 2.9 • Annual admissions per FTE physician: 13 • Annual patient-days per FTE physician: 94 • Number of FTE physicians per bed: 0.24 • Number of nurses per FTE physician: 0.36 • Staff at the department (including overhead and intermediate services departments
personnel):
− Number of FTE staff: 10.34 − Number of FTE staff per bed: 0.86 − Number of FTE staff per bed (according to occupancy rate): 13.77
• Staff of the inpatient department (not including overhead and intermediate servicesdepartments personnel):
23
− Number of FTE staff: 7.94 − Number of FTE staff per bed: 0.66
The intensive care unit is the least efficient department in Bani Suef Hospital for the followingreasons:
− High cost per admission. The ICU is the highest of the inpatient departments at 4,064L.E.
− Low annual admission, occupancy and bed turnover rates at 37 admissions, 6.26 percentand 3 patients, respectively.
− The FTE physician per occupied bed is 3.86, which is the highest rate in the hospital.
− Number of admissions per physician. The total number of admissions for the 2.9 FTEphysicians is 37. This figure means that there is only one admission per physician permonth.
− Number of FTE staff per occupied bed. The number is astonishing at 10.58 FTE staff,
forming the highest rate not only in inpatient departments for Bani Suef General hospitalbut in all MOHP hospitals.
− The step-down allocation of hospital staff shows that the total number of FTE staff is
13.77 per occupied bed. − Number of patient-days per FTE physician is 94, the lowest number of all inpatient
departments. This means that, based on 270 annual work days, each FTE physicianexamines only one patient every 2.9 days.
− Drugs and medical supplies for ICU patients account for only 5 percent of the cost ofadmission.
As a result of the high annual depreciation costs, equipment and furniture in the ICU constitute60 percent of all annual depreciated costs of the inpatient departments, and 18 percent of thetotal hospital equipment depreciation costs. These are the highest depreciation costs in thehospital.
F. Incubator Department
Cost Analysis
• Annual cost of the department: 129,773 L.E. (3.64 percent of total annual expenditure forinpatient departments)
• Cost per inpatient admission: 459 L.E. • Cost per day: 82 L.E. • Annual cost per bed: 18,539 L.E.
24
Efficiency Indicators
• Annual admissions: 283 (1.16 percent of total annual admissions) • Number of beds: 7 (1.22 percent of total hospital beds) • Annual patient-days of stay: 1,592 (1.37 percent of total annual patient-days) • Occupancy rate: 62.31 • Bed turnover rate: 40 • Average length of stay: 5.63
Department Staff
• Number of full time equivalent physicians: 5.25 • Annual admissions per FTE physician: 54 • Annual patient-days per FTE physician: 303 • Number of FTE physicians per bed: 0.75 • Number of nurses per FTE physician: 0.44 • Staff at the department (including overhead and intermediate services departments
personnel):
− Number of FTE staff: 18.71 − Number of FTE staff per bed: 2.67 − Number of FTE staff per bed (according to occupancy rate): 44.29
• Staff of the inpatient department (not including overhead and intermediate servicesdepartments personnel):
− Number of FTE staff: 12.55 − Number of FTE staff per bed: 1.79
The annual cost per bed, 18,539 L.E., is the highest in the hospital. This is because thedepartment has only 7 beds or 1.22 percent of the total, which is the lowest number of beds inthe hospital.
The average cost per admission is 459 L.E., which is the second highest cost after the ICU. Thishigh cost per admission is a result of the low annual admission or 283 patients, representing 1.16of total annual admissions.
The cost per day is 82 L.E. Again, this number represents the second highest cost after the ICU.Drugs and medical costs account for 17.56 percent, the second highest percentage after the ENTdepartment (21.63 percent). The annual depreciated cost of equipment and furniture absorbs15.92 percent.
25
The incubator department is the most frequently used department and accounts for 3.29 ofadmission costs.
The ALOS is within range of the average at 5.63 days. However, because of the high occupancyand turnover rates at 63.75 and 40 respectively, the department, which is located in Region 1 inGraph 21, is characterized by a small proportion of unused beds and a high bed turnover rate.
The total number of personnel working within the incubator department is only 1.79 per bed,which is the highest of the inpatient departments, and can reach 2.88 per occupied bed. SeeTable 27 for the number of FTE inpatient department personnel per bed. The number of FTEphysicians per bed is 0.75, which is the highest of all inpatient departments, and can reach 1.2per occupied bed.
The step-down allocation of hospital staff reveals that the total number of FTE staff per bedreaches 2.67, which is the highest rate in the inpatient departments. The rate reaches 4.29personnel per occupied bed.
Overhead support departments absorb 19.80 percent of the total annual costs of the incubatordepartment and 5.63 percent of intermediate services departments. The five cost categories ofthe department -- equipment, building, personnel, utilities and drugs -- represent 74.57 percentof the total annual costs of the department. See Tables 21 and 22 for the distribution of annualcosts.
G. Psychiatry Department
Cost Analysis
• Annual cost of the department: 302,864 L.E. (8.49 percent of total annual expenditures forinpatient departments)
• Cost per inpatient admission: 447 L.E. • Cost per day: 15 L.E. • Annual cost per bed: 3,739 L.E.
Efficiency Indicators
• Annual admissions: 677 (2.79 percent of total annual admissions) • Number of beds: 81 (14.06 percent of total hospital beds) • Annual patient-days of stay: 19,635 (16.89 percent of total annual patient-days)• Occupancy rate: 66.41 • Bed turnover rate: 8 • Average length of stay: 29.00
Department Staff
• Number of full-time equivalent physicians: 1.5
26
• Annual admissions per FTE physician: 451 • Annual patient-days per FTE physician: 13,090 • Number of nurses per FTE physician: 16.5 • Staff at the department (including overhead and intermediate services department
personnel):
− Number of FTE staff: 54.45 − Number of FTE staff per bed: 0.67 − Number of FTE staff per bed (according to occupancy rate): 1.01
• Staff within the inpatient department (not including overhead and intermediate servicesdepartment personnel):
− Number of FTE staff: 50.25 − Number of FTE staff per bed: 0.62
The psychiatry department is considered to be one of the most efficient departments in thehospital for the following reasons:
− The cost per day is the lowest in the hospital, 15 L.E., because the department has thehighest average length of stay at 29 days.
− The occupancy rate is the highest at 66.41. Again, the high occupancy rate is a result of
long ALOS. − The number of patient-days per physician is 13,090, which is the highest rate in the
hospital. − The number of FTE staff per occupied bed, including overhead and intermediate
services departments, is one of the lowest in the hospital (0.67). The urologydepartment is the lowest with only 0.64 FTE staff per occupied bed.
− The number of FTE physicians per occupied bed is 0.02, which is the lowest number in
the inpatient departments in the hospital. This figure means that each physician isresponsible for 50 occupied beds, which reflects the severe shortage of psychiatricphysicians at Bani Suef General Hospital.
The cost per admission is 447 L.E. This high cost is a result of the long ALOS. Personnelaccount for 40.67 percent of the admission cost, followed by the annual depreciation costs of thebuilding, which absorbs 27.97 percent. Utilities account for 8.70 percent, and drugs and medicalsupplies account for 6.18 percent of the admission cost.
Both the high occupancy and low turnover rtes of the department place the department in RegionII in Graph 21.
Overhead support departments account for 11.71 percent of the total annual cost of thepsychiatry department and intermediate services departments account for 16.06. The five costcategories --equipment, building, personnel, utilities and drugs -- of the psychiatry department
27
represent 72.23 percent of the total cost per admission. See Table 24 for the distribution of costsper admission.
H. Orthopedics Department
Cost Analysis
• Annual cost of the department: 437,560 L.E. (12.27 percent of the total annual expenditurefor inpatient departments).
• Cost per inpatient admission: 89 L.E. • Cost per day: 21 L.E. • Annual cost per bed: 4,808 L.E.
Efficiency Indicators
• Annual admissions: 4,914 (20.22 percent of total annual admissions) • Number of beds: 91 (15.8 of total hospital beds) • Annual patient-days of stay: 21,176 (18.22 percent of total annual patient-days) • Occupancy rate: 63.75 • Bed turnover rate: 54 • Average length of stay: 4.31
Department Staff
• Number of full-time equivalent physicians: 6.00 • Annual admissions per FTE physician: 819 • Annual patient-days per FTE physician: 3,529 • Number of FTE physicians per bed: 0.07 • Number of nurses per FTE physician: 1.4 • Staff at the department (including overhead and intermediate services departments
personnel):− Number of FTE staff: 61.81 − Number of FTE staff per bed: 0.68 − Number of FTE staff per bed (according to occupancy rate): 1.07
• Staff within the inpatient department (not including overhead and intermediate servicesdepartment personnel):
28
− Number of FTE staff: 15.38− Number of FTE staff per bed: 0.17
The department has the following good efficiency indicator:
− The annual number of admissions is the highest at one hospital (4,914). − The cost per admission is the least in the inpatient department (21 L.E.) − The occupancy rate and turnover rate are high, 63.75 and 54 receptively. − The number of admissions per physician is the highest in the inpatient departments
(819). − Number of the patient-days per physician is 3,529, which is second highest rate after
psychiatry (13,090). − The number of FTE physicians per occupied bed is the least in the hospital (0.27).
The number of FTE physicians per occupied bed is the second lowest in the hospital (0.10) afterthe psychiatry department (0.02).
Forty percent of admission costs are absorbed by the operating theater, followed by personnelworking in the inpatient department, accounting office for 6.8 percent, which is the lowestpercentage of personnel costs in the inpatient departments. Drugs and medical supplies accountfor only 5.77 percent of admission costs.
Intermediate services departments account for 61.81 percent of the total cost per admission,while overhead departments account for 4.77 percent. The five cost categories -- equipment,building, personnel, utilities and drugs -- in the orthopedics department represent 33.42 percentof the total cost per admission. See Table 24 for the distribution of costs per admission.
I. Pediatrics Department
Cost Analysis
• Annual cost of the department: 248,337 L.E. (6.96 percent of total annual expenditure forinpatient departments).
• cost per inpatient admission: 76 L.E. • Cost per day: 35 L.E. • Annual cost per bed: 5,644 L.E.
Efficiency Indicators
• Annual admissions: 3,252 (13.38 percent of total annual admissions) • Number of beds: 44 (7.64 percent of total hospital beds) • Annual patient-days of stay: 7,185 (6.18 percent of total annual patient-days)
29
• Occupancy rate: 44.74 • Bed turnover rate: 74 • Average length of stay: 2.21
Department Staff
• Number of full-time equivalent physicians: 6.3 • Annual admissions per FTE physician: 516 • Annual patient-days per FTE physician: 1.140 • Number of FTE physicians per bed: 0.14 • Number of nurses per FTE physician: 3.57 • Staff at the department (including overhead and intermediate services departments
personnel):
− Number of FTE staff: 44.53 − Number of FTE staff per bed: 1.01 − Number of FTE staff per bed (according to occupancy rat): 2.26
• Staff within the inpatient department (not including overhead and intermediate servicesdepartments personnel):
− Number of FTE staff: 28.77 − Number of FTE staff per bed: 0.65
The turnover rate of 74 patients per year is the highest in the hospital. The average length ofstay of 2.21 days is the lowest for inpatient departments.
High turnover and low ALOS lead to the lowest cost per admission (76 L.E.). Drugs and medicalsupplies represent only 4.96 percent of the cost, or 3.78 L.E., for drugs and medical supplies peradmission for inpatient cost departments, which is the lowest.
Intermediate services departments account for 32.26 percent of the total cost per admission,while overhead departments account for 13.74 percent. The five cost categories - - equipment,building, personnel, utilities and drugs -- of the department absorb 54 percent of the total cost peradmission. See Table 23 for the distribution of costs per admission.
J. Urology Department
Cost Analysis
• Annual cost of the department: 165,567 L.E. (4.64 percent of total annual expenditure forinpatient departments)
30
• Cost per inpatient admission: 156 L.E. • Cost per day: 21 L.E. • Annual cost per bed: 4,357 L.E.
Efficiency Indicators
• Annual admissions: 1,060 (4.36 percent of total annual admissions). • Number of beds: 38 (6.6 of total hospital beds) • Annual patient-days of stay: 7,732 (6.65 percent of total annual patient-days) • Occupancy rate: 55.75 • Bed turnover rate: 28 • Average length of stay: 7.29
Department Staff
• Number of full-time equivalent physicians: 4.9 • Annual admissions per FTE physician: 216 • Annual patient-days per FTE physician: 1,578 • Number of FTE physicians per bed: 0.13 • Number of nurses per FTE physician: 0.46 • Staff at the department (including overhead and intermediate services department
personnel):
− Number of FTE staff: 24.49 − Number of FTE staff per bed: 0.64 − Number of FTE staff per bed (according to occupancy rate): 11.16
• Staff within the inpatient department (not including overhead and intermediate servicesdepartment personnel):
− Number of FTE staff: 11.16 − Number of FTE staff per bed: 0.29
The average cost per admission is 156 L.E. Drugs and personnel costs in the inpatientdepartment constitute an average of 17 percent of this cost. This is one of the few exampleswhere personnel costs equal drug costs per admission. The operating rooms constitute only 8.3percent, as most admissions do not require surgery, and the radiology department constitutes6.26 percent.

31
The average length of stay is relatively high at 7.29 days, and the turnover rate is relatively lowat 28 patients. These figures locate the department in Region IV in Graph 21, which has a lowbed turnover rate.
Intermediate services departments account for 32.26 percent of the total cost per admission,while overhead departments account for 13.74 percent. The five cost categories--equipment,building, personnel, utilities and drugs -- of the urology department represent 54.00 percent ofthe total cost per admission. See Table 22 for the distribution of costs per admission.
32
IV. Conclusion
Average costs are customarily used to provide data needed to rate hospital performance. Theaverage cost, however, is not sufficient to reach decisive conclusions regarding the sources ofhospital efficiency. Ideally, a comparative study of the cost per unit of output for severalhospitals would provide useful data on the hospitals that have provided optimal services with thegreatest efficiency. Understandably, several minimum conditions, including the quality ofservices provided and the clinical composition of the patients for each hospital, would have to beknown to give credibility to such results.
Without an understanding of the differences in quality and the case mix across the differentdepartments of Bani Suef General Hospital, the efficiency implication of variation in averagecosts cannot be properly interpreted. High average costs may reflect high quality -- expensiveequipment and adequate provision of drugs. Low average costs may be a result of aninadequate provision of drugs, thus representing poor quality, as is the case in the generalmedicine, ICU and pediatric departments where drugs and medical supplies account for only 5percent of the total cost of admission. If information on the quality of services and the case mixof patients is added to cost data, the efficiency implications of average cost information becomecomprehensible.
The average length of stay (ALOS) is an important indicator of the efficiency of hospital resourceutilization. Differences in the average length of stay among comparable types of departmentsimply differences in prevailing treatment practices across the hospital. However, withoutinformation about case mix and severity, it is difficult to use length of stay as a direct indicator ofefficiency. However, stays that are unusually long raise many questions regarding efficiency andprompt a closer look at the possible causes.
A high bed occupancy rate does not always indicate better hospital performance. Indeed, bedoccupancy rates can be too high, meaning that the volume of services is above the leveldesigned for the hospital. The implications of high occupancy rates may reflect relativelyefficient situations, as when many patients with modest lengths of stay are served (that is, thedepartment has a high bed turnover rate).
Long lengths of stay tend to have lower than average costs per day because the treatment costsfor the additional days are likely to fall below the average. However, low bed costs are notnecessarily a true indicator of inefficiency. This is because lower bed costs can be the result ofhigher occupancy without increases in inefficiency. Preferably, following a policy to increase thebed occupancy rate through a greater number of admissions per bed, rather than longer stayswill allow more patients to be served and thus boost the hospital productivity..
The study demonstrated many inefficiencies in the operation of Bani Suef General Hospital,particularly in low occupancy rates and excessive staffing in many departments. The followingsection details recommendations to improve management.
33
V. Recommendations to Help Improve the Performance and Cut Costin Bani Suef General Hospital
Hospitals perform a range of different functions: provision of inpatient treatment services withinvarious medical specialties, specialist and general outpatient care, medical and paramedicalsupport services, and other support services such as administration. It is important to know thebalance of resources absorbed by different functions. To examine the efficiency with whichdepartments of the hospital carry out their intended functions it would be desirable to havestudies which specify cost functions and estimate average costs.
In nearly all countries, the largest share of public sector health expenditure is for hospitals,regardless of a country’s health status and income level. It is both conventional and traditional todescribe developing-country health systems as hospital dominated.
Hospitals internationally absorb approximately 30-50 percent of health sector expenditures, and50-60 percent of current government health sector expenditures. General and central hospitalsaccount for 60-80 percent of the total budget for hospitals, the remainder going to districthospitals (Mills 1990). In Jordan in 1987, the MOH spent 75 percent of the total recurrent healthbudget on hospitals. In Tunisia, hospitals represent 85 percent of national government healthfacilities stet (Mills 1990).
In Egypt, as in other developing countries, the distribution of recurrent resources within thegovernment health sector strongly favors hospitals. The available data reveal that 50 percent ofMOHP resources are assigned to hospitals (National health account, 1995).
Recommendations to improve the efficiency of Bani Suef General Hospital include:
1. Hospital Autonomy
Currently, the hospital director has relatively little power for determining the number of staff,types and amount of items in the budget, drugs, maintenance, and equipment purchases.Increased hospital autonomy is the foundation for making hospitals more responsive andaccountable to local conditions and demands for health services. In addition to increasedhospital autonomy and decision making power for the hospital administration, an incentivesystem that reward increased efficiency and improved performance and good management iskey. The rewards for good management and efficiency might include, for example, financialgain, recognition, or more rapid advancement. In the United States, the incentive to improvemanagement, efficiency, and quality is frequently health insurance reimbursement and contractsonly for those hospitals demonstrating the highest standards. Reimbursements are essential forthe hospitals to remain in business.
A performance-based incentive system that incorporates efficiency indicators as those assessedin this cost analysis, plus additional indicators of quality of care, patient satisfaction, and rewardsfor the hospitals and mangers that achieve outstanding gains is one feasible method forimproving management.
In a system with greater hospital autonomy, the Ministry of Health and Population role couldchange into one of determining policies, developing incentive systems, guidelines and regulatorysystems to ensure quality of care and access for the poor and undeserved. This would diminishthe role of the ministry in determining staffing, but would increase its role in developingstandards of care, and potentially clinical guidelines.
34
2. Quality of Care
This cost study does not address how quality of care and efficiency interact. Quality of caredepends upon technically skilled staff, effective operation of equipment used for diagnosis andtreatment, adequate drugs, medical supplies, and proper sanitary conditions. This hospital isdeficient in several areas and ideally should improve both its efficiency and quality. Improvedquality of care is likely to increase patient utilization, while improving the operating efficiency ofthe hospital.
3. Hospital Staff
There is no internationally accepted protocol for staffing ratios, because staffing choices must bemade in the context of local constraints. Staffing ratios per bed or bed day are not an infallibleproxy for quality of service. Training and skill level, supporting technology, drugs and supplies,team work, and organization of services are all essential complementary co-determinants ofquality. In addition, differences in case mix between departments have an important role. Forexample, ICU patients need more staff than orthopedics patients.
An examination of staffing ratios reveals cross hospital variation in the total staff per bed andcomposition of staff. The numbers show that inpatient departments as well as outpatient clinicsprobably have excess personnel. The number of personnel (working in inpatient departmentsonly) per bed is as high 0.66 person, while 93.7 percent of time (more than 11 months per year)the bed is not used because of low occupancy rats (ICU department). These numbers will betranslated to 11 persons per occupied bed in some departments. Using the step-down techniqueto allocate hospital staff to final services departments shows that the number of personnel peroccupied bed goes up to 14. These numbers are the highest compared to other developingcountries.
Each department has to assess its need for physicians and nurses in different specialties throughthe efficiency indicators and studies of patient case mix. Current figures imply discrepanciesbetween the number of staff needed in each department with the actual patient number andoccupancy rates. This study recommends linking the hospital needs for staff according to thelevel of occupancy rate for each department.
4. Drugs and Medical Supplies
Drugs and medical supplies account on average for 9 percent of the total costs per admission.This number decreases to 5 percent in the ICU. Increases in the budget for drugs and medicalsupplies will increase the total annual costs of the hospital: however, the availability of drugs willlikely increase the quality of care and the utilization rate (number of admissions) and this, in turn,will decrease the total cost of admission. See Graph 29 for the annual number of outpatientvisits compared to drug costs. Graph 30 shows the annual bed days against the cost of drugs.
This study did not assess the availability of drugs in the hospital. However, during the study theteam members heard informal comments about temporary lapses in drug supplies during whichpatients had to purchase their pharmaceuticals from private pharmacies to ensure a continuoussupply to the hospital. A continuous, reliable supply of drugs is a sine qua non for quality care.
Increasing the autonomy of hospitals in managing the supply of drugs may assist in preventingthese lapses in supplies and therefore maintaining a better quality of care. Hospitals could holda portion of the drugs budget and not use it all to purchase drugs though the MOHP. The MOHPmay have access to favorable pricing: however, turn-around-time for drug orders can be manymonths. During this interim, hospitals could purchase needed drugs from the private sector inemergencies. Alternatively, some income from the hospital services could be set aside in an
35
emergency drug purchase fund. Hospitals could consider joining with other private and publicsector health agencies to pool drug purchasing and negotiate for lower prices.
5. Treatment Protocols
Physicians exert ultimate control over the way in which treatment procedures are used and thesubsequent length of stay of patients. Diagnosis and treatment procedures for the same causeof admission vary among physicians of the same department. The quality of care may likely beimproved by establishing a standard practice for specific admissions. However, there may beconsiderable professional controversy concerning the development of treatments standards.
6. Maintenance
Maintenance has important implications for the overall quality of the hospital environment andthe services provided. Clean and attractive surroundings increase patient satisfaction anddemand for services. The total cost of maintenance represents 1.83 percent of the annualrecurrent costs. Unfortunately, maintenance costs are directed mainly towards repairing hospitalequipment and not towards regular and preventive maintenance, for which there are no plans.The level of required maintenance depends on the operating environment, but the internationalaverage of maintenance costs ranges between 10-15 percent of the annual recurrent costs touphold the hospital operation effectively (Mills 1991).
7. Average Length of Stay
Reducing the average length of stay by increasing occupancy rate would increase the turnoverrte and would extend hospital benefits to a greater number of people. Without information aboutcase mix and severity, it is difficult to use length of stay as a direct indicator of efficiency fordepartments. however, stays that are unusually long raise questions regarding efficiency andshould provoke a closer look at possible explanations.
The study informally investigated the main causes of long average lengths of stay for differentdiagnoses. The following factors presents some sources of extended lengths of stay:
• Most of the cases admitted to inpatient care for diagnostic tests are confined until results arereceived and then proceed for medical or surgical treatments.
• Physicians’ lateness or absence due to the conflicting appointments arising from their
dividing their time between hospital service and private practice. It is critical for the hospitalto work out arrangements with the physicians to ensure that such conflicts are minimized.
• Absence of standard treatment practices, and treatment protocols for the same cause of
admission vary among the physicians of the same department. • Hospital infections as a result of poor sterilization (although very few data are available on
the magnitude of hospital infections and their effect on ALOS). International data calculate13.2 percent of surgery cases and 10.3 percent of orthopedics cases may obtain nosocomialinfection (Blanpain 1987).
8. Information Systems
It is evident that the existing information systems rarely produce the required information.Research is required into how routine systems can best be altered and augmented to providereliable data which will help identify resource allocation problems, planning changes in healthsector resource allocation patterns, monitoring changes, taking adequate account of the
36
recurrent cost burden of the hospital in investment decisions and implementation of plans.Collection and analysis of the data required to calculate average costs can be made a routinehospital activity with the objective of improved planning, management and budgeting. Adetailed, reliable information system for the collection of admissions, discharges, lab tests,drugs, personnel and other costs is needed for the implementation of any performance-basedincentive system.
9. Use of Results for Pricing and Contracts
Bani Suef General Hospital currently has a “economic ward” where private patients or patientscovered by corporate plans stay when hospitalized. The results of this study will provide adefinitive basis for negotiating a cost plus price for the daily reimbursement rate for these privatepatients based upon the average cost per day of 31 L.E. It can also be used for negotiating areimbursement rate from health insurance companies and for health insurance companies to setinsurance prices based on estimated annual costs for hospitalization and utilization in thepopulation covered. In the current health sector reform environment in which the government isconsidering social insurance schemes, this information will provide a basis for estimating costs ofhospitalization in the population.
10. Ambulatory Surgery
In industrialized countries, the hospital admission rate per capita has steadily declined. Forexample, in the United States, the number of occupied hospital beds per capita has declinedmore than 30 percent in the last 15 years despite the increasing age of the population. Thisphenomenon has resulted from an increasing transfer of inpatient services to outpatient care.most dramatically, surgical procedures have changed to outpatient services. The developmentof new techniques, instruments, better diagnostic tests and improved anesthesia with fewer sideeffects have resulted in short non-traumatic operations, rapid patient recovery and improvedpatient outcomes despite dramatically shorter hospitalizations.
Ambulatory surgery can be located either in hospitals or in independent sites. When locatedoutside of the hospital, operations within the hospitals have decreased resulting in loweroccupancy rates. However, when located within hospitals, the capacity to perform ambulatorysurgery can assist in maintaining or even increasing utilization. In a study in Cali, Colombia, thecosts per surgical case is about 30 percent of the cost of traditional surgical procedures, whilepatients satisfaction was greater for the outpatient procedure (Shepard, Walsh, et al., 1994).Other types of procedures have also been transferred to the outpatient department frominpatient, such as, long-term therapy for cancer or chronic infections and diagnostic procedures.In Cali, as an alternative to building new hospitals when the general hospital becameovercrowded, ambulatory surgical and reference units were built around the city.
For Bani Suef General Hospital, increasing the capacity of the general hospital to performambulatory surgery and other treatments would potentially assist in increasing efficiency in termsof cost per admission while fulfilling the patient demand for improved hospital care. This wouldrequire upgraded skills, on the part of the surgeons and anesthesiologist, as well as specializedequipment. The average length of stay for many operative admissions is many days longer thanthe US. See Table 14.
11. Nosocomial Infection
A study in one university hospital n Cairo revealed that the overall hospital-acquired infectionrate was 5.6 percent of the total patients discharged. Post-operative wound infection is the mostfrequent infection site. The infection rate reached 10 percent of the total patients discharged Ispecial surgery departments. Bani Suef General Hospital should use a surveillance system for

37
the continuous monitoring of hospital-acquired infection. Controlling hospital acquired infectionwill increase the bed turnover rate and reduce both the average length of stay and the total costper admission.

38
Bibliography
Averill, R.F., T.E. McGuire, B.E. Manning, D.A. Fowler, S.D. Horn, P.S.Dickson, M.J. Coye, D.L. Knowlton, and J.A. Bender, “A Study of the Relationship BetweenSeverity of Illness and Hospital Cost in New Jersey Hospitals”, Health Services Research27(5), 586-604 (1992).
Barnum, Howard and Joseph Kutzin. Public Hospitals in Developing Countries:Resource Use, Cost, Financing. Baltimore: Johns Hopkins University Press, 1993.
Cleverley W.O., and R.K. Harvey. “Critical Strategies for Successful RuralHospitals.” Health Care Management Review, Winter 1992.
Creese, Andrew and David Parker, eds. Cost Analysis in Primary Health Care: A TrainingManual for Program Managers. Geneva, Switzerland: World Health Organization, 1994.
Holly, W. “Health Financing in Tuvalu”. Health and Financing Report No. 11, submitted to theHealth Services Division, Office of Health, Bureau for Research and Development, U.S.Agency for International Development, 1993.
Holly, W. “Cost Analysis for Niamey Hospital.” Prepared under USAID Project 683-0254.Bethesda, MD: Abt Associates 1989.
Jacobs P., and W.T. Noseworthy. “National Estimates of Intensive Care Utilization and Costs:Canada and the United States.” Critical Care Medicine, Vol. 18, No. 11, 1990.
Janowitz, B., and J.H. Bratt . “Methods for Costing Family Planning Services.” United NationsPopulation Fund, 1994.
Jolly, D, Gerbaud I. “The Hospital for Tomorrow. Division of Strengthening of Health Services.”Report Number 5. Geneva: World Health Organization., 1992.
JSI (John Snow, Inc.). Papua New Guinea: Health Sector Financing Study Project Prepared forthe Papua New Guinea Department of Health under contract with the Asia Development Bank,TA 1091, - PNG. Boston, 1990.
Kemprecos, L. Health Care Financing in Egypt. Reston, VA: Cambridge ConsultingCorporation, 1994.
Lebreghe, W.V., and Y. Lafort. The Role of the Hospital in the District Delivery or SupportingPrimary Health Care. Public Health Research and Training Unit, Institute for TropicalMedicine. Antwerp, Belgium, 1990.
Mills, A. J., J. Kapalamula and S. Chisimbi. “ The Cost of the District Hospital: A Case Studyin Malawi.” WHO Bulletin OMS. Vol 71, 1993.
Mills, A. “Survey and Examples of Economic Evaluation of Health Programs in DevelopingCountries.” World Health Quarterly 28 (4): 402-32, 1985.
Mills, A. “The Economics of Hospitals in Developing Countries. Part I: Expenditure Patterns.”Health Policy and Planning 5(2): 107-17, 1990.

39
Mills, A. “The Economic of Hospitals in Developing Countries. Part II: Costs and Sources ofIncome.” Health Policy and Planning. 5(3): 203-18, 1990.
Mills, A. “The Costs of the District Hospital: A Case Study from Malawi.” PRE Working Paper742, World Bank, Population and Human Resources Department, Population, Health, andNutrition Division, Washington, D. C, 1991.
Newbrander, W., H. Barnum, J. Kutzin. Hospital Economics and Financing in DevelopingCountries. Division of Strengthening of Health Services. NHP/92.2. Geneva, Switzerland:World Health Organization, 1992.
Rannan-Eliya, R.P., and P. Berman. National Health Accounts for Egypt. DDM PublicationNo. 25. Boston MA: Harvard School of Public Health, 1995.
Shepard, D., S. Layes, and C. Emmou. “Cost-Effectiveness of the Expanded Program onImmunization in the Ivory Coast: A Preliminary Assessment.” Social Science and Medicine22(3): 369-77, 1986.
Shepard, D., J. Walsh, W. Munar, L. Rose, R. Guerrero, L.F. Cruz , G. Reyes G. Price, andC. Solarte . “Cost-Effectiveness of Ambulatory Surgery in Cali, Columbia.” Working Paper1, Department of Population and International Health. Harvard School of Public Health,Boston, 1991.
World Development Report: Investing in Health. Oxford: Oxford University Press, 1993.

40
Annex I: Text Tables

76
Annex II: Text Figures
108
Annex III: Definitions and Data Notes
Admission per physician: The average number of patient admissions per full time equivalentphysician during one year.
= annual admissions / total number of FTE physicians
Allocative efficiency: The extent of optimality reached in the distribution of resources among anumber of competing uses.
Ancillary service cost: These include the cost of all cost centers in intermediate servicesdepartments except kitchen and laundry cost centers.
Annual admissions: Total number of admissions during reference time (July 1, 1993 to June30, 1994).
Annual days of stay: The total number of patient-days from admission to discharge during oneyear.
Annual cost of department: The total annual cost of the department after allocation ofoverhead and intermediate services departments using the step-down allocation method (seetable 17).
Annual hospital expenditures: Includes the annual cost of personnel, medications,depreciation of buildings and equipment, and food and utilities.
Annual values: Values of the use of capital items for health services, such as equipment,vehicles and building, for one year.
Average cost (unit cost): Defined as the total cost divided by number of units of output, e.g.,cost per admission, cost per patient-day and cost per outpatient visit. Similarly, marginal cost isthe additional cost required to produce one more unit of output.
Average length of stay (ALOS): The mean number of days from admission to discharge fordiagnosis and inpatient department.
ALOS = Annual number of inpatient days/Annual number of admissions.
Bed turnover rate (T): The average number of patient admissions per bed during one year.
T = Annual number of admissions/Average number of available hospital beds during ayear.
Costs: The products of price (or unit costs) and the number of units consumed (or serviceintensity). The higher the average level of unit costs, the more important the variation in serviceintensity.
Capital cost: The annual cost of resources that have a life expectancy of more than one year,e.g., buildings, equipment and vehicles. Staff training also can be classified as capital cost if thenew skills are expected to last for one year or more. The costs of refresher training courses thatoccur throughout the year should be classified as recurrent.
109
Cost-effectiveness analysis: The technique used for identifying which health interventionsachieve the greatest level of health impact per unit of investment.
Cost per admission = Total annual cost of inpatient department/total annual number ofadmissions for the department.
Direct costs of department: The costs attributed to each cost center prior to the allocation ofthe cost centers associated with hospital outputs.
Disability-adjusted life year (DALY): The unit used for measuring both the global burden ofdisease and the effectiveness of health interventions, as indicated by reductions in the diseaseburden. It is calculated as the present value of the future years of disability-free life that are lostas the result of the premature deaths or cases of disability occurring in a practical year.
Equipment operation and maintenance: Cost of maintaining equipment in operating order.
Economic cost: Presents the opportunity cost of using resources and inputs in one interventionrather in their next best intervention use. More formally, it is the payment required to keep thatinput in its present employment, or… the remuneration the input would receive in its bestalternative employment (Nicholson, W., Microeconomics Theory: Basic Principles andExtensions, Fourth Edition, Dryden Press, New York, 1989, p. 309).
Economic efficiency: Economic inefficiency occurs when the hospital is not using the leastexpensive combination of inputs for a given output (Barnum 1993).
Final service departments: Cost centers which provide services directly to patients and not toother departments, e.g. inpatient departments and outpatient clinics.
Financial cost: The actual expenditures or outlays made for a specific intervention.
Full-time equivalent (FTE) physician: FTE was calculated by dividing each physician’s workby specialty by the ratio of his/her work in outpatient clinics, inpatient departments, operationtheaters and the emergency unit (table 6 presents the percentage of working time per activity forphysicians for each department).
FTE physician for inpatient departments: The total number of physicians working at inpatientdepartments and operating rooms.
FTE physician per bed: Measures the number of physicians working full-time per bed forinpatient departments.
= Total number of physicians working at inpatient departments and operating rooms/totalnumber of beds.
FTE staff step-down: The study used the step-down allocation technique to allocate overheadand intermediate services department personnel to final service departments to get the totalnumber of full-time equivalent personnel working in each final service department.
Hotel services cost: This includes food and laundry costs.
Intermediate services departments: Intermediate services departments are those that offerservices both directly to patients and to other final medical departments. Examples include:operating theaters, laboratory and X-ray. In this analysis, kitchen and laundry departments werealso included in the intermediate category because costs in these centers were estimated anddistributed in a way similar to those of other intermediate services departments.
110
Intervention (in health): A specific activity meant to reduce disease risks, treat illness, orpalliate the consequences of disease and disability.
Number of nurses per FTE physician: Measures the number of nurses working with a full-timephysician.
= Total number of nurses/total number of FTE physicians
Overhead departments: Cost centers which produce only those services that are consumed byother departments (cost centers) of the hospitals, not by patients. Examples include:maintenance, legal affairs and finance.
Overhead cost: These costs remain essentially constant regardless of whether a bed isoccupied.
Occupancy rate (OCC): Measures the percentage of total available beds that are occupied bypatient during on year.
OCC = (Annual number of patient days) X 100 /(Average number of available hospital bedsduring a year) X 365 days.
Patient days per FTE physician:
= annual number of patient days at inpatient department/ Total number of FTEphysicians working at the inpatient department.
Per Diem: Cost of daily stipends for health workers involved in supervision activities.
Personnel cost: Value of labor, including health professionals, administrative staff, and non-health personnel (e.g., drivers), used to provide health services during the reference period.
Present value (current values): Estimates the current value of the capital item – the amountyou would have to pay to purchase a similar item at the present time (the replacement valuerather than the original price). It is the market value of the item e.g., equipment, square meter ofconstructions (WHO cost analysis manual 1992).
Reference time: The period of data collection for costing of the health facilities from July 1,1993 to June 30, 1994.
Recurrent cost: The cost associated with inputs that will be consumed or replaced in one yearor less, for example, staff salaries, utilities, drugs and medical supplies.
Step-down method: The technique used to distribute costs from the overhead departments toother overhead departments and finally to intermediate and final services departments,according to allocation criteria devised to resemble as closely as possible the actual use ofresources by each department. The term “step-down” is used because of the format in which thedistribution of costs is made.
Technical efficiency: The extent to which choice and utilization of input of resources producesa specific health output, intervention or service at the lowest cost (WDR 1993).
Tertiary-based health services: A hospital or other health facility that offers a specialized,highly technical level of health care for the population of a large region. Characteristics include

111
specialized intensive care units, advanced diagnostic support services and highly specializedpersonnel.
Useful life: Estimates the number of years of useful life the item realistically can be expected tohave after being acquired
111
Annex IV: Data Sources
I. Hospital Cost
A. Capital Cost
1. Building space:
− Engineering Department
− Maintenance Department
2. Equipment, vehicles and furniture:
− Physical inventory
− Log books no. 118, 112, and 121
− List of received items for nurses at different departments.
− Purchase dept. at health directorate.
B. Recurrent Cost
1. Personnel:
− Sheet no. 132 A.H.
− Sheet no. 50 A.H.
− Log book for salary
− Personnel Department
2. Drugs and medical supplies:
− Log book for inpatient, outpatient and emergency pharmacies
3. Utilities, include
− Water: Receipts for water
− Electricity: Receipts for electricity
− Telephone: Receipts for telephone
− Gas: Receipts for gas
− Benzene, oil: Receipt for benzene and oil4. Others, include
112
− Food: Receipts for food− Stationery: Receipts for stationery
5. Maintenance, include:
− Building: Receipt for maintenance
− Equipment: Receipt for maintenance
− Vehicle: Receipt for maintenance
II. Hospital Statistics
Number of admission: Admissions discharge log book for 1993-94.
ALOS: Admissions discharge log book for 1993-94.
Outpatient visits: Outpatient log book for 1993-94.
Surgical procedures: Log book for operation theaters for 1993-94.
Lab tests: Log book for inpatient laboratory for 1993-94.
X ray: Log book for inpatient and outpatient radiology departments.

113
Annex V: Data Collection Forms