Embed Size (px)
Citation preview
Cost and benefits of using
alternative fuels
Joint study of DNV GL and MAN Diesel & Turbo
Christian S. Mørch (presenting), Hendrik W. Brinks (presenting),
Pierre Sames, Niels B. Clausen, Christos Chryssakis, Per R. Kristensen
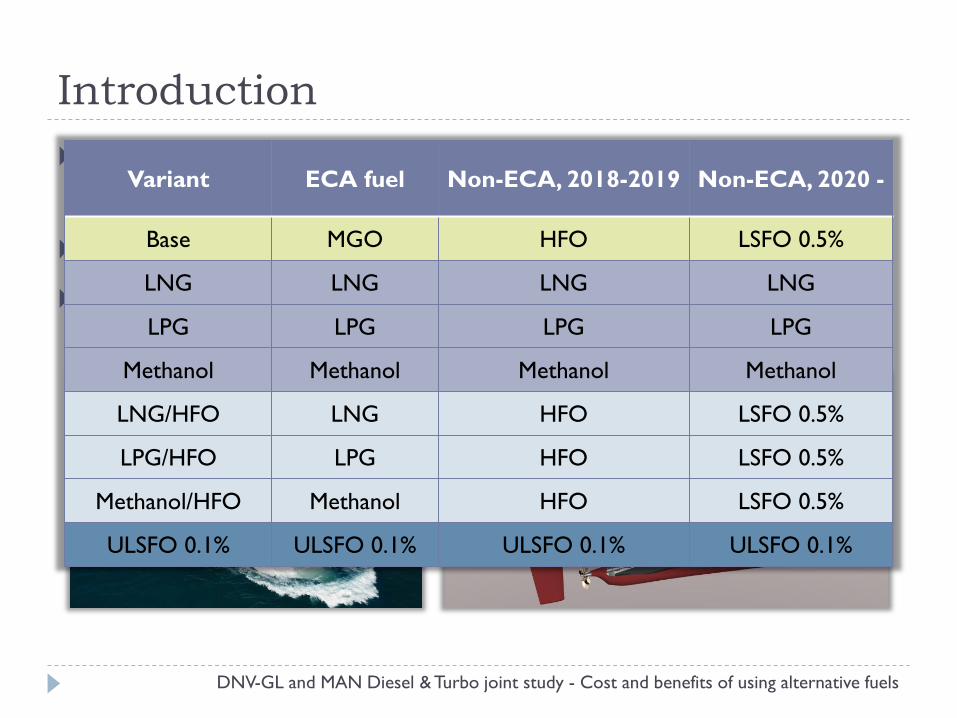
Introduction
New emission regulation
High focus on fuel alternatives
Compare alternatives for a specific ship
Focus on comparing fuels
Variant ECA fuel Non-ECA, 2018-2019 Non-ECA, 2020 -
Base MGO HFO LSFO 0.5%
LNG LNG LNG LNG
LPG LPG LPG LPG
Methanol Methanol Methanol Methanol
LNG/HFO LNG HFO LSFO 0.5%
LPG/HFO LPG HFO LSFO 0.5%
Methanol/HFO Methanol HFO LSFO 0.5%
ULSFO 0.1% ULSFO 0.1% ULSFO 0.1% ULSFO 0.1%
DNV-GL and MAN Diesel & Turbo joint study - Cost and benefits of using alternative fuels
Length, O.A. 225 m
Breadth, Mld. 32.26 m
Draught, Scantling 14.2 m
Main Engine 1 x MAN B&W 6G60ME-C9.5
SMCR 11,500 kW at 92 RPM
NCR (90% SMCR) 10,390 kW at 88.8 RPM
Design speed at NCR 15 knots
PTO Aft mounted fixed ratio, 778 kW
Genset 3 x MAN 7L23/30H at 944 kW
D N
V
3
0
2
2 2
V
0
.
0
2
1 11
11
2
222 2
2
2
2
2 2
2
2
1
1
1
1
1
1
1
1
1
1
1
1
1
1
1
1
1
1
2
1
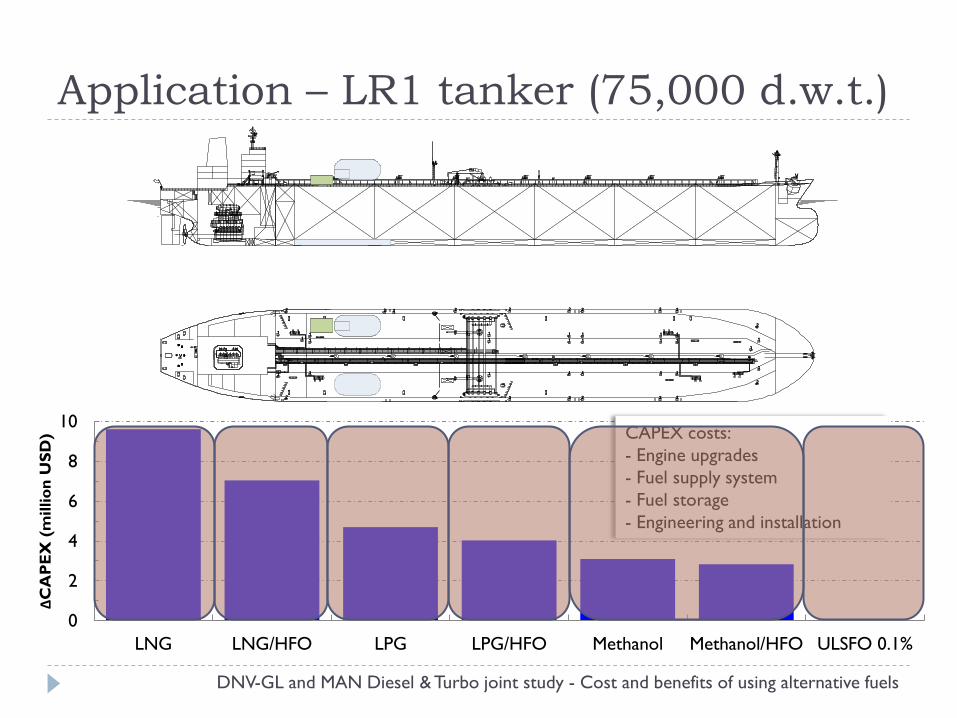
Application – LR1 tanker (75,000 d.w.t.)
D N
V
3
0
2
2 2
V
0
.
0
2
1 11
11
2
222 2
2
2
2
2 2
2
2
1
1
1
1
1
1
1
1
1
1
1
1
1
1
1
1
1
1
2
1
D N
V
3
0
2
2 2
V
0
.
0
2
1 11
11
2
222 2
2
2
2
2 2
2
2
1
1
1
1
1
1
1
1
1
1
1
1
1
1
1
1
1
1
2
1
D N
V
3
0
2
2 2
V
0
.
0
2
1 11
11
2
222 2
2
2
2
2 2
2
2
1
1
1
1
1
1
1
1
1
1
1
1
1
1
1
1
1
1
2
1
0
2
4
6
8
10
ΔC
AP
EX
(m
illio
n U
SD
) CAPEX costs:
- Engine upgrades
- Fuel supply system
- Fuel storage
- Engineering and installation
0
2
4
6
8
10
LNG LNG/HFO LPG LPG/HFO Methanol Methanol/HFO ULSFO 0.1%
ΔC
AP
EX
(m
illio
n U
SD
) CAPEX costs:
- Engine upgrades
- Fuel supply system
- Fuel storage
- Engineering and installation
DNV-GL and MAN Diesel & Turbo joint study - Cost and benefits of using alternative fuels
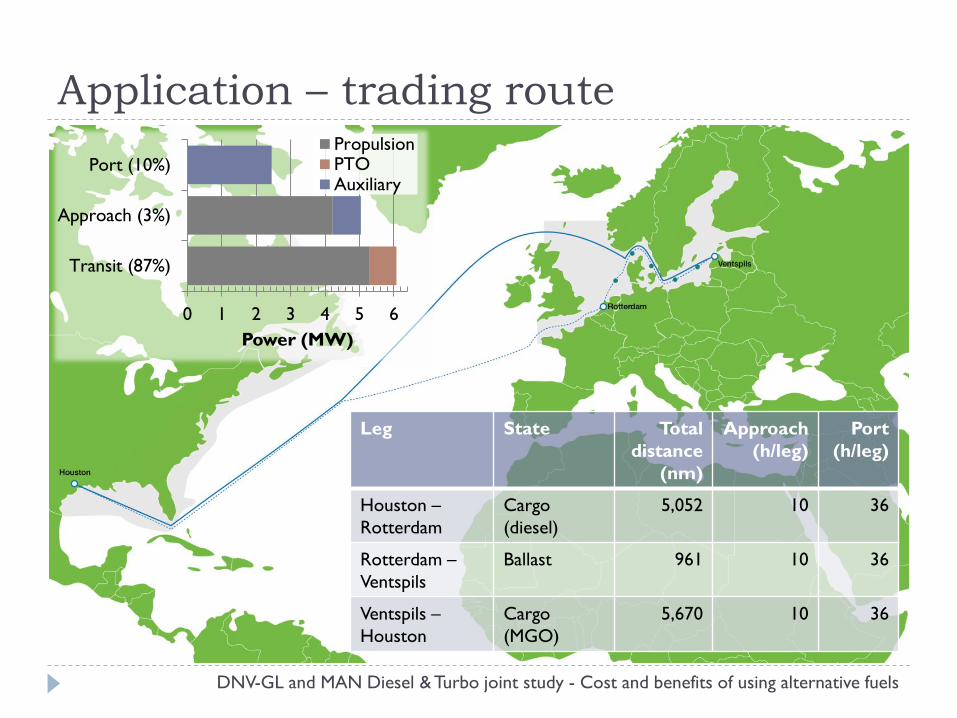
Application – trading route
DNV-GL and MAN Diesel & Turbo joint study - Cost and benefits of using alternative fuels
Leg State Total
distance
(nm)
Approach
(h/leg)
Port
(h/leg)
Houston –
Rotterdam
Cargo
(diesel)
5,052 10 36
Rotterdam –
Ventspils
Ballast 961 10 36
Ventspils –
Houston
Cargo
(MGO)
5,670 10 36
0 1 2 3 4 5 6
Transit (87%)
Approach (3%)
Port (10%)
Power (MW)
PropulsionPTOAuxiliary
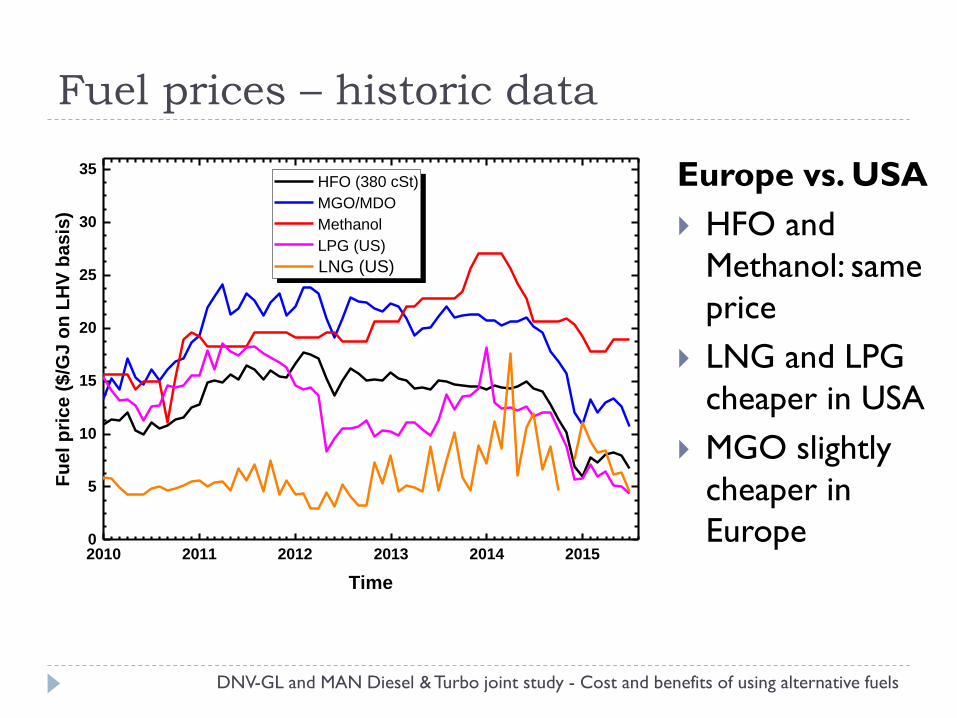
Fuel prices – historic data
Europe vs. USA
HFO and
Methanol: same
price
LNG and LPG
cheaper in USA
MGO slightly
cheaper in
Europe 2010 2011 2012 2013 2014 20150
5
10
15
20
25
30
35
Fu
el
pri
ce
($
/GJ
on
LH
V b
as
is)
Time
HFO (380 cSt)
MGO/MDO
Methanol
LPG (US)
LNG (US)
DNV-GL and MAN Diesel & Turbo joint study - Cost and benefits of using alternative fuels
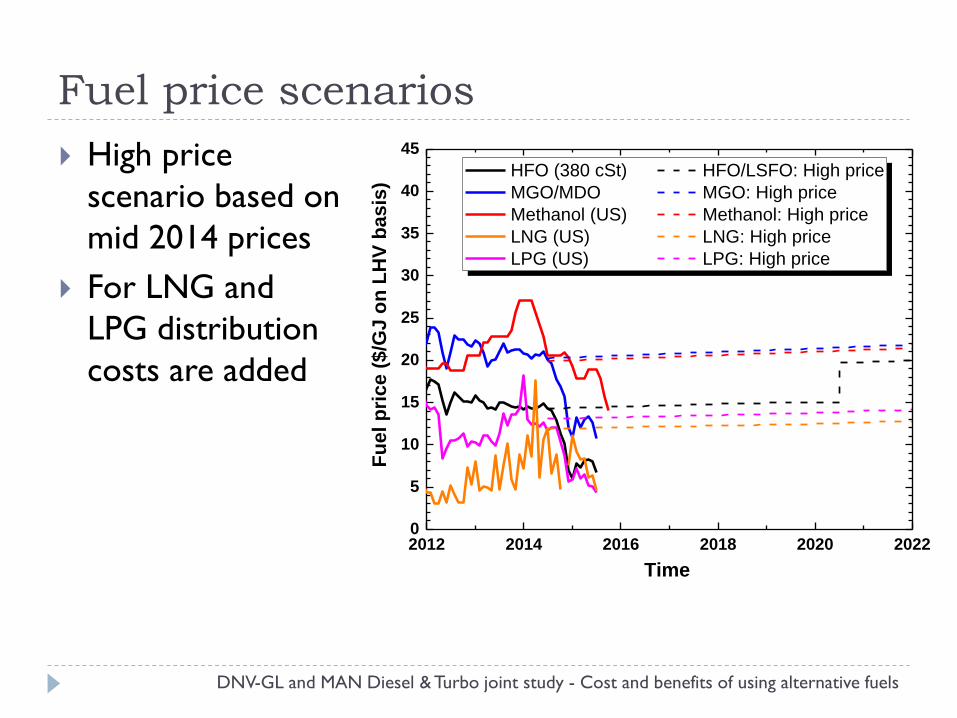
Fuel price scenarios
High price
scenario based on
mid 2014 prices
For LNG and
LPG distribution
costs are added
2012 2014 2016 2018 2020 20220
5
10
15
20
25
30
35
40
45
Fu
el
pri
ce
($
/GJ o
n L
HV
ba
sis
)
Time
HFO (380 cSt) HFO/LSFO: High price
MGO/MDO MGO: High price
Methanol (US) Methanol: High price
LNG (US) LNG: High price
LPG (US) LPG: High price
DNV-GL and MAN Diesel & Turbo joint study - Cost and benefits of using alternative fuels
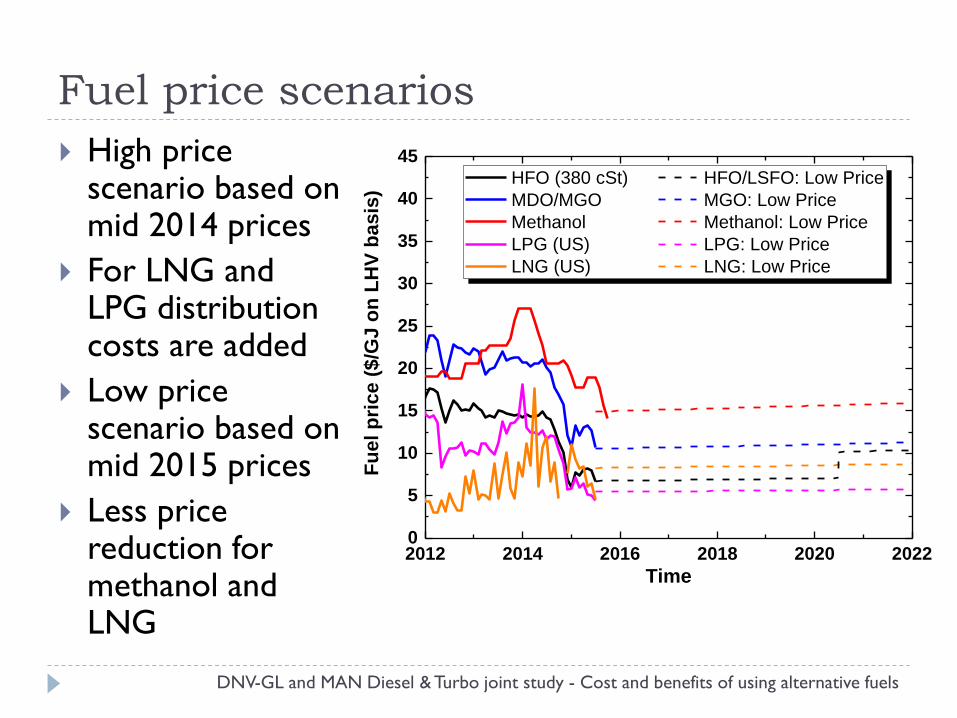
Fuel price scenarios
High price scenario based on mid 2014 prices
For LNG and LPG distribution costs are added
Low price scenario based on mid 2015 prices
Less price reduction for methanol and LNG
2012 2014 2016 2018 2020 20220
5
10
15
20
25
30
35
40
45
Fu
el
pri
ce
($
/GJ
on
LH
V b
as
is)
Time
HFO (380 cSt) HFO/LSFO: Low Price
MDO/MGO MGO: Low Price
Methanol Methanol: Low Price
LPG (US) LPG: Low Price
LNG (US) LNG: Low Price
DNV-GL and MAN Diesel & Turbo joint study - Cost and benefits of using alternative fuels
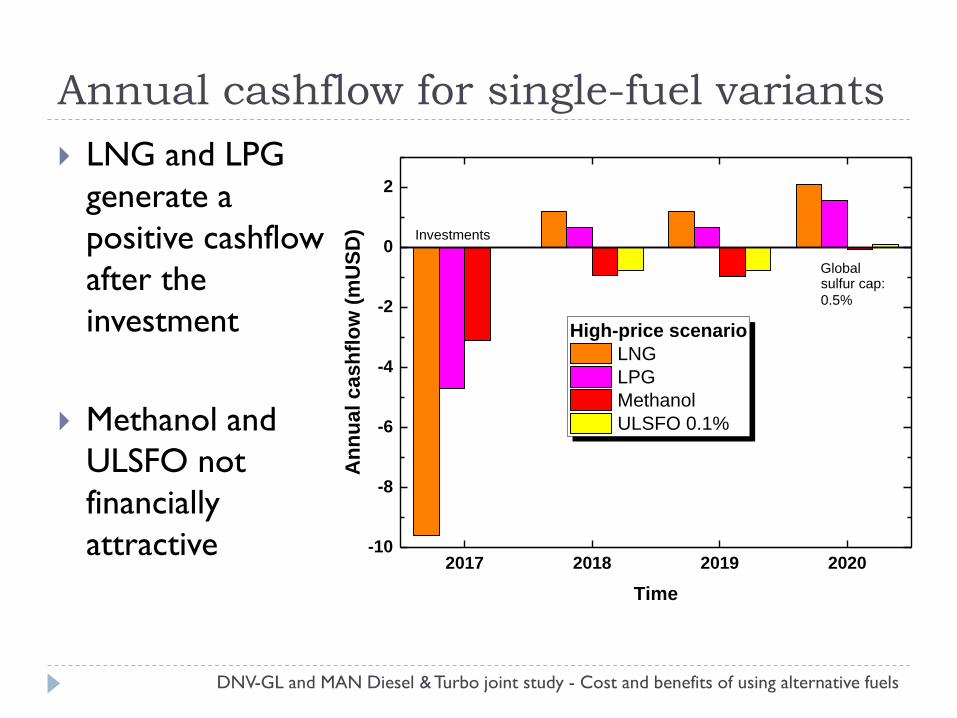
Annual cashflow for single-fuel variants
LNG and LPG
generate a
positive cashflow
after the
investment
Methanol and
ULSFO not
financially
attractive 2017 2018 2019 2020
-10
-8
-6
-4
-2
0
2
Investments
An
nu
al
ca
sh
flo
w (
mU
SD
)
Time
High-price scenario
LNG
LPG
Methanol
ULSFO 0.1%
Globalsulfur cap:
0.5%
DNV-GL and MAN Diesel & Turbo joint study - Cost and benefits of using alternative fuels
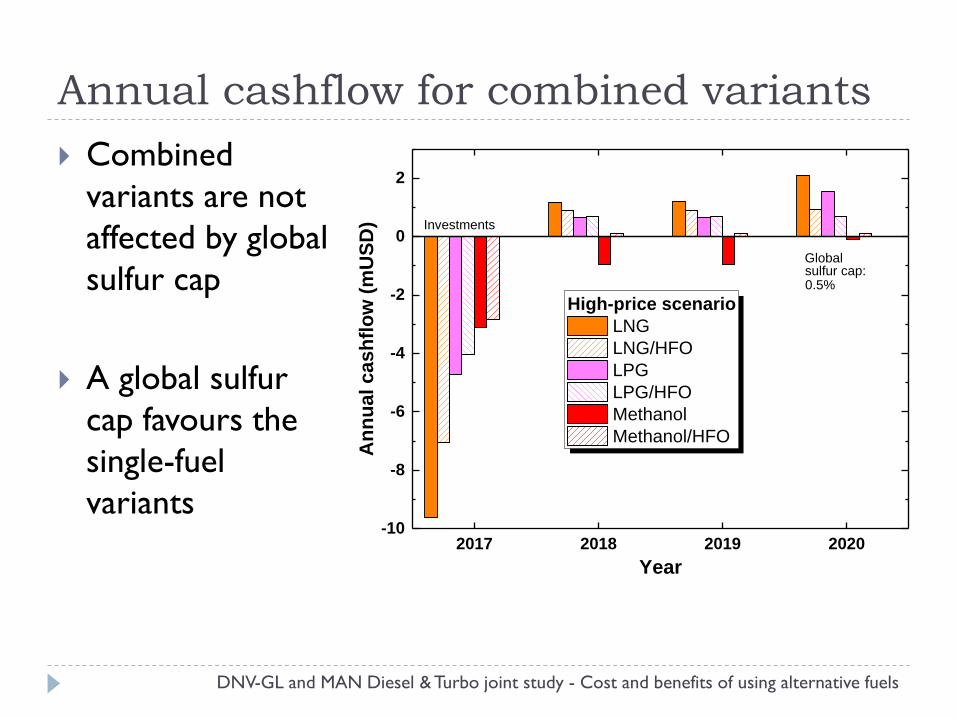
Annual cashflow for combined variants
Combined
variants are not
affected by global
sulfur cap
A global sulfur
cap favours the
single-fuel
variants
2017 2018 2019 2020-10
-8
-6
-4
-2
0
2
Investments
An
nu
al cash
flo
w (
mU
SD
)
Year
High-price scenario
LNG
LNG/HFO
LPG
LPG/HFO
Methanol
Methanol/HFO
Globalsulfur cap:0.5%
DNV-GL and MAN Diesel & Turbo joint study - Cost and benefits of using alternative fuels
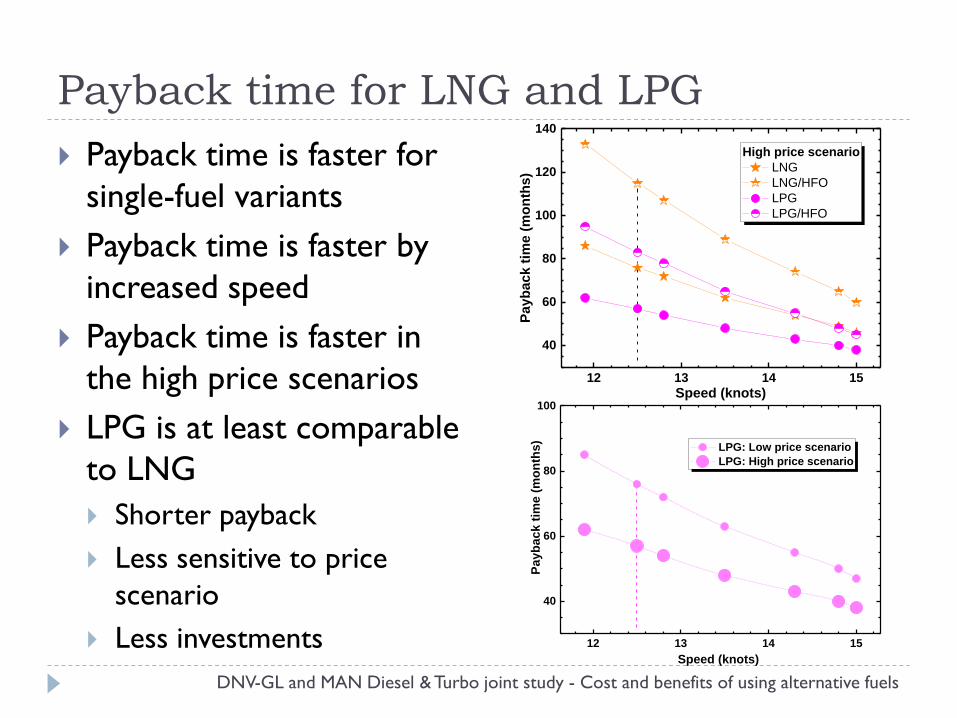
Payback time for LNG and LPG
Payback time is faster for
single-fuel variants
Payback time is faster by
increased speed
Payback time is faster in
the high price scenarios
LPG is at least comparable
to LNG
Shorter payback
Less sensitive to price
scenario
Less investments
DNV-GL and MAN Diesel & Turbo joint study - Cost and benefits of using alternative fuels
12 13 14 15
40
60
80
100
120
140
Pa
yb
ac
k t
ime
(m
on
ths
)
Speed (knots)
High price scenario
LNG
LNG/HFO
LPG
LPG/HFO
12 13 14 15
40
60
80
100
Pay
ba
ck
tim
e (
mo
nth
s)
Speed (knots)
LPG: Low price scenario
LPG: High price scenario
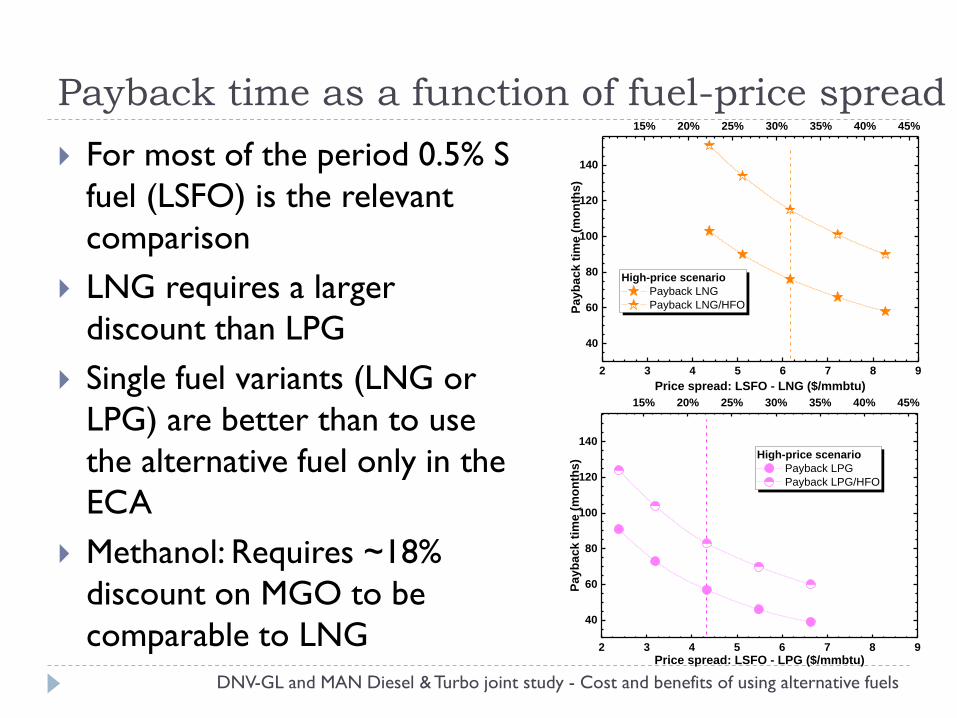
Payback time as a function of fuel-price spread
For most of the period 0.5% S
fuel (LSFO) is the relevant
comparison
LNG requires a larger
discount than LPG
Single fuel variants (LNG or
LPG) are better than to use
the alternative fuel only in the
ECA
Methanol: Requires ~18%
discount on MGO to be
comparable to LNG
DNV-GL and MAN Diesel & Turbo joint study - Cost and benefits of using alternative fuels
2 3 4 5 6 7 8 9
40
60
80
100
120
140
Pa
yb
ac
k t
ime
(m
on
ths
)
Price spread: LSFO - LNG ($/mmbtu)
High-price scenario
Payback LNG
Payback LNG/HFO
15% 20% 25% 30% 35% 40% 45%
2 3 4 5 6 7 8 9
40
60
80
100
120
140
Pa
yb
ac
k t
ime
(m
on
ths
)
Price spread: LSFO - LPG ($/mmbtu)
High-price scenario
Payback LPG
Payback LPG/HFO
15% 20% 25% 30% 35% 40% 45%
Conclusions
Regulations call for alternative fuels
as a means of compliance
Costs and benefits for various fuels
(LNG, LPG, methanol, ULSFO) were
investigated
LNG and LPG were found to be the
most promising options
For the most promising alternative
fuels, the best option is to use the
fuel both in ECAs and non-ECAs.
Financial attractiveness is highly
dependent on fuel price scenario. DNV-GL and MAN Diesel & Turbo joint study - Cost and benefits of using alternative fuels
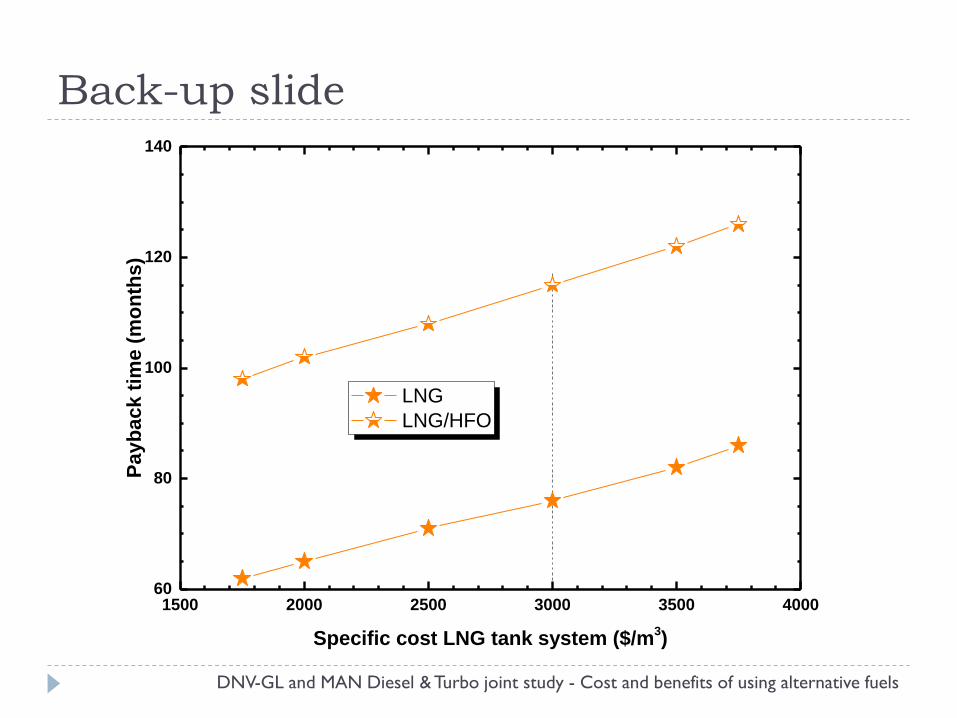
Back-up slide
1500 2000 2500 3000 3500 400060
80
100
120
140P
ayb
ack t
ime (
mo
nth
s)
Specific cost LNG tank system ($/m3)
LNG
LNG/HFO
DNV-GL and MAN Diesel & Turbo joint study - Cost and benefits of using alternative fuels
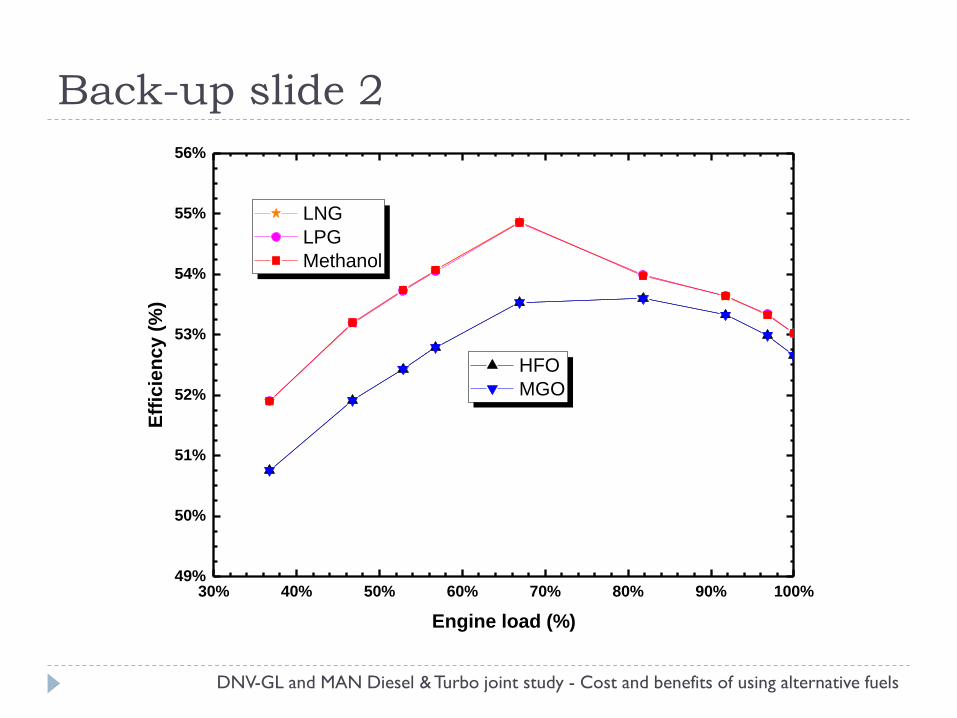
Back-up slide 2
30% 40% 50% 60% 70% 80% 90% 100%49%
50%
51%
52%
53%
54%
55%
56%
HFO
MGO
Eff
icie
ncy (
%)
Engine load (%)
LNG
LPG
Methanol
DNV-GL and MAN Diesel & Turbo joint study - Cost and benefits of using alternative fuels
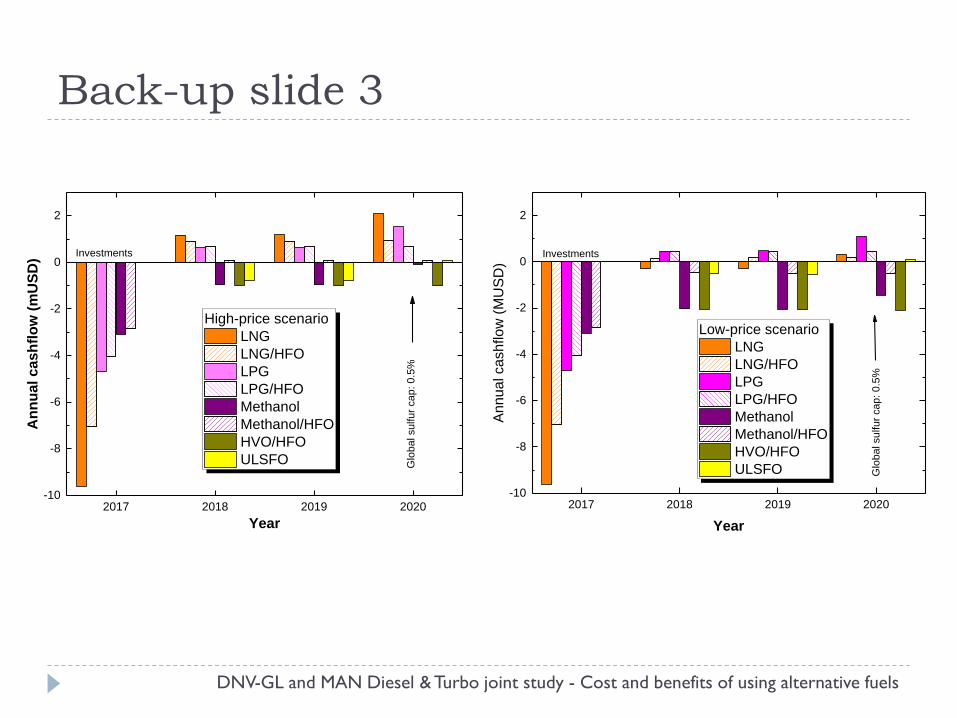
Back-up slide 3
2017 2018 2019 2020-10
-8
-6
-4
-2
0
2
Investments
Glo
ba
l su
lfu
r ca
p:
0.5
%
Annu
al ca
sh
flo
w (
MU
SD
)
Year
Low-price scenario
LNG
LNG/HFO
LPG
LPG/HFO
Methanol
Methanol/HFO
HVO/HFO
ULSFO
2017 2018 2019 2020-10
-8
-6
-4
-2
0
2
Investments
Glo
ba
l su
lfu
r ca
p:
0.5
%
An
nu
al ca
sh
flo
w (
mU
SD
)
Year
High-price scenario
LNG
LNG/HFO
LPG
LPG/HFO
Methanol
Methanol/HFO
HVO/HFO
ULSFO
DNV-GL and MAN Diesel & Turbo joint study - Cost and benefits of using alternative fuels