Embed Size (px)
Citation preview
COST ASSESSMENT OF ENVIRONMENTAL DEGRADATION IN THE MIDDLE EAST AND NORTH
AFRICA REGION – SELECTED ISSUES
Bjorn Larsen
Working Paper 583
May 2011
Send correspondence to: Bjorn Larsen Freelance Consultant [email protected]
First published in 2011 by The Economic Research Forum (ERF) 7 Boulos Hanna Street Dokki, Cairo Egypt www.erf.org.eg Copyright © The Economic Research Forum, 2011 All rights reserved. No part of this publication may be reproduced in any form or by any electronic or mechanical means, including information storage and retrieval systems, without permission in writing from the publisher. The findings, interpretations and conclusions expressed in this publication are entirely those of the author(s) and should not be attributed to the Economic Research Forum, members of its Board of Trustees, or its donors.
1
Abstract
This paper estimates the cost of inadequate potable water, sanitation and hygiene, outdoor air pollution, and cropland degradation in 16 countries of the Arab League. Estimated annual cost was equivalent to 3.4 percent of the countries’ GDP in 2008, averaging 3.1 percent of GDP in the 10 countries with the highest GDP per capita and 8.7 percent of GDP in the 6 countries with the lowest GDP per capita. Cost as a percent of GDP declines by 0.6 percent per one percent increase in GDP per capita across the 16 countries. This association is primarily driven by the cost of inadequate water, sanitation and hygiene, to a much lesser extent by the cost of land degradation, and to no statistically significant extent by the cost of outdoor air pollution. Costs of other forms of environmental degradation are also likely to be substantial in at least some of the countries as evidenced by the METAP/World Bank cost of environmental degradation studies from 2002-2004 and reports from recent household surveys of high prevalence of household use of solid fuels, and thus household air pollution, in five of the six countries with the lowest GDP per capita.
ملخص
واء ، وتدهور تقدر وث اله ة الصحية ، وتل اه والصرف الصحي والنظاف اه الشرب المي ة مي ة هذه الورقة تكلفة عدم آفاي حالي ة ف ة 16األراضي الزراعي دول العربي ن ال دا م در و. بل ادل تق ا يع نوية بم ة الس ي 3،4التكلف اتج المحل ن الن ة م ي المئ فدر بلدان ال من 10في المئة من الناتج المحلي اإلجمالي في 3،1حيث بلغ متوسطها ، 2008اإلجمالي للبلدان في عام ي يق الت
ي 8،7بلغ متوسطها و للفرد من أعلى المعدالتالمحلي هااتجن الي ف ي اإلجم دان ال من 6في المئة من الناتج المحل ي بل التي 0،6مئوية من الناتج المحلي اإلجمالي نسبة انخفاض التكلفة آنسبة وسجلت.للفرد من أقل المعدالتالمحلي هااتجن يقدر ف
ام األول هذا الربط.بلدا 16واحد في المئة في الناتج المحلي اإلجمالي للفرد الواحد في جميع أنحاء لكلالمائة مدفوع في المقة المترت دهور األراضي ، من قبل تكلفة عدم آفاية المياه والصرف الصحي والنظافة، إلى حد أقل بكثير من التكلف ى ت ة عل ب
واء ودوإلى حد وث اله د .ال يعتد بها إحصائيا من تكلفة تل اليف تع ي األخرى من شكال األتك دهور البيئ من المحتمل أن الترت ون آبي ا ةك دان آم ي بعض البل ل ف ى األق دهور تشيراعل ن الت ة م ارير ل 2004-2002لدراسات البيئي دولي والتق ك ال لبن
ود الصلب، االت االستقصائية لألسر المعيشية األخيرة من ارتفاع معدل انتشار الواردة من الدراسا ستخدام المنزلي من الوق .دنى للفرد الواحداألوبالتالي تلوث الهواء ، في خمس من الدول الست مع الناتج المحلي اإلجمالي
2
1. Introduction METAP/World Bank undertook cost of environmental degradation assessments in seven countries of the Arab League for the year 2000 (+/- 1 year), i.e., in Algeria, Egypt, Jordan, Lebanon, Morocco, Syria and Tunisia. This paper expands the cost assessment to sixteen countries of the Arab League for the year 2007/08 with focus on the three environmental categories found in the METAP/World Bank studies to have the highest cost of degradation, i.e., potable water, sanitation and hygiene, outdoor air pollution in urban areas, and land degradation in relation to agricultural crop cultivation.1 The sixteen countries are the seven countries included in the METAP/World Bank studies and the additional countries of Comoros, Djibouti, Iraq, Libya, Mauritania, Somalia, Sudan, West Bank and Gaza, and Yemen. The higher income gulf countries of Bahrain, Kuwait, Oman, Qatar, Saudi Arabia, and United Arab Emirates are not included in this assessment, as the cost of environmental degradation pertaining to at least two of the environmental categories addressed in this paper is much lower in these countries. These six countries generally have higher population coverage rates of improved water and sanitation (WHO/UNICEF, 2010), lower child mortality rates (WHO, 2010), and much smaller agricultural shares of GDP (World Bank, 2010a) than the other sixteen countries of the Arab League. Country level urban air pollution (PM10) in the higher income gulf countries is, however, comparable to levels in the other sixteen countries (World Bank, 2010a).
The purpose of the METAP/World Bank cost assessments, as of this paper, is not to document and elaborate on the status of the environment and the causes of environmental conditions, but rather to quantify and monetize the consequences of environmental degradation on population health and well-being and economic productivity. These studies, as well as more recent cost of environmental degradation assessments in some countries in North Africa and the Middle East, East and South Asia, Latin America, and Sub-Saharan Africa by the World Bank and others, have helped raise awareness among policy makers and the general public of the impacts and costs of environmental degradation. To these studies should be added regional and country environmental health risk assessments by WHO, the Economics of Sanitation Initiative (ESI) by the Water and Sanitation Program (WSP), and sector studies of cost of environmental degradation or environmental health risks by the World Bank and others. Such studies have also motivated efforts to identify cost-effective solutions and helped spur government legislation, policies, funding and actions to curtail costs of degradation and improve environmental conditions.
Many developments have taken place in the region since the METAP/World Bank cost assessments. Urban populations exposed to outdoor air pollution have grown rapidly. Pressure is increasing on scarce renewable natural resources such as land, forest and water from growing populations and economic activities. Environmental services - such as improved water supply and sanitation and household waste collection – have struggled to keep up with the growing populations. Agricultural commodity prices have increased substantially, increasing the cost of crop yield declines from land degradation. New empirical evidence of additional linkages between health and environmental quality has been further substantiated. This includes long term mortality effects of outdoor air pollution, linkages between repeated diarrheal infections in early childhood and child nutritional status, meta-analyses of international research on the effect of poor hand washing practices on
1 Environmental degradation in relation to health is understood as factors in the environment that affect human health. These factors may be physical, chemical, biological, social, and psychosocial, and thus not only include pollutants (e.g., air pollution) but also individuals’, household, and community behavior that contribute to environment-to-human transmission of pathogens (e.g., sanitary and hygiene practices). This understanding of the environment and its relation to health is motivated by the definition of environmental health set forth by the World Health Organization (WHO).
3
diarrheal disease incidence, and transmission of respiratory infections from poor hand washing practices. Methodologies to incorporate the health effects in environmental risk factor analyses have now been established for most of these issues that were not reflected in the METAP/World Bank studies.
Availability of consistent and reliable data is essential for assessment of environmental conditions and their consequences on health, well-being, and economic productivity. This is important for accuracy of estimates at the country level, and for any meaningful comparison across countries. As environmental issues have received increased attention and interest worldwide during the last several decades, efforts have been intensified to monitor, survey, collect, and disseminate data for analytical and policy purposes. Data availability has improved in some areas since the METAP/World Bank studies. More consistent cause-specific estimates of child and adult mortality at the country level is now available, which are data used for quantification of health effects from water, sanitation and hygiene and outdoor air pollution. National household surveys for more countries in the region are now available, containing important data on child diarrhea and treatment, household water and sanitation, child nutritional status, and even some indicators of household hygiene practices.2 Data challenges do, however, remain. These include uncertainties as to the accuracy of data on outdoor air quality and nationwide land degradation and its effect on agricultural productivity. Nevertheless, the data used in this paper provide a better, albeit still imperfect basis for cross-country comparisons of the cost of environmental degradation than in previous regional studies (Annex 1).
The sixteen countries of the Arab League analyzed in this paper represent great developmental and environmental diversity relevant to the understanding of the cost of environmental degradation in the region. The countries had a total population of 307 million in 2008, ranging from less than one million in Comoros and Djibouti to over 80 million in Egypt. GDP per capita ranged from US $300 in Somalia to nearly US $15,000 in Libya in the same year (World Bank, 2010a). The economic contribution of the agricultural sector (agriculture, forestry, fisheries) varies greatly, ranging from 2 percent of GDP in Libya to 60 percent in Somalia and declines with higher income levels. The agricultural sector is, however, far more important in terms of employment. About 20 percent and over 50 percent of the economically active population work in agriculture in Algeria and Yemen respectively, although the sector contributes 7 percent and 11 percent to GDP in these two countries (World Bank, 2010a). Child mortality rates (age < 5 years) ranged from as low as 13 per 1,000 live births in Lebanon to 200 in Somalia in 2008 (World Bank, 2010a) and also decline with higher income levels (Annex 1).
Access to improved drinking water sources ranged from 30 percent of the population in Somalia to practically 100 percent in Lebanon in 2008, and improved sanitation ranged from 23 percent in Somalia to 98 percent in Jordan (WHO/UNICEF, 2010). Improved water sources are piped water supply, public tap/standpipe, tube well/borehole, protected wells and springs, and rain water. Unimproved water sources are unprotected wells and springs, tanker trucks/carts, and surface water. Improved sanitation is flush/pour-flush toilets to sewage, septic tank or pit; ventilated improved pit latrine (VIP), pit latrine with slab,; and composting toilet. Unimproved sanitation is flush/pour-flush toilets to somewhere else than sewage, septic tank or pit; open pit (pit latrine without slab); bucket toilet; toilet hanging over water; 2 E.g., Demographic and Health Surveys (DHS) and Multiple Indicator Cluster Surveys (MICS) available at www.measuredhs.com and www.childinfo.org. These surveys are nationally representative surveys of thousands of households usually conducted every five years. Surveys conducted in the period 2006-09 are available for Algeria, Djibouti, Egypt, Iraq, Jordan, Mauritania, Morocco, Somalia, Syria, Tunisia, West Bank and Gaza, and Yemen. Other national household surveys from 2004-06 are publicly available for Comoros, Lebanon, and Sudan.
4
or having no toilet facility. While improved water sources and improved sanitation is found to reduce the risk of various illnesses, they do not eliminate the risk (Pruss et al 2002; Pruss-Ustun et al 2004). As reported in available DHS and MICS reports, very few households in the region treat or disinfect their water prior to drinking, a large share of households disposes of children’s feces unhygienically in countries with low sanitation coverage rates, and anecdotal evidence indicates inadequate hand washing practices at critical junctures among a large majority of households.
Ambient concentrations of air particulate matter (PM) are high by international comparison in many cities in the region (e.g., Cairo and many cities in Syria). The urban population increased by 30 million from 2000 to 2008 in the sixteen countries. About 52 percent of the population lived in urban areas in 2008, ranging from 30 percent of the population in Comoros and Yemen to 78-87 percent of the population in Jordan, Libya, Djibouti and Lebanon. Several of the countries are experiencing an urban population growth of 3-5 percent per year, fueled by, among other factors, high birth rat0ll above the world average (World Bank, 2010a). High rates of urbanization and urban population growth are putting an increasing share of the population at risk of health effects from air pollution.
Most of the countries have a limited and vulnerable renewable natural resource base. Much of agriculture is dependent on irrigation or limited rainfall. Arable and permanent cropland ranged from less than 0.05 hectares per capita in Djibouti, Egypt and Jordan to over 0.45 hectares in Sudan and Tunisia in 2007 (www.fao.org). Available cross-country data on land degradation indicate that more than 2/3rd of territorial land suffers from moderate and severe degradation in half of the sixteen countries. Major causes of degradation are identified as agriculture and livestock overgrazing (FAO, 2000).
While the focus of the cost assessment in this paper is limited to three environmental issues, it is recognized that there are additional costs of environmental degradation related to rangeland degradation, forest and freshwater degradation, groundwater over-extraction, coastal and fishery degradation, inadequate waste management, health effects from household use of solid fuels for cooking,3 desertification, potential losses in biodiversity and quality of protected areas, and impacts of global climate change. These costs are likely to be substantial in at least some of the countries as evidenced by the METAP/World Bank studies for some of these issues and reports from recent household surveys of high prevalence of household use of solid fuels in five of the six countries with the lowest GDP per capita.
2. Environmental health Inadequate potable water, sanitation and hygiene, outdoor air pollution in urban areas, and household air pollution from use of solid fuels caused an estimated nearly 4.7 million deaths globally in 2004 (WHO 2009). Exposure to lead (Pb) and global climate change have also been estimated to be associated with substantial health effects globally (WHO 2004). This section presents estimates of health effects and costs of inadequate potable water, sanitation and hygiene, and outdoor air pollution in urban areas, as these two environmental health risk factors affect all sixteen countries.
2.1 Water, sanitation and hygiene Inadequate potable water supply, sanitation and hygiene are associated with various health effects such as diarrhea, typhoid, cholera, intestinal parasite infections, and schistosomiasis. 3 Household air pollution from use of solid fuels for cooking and other purposes is a major environmental health risk factor in developing countries (WHO 2004; 2009). Relatively few households in a majority of the 16 countries use solid fuels as primary cooking fuel today. However, according to MICS surveys, a majority of households use solid fuels in Comoros (83% in 2000), Mauritania (62% in 2006), Somalia (99% in 2006) and Sudan (87% in 2000), and over one-third of households use such fuels in Yemen (36% in 2006).
5
Data on many of these health effects are often incomplete, and difficult to access for the sixteen countries of the Arab League included in this paper. The focus of analysis is therefore on diarrheal illness and diarrheal mortality, as in the METAP/World Bank studies.
Nearly 90 percent of diarrhea incidence worldwide is associated with inadequate water supply, sanitation and hygiene (Pruss et al 2002; Pruss-Ustun et al 2004). Types of household drinking water source and toilet facilities are two indicators of risk of diarrheal disease. While an improved drinking water source is generally better protected from contamination than an unimproved source, improved water sources are not necessarily free from contamination. Household point-of-use treatment of drinking water (e.g. boiling, filtering, chlorine treatment) has therefore been found in many countries to be an effective intervention to reduce the risk of diarrhea (Arnold and Colford 2007; Clasen et al 2007; Fewtrell et al 2005). Similarly, while improved sanitation generally reduces the risk of fecal-oral transmission - and thus risk of diarrhea - personal, domestic and community hygiene practices greatly influence the risk of diarrhea. In particular, regular hand washing with soap has been found in many countries to substantially reduce the risk of diarrhea (Curtis and Cairncross 2003; Fewtrell et al 2005). Hand washing with soap has also been found to substantially reduce the risk of respiratory infections in children (Luby et al 2005; Rabie and Curtis 2006). In recent years, community led total sanitation (CLTS) programs have been implemented in many countries that provide innovative approaches to achieving open defecation free (ODF) communities and higher coverage rates of household sanitation.
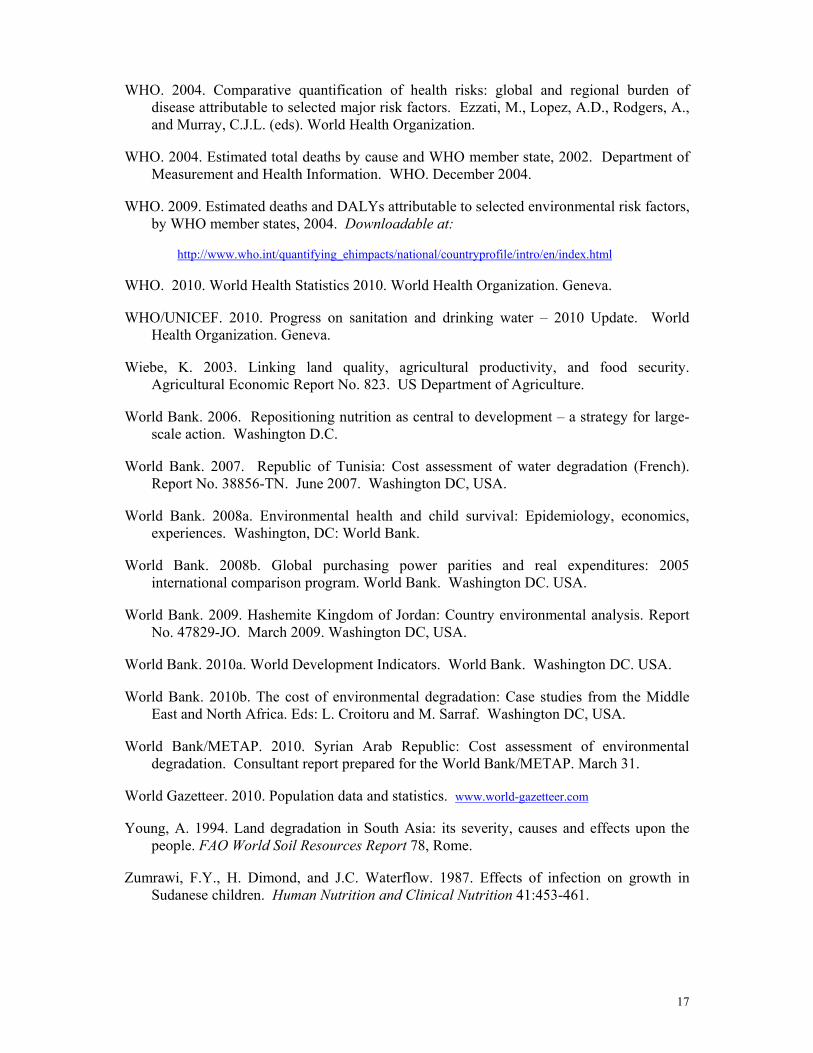
Globally, a smaller percentage of the population has access to an improved, non-shared toilet facility than to an improved drinking water source.4 This is also the case in the sixteen countries assessed in this paper. About 80 percent of the population in the sixteen countries had access to an improved drinking water source in 2008, while 75 percent had an improved, non-shared toilet facility. The gap shrank, however, by 6 percentage points from 2000 at which time 81 percent had access to an improved drinking water source and 70 percent had an improved, non-shared toilet facility (WHO/UNICEF, 2010).
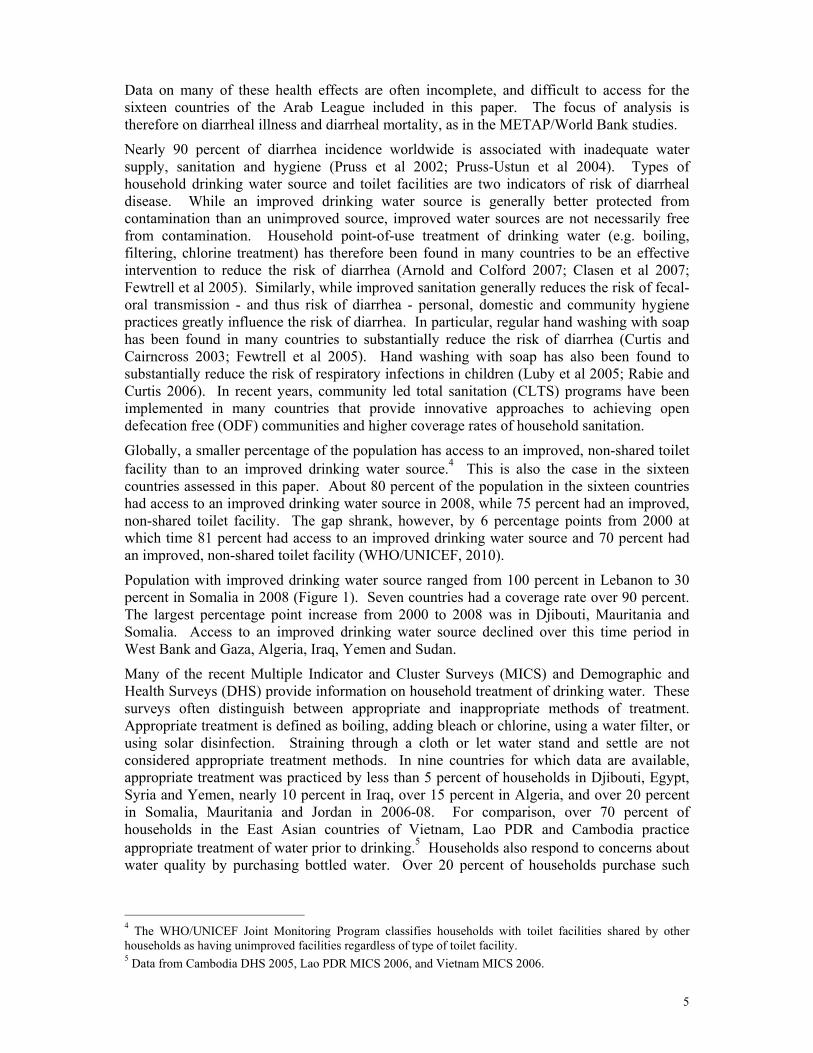
Population with improved drinking water source ranged from 100 percent in Lebanon to 30 percent in Somalia in 2008 (Figure 1). Seven countries had a coverage rate over 90 percent. The largest percentage point increase from 2000 to 2008 was in Djibouti, Mauritania and Somalia. Access to an improved drinking water source declined over this time period in West Bank and Gaza, Algeria, Iraq, Yemen and Sudan.
Many of the recent Multiple Indicator and Cluster Surveys (MICS) and Demographic and Health Surveys (DHS) provide information on household treatment of drinking water. These surveys often distinguish between appropriate and inappropriate methods of treatment. Appropriate treatment is defined as boiling, adding bleach or chlorine, using a water filter, or using solar disinfection. Straining through a cloth or let water stand and settle are not considered appropriate treatment methods. In nine countries for which data are available, appropriate treatment was practiced by less than 5 percent of households in Djibouti, Egypt, Syria and Yemen, nearly 10 percent in Iraq, over 15 percent in Algeria, and over 20 percent in Somalia, Mauritania and Jordan in 2006-08. For comparison, over 70 percent of households in the East Asian countries of Vietnam, Lao PDR and Cambodia practice appropriate treatment of water prior to drinking.5 Households also respond to concerns about water quality by purchasing bottled water. Over 20 percent of households purchase such
4 The WHO/UNICEF Joint Monitoring Program classifies households with toilet facilities shared by other households as having unimproved facilities regardless of type of toilet facility. 5 Data from Cambodia DHS 2005, Lao PDR MICS 2006, and Vietnam MICS 2006.
6
water in Jordan according to the DHS 2007. Bottled water consumption is also high in Lebanon.6
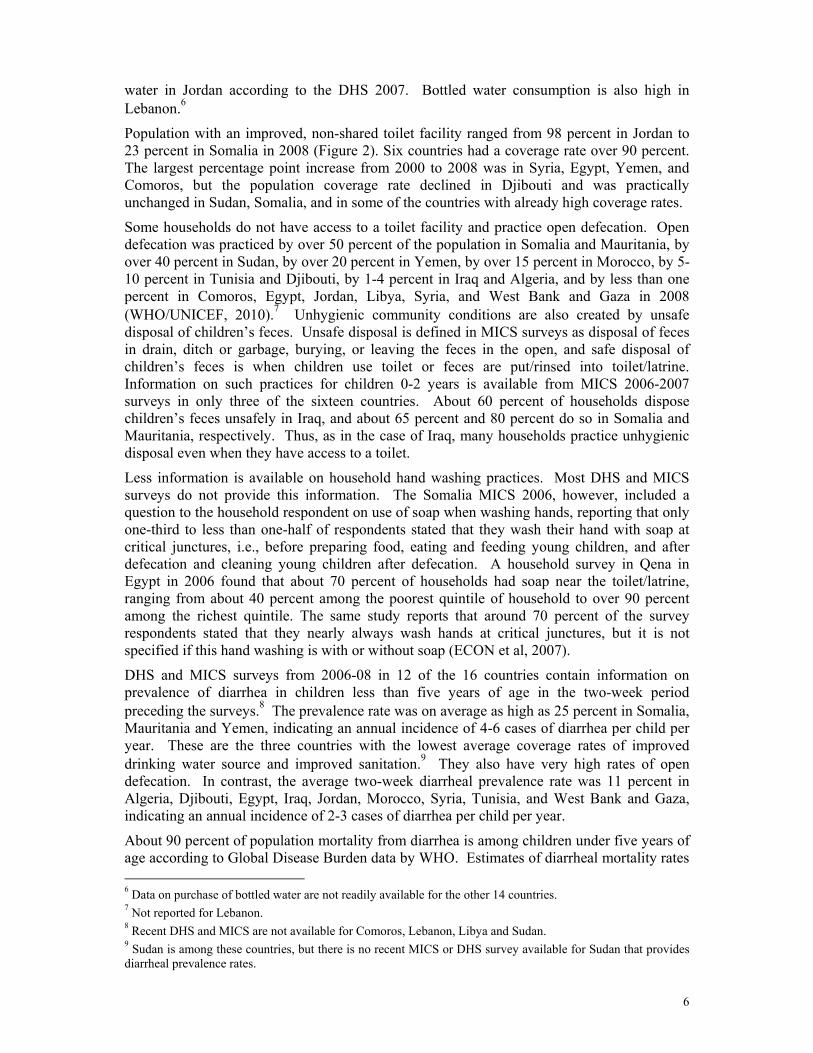
Population with an improved, non-shared toilet facility ranged from 98 percent in Jordan to 23 percent in Somalia in 2008 (Figure 2). Six countries had a coverage rate over 90 percent. The largest percentage point increase from 2000 to 2008 was in Syria, Egypt, Yemen, and Comoros, but the population coverage rate declined in Djibouti and was practically unchanged in Sudan, Somalia, and in some of the countries with already high coverage rates.
Some households do not have access to a toilet facility and practice open defecation. Open defecation was practiced by over 50 percent of the population in Somalia and Mauritania, by over 40 percent in Sudan, by over 20 percent in Yemen, by over 15 percent in Morocco, by 5-10 percent in Tunisia and Djibouti, by 1-4 percent in Iraq and Algeria, and by less than one percent in Comoros, Egypt, Jordan, Libya, Syria, and West Bank and Gaza in 2008 (WHO/UNICEF, 2010).7 Unhygienic community conditions are also created by unsafe disposal of children’s feces. Unsafe disposal is defined in MICS surveys as disposal of feces in drain, ditch or garbage, burying, or leaving the feces in the open, and safe disposal of children’s feces is when children use toilet or feces are put/rinsed into toilet/latrine. Information on such practices for children 0-2 years is available from MICS 2006-2007 surveys in only three of the sixteen countries. About 60 percent of households dispose children’s feces unsafely in Iraq, and about 65 percent and 80 percent do so in Somalia and Mauritania, respectively. Thus, as in the case of Iraq, many households practice unhygienic disposal even when they have access to a toilet.
Less information is available on household hand washing practices. Most DHS and MICS surveys do not provide this information. The Somalia MICS 2006, however, included a question to the household respondent on use of soap when washing hands, reporting that only one-third to less than one-half of respondents stated that they wash their hand with soap at critical junctures, i.e., before preparing food, eating and feeding young children, and after defecation and cleaning young children after defecation. A household survey in Qena in Egypt in 2006 found that about 70 percent of households had soap near the toilet/latrine, ranging from about 40 percent among the poorest quintile of household to over 90 percent among the richest quintile. The same study reports that around 70 percent of the survey respondents stated that they nearly always wash hands at critical junctures, but it is not specified if this hand washing is with or without soap (ECON et al, 2007).
DHS and MICS surveys from 2006-08 in 12 of the 16 countries contain information on prevalence of diarrhea in children less than five years of age in the two-week period preceding the surveys.8 The prevalence rate was on average as high as 25 percent in Somalia, Mauritania and Yemen, indicating an annual incidence of 4-6 cases of diarrhea per child per year. These are the three countries with the lowest average coverage rates of improved drinking water source and improved sanitation.9 They also have very high rates of open defecation. In contrast, the average two-week diarrheal prevalence rate was 11 percent in Algeria, Djibouti, Egypt, Iraq, Jordan, Morocco, Syria, Tunisia, and West Bank and Gaza, indicating an annual incidence of 2-3 cases of diarrhea per child per year.
About 90 percent of population mortality from diarrhea is among children under five years of age according to Global Disease Burden data by WHO. Estimates of diarrheal mortality rates 6 Data on purchase of bottled water are not readily available for the other 14 countries. 7 Not reported for Lebanon. 8 Recent DHS and MICS are not available for Comoros, Lebanon, Libya and Sudan. 9 Sudan is among these countries, but there is no recent MICS or DHS survey available for Sudan that provides diarrheal prevalence rates.
7
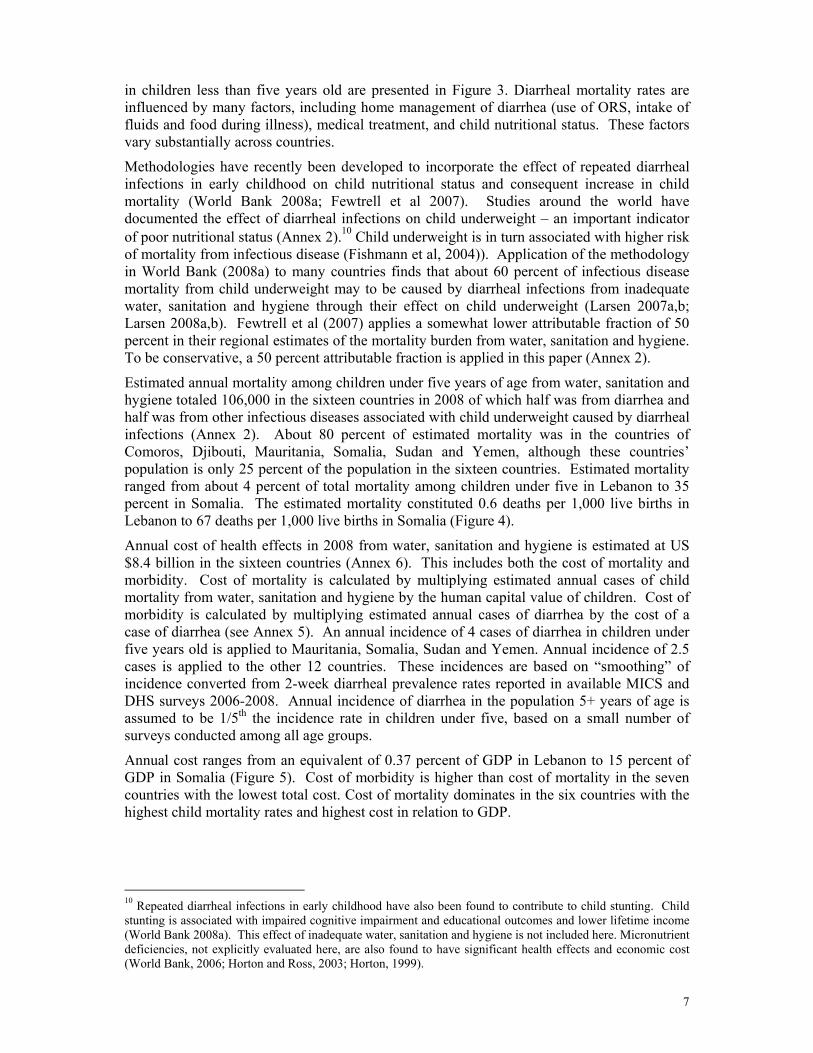
in children less than five years old are presented in Figure 3. Diarrheal mortality rates are influenced by many factors, including home management of diarrhea (use of ORS, intake of fluids and food during illness), medical treatment, and child nutritional status. These factors vary substantially across countries.
Methodologies have recently been developed to incorporate the effect of repeated diarrheal infections in early childhood on child nutritional status and consequent increase in child mortality (World Bank 2008a; Fewtrell et al 2007). Studies around the world have documented the effect of diarrheal infections on child underweight – an important indicator of poor nutritional status (Annex 2).10 Child underweight is in turn associated with higher risk of mortality from infectious disease (Fishmann et al, 2004)). Application of the methodology in World Bank (2008a) to many countries finds that about 60 percent of infectious disease mortality from child underweight may to be caused by diarrheal infections from inadequate water, sanitation and hygiene through their effect on child underweight (Larsen 2007a,b; Larsen 2008a,b). Fewtrell et al (2007) applies a somewhat lower attributable fraction of 50 percent in their regional estimates of the mortality burden from water, sanitation and hygiene. To be conservative, a 50 percent attributable fraction is applied in this paper (Annex 2).
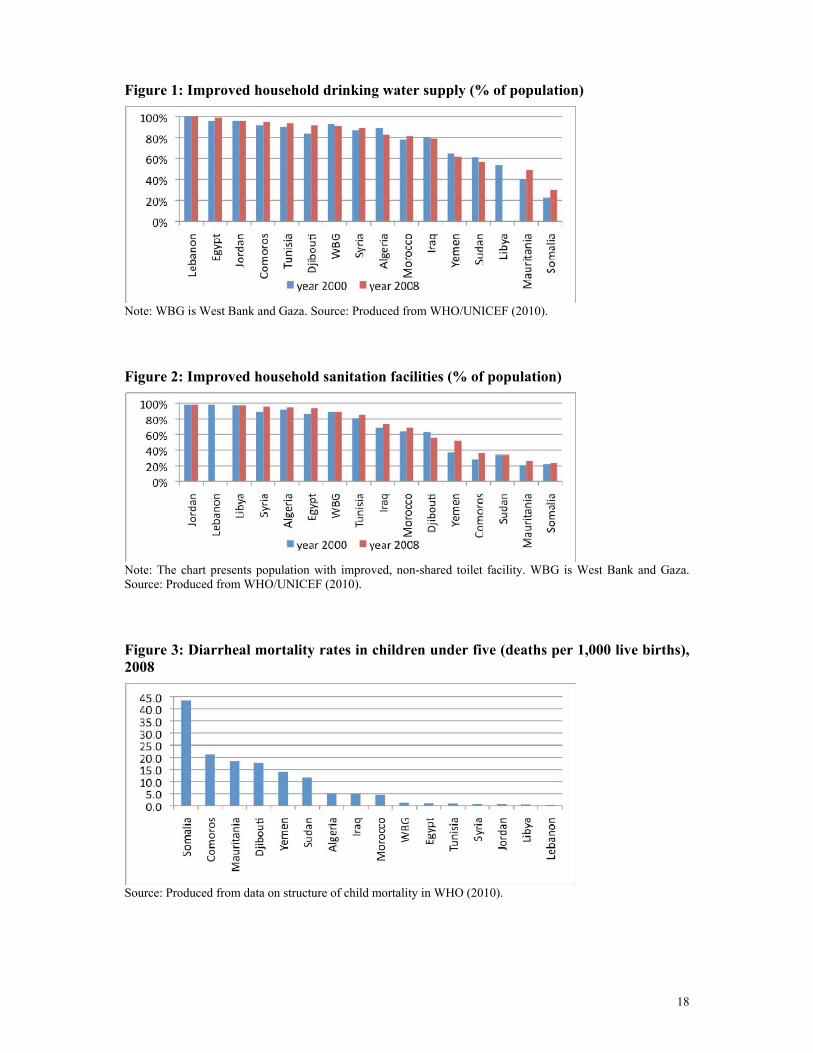
Estimated annual mortality among children under five years of age from water, sanitation and hygiene totaled 106,000 in the sixteen countries in 2008 of which half was from diarrhea and half was from other infectious diseases associated with child underweight caused by diarrheal infections (Annex 2). About 80 percent of estimated mortality was in the countries of Comoros, Djibouti, Mauritania, Somalia, Sudan and Yemen, although these countries’ population is only 25 percent of the population in the sixteen countries. Estimated mortality ranged from about 4 percent of total mortality among children under five in Lebanon to 35 percent in Somalia. The estimated mortality constituted 0.6 deaths per 1,000 live births in Lebanon to 67 deaths per 1,000 live births in Somalia (Figure 4).
Annual cost of health effects in 2008 from water, sanitation and hygiene is estimated at US $8.4 billion in the sixteen countries (Annex 6). This includes both the cost of mortality and morbidity. Cost of mortality is calculated by multiplying estimated annual cases of child mortality from water, sanitation and hygiene by the human capital value of children. Cost of morbidity is calculated by multiplying estimated annual cases of diarrhea by the cost of a case of diarrhea (see Annex 5). An annual incidence of 4 cases of diarrhea in children under five years old is applied to Mauritania, Somalia, Sudan and Yemen. Annual incidence of 2.5 cases is applied to the other 12 countries. These incidences are based on “smoothing” of incidence converted from 2-week diarrheal prevalence rates reported in available MICS and DHS surveys 2006-2008. Annual incidence of diarrhea in the population 5+ years of age is assumed to be 1/5th the incidence rate in children under five, based on a small number of surveys conducted among all age groups.
Annual cost ranges from an equivalent of 0.37 percent of GDP in Lebanon to 15 percent of GDP in Somalia (Figure 5). Cost of morbidity is higher than cost of mortality in the seven countries with the lowest total cost. Cost of mortality dominates in the six countries with the highest child mortality rates and highest cost in relation to GDP.
10 Repeated diarrheal infections in early childhood have also been found to contribute to child stunting. Child stunting is associated with impaired cognitive impairment and educational outcomes and lower lifetime income (World Bank 2008a). This effect of inadequate water, sanitation and hygiene is not included here. Micronutrient deficiencies, not explicitly evaluated here, are also found to have significant health effects and economic cost (World Bank, 2006; Horton and Ross, 2003; Horton, 1999).
8
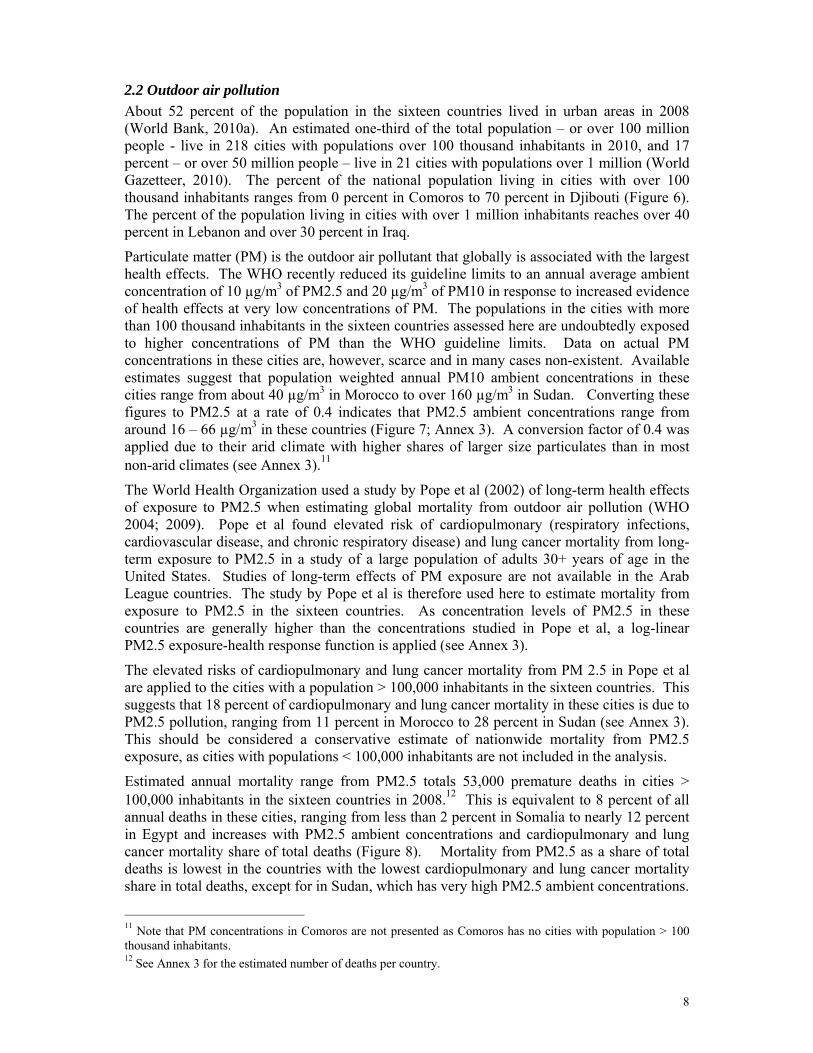
2.2 Outdoor air pollution About 52 percent of the population in the sixteen countries lived in urban areas in 2008 (World Bank, 2010a). An estimated one-third of the total population – or over 100 million people - live in 218 cities with populations over 100 thousand inhabitants in 2010, and 17 percent – or over 50 million people – live in 21 cities with populations over 1 million (World Gazetteer, 2010). The percent of the national population living in cities with over 100 thousand inhabitants ranges from 0 percent in Comoros to 70 percent in Djibouti (Figure 6). The percent of the population living in cities with over 1 million inhabitants reaches over 40 percent in Lebanon and over 30 percent in Iraq.
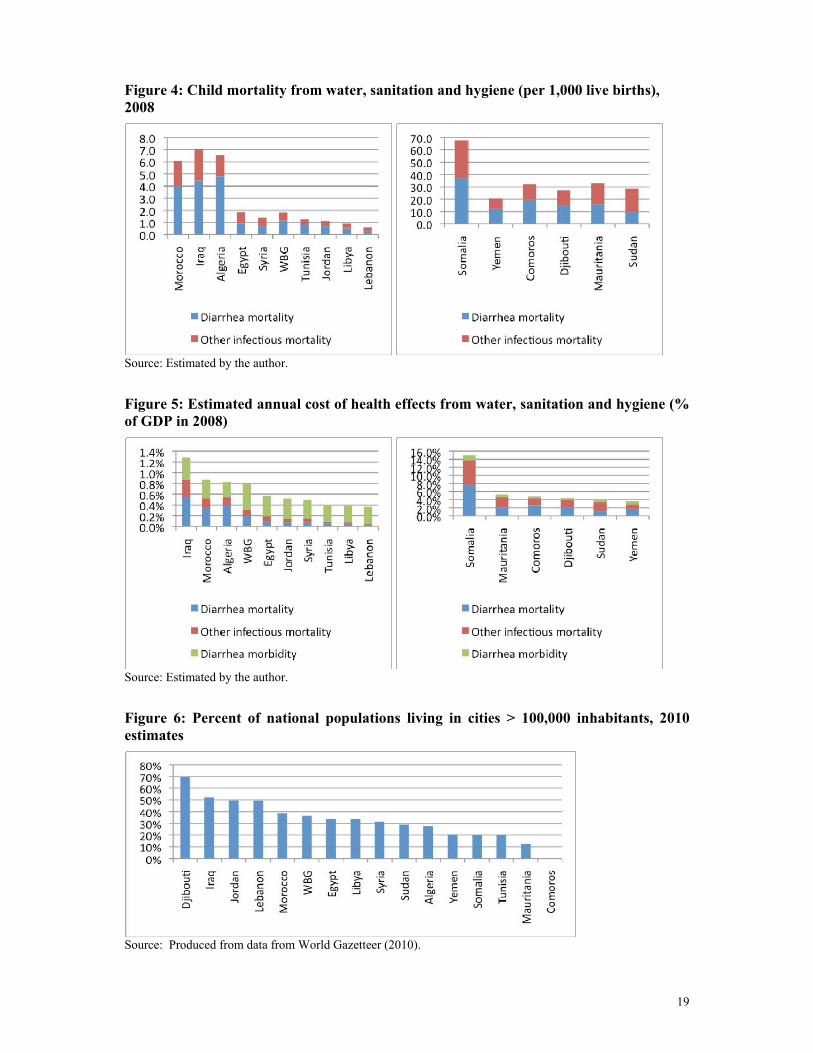
Particulate matter (PM) is the outdoor air pollutant that globally is associated with the largest health effects. The WHO recently reduced its guideline limits to an annual average ambient concentration of 10 µg/m3 of PM2.5 and 20 µg/m3 of PM10 in response to increased evidence of health effects at very low concentrations of PM. The populations in the cities with more than 100 thousand inhabitants in the sixteen countries assessed here are undoubtedly exposed to higher concentrations of PM than the WHO guideline limits. Data on actual PM concentrations in these cities are, however, scarce and in many cases non-existent. Available estimates suggest that population weighted annual PM10 ambient concentrations in these cities range from about 40 µg/m3 in Morocco to over 160 µg/m3 in Sudan. Converting these figures to PM2.5 at a rate of 0.4 indicates that PM2.5 ambient concentrations range from around 16 – 66 µg/m3 in these countries (Figure 7; Annex 3). A conversion factor of 0.4 was applied due to their arid climate with higher shares of larger size particulates than in most non-arid climates (see Annex 3).11
The World Health Organization used a study by Pope et al (2002) of long-term health effects of exposure to PM2.5 when estimating global mortality from outdoor air pollution (WHO 2004; 2009). Pope et al found elevated risk of cardiopulmonary (respiratory infections, cardiovascular disease, and chronic respiratory disease) and lung cancer mortality from long-term exposure to PM2.5 in a study of a large population of adults 30+ years of age in the United States. Studies of long-term effects of PM exposure are not available in the Arab League countries. The study by Pope et al is therefore used here to estimate mortality from exposure to PM2.5 in the sixteen countries. As concentration levels of PM2.5 in these countries are generally higher than the concentrations studied in Pope et al, a log-linear PM2.5 exposure-health response function is applied (see Annex 3).
The elevated risks of cardiopulmonary and lung cancer mortality from PM 2.5 in Pope et al are applied to the cities with a population > 100,000 inhabitants in the sixteen countries. This suggests that 18 percent of cardiopulmonary and lung cancer mortality in these cities is due to PM2.5 pollution, ranging from 11 percent in Morocco to 28 percent in Sudan (see Annex 3). This should be considered a conservative estimate of nationwide mortality from PM2.5 exposure, as cities with populations < 100,000 inhabitants are not included in the analysis.
Estimated annual mortality range from PM2.5 totals 53,000 premature deaths in cities > 100,000 inhabitants in the sixteen countries in 2008.12 This is equivalent to 8 percent of all annual deaths in these cities, ranging from less than 2 percent in Somalia to nearly 12 percent in Egypt and increases with PM2.5 ambient concentrations and cardiopulmonary and lung cancer mortality share of total deaths (Figure 8). Mortality from PM2.5 as a share of total deaths is lowest in the countries with the lowest cardiopulmonary and lung cancer mortality share in total deaths, except for in Sudan, which has very high PM2.5 ambient concentrations.
11 Note that PM concentrations in Comoros are not presented as Comoros has no cities with population > 100 thousand inhabitants. 12 See Annex 3 for the estimated number of deaths per country.
9
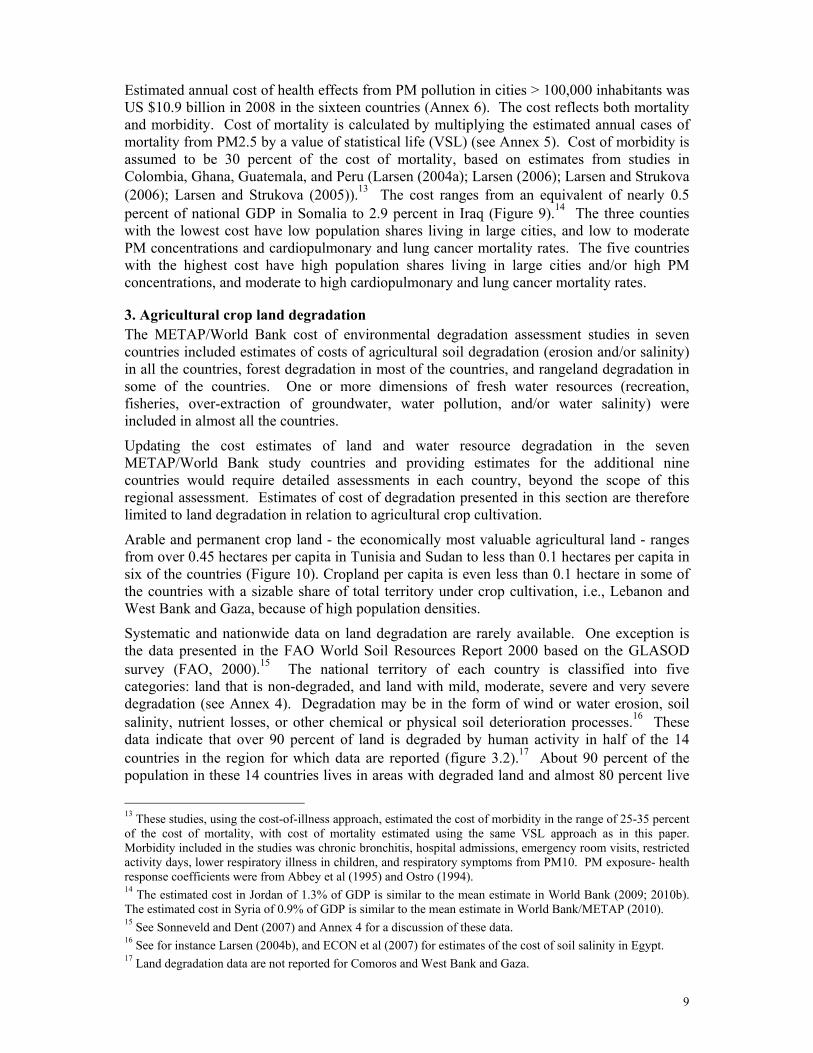
Estimated annual cost of health effects from PM pollution in cities > 100,000 inhabitants was US $10.9 billion in 2008 in the sixteen countries (Annex 6). The cost reflects both mortality and morbidity. Cost of mortality is calculated by multiplying the estimated annual cases of mortality from PM2.5 by a value of statistical life (VSL) (see Annex 5). Cost of morbidity is assumed to be 30 percent of the cost of mortality, based on estimates from studies in Colombia, Ghana, Guatemala, and Peru (Larsen (2004a); Larsen (2006); Larsen and Strukova (2006); Larsen and Strukova (2005)).13 The cost ranges from an equivalent of nearly 0.5 percent of national GDP in Somalia to 2.9 percent in Iraq (Figure 9).14 The three counties with the lowest cost have low population shares living in large cities, and low to moderate PM concentrations and cardiopulmonary and lung cancer mortality rates. The five countries with the highest cost have high population shares living in large cities and/or high PM concentrations, and moderate to high cardiopulmonary and lung cancer mortality rates.
3. Agricultural crop land degradation The METAP/World Bank cost of environmental degradation assessment studies in seven countries included estimates of costs of agricultural soil degradation (erosion and/or salinity) in all the countries, forest degradation in most of the countries, and rangeland degradation in some of the countries. One or more dimensions of fresh water resources (recreation, fisheries, over-extraction of groundwater, water pollution, and/or water salinity) were included in almost all the countries.
Updating the cost estimates of land and water resource degradation in the seven METAP/World Bank study countries and providing estimates for the additional nine countries would require detailed assessments in each country, beyond the scope of this regional assessment. Estimates of cost of degradation presented in this section are therefore limited to land degradation in relation to agricultural crop cultivation.
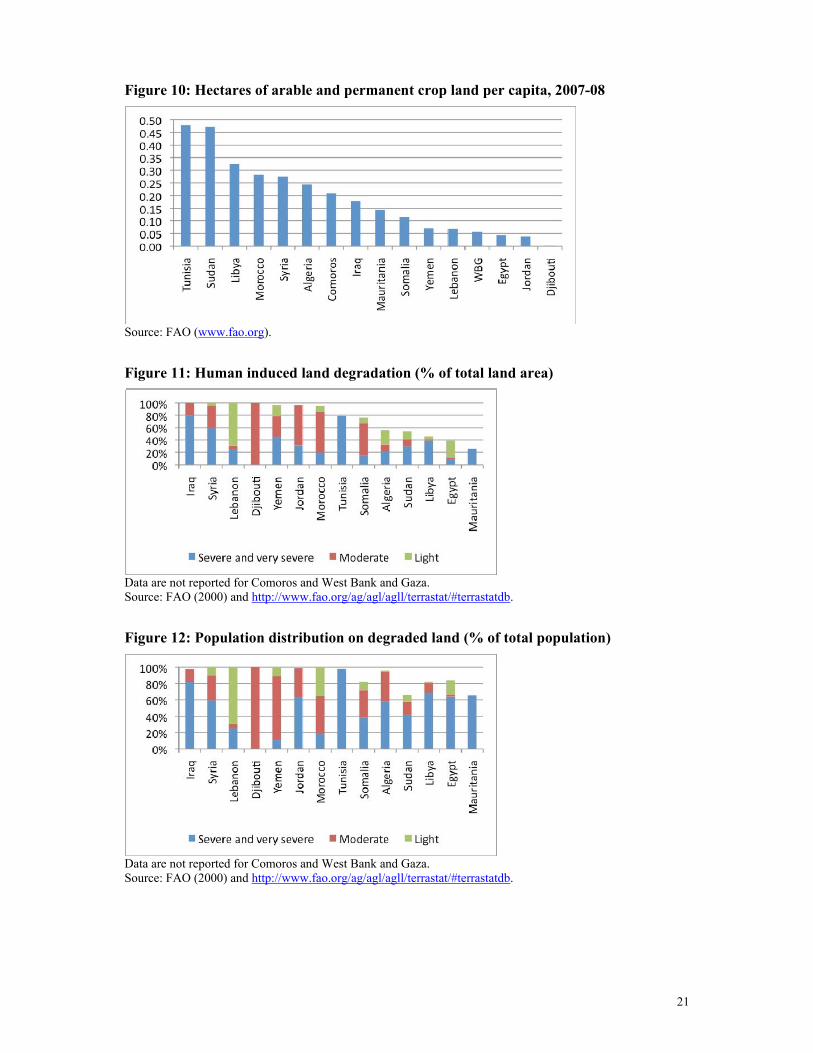
Arable and permanent crop land - the economically most valuable agricultural land - ranges from over 0.45 hectares per capita in Tunisia and Sudan to less than 0.1 hectares per capita in six of the countries (Figure 10). Cropland per capita is even less than 0.1 hectare in some of the countries with a sizable share of total territory under crop cultivation, i.e., Lebanon and West Bank and Gaza, because of high population densities.
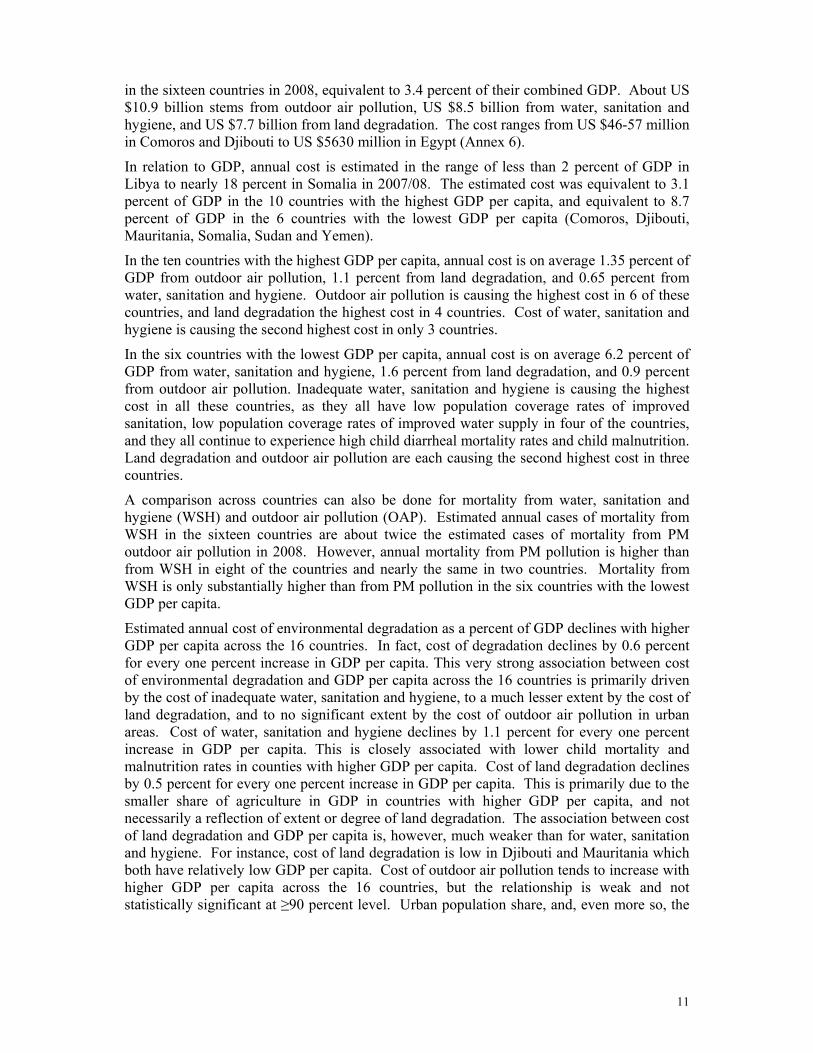
Systematic and nationwide data on land degradation are rarely available. One exception is the data presented in the FAO World Soil Resources Report 2000 based on the GLASOD survey (FAO, 2000).15 The national territory of each country is classified into five categories: land that is non-degraded, and land with mild, moderate, severe and very severe degradation (see Annex 4). Degradation may be in the form of wind or water erosion, soil salinity, nutrient losses, or other chemical or physical soil deterioration processes.16 These data indicate that over 90 percent of land is degraded by human activity in half of the 14 countries in the region for which data are reported (figure 3.2).17 About 90 percent of the population in these 14 countries lives in areas with degraded land and almost 80 percent live
13 These studies, using the cost-of-illness approach, estimated the cost of morbidity in the range of 25-35 percent of the cost of mortality, with cost of mortality estimated using the same VSL approach as in this paper. Morbidity included in the studies was chronic bronchitis, hospital admissions, emergency room visits, restricted activity days, lower respiratory illness in children, and respiratory symptoms from PM10. PM exposure- health response coefficients were from Abbey et al (1995) and Ostro (1994). 14 The estimated cost in Jordan of 1.3% of GDP is similar to the mean estimate in World Bank (2009; 2010b). The estimated cost in Syria of 0.9% of GDP is similar to the mean estimate in World Bank/METAP (2010). 15 See Sonneveld and Dent (2007) and Annex 4 for a discussion of these data. 16 See for instance Larsen (2004b), and ECON et al (2007) for estimates of the cost of soil salinity in Egypt. 17 Land degradation data are not reported for Comoros and West Bank and Gaza.
10
in areas with moderately, severely or very severely degraded land. Overall, population densities are 6 times higher on degraded land than on non-degraded land in the 14 countries. In Egypt and Mauritania, the countries with the lowest share of land area classified as degraded, over 60 percent of the population lives in areas with severely and very severely degraded land (Figure 11).
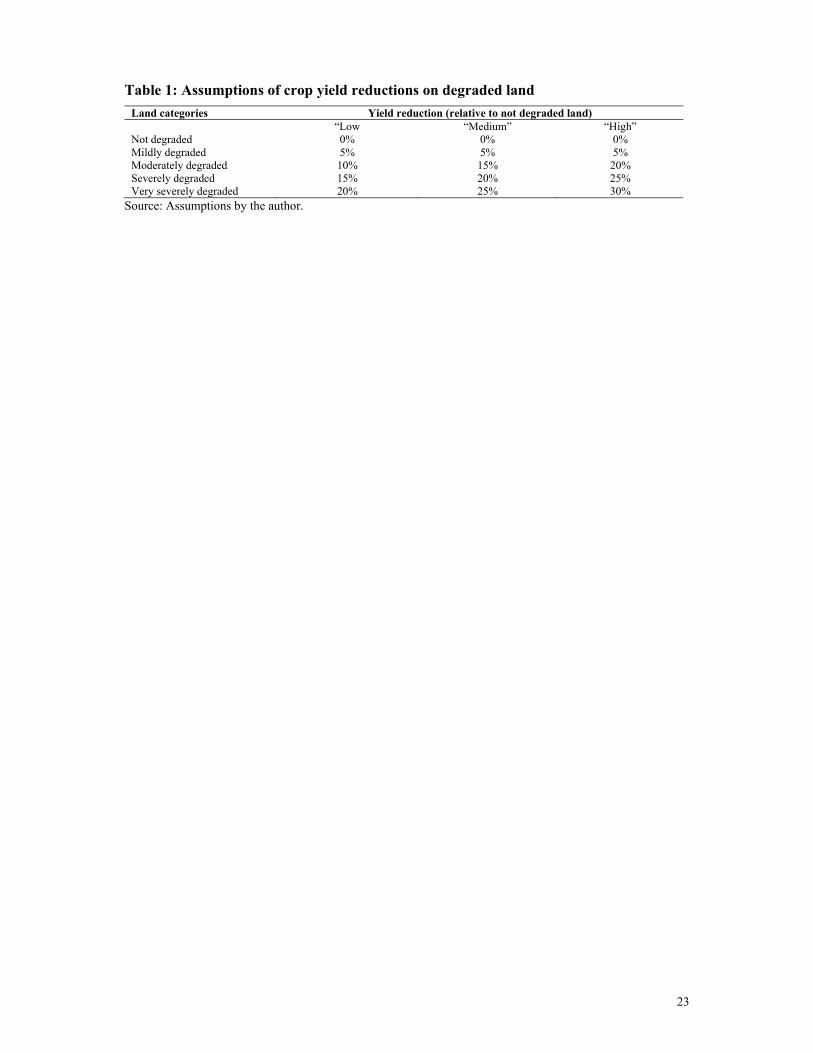
Human induced land degradation in the region is primarily a result of agricultural activities and overgrazing by livestock. Deforestation is also mentioned as a primary cause in some of the countries (FAO, 2000). Land degradation may have severe and long-term impacts on the eco-systems, water resources, recreation and tourism, and on agriculture. The social and economic costs of these impacts are often difficult to estimate and require in-depth studies. Estimates of the economic cost of land degradation in relation to agricultural crop cultivation are presented in this section. These estimates are based on assumptions about crop yield reductions (Table 1) and distribution of crop cultivation across the five land categories discussed above (see Annex 4). Assumed crop reductions represent average accumulative yield losses relative to yields of non-degraded soils in a country. The assumed yield reductions for “moderately degraded” land are of similar orders of magnitude as average yield losses reported in Pimentel et al (1995) and a literature review of several regions of the world by Wiebe (2003).
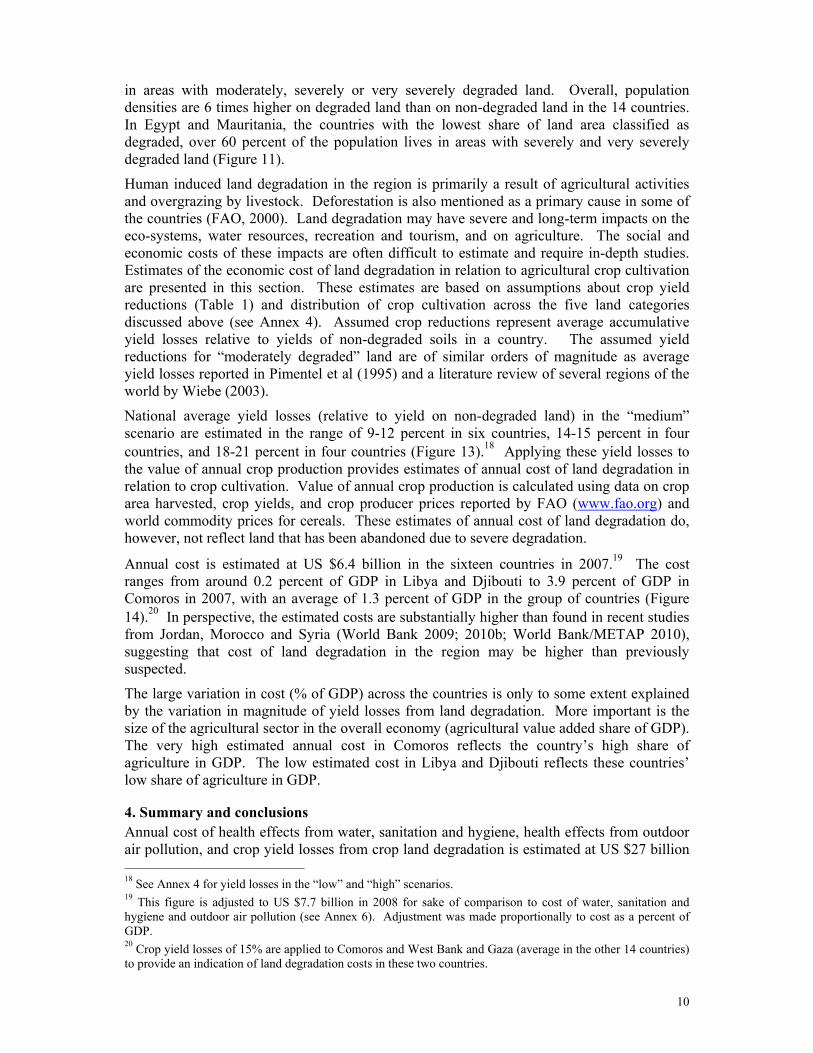
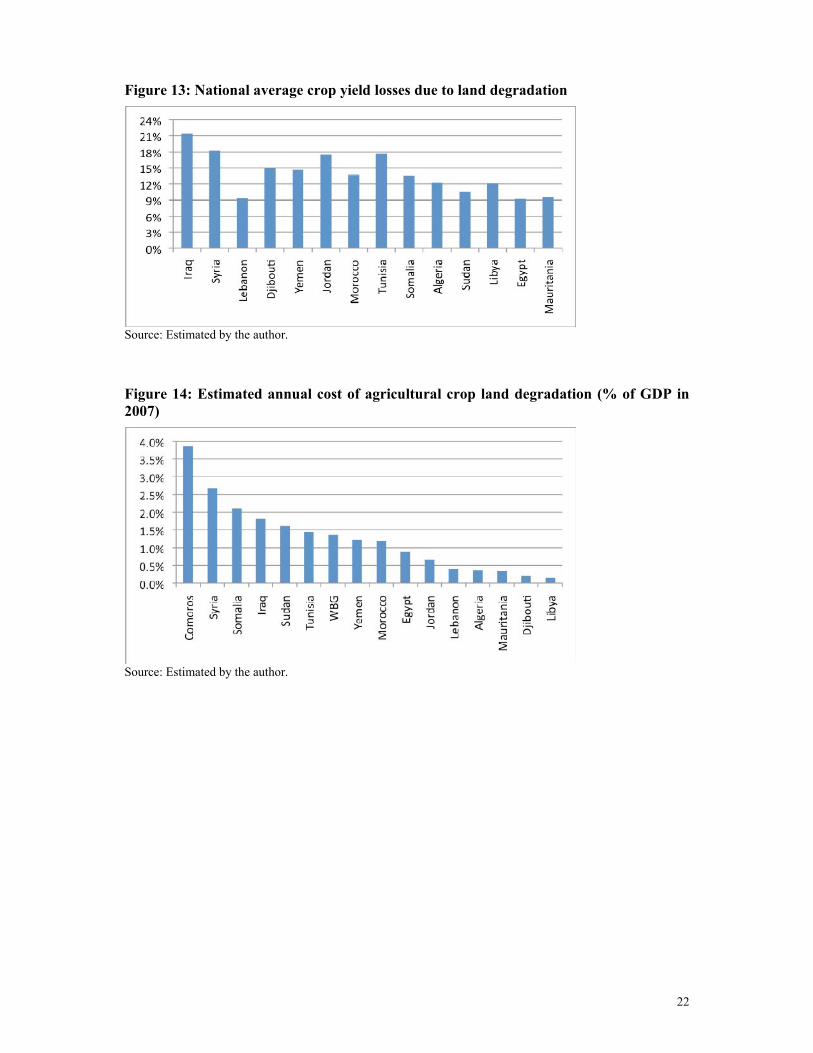
National average yield losses (relative to yield on non-degraded land) in the “medium” scenario are estimated in the range of 9-12 percent in six countries, 14-15 percent in four countries, and 18-21 percent in four countries (Figure 13).18 Applying these yield losses to the value of annual crop production provides estimates of annual cost of land degradation in relation to crop cultivation. Value of annual crop production is calculated using data on crop area harvested, crop yields, and crop producer prices reported by FAO (www.fao.org) and world commodity prices for cereals. These estimates of annual cost of land degradation do, however, not reflect land that has been abandoned due to severe degradation.
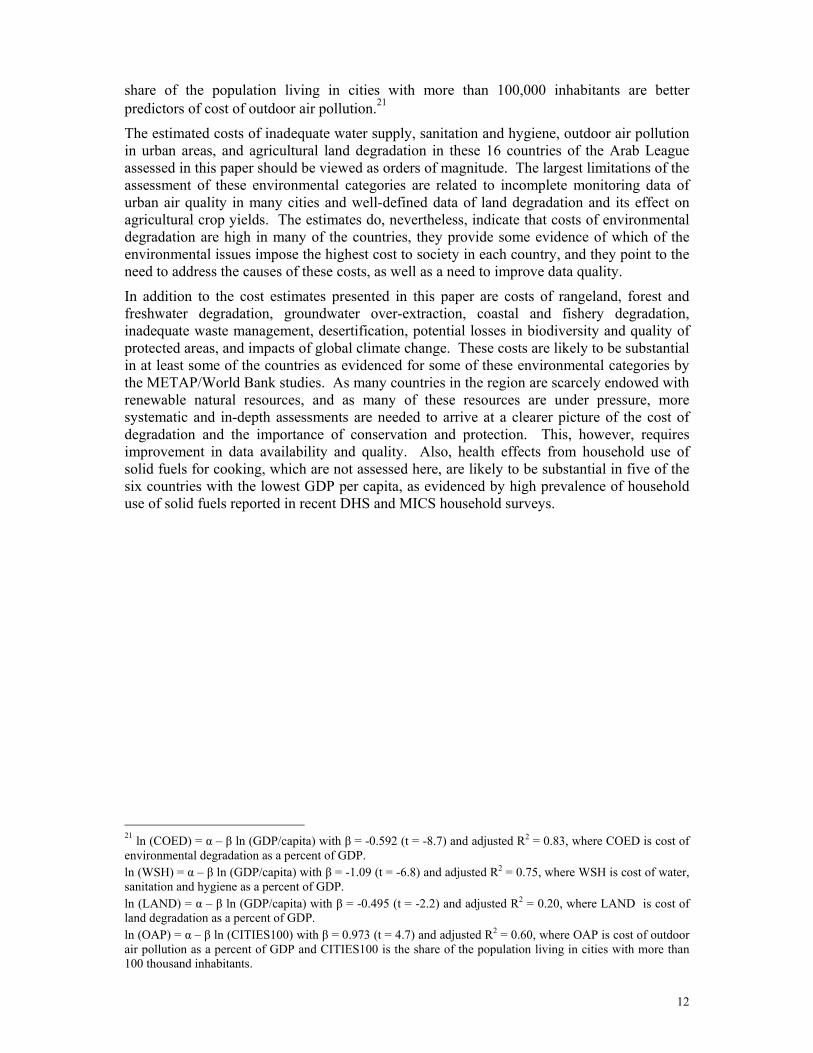
Annual cost is estimated at US $6.4 billion in the sixteen countries in 2007.19 The cost ranges from around 0.2 percent of GDP in Libya and Djibouti to 3.9 percent of GDP in Comoros in 2007, with an average of 1.3 percent of GDP in the group of countries (Figure 14).20 In perspective, the estimated costs are substantially higher than found in recent studies from Jordan, Morocco and Syria (World Bank 2009; 2010b; World Bank/METAP 2010), suggesting that cost of land degradation in the region may be higher than previously suspected.
The large variation in cost (% of GDP) across the countries is only to some extent explained by the variation in magnitude of yield losses from land degradation. More important is the size of the agricultural sector in the overall economy (agricultural value added share of GDP). The very high estimated annual cost in Comoros reflects the country’s high share of agriculture in GDP. The low estimated cost in Libya and Djibouti reflects these countries’ low share of agriculture in GDP.
4. Summary and conclusions Annual cost of health effects from water, sanitation and hygiene, health effects from outdoor air pollution, and crop yield losses from crop land degradation is estimated at US $27 billion 18 See Annex 4 for yield losses in the “low” and “high” scenarios. 19 This figure is adjusted to US $7.7 billion in 2008 for sake of comparison to cost of water, sanitation and hygiene and outdoor air pollution (see Annex 6). Adjustment was made proportionally to cost as a percent of GDP. 20 Crop yield losses of 15% are applied to Comoros and West Bank and Gaza (average in the other 14 countries) to provide an indication of land degradation costs in these two countries.
11
in the sixteen countries in 2008, equivalent to 3.4 percent of their combined GDP. About US $10.9 billion stems from outdoor air pollution, US $8.5 billion from water, sanitation and hygiene, and US $7.7 billion from land degradation. The cost ranges from US $46-57 million in Comoros and Djibouti to US $5630 million in Egypt (Annex 6).
In relation to GDP, annual cost is estimated in the range of less than 2 percent of GDP in Libya to nearly 18 percent in Somalia in 2007/08. The estimated cost was equivalent to 3.1 percent of GDP in the 10 countries with the highest GDP per capita, and equivalent to 8.7 percent of GDP in the 6 countries with the lowest GDP per capita (Comoros, Djibouti, Mauritania, Somalia, Sudan and Yemen).
In the ten countries with the highest GDP per capita, annual cost is on average 1.35 percent of GDP from outdoor air pollution, 1.1 percent from land degradation, and 0.65 percent from water, sanitation and hygiene. Outdoor air pollution is causing the highest cost in 6 of these countries, and land degradation the highest cost in 4 countries. Cost of water, sanitation and hygiene is causing the second highest cost in only 3 countries.
In the six countries with the lowest GDP per capita, annual cost is on average 6.2 percent of GDP from water, sanitation and hygiene, 1.6 percent from land degradation, and 0.9 percent from outdoor air pollution. Inadequate water, sanitation and hygiene is causing the highest cost in all these countries, as they all have low population coverage rates of improved sanitation, low population coverage rates of improved water supply in four of the countries, and they all continue to experience high child diarrheal mortality rates and child malnutrition. Land degradation and outdoor air pollution are each causing the second highest cost in three countries.
A comparison across countries can also be done for mortality from water, sanitation and hygiene (WSH) and outdoor air pollution (OAP). Estimated annual cases of mortality from WSH in the sixteen countries are about twice the estimated cases of mortality from PM outdoor air pollution in 2008. However, annual mortality from PM pollution is higher than from WSH in eight of the countries and nearly the same in two countries. Mortality from WSH is only substantially higher than from PM pollution in the six countries with the lowest GDP per capita.
Estimated annual cost of environmental degradation as a percent of GDP declines with higher GDP per capita across the 16 countries. In fact, cost of degradation declines by 0.6 percent for every one percent increase in GDP per capita. This very strong association between cost of environmental degradation and GDP per capita across the 16 countries is primarily driven by the cost of inadequate water, sanitation and hygiene, to a much lesser extent by the cost of land degradation, and to no significant extent by the cost of outdoor air pollution in urban areas. Cost of water, sanitation and hygiene declines by 1.1 percent for every one percent increase in GDP per capita. This is closely associated with lower child mortality and malnutrition rates in counties with higher GDP per capita. Cost of land degradation declines by 0.5 percent for every one percent increase in GDP per capita. This is primarily due to the smaller share of agriculture in GDP in countries with higher GDP per capita, and not necessarily a reflection of extent or degree of land degradation. The association between cost of land degradation and GDP per capita is, however, much weaker than for water, sanitation and hygiene. For instance, cost of land degradation is low in Djibouti and Mauritania which both have relatively low GDP per capita. Cost of outdoor air pollution tends to increase with higher GDP per capita across the 16 countries, but the relationship is weak and not statistically significant at ≥90 percent level. Urban population share, and, even more so, the
12
share of the population living in cities with more than 100,000 inhabitants are better predictors of cost of outdoor air pollution.21
The estimated costs of inadequate water supply, sanitation and hygiene, outdoor air pollution in urban areas, and agricultural land degradation in these 16 countries of the Arab League assessed in this paper should be viewed as orders of magnitude. The largest limitations of the assessment of these environmental categories are related to incomplete monitoring data of urban air quality in many cities and well-defined data of land degradation and its effect on agricultural crop yields. The estimates do, nevertheless, indicate that costs of environmental degradation are high in many of the countries, they provide some evidence of which of the environmental issues impose the highest cost to society in each country, and they point to the need to address the causes of these costs, as well as a need to improve data quality.
In addition to the cost estimates presented in this paper are costs of rangeland, forest and freshwater degradation, groundwater over-extraction, coastal and fishery degradation, inadequate waste management, desertification, potential losses in biodiversity and quality of protected areas, and impacts of global climate change. These costs are likely to be substantial in at least some of the countries as evidenced for some of these environmental categories by the METAP/World Bank studies. As many countries in the region are scarcely endowed with renewable natural resources, and as many of these resources are under pressure, more systematic and in-depth assessments are needed to arrive at a clearer picture of the cost of degradation and the importance of conservation and protection. This, however, requires improvement in data availability and quality. Also, health effects from household use of solid fuels for cooking, which are not assessed here, are likely to be substantial in five of the six countries with the lowest GDP per capita, as evidenced by high prevalence of household use of solid fuels reported in recent DHS and MICS household surveys.
21 ln (COED) = α – β ln (GDP/capita) with β = -0.592 (t = -8.7) and adjusted R2 = 0.83, where COED is cost of environmental degradation as a percent of GDP. ln (WSH) = α – β ln (GDP/capita) with β = -1.09 (t = -6.8) and adjusted R2 = 0.75, where WSH is cost of water, sanitation and hygiene as a percent of GDP. ln (LAND) = α – β ln (GDP/capita) with β = -0.495 (t = -2.2) and adjusted R2 = 0.20, where LAND is cost of land degradation as a percent of GDP. ln (OAP) = α – β ln (CITIES100) with β = 0.973 (t = 4.7) and adjusted R2 = 0.60, where OAP is cost of outdoor air pollution as a percent of GDP and CITIES100 is the share of the population living in cities with more than 100 thousand inhabitants.
13
References
Abbey, D. et al. 1995. Long-Term Ambient Concentrations of Particulates and Oxidants and Development of Chronic Disease in a Cohort of Nonsmoking California Residents. Inhalation Toxicology, Vol 7: 19-34.
Adair, L., B.M. Popkin, J. VanDerslice, J. Akin, D. Guilkey, R. Black, J. Briscoe, and W. Flieger. 1993. Growth Dynamics During the First Two Years of Life: a Prospective Study in the Philippines. European Journal of Clinical Nutrition 47(1):42-51.
Arnold, B. and Colford, JM. 2007. Treating water with chlorine at point-of-use to improve water quality and reduce child diarrhea in developing countries: a systematic review and meta-analysis. American Journal of Tropical Medicine and Hygiene, vol 76(2): 354-364.
Bairagi, R., M.K. Chowdhury, Y.J. Kim, G.T. Curlin, and R.H. Gray. 1987. The Association between Malnutrition and Diarrhoea in Rural Bangladesh. International Journal of Epidemiology 16(3): 477-481.
Becker, S., R.E. Black, and K.H. Brown. 1991. Relative Effects of Diarrhea, Fever and Dietary Energy Intake on Weight Gain in rural Bangladeshi Children. American Journal of Clinical Nutrition 53:1499-1503.
Black, Robert E., Kenneth H. Brown, and Stan. Becker. 1984. Effects of Diarrhea Associated with Specific Enteropathogens on the Growth of Children in Rural Bangladesh. Pediatrics 73:799-805.
Checkley, William, Robert H. Gilman, Leonardo D. Epstein, Manuel Suarez, J. Fernando Diaz, Lilia Cabrera, Robert E. Black, and Charles R. Sterling. 1997. Asymptomatic and Symptomatic Cryptosporidiosis: Their Acute Effect on Weight Gain in Peruvian Children. American Journal of Epidemiology 145:156-163.
Checkley, William, Leonardo D. Epstein, Robert H. Gilman, Lilia M. Cabrera, and Robert E. Black. 2003. Effects of acute diarrhea on linear growth in Peruvian children. American Journal of Epidemiology, 157:166-175.
Clasen, T., Schmidt, W-P., Rabie, T., Roberts, I., and Cairncross, S. 2007. Interventions to improve water quality for preventing diarrhoea: systematic review and meta-analysis. British Medical Journal, 334:782-91.
Condon-Paoloni, D., J. Cravioto, F.E. Johnston, E.R. De Licardie, and T.O. Scholl. 1977. Morbidity and Growth of Infants and Young Children in a Rural Mexican Village. American Journal of Public Health 67:651-656.
Curtis, V. and Cairncross, S. 2003. Effect of Washing Hands with Soap on Diarrhoea Risk in the Community: A Systematic Review. Lancet Infectious Diseases, vol 3:275-81.
ECON et al. 2007. Mitigating the cost of environmental impacts from inadequate water supply and sanitation and hygiene in rural Qena, Egypt. Commissioned by the World Bank. Undertaken by ECON, Norway and Environics and Chemonics, Egypt.
FAO. 2000. Land resource potential and constraints at regional and country levels. World Soil Resources Report 90. Food and Agriculture Organization. Rome.
14
Fewtrell, L., Kaufmann, R., Kay, D., Enanoria, W., Haller, L., and Colford, JM. 2005. Water, sanitation, and hygiene interventions to reduce diarrhoea in less developed countries: a systematic review and meta-analysis. Lancet Infectious Diseases, vol 5:42-52.
Fewtrell, L., Prüss-Üstün, A., Bos, R., Gore, F., and Bartram, J. 2007. Water, sanitation and hygiene: quantifying the health impact at national and local levels in countries with incomplete water supply and sanitation coverage. WHO Environmental Burden of Disease Series No. 15. World Health Organization, Geneva.
Fikree FF, Rahbar MH, and Berendes HW. 2000. Risk factors for stunting and wasting at age six, twelve and twenty-four months for squatter children of Karachi. Journal of Pakistan Medical Association, 50(10):341-8.
Fishman, M.S., L.E. Caulfield, M. De Onis, M. Blossner, A.A. Hyder, L. Mullany, and R.E. Black. 2004. “Childhood and Maternal Underweight”. In Ezzati, M., A.D. Lopez, A. Rodgers, and C.J.L. Murray (Eds): Comparative Quantification of Health Risks – Global and Regional Burden of Disease Attributable to Selected Major Risk Factors. Vol. 1. Geneva: World Health Organization.
Guerrant RL, Kirchhoff LV, Shields DS, Nations MK, Leslie J, de Sousa MA, Araujo JG, Correia LL, Sauer KT, McClelland KE, et al. 1983. Prospective study of diarrheal illnesses in northeastern Brazil: patterns of disease, nutritional impact, etiologies, and risk factors. J Infect Dis., 148(6):986-97.
Horton, S. 1999. Opportunities for investments in nutrition in low-income Asia. Asian Development Review, 17: 246-273.
Horton, S. and Ross, J. 2003. The economics of iron deficiency. Food Policy, 28: 51-75.
Kochi, I., Hubbell, B., and Kramer, R. 2006. An Empirical Bayes Approach to Combining and Comparing Estimates of the Value of a Statistical Life for Environmental Policy Analysis. Environmental and Resource Economics. 34 (3): 385-406.
Kolsteren, P.W., J.A. Kusin, and S. Kardjati. 1997. “Morbidity and Growth Performance of Infants in Madura, Indonesia”. Annales Tropical Pediatrics 17(3):201-208.
Larsen, B. 2004a. Cost of Environmental Damage in Colombia- A Socio-Economic and Environmental Health Risk Assessment. Prepared for the Ministry of Environment, Government of Colombia.
Larsen, B. 2004b. Governorate of Damietta, Egypt: Cost of Environmental Degradation – A Socio-Economic and Environmental Health Assessment. SEAM Egypt/ERM UK. Funded by DFID.
Larsen, B. 2006. Ghana Cost of Environmental Damage: An Analysis of Environmental Health. Background report for the Ghana CEA. ECON prepared for the World Bank.
Larsen, B. 2007a. Cost of environmental health risk in children u5: Accounting for malnutrition in Ghana and Pakistan. Background report prepared for the World Bank. Environment Department, World Bank.
Larsen, B. 2007b. The disease burden from water, sanitation and hygiene in Cambodia, Indonesia, the Philippines and Vietnam – accounting for the effects of diarrheal
15
infections on malnutrition. Brief note prepared for the Economics of Sanitation Initiative of the EAP Water and Sanitation Program, World Bank.
Larsen, B. 2008a. Malnutrition related mortality from water, sanitation and hygiene in the Philippines: accounting for the effect of diarrheal infections on child malnutrition. Prepared for the Philippines CEA, World Bank.
Larsen, B. 2008b. Malnutrition and mortality from water, sanitation and hygiene in Cambodia, Lao PDR and Vietnam. Prepared for the Poverty and Environment Nexus (PEN) study, World Bank.
Larsen, B. and Strukova, E. 2005. Peru Cost of Environmental Damage: An Analysis of Environmental Health and Natural Resources. Background report for the Peru CEA. Prepared for the World Bank.
Larsen, B. and Strukova, E. 2006. Guatemala Cost of Environmental Damage: An Analysis of Environmental Health. Background report for the Guatemala CEA. Prepared for the World Bank.
Luby, S., Agboatwalla, M., Feikin, D., Painter, J., Ward Billheimer, MS., Altaf, A., and Hoekstra, R. 2005. Effect of hand washing on child health: a randomised controlled trial. Lancet, 366: 225-33.
Lutter CK, Mora JO, Habicht JP, Rasmussen KM, Robson DS, Sellers SG, Super CM, and Herrera MG. 1989. Nutritional supplementation: effects on child stunting because of diarrhea. American Journal of Clinical Nutrition, 50(1):1-8.
Martorell, R., J.P. Habicht, C. Yarbrough, A. Loehtig, R.E. Klein and K.A. Western. 1975. Acute Morbidity and Physical Growth in Rural Guatemalan Children. Pediatrics 129; 1296-1301.
Molbak, K., M. Andersen, P. Aaby, N. Hojlyng, M. Jakobsen, M. Sodemann, and A.P. da Silva. 1997. Cryptosporidium Infection in Infancy as a Cause of Malnutrition: a Community Study from Guinea-Bissau, West Africa. American Journal of Clinical Nutrition 65(1):149-52.
Moore SR, Lima AA, Schorling JB, Barboza MS, Soares AM, and Guerrant RL. 2000. Changes over time in the epidemiology of diarrhea and malnutrition among children in an urban Brazilian shantytown, 1989 to 1996. International Journal of Infectious Diseases, 4(4): 179-186.
Mrozek, J. and Taylor, L. 2002. What Determines the Value of Life? A Meta Analysis. Journal of Policy Analysis and Management. Vol 21 (2): 253-270.
Navrud, S. and Lindhjem, H. 2010. Meta-analysis of stated preference VSL studies: Further model sensitivity and benefit transfer issues. Prepared for the Environment Directorate, OECD.
Ostro, B. 1994. Estimating the Health Effects of Air Pollution: A Method with an Application to Jakarta. Policy Research Working Paper, World Bank.
16
Ostro, B. 2004. Outdoor Air Pollution - Assessing the environmental burden of disease at national and local levels. Environmental Burden of Disease, Series, No. 5. Geneva: WHO.
Pimentel, D., Harvey, C., et al. 1995. Environmental and economic costs of soil erosion and conservation benefits. Science, 267: 1117-23.
Pope CA III, Burnett RT, Thun MJ, et al. 2002. Lung cancer, Cardiopulmonary mortality, and Long-term exposure to Fine particulate air pollution. Journal of the American Medical Association, 287: 1132-1141.
Pope CA, III, Burnett RT, Krewski D, et al. 2009. Cardiovascular mortality and exposure to airborne fine particulate matter and cigarette smoke: shape of the exposure-response relationship. Circulation, 120(11):941-8.
Pruss, A., Kay, D., Fewtrell, L., and Bartram, J.,2002. Estimating the Burden of Disease from Water, Sanitation and Hygiene at the Global Level. Environmental Health Perspectives. Vol 110, No. 5.
Pruss-Ustun, A., Kay, D., Fewtrell, L., and Bartram, J., 2004. Unsafe water, sanitation and hygiene. In: Ezzati, M. et al. (eds): Comparative quantification of health risks: global and regional burden of disease attributable to selected major risk factors. World Health Organization.
Rabie, T. and Curtis, V. 2006. Hand washing and risk of respiratory infections: a quantitative systematic review. Tropical Medicine and International Health, vol 11(3): 258-67.
Rowland, M.G., S.G. Rowland, and T.J. Cole. 1988. Impact of Infection on the Growth of Children from 0 to 2 Years in an Urban West African Community. American Journal of Clinical Nutrition 47:134-138.
Rowland, M.G., T.J. Cole, and R.G. Whitehead. 1977. A Quantitative Study into the Role of Infection in Determining Nutritional Status in Gambian Village Children. British Journal of Nutrition 37:441-450.
Sonneveld, B.G.J.S. and Dent, D.L. 2007. How good is GLASOD? Journal of Environmental Management, 1-10.
United Nations. 2004. Fifth report on the global nutrition situation – nutrition for improved development outcomes. United Nations System Standing Committee on Nutrition. March 2004.
USEPA. 2004. The particle pollution report: Current understanding of air quality and emissions through 2003. Environmental Protection Agency. United States.
Villamor, E., M.R. Fataki, J.R. Bosch, R.L. Mbise, and W.W. Fawzi. 2004. Human immunodeficiency virus infection, diarrheal disease and sociodemographic predictors of child growth. Acta Paediatrica 93(3):372-9.
Viscusi, W.K. and Aldy, J.E. 2002. The Value of a Statistical Life: A critical review of market estimates throughout the world. Discussion Paper No. 392. Harvard Law School. Cambridge, MA. United States.
17
WHO. 2004. Comparative quantification of health risks: global and regional burden of disease attributable to selected major risk factors. Ezzati, M., Lopez, A.D., Rodgers, A., and Murray, C.J.L. (eds). World Health Organization.
WHO. 2004. Estimated total deaths by cause and WHO member state, 2002. Department of Measurement and Health Information. WHO. December 2004.
WHO. 2009. Estimated deaths and DALYs attributable to selected environmental risk factors, by WHO member states, 2004. Downloadable at:
http://www.who.int/quantifying_ehimpacts/national/countryprofile/intro/en/index.html
WHO. 2010. World Health Statistics 2010. World Health Organization. Geneva.
WHO/UNICEF. 2010. Progress on sanitation and drinking water – 2010 Update. World Health Organization. Geneva.
Wiebe, K. 2003. Linking land quality, agricultural productivity, and food security. Agricultural Economic Report No. 823. US Department of Agriculture.
World Bank. 2006. Repositioning nutrition as central to development – a strategy for large-scale action. Washington D.C.
World Bank. 2007. Republic of Tunisia: Cost assessment of water degradation (French). Report No. 38856-TN. June 2007. Washington DC, USA.
World Bank. 2008a. Environmental health and child survival: Epidemiology, economics, experiences. Washington, DC: World Bank.
World Bank. 2008b. Global purchasing power parities and real expenditures: 2005 international comparison program. World Bank. Washington DC. USA.
World Bank. 2009. Hashemite Kingdom of Jordan: Country environmental analysis. Report No. 47829-JO. March 2009. Washington DC, USA.
World Bank. 2010a. World Development Indicators. World Bank. Washington DC. USA.
World Bank. 2010b. The cost of environmental degradation: Case studies from the Middle East and North Africa. Eds: L. Croitoru and M. Sarraf. Washington DC, USA.
World Bank/METAP. 2010. Syrian Arab Republic: Cost assessment of environmental degradation. Consultant report prepared for the World Bank/METAP. March 31.
World Gazetteer. 2010. Population data and statistics. www.world-gazetteer.com
Young, A. 1994. Land degradation in South Asia: its severity, causes and effects upon the people. FAO World Soil Resources Report 78, Rome.
Zumrawi, F.Y., H. Dimond, and J.C. Waterflow. 1987. Effects of infection on growth in Sudanese children. Human Nutrition and Clinical Nutrition 41:453-461.
18
Figure 1: Improved household drinking water supply (% of population)
Note: WBG is West Bank and Gaza. Source: Produced from WHO/UNICEF (2010).
Figure 2: Improved household sanitation facilities (% of population)
Note: The chart presents population with improved, non-shared toilet facility. WBG is West Bank and Gaza. Source: Produced from WHO/UNICEF (2010).
Figure 3: Diarrheal mortality rates in children under five (deaths per 1,000 live births), 2008
Source: Produced from data on structure of child mortality in WHO (2010).
19
Figure 4: Child mortality from water, sanitation and hygiene (per 1,000 live births), 2008
Source: Estimated by the author.
Figure 5: Estimated annual cost of health effects from water, sanitation and hygiene (% of GDP in 2008)
Source: Estimated by the author.
Figure 6: Percent of national populations living in cities > 100,000 inhabitants, 2010 estimates
Source: Produced from data from World Gazetteer (2010).
20
Figure 7: Estimates of Annual Ambient PM concentrations (µg/m3) in cities 100K+
Source: Estimates by the author based on World Bank model estimates and data in METAP/World Bank cost of environmental degradation studies in the MENA region.
Figure 8: Mortality from PM2.5 in cities > 100,000 inhabitants (% of all deaths in the cities)
Source: Estimated by the author. Comoros is not included as the country has not cities > 100,000 inhabitants.
Figure 9: Estimated annual cost of health effects from PM outdoor air pollution (% of GDP in 2008)
Source: Estimates by the author. Comoros is not included as the country has not cities > 100,000 inhabitants.
21
Figure 10: Hectares of arable and permanent crop land per capita, 2007-08
Source: FAO (www.fao.org).
Figure 11: Human induced land degradation (% of total land area)
Data are not reported for Comoros and West Bank and Gaza. Source: FAO (2000) and http://www.fao.org/ag/agl/agll/terrastat/#terrastatdb.
Figure 12: Population distribution on degraded land (% of total population)
Data are not reported for Comoros and West Bank and Gaza. Source: FAO (2000) and http://www.fao.org/ag/agl/agll/terrastat/#terrastatdb.
22
Figure 13: National average crop yield losses due to land degradation
Source: Estimated by the author. Figure 14: Estimated annual cost of agricultural crop land degradation (% of GDP in 2007)
Source: Estimated by the author.
23
Table 1: Assumptions of crop yield reductions on degraded land Land categories Yield reduction (relative to not degraded land) “Low “Medium” “High” Not degraded 0% 0% 0% Mildly degraded 5% 5% 5% Moderately degraded 10% 15% 20% Severely degraded 15% 20% 25% Very severely degraded 20% 25% 30%
Source: Assumptions by the author.
24
Annex 1: Data sources and basic indicators
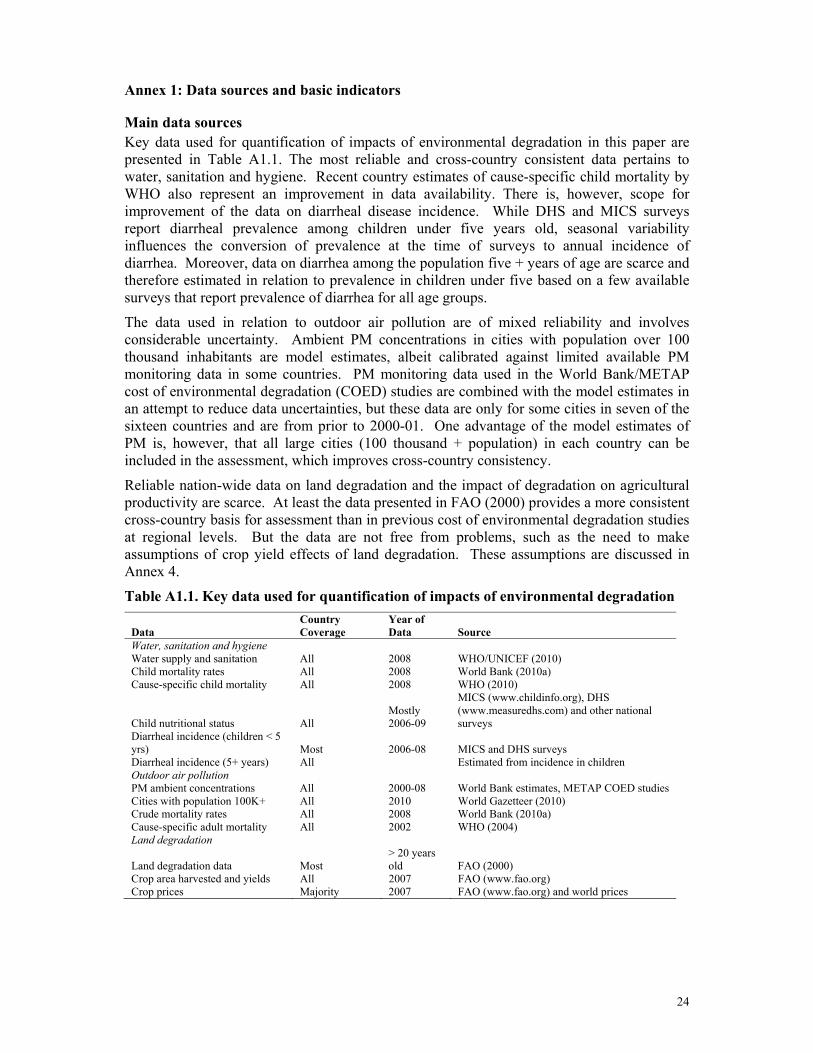
Main data sources Key data used for quantification of impacts of environmental degradation in this paper are presented in Table A1.1. The most reliable and cross-country consistent data pertains to water, sanitation and hygiene. Recent country estimates of cause-specific child mortality by WHO also represent an improvement in data availability. There is, however, scope for improvement of the data on diarrheal disease incidence. While DHS and MICS surveys report diarrheal prevalence among children under five years old, seasonal variability influences the conversion of prevalence at the time of surveys to annual incidence of diarrhea. Moreover, data on diarrhea among the population five + years of age are scarce and therefore estimated in relation to prevalence in children under five based on a few available surveys that report prevalence of diarrhea for all age groups.
The data used in relation to outdoor air pollution are of mixed reliability and involves considerable uncertainty. Ambient PM concentrations in cities with population over 100 thousand inhabitants are model estimates, albeit calibrated against limited available PM monitoring data in some countries. PM monitoring data used in the World Bank/METAP cost of environmental degradation (COED) studies are combined with the model estimates in an attempt to reduce data uncertainties, but these data are only for some cities in seven of the sixteen countries and are from prior to 2000-01. One advantage of the model estimates of PM is, however, that all large cities (100 thousand + population) in each country can be included in the assessment, which improves cross-country consistency.
Reliable nation-wide data on land degradation and the impact of degradation on agricultural productivity are scarce. At least the data presented in FAO (2000) provides a more consistent cross-country basis for assessment than in previous cost of environmental degradation studies at regional levels. But the data are not free from problems, such as the need to make assumptions of crop yield effects of land degradation. These assumptions are discussed in Annex 4.
Table A1.1. Key data used for quantification of impacts of environmental degradation
Data Country Coverage
Year of Data Source
Water, sanitation and hygiene Water supply and sanitation All 2008 WHO/UNICEF (2010) Child mortality rates All 2008 World Bank (2010a) Cause-specific child mortality All 2008 WHO (2010)
Child nutritional status All Mostly 2006-09
MICS (www.childinfo.org), DHS (www.measuredhs.com) and other national surveys
Diarrheal incidence (children < 5 yrs) Most 2006-08 MICS and DHS surveys Diarrheal incidence (5+ years) All Estimated from incidence in children Outdoor air pollution PM ambient concentrations All 2000-08 World Bank estimates, METAP COED studies Cities with population 100K+ All 2010 World Gazetteer (2010)Crude mortality rates All 2008 World Bank (2010a) Cause-specific adult mortality All 2002 WHO (2004) Land degradation
Land degradation data Most > 20 years old FAO (2000)
Crop area harvested and yields All 2007 FAO (www.fao.org) Crop prices Majority 2007 FAO (www.fao.org) and world prices
25
Annex 2: Mortality from water, sanitation and hygiene
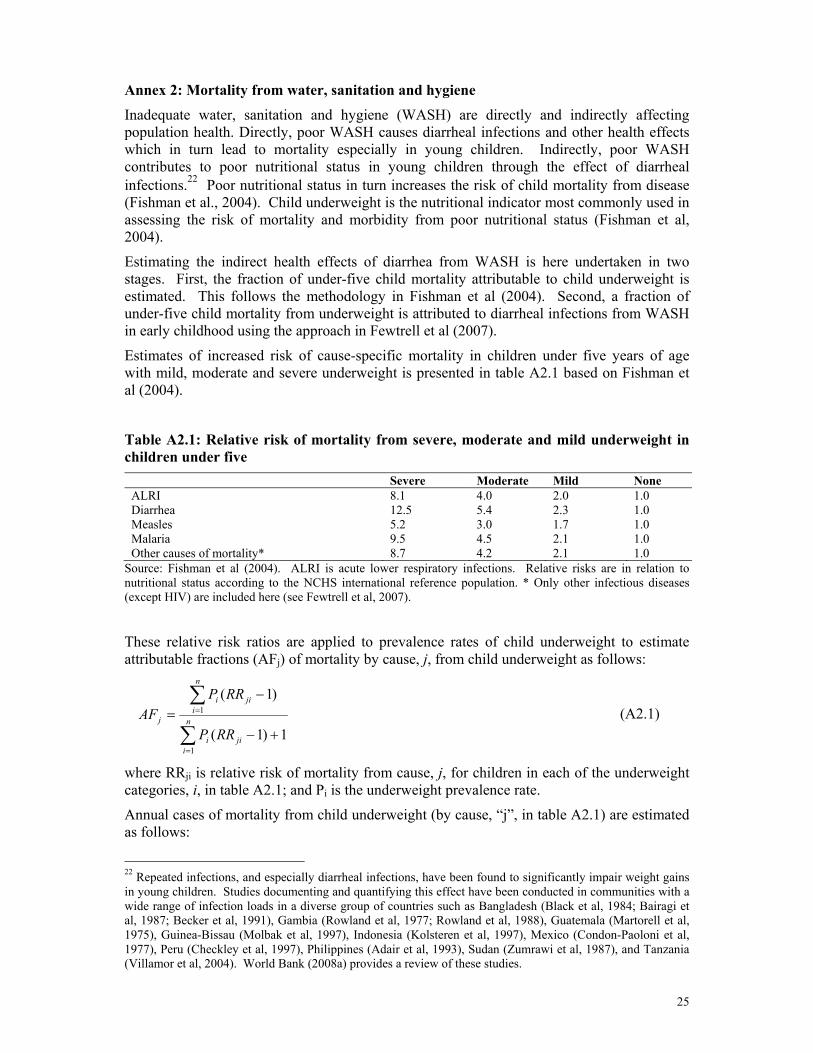
Inadequate water, sanitation and hygiene (WASH) are directly and indirectly affecting population health. Directly, poor WASH causes diarrheal infections and other health effects which in turn lead to mortality especially in young children. Indirectly, poor WASH contributes to poor nutritional status in young children through the effect of diarrheal infections.22 Poor nutritional status in turn increases the risk of child mortality from disease (Fishman et al., 2004). Child underweight is the nutritional indicator most commonly used in assessing the risk of mortality and morbidity from poor nutritional status (Fishman et al, 2004).
Estimating the indirect health effects of diarrhea from WASH is here undertaken in two stages. First, the fraction of under-five child mortality attributable to child underweight is estimated. This follows the methodology in Fishman et al (2004). Second, a fraction of under-five child mortality from underweight is attributed to diarrheal infections from WASH in early childhood using the approach in Fewtrell et al (2007).
Estimates of increased risk of cause-specific mortality in children under five years of age with mild, moderate and severe underweight is presented in table A2.1 based on Fishman et al (2004).
Table A2.1: Relative risk of mortality from severe, moderate and mild underweight in children under five
Severe Moderate Mild None ALRI 8.1 4.0 2.0 1.0 Diarrhea 12.5 5.4 2.3 1.0 Measles 5.2 3.0 1.7 1.0 Malaria 9.5 4.5 2.1 1.0 Other causes of mortality* 8.7 4.2 2.1 1.0
Source: Fishman et al (2004). ALRI is acute lower respiratory infections. Relative risks are in relation to nutritional status according to the NCHS international reference population. * Only other infectious diseases (except HIV) are included here (see Fewtrell et al, 2007). These relative risk ratios are applied to prevalence rates of child underweight to estimate attributable fractions (AFj) of mortality by cause, j, from child underweight as follows:
1)1(
)1(
1
1
+−
−=
∑
∑
=
=n
ijii
n
ijii
j
RRP
RRPAF (A2.1)
where RRji is relative risk of mortality from cause, j, for children in each of the underweight categories, i, in table A2.1; and Pi is the underweight prevalence rate.
Annual cases of mortality from child underweight (by cause, “j”, in table A2.1) are estimated as follows:
22 Repeated infections, and especially diarrheal infections, have been found to significantly impair weight gains in young children. Studies documenting and quantifying this effect have been conducted in communities with a wide range of infection loads in a diverse group of countries such as Bangladesh (Black et al, 1984; Bairagi et al, 1987; Becker et al, 1991), Gambia (Rowland et al, 1977; Rowland et al, 1988), Guatemala (Martorell et al, 1975), Guinea-Bissau (Molbak et al, 1997), Indonesia (Kolsteren et al, 1997), Mexico (Condon-Paoloni et al, 1977), Peru (Checkley et al, 1997), Philippines (Adair et al, 1993), Sudan (Zumrawi et al, 1987), and Tanzania (Villamor et al, 2004). World Bank (2008a) provides a review of these studies.
26
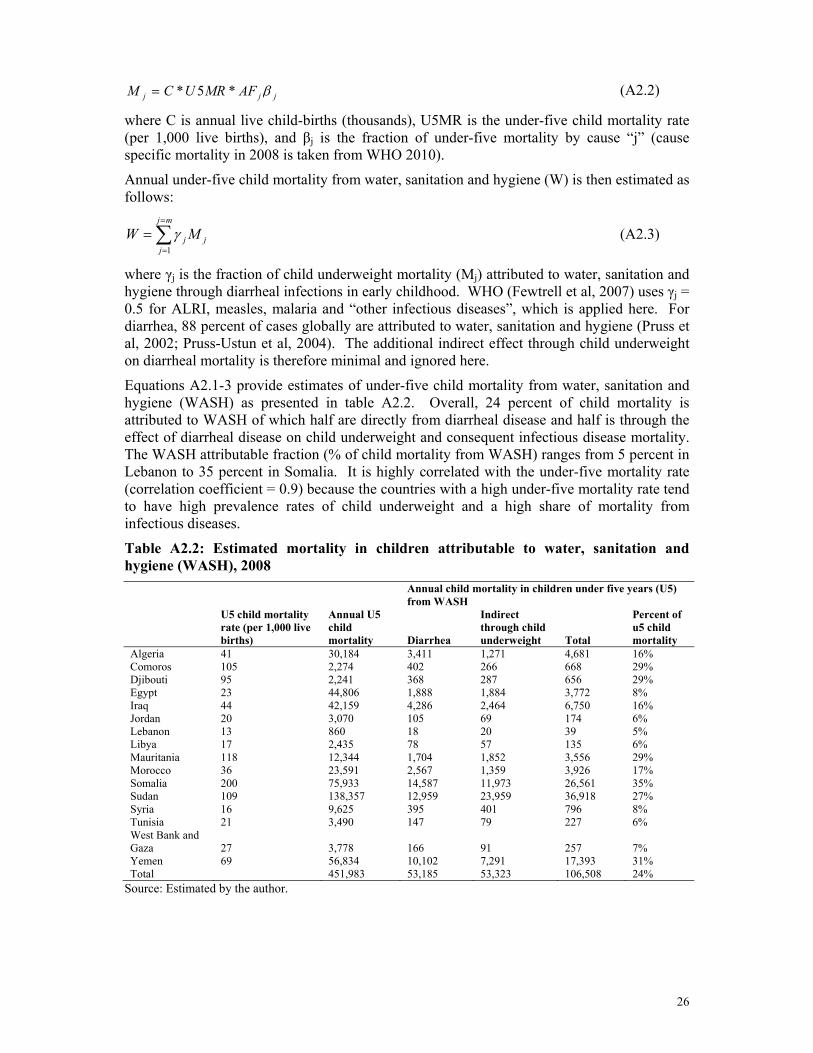
jjj AFMRUCM β*5*= (A2.2)
where C is annual live child-births (thousands), U5MR is the under-five child mortality rate (per 1,000 live births), and βj is the fraction of under-five mortality by cause “j” (cause specific mortality in 2008 is taken from WHO 2010).
Annual under-five child mortality from water, sanitation and hygiene (W) is then estimated as follows:
∑=
=
=mj
jjj MW
1γ (A2.3)
where γj is the fraction of child underweight mortality (Mj) attributed to water, sanitation and hygiene through diarrheal infections in early childhood. WHO (Fewtrell et al, 2007) uses γj = 0.5 for ALRI, measles, malaria and “other infectious diseases”, which is applied here. For diarrhea, 88 percent of cases globally are attributed to water, sanitation and hygiene (Pruss et al, 2002; Pruss-Ustun et al, 2004). The additional indirect effect through child underweight on diarrheal mortality is therefore minimal and ignored here.
Equations A2.1-3 provide estimates of under-five child mortality from water, sanitation and hygiene (WASH) as presented in table A2.2. Overall, 24 percent of child mortality is attributed to WASH of which half are directly from diarrheal disease and half is through the effect of diarrheal disease on child underweight and consequent infectious disease mortality. The WASH attributable fraction (% of child mortality from WASH) ranges from 5 percent in Lebanon to 35 percent in Somalia. It is highly correlated with the under-five mortality rate (correlation coefficient = 0.9) because the countries with a high under-five mortality rate tend to have high prevalence rates of child underweight and a high share of mortality from infectious diseases.
Table A2.2: Estimated mortality in children attributable to water, sanitation and hygiene (WASH), 2008
Annual child mortality in children under five years (U5) from WASH
U5 child mortality rate (per 1,000 live births)
Annual U5 child mortality Diarrhea
Indirect through child underweight Total
Percent of u5 child mortality
Algeria 41 30,184 3,411 1,271 4,681 16% Comoros 105 2,274 402 266 668 29% Djibouti 95 2,241 368 287 656 29% Egypt 23 44,806 1,888 1,884 3,772 8% Iraq 44 42,159 4,286 2,464 6,750 16% Jordan 20 3,070 105 69 174 6% Lebanon 13 860 18 20 39 5% Libya 17 2,435 78 57 135 6% Mauritania 118 12,344 1,704 1,852 3,556 29% Morocco 36 23,591 2,567 1,359 3,926 17% Somalia 200 75,933 14,587 11,973 26,561 35% Sudan 109 138,357 12,959 23,959 36,918 27% Syria 16 9,625 395 401 796 8% Tunisia 21 3,490 147 79 227 6% West Bank and Gaza 27 3,778 166 91 257 7% Yemen 69 56,834 10,102 7,291 17,393 31% Total 451,983 53,185 53,323 106,508 24%
Source: Estimated by the author.
27
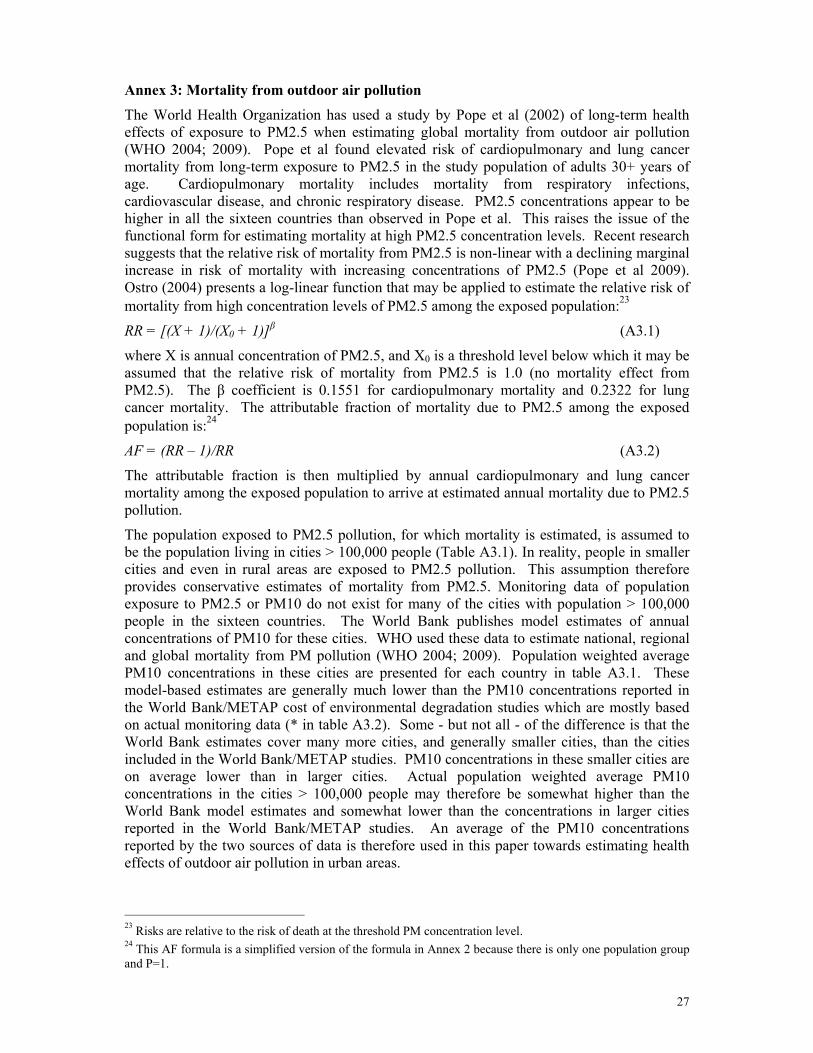
Annex 3: Mortality from outdoor air pollution
The World Health Organization has used a study by Pope et al (2002) of long-term health effects of exposure to PM2.5 when estimating global mortality from outdoor air pollution (WHO 2004; 2009). Pope et al found elevated risk of cardiopulmonary and lung cancer mortality from long-term exposure to PM2.5 in the study population of adults 30+ years of age. Cardiopulmonary mortality includes mortality from respiratory infections, cardiovascular disease, and chronic respiratory disease. PM2.5 concentrations appear to be higher in all the sixteen countries than observed in Pope et al. This raises the issue of the functional form for estimating mortality at high PM2.5 concentration levels. Recent research suggests that the relative risk of mortality from PM2.5 is non-linear with a declining marginal increase in risk of mortality with increasing concentrations of PM2.5 (Pope et al 2009). Ostro (2004) presents a log-linear function that may be applied to estimate the relative risk of mortality from high concentration levels of PM2.5 among the exposed population:23
RR = [(X + 1)/(X0 + 1)]β (A3.1)
where X is annual concentration of PM2.5, and X0 is a threshold level below which it may be assumed that the relative risk of mortality from PM2.5 is 1.0 (no mortality effect from PM2.5). The β coefficient is 0.1551 for cardiopulmonary mortality and 0.2322 for lung cancer mortality. The attributable fraction of mortality due to PM2.5 among the exposed population is:24
AF = (RR – 1)/RR (A3.2)
The attributable fraction is then multiplied by annual cardiopulmonary and lung cancer mortality among the exposed population to arrive at estimated annual mortality due to PM2.5 pollution.
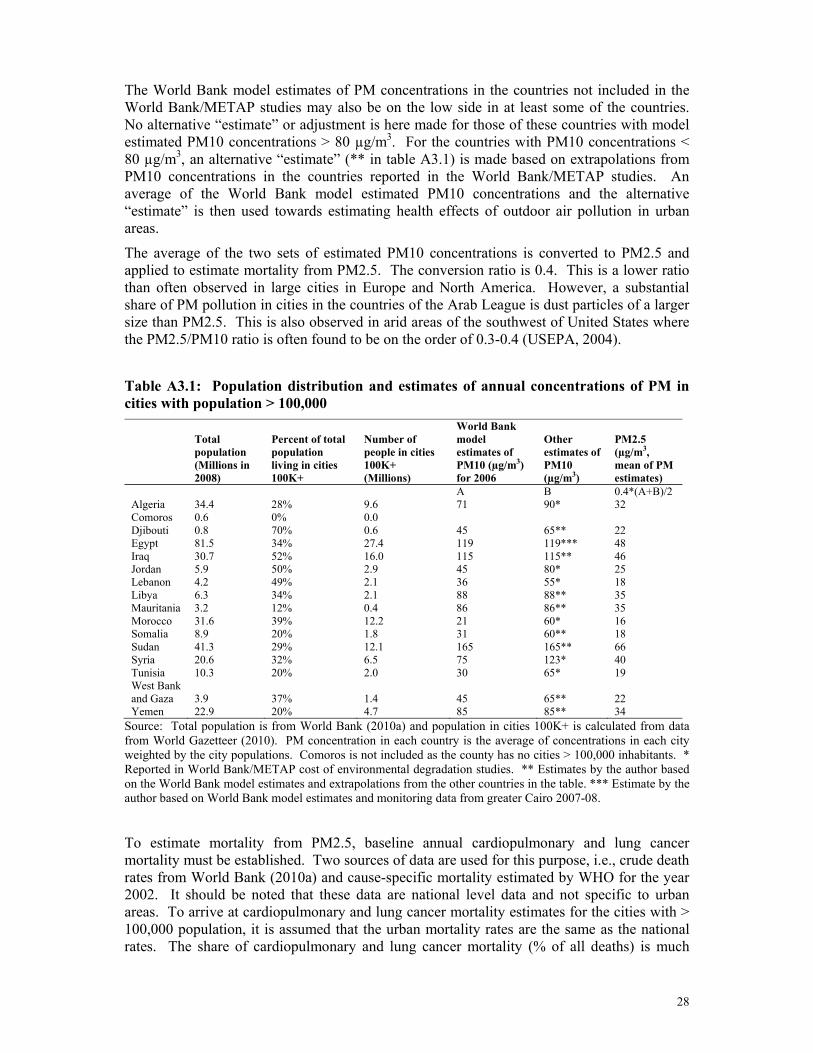
The population exposed to PM2.5 pollution, for which mortality is estimated, is assumed to be the population living in cities > 100,000 people (Table A3.1). In reality, people in smaller cities and even in rural areas are exposed to PM2.5 pollution. This assumption therefore provides conservative estimates of mortality from PM2.5. Monitoring data of population exposure to PM2.5 or PM10 do not exist for many of the cities with population > 100,000 people in the sixteen countries. The World Bank publishes model estimates of annual concentrations of PM10 for these cities. WHO used these data to estimate national, regional and global mortality from PM pollution (WHO 2004; 2009). Population weighted average PM10 concentrations in these cities are presented for each country in table A3.1. These model-based estimates are generally much lower than the PM10 concentrations reported in the World Bank/METAP cost of environmental degradation studies which are mostly based on actual monitoring data (* in table A3.2). Some - but not all - of the difference is that the World Bank estimates cover many more cities, and generally smaller cities, than the cities included in the World Bank/METAP studies. PM10 concentrations in these smaller cities are on average lower than in larger cities. Actual population weighted average PM10 concentrations in the cities > 100,000 people may therefore be somewhat higher than the World Bank model estimates and somewhat lower than the concentrations in larger cities reported in the World Bank/METAP studies. An average of the PM10 concentrations reported by the two sources of data is therefore used in this paper towards estimating health effects of outdoor air pollution in urban areas.
23 Risks are relative to the risk of death at the threshold PM concentration level. 24 This AF formula is a simplified version of the formula in Annex 2 because there is only one population group and P=1.
28
The World Bank model estimates of PM concentrations in the countries not included in the World Bank/METAP studies may also be on the low side in at least some of the countries. No alternative “estimate” or adjustment is here made for those of these countries with model estimated PM10 concentrations > 80 µg/m3. For the countries with PM10 concentrations < 80 µg/m3, an alternative “estimate” (** in table A3.1) is made based on extrapolations from PM10 concentrations in the countries reported in the World Bank/METAP studies. An average of the World Bank model estimated PM10 concentrations and the alternative “estimate” is then used towards estimating health effects of outdoor air pollution in urban areas.
The average of the two sets of estimated PM10 concentrations is converted to PM2.5 and applied to estimate mortality from PM2.5. The conversion ratio is 0.4. This is a lower ratio than often observed in large cities in Europe and North America. However, a substantial share of PM pollution in cities in the countries of the Arab League is dust particles of a larger size than PM2.5. This is also observed in arid areas of the southwest of United States where the PM2.5/PM10 ratio is often found to be on the order of 0.3-0.4 (USEPA, 2004).
Table A3.1: Population distribution and estimates of annual concentrations of PM in cities with population > 100,000
Total population (Millions in 2008)
Percent of total population living in cities 100K+
Number of people in cities 100K+ (Millions)
World Bank model estimates of PM10 (µg/m3) for 2006
Other estimates of PM10 (µg/m3)
PM2.5 (µg/m3, mean of PM estimates)
A B 0.4*(A+B)/2 Algeria 34.4 28% 9.6 71 90* 32 Comoros 0.6 0% 0.0 Djibouti 0.8 70% 0.6 45 65** 22 Egypt 81.5 34% 27.4 119 119*** 48 Iraq 30.7 52% 16.0 115 115** 46 Jordan 5.9 50% 2.9 45 80* 25 Lebanon 4.2 49% 2.1 36 55* 18 Libya 6.3 34% 2.1 88 88** 35 Mauritania 3.2 12% 0.4 86 86** 35 Morocco 31.6 39% 12.2 21 60* 16 Somalia 8.9 20% 1.8 31 60** 18 Sudan 41.3 29% 12.1 165 165** 66 Syria 20.6 32% 6.5 75 123* 40 Tunisia 10.3 20% 2.0 30 65* 19 West Bank and Gaza 3.9 37% 1.4 45 65** 22 Yemen 22.9 20% 4.7 85 85** 34
Source: Total population is from World Bank (2010a) and population in cities 100K+ is calculated from data from World Gazetteer (2010). PM concentration in each country is the average of concentrations in each city weighted by the city populations. Comoros is not included as the county has no cities > 100,000 inhabitants. * Reported in World Bank/METAP cost of environmental degradation studies. ** Estimates by the author based on the World Bank model estimates and extrapolations from the other countries in the table. *** Estimate by the author based on World Bank model estimates and monitoring data from greater Cairo 2007-08. To estimate mortality from PM2.5, baseline annual cardiopulmonary and lung cancer mortality must be established. Two sources of data are used for this purpose, i.e., crude death rates from World Bank (2010a) and cause-specific mortality estimated by WHO for the year 2002. It should be noted that these data are national level data and not specific to urban areas. To arrive at cardiopulmonary and lung cancer mortality estimates for the cities with > 100,000 population, it is assumed that the urban mortality rates are the same as the national rates. The share of cardiopulmonary and lung cancer mortality (% of all deaths) is much
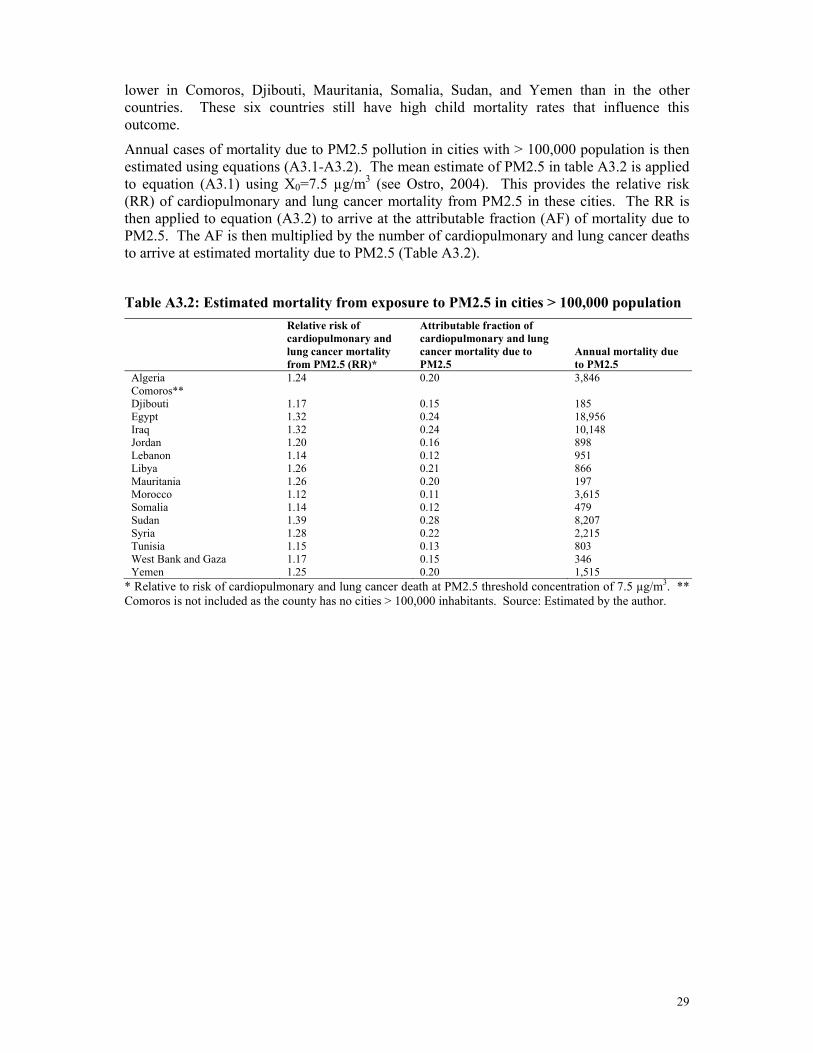
29
lower in Comoros, Djibouti, Mauritania, Somalia, Sudan, and Yemen than in the other countries. These six countries still have high child mortality rates that influence this outcome.
Annual cases of mortality due to PM2.5 pollution in cities with > 100,000 population is then estimated using equations (A3.1-A3.2). The mean estimate of PM2.5 in table A3.2 is applied to equation (A3.1) using X0=7.5 µg/m3 (see Ostro, 2004). This provides the relative risk (RR) of cardiopulmonary and lung cancer mortality from PM2.5 in these cities. The RR is then applied to equation (A3.2) to arrive at the attributable fraction (AF) of mortality due to PM2.5. The AF is then multiplied by the number of cardiopulmonary and lung cancer deaths to arrive at estimated mortality due to PM2.5 (Table A3.2).
Table A3.2: Estimated mortality from exposure to PM2.5 in cities > 100,000 population
Relative risk of cardiopulmonary and lung cancer mortality from PM2.5 (RR)*
Attributable fraction of cardiopulmonary and lung cancer mortality due to PM2.5
Annual mortality due to PM2.5
Algeria 1.24 0.20 3,846 Comoros** Djibouti 1.17 0.15 185 Egypt 1.32 0.24 18,956 Iraq 1.32 0.24 10,148 Jordan 1.20 0.16 898 Lebanon 1.14 0.12 951 Libya 1.26 0.21 866 Mauritania 1.26 0.20 197 Morocco 1.12 0.11 3,615 Somalia 1.14 0.12 479 Sudan 1.39 0.28 8,207 Syria 1.28 0.22 2,215 Tunisia 1.15 0.13 803 West Bank and Gaza 1.17 0.15 346 Yemen 1.25 0.20 1,515
* Relative to risk of cardiopulmonary and lung cancer death at PM2.5 threshold concentration of 7.5 µg/m3. ** Comoros is not included as the county has no cities > 100,000 inhabitants. Source: Estimated by the author.
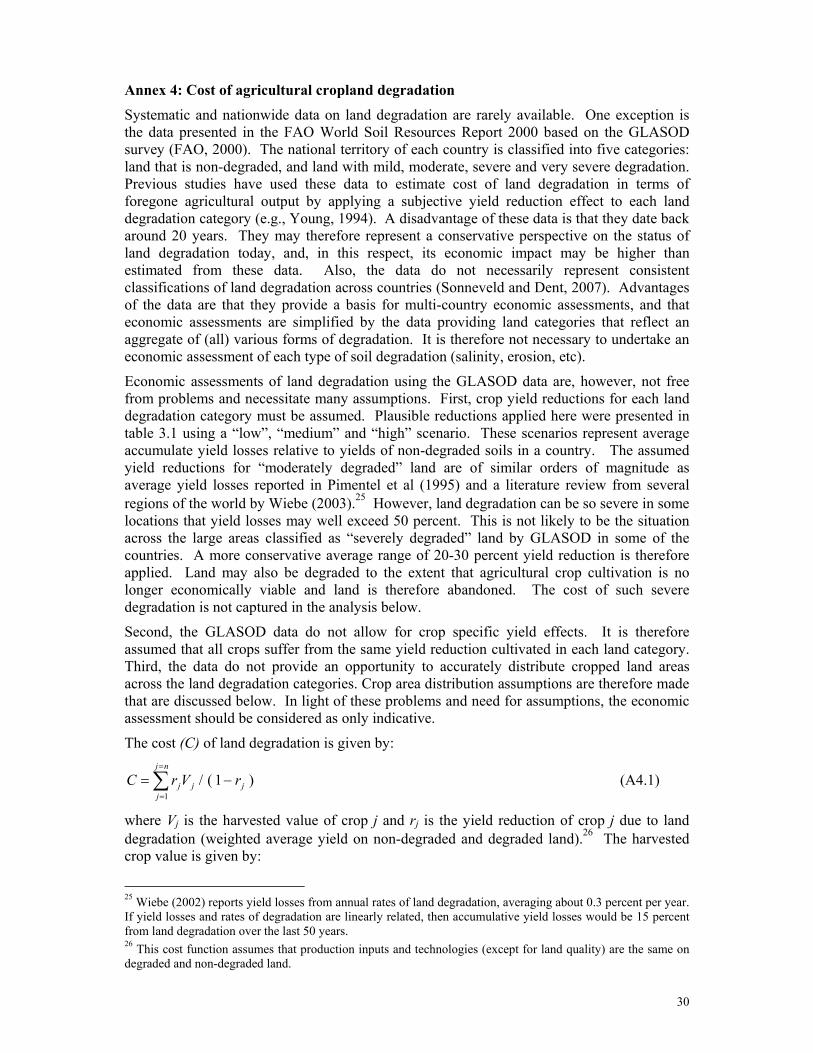
30
Annex 4: Cost of agricultural cropland degradation
Systematic and nationwide data on land degradation are rarely available. One exception is the data presented in the FAO World Soil Resources Report 2000 based on the GLASOD survey (FAO, 2000). The national territory of each country is classified into five categories: land that is non-degraded, and land with mild, moderate, severe and very severe degradation. Previous studies have used these data to estimate cost of land degradation in terms of foregone agricultural output by applying a subjective yield reduction effect to each land degradation category (e.g., Young, 1994). A disadvantage of these data is that they date back around 20 years. They may therefore represent a conservative perspective on the status of land degradation today, and, in this respect, its economic impact may be higher than estimated from these data. Also, the data do not necessarily represent consistent classifications of land degradation across countries (Sonneveld and Dent, 2007). Advantages of the data are that they provide a basis for multi-country economic assessments, and that economic assessments are simplified by the data providing land categories that reflect an aggregate of (all) various forms of degradation. It is therefore not necessary to undertake an economic assessment of each type of soil degradation (salinity, erosion, etc).
Economic assessments of land degradation using the GLASOD data are, however, not free from problems and necessitate many assumptions. First, crop yield reductions for each land degradation category must be assumed. Plausible reductions applied here were presented in table 3.1 using a “low”, “medium” and “high” scenario. These scenarios represent average accumulate yield losses relative to yields of non-degraded soils in a country. The assumed yield reductions for “moderately degraded” land are of similar orders of magnitude as average yield losses reported in Pimentel et al (1995) and a literature review from several regions of the world by Wiebe (2003).25 However, land degradation can be so severe in some locations that yield losses may well exceed 50 percent. This is not likely to be the situation across the large areas classified as “severely degraded” land by GLASOD in some of the countries. A more conservative average range of 20-30 percent yield reduction is therefore applied. Land may also be degraded to the extent that agricultural crop cultivation is no longer economically viable and land is therefore abandoned. The cost of such severe degradation is not captured in the analysis below.
Second, the GLASOD data do not allow for crop specific yield effects. It is therefore assumed that all crops suffer from the same yield reduction cultivated in each land category. Third, the data do not provide an opportunity to accurately distribute cropped land areas across the land degradation categories. Crop area distribution assumptions are therefore made that are discussed below. In light of these problems and need for assumptions, the economic assessment should be considered as only indicative.
The cost (C) of land degradation is given by:
∑=
=
−=nj
jjjj rVrC
1)1(/ (A4.1)
where Vj is the harvested value of crop j and rj is the yield reduction of crop j due to land degradation (weighted average yield on non-degraded and degraded land).26 The harvested crop value is given by:
25 Wiebe (2002) reports yield losses from annual rates of land degradation, averaging about 0.3 percent per year. If yield losses and rates of degradation are linearly related, then accumulative yield losses would be 15 percent from land degradation over the last 50 years. 26 This cost function assumes that production inputs and technologies (except for land quality) are the same on degraded and non-degraded land.
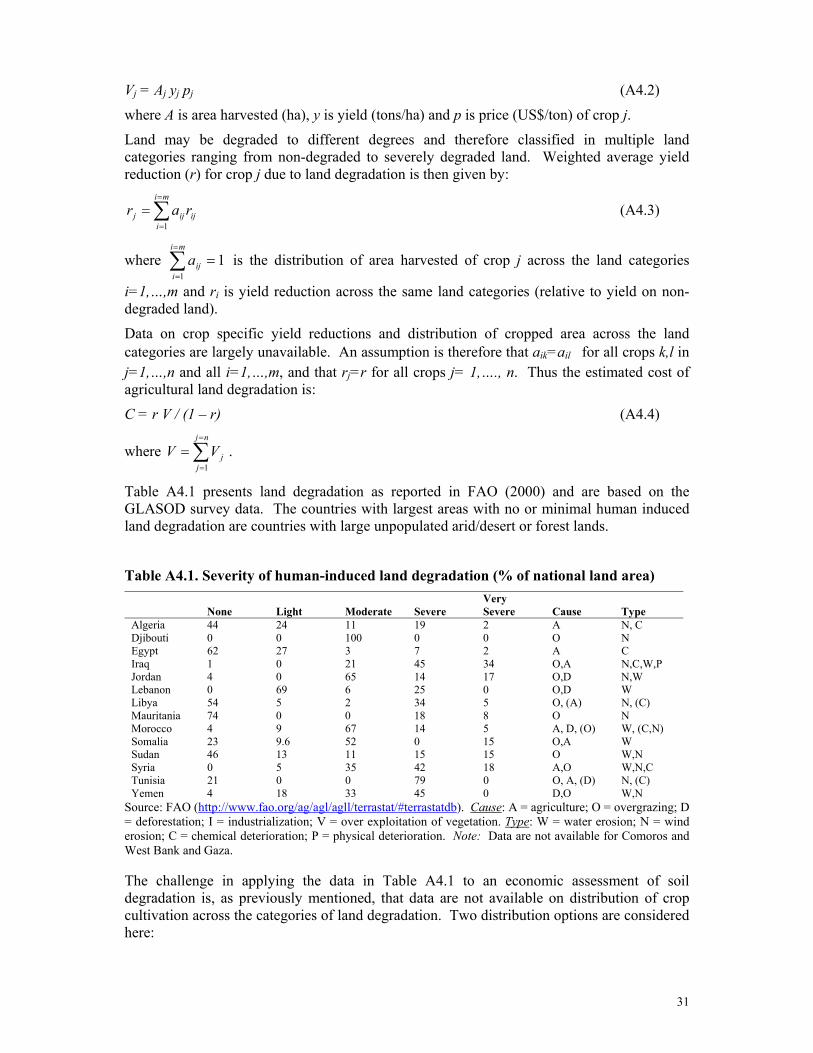
31
Vj = Aj yj pj (A4.2)
where A is area harvested (ha), y is yield (tons/ha) and p is price (US$/ton) of crop j.
Land may be degraded to different degrees and therefore classified in multiple land categories ranging from non-degraded to severely degraded land. Weighted average yield reduction (r) for crop j due to land degradation is then given by:
∑=
=
=mi
iijijj rar
1 (A4.3)
where ∑=
=
=mi
iija
11 is the distribution of area harvested of crop j across the land categories
i=1,…,m and ri is yield reduction across the same land categories (relative to yield on non-degraded land).
Data on crop specific yield reductions and distribution of cropped area across the land categories are largely unavailable. An assumption is therefore that aik=ail for all crops k,l in j=1,…,n and all i=1,…,m, and that rj=r for all crops j= 1,…., n. Thus the estimated cost of agricultural land degradation is:
C = r V / (1 – r) (A4.4)
where ∑=
=
=nj
jjVV
1.
Table A4.1 presents land degradation as reported in FAO (2000) and are based on the GLASOD survey data. The countries with largest areas with no or minimal human induced land degradation are countries with large unpopulated arid/desert or forest lands.
Table A4.1. Severity of human-induced land degradation (% of national land area)
None Light Moderate Severe Very Severe Cause Type
Algeria 44 24 11 19 2 A N, C Djibouti 0 0 100 0 0 O N Egypt 62 27 3 7 2 A C Iraq 1 0 21 45 34 O,A N,C,W,P Jordan 4 0 65 14 17 O,D N,W Lebanon 0 69 6 25 0 O,D W Libya 54 5 2 34 5 O, (A) N, (C) Mauritania 74 0 0 18 8 O N Morocco 4 9 67 14 5 A, D, (O) W, (C,N) Somalia 23 9.6 52 0 15 O,A W Sudan 46 13 11 15 15 O W,N Syria 0 5 35 42 18 A,O W,N,C Tunisia 21 0 0 79 0 O, A, (D) N, (C) Yemen 4 18 33 45 0 D,O W,N
Source: FAO (http://www.fao.org/ag/agl/agll/terrastat/#terrastatdb). Cause: A = agriculture; O = overgrazing; D = deforestation; I = industrialization; V = over exploitation of vegetation. Type: W = water erosion; N = wind erosion; C = chemical deterioration; P = physical deterioration. Note: Data are not available for Comoros and West Bank and Gaza. The challenge in applying the data in Table A4.1 to an economic assessment of soil degradation is, as previously mentioned, that data are not available on distribution of crop cultivation across the categories of land degradation. Two distribution options are considered here:
32
1. Area of agricultural crop cultivation is distributed in proportion to land area in each land degradation category (e.g., 44 percent of cropped area in Algeria is on non-degraded land).
2. Area of agricultural crop cultivation is distributed in proportion to population distribution across the land degradation categories.27
The first option assumes that crop cultivation is uniformly distributed across a country, i.e., hectares of crop cultivation per unit of national land area are the same everywhere. Clearly this is a special case and highly unlikely because of uncultivable desert/arid areas, mountains, and forest land. The second option assumes that hectares of crop cultivation per population are the same everywhere. This may be close to the case if the whole population were rural and employed in agriculture.
Applying equation (A4.3) with rj=r for all crops j= 1,…., n to the data in table A4.1 and population distribution in relation to land degradation gives the national weighted average yield losses for each of the two crop distribution options discussed above. The difference between the two options is largest in Algeria and Egypt, but also quite large in Libya and Mauritania. The mean value of yield losses (mean of the two options) ranges from 9-12 percent in six countries, 14-15 percent in four countries, and 18-21 percent in four countries based on the “low”, “medium” and “high” land degradation yield loss assumptions in table 3.1 (Table A4.2).
The remaining data needed to estimate the annual cost of agricultural cropland degradation is the annual value of agricultural crops harvested (equation A4.2). Annual value is calculated from FAO data on area harvested and yields of each crop (see www.fao.org). Prices of cereals (wheat, rice, barley, rye, millet, maize, oats, and sorghum are world commodity prices. Prices of over 100 other crops (vegetables, pulses, roots and tubers, fruits, etc) are producer prices reported by FAO (www.fao.org) for most of the countries, except for Comoros, Djibouti, Iraq, Libya, Mauritania, and Somalia. Average prices from the region are applied to these countries. Annual value of crops harvested and yield losses are then applied to equation (A4.4) to estimate the annual cost of cropland degradation.
Annual cost of crop land degradation ranges from about 0.2 percent of GDP in Djibouti and Libya to over 2 percent in Somalia and Syria in 2007 in the “medium” yield loss scenario (Table A4.2). The annual cost may be almost 4 percent of GDP in Comoros if applying a yield loss that is on the order of the average for the other Arab League countries.28
27 The GLASOD data report population distribution in relation to land degradation (FAO, 2000). 28 FAO (2000) does not report land degradation data for Comoros and West Bank and Gaza.
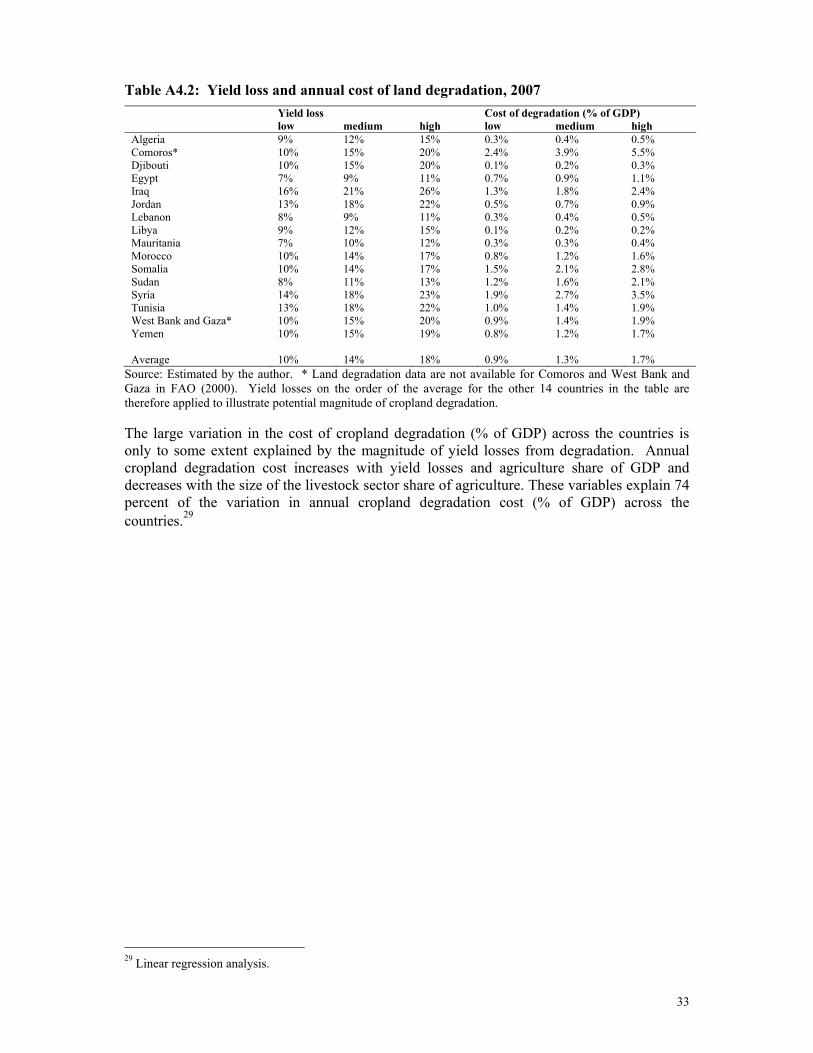
33
Table A4.2: Yield loss and annual cost of land degradation, 2007 Yield loss Cost of degradation (% of GDP) low medium high low medium high Algeria 9% 12% 15% 0.3% 0.4% 0.5% Comoros* 10% 15% 20% 2.4% 3.9% 5.5% Djibouti 10% 15% 20% 0.1% 0.2% 0.3% Egypt 7% 9% 11% 0.7% 0.9% 1.1% Iraq 16% 21% 26% 1.3% 1.8% 2.4% Jordan 13% 18% 22% 0.5% 0.7% 0.9% Lebanon 8% 9% 11% 0.3% 0.4% 0.5% Libya 9% 12% 15% 0.1% 0.2% 0.2%Mauritania 7% 10% 12% 0.3% 0.3% 0.4% Morocco 10% 14% 17% 0.8% 1.2% 1.6% Somalia 10% 14% 17% 1.5% 2.1% 2.8% Sudan 8% 11% 13% 1.2% 1.6% 2.1% Syria 14% 18% 23% 1.9% 2.7% 3.5% Tunisia 13% 18% 22% 1.0% 1.4% 1.9% West Bank and Gaza* 10% 15% 20% 0.9% 1.4% 1.9% Yemen 10% 15% 19% 0.8% 1.2% 1.7% Average 10% 14% 18% 0.9% 1.3% 1.7%
Source: Estimated by the author. * Land degradation data are not available for Comoros and West Bank and Gaza in FAO (2000). Yield losses on the order of the average for the other 14 countries in the table are therefore applied to illustrate potential magnitude of cropland degradation. The large variation in the cost of cropland degradation (% of GDP) across the countries is only to some extent explained by the magnitude of yield losses from degradation. Annual cropland degradation cost increases with yield losses and agriculture share of GDP and decreases with the size of the livestock sector share of agriculture. These variables explain 74 percent of the variation in annual cropland degradation cost (% of GDP) across the countries.29
29 Linear regression analysis.
34
Annex 5: Valuation of health effects
1. Mortality risk Two distinct methods of valuation of mortality are commonly used to estimate the social cost of premature death, i.e., the human capital approach (HCA) and the value of statistical life (VSL). The HCA is here applied to child mortality and VSL to adult mortality.
The HCA is based on the economic contribution of an individual to society over the lifetime of the individual. The lost present value of future income, or human capital value (HCV), from premature death is expressed as follows:
∑=
=
++=ni
ki
ii rgIIPV )1/()1()( 00 (A5.1)
where I0 is income in year 0 (year of death), g is annual growth in real income, and r is the rate of time preference. In the case of children, i∈ {17,…,60}, assuming the lifetime income on average starts at age 17 and ends at age 60.30 An annual growth of real income of 2 percent and a rate of time preference of 3 percent are applied here.
Reliable average labor income data are scarce however. An alternative approach to estimate income is given by:
I0 = gni0 * IL / L0 (A5.2)
where gni0 is gross national income (GNI) per capita in year of death, IL is labor income share of GNI, and L0 is labor participation rate as a percentage of population. GNI per capita in 2008 is available from World Bank (2010a). Reliable country specific estimates of labor income shares of GNI are however not readily available. Estimates of household consumption shares of GNI calculated from World Bank (2010a) suggest that the average labor income share in the 16 countries may be on the order of 60 percent of GNI, and data from World Bank (2010a) indicate that the average labor participation rate in these countries is nearly 40 percent. Given the uncertainties of the country specific data, a labor income share of 60 percent and a labor participation rate of 40 percent are applied here to all 16 countries.
VSL is based on individuals’ valuation of mortality risk. For instance, if individuals on average are willing to pay $200 US for eliminating a mortality risk of 1/10000, then every 10 000 individuals are collectively willing to pay US $2 million to avoid one statistical death. This amount is the VSL. Mrozek and Taylor (2002) from a meta-analysis of VSL estimates from labor market studies from around the world conclude that a VSL range of US $1.5-2.5 million in 1998 prices can be reasonably inferred when “best-practice” assumptions are invoked. A majority of the studies were from the United States, which GDP per capita was US $31,500 in 1998 (World Bank, 2010a). The VSL range inferred by Mrozek and Taylor is substantially lower than average VSL estimated in Viscusi and Aldy (2002) and Kochi et al (2006), both widely referenced meta-analysis studies. These two studies report a mean VSL on the order of US $5-6 million. More recently, Navrud and Lindhjem (2010) present a VSL
30 Variation of start and ending of a working life by a few years have minimal effect on the total PV of lifetime income. Reducing or increasing the ending of working life by 5 years only alters the human capital value (HCV) by 9%. Reducing or increasing the start of a working life by 3 years alters the HCV by 8%.
35
function estimated from a meta-analysis of stated preference studies that provides a VSL of about US $2.5 million when applied to a GDP per capita of US $31,500.
There are few, if any studies of VSL conducted in the sixteen countries covered in this paper. One commonly used approach in transferring VSL values by applying income elasticities.31 Navrud and Linhjem (2010) estimate an income elasticity of 1.0 from the model they recommend for VSL transfer across countries. Thus VSL in country, i, is given by:
VSLi = VSLH * gdpi / gdpH (A5.3)
where VSLH = US $2 million (mid-point estimate in Mrozek and Taylor, 2002), gdpi is GDP per capita in 2008 in country i, and gdpH is average GDP per capita in the countries in which the VSL studies were conducted (here US $30,000). The resultant VSL values applied to adults are around 60 percent larger than the human capital values for children estimated from equation (A5.1).
2.Diarrheal illness Two distinct methods of valuation are commonly used by economists to estimate the social cost of illness, i.e., the cost-of-illness (COI) approach and the willingness-to-pay (WTP) of an individual to avoid or reduce the risk of illness. Studies of WTP are generally not available for most of the countries included in this paper. The COI approach is therefore used to estimate the cost of diarrheal illness. The cost of diarrheal illness per case is given by: C = β (Cm + Cd) + α w (β tT + tI T) (A5.4) where β is treatment rate (% of cases treated at medical facility), α is the fraction of wage rates applied to value time lost to illness (care giving of ill children, and time lost for working and non-working adults), Cm is the cost of medical treatment (US$), Cd is the cost of medicines (US$), w is national average hourly wage rate (US$), tT=3 is hours of time spent seeking medical treatment (travel, waiting, treatment), tI=2 is hours lost per day to illness by ill adults or caregivers of young children, and T=3 is duration of illness in days.
Most DHS surveys - but not MICS - provide an indication of treatment rates at medical facilities for children less than five years of age with diarrhea. Recent DHS surveys are however only available for four of the sixteen countries. Treatment rates were 55-65 percent in Egypt and Jordan, but only 22-26 percent in Morocco and Mauritania according to these surveys. Medicines were also bought at pharmacies for some children that are not reflected in these treatment rates. Thus, over 65 percent of children in Morocco with diarrhea received some form of treatment, but only 35 percent in Mauritania. Given the scarcity of data on treatment rates of diarrhea, a 60 percent treatment rate (β=0.6) is here applied to all 16 countries for children and adults. Applying a treatment rate to 40 percent reduces the estimated total cost of a case of diarrhea by only 12-17 percent because the estimated cost of time losses from illness generally constitute the largest cost share (Table A5.1).
As to cost of time lost to illness, economists generally apply a rate of 0.5-1.0 of wage rates depending on the nature of the time losses. A rate of 1.0 would reflect the economic cost of income losses. A rate of 0.5 may better reflect the cost for non-income earning caretakers
31 The income elasticity is the percentage change in VSL per percentage change in income.
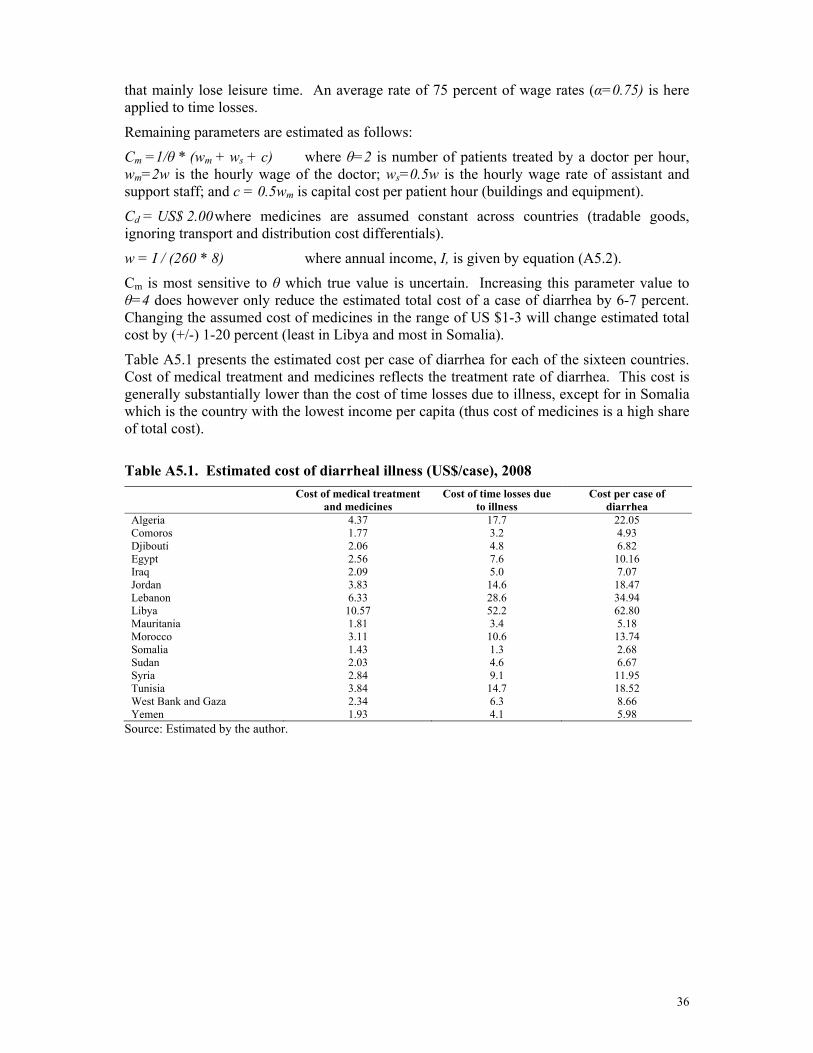
36
that mainly lose leisure time. An average rate of 75 percent of wage rates (α=0.75) is here applied to time losses.
Remaining parameters are estimated as follows:
Cm =1/θ * (wm + ws + c) where θ=2 is number of patients treated by a doctor per hour, wm=2w is the hourly wage of the doctor; ws=0.5w is the hourly wage rate of assistant and support staff; and c = 0.5wm is capital cost per patient hour (buildings and equipment).
Cd = US$ 2.00 where medicines are assumed constant across countries (tradable goods, ignoring transport and distribution cost differentials).
w = I / (260 * 8) where annual income, I, is given by equation (A5.2).
Cm is most sensitive to θ which true value is uncertain. Increasing this parameter value to θ=4 does however only reduce the estimated total cost of a case of diarrhea by 6-7 percent. Changing the assumed cost of medicines in the range of US $1-3 will change estimated total cost by (+/-) 1-20 percent (least in Libya and most in Somalia).
Table A5.1 presents the estimated cost per case of diarrhea for each of the sixteen countries. Cost of medical treatment and medicines reflects the treatment rate of diarrhea. This cost is generally substantially lower than the cost of time losses due to illness, except for in Somalia which is the country with the lowest income per capita (thus cost of medicines is a high share of total cost).
Table A5.1. Estimated cost of diarrheal illness (US$/case), 2008
Cost of medical treatment
and medicines Cost of time losses due
to illness Cost per case of
diarrhea Algeria 4.37 17.7 22.05 Comoros 1.77 3.2 4.93 Djibouti 2.06 4.8 6.82 Egypt 2.56 7.6 10.16 Iraq 2.09 5.0 7.07 Jordan 3.83 14.6 18.47 Lebanon 6.33 28.6 34.94 Libya 10.57 52.2 62.80 Mauritania 1.81 3.4 5.18 Morocco 3.11 10.6 13.74 Somalia 1.43 1.3 2.68 Sudan 2.03 4.6 6.67 Syria 2.84 9.1 11.95 Tunisia 3.84 14.7 18.52 West Bank and Gaza 2.34 6.3 8.66 Yemen 1.93 4.1 5.98
Source: Estimated by the author.
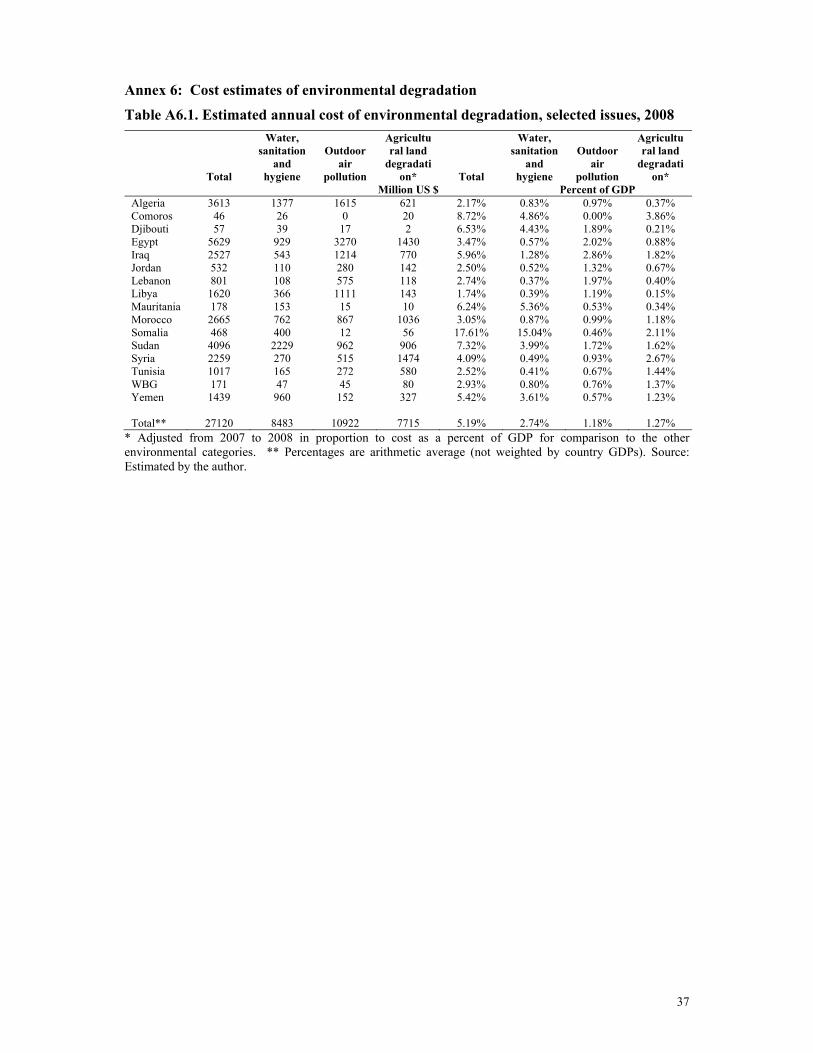
37
Annex 6: Cost estimates of environmental degradation
Table A6.1. Estimated annual cost of environmental degradation, selected issues, 2008
Total
Water, sanitation
and hygiene
Outdoor air
pollution
Agricultural land
degradation* Total
Water, sanitation
and hygiene
Outdoor air
pollution
Agricultural land
degradation*
Million US $ Percent of GDP Algeria 3613 1377 1615 621 2.17% 0.83% 0.97% 0.37% Comoros 46 26 0 20 8.72% 4.86% 0.00% 3.86% Djibouti 57 39 17 2 6.53% 4.43% 1.89% 0.21% Egypt 5629 929 3270 1430 3.47% 0.57% 2.02% 0.88% Iraq 2527 543 1214 770 5.96% 1.28% 2.86% 1.82% Jordan 532 110 280 142 2.50% 0.52% 1.32% 0.67% Lebanon 801 108 575 118 2.74% 0.37% 1.97% 0.40% Libya 1620 366 1111 143 1.74% 0.39% 1.19% 0.15% Mauritania 178 153 15 10 6.24% 5.36% 0.53% 0.34% Morocco 2665 762 867 1036 3.05% 0.87% 0.99% 1.18% Somalia 468 400 12 56 17.61% 15.04% 0.46% 2.11% Sudan 4096 2229 962 906 7.32% 3.99% 1.72% 1.62% Syria 2259 270 515 1474 4.09% 0.49% 0.93% 2.67% Tunisia 1017 165 272 580 2.52% 0.41% 0.67% 1.44% WBG 171 47 45 80 2.93% 0.80% 0.76% 1.37% Yemen 1439 960 152 327 5.42% 3.61% 0.57% 1.23% Total** 27120 8483 10922 7715 5.19% 2.74% 1.18% 1.27%
* Adjusted from 2007 to 2008 in proportion to cost as a percent of GDP for comparison to the other environmental categories. ** Percentages are arithmetic average (not weighted by country GDPs). Source: Estimated by the author.