Embed Size (px)
Citation preview
Cost Behavior:Analysis and Use
Chapter
5
© The McGraw-Hill Companies, Inc., 2000Irwin/McGraw-Hill
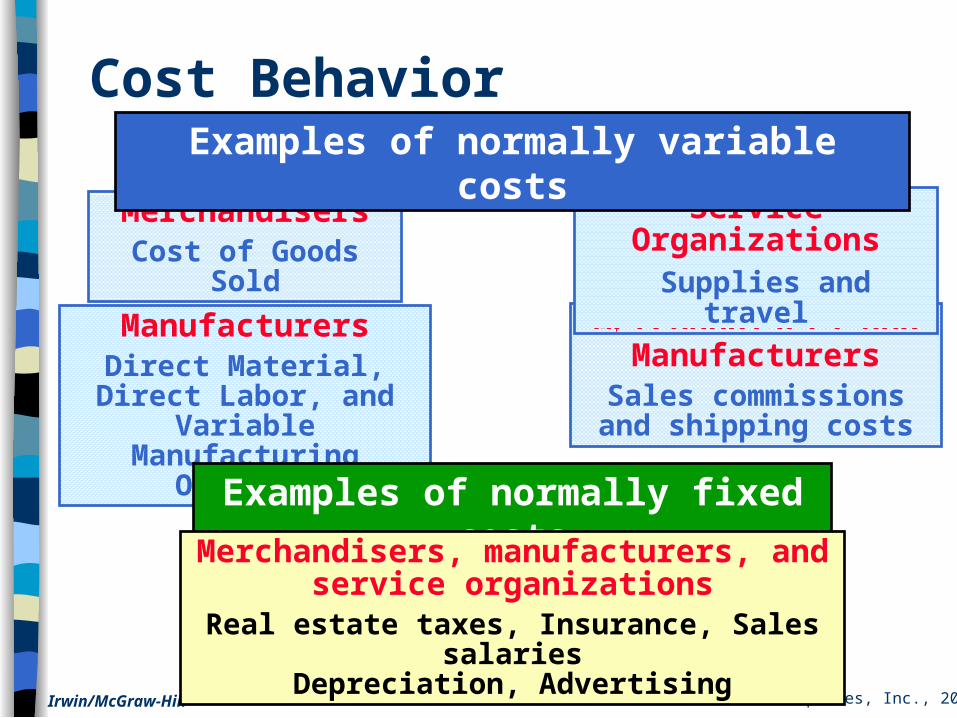
Cost Behavior
MerchandisersCost of Goods Sold
ManufacturersDirect Material, Direct Labor, and Variable
Manufacturing Overhead
Merchandisers and Manufacturers
Sales commissions and shipping costs
Service Organizations Supplies and travel
Examples of normally variable costs
Examples of normally fixed costs
Merchandisers, manufacturers, and service organizations
Real estate taxes, Insurance, Sales salariesDepreciation, Advertising
© The McGraw-Hill Companies, Inc., 2000Irwin/McGraw-Hill
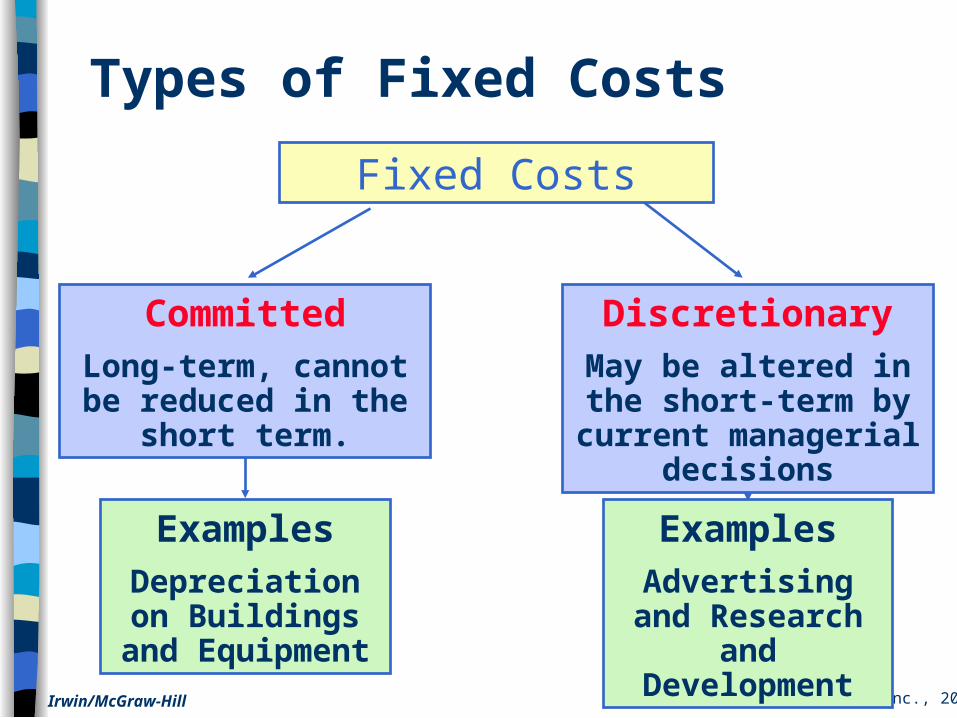
Types of Fixed Costs
Fixed Costs
DiscretionaryMay be altered in the short-term by current managerial decisions
CommittedLong-term, cannot be reduced in the short
term.
ExamplesDepreciation on Buildings and
Equipment
ExamplesAdvertising and Research and Development
© The McGraw-Hill Companies, Inc., 2000Irwin/McGraw-Hill
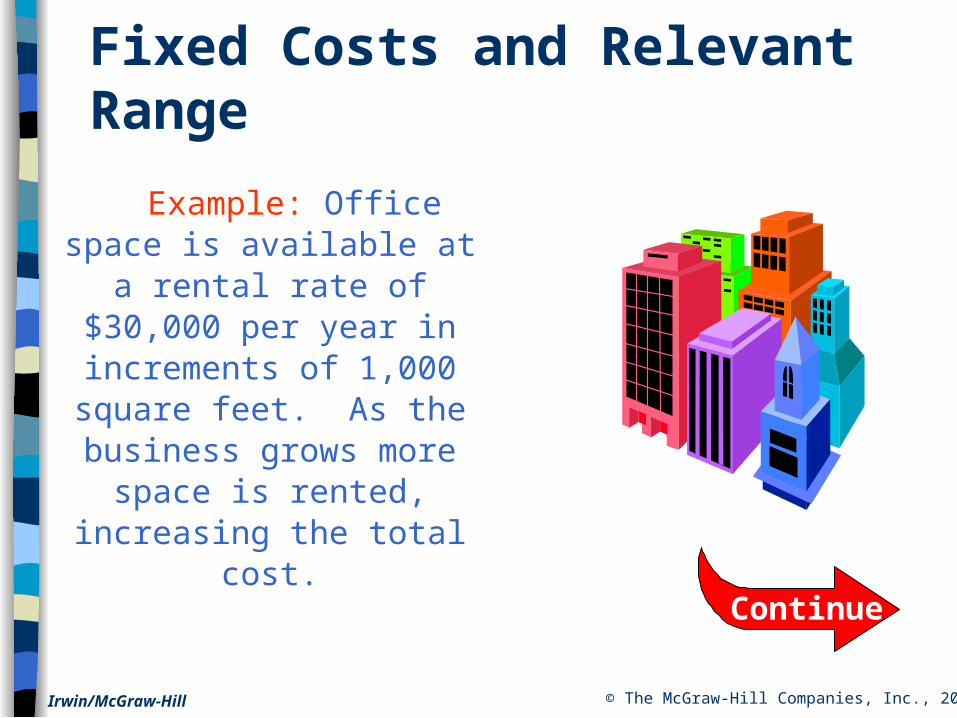
Example: Office space is available at a rental
rate of $30,000 per year in increments of 1,000 square feet. As
the business grows more space is rented,
increasing the total cost.
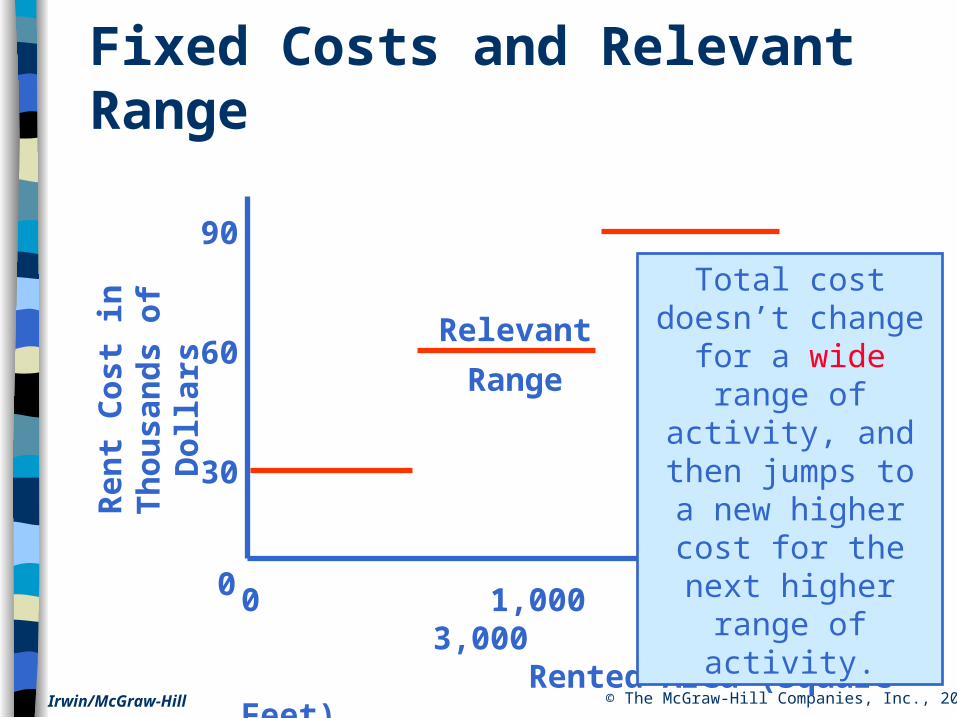
Fixed Costs and Relevant Range
Continue
© The McGraw-Hill Companies, Inc., 2000Irwin/McGraw-Hill
Ren
t C
ost
in
T
ho
usa
nd
s o
f D
oll
ars
0 1,000 2,000 3,000 Rented Area (Square Feet)
0
30
60
Fixed Costs and Relevant Range
90
Relevant
Range
Total cost doesn’t change for a wide range of activity,
and then jumps to a new higher cost for
the next higher range of activity.
© The McGraw-Hill Companies, Inc., 2000Irwin/McGraw-Hill
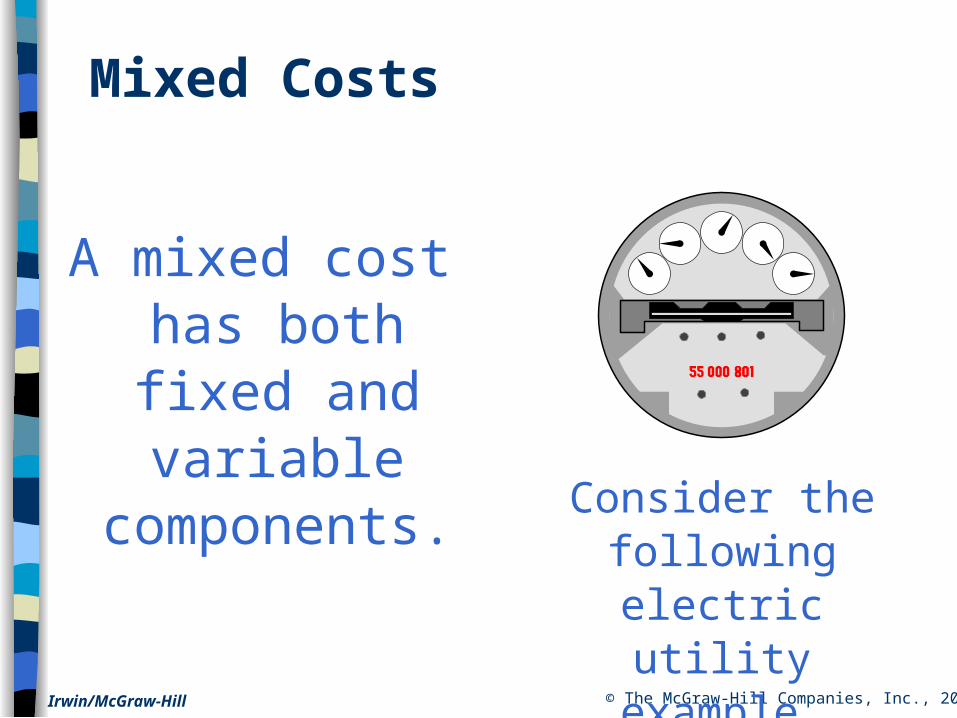
A mixed costhas both fixed and variablecomponents.
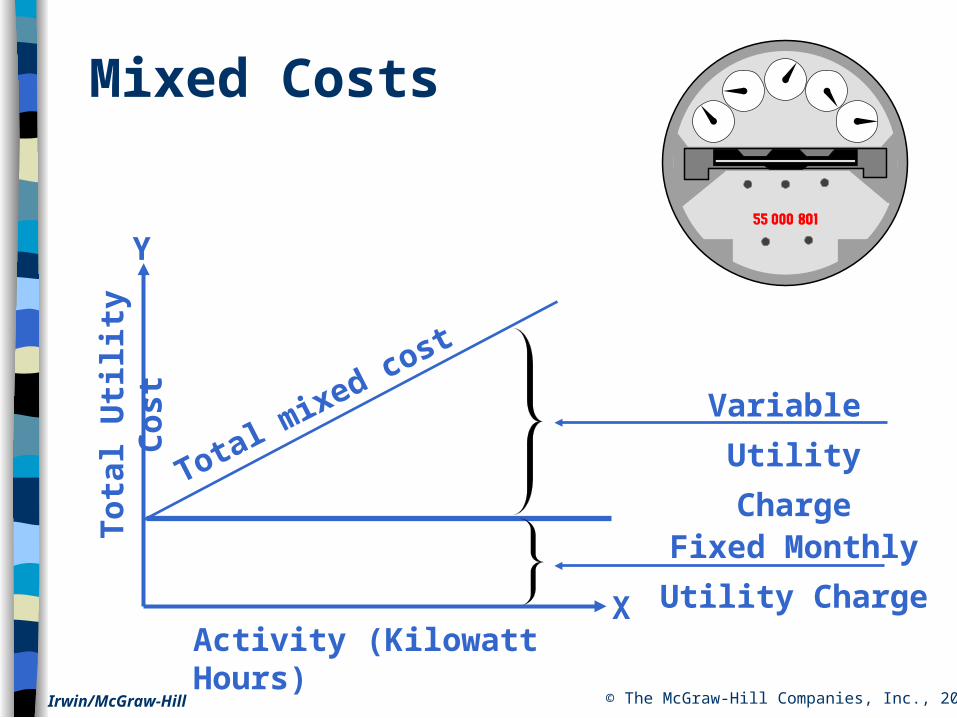
Mixed Costs
Consider thefollowing electric utility example.
© The McGraw-Hill Companies, Inc., 2000Irwin/McGraw-Hill
Fixed Monthly
Utility Charge
Variable
Utility Charge
Activity (Kilowatt Hours)
To
tal
Uti
lity
Co
stMixed Costs
X
Y
Total mixed cost
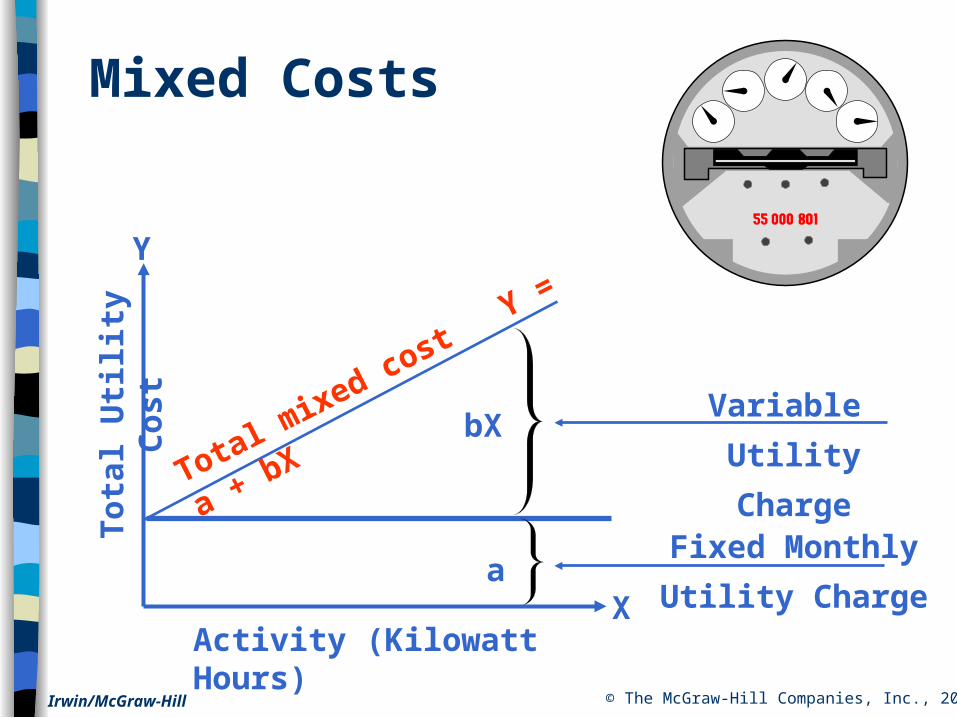
© The McGraw-Hill Companies, Inc., 2000Irwin/McGraw-Hill
Fixed Monthly
Utility Charge
Variable
Utility Charge
Activity (Kilowatt Hours)
To
tal
Uti
lity
Co
st
Total mixed cost Y
= a + bX
Mixed Costs
bX
aX
Y

© The McGraw-Hill Companies, Inc., 2000Irwin/McGraw-Hill
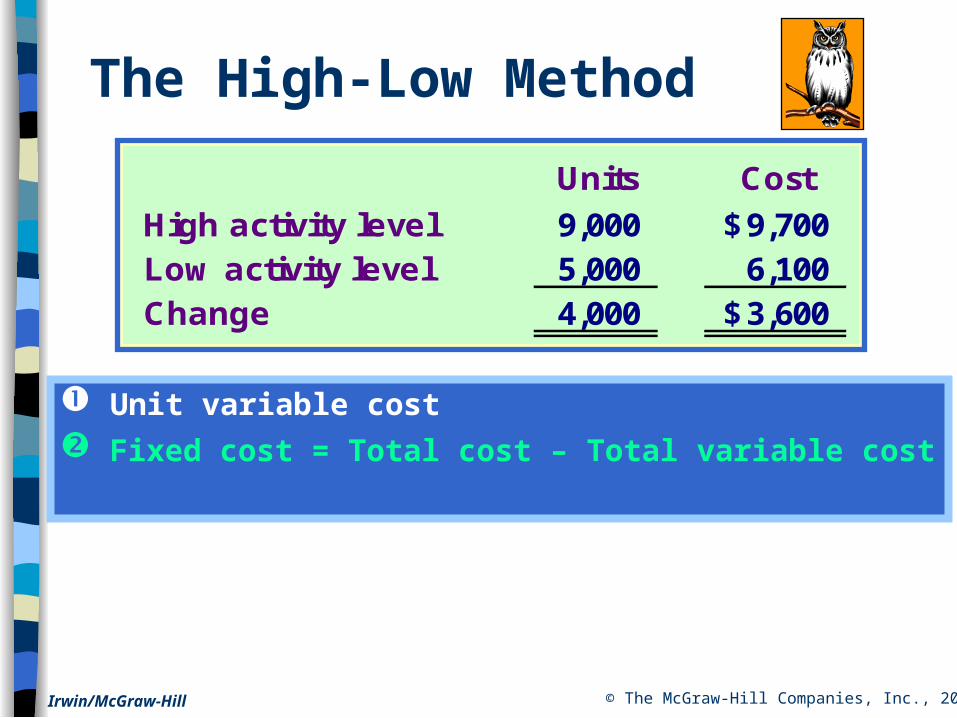
Unit variable cost =Changein costChange in units
Units Cost
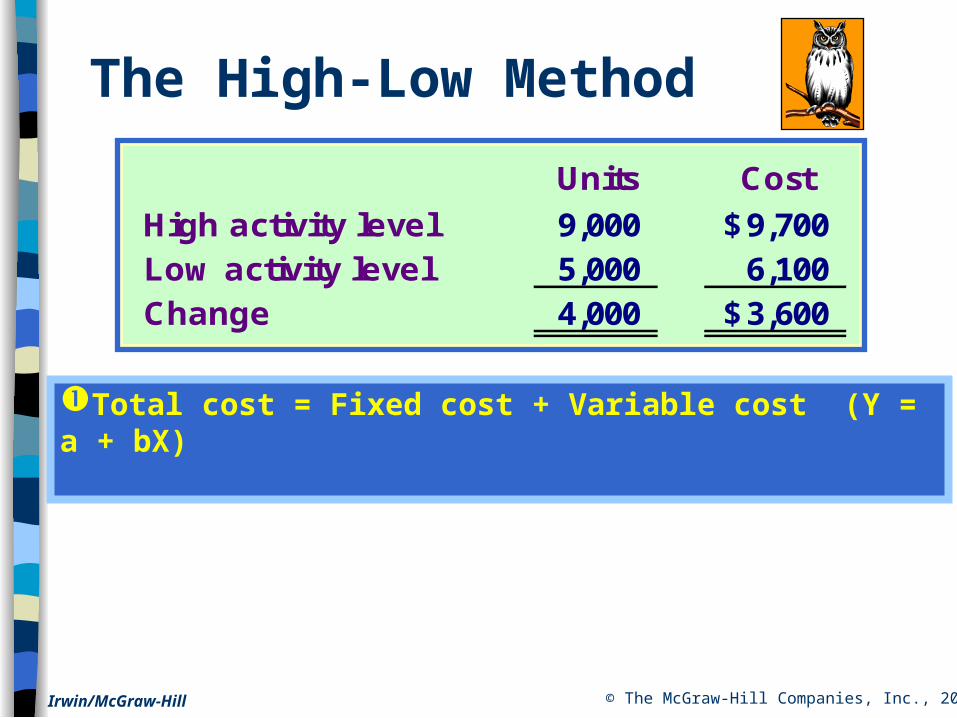
High activity level 9,000 9,700$ Low activity level 5,000 6,100 Change 4,000 3,600$
The High-Low Method
© The McGraw-Hill Companies, Inc., 2000Irwin/McGraw-Hill
Units Cost
High activity level 9,000 9,700$ Low activity level 5,000 6,100 Change 4,000 3,600$
The High-Low Method
Unit variable cost Fixed cost = Total cost – Total variable cost
© The McGraw-Hill Companies, Inc., 2000Irwin/McGraw-Hill
Total cost = Fixed cost + Variable cost (Y = a + bX)
Units Cost
High activity level 9,000 9,700$ Low activity level 5,000 6,100 Change 4,000 3,600$
The High-Low Method
© The McGraw-Hill Companies, Inc., 2000Irwin/McGraw-Hill
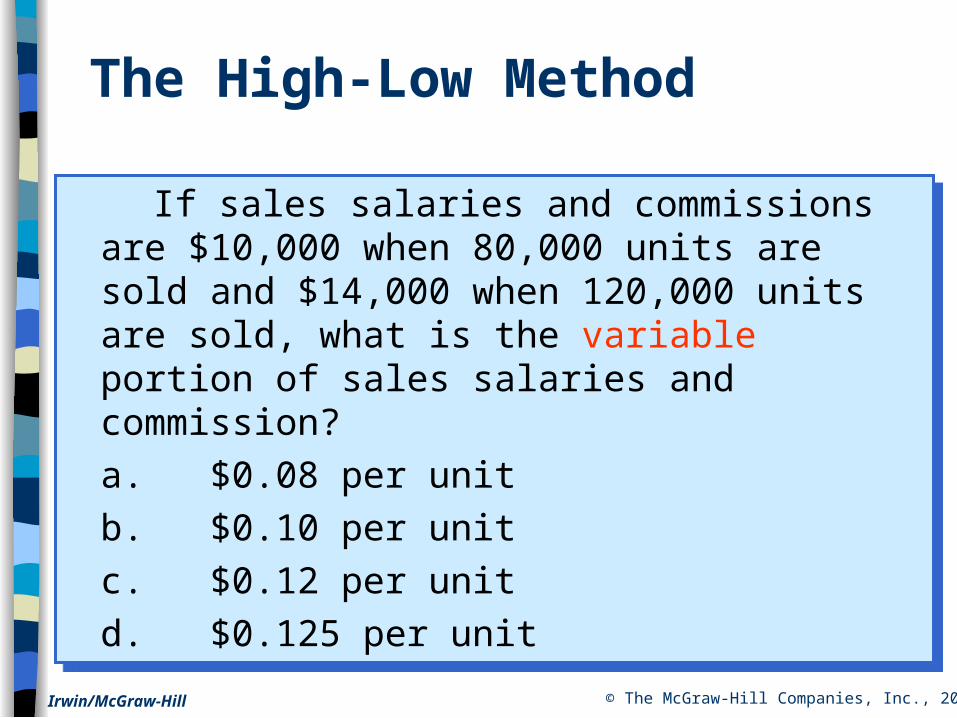
If sales salaries and commissions are $10,000 when 80,000 units are sold and $14,000 when 120,000 units are sold, what is the variable portion of sales salaries and commission?
a. $0.08 per unit
b. $0.10 per unit
c. $0.12 per unit
d. $0.125 per unit
If sales salaries and commissions are $10,000 when 80,000 units are sold and $14,000 when 120,000 units are sold, what is the variable portion of sales salaries and commission?
a. $0.08 per unit
b. $0.10 per unit
c. $0.12 per unit
d. $0.125 per unit
The High-Low Method
© The McGraw-Hill Companies, Inc., 2000Irwin/McGraw-Hill
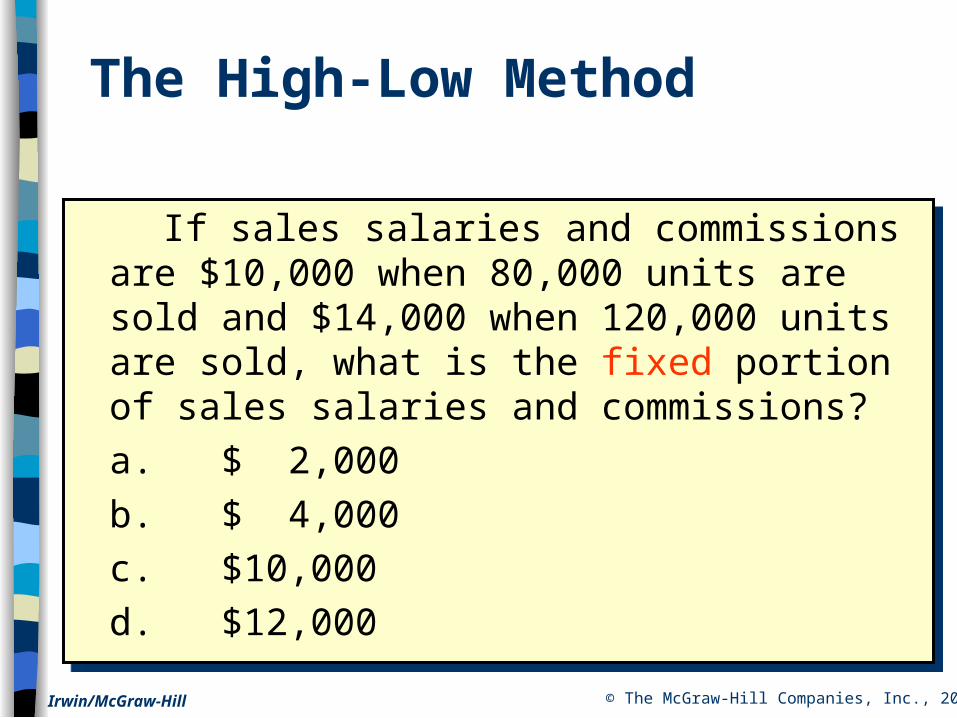
If sales salaries and commissions are $10,000 when 80,000 units are sold and $14,000 when 120,000 units are sold, what is the fixed portion of sales salaries and commissions?
a. $ 2,000
b. $ 4,000
c. $10,000
d. $12,000
If sales salaries and commissions are $10,000 when 80,000 units are sold and $14,000 when 120,000 units are sold, what is the fixed portion of sales salaries and commissions?
a. $ 2,000
b. $ 4,000
c. $10,000
d. $12,000
The High-Low Method
© The McGraw-Hill Companies, Inc., 2000Irwin/McGraw-Hill
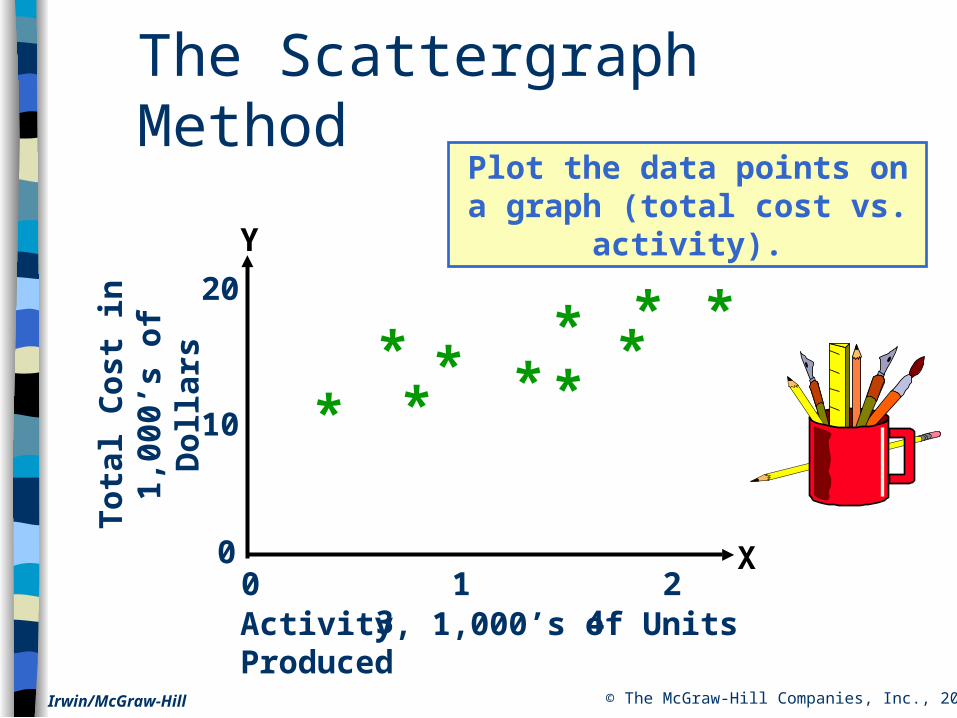
The Scattergraph MethodPlot the data points on a
graph (total cost vs. activity).
0 1 2 3 4
*
To
tal
Co
st i
n1,
000’
s o
f D
oll
ars
10
20
0
***
**
**
*
*
Activity, 1,000’s of Units Produced
X
Y
© The McGraw-Hill Companies, Inc., 2000Irwin/McGraw-Hill
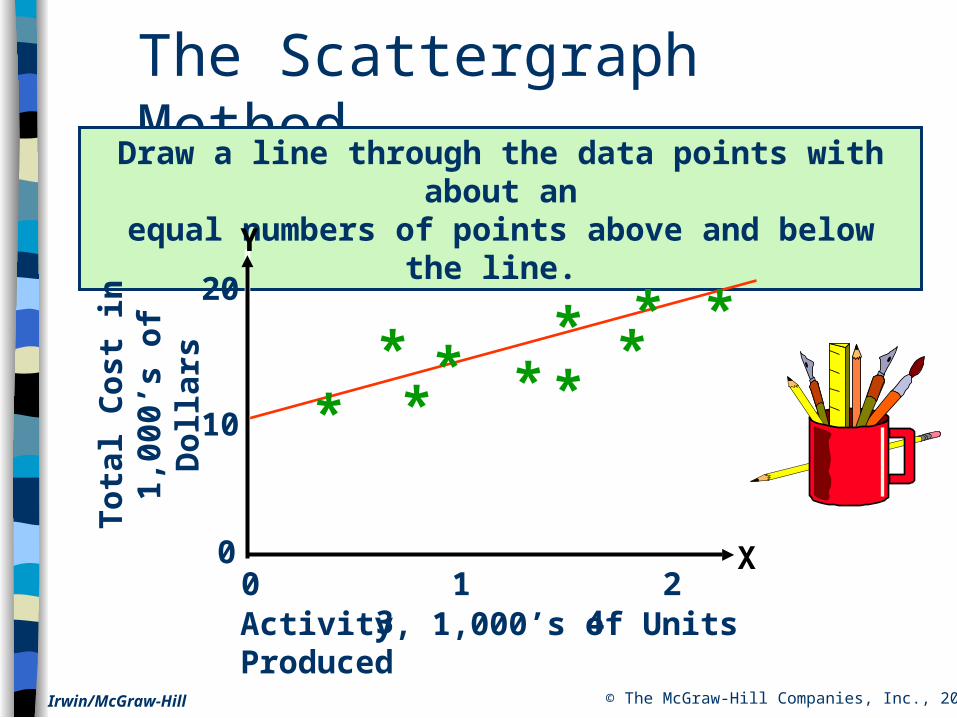
The Scattergraph MethodDraw a line through the data points with about an
equal numbers of points above and below the line.
0 1 2 3 4
*
To
tal
Co
st i
n1,
000’
s o
f D
oll
ars
10
20
0
***
**
**
*
*
Activity, 1,000’s of Units Produced
X
Y
© The McGraw-Hill Companies, Inc., 2000Irwin/McGraw-Hill
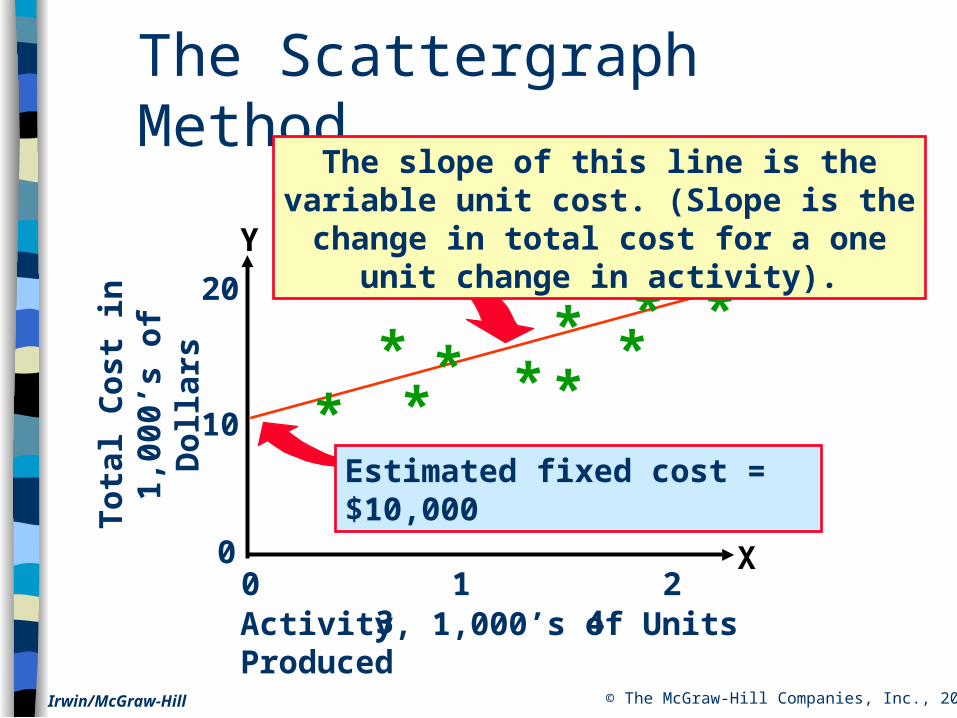
The Scattergraph Method
Estimated fixed cost = $10,000
0 1 2 3 4
*
To
tal
Co
st i
n1,
000’
s o
f D
oll
ars
10
20
0
***
**
**
*
*
Activity, 1,000’s of Units Produced
X
Y
The slope of this line is the variable unit cost. (Slope is the change in total cost
for a one unit change in activity).
© The McGraw-Hill Companies, Inc., 2000Irwin/McGraw-Hill
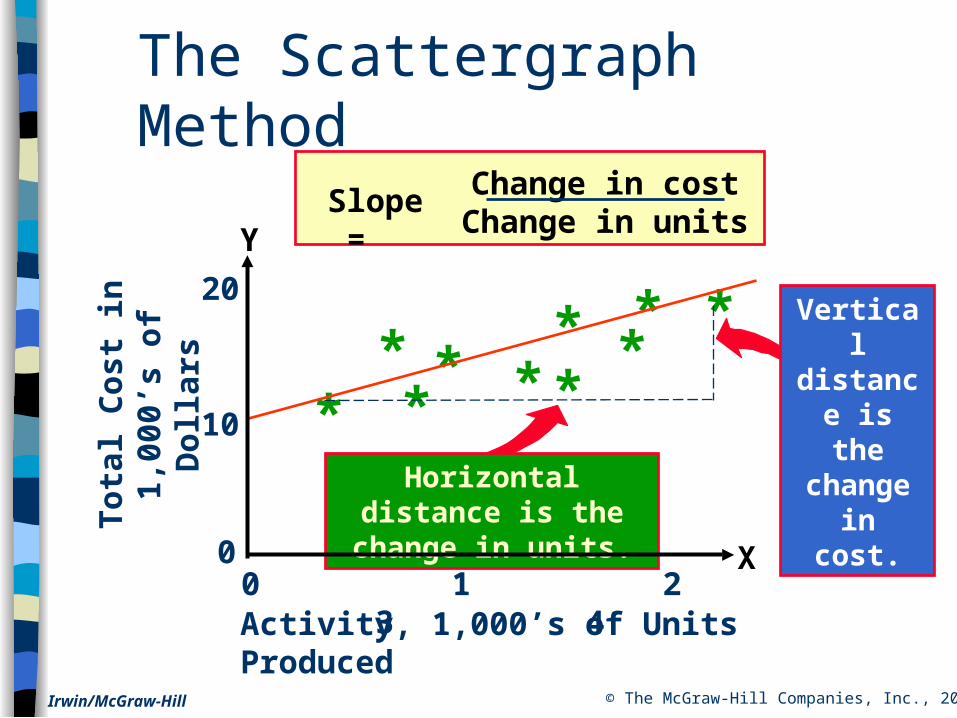
The Scattergraph Method
Slope = Change in costChange in units
Horizontal distance is the change in units.
0 1 2 3 4
*
To
tal
Co
st i
n1,
000’
s o
f D
oll
ars
10
20
0
***
**
**
*
*
Activity, 1,000’s of Units Produced
X
Y
Vertical distance
is the change in cost.
© The McGraw-Hill Companies, Inc., 2000Irwin/McGraw-Hill
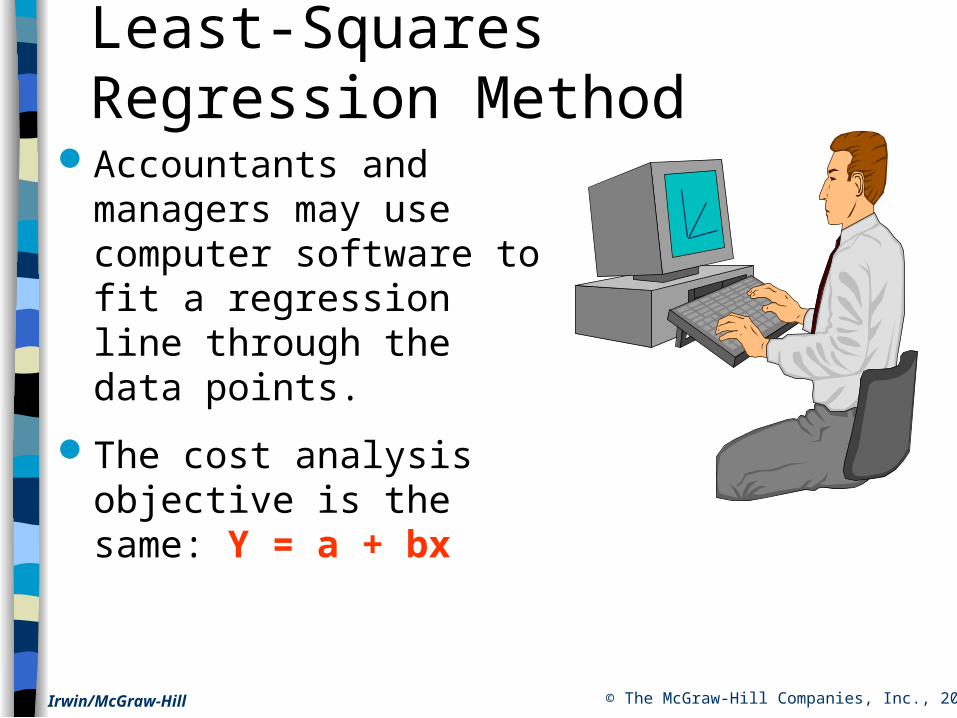
Accountants and managers may use computer software to fit a regression line through the data points.
The cost analysis objective is the same: Y = a + bx
Least-Squares Regression Method
© The McGraw-Hill Companies, Inc., 2000Irwin/McGraw-Hill
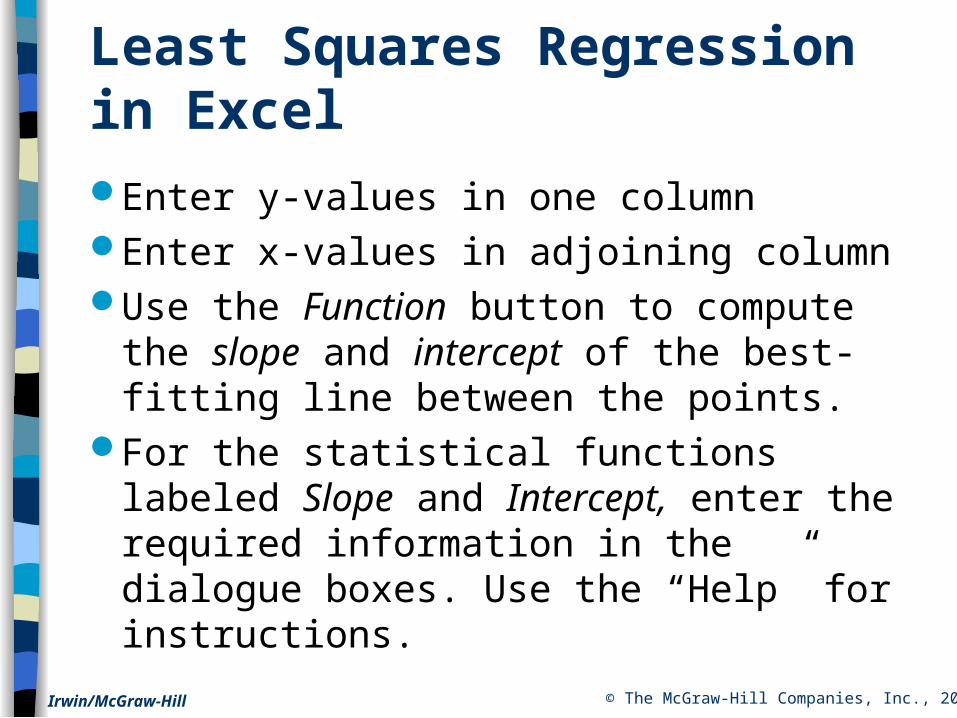
Least Squares Regression in Excel
Enter y-values in one columnEnter x-values in adjoining columnUse the Function button to compute the slope and intercept of the best-fitting line between the points.
For the statistical functions labeled Slope and Intercept, enter the required information in the dialogue boxes. Use the “Help” for instructions.
© The McGraw-Hill Companies, Inc., 2000Irwin/McGraw-Hill
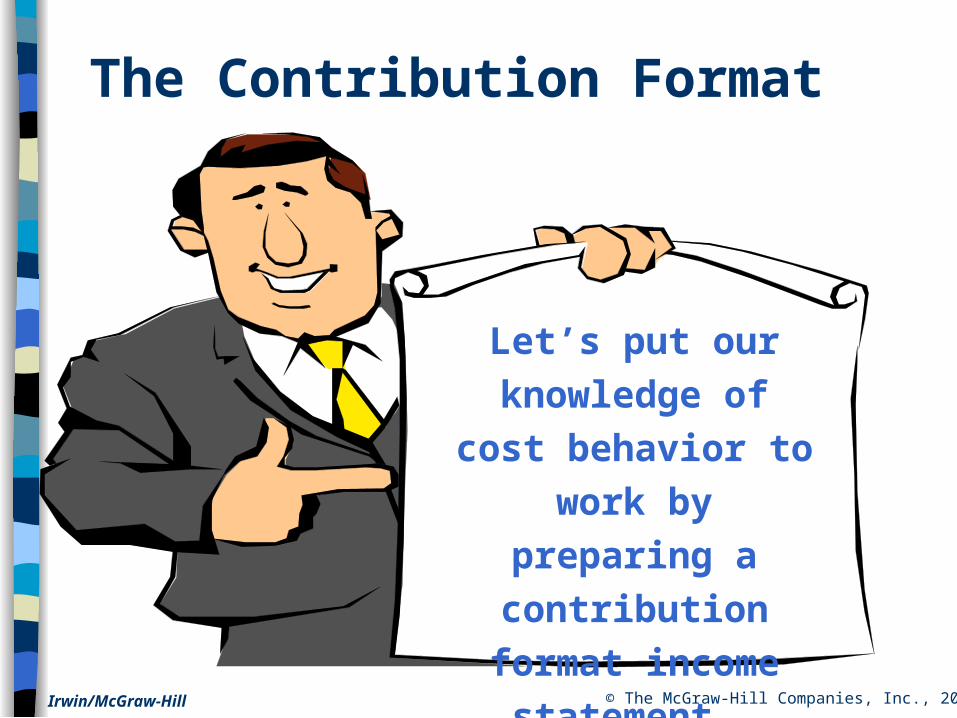
Let’s put our
knowledge of cost
behavior to work by
preparing a
contribution format
income statement.
The Contribution Format
© The McGraw-Hill Companies, Inc., 2000Irwin/McGraw-Hill
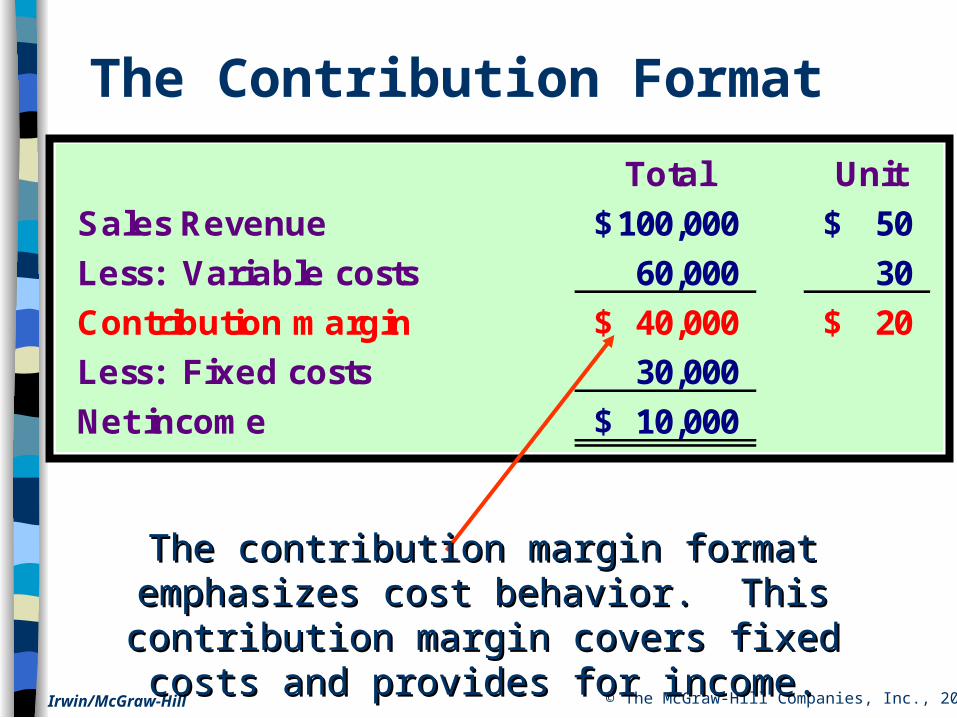
The Contribution Format
Total Unit
Sales Revenue 100,000$ 50$
Less: Variable costs 60,000 30
Contribution margin 40,000$ 20$
Less: Fixed costs 30,000
Net income 10,000$
The contribution margin format emphasizes cost The contribution margin format emphasizes cost behavior. This contribution margin covers fixed behavior. This contribution margin covers fixed
costs and provides for income.costs and provides for income.