Embed Size (px)
Citation preview

Cost Behavior Analysis
Chapter 3

I Made R. Natawidnyana, Ak., CPMACost Accounting – Third Sesion
Summary of Variable and Fixed Cost Behavior
Cost In Total Per Unit
Variable Total variable cost is Variable cost per unit remainsproportional to the activity the same over wide ranges
level within the relevant range. of activity.
Fixed Total fixed cost remains the Fixed cost per unit goessame even when the activity down as activity level goes up.
level changes within therelevant range.
Recall the summary of our cost behavior discussion from Chapter 2.
Types of Cost Behavior Patterns

I Made R. Natawidnyana, Ak., CPMACost Accounting – Third Sesion
The Activity Base
A measure of the event that causes the incurrence of a
variable cost – a cost driver
A measure of the event that causes the incurrence of a
variable cost – a cost driver
Unitsproduced
Unitsproduced
Miles driven
Miles driven
Labor hours
Labor hours
Machine hours
Machine hours

I Made R. Natawidnyana, Ak., CPMACost Accounting – Third Sesion
Minutes Talked
To
tal L
on
g D
ista
nce
Tel
eph
on
e B
ill
True Variable Cost Example
Your total long distance telephone bill is based on how many minutes you talk.

I Made R. Natawidnyana, Ak., CPMACost Accounting – Third Sesion
Minutes Talked
Per
Min
ute
Tel
eph
on
e C
har
ge
Variable Cost Per Unit Example
The cost per minute talked is constant. For example, 10 cents per minute.

I Made R. Natawidnyana, Ak., CPMACost Accounting – Third Sesion
Step-Variable Costs
Activity
Co
st
Total cost remainsconstant within anarrow range of
activity.
Total cost remainsconstant within anarrow range of
activity.
I Made R. Natawidnyana, Ak., CPMACost Accounting – Third Sesion
Step-Variable Costs
Activity
Co
st
Total cost increases to a new higher cost for the
next higher range of activity.
Total cost increases to a new higher cost for the
next higher range of activity.

I Made R. Natawidnyana, Ak., CPMACost Accounting – Third Sesion
RelevantRange
A straight line closely
approximates a curvilinear
variable cost line within the
relevant range.
A straight line closely
approximates a curvilinear
variable cost line within the
relevant range.
Activity
To
tal
Co
st
Economist’sCurvilinear Cost
Function
The Linearity Assumption and the Relevant Range
Accountant’s Straight-Line Approximation (constant
unit variable cost)

I Made R. Natawidnyana, Ak., CPMACost Accounting – Third Sesion
Number of Local Calls
Mo
nth
ly B
asic
T
elep
ho
ne
Bill
Total Fixed Cost Example
Your monthly basic telephone bill is probably fixed and does not change when
you make more local calls.

I Made R. Natawidnyana, Ak., CPMACost Accounting – Third Sesion
Number of Local Calls
Mo
nth
ly B
asic
Tel
eph
on
e B
ill p
er L
oca
l Cal
l
Fixed Cost Per Unit Example
The fixed cost per local call decreases as more local calls are made.

I Made R. Natawidnyana, Ak., CPMACost Accounting – Third Sesion
Cost Behavior
MerchandisersCost of Goods Sold
MerchandisersCost of Goods Sold
ManufacturersDirect Material, Direct Labor, and Variable
Manufacturing Overhead
ManufacturersDirect Material, Direct Labor, and Variable
Manufacturing Overhead
Merchandisers and Manufacturers
Sales commissions and shipping costs
Merchandisers and Manufacturers
Sales commissions and shipping costs
Service Organizations Supplies and travel
Service Organizations Supplies and travel
Examples of normally variable costsExamples of normally variable costs
Examples of normally fixed costsExamples of normally fixed costs
Merchandisers, manufacturers, and service organizations
PBB taxes, Insurance, Sales salariesDepreciation, Advertising
Merchandisers, manufacturers, and service organizations
PBB taxes, Insurance, Sales salariesDepreciation, Advertising

I Made R. Natawidnyana, Ak., CPMACost Accounting – Third Sesion
ExamplesAdvertising and Research and Development
ExamplesAdvertising and Research and Development
ExamplesDepreciation on Buildings and
Equipment
ExamplesDepreciation on Buildings and
Equipment
Types of Fixed Costs
DiscretionaryMay be altered in the short-term by current managerial decisions
DiscretionaryMay be altered in the short-term by current managerial decisions
CommittedLong-term, cannot be reduced in the short
term.
CommittedLong-term, cannot be reduced in the short
term.

I Made R. Natawidnyana, Ak., CPMACost Accounting – Third Sesion
Example: Office space is available at a rental
rate of $30,000 per year in increments of 1,000
square feet. As the business grows more
space is rented, increasing the total
cost.
Fixed Costs and Relevant Range
Continue

I Made R. Natawidnyana, Ak., CPMACost Accounting – Third Sesion
Ren
t C
ost
in
T
ho
usa
nd
s o
f D
oll
ars
0 1,000 2,000 3,000 Rented Area (Square Feet)
0
30
60
Fixed Costs and Relevant Range
90
Relevant
Range
Total cost doesn’t change for a wide range of activity,
and then jumps to a new higher cost for
the next higher range of activity.
Total cost doesn’t change for a wide range of activity,
and then jumps to a new higher cost for
the next higher range of activity.

I Made R. Natawidnyana, Ak., CPMACost Accounting – Third Sesion
How does this type of fixed cost differ
from a step-variable cost?
Step-variable costs can be adjusted more
quickly and . . .
The width of the activity steps is much
wider for the fixed cost.
Fixed Costs and Relevant Range

I Made R. Natawidnyana, Ak., CPMACost Accounting – Third Sesion
Fixed Monthly
Utility Charge
Variable
Cost per KW
Activity (Kilowatt Hours)
To
tal U
tilit
y C
ost
X
Y
A semivariable cost has both fixed and variablecomponents. Consider the example of utility cost.
A semivariable cost has both fixed and variablecomponents. Consider the example of utility cost.
Semivariable Costs
Total semivariable cost

I Made R. Natawidnyana, Ak., CPMACost Accounting – Third Sesion
Fixed Monthly
Utility Charge
Variable
Cost per KW
Activity (Kilowatt Hours)
To
tal
Uti
lity
Co
st
X
Y
Semivariable Costs
Total semivariable cost Y = a + bX
I Made R. Natawidnyana, Ak., CPMACost Accounting – Third Sesion
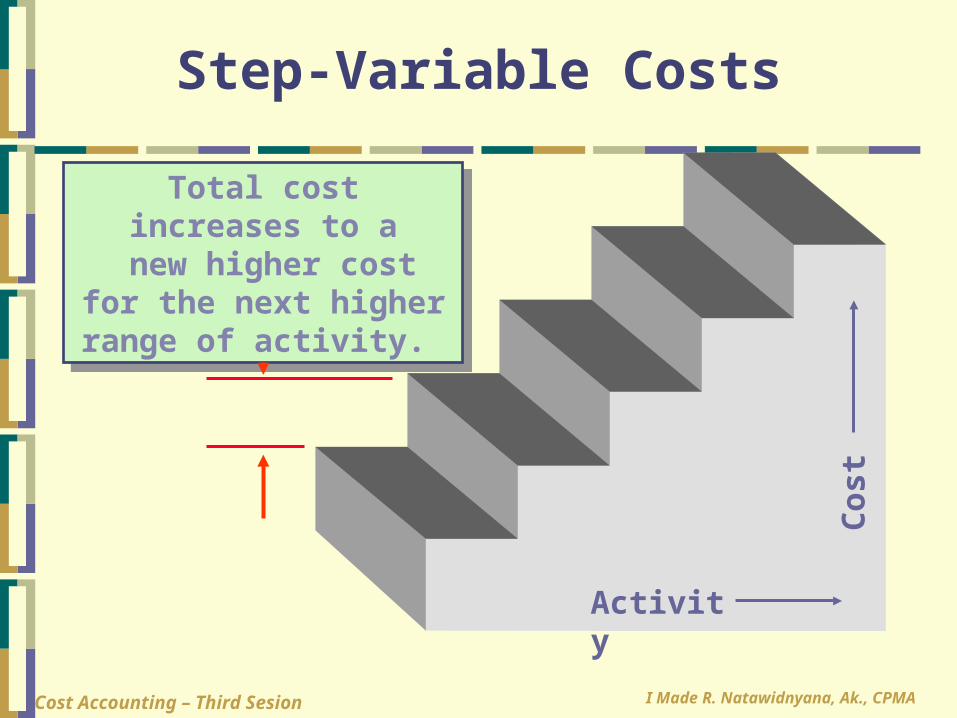
The Analysis of Semivariable Costs
1. High-Low Method
3. Least-Square Regression Method
2. Scattergraph Method
I Made R. Natawidnyana, Ak., CPMACost Accounting – Third Sesion
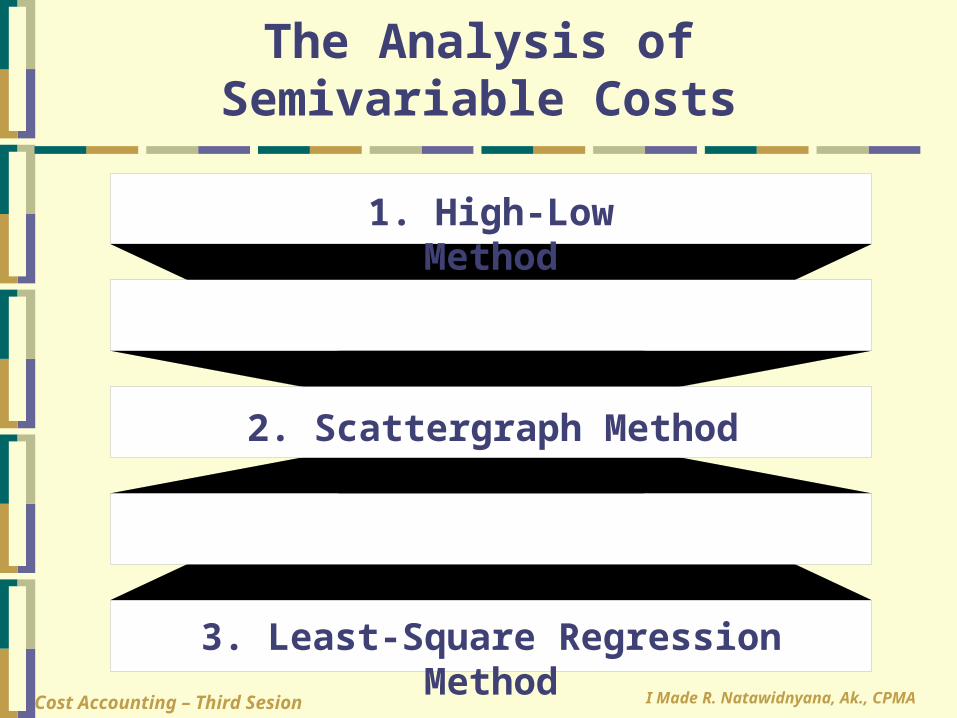
Plot the data points on a graph (total cost vs. activity).
Plot the data points on a graph (total cost vs. activity).
0 1 2 3 4
*
To
tal
Co
st i
n1,
000’
s o
f D
oll
ars
10
20
0
***
**
**
*
*
Activity, 1,000’s of Units Produced
X
Y
The Scattergraph Method

I Made R. Natawidnyana, Ak., CPMACost Accounting – Third Sesion
0 1 2 3 4
*
To
tal
Co
st i
n1,
000’
s o
f D
oll
ars
10
20
0
***
**
**
*
*
Activity, 1,000’s of Units Produced
X
Y
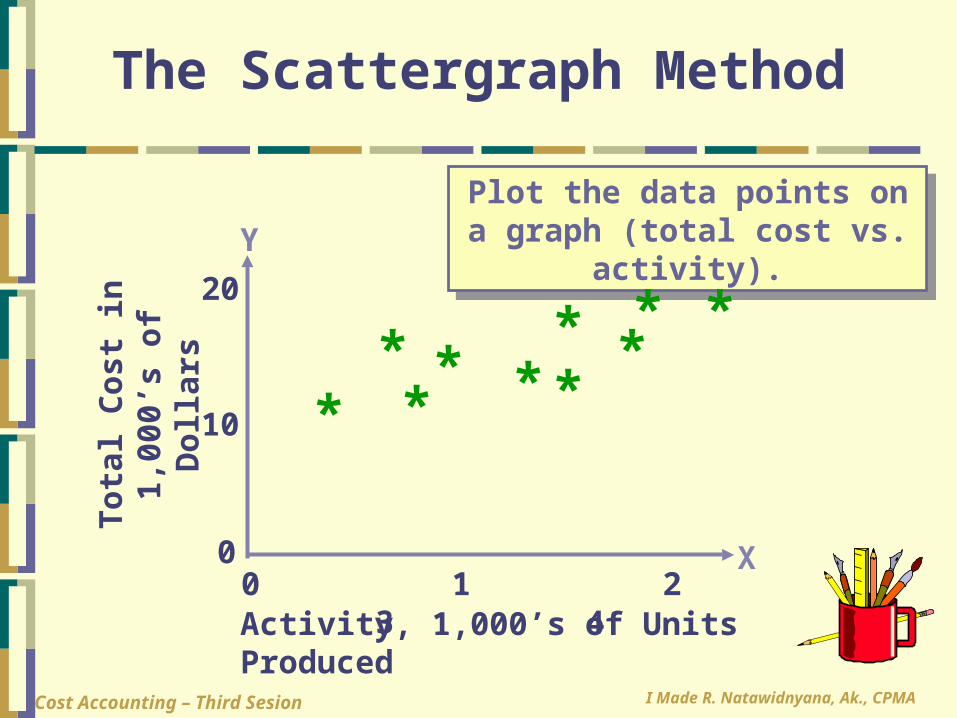
The Scattergraph Method (2)
Intercept is the estimated fixed cost (a) = $10,000
Intercept is the estimated fixed cost (a) = $10,000
Draw a line through the data points with about anequal numbers of points above and below the line.
Draw a line through the data points with about anequal numbers of points above and below the line.

I Made R. Natawidnyana, Ak., CPMACost Accounting – Third Sesion
0 1 2 3 4
*
To
tal
Co
st i
n1,
000’
s o
f D
oll
ars
10
20
0
***
**
**
*
*
Activity, 1,000’s of Units Produced
X
Y
The Scattergraph Method (3)The slope is the estimated variable cost per unit.
Slope = Change in cost ÷ Change in units
The slope is the estimated variable cost per unit.
Slope = Change in cost ÷ Change in units
Vertical distance is the change in cost.
Vertical distance is the change in cost.
Horizontal distance is
the change in activity.
Horizontal distance is
the change in activity.

I Made R. Natawidnyana, Ak., CPMACost Accounting – Third Sesion
WiseCo recorded the following production activity and maintenance costs for two months:
Using these two levels of activity, compute: the variable cost per unit; the fixed cost; and then express the costs in equation form Y = a + bX.
The High-Low Method

I Made R. Natawidnyana, Ak., CPMACost Accounting – Third Sesion
Changein costChange in units
The High-Low Method
Variable cost per unit = Change in cost ÷ change in units

I Made R. Natawidnyana, Ak., CPMACost Accounting – Third Sesion
The High-Low Method
Variable cost per unit = $2,400 ÷ 3,000 units
= $0.80 per unit

I Made R. Natawidnyana, Ak., CPMACost Accounting – Third Sesion
The High-Low Method
Variable cost = $2,400 ÷ 3,000 units = $0.80 per unit Fixed cost = Total cost – Total variable cost
Fixed cost = $9,800 – ($0.80 per unit × 8,000 units)
Fixed cost = $9,800 – $6,400 = $3,400

I Made R. Natawidnyana, Ak., CPMACost Accounting – Third Sesion
Variable cost = $2,400 ÷ 3,000 units = $0.80 per unit Fixed cost = Total cost – Total variable cost
Fixed cost = $9,800 – ($0.80 per unit × 8,000 units)
Fixed cost = $9,800 – $6,400 = $3,400 Total cost = Fixed cost + Variable cost (Y = a + bX) Y = $3,400 + $0.80X
The High-Low Method

I Made R. Natawidnyana, Ak., CPMACost Accounting – Third Sesion
Software can be used to fit a regression line through the data points.
The cost analysis objective is the same: Y = a + bx
Least-Squares Regression Method
Least-squares regression also provides a statistic,
called the R2, that is a measure of the goodness
of fit of the regression line to the data points.
Least-squares regression also provides a statistic,
called the R2, that is a measure of the goodness
of fit of the regression line to the data points.
I Made R. Natawidnyana, Ak., CPMACost Accounting – Third Sesion
0 1 2 3 4
To
tal
Co
st
10
20
0
Activity
****
**
****
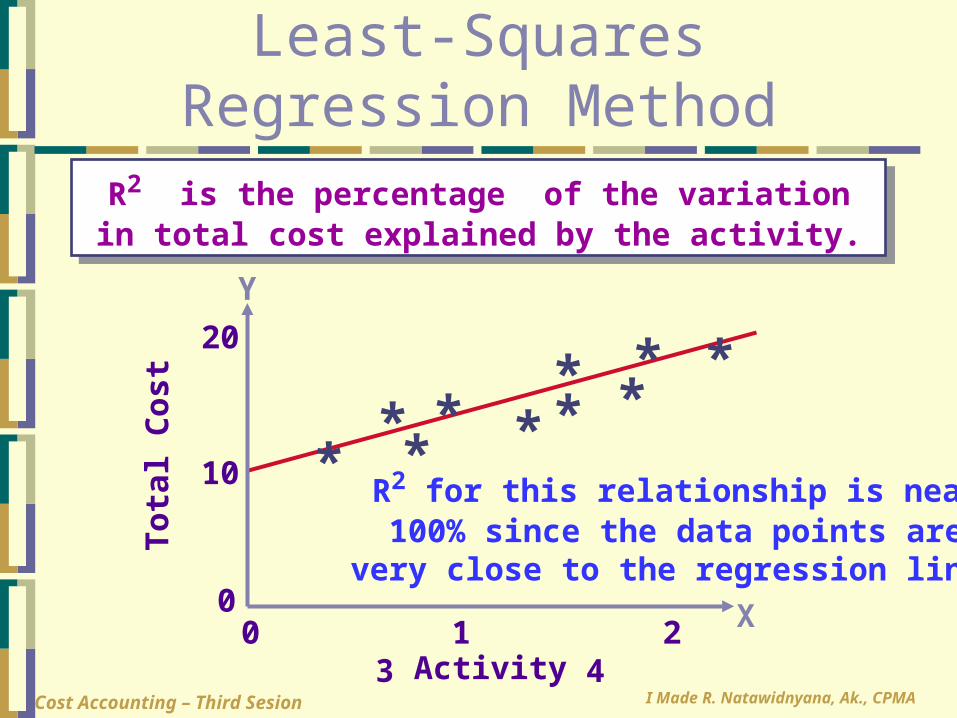
Least-Squares Regression Method
R2 is the percentage of the variation in total cost explained by the activity.
R2 is the percentage of the variation in total cost explained by the activity.
R2 for this relationship is near100% since the data points are
very close to the regression line.
X
Y

I Made R. Natawidnyana, Ak., CPMACost Accounting – Third Sesion
Cost Estimation MethodsRegression Analysis
A statistical method used to create an equation relating independent (or X)
variables to dependent (or Y) variables.
Past data is used to estimate relationships between costs and activities.
A statistical method used to create an equation relating independent (or X)
variables to dependent (or Y) variables.
Past data is used to estimate relationships between costs and activities.
Dependent variables are caused by the
independent variables.
Dependent variables are caused by the
independent variables.
Independent variables are the cost drivers that are correlated with the dependent variables.
Independent variables are the cost drivers that are correlated with the dependent variables.

I Made R. Natawidnyana, Ak., CPMACost Accounting – Third Sesion
Caution: Before doing the analysis, take time
to determine if a logical relationship
between the variables exists.
Caution: Before doing the analysis, take time
to determine if a logical relationship
between the variables exists.
Cost Estimation MethodsRegression Analysis
The simple cost model is actually a regression model:
TC = F + VX
The simple cost model is actually a regression model:
TC = F + VX
This model will only be useful within a relevant range of
activity.
This model will only be useful within a relevant range of
activity.

I Made R. Natawidnyana, Ak., CPMACost Accounting – Third Sesion
Cost Estimation MethodsRegression Analysis
A set of data can be regressed using several techniques:
•Manual computations•SPSS or SAS Statistical Software
•Excel or other spreadsheet
A set of data can be regressed using several techniques:
•Manual computations•SPSS or SAS Statistical Software
•Excel or other spreadsheet
The result of the regression process is a
regression model:
TC = F + VX
The result of the regression process is a
regression model:
TC = F + VX
Each regression model has an R-square (R2)
measure of how good the model is.
Range of R2 = 0 to 1.0
Each regression model has an R-square (R2)
measure of how good the model is.
Range of R2 = 0 to 1.0

I Made R. Natawidnyana, Ak., CPMACost Accounting – Third Sesion
Simple Regression AnalysisExample
Fasco wants to know its average
fixed cost and variable cost per
unit.
Using the data to the right, let’s see
how to do a regression using
Excel.
Fasco wants to know its average
fixed cost and variable cost per
unit.
Using the data to the right, let’s see
how to do a regression using
Excel.

I Made R. Natawidnyana, Ak., CPMACost Accounting – Third Sesion
Simple Regression AnalysisExample
You will need three pieces of information from your
regression analysis:
1. Estimated Variable Cost per Unit (line slope)
2. Estimated Fixed Costs (line intercept)
3. Goodness of fit, or R2
You will need three pieces of information from your
regression analysis:
1. Estimated Variable Cost per Unit (line slope)
2. Estimated Fixed Costs (line intercept)
3. Goodness of fit, or R2
To get these three pieces of information we will need to use THREE
different excel functions.
LINEST, INTERCEPT, & RSQ
To get these three pieces of information we will need to use THREE
different excel functions.
LINEST, INTERCEPT, & RSQ

I Made R. Natawidnyana, Ak., CPMACost Accounting – Third Sesion
Let’s put our knowledge of cost
behavior to work by preparing a
contribution format income statement.

I Made R. Natawidnyana, Ak., CPMACost Accounting – Third Sesion
The Contribution Format
Total Unit
Sales Revenue 100,000$ 50$
Less: Variable costs 60,000 30
Contribution margin 40,000$ 20$
Less: Fixed costs 30,000
Net operating income 10,000$
The contribution margin format emphasizes cost behavior. Contribution margin covers fixed costs
and provides for income.

I Made R. Natawidnyana, Ak., CPMACost Accounting – Third Sesion
The Contribution Format
Used primarily forexternal reporting.
Used primarily bymanagement.

I Made R. Natawidnyana, Ak., CPMACost Accounting – Third Sesion
End of Session 3