Embed Size (px)
Citation preview

Cost-Benefit Analysis
FARMER DISTRESS Analysis of interventions addressing farmer distress in Andhra Pradesh
AUTHORS: Dr. Nilanjan BanikProfessor of Economics School of Management Bennett University, Greater Noida
SECTOR EXPERT REVIEWERS:
Dr GangaiahMember Secretary, AP State Planning Board

© 2018 Copenhagen Consensus Center [email protected] www.copenhagenconsensus.com This work has been produced as a part of the Andhra Pradesh Priorities project under the larger, India Consensus project. This project is undertaken in partnership with Tata Trusts.
Some rights reserved
This work is available under the Creative Commons Attribution 4.0 International license (CC BY 4.0). Under the Creative Commons Attribution license, you are free to copy, distribute, transmit, and adapt this work, including for commercial purposes, under the following conditions:
Attribution Please cite the work as follows: #AUTHOR NAME#, #PAPER TITLE#, Andhra Pradesh Priorities, Copenhagen Consensus Center, 2017. License: Creative Commons Attribution CC BY 4.0.
Third-party-content Copenhagen Consensus Center does not necessarily own each component of the content contained within the work. If you wish to re-use a component of the work, it is your responsibility to determine whether permission is needed for that re-use and to obtain permission from the copyright owner. Examples of components can include, but are not limited to, tables, figures, or images.
Analysis of interventions addressing farmer distress in Andhra Pradesh
Andhra Pradesh Priorities
An India Consensus Prioritization Project
Nilanjan Banik1
Professor of Economics, School of Management
Bennett University, Greater Noida.
1 The author would like to thank Brad Wong and Amar Chanchal for their useful comments and suggestions on earlier versions of this draft. Thank you also to two anonymous reviewers and Swapnil Marothi for their comments. All remaining errors are my own.
Working paper as of 28th March, 2018

ABSTRACT ........................................................................................................................................................ 1
THE PROBLEM ........................................................................................................................................................ 1
INTERVENTION 1: FARM LOAN WAIVERS ..................................................................................................................... 2
OVERVIEW ............................................................................................................................................................. 2
COSTS AND BENEFITS ............................................................................................................................................... 3
Costs ............................................................................................................................................................... 3
Benefits .......................................................................................................................................................... 3
INTERVENTION 2: MANAGING COLD SUPPLY CHAIN LOGISTICS .......................................................................................... 4
OVERVIEW ............................................................................................................................................................. 4
COSTS AND BENEFITS ............................................................................................................................................... 4
Costs ............................................................................................................................................................... 4
Benefits .......................................................................................................................................................... 5
INTERVENTION 3: LOCAL FOOD PROCESSING UNITS ....................................................................................................... 5
OVERVIEW ............................................................................................................................................................. 5
COSTS AND BENEFITS ............................................................................................................................................... 6
CONCLUSION .......................................................................................................................................................... 6
INTRODUCTION ............................................................................................................................................... 8
INTERVENTION 1: FARM LOAN WAIVER ......................................................................................................... 11
COSTS AND BENEFITS OF FARM LOAN WAIVER SCHEME ................................................................................................ 11
Costs ............................................................................................................................................................. 11
ANALYSIS OF THE LOAN WAIVER INTERVENTION ........................................................................................................... 14
Data ............................................................................................................................................................. 14
Method......................................................................................................................................................... 15
Estimating the cost of the bailout ............................................................................................................................. 15
Estimating the post-bailout distribution of formal credit ......................................................................................... 15
Estimating the post-bailout effects of redistribution ................................................................................................ 17
THE EFFECT OF CREDIT CONTRACTION ON SMALL AND MARGINAL FARMERS ....................................................................... 17
THE EFFECT OF CREDIT EXPANSION ON FARMERS WITH LARGER LAND HOLDINGS ................................................................. 18
COST BENEFIT ANALYSIS .......................................................................................................................................... 18
INTERVENTION 2: BUILDING MORE STORAGE FACILITIES ............................................................................... 20
COSTS AND BENEFIT ANALYSIS ................................................................................................................................. 23
Data ............................................................................................................................................................. 23
Method......................................................................................................................................................... 24
INTERVENTION 3: IMPACT OF HAVING LOCAL FOOD PROCESSING UNITS ...................................................... 27
CASE STUDY 2: ECONOMICS OF PADDY PROCESSING .................................................................................................... 31

CONCLUSION ................................................................................................................................................. 33
REFERENCES ................................................................................................................................................... 35

1
ABSTRACT
The Problem
During the fiscal year 2016-2017, the contribution of the agricultural and related sectors was 14% of
Gross Domestic Product (GDP), even though 58% of the population are dependent on the sectors for
their livelihood. India has around 260 million people living in poverty and 80% of them live in the
countryside. The median annual wage for a farmer in India is INR 18,850 (including the implied value
of the food they consume). This is equivalent to two months’ minimum wage in Mumbai – the
commercial capital of India. It is therefore unsurprising that there was a spike in farmer protests
during 2017-18 in various parts of the country.
There is wide recognition that the agricultural sector in India is in a state of distress. There are several
factors which have contributed to this distress. Agriculture is characterized by instability due to a
variety of risks associated with production, prices and markets. An additional factor which aggravates
the situation, is that about 72% of land holdings are small and marginal (less than 2 hectares) and
farmers cannot reap benefits from economies of scale.1 Since 1960, the real agriculture growth rate in
India has been an average of 2.8 percent. Before the Green Revolution the average growth rate was
less than 2 percent; the period following the Green Revolution, until 2004, witnessed agriculture
growth of 3 percent; in the subsequent years after the global agriculture commodity surge, growth in
the sector increased to 3.6 percent.2 The volatility in agriculture continues, although it has declined
substantially from a standard deviation of 6.3 percent between 1960 and 2004, to 2.9 percent since
2004.3 Furthermore, approximately 52% (73.2 million hectares out of 141.4 million hectares) of the
net sown area is still rainfed and not yet irrigated.4 The most striking impact of such levels of distress
on Indian farmers is the increasing number of farmer suicides. Between 1995 and 2012, a total of
28,4673 farmers committed suicide in India.
It is in this context that it becomes important to research the reasons for the unviability of small and
marginal farmers in India and the reasons for farmer suicides. Some of the common factors cited are
crop failures, low farm productivity, an inability to achieve market prices, inefficient cold chain
management resulting in wastage of agricultural produce from inadequate storage, lack of irrigation
1http://www.thehindu.com/news/national/why-are-farmers-distressed-across-india/article22267501.ece
2Economic Survey 2017-18, Department of Economic Affairs, Ministry of Finance, Government of India.
3ibid
4http://www.thehindu.com/opinion/op-ed/stemming-the-tide-of-agrarian-distress/article22859916.ece

2
facilities, and insurmountable debt. However, the increasing numbers of farmer protests and suicides
call for reconsideration of the policy interventions in the agricultural sector. There have been various
initiatives undertaken by the Government, including – farm loan waiver schemes, higher minimum
support price (MSP), reforms in the Agriculture Produce Market Committee (APMC) Act so that
farmers can sell directly to end users, fertilizer subsidies, tax free agricultural income, and spending
on rural infrastructure such as electrification and building canals. While each one of these
interventions is expected to yield some benefits to the farmers, there are costs involved in
undertaking them. Budgetary allocation of Union and State Governments are an indication of the
priorities of Government. Knowing that financial resources are limited and judiciously allocating
money amongst various sectors and inter-sector prioritizing the initiatives is the need of the hour.
This paper focuses on the reasons for farmer distress in the state of Andhra Pradesh (AP), and
evaluates several interventions which claim to alleviate the distress. The three interventions which
this paper analyzes are: farm loan waivers, expanding end-to-end cold chain infrastructure, and
setting-up more food processing units.
Intervention 1: Farm Loan Waivers
Overview
This intervention assumes a hypothetical farmer loan waiver scheme that waives all formal sector
loans of individuals with land holding sizes less than 2ha. This intervention is similar to relief schemes
implemented or announced across India in the past, for example:
a) The 2008 Agricultural Debt Waiver and Debt Relief Scheme - INR 600 billion (approximately
$12 billion) loan waiver package for 30 million small and marginal farmers and a one-time
settlement for another 10 million farmers. The amount of loans waived was equivalent to 1%
of India's GDP in 2007-08.
b) Large-scale farm debt waivers enacted during 2017 by three major states – Uttar Pradesh,
Maharashtra and Punjab. The total amount of debt relief announced by these three states
amount to INR 77,000 crore (approximately $12 billion) or 0.5% of India's GDP in 2016-17.
c) A loan waiver scheme of INR 24000 crore, announced by the State Government of Andhra
Pradesh5.
5 http://www.thehindu.com/todays-paper/tp-national/tp-andhrapradesh/third-tranche-of-farm-loan-waiver-
released/article19832020.ece
3
It is important to note that the loan waiver scheme analysed in this paper is most similar to the 2008
Agricultural Debt Waiver and Debt Relief Scheme, since the effects of that scheme have been well
studied by academia. Nevertheless it is likely that schemes with slightly different parameters will have
similar effects, benefits and costs.
Costs and Benefits
Costs
The most significant cost is the loan waiver itself. Using latest data on farm size and formal debt
holdings by size, we estimate a cost of 23300 crore for the loan waiver.
The reduction in formal loans available to small and marginal farmers results in a drop in production.
The small and marginal farmers lose INR 803 crore annually.
The anticipation of a loan waiver causes smallholder farmers to reduce their credit discipline, and
academic evidence (Gine and Kanz, 2017) suggests that bailouts lead to an increase in non-performing
loans and greater sensitivity of defaults to the electoral cycle. The welfare impact of this moral hazard
is not straightforward to calculate, and is probably partially reflected in the credit restriction
experienced by small and marginal farmers after a bailout. Any additional costs, for example to the
wider credit environment, are not included in the calculations and this suggests the benefit-cost ratio
would be even smaller than the one reported.
Benefits
There is an immediate, one-time benefit to small and marginal farmers. They will not have to pay back
outstanding loans (principal plus interest amount) which they owe to the banks. This value is INR
23300 crore, exactly equivalent to the cost of the loan waiver.
In the medium-run, large farmers (those with more than 2ha) experience an expansion of available
formal credit. This allows them to pay down informal credit and increase production. It may also
increase the efficiency of credit allocated in the state, since fewer funds are given to riskier small
Academic evidence regarding the effects of the 2008 Agricultural Debt Waiver and Debt Relief
Scheme shows a reduction in lending to small farmers for up to four years after bailout (Gine and
Kanz, 2017). In AP the estimated impact on livelihoods following the farm loan waiver and subsequent
reduced lending, is a loss of INR 815 per year for marginal farmers (< 1ha) and INR 2483 per year for
small farmers (1-2ha).

4
holder farmers and a higher proportion of funds are allocated to larger farm households. Estimates
suggest that farmers with larger land holdings will gain INR 733 crore, annually.
Intervention 2: Managing cold supply chain logistics
Overview
This intervention assumes the cold chain infrastructure requirements as estimated by The National
Centre for Cold Chain Development (NCCD) are built within the state of AP, as well as all supporting
requirements like manpower, maintenance and transportation. The intervention time horizon is 10
years.
Fruits, vegetables, and milk command a higher market price in comparison to staple crops such as
rice, wheat and pulses. One thing that differentiates fruits, vegetables, and milk from staple crops is
that they are perishable by nature, and without proper storage and refrigeration wastage is high.
Milk and horticulture items command a high price in international markets and are in demand by
corporate buyers in the food processing industry. However, the majority of small farmers do not risk
growing these crops, partly because of inadequate post-harvest management.
The absence of cold chain, an environment-controlled logistics chain that preserves the essential
characteristics of the products handled, leads to several challenges for farmers and the agricultural
sector in general. First, it leads to wastage of fruits, vegetables, and milk. Second, as there is no
mechanism for farmers to store their produce until they can optimise the price they obtain on the
market, farmers will often resort to quick selling of the products. This reduces their potential earnings
and affects their livelihoods. Finally, the absence of cold chain, discourages farmers from further
growing these higher value commodities.
Costs and Benefits
Costs
The National Centre for Cold Chain Development (NCCD) has estimated the cold storage and
warehouse related infrastructure requirements for India, including AP. Based on NCCD data and our
analysis, the current total storage requirement for storing milk, fruits and vegetables stands at
744650 MT. The total number of pack houses required is 4382. The total number of ripening
chambers required is 5708. The total number of specialised trucks required for transporting fruits,
vegetables and milk is 1312. About 90% of the storage requirement already exists within the state,
but the remaining infrastructure needs are almost non-existent. To fill this gap requires a one-off

5
investment of INR 2686 crore, plus additional investments over the following 9 years averaging
approximately 20% of this value per year to meet expected growth in the horticulture and dairy
sectors.
Additionally, at the outset an additional 1261 employees would be required to run the storage
facilities, 9567 employees to run pack houses and ripening chambers, and 3418 workers (including
drivers and helpers) to operate the trucks. This requirement increases over the years to meet growth.
The average annual workforce costs is INR 146 crore over the 10 years. Lastly, we include operations
and maintenance cost of 10% of invested capital which averages INR 518 crore per year.
Benefits
The benefit from a better post-harvest management is that fruits, vegetable items, and milk will not
be wasted. Loss in vegetables and fruit items because of lack of storage has been estimated at
between 5% to 30%.
For milk, data shows the amount of loss can be as high 40% and two-thirds of this loss happens during
storage.
In the first year of this intervention, the total benefit from putting cold chain logistics in place is
estimated at INR 997,854 lakh. The value of milk that can be saved by using cold storage represents
48% of the total benefit, and the value of fruits and vegetables that can be saved is 52% of the total
benefit. The annual benefit increases by 6-7% per year in line with the expected rate of growth in the
horticulture and dairy sectors.
In India, 83% of the farmers are small and marginal farmers. The majority of these farmers cultivate
mainly low value, subsistence crops. This intervention will have implications particularly on the
livelihoods of small and marginal farmers who would then be able to undertake the cultivation of
high return crops which are in demand in global markets. Overall, the implications are that there
would be an increase in agricultural productivity and it could liberate small and marginal farmers from
a cycle of poverty and distress. The option value of this benefit is not included in the calculations,
though we note that to take advantage of the option to grow higher value produce, would itself
require more costs at the farm-level.
Intervention 3: Local Food Processing Units
Overview
x The third intervention is about expanding local, small-scale food-processing units in Andhra
Pradesh. AP has bountiful production when it comes to agriculture and livestock. The state ranks

6
second in India in production of paddy, ground nut and maize. It is one of the leading states in
horticulture produce, having nearly 2 million hectare with different types of fruit crops. AP ranks
first in India in the production of Mango, Papaya, Lemon, Chili, Turmeric, and Tomato. The state
ranks first in terms of egg production and has a strong presence in terms of meat and milk
products.
x The analysis for this intervention is based on the results of two case studies from the neighboring
states of Karnataka and Tamil Nadu. Since the two states are proximate to AP it is assumed they
will have a similar cost structure and access to technology when it comes to setting up food
processing units.
x In reality, the size and type of food processing unit should be tailored to reflect the local
conditions and food availability, and we note this analysis only aims to identify the ballpark
benefit-cost ratio of a typical food processing unit.
Costs and Benefits
x The benefits refer to additional incremental revenue food processing units. The costs are
incurred in setting up the food processing units, and the cost of actual processing such as
labour and food.
x The two studies from India indicate that the rice processing has a benefit cost ratio around 1.
Turmeric processing has a benefit cost ratio around 4.
x International experience from food processing units in other developing countries suggests
similar benefit-cost ratios.
Conclusion
The results from analysis indicate that, for intervention 1, the farm loan waiver scheme, the economic
cost is higher than the benefit. If the objective of the loan waiver is to help the smallest farmers, then
the farm loan waiver scheme does not fulfil that objective. This is because only 15% of the smallest
farmers have access to institutional credit (formal credit), and loan waiver necessarily caters to
farmers who have been able to access formal loans. Even for those with 2.0 ha or less, roughly 50% of
them access formal credit. Moreover, studies have shown that the long-term impact of loan waiver
programmes results in a fall in agricultural output and a reduction in the availability of formal loans to
small and marginal farmers subsequent to the loan bailout. Also, it is a significant cost to the national
exchequer, resulting in a higher fiscal deficit or curtailing of other development programs.

7
Regarding the second intervention, building more cold storage facilities and investing in reefer
vehicles, the analysis shows that it is a beneficial intervention. Investing in cold chain infrastructure
with the aim of improving post-harvest management results in socio-economic benefits that far
outweigh the economic costs. Improper post-harvest management not only leads to huge wastage of
crops, but also discourages small and marginal farmers from growing these high-value items. These
items are in high demand in international markets and by the corporations with a large presence in
the food processing industry. However, small farmers often do not want to venture into growing
these perishable items as the lack of cold chain management either leads to crops being wasted, or
degraded to a standard which is not internationally accepted.
Intervention 3 is about local food processing units. As mentioned in the section above, the state of
Andhra Pradesh performs well when it comes to the production of agricultural, livestock and
horticultural crops. This intervention further seeks to add value to the primary product and derive
benefits from the same. Based on our literature survey we find, in general, that the benefit-cost ratio
from setting up local food processing units lay between 1 and 4.
Summary of costs and benefits of interventions. Note all benefits and costs assume 5%
discount rate
Intervention BCR Benefit (INR crore)
Costs (INR crore)
Time Horizon of analysis
Quality of Evidence
Farm Loan Waiver 0.99 24,629 24,860 5 years Strong Cold chain infrastructure
8.8 101,451 11,482
10 years Medium
Local food processing units
Approximate range of 1-4
Depends on local conditions and type of processing
Depends on local conditions and type of processing
1-3 years Medium

8
Introduction
During the fiscal year 2016-2017, the contribution of the agricultural and allied sectors was 14% of
Gross Domestic Product (GDP), despite 58% of the Indian population relying on this sector for
livelihood (Central Statistics Office, Government of India, 2016).6 Although there has been a steep
reduction in terms of its contribution to the GDP, still roughly half of the workforce depends on
agriculture as a source of livelihood.7 India has around 260 million people living in poverty and 80% of
them live in the countryside (World Bank, 2016). The median annual wage for a farmer in India is INR
18,850 (or $ 290)8 (including the implied value of the food they consume) which is equal to two
months’ minimum wage in Mumbai – the commercial capital of India (The Economist, 2016).
There is wide recognition that the agricultural sector in India is in a state of distress. There are several
factors which have contributed to this distress. Agriculture is characterized by instability due to a
variety of risks associated with production, prices and markets. An additional factor which aggravates
the situation, is that about 72% of land holdings are small and marginal (less than 2 hectares) and
farmers cannot reap benefits from economies of scale.9 Since 1960, the real agriculture growth rate in
India has been an average of 2.8 percent. Before the Green Revolution the average growth rate was
less than 2 percent; the period following the Green Revolution, until 2004, witnessed agriculture
growth of 3 percent; in the subsequent years after the global agriculture commodity surge, growth in
the sector increased to 3.6 percent.10 The volatility in agriculture continues, although it has declined
substantially from a standard deviation of 6.3 percent between 1960 and 2004, to 2.9 percent since
2004.11 Furthermore, approximately 52% (73.2 million hectares out of 141.4 million hectares) of the
net sown area is still rainfed and not yet irrigated.12 The most striking impact of such levels of distress
on Indian farmers is the increasing number of farmer suicides.
Between 1995 and 2012, a total of 28,4673 farmers committed suicides in India (Mishra, 2014).13
Reddy and Mishra (2010) argue that the liberalization of the agricultural sector in the early-1990s led
to an agrarian crisis, and consequently farmers with certain socioeconomic characteristics, such as
cash crops cultivators and small farmers with debts, are at risk of committing suicide. World Bank
6Year refers to the fiscal year, starting from April for any particular year and ending on March, next year.
7
http://niti.gov.in/writereaddata/files/document_publication/Raising%20Agricultural%20Productivity%20and%20Making%20Farming%20R
emunerative%20for%20Farmers.pdf
8Henceforth, for the dollar-indian rupee conversion rate we use INR 65 = $1.
9http://www.thehindu.com/news/national/why-are-farmers-distressed-across-india/article22267501.ece
10Economic Survey 2017-18, Department of Economic Affairs, Ministry of Finance, Government of India.
11ibid
12http://www.thehindu.com/opinion/op-ed/stemming-the-tide-of-agrarian-distress/article22859916.ece
13Between 1995 and 2012, farm suicides as a percent of all suicides in India was 14%.

9
data shows only 35% of India’s agricultural land is irrigated (artificial application of water to land or
soil).14 Banik and Stevens (2016) find that uncertain weather conditions, leading to volatile agricultural
output, is a primary cause of farmer suicides. According to Chand et al., (2015) growth in farm income
has fallen to around 1% and this is an important reason for the sudden rise in agrarian distress in
recent years. The study reported that in 2013 small farmers (with landholding size less than 1
hectare15) had a higher monthly consumption than their monthly income.16
Among all the states, Andhra Pradesh (AP, hereafter) has one of the highest rates of farmer suicide.
Between 2010 and 2012, there were 47 farm suicides per 100,000 population. The corresponding
figure for all India during the same period was 15 per 100,000 population (Mishra, 2014). Some of the
most common contributing factors are crop failures, low farm productivity, an inability to achieve
market price, inefficient cold chain management resulting in wastage of agricultural produce, lack of
irrigation facilities, and insurmountable debt.
Based on a study of 22 suicides cases in Anantapur district in AP, Kumar (2016) argues that while crop
failure is a significant factor, the role of other socio-cultural forces should not be discounted.
Anantapur district, historically an agriculturally backward region, has seen more “farmers’ suicides”
than other regions in AP - a State which along with Karnataka, Maharashtra and Gujarat have
recorded more suicides than elsewhere. For Anantapur district as a whole, farmers owning less than 5
acres account for over half the suicide cases, while those holding between 5 and 10 acres account for
another third. Kumar (2016) finds commercialisation of agriculture is leading to break-up of joint
families, tensions over sharing of roles within families, and a challenge to the authority of the family
patriarch in decision-making. The clash between the old and the young leads to wounded egos, more
so among men; as such, farmers’ suicide becomes as much an assertion of patriarchal honour. For
instance, although the head of the family opposes growing high risk crops such as citrus, the younger
generation are more aspirational and prone to risky decision making, and when crop output fails
because of volatile weather conditions, they may commit suicide.
However, the increasing number of farmer protests, as well as the high incidence of suicide, calls for a
closer look at the policy interventions in the agriculture sector. There have been various initiatives
14Available at: http://data.worldbank.org/indicator/AG.LND.IRIG.AG.ZS/countries. Accessed on 09/12/2017.
15A hectare is roughly equal to 2.47 acres.
16 National Sample Survey Organization (NSSO), Government of India, defines an agricultural household as a
household receiving some value of produce more than INR 3000 from agricultural activities (e.g. cultivation of
field crops, horticulture crops, fodder crops, plantation, animal husbandry, poultry, fishery, piggery, bee-
keeping, vermiculture, sericulture, etc.) and have atleast one member self-employed in agriculture in the
principle status during last 365 days.
10
undertaken by the Government in the agricultural sector, including farm loan waiver schemes, higher
minimum support price (MSP),17reforms in the Agriculture Produce Market Committee (APMC) Act so
that farmers can sell directly to the end users, fertilizer subsidies, tax free agricultural income, and
spending on rural infrastructure such as electrification and building canals. While each one of these
interventions is expected to yield some benefits to the farmers, there are costs involved in
undertaking them. All governments operate within budgetary constraints, and assessing which
policies for alleviating farm distress have the greatest benefit for the amount spent can help improve
policy making on this critical issue.
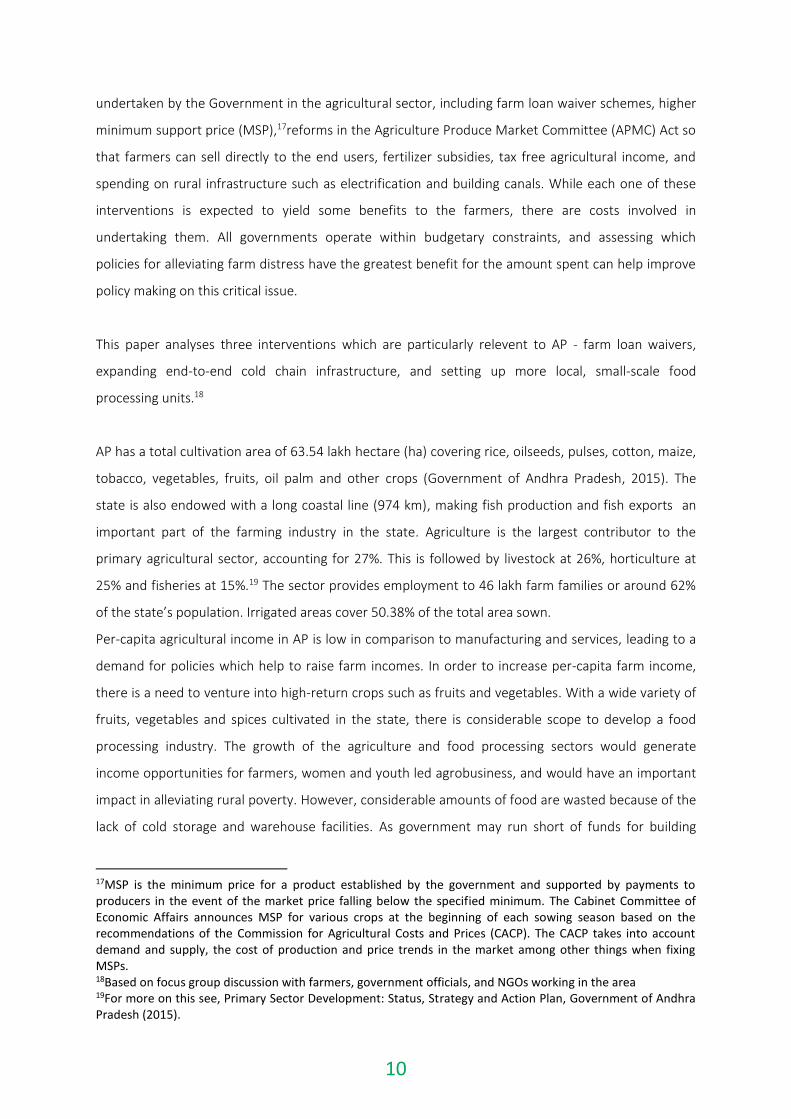
This paper analyses three interventions which are particularly relevent to AP - farm loan waivers,
expanding end-to-end cold chain infrastructure, and setting up more local, small-scale food
processing units.18
AP has a total cultivation area of 63.54 lakh hectare (ha) covering rice, oilseeds, pulses, cotton, maize,
tobacco, vegetables, fruits, oil palm and other crops (Government of Andhra Pradesh, 2015). The
state is also endowed with a long coastal line (974 km), making fish production and fish exports an
important part of the farming industry in the state. Agriculture is the largest contributor to the
primary agricultural sector, accounting for 27%. This is followed by livestock at 26%, horticulture at
25% and fisheries at 15%.19 The sector provides employment to 46 lakh farm families or around 62%
of the state’s population. Irrigated areas cover 50.38% of the total area sown.
Per-capita agricultural income in AP is low in comparison to manufacturing and services, leading to a
demand for policies which help to raise farm incomes. In order to increase per-capita farm income,
there is a need to venture into high-return crops such as fruits and vegetables. With a wide variety of
fruits, vegetables and spices cultivated in the state, there is considerable scope to develop a food
processing industry. The growth of the agriculture and food processing sectors would generate
income opportunities for farmers, women and youth led agrobusiness, and would have an important
impact in alleviating rural poverty. However, considerable amounts of food are wasted because of the
lack of cold storage and warehouse facilities. As government may run short of funds for building
17MSP is the minimum price for a product established by the government and supported by payments to
producers in the event of the market price falling below the specified minimum. The Cabinet Committee of
Economic Affairs announces MSP for various crops at the beginning of each sowing season based on the
recommendations of the Commission for Agricultural Costs and Prices (CACP). The CACP takes into account
demand and supply, the cost of production and price trends in the market among other things when fixing
MSPs.
18Based on focus group discussion with farmers, government officials, and NGOs working in the area
19For more on this see, Primary Sector Development: Status, Strategy and Action Plan, Government of Andhra
Pradesh (2015).

11
warehouses/cold storages, there is a need to encourage public-private partnership that will tap into
private sector funding. Big corporate houses with considerable interest in manufacturing farm
equipment have a large presence in the state, and may be interested in investing in cold chain
infrastrucutre.
Intervention 1: Farm Loan Waiver
Farm loan waiver policies have been popular across India as a way of helping to alleviate the problems
of agriculture distress The Government of AP also announced a loan waiver of INR 24,000 crore (Rao,
2017). Farm loan waivers are granted to small and marginal farmers with landholding of less than 2
ha. In India, 83% of the farmers are smallholders, with less than 1 ha of land (Chand et al, 2011). The
focus on farmer loan waivers is motivated by the large amount of money typically required to enable
a broad-based farmer loan waiver scheme.
Costs and Benefits of Farm Loan Waiver Scheme
Benefit cost analysis estimates the total equivalent monetary value of the benefits and costs
to society when implementing this intervention. If the Benefit Cost Ratio (BCR) for a specific
intervention is greater than one, then society gains from the intervention20. At a policy level,
it is therefore rational to at least consider implementing the intervention. In this paper we
consider three rates of discount - 3%, 5%, and 8%, when computing BCRs.
Costs
Typically, the debt loan waivers packages are aimed at fulfilling election promises made by the
political parties. For instance, in 2017, three major states - Uttar Pradesh, Maharashtra and Punjab -
undertook large-scale farm debt waivers. The total amount of debt relief announced by these three
states amounted to INR 77,000 crore (roughly, $ 12,000 million) or 0.5% of India's GDP in 2016-17
(Kundu, 2017). If all the states in India were to waive 50% of their farm debt, it would cost 1% of
India’s GDP. Therefore, the farm loan waiver programme has a potentially huge cost on the national
exchequer (See, Figure 1).
20From the perspective of private return, any investment decision is viable if the Internal Rate of Return (IRR) is
higher than the bank’s rate of interest.
12
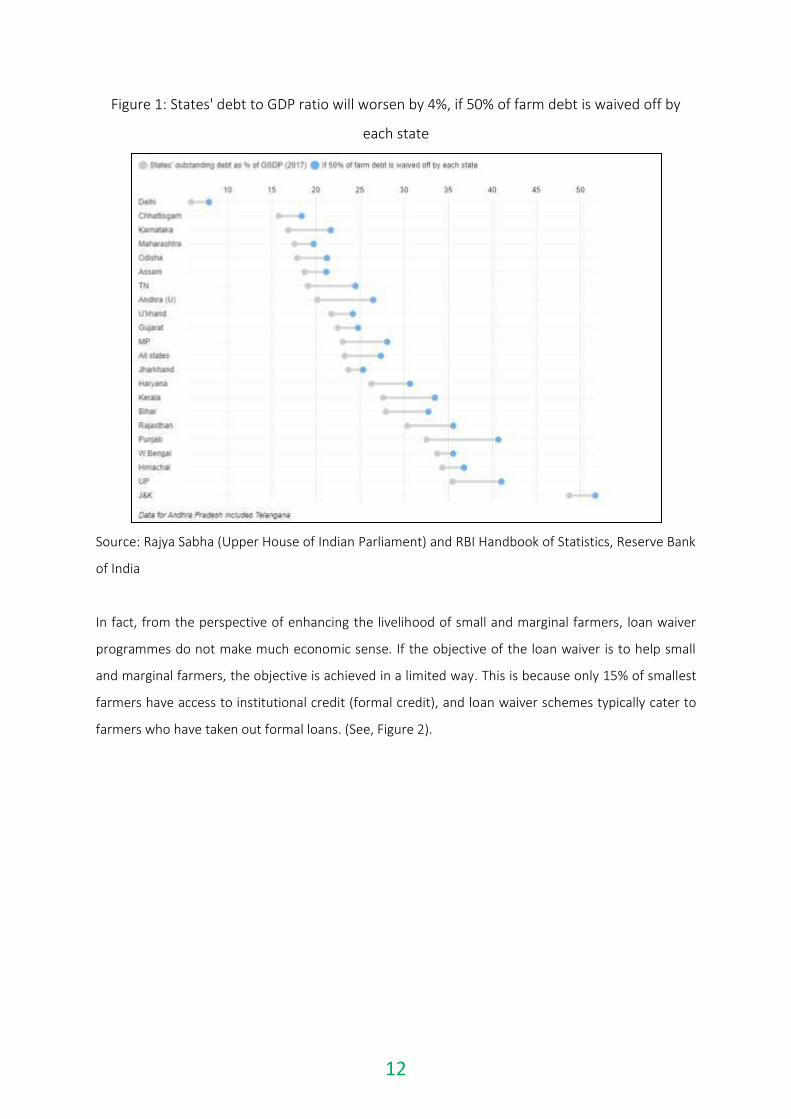
Figure 1: States' debt to GDP ratio will worsen by 4%, if 50% of farm debt is waived off by
each state
Source: Rajya Sabha (Upper House of Indian Parliament) and RBI Handbook of Statistics, Reserve Bank
of India
In fact, from the perspective of enhancing the livelihood of small and marginal farmers, loan waiver
programmes do not make much economic sense. If the objective of the loan waiver is to help small
and marginal farmers, the objective is achieved in a limited way. This is because only 15% of smallest
farmers have access to institutional credit (formal credit), and loan waiver schemes typically cater to
farmers who have taken out formal loans. (See, Figure 2).

13
Figure 2: Farmers with access to institutional credit (in %)
Source: National Sample Survey Office's 2013 situation assessment survey of farm households,
Government of India.
On the contrary, loan waivers may create to a problem of moral hazard, whereby more productive
farmers who can pay-off their loan, deliberately default, thereby resulting in lower loan availability
during the next cycle. Analysing the loan waiver program announced by Uttar Pradesh government in
2011, Chakraborti and Gupta (2017) find that eligible households in districts that received the waiver
had higher consumption expenditure, by approximately INR 8,000 per year, compared to non-eligible
households. What is of greater concern is that eligible households also tend to spend significantly
more on social events such as weddings, family occasions, and so on. This study also points out that
within the same district, households who received a loan waiver had no significant productivity
difference when compared with households who were not eligible for the waiver. Specifically, debt
forgiveness is likely to disincentivize households from using loans for productive investments, which
would be required for repayment. Households expect governments to intervene so that credit
institutions do not seize their collateral in case of default. The expectation that they can avoid any
penalty for non-repayment of a loan is likely to affect household decisions regarding the utilization of
loans.
At a macro level, loan waiver programs can be so costly, that they can impinge upon other
development activities. For example, after the Maharashtra government announced the INR 34,000
crore loan waiver program in 2017, finance officials indicated that a paucity of funds in the state
exchequer was making it difficult to honor tax refunds intended for industry (Thevar, 2018). Similarly,
because of the Uttar Pradesh loan waiver program, the state’s budget deficit shot up to 4.45% of the
14
gross state domestic product (GSDP). This was significantly higher than the average level of fiscal
deficit for all states, which stood at 2.5% of GSDP. It also left less money available to undertake the
capital expenditure allocated for infrastructure (Kumar, 2017).
Analysis of the loan waiver intervention
The intervention provides all famers with less than 2ha unconditional relief on outstanding formal
credit. To undertake a cost-benefit analysis, we rely on two papers, Giné and Kanz (2017) and Kanz
(2016) which estimate the effects of a 2008 farmer loan waiver enacted by the Union government in
response to the global financial crisis. Results indicate that the benefit to cost ratio is below 1 i.e. the
intervention does not create value for society in AP.
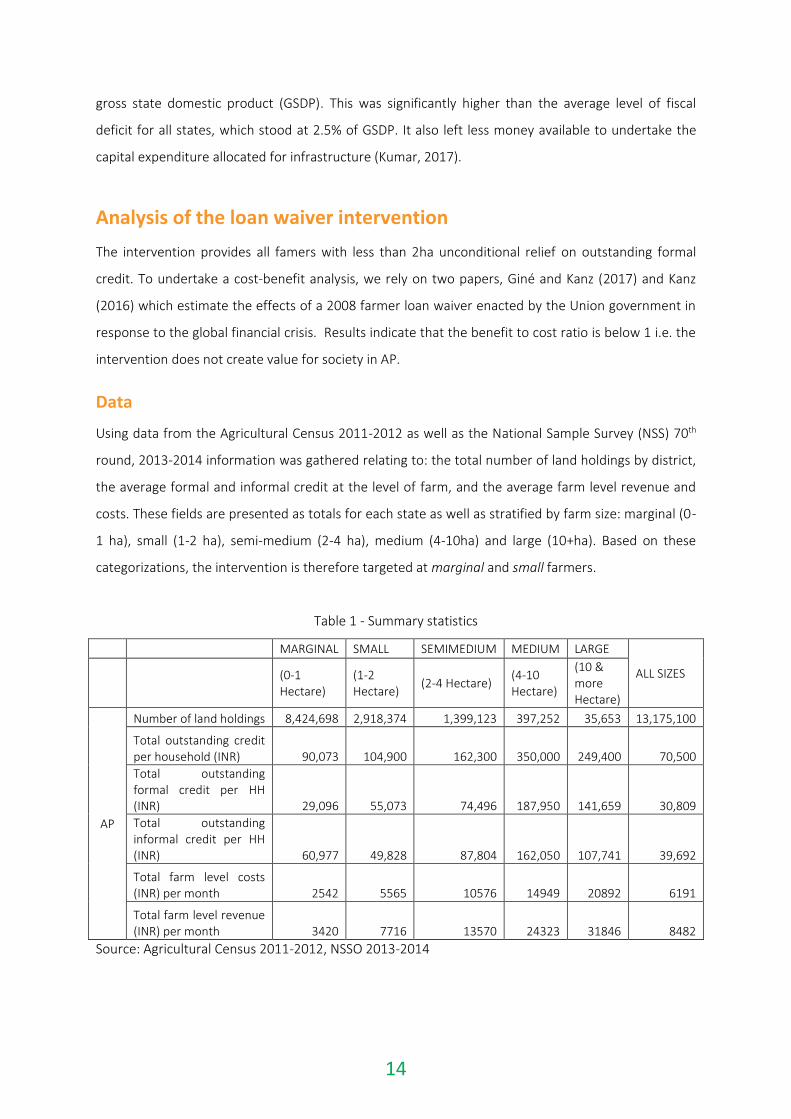
Data
Using data from the Agricultural Census 2011-2012 as well as the National Sample Survey (NSS) 70th
round, 2013-2014 information was gathered relating to: the total number of land holdings by district,
the average formal and informal credit at the level of farm, and the average farm level revenue and
costs. These fields are presented as totals for each state as well as stratified by farm size: marginal (0-
1 ha), small (1-2 ha), semi-medium (2-4 ha), medium (4-10ha) and large (10+ha). Based on these
categorizations, the intervention is therefore targeted at marginal and small farmers.
Table 1 - Summary statistics
MARGINAL SMALL SEMIMEDIUM MEDIUM LARGE
ALL SIZES
(0-1 Hectare)
(1-2 Hectare)
(2-4 Hectare) (4-10 Hectare)
(10 & more Hectare)
AP
Number of land holdings 8,424,698 2,918,374 1,399,123 397,252 35,653 13,175,100
Total outstanding credit per household (INR) 90,073 104,900 162,300 350,000 249,400 70,500 Total outstanding formal credit per HH (INR) 29,096 55,073 74,496 187,950 141,659 30,809 Total outstanding informal credit per HH (INR) 60,977 49,828 87,804 162,050 107,741 39,692
Total farm level costs (INR) per month 2542 5565 10576 14949 20892 6191
Total farm level revenue (INR) per month 3420 7716 13570 24323 31846 8482
Source: Agricultural Census 2011-2012, NSSO 2013-2014

15
This data is used to calculate the amount of formal and informal credit held by farmers with different
size holdings for each district. We then calculate a hypothetical exposure to bailout in each district
similar in concept to the one calculated in Giné and Kanz (2017)21.
Exposure to bailout in district i = Formal credit outstanding to farmers < 2ha in district i / total formal
credit in district i
Table 2: Exposure to bailout
Andhra Pradesh districts (n=13) All India districts, Giné and Kanz
(n=489)
Mean 0.671 0.326 Median 0.702 0.284 Standard Deviation 0.106 0.224 Min 0.456 0.002 Max 0.825 0.991
Source: Calculation by the authors
Note: AP represent a hypothetical bailout exposure based on data from NSSO 70. Giné and Kanz represent actual
bailout exposure from 2008 government bailout.
Method
Estimating the cost of the bailout
To estimate the cost of the bailout we simply identify the average amount of all formal credit held by
marginal and small farmers, and multiply by the number of households (see Table 1). This amounts to
INR 23,300 crore.
Estimating the post-bailout distribution of formal credit
Using the exposure to bailout variable, we estimate the amount of formal credit expansion or
contraction following Giné and Kanz. That papers suggests a one standard deviation increase
(decrease) in bailout exposure leads to a 25% reduction (increase) in formal credit allocated to that
district, post-bailout.
21The exposure variable in Giné and Kanz, differs in that it accounts for borrowers in default and also partial
waiving of loans for those with landholdings greater than 2ha. This reflects the specifications of the 2008 loan
waiver studied in that paper which only granted relief to farmers in default, and provided for relief for 25% of
loans for those with landholdings greater than 2ha. Because we assume an intervention that waives loans
regardless of default status (as seems to be the case for loan waivers in India since 2008), and is confined to
farmers with holdings less than 2ha, we require a simplified version of the exposure variable.

16
We then assess how this credit contraction or expansion is distributed across different farm sizes
within a district. In doing so we attempt to reconcile the findings of Giné and Kanz, which suggests
overall formal lending increases after the bailout, and Kanz (2016), which suggests that farmers below
the 2ha cut-off experience an 8-percentage point reduction in formal lending post-bailout. The
implication of these two findings is that farmers with more than 2ha receive more credit after the
bailout.
We apply Kanz (2016) 8-percentage point effect to small farmers (i.e. 1-2ha) to estimate their post-
waiver formal credit allocation. However, we do not apply the same percentage point reduction for
marginal farmers since they hold a lower share in formal credit than small farmers, and an 8-
percentage point reduction would represent a very significant percentage reduction in their share.
Instead of that it is assumed that marginal farmers experience the same percentage reduction in their
share of formal credit as small farmers do and calculate this effect size by dividing the estimate
percentage point reduction 7.95 from Kanz (2016) by the average share of formal credit held by small
farmers in the entire state (52.5% for AP). This implies a 15% reduction in formal credit for small and
marginal farmers in AP. The above calculations are initially done at a district level and then summed
up to identify the total contraction for small and marginal farmers across the state.
For farmers with greater than 2ha, the assumption is that they attract a quantum of formal credit that
satisfies the formal credit contraction or expansion at the district level that was calculated using the
Giné and Kanz finding. Sometimes this quantum is negative, i.e. farmers with land greater than 2ha
receive less formal credit in a given district.22 However, when summed across the state, farmers with
greater than 2ha receive more formal lending overall, while farmers with less than 2ha attract less
formal lending overall. Results of this reallocation are presented in Figure 3, below.
22 The findings of the two papers do not indicate whether the rule that overall lending to farmers with greater
than 2ha needs to hold at the district level, or merely overall at the state level. As such, we also test the effects
of a distribution formula that assumes farmers with land greater than 2ha always receive more formal credit or
zero, whichever is higher, and that the necessary contraction that would make the Giné and Kanz relationship
hold for a given district is attributed to small and marginal farmers instead. The results are similar to the ones
presented.
17
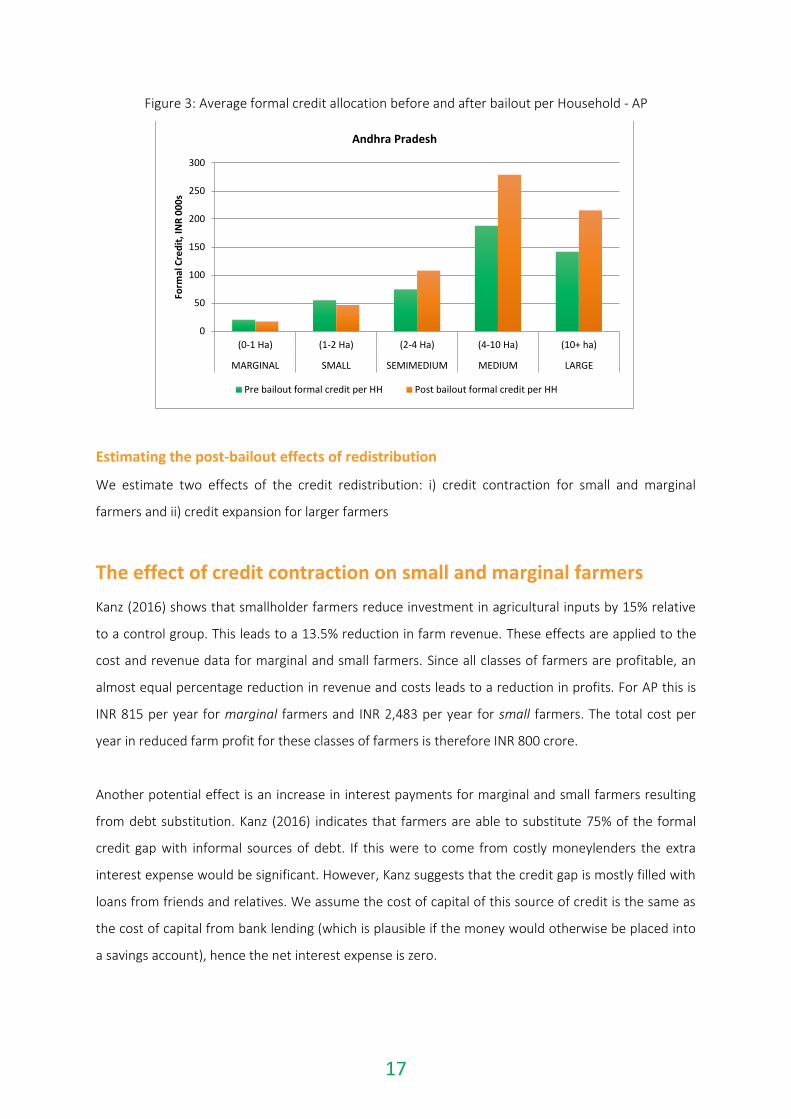
Figure 3: Average formal credit allocation before and after bailout per Household - AP
Estimating the post-bailout effects of redistribution
We estimate two effects of the credit redistribution: i) credit contraction for small and marginal
farmers and ii) credit expansion for larger farmers
The effect of credit contraction on small and marginal farmers
Kanz (2016) shows that smallholder farmers reduce investment in agricultural inputs by 15% relative
to a control group. This leads to a 13.5% reduction in farm revenue. These effects are applied to the
cost and revenue data for marginal and small farmers. Since all classes of farmers are profitable, an
almost equal percentage reduction in revenue and costs leads to a reduction in profits. For AP this is
INR 815 per year for marginal farmers and INR 2,483 per year for small farmers. The total cost per
year in reduced farm profit for these classes of farmers is therefore INR 800 crore.
Another potential effect is an increase in interest payments for marginal and small farmers resulting
from debt substitution. Kanz (2016) indicates that farmers are able to substitute 75% of the formal
credit gap with informal sources of debt. If this were to come from costly moneylenders the extra
interest expense would be significant. However, Kanz suggests that the credit gap is mostly filled with
loans from friends and relatives. We assume the cost of capital of this source of credit is the same as
the cost of capital from bank lending (which is plausible if the money would otherwise be placed into
a savings account), hence the net interest expense is zero.
0
50
100
150
200
250
300
(0-1 Ha) (1-2 Ha) (2-4 Ha) (4-10 Ha) (10+ ha)
MARGINAL SMALL SEMIMEDIUM MEDIUM LARGE
Form
al C
redi
t, IN
R 00
0s
Andhra Pradesh
Pre bailout formal credit per HH Post bailout formal credit per HH

18
The effect of credit expansion on farmers with larger land holdings
Table 1 indicates that large farmers still require some form of informal credit, though the percentage
share is much lower than for small and marginal farmers. It is assumed that farmers use the
expansion of formal credit to reduce their reliance on informal credit, thereby reaping a savings in
interest payments. Tripathi (2017) shows that the average rate of interest on formal credit is 11.67%,
while for informal credit it is 25.20%. Both of these represent the weighted average of diverse sources
of credit, including banks and government (formal) as well as moneylenders, shopkeepers, friends,
family, and landlords (informal). The benefit to larger farmers is simply the total formal credit increase
multiplied by the interest rate differential, 13.53%. This amounts to INR 733 crore per year.
One could also argue that larger farmers, instead of substituting to informal credit, rather use the
windfall credit to increase agricultural investment. Assuming these farmers are freely able to access
informal credit in the pre-bailout period, the marginal return on investment should equal the marginal
cost of informal credit in equilibrium. The net return of expanding investment would therefore be the
return of investment, 25.20%, less the formal interest rate, 11.67%, leading to a benefit calculation
identical to the substitution of informal credit.
Cost benefit analysis
In Year 1 the Government pays the loan waiver, and that exact same amount is received as a benefit
by small and marginal farmers. In subsequent years beneficiary farmers face a production loss, while
non-beneficiary farmers receive a net gain through credit expansion. We assume the effects last for
four years as per Giné and Kanz (2017).
Both of the papers examining the effects of the 2008 loan waiver scheme, indicate a costly moral
hazard arising from the intervention. Giné and Kanz (2017) show an increase in default in districts
with greater exposure to bailout, while Kanz (2016) shows that beneficiary farmers appear less
concerned about the reputational effects of defaulting on their loans. The costs of this significant
effect is not included fully, though is partially captured by credit restriction to farmers with less than
2ha. Therefore, the results can be considered a conservative commentary on the inefficiency of
farmer loan waivers.

19
For simplicity this paper ignores the effects of natural credit growth, inflation and growth in the
agricultural sector. These would not affect the final result significantly since they impact the
intervention scenario and the counterfactual scenario in a similar way.
Table 3: Profile of costs and benefits in AP (all figures in INR crore)
COSTS Year 1 Year 2 Year 3 Year 4 Year 5 Cost of bailout 23,263
Reduction in farm profits for beneficiary farmers
801 801 801 801
Total Costs 23,263 801 801 801 801 BENEFITS Receipt of waiver 23,263 Benefits of credit expansion for non-beneficiary farmers 733
733 733 733
Total Benefits 23,263 733 733 733 733
Results indicate that for AP the net benefits of the farmer loan waiver is less than 0, and the benefit-
to-cost ratio is less than 1. In fact, the BCR would have been even lower, if data showcasing district-
wise non-performing assets (NPAs) could have been accounted for. As of June 2017, the total amount
of NPAs in Indian banks stood at INR 829,338 crore. As state-wise/district-wise NPA data are not
available, it was not possible to account for this when calculating the BCR. However, Gine and Kanz
(2017) suggests that a one standard deviation to bailout exposure increases the probability that a
given district has a higher share of non-performing loans by 52%.
Table 4: Summary of cost benefit results (all figures in INR crore)
Discount Benefits Costs BCR Net benefits 3% 25,229 25,476 0.99 (247) 5% 24,629 24,860 0.99 (231) 8% 23,787 23,996 0.99 (210)
20
Intervention 2: Building more Storage Facilities
In India, usually farmers have two ways to sell their produce. The first is to sell directly to the
Government at Minimum Support Price (MSP). The Union Government procures 25 essential food
items directly from the farmers via agencies such as the National Agricultural Cooperative Marketing
Federation of India Limited (NAFED) and the Food Corporation of India (FCI).23 Typically, the MSP is
higher than the market price, and one would assume that farmers would necessarily sell their
produce to the Government and profit every time the government announces the value of the MSP.
24However, in practice, farmers are seldom sell their produce at the MSP. There are multiple reasons
for this. Not every village has NAFED or FCI outlets. The FCI currently procures a major portion of
paddy and wheat from a few select states; 70% of paddy procurement comes from the states of
Punjab, Andhra Pradesh, Chhattisgarh and Uttar Pradesh, while 80% of wheat procurement comes
from Punjab, Haryana and Madhya Pradesh. In fact, three states – Punjab, Haryana and Uttar Pradesh
– accounted for more than half of the total procurement during 2012-13 (Kishore, 2018).25 Further to
that, even if there is an NAFED or FCI outlet, the Government may not purchase the crops if the
farmers bring their produce before or after the allotted dates of procurement.
The second option for the farmers is to take their produce to the nearby Government designated
mandis (Hindi word for market) where, in front of the state government officers, they can auction
their produce to the brokers.26, In this situation, farmers have limited options other than to sell to the
middlemen who charge a hefty commission. In a Supply Chain examination study involving trade in
potatoes, it was found that middlemen can charge a commission of up to a staggering 70% (Singh
2017). For instance, during June 2017 in the Azadpur and Ghazipur mandis of Delhi, the middlemen
were selling common variety of potatoes at INR 5-7 per kilo. If these rates were being offered to
farmers they should have realized between INR 250 and 350 for a 50 kilogram sack. However, in
23In 2017-18, these items were paddy, jowar, bajra, maize, ragi, tur, moong, urad, cotton, groundnut,
sunflower seed, soyabeen black, sesamum, nigerseed, wheat, barley, gram, masur, mustard, safflower, toria,
copra, de-husked coconut, jute, and sugarcane. Some of these items such as safflower, sunflower, etc. are
more perishable in nature than others.
24 MSP is determined by Commission for Agricultural Costs and Prices (CACP), Ministry of Agriculture and
Farmers Welfare, Government of India. CACP gives three definitions of production costs: A2, A2+FL, and C2. A2
costs cover actual paid-out expenses incurred by farmers – both in cash and in kind – on seeds, fertilizers
pesticides, hired labor, fuel, irrigation, etc. A2+FL includes A2 plus an imputed value of unpaid family labor. C2
costs are more comprehensive, accounting for the rentals or interest foregone on owned land and fixed capital
assets, on top of A2+FL. Farmers complain if the government were to fix MSP on the basis of first two
definitions of production cost, they actually make a loss.
25India’s farmers need a new deal beyond cliched MSP Politics, Hindustan Times (15th
February 2018).
26 Mandis refer to markets in smaller towns and cities to which farmers from nearby villages bring their
agricultural produce to sell. There are around 7700 government designated mandis spread across India.
21
reality, the maximum price the farmers were offered was INR 100 for a 50 kilogram sack. Hence, most
often farmers do not know the actual market prices of the commodities and it is the middlemen who
siphon off most of the profits.
Inefficient supply chain management affects the small and marginal farmers (land holding of less than
2 ha). In India, the majority of farmers can be categorised in this way. They do not have access to cold
storage and warehouse facilities. To store their items in cold storage and warehouses, a farmer need
to book a minimum capacity of 50,000 quintals for their produce.27 However these small farmers do
not have the ability to grow 50,000 quintals of good quality produce,28 nor do they have access to the
finance needed to keep these items in storage. The only option for them is to sell their produce to
middlemen or traders at a price cheaper than the MSP and/or the market price.
In fact, the importance of access to cold storage and warehousing become more pronounced for
perishable produce such as fruits, vegetables, and milk. Although returns from growing fruits and
vegetables are higher, the majority of small farmers do not grow these crops. Birthal et al., (2015)
point out that only 22.22% of marginal famers (with less than 1 ha of landholding size) and 23.61% of
small farmers (between 1 and 2 ha of landholding size) grow any high value crops, such as fruits,
vegetables, spices, flowers, plantation and medicinal plants. Analysing data from the National Sample
Survey Organization (2005), this study finds small and marginal farmers are likely to gain from shifting
to high value crops: the likelihood of a farmer being poor is 3–7% less, if he grows high value crops.
However, partly because of the lack of storage and warehouse facilities, the majority of small and
marginal farmers shy away from growing these high value crops.
Apart from its ability to reduce poverty (as is evident from the the example of growing high value
crops), the absence of cold chain and warehouses also lead to wastage of fruits, vegetables, and milk.
A reduction in food wastage also improves food security by increasing the real income for all the
consumers. Wasting crops does not only reduce the food available for human consumption, but also
causes negative externalities to society through the costs of waste management, greenhouse gas
production, and the loss of scarce resources used in their production (Gustavsson, et al., 2011).
Moreover, quality (nutrient contents) of fresh foods continue to deteriorate throughout their shelf
life, from harvest or slaughter, through packing, distribution, marketing and sale (Kitinoja, 2013).
27 See, Project Report on Cool Chamber, National Informatic Centre, Government of India. Available
at:http://odihort.nic.in/sites/default/files/10MT-Cold-Room.pdf.
28 A sizeable portion of the crop gets lost because of weeds and pest insects.

22
Table 5: Importance of Cold Storage Management
Variable Global Developed Countries Developing Countries
Population in 2009 (in billions of inhabitants)
6.83 1.23 5.60
Population in 2050 (forecast, in billions of inhabitants)
9.15 1.28 7.87
Refrigerated storage capacity (m3/1000 inhabitants)
52 200 19
Food losses (all products)
25% 10% 28%
Losses of fruits and vegetables
35% 15% 40%
Losses of perishable foodstuffs due to lack of refrigeration
20% 9% 23%
Source: Lisa Kitinoja (2013), pp. 2.
According to an estimate prepared by ICAR-CIPHET study, the harvest and post-harvest losses for
major food commodities covering crops, livestock and fish was INR 92,651 crore during the year 2013-
2014. For the entire food sector this loss comes to INR 107,994 crore. These estimates reveal that
5.8% of food output is lost during harvest and transit. Around 18% of the country’s food and
vegetables are wasted annually because of lack of proper storage (ICAR-CIPHET, 2015).29
There are several constituent elements in cold chain logistics (an environment-controlled logistics
chain aimed at preserving the essential characteristics of the products handled):
(i) Pack-house - Pack-house are equipped with conveyer belt systems for sorting, grading, washing,
drying, weighing, and packaging fruits and vegetables.
(ii) Storage - Static infrastructure designed with insulated and refrigerated chambers for long term or
transient storage of whole fresh, ready-to-retail, or processed forms of perishable products.
29 Also see, Bhosale (2013).

23
(iii) Cold Storage (Bulk) - Environment controlled warehousing space with multiple chambers intended
for the bulk storage of perishable produce. Designed for extended duration storage of produce so as
to build an inventory buffer.
(iv) Cold Storage (Hubs): Environment controlled warehousing space with multiple temperature zones
which functions as a distribution hub. Designed for short term handling of products so as to serve as a
distribution logistics platform for market ready packaged produce and ready to retail products.
(v) Ripening Chambers: As the name suggests, these chambers are used for organically ripening fruits
and vegetables.
And, (vi) Reefer Vehicles: These are refrigerated transport vehicles, with an insulated carrier and
equipped with active refrigeration, designed for temperature-controlled carriage of perishable
products.
In cold chain logistics, cold storage (bulk and hubs) make up about 30%. The remaining 70% comprise
pack-houses, storage, ripening chambers and reefer vehicles. According to estimates by the National
Centre for Cold Chain Development (NCCD), the Ministry of Agriculture and Farmers Welfare,
Government of India, during 2012, there was an additional requirement for cold chain logistics that
can accommodate about 40 million metric tonnes of perishable items.
Costs and Benefit Analysis
Data
State-wide data relating to the value of fruits and vegetables produced are sourced from the Ministry
of Statistics and Programme Implementation, Government of India.30Data on storage capacity and
reefer vehicles are sourced from the NCCD report (2015). Data on the cost of building storage is also
sourced from the NCCD report. As per estimates, on a per ton basis, the average cost for building
multiproduct storage along with land and other infrastructure is INR 8,255. Further investment would
be needed to upgrade technology of existing cold storage facilities, which is estimated at INR 1,755
per ton capacity. To build specialized storage systems, such as controlled atmosphere cold stores,
would involve a higher investment cost of INR 31,000 per ton capacity. The estimate for building this
specialized storage with land and other ancillary infrastructure would be INR 8255 + INR 1755 = INR
10,010 per ton capacity. These figures are for the year 2012. For subsequent years, we inflate the
numbers by 30% which is the total rate of inflation between 2012 and 2017. The cost of ripening
30 For more on this see, "Statewise and item-wise estimates of value of output from agricultural and allied
sectors with new base year 2011-2012," Ministry of Statistics and Programme Implementation, Government of
India, 2016, page 301.
24
chambers is estimated at INR 0.5 million per piece. This data is sourced from India Mart.31 Agricultural
output data and milk production data are sourced from the Agricultural Census 2011-2012 and the
National Sample Survey 70th Round, 2013-2014. Costs relating to minimum wage rates are sourced
from the Ministry of Finance, the Government of Andhra Pradesh. Macro-level data such as inflation
and exchange rates are sourced from World Bank Indicators, World Bank.
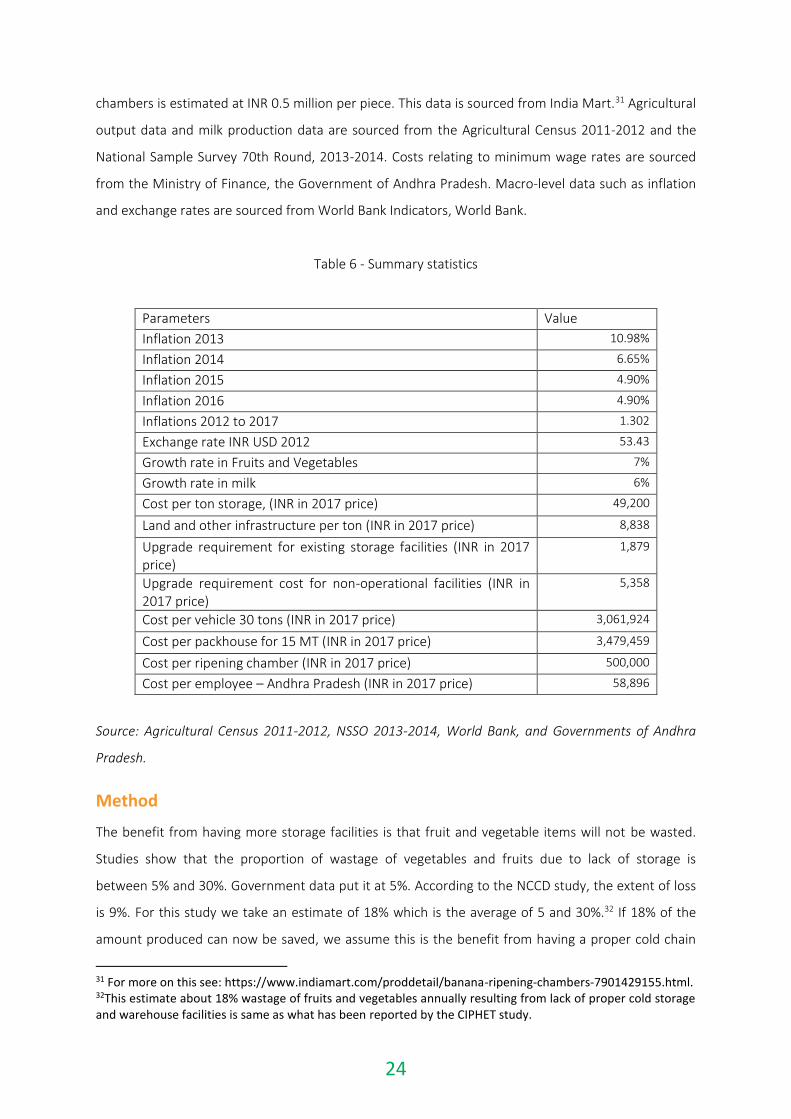
Table 6 - Summary statistics
Parameters Value
Inflation 2013 10.98%
Inflation 2014 6.65%
Inflation 2015 4.90%
Inflation 2016 4.90%
Inflations 2012 to 2017 1.302
Exchange rate INR USD 2012 53.43
Growth rate in Fruits and Vegetables 7%
Growth rate in milk 6%
Cost per ton storage, (INR in 2017 price) 49,200
Land and other infrastructure per ton (INR in 2017 price) 8,838
Upgrade requirement for existing storage facilities (INR in 2017 price)
1,879
Upgrade requirement cost for non-operational facilities (INR in 2017 price)
5,358
Cost per vehicle 30 tons (INR in 2017 price) 3,061,924
Cost per packhouse for 15 MT (INR in 2017 price) 3,479,459
Cost per ripening chamber (INR in 2017 price) 500,000
Cost per employee – Andhra Pradesh (INR in 2017 price) 58,896
Source: Agricultural Census 2011-2012, NSSO 2013-2014, World Bank, and Governments of Andhra
Pradesh.
Method
The benefit from having more storage facilities is that fruit and vegetable items will not be wasted.
Studies show that the proportion of wastage of vegetables and fruits due to lack of storage is
between 5% and 30%. Government data put it at 5%. According to the NCCD study, the extent of loss
is 9%. For this study we take an estimate of 18% which is the average of 5 and 30%.32 If 18% of the
amount produced can now be saved, we assume this is the benefit from having a proper cold chain
31 For more on this see: https://www.indiamart.com/proddetail/banana-ripening-chambers-7901429155.html.
32This estimate about 18% wastage of fruits and vegetables annually resulting from lack of proper cold storage
and warehouse facilities is same as what has been reported by the CIPHET study.

25
management. For milk, data shows the loss can be as high 40% and two-thirds of this loss happens
during storage (ASSOCHAM, 2017).33 Hence, the net benefit for the farmers from accessing cold
storage is one-third of 40%, that is 13%. This paper has analysed storage calculations for milk because
AP is one of the biggest suppliers of milk in India. Data shows that milk production is growing annually
at 7%, whereas for fruits and vegetables the annual growth rate is 6%.
In the first year of this intervention, the total benefit from putting cold chain logistics in place is
estimated at INR 997,854 lakh. The value of milk that can be saved by using cold storage represents
48% of the total benefit, and the value of fruits and vegetables that can be saved is 52% of the total
benefit. The annual benefit increases by 6-7% per year in line with the expected rate of growth in the
horticulture and dairy sectors. The year wise benefits are depicted in Figure 4 below.
Figure 4
For calculating the costs, we assume that there are capital costs associted with building the storage
units and that once built they will require some additional costs for maintenance and upgrades. We
also include the costs of variable inputs, such as labour, and other running cost, such as electricity and
gasoline, which are required to run storage facilities, pack-houses, ripening chambers, and all other
constituent elements of cold chain logistics. Similarly, the cost of running reefer vehicles and other
33ASSOCHAM-MRSS India study noted up to 50% of milk, fruits, veggies, produced in India go waste.
-
5,000
10,000
15,000
20,000
1 2 3 4 5 6 7 8 9 10
Cror
e IN
R
Intervention Year
Avoided wastage of milk, fruits and vegetables from cold chain infrastructure in
AP
Avoided milk wastage Avoided fruits and vegetable wastage

26
fixed investment are also included. Once we have these numbers relating to the costs and benefit, we
can compute the benefit-cost ratio.
Based on NCCD data and our analysis, the current total storage requirement for storing milk, fruits
and vegetables stands at 744650 MT. The total number of pack houses required is 4382. The total
number of ripening chambers required is 5708. The total number of specialised trucks required for
transporting fruits, vegetables and milk is 1312. About 90% of the storage requirement already exists
within the state, but the remaining infrastructure needs are almost non-existent. To fill this gap
requires a one-off investment of INR 2686 crore, plus additional investments over the following 9
years averaging approximately 20% of this value per year to meet expected growth in the horticulture
and dairy sectors.
Additionally, at the outset an additional 1261 employees would be required to run the storage
facilities, 9567 employees to run pack houses and ripening chambers, and 3418 workers (including
drivers and helpers) to operate the trucks. This requirement increases over the years to meet growth.
The average annual workforce costs is INR 146 crore over the 10 years. Lastly, we include operations
and maintenance cost of 10% of invested capital which averages INR 518 crore per year.
The year-wise cost breakdown is depicted in Figure 5 below.
Figure 5
-
500
1,000
1,500
2,000
2,500
3,000
3,500
1 2 3 4 5 6 7 8 9 10
INR
Cro
re
Costs of Establishing Cold Chain in AP
Infrastructure Costs O+M Labour costs

27
Table 7: Summary of cost benefit results (all figures in INR crore)
Discount Benefits Costs BCR Net Benefit Quality of Evidence
3% 113,199 12,654 8.9 100,545 Medium
5% 101,451 11,482 8.8 89,969 Medium
8% 86,884 10,026 8.7 76,858 Medium
Intervention 3: Impact of having local food processing units
Increase in income in India has led to changes in food habits - away from food grains to high calorie
produce such as pulses, eggs, fish, meats, and processed food items (dairy and bakery products). At
constant prices, between 2004-05 and 2012-13, the Gross State Domestic Product of AP has grown at
an average annual rate of around 4%.34 Enhanced income and changing lifestyle have led to increased
demand for processed food items. The state is bountiful when it comes to the production of
agriculture and livestock. AP ranks second in India in the production of paddy, ground nut and maize.
It is one of the leading states in horticulture produce with nearly 2 million hectare with different types
of fruit crops. AP ranks first in India in the production of Mango, Papaya, Lemon, Chili, Turmeric, and
Tomato. It also ranks first in terms of egg production, and has a strong presence in terms of meat and
milk products. During 2015-16, the state stood 2nd in Egg production (1417.67 crores), 4th in Meat
production (5.66 lakh Metric Tons) and 5th in Milk production (108.17 Lakh Metric Tons) in the
country. 35 All these make AP attractive to the food processing industry.
34 In 2014, the new state of Telengana had been carved out of Andhra Pradesh. Hence, to compute growth rate
we rely on data until 2013-14.
35 Socio economic survey, 2016-2017, Governmentof Andhra Pradesh. Available at: http://www.ap.gov.in/wp-
content/uploads/2017/03/SOCIO-ECONOMIC-SURVEY-2016-17.pdf

28
Table 8: Potential for AP emerging as a Food Processing Hub
Crops Area (in Million Hectare)
Production (in Million Tons)
Rank in India in terms of Production
% Contribution to India's production
Paddy 2.58 13.91 2 10.9 Groundnut 1.18 1.23 2 12.7 Maize 0.35 5.30 2 21.8 Sugarcane 0.16 15.57 5 4.56 Mango 0.3 2.73 1 14.8 Papaya 0.02 1.55 1 27.4 Lime/Lemon 0.02 0.35 1 21.0 Tomato 0.16 3.36 1 17.9 Cashew 0.08 0.56 2 13.6 Coconut 0.12 1829 millions 3 8.00 Banana 0.09 3.16 3 10.7 Onion 0.05 1.0 6 5.0 Egg NA 1273 millions 1 32.2 Meat NA 0.48 2 5.38 Milk NA 9.08 lakh litre
per day 3 7.47
Source: Department of Industries and Commerce, Government of Andhra Pradesh (2015).

29
Figure 6: District-wise distribution of major crops and livestock
Source: Department of Industries and Commerce, Government of Andhra Pradesh (2015).
Farmers gain from selling processed food items (adding value to the raw produce).36 For example, by-
products of paddy are used for manufacturing straw, rice bran oil, flattened rice (poha), and puffed
rice. Each one of these items sells at a higher price than paddy. Likewise, only 2% of the fruits and
vegetables produced in the state are processed. Processed fruits and vegetable items are in high
demand in local and export markets. Milk can be easily processed into ghee and processed cheese.
Food processing can be undertaken by small and marginal farmers with little help from the local gram
panchayat (village council). Preserving food using traditional methods can smooth consumption cycle
(by increasing their shelf life) especially because there are times of the year when excess production
can lead to wastage or shortage in production, caused by lack of adequate rainfall (or, even floods).37
Ability to process food also has an implication on production of livestock. In times of hostile climatic
conditions (prolonged dry or winter seasons) crops cannot be grown. There are cases where lack of
fodder leads to slaughtering of animals. In these situations stored dry grains or root crops provide
energy; dried, salted or smoked meats, or cheeses provide a source of protein, vitamins and minerals;
and processed fruits and vegetables such as pickles, chutneys or dried fruits or leaves provide
36The net value added is highest in grain milling is 25% followed by sugars, vegetable oils, fish, edible nuts,
feed, starch, fruits and bakery products (Government of Andhra Pradesh, 2015).
37As oppose to local processing units, the modern processing units require higher capital investment. Modern
food processing has three major aims which are: (a) To make food safe (microbiologically, chemically), (b) to
provide products of the highest quality (flavour, colour, texture), and (c) to make food into forms that are
convenient (ease of use) such as edible packaged food items.

30
vitamins and minerals. Hence, growth of local food processing units can be instrumental increasing
income, promoting greater food availability, and reducing post-harvest losses for the small and
marginal farmers.
The cost-benefit analysis for this intervention is based on results obtained from two case studies from
the neighbouring states in Karnataka and Tamil Nadu. It is assumed that since these 2 states are
proximate to AP they will have a similar cost structure and access to technology when it comes to
setting up any food processing unit. Accordingly, the benefit cost ratio that we see for Tamil Nadu and
Karnataka, will be similar for AP for a ‘typical’ processing unit. For Tamil Nadu, we looked at turmeric
processing. For Karnataka we looked at a paddy processing. It should be noted that throughout the
state, local conditions and availability of foods will determine the optimum food processing unit to
establish. Nevertheless, the evidence presented below from both India and international studies
suggests a likely benefit-to-cost ratio for local food processing of between 1-4.
Case Study 1: An Economic Analysis of Turmeric Production in Tamil Nadu.
Karthik and Amarnath (2014) undertook an economic analysis of turmeric production and processing
in Tamil Nadu. They undertook this study in Dharmapuri district in Tamil Nadu, which ranks third in
terms of area and production in the state, after Erode and Salem districts. Within Dharmapuri district,
Harur, Pappireddipatty, and Morappur blocks were selected based on the area under turmeric
production. These three blocks accounted for more than 50% of the area under turmeric production
in the Dharmapuri district. Within these three blocks, six villages were selected, and from each village
fifteen turmeric growers were selected at random. The total sample size was 90 and the authors used
two stage random sampling technique38 to analyse the cost benefit analysis for processed turmeric
production.
To estimate the cost and benefit, the authors used stochastic frontier analysis. Farmers are assumed
to be rational agents who maximize their production and minimize their costs. The objective is to
maximize their profits. However, though every producer may attempt to optimize, not all of them will
succeed in their efforts. For example, given the same inputs, and the same technology, some farmers
will produce more output than others, that is, they are more efficient than others. Using Stochastic
Frontier Analysis methodology, the researchers estimated the efficiency scores of individual
producers. Since efficiency scores vary across producers, they can be related to producer
38Samples chosen from pre-existing groups. At first, groups are randomly selected and then
individuals in those groups are used for the study.

31
characteristics such as size, ownership, location, etc., thereby identifying the root causes of
inefficiency. Interventions can then be targeted towards improving these inefficiencies.
This study on turmeric processing revealed that planting material, the nitrogen and potash content of
the soil, mechanization, and irrigation are important variables which contribute to the yield of
turmeric. The coefficients (production elasticity) of planting material, harvesting and curing, and
irrigation are significant at 1% level with values 0.321, 0.287 and 0.491, respectively. This implies that
a 1% increase in respective input could increase turmeric yield by 0.321, 0.287, and 0.491%,
respectively. For an average turmeric production, the mean level of technical efficiency analysis
indicates that it is 15.87% lower than the maximum possible attainable using optimum technology.
Therefore, it was possible to increase the average turmeric yield by 15.87% by adopting technology
used by the best performers. The benefit cost ratio for turmeric powder processing plant
documented in the paper is 4.3. The internal Rate of Return was found to be greater than 60%,
indicating financial viability.
Case Study 2: Economics of Paddy Processing
Shwetha, et. al., 2011 undertook a study to understand the economic viability of processing paddy
into rice and flattened rice (poha), both by conventional and modern rice mill processing units, in
Karnataka. The authors chose Davangere district in Karnataka. Devangere district is a leading district
in terms of growing paddy and processing it into rice and poha. The district consists of 150
conventional and 215 modern rice mills. In conventional mills, paddy processing is carried out in steel
hullers, whereas, other activities such as cleaning, drying, grading, polishing, etc., are carried out
manually. In contrast, in modern rice mills, paddy processing is carried out using rubber roll speller, a
technology which is more efficient. All other activities, such as grading, polishing, drying, etc., are
carried out using machines.
To understand the benefit cost analysis of paddy processing units the authors undertook a primary
survey. Data related to the costs and final value of the output (rice and poha) were collected. The
data was collected for a period of five years between 2005-2006 and 2009-2010. There are three
major components to the processing costs. These are the cost of the interest on fixed and working
capital for setting up paddy processing units. The costs of running the rice processing units, such as
fuel and power costs. And finally, there are water charges. This study finds that power, fuel, and water
charges together account for almost 42% of the total variable cost. The costs associated with salaries
and depreciation of buildings ranges between 1 and 2% of the total processing cost of milling rice.

32
Table 9: Net returns realized by Conventional and Modern Rice Mills (Per Quintal of Paddy Processed;
Figures in INR)
Particulars Rice Milling Process Flattened Rice (Poha) Making Process
Conventional
Unit
Modern Unit Conventional Unit Modern Unit
Gross Returns 1849.50 2104.55 1381.75 1476.75
Cost of Paddy 1437 1521.6 1084.32 1123.4
Processing Cost 126 196 35.3 41.00
Marketing Cost
a) Rice/Poha 69.80 84.33 56.8 60.40
b) Husk 4.95 10.5 5.12 4.75
c) Bran 3.92 4.48 NA NA
d) Broken 2.62 4.50 1.70 1.80
e) Total 81.29 103.81 63.62 66.95
Total Cost 1645.50 1821.80 1183.24 1231.35
Net Returns 204.46 282.75 198.5 245.0
Source: Shwetha, et. al., (2011), pp. 334.
In terms of return, one quintal (100 kg) of paddy yields in INR 1849 worth of rice when processed
using conventional units, and INR 2104 worth of rice when processed in modern units. Similarly, if one
quintal of rice were to be converted into poha, it yields in INR 1381.75 when processed using
conventional methods, and INR 1476.75 when processed using modern techniques. The benefit to
cost ratio for paddy using conventional processes is 1.28, whereas if processed in modern units the
benefit to cost ratio is 1.38. For poha (flattened rice), the benefit cost ratio for conventional units is
1.27 whereas for modern units is 1.31.
International experience from food processing in other developing countries also suggest similar
levels of benefit-cost ratio. For example, evidence from the Sweet potato Coalition Project # R8273
undertaken by the Food and Agricultural Organization, United Nations, in three districts (Mukono,
Luweero, and Mpigi) of Uganda, finds the benefit cost ratio for processing fresh sweet potato roots to
be between 1.5 and 2.1. The corresponding values for processing sweet potato flour are 1.7 and 3.7,
whereas, for sweet potato snacks the values are 0.9 and 1.1,. Likewise, examining the case for fish

33
processing in Nigeria, Ajang et al., 2010, find, processing fish using chorkor oven always yielded higher
returns (20%) when compared with returns from fish processed using traditional smoking alter
(7.20%).
AP ranks high when it comes to the production of fruit and vegetables, meat and egg, paddy, maize,
groundnut and sugarcane. As less than 2% of the produce are processed there exists a huge
opportunity for setting up local food processing units. Please note, local food processing units are
easy to set-up. At times food can be processed using traditional methods. This is different than
modern food processing units requiring higher capital investment. Food processing units not only
have the added benefit of giving food grains a longer shelf life, but can also create employment
opportunities in rural areas. Overall, the farmers gain as they realize higher prices by selling processed
food items. Apart from farming, other sectors such as aquaculture (AP is one of the largest producer
of shrimp), livestock, and diary sectors offer opportunities for farmers from AP.
Table 10
Intervention BCR Benefits Costs Quality of Evidence
Local food processing units Approximate
range of 1.0 – 4.0
Depends on local conditions and type of processing
Depends on local conditions and type of processing
Medium
Conclusion
The results from the analyses suggest that, for intervention 1 (farm loan waiver schemes), the
economic cost is higher than the benefit. If the objective of the loan waiver is to help smallest
farmers, farm loan waiver schemes do not fulfil that objective. This is because only 15% of smallest
farmers have access to institutional credit (formal credit), and loan waivers cater primarily to farmers
who have accessed formal loans. Even for those with 2.0 ha or less, roughly 50% of them access
formal credit. Moreover, studies have shown that the long-term impact of loan waiver programme
results in a fall in agriculture output and a reduction in the amount of formal loans available for small
and marginal farmers following the loan bailout period. Also, the costs to the national exchequer
result in a higher fiscal deficit. The opportunity cost of investing the same money into other
productive purposes, such as electrification of rural areas, building more canals and irrigation
facilities, could be high.
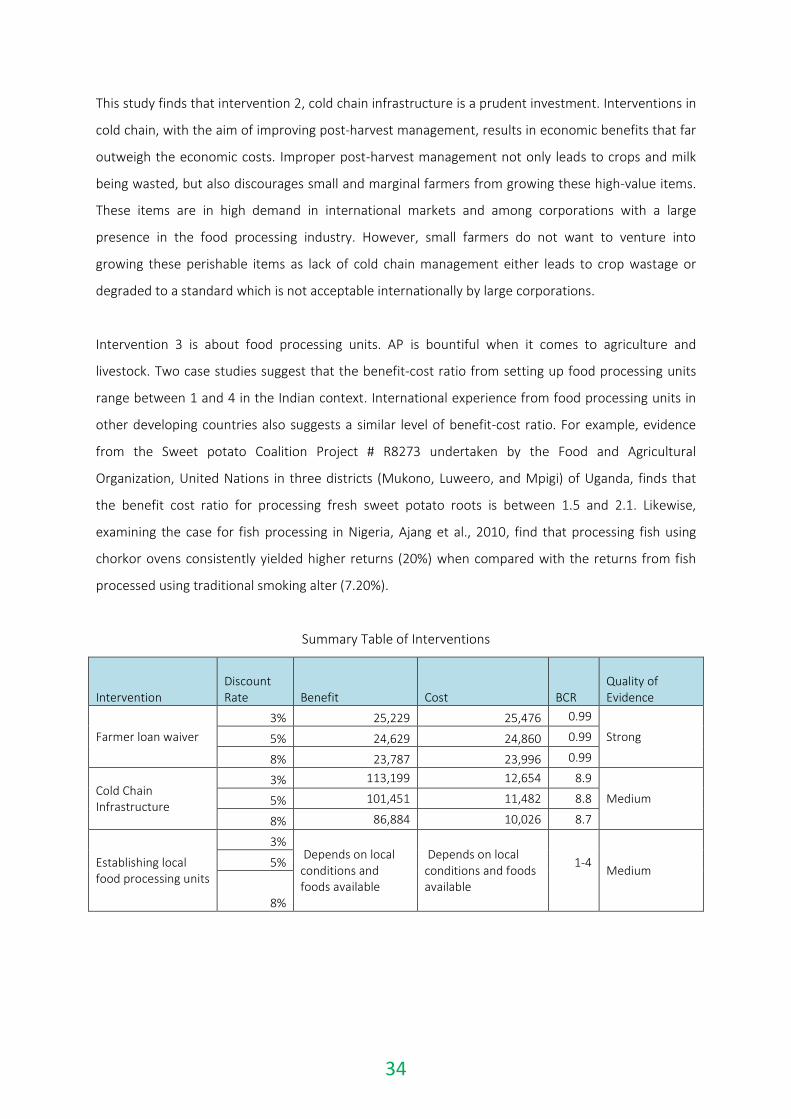
34
This study finds that intervention 2, cold chain infrastructure is a prudent investment. Interventions in
cold chain, with the aim of improving post-harvest management, results in economic benefits that far
outweigh the economic costs. Improper post-harvest management not only leads to crops and milk
being wasted, but also discourages small and marginal farmers from growing these high-value items.
These items are in high demand in international markets and among corporations with a large
presence in the food processing industry. However, small farmers do not want to venture into
growing these perishable items as lack of cold chain management either leads to crop wastage or
degraded to a standard which is not acceptable internationally by large corporations.
Intervention 3 is about food processing units. AP is bountiful when it comes to agriculture and
livestock. Two case studies suggest that the benefit-cost ratio from setting up food processing units
range between 1 and 4 in the Indian context. International experience from food processing units in
other developing countries also suggests a similar level of benefit-cost ratio. For example, evidence
from the Sweet potato Coalition Project # R8273 undertaken by the Food and Agricultural
Organization, United Nations in three districts (Mukono, Luweero, and Mpigi) of Uganda, finds that
the benefit cost ratio for processing fresh sweet potato roots is between 1.5 and 2.1. Likewise,
examining the case for fish processing in Nigeria, Ajang et al., 2010, find that processing fish using
chorkor ovens consistently yielded higher returns (20%) when compared with the returns from fish
processed using traditional smoking alter (7.20%).
Summary Table of Interventions
Intervention Discount Rate Benefit Cost BCR
Quality of Evidence
Farmer loan waiver
3% 25,229 25,476 0.99
Strong 5% 24,629 24,860 0.99
8% 23,787 23,996 0.99
Cold Chain Infrastructure
3% 113,199 12,654 8.9
Medium 5% 101,451 11,482 8.8
8% 86,884 10,026 8.7
Establishing local food processing units
3% Depends on local conditions and foods available
Depends on local conditions and foods available
1-4
Medium 5%
8%

35
References
Ajang, R.O., Ndome, C. B., and Ingwe, R.U. (2010) Cost-Benefit Analysis of Chorkor and Traditional
Smoking Kilns for Fish Processing. Iranica Journal of Energy and Environment, 1(4), 339-346.
ASSOCHAM. (2017) ASSOCHAM-MRSS India Study. New Delhi, India.
Banik, N. and Stevens, P. (2016) Farmer suicides in India and Weather God.Asia-Pacific Research and
Training Network on Trade Working Paper No. 161, United Nations ESCAP, 1-31.
Banerji, A. and Meenakshi, J. V. (2004) Buyer collusion and efficiency of government intervention in
wheat markets in northern India: An asymmetric structural auctions analysis. American journal of
agricultural economics,86(1), 236-253.
Bhosale, J. (2013) India wastes fruits and vegetables worth Rs 13000 crore every year: Emerson study.
The Economic Times, 28 November. Available at:
https://economictimes.indiatimes.com/news/economy/agriculture/india-wastes-fruits-and-
vegetables-worth-rs-13300-crore-every-year-emerson-study/articleshow/26523928.cms[Accessed: 10
March 2018].
Birthal, P. S., Roy, D. and Negi, D. S. (2015) Assessing the Impact of Crop Diversification on Farm
Poverty in India. World Development, 72, 70-92.
Central Statistical Office.(2016) State-wise and Item-wise estimates of Value of Output from
Agricultural and Allied Sectors.CSO Report: Ministry of Statistics and Programme Implementation,
Government of India. Available at: http://mospi.nic.in/sites/default/files/publication_reports/State-
wise_Value_of_Output_2011-12to2013-14.pdf[Accessed: 12 December 2017].
Government of Andhra Pradesh. (2015) Primary Sector Development: Status, Strategy, and Action
Plan. Report Submitted to NITI Aayog, India. Available at:
http://niti.gov.in/writereaddata/files/AndhraPradesh_Report_2.pdf [Accessed: 22 December 2017].
Chakraborti, T. and Gupta, A. (2017) Efficacy of Loan Waiver Programs. Department of Economics
Working Paper, IIT Kanpur, 1-50. Available at:
http://home.iitk.ac.in/~tanika/files/research/LoanWaiverAT.pdf[Accessed: 01 December 2017].
36
Chand, R., Lakshmi Prasanna, P.A. and Singh, A.(2011) Farm size and productivity: Understanding the
strengths of smallholders and improving their livelihoods.Economic and Political Weekly,46(26), 5-11.
Chand, R., Saxena, A. and Rana, S. (2015) Estimates and analysis of Farm income in India, 1983-84 to
2011-12. Economic and Political Weekly,1(22), 139-145.
Chand, R. (2016) Why doubling farmers’ income by 2022 is possible?Indian Express, 15 April.Available
at: http://indianexpress.com/article/opinion/columns/why-doubling-farmers-income-by-2022-is-
possible-2754028/ [Accessed: 14 February 2018].
Department of Industries and Commerce (2015) Andhra Pradesh Food Processing Policy 2015-2020 &
Operational Guidelines for Implementation. Report on Food Processing: Government of Andhra
Pradesh, Andhra Pradesh.
Giné X. and Kanz M. (2017); The Economic Effects of a Borrower Bailout: Evidence from an Emerging
Market, The Review of Financial Studies, hhx073, https://doi.org/10.1093/rfs/hhx073
Gustavsson, J., Cederberg, C., and Sonesson, U. (2011) Global Food Losses and Food Waste: Extent
Causes and Prevention. Food and Agriculture Organization of the United Nations, Rome. Available at:
http://www.fao.org/docrep/014/mb060e/mb060e00.pdf[Accessed: 21 January 2018].
Hindu BusinessLine. (2017) Telengana govt. completes farm loan waiver programme. 13 April.
Available at: https://www.thehindubusinessline.com/news/national/telangana-govt-completes-farm-
loan-waiver-programme/article9638022.ece [Accessed: 22 January 2018].
ICAR-CIPHET (2015) Report on Assessment of Quantitative Harvest and Post Harvest Losses of Major
Crops and Commodities in India.All India Coordinated Research Project on Post Harvest Technology,
Central Institute of Post-Harvest Engineering and Technology (CIPHET), Ludhiana.Available at:
https://www.researchgate.net/profile/Rajesh_Vishwakarma6/publication/289637983_Assessment_of
_Quantitative_Harvest_and_Post-
Harvest_Losses_of_Major_CropsCommodities_in_India/links/5690c83b08aed0aed811bae6/Assessme
nt-of-Quantitative-Harvest-and-Post-Harvest-Losses-of-Major-Crops-Commodities-in-
India.pdf[Accessed: 20 December 2017].
37
Kanz, M. (2016) What does debt relief do for development? Evidence from India’s bailout for rural
households.American Economic Journal: Applied Economics, 8(4), 66-99.
Karthik, V and Amarnath, J.S. (2014) An economic analysis of turmeric production in Tamil Nadu,
India. Direct Research Journal of Agriculture and Food Science, 2(6), 66-76.
Kishore, R. (2018) India’s farmers need a new deal beyond clichéd MSP politics. Hindustan Times, 15
February. Available at: https://www.hindustantimes.com/india-news/india-s-farmers-need-a-new-
deal-beyond-cliched-msp-politics/story-fpGg1pb90g1IKOkWBTUN3O.html[Accessed: 20 February
2018].
Kitinoja, L. (2013) Use of cold chains in reducing food losses in developing countries. PEFWhite Paper
No. 13-03,ThePostharvest Education Foundation, 1-16. Available at:
http://postharvest.org/Use%20of%20cold%20chains%20PEF%20white%20paper%2013-
03%20final.pdf[Accessed: 20 February 2018].
Kumar, N. (2016) Unraveling Farmer Suicides in India: Egoism and Masculinity in Peasant Life. Oxford
University Press.
Kumar, R. (2017) Farm Loan Waiver First Step, CM Yogi Adityanath must cure the malaise in UP
agriculture. Financial Express, 8 April. Available at: http://www.financialexpress.com/opinion/farm-
loan-waiver-first-step-cm-yogi-adityanath-must-cure-the-malaise-in-up-agriculture/620117/
[Accessed: 10 December 2017].
Kundu, T. (2017) How will Farm Loan Waivers impact the Indian Economy? Live Mint, 10 August.
Available at: http://www.livemint.com/Politics/HcS9M9n9rus7h5JiLQC2ZM/How-will-farm-loan-
waivers-impact-the-Indian-economy.html[Accessed: 10 December 2017].
Mishra, S. (2015) Farmers’ Suicides in India, 1995-2012: Measurement and Interpretation. Asia
Research Centre Working Paper number 62, London School of Economics, United Kingdom.
Mitra, S., Mookherjee, D., Torero, M. and Visaria, S. (2013) Asymmetric Information and Middleman
Margins: An experiment with West Bengal Potato farmers. BREAD working paper number 401, The
Bureau for Research and Economic Analysis for Development, Italy.

38
National Centre for Cold Chain Development. (2015) All India Cold Chain Infrastructure Capacity
Assessment of Status and Gap. Ministry of Agriculture and Farmers Welfare, Government of India, 1-
114. Available at: http://www.nccd.gov.in/PDF/CCSG_Final%20Report_Web.pdf[Accessed: 11
November 2017].
National Centre for Cold Chain Development. (2016) Report on Cold Chain-2016, Ministry of
Agriculture and Farmers Welfare, Government of India, 1-114. Available at:
http://www.nccd.gov.in/PDF/ReportCold-chain2016.pdf[Accessed: 13 November 2017].
National Informatic Centre. (2017) Project Report on Cool Chamber, Government of India. Available
at:http://odihort.nic.in/sites/default/files/10MT-Cold-Room.pdf [Accessed: 13 November 2017].
National Sample Survey Organization (NSSO). (2013) Situation Assessment Survey of Farmers: Income,
Expenditure and Productive Assets of Farmer Households. NSS 70th Round, Schedule 33, January-
December, 2013, NSS Report:Ministry of Statistics and Programme Implementation, Government of
India.
NITI Aayog. (2017) Doubling Farmers' Income: Rationale Strategy, Prospects and Action Plan.NITI
Aayog Policy Paper No. 1/2017, Government of India. Available at:
http://niti.gov.in/writereaddata/files/document_publication/DOUBLING%20FARMERS%20INCOME.pd
f[Accessed: 2 February 2018].
Rao, G., V. (2017) Loan Waiver a boon or a bane. The Hindu, 07 June. Available at:
http://www.thehindu.com/todays-paper/tp-national/tp-andhrapradesh/loan-waiver-a-boon-or-a-
bane/article14391583.ece1 [Accessed: 20 February 2018].
Reddy, D. N. and Mishra, S. (2010) Economic Reforms, Small Farmer Economy and Agrarian Crisis. In
R. S. Deshpande and Saroj Arora (eds), Agrarian Crisis and Farmers Suicides, 43-68, New Delhi: SAGE.
Sally, M. (2018) New MSP system to bring bounty for coarse grain croppers. The Economic Times, 05
February. Available at: https://economictimes.indiatimes.com/news/economy/agriculture/budget-
2018-new-msp-system-to-bring-bounty-for-coarse-grain-
croppers/articleshow/62782105.cms[Accessed: 21 February 2018].
39
Singh, P. (2017) Middle Earth Moguls. Outlook, 03 July. Available at:
https://www.outlookindia.com/magazine/story/middle-earth-moguls/299037 [Accessed: 12 March
2018].
Shwetha, M.K., Mahajanashetti, S.B. and Kerur, N. M. (2011) Economics of Paddy Processing: A
Comparative Analysis of Conventional and Modern Rice Mills. Karnataka Journal of Agriculture
Science, 24(3), 331-335.
The Economist. (2016) Dry Times – India’s Rural Economy. 30 April. Available at:
https://www.economist.com/news/finance-and-economics/21697870-meagre-rainfall-only-part-
problem-indias-farmers-dry-times [Accessed: 14 October 2017]
Tiwari, D. (2017) In 80% farmer-suicides due to debt, loans from banks, not money lenders, Indian
Express, 7 January. Available at: http://indianexpress.com/article/india/in-80-farmer-suicides-due-to-
debt-loans-from-banks-not-moneylenders-4462930/ [Accessed on 20 October 2017].
Thevar, K. (2018) Farm loan waiver, debt hinder Maha Govt from giving relief to Industries. The
Economic Times, 04 February. Available at:
https://economictimes.indiatimes.com/news/economy/policy/farm-loan-waiver-debt-hinder-
maharashtra-government-from-giving-relief-to-industries/articleshow/62781581.cms [Accessed: 20
February 2018].
Tripathi, A. K. (2017) Credit for Agricultural Households in India: Growing Inequalities.Journal of Asian
and African Studies, 52(6), 807-823.
World Bank. (2016) World Development Indicators. Washington DC: World Bank

Sector Expert Review
Andhra Pradesh Priorities An India Consensus Prioritization Project
Dr.B.GangaiahAndhra Pradesh State Planning Board
1
Thepaperisconciseandwellwrittenwithsupportingdataanddocumentation.Conclusions
ofthestudyareontheexpectedlines.
The paper listed three interventions for analysis i.e. 1. Farm loan waivers, 2. Building
additional storage capacity, and 3. Introduction of e-mandi, but finally the analysis is
confined to only the first two interventions. The reasons for not analyzing the third
interventionarenotknown.
1.FarmLoanWaivers:
The conclusion that farm loanwaiver benefits only small segment of formal institutional
credit borrowers and excludes large number of small andmarginal farmers who rely on
informal credit channels is largely true as revealed by several studies and anecdotal
evidence.
ResultsfromthepaperindicatethatforAPthenetbenefitsofthefarmerloanwaiverisless
than0,andthebenefit-to-costratioislessthan1.FarmerloanwaiversinAPwouldcreate
7bnINRinsociallosses.
Theargumentthatloanwaivercreatesabadenvironmentinthecreditmarketandwilllead
toaproblemofmoralhazardwhereinmoreproductivefarmerswhocanpay-offtheirloan,
willfullydefault, thereby resulting in lower loanavailabilityduring thenext cycle is also a
strongargumentagainstloanwaiverprograms.Burdenontheexchequerduetoloanwaiver
is real and substantial and this amount can be more fruitfully spent on creating
infrastructure, irrigation to build the capacity of farmers towithstand drought conditions
and improvetheproductivityandprofitabilityofproduction.Despitetheseargumentsthe
political attraction loan waiver has not diminished over time and is even getting more
politicalfans.
EvenifweagreethattheinterventionofFarmLoanWaiverdoesnotcreatevalueforsociety
inAPbasedontheanalysis,thisisbeingcontestedbythefarmersandsomesocialscientists
includingpoliticiansonthegroundthatitistheonlywaytoreducethedebtburdeninthe
shortrunandproviderelieftothedistressedfarmersandenablefarmerstofurtherinvest

2
ontheland.Weoftenherecriticismthatdebtreliefoflargesumsisgiventoindustrybythe
government banking system to few irresponsible industrialists without any large
distributional impact as in the case of farmers. However, it is politically an attractive
proposition as farmers constitute substantial chunkof electorate in this country. So, the
justification for farm loanwaiver comes largely from politicians and some segments of
social scientistswhoseagenda ispromotionofequity.Wehavewitnessed in recentyears
that despite intellectual arguments against the loan waiver more and more state
governmentsincludingtheBJPruledstateslikeUPhaveembracedthisprogram.
Farmerssuicidesarenotjustrelatedtocropfailuresordepressedpricesfortheproducebut
due to a host of factors like illness in the family and hospitalization of familymembers
incurring huge expenditure and social pressure to spendonmarriages, death ceremonies
beyond their means which could not be met from the meagre income frommonocrop
farming and borrowing from private lenders at exorbitant interest rates. The amount of
short-terminstitutionalloansforagricultureexceedsthetotalcostofinputsincludinghired
labouratanall-IndialevelandinmanyStates.Thisindicatesthatapartofcroploansislikely
spentonnon-agriculturalpurposes.NSSsurveysonInvestmentandDebt(NSS-I&D)indicate
that the loans taken by cultivators from non-institutional sources, which involve high
interestrate,isrisingfasterthanfrominstitutionalsources.
Decliningtermsoftradeofagriculturevis-a-visIndustry,tradeandservicessectorsisalsoan
importantfactorinthiscontext.
Studies show that inmany cases the suicides aremore among cash crop cultivators like
cottonwhichrequirelargeinvestmentinthefaceoflowqualityseed,vagariesofnatureand
depressed prices due to market uncertainties. All these factors need to be addressed
systemicallythroughtheexistinginstitutionalstructureswhichisarealchallenge.
Suggestions have come from several quarters to remedy the situation. Economists like
Dr.C.Rangarajanhavesuggestedinterestwaiverwithreschedulingofloanratherthanloan
waiverwhichneedsaseriousconsiderationbythepolicymakers.Butthismaynotbethe
mostpopularideaforpoliticians.

3
Amore sustainable relief can be provided by developing cropmortgage instruments and
extending concessional credit and by developing efficient storage systems and cold chain
facilities. Another important area neglected so far is the development of comprehensive
crop/agricultural insurance market. Currently agricultural insurance is limited in India.
Instrumentsofinsurancearealsolimited.Morediversifiedinsuranceproductsneedtobe
developedandintroducedtosuitthevariedneedsofthefarmers.Furtherconsideringthe
small size of majority farm holdings in India the only way to sustain the farming is by
diversifyingthesourcesof farmers incomebypromotingnon-cropalternatives likeanimal
husbandry,fisheriesandhorticulturewhichcanprovidestabilityandsustainabilityoffarm
incomes. Low input organic farming which is now being encouraged widely is another
importantoptionas studieshave shown that inorganic farming the costofproduction is
low,variabilityinproductionislessandpricesarehigherthaninorganicproduction.
While in the formal sector, there is always limited liability on the entrepreneur, in
agriculture, farmers faceunlimited liability. Farmersneedcreditproducts that theyareat
leastpartiallyexemptfromrepayingwhenevertherearedisastersandlosses.
NITIAayog(December2015)hasalsomadeseveralsuggestionsthatareworthconsidering.
Apartfromeffortsto increaseyields,theframeworkfor landleasingcanbestrengthened,
which will not only allow consolidation, but will also give an opportunity to unwilling
farmers to exit the sector. It also highlighted the ideaof price deficiency payment. If the
priceof a crop fallsbelowapredetermined threshold level, farmers canbe compensated
through cash transfers.Adequate safeguardsneed tobebuilt inorder toprotect farmers
against both production and price risks. Cooperatives can also be encouraged; thesewill
helpreduceriskandtransactioncosts.
In the longer run, strengthening the repaymentcapacityof the farmersby improvingand
stabilizingtheir incomebyraising incomefromagriculturalactivitiesandenhancingaccess
tonon-farmsourcesofincome.Improvedtechnology,expansionofirrigationcoverage,and
crop diversification towards high-value crops are appropriate measures for raising
productivityandfarmers’income

4
Intervention2:BuildingmoreStorageFacilities
Theconclusionsfromtheanalysisofinterventionofbuildingmorestoragefacilitiesarealso
indisputable.Realizing the importanceof storageandcoldchain logistics theGovernment
hasmadeseveralpolicyinitiativesfromtimetotime.Encouragingprivateinvestmentwith
incentives is one such important measure. However, the results have been slow and
inadequatetomeettheneedsofthefarmsector.Accesstomodernstorageandtransportis
limitedtolargeandmediumsizedfarmerswithsmallandmarginalfarmerslargelyleftout
fromthesystemresultinginlowpricerealizationbysmallandmarginalfarmers.Minimum
supportprices(MSP),andcooperativefarmingandofflatefarmersproducersorganizations
targetedlargelytohelpsmallandmarginalfarmershavenotbeenabletoprovidereliefto
largenumberofsmallandmarginalfarmers.
These smallholder farmers donot have access to cold storage and reefer vehicles due to
highcostandlowavailabilityinmanyplaces.Moreover,thesefacilitiesaresuitableonlyfor
horticultureandanimalhusbandryproductswhereasbulkofthesmallandmarginalfarmers
growonlylowvaluecropslikecereals,pulses,cotton,jowarwhicharenotgenerallystored
asthecostofstorageinthetotalvaluerealizationwillbeveryhighhencenoteconomically
viable.
The solutions for this problem are known but not implemented in the past due to
institutional constraints and inadequate investments and extension services. Cooperative
farming is tried out in many areas but has been successful only in a few states like
MaharashtraandGujaratthattooinafewsubsectorslikesugar,milketc.OfflateFarmers
Producers organizations have been given importance to improve the productivity and
realizebetterpricesforsmallandmediumfarmers.Butherealsotheresultsaremixedwith
betterorganizedFPOsareabletoreapthebenefitswhilelargenumberofthemarefacing
severalfinancial,managementandotherorganizationalissues.Thesearetobeaddressedin
thesystematicandsustainedmanner.

5
Thisreportisausefulsteptounderstandthecostbenefitanalysisforspecificinterventions
in different States. However, it needs to be interpreted with caution considering the
presenceof private sector andquality assureddiagnosis / treatment, the socio economic
profile of the population, the health seeking behavior, the capacity of the public health
systemforintensifiedcasefindingactivitiesinurbanslums/vulnerablepopulation,etc.
Evenaftertwentyfiveyearsofbeingdeclaredaglobalhealthemergency,TBcontinuesto
beamajorpublichealthchallenge,particularlyinIndia.AccordingtotheGlobalTBReport
2017,outoftheglobal104lakhnewcasesperyear,28lakharefromIndia,i.e.,weaccount
forone-fourthoftheglobalburdenoftuberculosis.Tuberculosisisoneoftheleadingcauses
ofdeathsworldwide,withIndiaaccountingfor4.2lakhsoutofthe17lakhsdeathsoccurring
globally due to TB. In India, TB causes more deaths than any other infectious disease,
includingbothHIVandMalaria.
Resistance to conventionally used anti-TBdrugshas also emerged as an enormouspublic
healthchallengewithanestimated1,47,000casesofDR-TBoccurringannuallyoutof the
notifiedcasesofpulmonaryTB in India. IndiacurrentlyhasthehighestburdenofbothTB
and DR TB and second highest of HIV associated TB, according to estimates reported in
Global TB Report 2017. Based on the first National Drug Resistance Survey (2014-16)
approximately 3% amongnewTB cases and 12 - 17% amongpreviously-treated TB cases
haveDR-TB.Anestimated87,000HIVassociatedTBoccurredin2015and12,000estimated
numberofpatientsdiedamongthem.
To fight thismassive public health problem, theGovernment of India (GoI) launched the
National TB Programme in 1962. After pilot testing recommendations from an expert
committee,afull-fledgedRevisedNationalTBControlProgrammewasstartedin1997using
the Directly Observed Treatment Short-course chemotherapy (DOTS), which was fully
established by 2006. In 2007, GoI introduced the Programmatic Management of Drug
ResistantTB(PMDT)tocombatdrugresistanceandachievedfullgeographicalcoverageby
2013.

6
Theprogramhascomea longwaysincethenandhasundergonemajorchangesover the
past fewyears.Mucheffort isbeingmadetomaketheprogrammorepatient-centricand
providecomprehensivetreatmentcareandsupport.
• The Technical and Operational Guidelines were updated in 2016 which gives a
comprehensive picture for case finding, diagnosis, treatment and care for
TuberculosisunderRNTCP.
• Daily regimen through fixed dose drug combinations (FDCs) to reduce the pill
burden, enhance patient autonomy and adherence without compromising on the
effectivenessoftreatment.
• Toenhanceadherencetotreatment,theTBprogramhasadopteddigitaltechnology
intheformofICTenabledpatientcentricadherencesupportcalled99DOTS.Itisan
innovationthatseekstoaddress issuesofadherencebyusingbasicmobilephones
and augmented packaging for medication. This has further increased patients’
controlovertheirtreatmentandhasadvancedpatientrightsandautonomy.
• Toimprovecasefindingand‘ReachingtheUnreached’,thecountryhasundertaken
ActiveCaseFinding (ACF)over threephases in378districts,whereinhigh riskand
vulnerablepopulationswerescreenedforTB.Throughthiseffort,morethan25,000
additionalTBpatientswerediagnosed.
• Provision of incentives for nutrition for all TB patients through Direct Beneficiary
Transfer(DBT).
• Provision of incentives to private practitioners as well as chemists to notify
tuberculosispatientstotheRNTCP.
• Interdepartmentallinkagesthrough‘singlewindowcare’forTB-HIVco-ordinationis
inplace,withalldiagnosedTBpatientsbeingreferredforHIVtestingandallPeople
LivingwithHIV/AIDS(PLHIV)beingscreenedfortuberculosis.
• Cross referral and Linkageswith the National Tobacco Control Programme (NTCP)
andNationalProgrammeforpreventionofCancer,Diabetes,Cardiovasculardisease
andStroke(NPCDCS)havebeenestablished.
7
• Public private linkages are being enhanced which may help us to extend our
diagnostic, treatmentandpatientsupportserviceseventopatientsseekingcare in
theprivatesector.
• ToensureearlycasedetectionandinitiationoftreatmentfordrugresistantTB,1135
CBNAATmachineshavebeenput inplace. These rapidmoleculardiagnosticshave
revolutionizedtheprogrammatic landscapeandhaveenabledtheRevisedNational
TBControlProgrammetodecentralizeUniversalDrugSusceptibility (U-DST)testing
services.
• ThePMDTGuidelineshavebeenrevisedtoadoptanewandmorerobustdiagnostic
algorithmthatwillhelpinearlydetectionandtreatmentinitiationofDR-TB.
• To aid early detection of drug resistant TB, Universal DST (U-DST) is being
implemented across India, wherein all diagnosed TB patients are being offered
CBNAAT testing to detect Rifampicin resistance, at the very outset of their
treatment.
• Tostrengthenmonitoringtheprogramhasintroducedwebbasedcasemanagement
system called “Nikshay” through which data access and analysis have both been
madeeasier.NikshayAushadhihasbeenintroducedtostrengthentheprocurement
andsupplychain.
These new adoptions are crucial to tackle the crisis of tuberculosis and help attain the
ambitiousgoaltoEndTB,asenvisagedintheNationalStrategicPlan(2017-2025).


© Copenhagen Consensus Center 2018
As a new state, Andhra Pradesh faces a bright future, but it is still experiencing many acute social and
economic development challenges. It has made great strides in creating a positive environment for
business, and was recently ranked 2nd in India for ease of doing business. Yet, progress needs to be
much faster if it is to achieve its ambitions of becoming the leading state in India in terms of social
development and economic growth. With limited resources and time, it is crucial that focus is informed
by what will do the most good for each rupee spent. The Andhra Pradesh Priorities project as part of
the larger India Consensus – a partnership between Tata Trusts and the Copenhagen Consensus
Center, will work with stakeholders across the state to identify, analyze, rank and disseminate the best
solutions for the state. We will engage people and institutions from all parts of society, through
newspapers, radio and TV, along with NGOs, decision makers, sector experts and businesses to
propose the most relevant solutions to these challenges. We will commission some of the best
economists in India, Andhra Pradesh, and the world to calculate the social, environmental and
economic costs and benefits of these proposals
For more information visit www.APpriorities.com
C O P E N H A G E N C O N S E N S U S C E N T E R Copenhagen Consensus Center is a think tank that investigates and publishes the best policies and
investment opportunities based on social good (measured in dollars, but also incorporating e.g. welfare,
health and environmental protection) for every dollar spent. The Copenhagen Consensus was
conceived to address a fundamental, but overlooked topic in international development: In a world with
limited budgets and attention spans, we need to find effective ways to do the most good for the most
people. The Copenhagen Consensus works with 300+ of the world's top economists including 7 Nobel
Laureates to prioritize solutions to the world's biggest problems, on the basis of data and cost-benefit
analysis.