Embed Size (px)
Citation preview

COST BENEFIT ANALYSIS OF BUFFER ZONE MANAGEMENT IN CHITWAN NA-
TIONAL PARK OF CHITWAN, NEPAL
Final Project Report
PRINCIPAL RESEARCHER: MANIRATNA ARYAL
Institute of Agriculture and Animal Science (IAAS), Rampur, Chitwan, Nepal
E-MAIL: [email protected]
ADDRESS: Department of Agricultural Economics, IAAS, Rampur, Chitwan
PHONE NUMBER: 9845069826, 9745013956
FUNDING: SOUTH ASIA NETWORK OF ECONOMICS RESEARCH INSTITUTES
(SANEI)
ORGANIZATION: Tribhuvan University, Institute of Agriculture and Animal Science (IAAS),
Rampur, Chitwan
“No time to see, when woods we pass
Where squirrels hide their nuts in grass
A poor life this if, full of care,
We have no time to stand and stare” ("Leisure," William Henry Davies, 1871-1940)

Aryal, Maniratna: Final Report
ADVISORY COMMITTEE
MR. JAY PRAKASH DUTTA (CHAIRMAN)
Assistant Professor
Department of Agricultural Economics, IAAS
PUNYA PRASAD REGMI, Ph. D (MEMBER)
Associate Professor
Department of Agricultural Economics, IAAS
KESHAB RAJ PANDE, Ph. D (MEMBER)
Assistant Professor
Department of Soil Science and Geology, IAAS
JULY 2008
Aryal, Maniratna: Final Report
TABLE OF CONTENTS
TABLE OF CONTENTS ....................................................................................................................... 3
LIST OF TABLES ................................................................................................................................. 7
LIST OF FIGURES ............................................................................................................................... 8
LIST OF APPENDICES ........................................................................................................................ 9
ACKNOWLEDGEMENTS ................................................................................................................. 10
GLOSSARY OF TERMS .................................................................................................................... 11
ACRONYMS ....................................................................................................................................... 12
EQUIVALENTS .................................................................................................................................. 14
ABSTRACT ......................................................................................................................................... 15
1. INTRODUCTION ........................................................................................................................... 16
1.1 Background Information ............................................................................................................ 16
1.2 Statement of Problem ................................................................................................................. 21
1.3 Research Rationale ..................................................................................................................... 23
1.4 Objectives ................................................................................................................................... 25
1.5 Scope and Limitation of Study ................................................................................................... 25
1.6 Definitions of the Concept ......................................................................................................... 26
2. REVIEW OF PAST WORKS .......................................................................................................... 28
2.1 Master Plan for the Forestry Sector ........................................................................................... 28
2.2 Initiation of Buffer Zone Concept .............................................................................................. 29
2.3 Buffer Zone Management in Nepal ............................................................................................ 31
2.4 Community Forestry in Buffer Zone of Chitwan National Park ................................................ 32
2.5 Paradox of National Parks .......................................................................................................... 33
2.6 Conflict Resolution Strategy: Establishment of Buffer Zones ................................................... 34
2.7 Participatory Conservation Approach ........................................................................................ 35
2.8 Nepalese Context ....................................................................................................................... 39
2.9 Conservation History ................................................................................................................. 40
2.10 Participatory Conservation Programme ................................................................................... 41
2.11 Community Mobilization Approach ........................................................................................ 42

Aryal, Maniratna: Final Report
2.12 Benefits of Chitwan National Park .......................................................................................... 44
2.13 Economic Approaches in Resource Evaluation ....................................................................... 44
2.14 Recreation Benefits in an Alpine and Periyar National Park ................................................... 45
3. METHODOLOGY .......................................................................................................................... 47
3.1 Selection of the Study Area ........................................................................................................ 47
3.2 Selection of Members and Sample Size Determination ............................................................. 47
3.3 Conceptual Framework .............................................................................................................. 51
3.4 Techniques of Data Collection ................................................................................................... 52
3.5 Field Data Collection ................................................................................................................. 53
3.6 Methods and Techniques of Data Analysis ................................................................................ 53
3.6.1 Socio-Demographic and Farm Characteristics .................................................................... 54
3.6.2 Calculation of Benefit-Cost Ratio (B/C) ............................................................................. 54
3.6.3 Willingness to Pay (WTP) ................................................................................................... 54
3.7 Overall Research Process ........................................................................................................... 61
4. DESCRIPTION OF THE STUDY AREA....................................................................................... 62
4.1 Chitwan District ......................................................................................................................... 62
4.2 Chitwan National Park ............................................................................................................... 62
4.3 Buffer Zone of Chitwan National Park ...................................................................................... 64
4.4 Land Use of Buffer Zone ........................................................................................................... 64
4.5 Baghmara Buffer Zone Community Forest ................................................................................ 64
4.6 Ecotourism Potential .................................................................................................................. 65
4.7 Climate ....................................................................................................................................... 66
4.8 Geology and Soil ........................................................................................................................ 66
4.9 Flora and Fauna .......................................................................................................................... 67
5. RESULT AND DISCUSSIONS ...................................................................................................... 68
5.1 Demographic characteristics ...................................................................................................... 68
5.1.1 Population distribution ........................................................................................................ 68
Aryal, Maniratna: Final Report
5.1.2 Economically active population .......................................................................................... 69
5.1.3 Ethnicity .............................................................................................................................. 69
5.1.4 Occupation .......................................................................................................................... 70
5.1.5 Education ............................................................................................................................. 72
5.1.6 Sources of income ............................................................................................................... 72
5.1.7 Food security ....................................................................................................................... 73
5.2 Park-People Interface ................................................................................................................. 74
5.2.1 Collection of thatching materials ........................................................................................ 74
5.2.2 Cooking materials ............................................................................................................... 75
5.2.4 Livestock farming ............................................................................................................... 78
5.2.5 Crop raiding and livestock depredation ............................................................................... 79
5.2.6 Threats to human and animal life ........................................................................................ 81
5.2.7 Natural calamities ................................................................................................................ 82
5.3 Human resource development .................................................................................................... 83
5.4 Tourism pressure and impact ..................................................................................................... 84
5.5 Community development initiatives .......................................................................................... 85
5.6 Park management ....................................................................................................................... 86
5.6.1 Cooperativeness of Park administration .............................................................................. 87
5.7 Benefit sharing among the participants ...................................................................................... 88
5.8 Utilization and management of forest product ........................................................................... 90
5.8.1 Forest resource demand and utilization ............................................................................... 90
5.8.2 Baghmara Buffer Zone Community Forest management ................................................... 91
5.9 Utilization of financial resources of Baghamra Buffer Zone Community Forest ...................... 92
5.9.1 Income from ecotourism ..................................................................................................... 92
5.9.2 Income from forest product ................................................................................................. 92
5.10 Benefit Cost ratio of Chitwan National Park ........................................................................... 92

Aryal, Maniratna: Final Report
5.11 Opportunity cost of the Park measured in terms of local crop production............................... 94
6. TOURISM ........................................................................................................................................ 96
6.1 Introduction ................................................................................................................................ 96
6.2 Tourism trends in Chitwan National Park .................................................................................. 96
6.3 Visitors survey results ................................................................................................................ 96
6.3.1 Visitor’s characteristics ....................................................................................................... 96
6.3.2 Means of Travel .................................................................................................................. 98
6.3.3 Duration of stay ................................................................................................................... 99
6.3.4 Visitor’s willingness to pay a higher entrance fee ............................................................ 100
6.5 Results from the Regression Analysis ...................................................................................... 101
6.6 The Consumer Surplus ............................................................................................................. 103
7. SUMMARY OF MAJOR FINDINGS, CONCLUSIONS AND RECOMMENDATIONS ......... 105
7.1 Summary of major findings ..................................................................................................... 105
7.1.1 Socioeconomic characteristics .......................................................................................... 105
7.1.2 Food security ..................................................................................................................... 106
7.1.3 Park resource using ........................................................................................................... 106
7.1.4 Livestock, human and crop damaging nature .................................................................... 107
7.1.5 Natural calamity ................................................................................................................ 108
7.1.6 Skill development .............................................................................................................. 108
7.1.7 Park management activities and cooperativeness ............................................................. 109
7.1.8 Benefit Cost ratio of Chitwan National Park ..................................................................... 110
7.1.9 Visitors characteristics ...................................................................................................... 110
7.2 Conclusion................................................................................................................................ 110
7.3 Recommendation ...................................................................................................................... 113
8. LITERATURE CITED .................................................................................................................. 116
9. APPENDICES ............................................................................................................................... 127

Aryal, Maniratna: Final Report
LIST OF TABLES
Table 1: Distribution of the Respondents of Bachhauli VDC by gender (2008) .......................... 68
Table 2: Distribution of different level of income from different sources, 2008, (NRs. “000”) .. 73
Table 3: Different economic status and food security position of the Respondents (2008) ......... 73
Table 4: Alternative sources of earnings of the Respondents to cope food deficiency (2008) .... 74
Table 5: Response of the Respondents for their khar/khadai requirement (2008) ....................... 74
Table 6: Perception of Respondents towards khar/khadai collection period (2008) .................... 75
Table 7: Various sources of energy used by the Respondents for cooking (2008) ....................... 76
Table 8: Sources of collection of firewood by the Respondents in the Bachhauli VDC (2008) .. 76
Table 9: Distribution of livestock of the Respondents in Bachhauli VDC (2008) ....................... 78
Table 10: Relationship of Park management with other related variables (2008) ........................ 87
Table 12: Annual savings of Baghmara Buffer Zone Community Forest in different years (NRs.)
....................................................................................................................................................... 92
Table 14: Annual net income from one katha of cultivated land (Income from Agriculture) ...... 95
Table 15: Number and Percentage of visitors’ Nationality and sex composition (2008) ............. 97
Table 16: Age distribution of visitors’ visiting the Chitwan National Park (2008) ...................... 97
Table 17: Annual income of sampled tourist visiting the Chitwan National Park (2008) ............ 97
Table 18: Occupation of tourist visiting the Chitwan National Park (2008) ................................ 98
Table 19: Means of travel used by tourist to visit the Chitwan National Park (2008) ................. 98
Table 20: Package tour and Average cost per package of tourist in Chitwan National Park ....... 99
Table 21: Average days spent in Chitwan and Nepal by tourist (2008) ....................................... 99
Table 22: Visitors reporting their willingness to pay more to visit Chitwan National Park ....... 100
Aryal, Maniratna: Final Report
LIST OF FIGURES
Figure 1: Principle of Buffer Zone Management .......................................................................... 18
Figure 2: People participation in resource management ............................................................... 19
Figure 3: Community Forest and its meaning ............................................................................... 20
Figure 4: A relational Framework on Forest Resource and Poverty Reduction ........................... 35
Figure 5: Map of Nepal showing Chitwan district........................................................................ 48
Figure 6: Map of Chitwan District showing the Chitwan National Park and Buffer Zone .......... 49
Figure 7: Buffer Zone Management, Biodiversity Conservation and Livelihood Improvement . 51
Figure 8: Overall research process ................................................................................................ 61
Figure 9: Map of Chitwan showing Bachhauli VDC (Study area) ............................................... 67
Figure 10: Household distribution of Baghmara Buffer Zone Community Forest Users Group . 68
Figure 11: Distribution of economically active population of the Respondents by gender .......... 69
Figure 12: Distribution of the Respondents of Bachhauli VDC by ethnic group (2008) ............. 70
Figure 13: Major occupation of the respondents of the Bachhauli VDC (2008) .......................... 71
Figure 14: Educational attainment of Respondents in Bachhauli VDC of Chitwan (2008) ......... 72
Figure 15: Feeding system adopted by the respondents of the Bachhauli VDC .......................... 79
Figure 16: Frequently reported crop damage by wild animals in the Bachhauli VDC (2008) ..... 79
Figure 17: Wild animals causing damages in the Bachhauli VDC of Chitwan ............................ 80
Figure 18: Different trainings taken by respondents of the Bachhauli VDC of Chitwan (2008) . 83
Figure 19: Perception of respondents in community development by community forest ............ 85
Figure 20: Relationship of Park administration with the local people of Bachhauli .................... 87

Aryal, Maniratna: Final Report
LIST OF APPENDICES
Appendix 1: List of Declared Protected Areas of Nepal
Appendix 2: List of Buffer Zone declared National Park of Nepal
Appendix 3: List of Buffer Zone of Chitwan District
Appendix 4: Overview of Chitwan National Park
Appendix 5: Overview of Chitwan National Park Buffer Zone
Appendix 6: Total number of households in BBZCF Users Group (Ward 1, 2, 3 and 4)
Appendix 7: Number and Percentage of ethnic groups of the Bachhauli VDC
Appendix 8: Number and Percentage of major occupation of the Respondents
Appendix 9: Feeding system adopted by the locals of buffer zone (2008)
Appendix 10: Wild animals causing damages to crops, livestock and human in study area
Appendix 11: Effectiveness of measures to control crop raids
Appendix 12: Possibility of monsoon flooding in the study area
Appendix 13: Satisfaction towards the compensation of loss caused by wild animals (2008)
Appendix 14: Types of training participated by the Respondents of the Bachhauli VDC
Appendix 15: Consequences of tourism perceived by the Respondents
Appendix 16: Respondent’s perception of community forest in community development
Appendix 17: Value of resources harvested by local community
Appendix 18: Estimate of Net monetary contribution from resources harvested during grass cutting
period to local economy
Appendix 19: Income of Chitwan National Park in different years
Appendix 20: Estimated total monetary value of resource harvested from CNP during cutting season
Appendix 21: Annual income of BBZCF in different years
Appendix 22: Annual expenditure of BBZCF in different years
Appendix 23: Estimated total monetary value of firewood and fodder: deficit assumed to be met from
CNP
Appendix 24: Direct benefits derived from Chitwan National Park (2008)
Appendix 25: Direct Cost to collect such forest products
Appendix 26: Number of tourist visiting Chitwan National Park in different years.
Appendix 27: Total value of benefits generated by Park in 2008

Aryal, Maniratna: Final Report
ACKNOWLEDGEMENTS
First, I would like to thank the South Asia Network of Economics Research Institute (SANEI) and
Institute of Agriculture and Animal Science (IAAS) for funding and organizing the research
project. I wish to express gratitude to Professor Dr. Durga Datta Dhakal, the Dean, and Professor
Dr. Resham Bahadur Thapa, Assistant Dean (Academic) for their co-operation.
I am greatly indebted to Mr. Jay Prakash Dutta, Major advisor of my research work for his conti-
nuous guidelines and valuable suggestions for completing this work. I am also equally indebted
to Dr. Punya Prasad Regmi and Dr. Keshab raj Pande, members of my advisory committee for
providing constructive comments, suggestions and inspiration during the course of report prepa-
ration. The Department of Agricultural Economics, IAAS is also acknowledged for providing
valuable ideas for final report preparation during the entire period of study. I would like to ex-
press thanks to the Directorate of Research (DOR) for providing technical help for the prepara-
tion of this report.
It is my pleasure to acknowledge all the staff of Chitwan National Park, Department of National
Park and Wildlife Conservation (DNPWC) and National Trust for Nature Conservation (NTNC),
for their kind co-operation and permission to conduct the survey research in and around as well
as inside the Park. I cannot forget the help provided by the Januka, Prakash, Yadav, Sugan, Go-
kul, Sudip and Samita Dahal, Prembadha during field survey, and the support provided by the
Basu Dhungana (President of MrigaKunja Buffer Zone) is highly acknowledged.
My friends Indra, Ramkumar, Sarita, Dinesh, Huma, Rajendra Koirala, Asmita, Rawati Poudel,
Tika Ram, brothers Umesh, Arun, Basista, Promod, Krishna, Srijan, and sisters Sangita, Madha-
vi, Namoona, Nabina are acknowledged for their kind co-operation entire period of study at
IAAS.
I would express thanks to my beloved parents Mr. Homnath Aryal and Mrs. Ramkali Aryal who
encouraged me to study master degree. I am thankful to my relatives Goma, Kalpana, Ramu
Acharya, Gangadhar Subedi, Bipan, Monika, Nikita, Manju Aryal and brother Manohar for their
encouragements and supports during the entire study period. I am grateful to the Local residents
of Baghmara Community Forest of Chitwan district and tourists for their good hospitality and
valuable information to carry out this work.

Aryal, Maniratna: Final Report
GLOSSARY OF TERMS
Brahmin: A caste of Aryan origin, follow Hindu Kush region
Chettri: One of the castes of Aryan origin
Gurung: A caste of Tibeto-Burman origin, mainly found in mid -hills of Nepal
Occupational caste: A caste recognized by their own professionalism
Tamang: A caste of Tibeto-Burman origin, like as Gurung
Tharu/Darai: A caste of aboriginal type commonly found in Terai belt of Nepal

Aryal, Maniratna: Final Report
ACRONYMS
ACF Area Conservation Facility
API Animal Preventive Infrastructure
BCC Biodiversity Conservation Center
BCF Barandabhar Corridor Forest
BNP Bardia National Park
BS Bikram Sambat
BZ Buffer Zone
BZCFUG Buffer Zone Community Forest Users Group
BZDC Buffer Zone Development Council
BZMP Buffer Zone Management Plan
CFUG Community Forest User Group
CNP Chitwan National Park
CP Close to Park
DAG Disadvantaged Group
DFO District Forest Office
DNPWC Department of National Parks and Wildlife Conservation
ECOS Ecological Service Centre
EPI Erosion Preventive Infrastructure
FECOFUN Federation of Community Forest Users, Nepal
FY Fiscal Year
Ha/ha Hectare
HH (s) Household (s)
GHG Green House Gas
G/N Government of Nepal
HRD Human Resource Development
IAAS Institute of Agriculture and Animal Science
ICF Internal Credit Facility
ICIMOD International Centre for Integrated Mountain Development
ICS Improved Cooking Stove

Aryal, Maniratna: Final Report
INGO International Non-Governmental Organization
IUCN International Union for Conservation of Natural Resources
Km Kilometer
MFSC Ministry of Forest and Soil Conservation
MOPE Ministry of Population & Environment
MPFS Master Plan for the Forestry Sector
m Meter
No. Number
NPC National Planning Commission
NTFP Non Timber Forest Product
NGO Non-Governmental Organizational
NRs Nepalese Rupees
NTNC National Trust for Nature Conservation
PA(s) Protected Area (s)
PCP Participatory Conservation Programme
PPP Park and People Programme
PRA Participatory Rural Appraisal
SNV/BSP SNV/Biogas Support Programme
Sq. Square
SLC School Leaving Certificate
SPSS Statistical Package for Social Sciences
TCN Timber Corporation Nepal
TDN Total Digestible Nutrient
UC (s) User Committee (s)
UG (s) User Groups
UNDP United Nations Development Programme
USA United States of America
VDC (s) Village Development Committee (s)

Aryal, Maniratna: Final Report
EQUIVALENTS
AREA
1 Hectare = 30 Kattha
= 19.66 Ropani
1 Ropani = 508.5 m2
MONTH
Nepali Calender Gregorian Calendar
Baishakh Mid-Apr/mid-May
Jestha Mud-May/mid-June
Asadh Mid-June/mid-July
Shrawan Mid-July/mid-Aug
Bhadra Mid-Aug/mid-Sep
Ashwin Mid-Sept/mid-Oct
Kartik Mid-Oct/mid-Nov
Mangsir M-Nov/mid-Dec
Poush Mid-Dec/mid-Jan
Magh Mid-Jan/mid-Feb
Falgun Mid-Feb/mid-Mar
Chaitra Mid-Mar/mid-Apr
Exchange rate:
1 US$= NRs. 68

Aryal, Maniratna: Final Report
ABSTRACT
This study assesses the conflict management of Buffer Zone in Chitwan district during the year
2007/08. A survey was conducted to collect information from User Groups by taking a sample of 203
members comprising 41 Rich, 67 Medium and 95 Poor family of Bachhauli VDC (Ward No. 1,2,3,
and 4) of Chitwan district by using stratified random sampling technique, 20 Park staffs were se-
lected and interviewed to gather information. Eighty tourists were selected randomly to evaluate the
recreational value of Park. It was found that the major causes of conflict were insufficient kharkhadai
collection period, ineffectiveness of animal preventive measures, inadequate compensation to human,
domestic animals and crop damage, and monsoon flooding. The trend of utilization and collection of
natural resources in three categories did not varied significantly but the dependency of poor was
much more than other categories. Most of the poor families were dependent on Park resources than
other two categories due to illiteracy, lack of opportunities to sustain livelihood. Modern energy
technologies for cooking materials were commonly used by higher caste but occupational and abori-
ginal ethnic groups were still heavily dependent on fire wood. This study showed that livestock was
an important earning source where stall feeding was commonly started in the Park vicinity area. The
negative attitude was fostered by the ineffectiveness of the adopted control measures and inadequate
compensation. The tourism created employment opportunities to local people but it was unplanned
and location specific. Since the programme has focused in both community development and conser-
vation awareness activities, however, the study showed that it emphasized only public infrastructure
development instead of sensitizing the members towards the conservation issues of protected areas.
To enhance conflict management efficiently, the policy recommendations are made focusing the ma-
jor conflicting issues in natural resource sharing. The study examined how much Park visitors are
willing to pay to visit and enjoy the Park. Annual benefits from the Park were considerable-the total
annual consumer surplus or economic benefit obtained from recreation in the Park was approximate-
ly NRs. 23 million (US$ 34,21,162.7). Various factors influence the visitors -these include travel
cost, household income, and the quality of the Park. Improvements in quality of the Park were likely
to increase recreational benefits. The study recommends that a Park entrance fee of US$ 15 per per-
son be introduced, which could be utilized for Park management.
Keywords:, National Park, Resource utilization, Benefits of Park, Conflict, Community forest, Buf-
fer zone, Nepal, Travel cost method, Total recreational value

Aryal, Maniratna: Final Report
1. INTRODUCTION
1.1 Background Information
Nepal is a landlocked country with the total geographic area of 1,47,181 Km2 (MOAC, 2006)
sandwiched between the two largest and most populous nations of the World-China and India. It
is located between 800 15’ and 880 10’ East longitude, and 260 20’ and 300 10’ North latitude
(MOPE, 2006). From the agricultural perspective, its territory is commonly divided into three
zones the Mountains in the North, the Hills in the Middle and the Terai plains in the South, stret-
ching from East to West. The average length of the country is 885 km from east to west and the
width varies from 145 km to 241 km, with a mean of 193 km north to south. Hills and high
mountains cover about 86% of the total land area and the remaining 14 % are the flatlands
(GN/MFSC, 2002). Altitude varies from some 67m above sea level in the Terai to Mount Everest
at 8,848m, the highest point in the world.
Nepal possesses 118 ecosystems, with 75 vegetation and 35 forests, where 246 flowering plants
are recorded as endemic. It is estimated that more than 6,500 species of flowering plants, over
350 species of lichens, 175 mammals’ species, 836 bird species, 147 reptiles and amphibian spe-
cies, 180 species of fish, 640 species of butterfly and over 6,000 species of moth are found in
Nepal (MFSC, 2002). Biodiversity conservation and economic development depends upon a bal-
ance between economics, environment and social values.
Endowed with unparallel natural beauties, Nepal reigns as a centre of attraction for all mankind
who consider natural areas as a common heritage. The contrasting topography, a wide variety of
climate and a diversity of flora and fauna have all enchanted naturalists who seek inspiration
from clean water, refreshing air and the serene beauty of the high Himalayas. A wide range of
ecological conditions, including the glaciers of the Himalaya, verdant landscapes of the mid
mountains, tropical forests and the fertile plains of the south, exist within a short span of about
200 Km. Forest cover approximately 31 % of the hilly and mountainous regions of the country
but these are receding under the combined pressure of population growth and increasing demand
for fuel wood and timber, about a decade age the forest area of Nepal was estimated at 6.4 mil-
lion ha but at present it is only 4.4 million ha.
Over 78 % of the nation’s energy is met by forest products and each person consumes one cubic
meter of wood per year for this purpose. Nepal’s more than 16 million people depend heavily on

Aryal, Maniratna: Final Report
its natural resources as 90 % of the people drive their livelihood from agricultural and allied ac-
tivities. The destruction of forest ecosystem was especially tragic when it results in the disap-
pearance of species which have a small geographic range and are adapted to a narrow range of
habitats. National Parks and other protected area offer the best possible opportunity to save at
least some representative samples of those ecosystems (Upreti, 1985). In 1970, King Mahendra
approved a conservation programme which initiated the establishment of national Parks and wild
life reserves in areas of Nepal chose specifically to represent the country’s unique habitats.
Consequently, with the declaration of Parks and reserves, many people have been legally re-
strained from using their traditional rights to these resources. Those people living outside the
boundaries have no legal resource to procure compensation for their lost benefits which com-
pelled them to engage themselves in prohibited activities such as grazing animals and smuggling
firewood, timber, grass/fodder from within the boundaries, wild animals’ depredation, collection
and utilization of wild edibles, fishing etc.
The buffer zone (BZ) of Chitwan National Park was declared in 1996 AD (Appendix 2), which
spread over various parts of 4 districts namely, Chitwan, Makawanpur, Nawalparasi and Parsa
and inhabited by a multi-ethnic population of about 2,23,260 people. After the advent of anti-
malaria campaign, in 1950 to 1960s and construction of roads linking Chitwan with other parts
of the country, the forests were cleared up for better agriculture. The wild animals compelled to
move into the degraded forests. The grasslands form a diverse and complex community with
over 50 species. The main attraction of Chitwan National Park is its wilderness, forest, grass-
lands and wetlands with great opportunities to sight innumerable varieties of wildlife in their
pristine natural habitats.
In Nepal, National Parks and wildlife conservation act was enforced in 1973 which provided a
legal basis for the management of protected areas. In Nepal, five categories of protected areas
system are operating under the Department of National Parks and Wildlife Conservation
(DNPWC) namely: National Park, wildlife reserves, Hunting Reserve, Conservation Area, and
Buffer Zone (Chaudhary, 1998). To date Nepal has 21 protected areas which cover approximate-
ly 18 % land of the country (Journey to Kathmandu, 2000) (Appendix 1). The latest development
in the protected areas system is the declaration of buffer Zone- A zone, peripheral to the national
Parks or equivalent reserve, where restrictions placed upon resource use or special development
Aryal, Maniratna: Final Report
measures are undertaken to enhance the conservation value of the area is called buffer zone
(Chaudhary, 1998). Management activities for Buffer Zone are designed as a long term goal of
minimizing the resource dependency of local people on the protected area (Ishwaran, 1992, cited
in Chaudhary 1998). Ecotourism can play an important role in ensuring both natural resource
conservation and economic growth. Because of ineffective capture of ecotourism revenues, al-
ternative land uses that provide greater short run returns, such as logging, agriculture, and cattle
grazing seem profitable even on public lands. The result is often deforestation, soil erosion, wa-
tershed degradation, and irreversible loss of bio-diversity.
It is realized that the experience of the last three decades of an operational protected area man-
agement system have increased populations of endangered wild animals and enhanced the con-
servation of Nepal’s unique natural and cultural heritage (MFSC, 2005). They have previously
always been excluded from making efforts and from sharing the conservation benefits. Realizing
the fact; the Department of National Parks and Wildlife Conservation (DNPWC) has imple-
mented the buffer zone management program for the participation of the local communities in
the Buffer Zone of Chitwan National Park since 1994 (PCP, 2006).
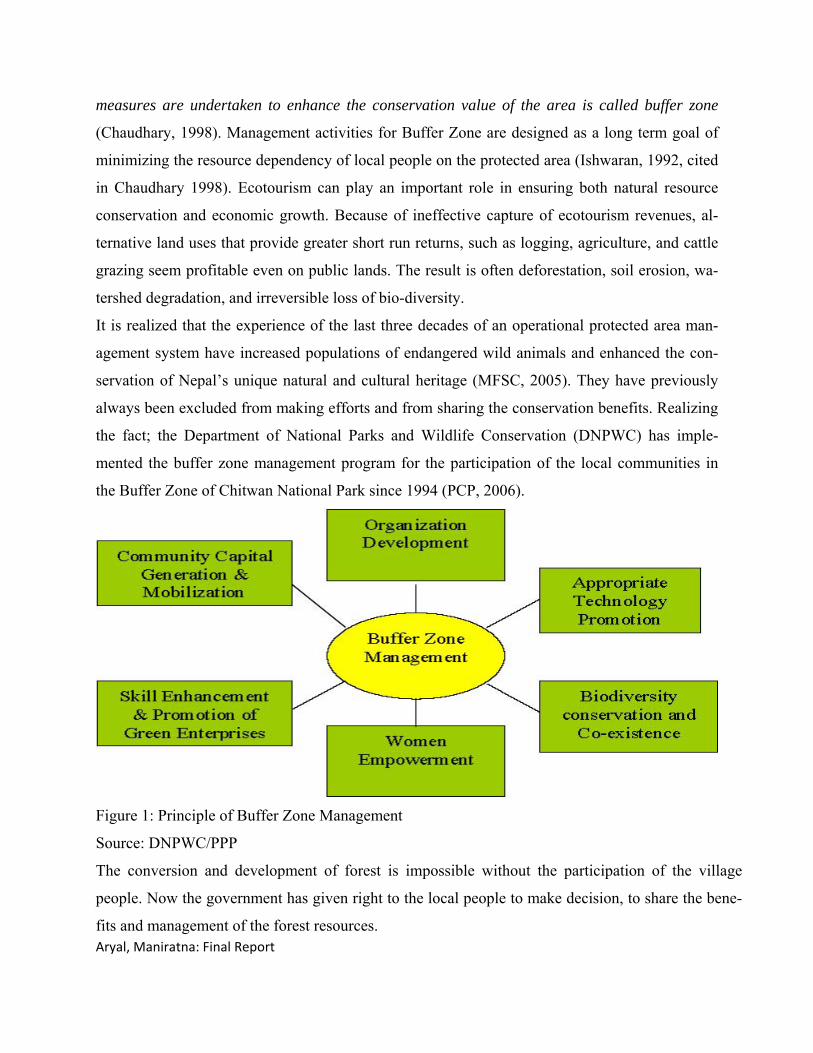
Figure 1: Principle of Buffer Zone Management
Source: DNPWC/PPP
The conversion and development of forest is impossible without the participation of the village
people. Now the government has given right to the local people to make decision, to share the bene-
fits and management of the forest resources.

Aryal, Maniratna: Final Report
In developing countries, governments are often strapped for resources to protect, conserve and sus-
tainably use natural resources. In such situations, ecotourism can play an important role in ensuring
both natural resource conservation and economic growth. A growing body of literature stresses the
role eco-tourism can play in managing National Parks and protected areas. In developing countries,
Park entry fees are often low, or sometimes non-existent, generating little revenue therefore for Park
management. Further, whatever tourism revenues that exist are frequently merged with other gener-
al sources and not earmarked for Park maintenance. Because of the ineffective capture of ecotourism
revenues, alternative land uses that provide greater short-run returns, such as logging, agriculture,
and cattle grazing, seem profitable even on public lands. The result is often deforestation, soil ero-
sion, watershed degradation, and irreversible loss of bio-diversity.
The potential benefits from charging user fees and using differential pricing in national Parks are
significant. User fees are a mechanism to capture the public benefits of ecotourism, which often ac-
crue primarily to the private sector. They can also be used to reduce visits to areas that suffer from
overuse and ecological damage. Developing countries have little experience in guiding natural re-
source managers to design effective pricing strategies. Analyses that assess the impacts of user fees
and differential pricing are needed so that appropriate policies can be devised and implemented
(Chase, et al., 1998).
Figure 2: People participation in resource management
By people’s participation, once they are aware about the forest resources and feel, the forest is their
own wealth, a treasury and a heritage of the society, then the development of forest is not so diffi-
Forestry profes‐sional
Determine strategy Identifying problems
Users group
Implement and management

Aryal, Maniratna: Final Report
cult. Community forestry can be defined as any form of forest activity undertaken specially and
principally to provide commercial benefit to the local people living in the vicinity of forest area
which involve them directly in its management. In 1978, community forestry program was launched
in Nepal. Community forest provides tangible as well as intangible benefits which are directly re-
lated.
All the national Parks of Terai of Nepal constitute the same topographical and ecological compo-
sition because these areas are the new settlements of the migrated people of the hills and moun-
tain areas. Further, there is uniformity in these national Park/reserves where the PPP has been
executed since 1995 AD. Like other environmental resources and public goods, national Parks
benefit society in many ways. They perform not only ecological functions but also provide recre-
ational facilities to those who visit these Parks. National Parks also help contribute precious for-
eign exchange earnings to national offers.
Figure 3: Community Forest and its meaning
S
Community forestry provides
F
O
E
R
T
Food Fiber Fuel wood Fodder Fertilizer
Rain Resin Recreation Rubber
Energy Employment Entertain Erosion control Environment
Soil Spot goods shipbuilding Sericulture
Timber Tourism Transport Turpentine Ted leaves
Oxygen Organic matter Oil seed Ornamental

Aryal, Maniratna: Final Report
1.2 Statement of Problem
An increasing population might be the biggest threat for the existence of the national Park; the
human influence is a major concern for the Park. The realization of severe disastrous impact
caused by deforestation on biodiversity, land degradation and water resource degradation re-
sulted into the establishment and management of national Parks during 1970s (Nepal and Weber,
1995). Until 1970s, most conservation laws and designation of protected areas as national Parks
in developing countries followed the western conservation paradigm, which advocated the exclu-
sion of local people and their subsistence forest-based activities to save bio-diversity. The crea-
tion of protected areas has indeed saved some endangered wildlife species from the verge of ex-
tinction, but in the process it has also alienated subsistence, agriculture based local people as
they are denied access to or restriction on the use of Park resources which they had been tradi-
tionally dependent to meet basic needs (Sharma, 1990; Wells et al., 1992). Local people have to
endure the wrath of depredating wild animals without any compensation. The wild animals of
Parks are known to raid crops and kill or injure livestock and human beings.
Establishment of National Park led to create conflict between local stakeholders and National
Park Management authority. The conflict arises due to Park’s prohibition on the free utilization
of forest products and other activities performed by various ethnic groups like fishing, hunting
etc. Mainly Bote, Majhi, Mushahar etc. who are a predominant group living in the buffer zone
are seemed to be affected as well as deprived. These ethnic groups in the area promptly identify
and associate between the policy implied by national Parks and losing their traditional rights, oc-
cupation and thereby livelihood. Social conflicts are common in heterogeneous village with
caste, class and sex differences which in turn, create a clash in resource use between the upper
class and weaker sections of the community (Upreti, 2000). Similarly, Non-Timber Forest Prod-
ucts (NTFP) collection and utilization, fuel wood and timber demand pressure has exacerbated
the conflicting situation, threats to human life (tourism pressure and impact), natural calamity
(flooding and land erosion).
The locals have been indulged into illegal activities like hunting, poaching and logging to the
point that impacted lands become degraded. In addition crop and livestock damage by wild ani-
mals are other serious concerns together with fuel wood and grazing problem. This situation has
led the country to redefine its conservation philosophy towards community-based conservation.

Aryal, Maniratna: Final Report
Park officials face the rash of local people in the form of encroachment, poaching, and wildlife
habitat alternation owing to agricultural expansion and exorbitant collection of forest products.
There is a lack of trust and communication between local people and Park staff that resulted into
clash of interests between different stakeholders.
It has been observed that disputes and conflicts are very common in community managed natural
resources. Even after implementation of PPP, extent of crop damage by wild animals, poaching
of wild animals remained major concern in the buffer zone area. The cost and benefit sharing
patterns show that most of the rich and powerful families in user group capture disproportionate
benefit at the cost of poor. After the implementation of the PPP in Chitwan district, the crops
damaged by the wild animals on private lands, encounters between people and wildlife and
poaching of wild animals by local people has not been resolved efficiently (Upreti, 2000).
In addition, biodiversity is linked to ethical, aesthetic, spiritual, symbolic, cultural, and religious
values of societies all over the world (Rolston, 1981; Mcneely, 1989; Kellert, 1993). Evidently,
loss of biodiversity will have serious repercussions for human kinds. Unfortunately, we are erod-
ing this biological capital at an alarming rate evoking worldwide concern. The off-cited cause of
biodiversity loss is habitat loss and fragmentation, over-exploitation/trade, pollution, and exotic
species. All these variables can be linked directly or indirectly to the unprecedented human
population growth, modernization approach and concomitant erosion in traditional beliefs, norms
and practices, unsustainable land use policy, economic development policies, and the misevalua-
tion of biological wealth.
Nepal has lost a significant amount of its forest cover in short period of time. The inherently de-
pendent nature of the economy of the local people on Park resources requires easy access to the
resources utilized from the forests. Access required by the local people for their subsistence
economy included: perpetual grazing right; independent operation of hotel/lodges/teashops in
major tourist places inside the Park areas; access to the forest for fodder, firewood and wood,
edible fruits and vegetables, medicinal plants or their parts and hunting; and harvest of construc-
tion timber and bamboos. Because of the establishment of the Park management, the local people
obliged to obtain permits from the Park administration for access to these resources and pay
fixed royalties according to the existing regulations.

Aryal, Maniratna: Final Report
There are numerous causes, which lead to conflict between the local people and Park manage-
ment. Pressure on natural resources, especially land and forest, in order to meet daily needs such
as food, fuel wood and fodder requirements are the major causes of conflicts at the boundaries of
Protected Areas (PA). The foremost cause is the crop damage and livestock depredation by wild-
life going outside the Park. Another equally important cause is the restriction imposed on the use
of forest resources, which are available only inside the protected areas. The protection of biodi-
versity resources has come into direct conflict with the traditional linkages and needs of com-
munities which use these resources for survival. The population and its associated demands are
exerting pressure on the natural resources, which in many cases are already at crisis point
(IUCN, 2003).
1.3 Research Rationale
It is becoming increasingly necessary to broaden our knowledge about the consequences of on-
going environmental changes and, at the same time, to learn how about combat some of the de-
trimental effects, which have already occurred (Brinck et al., 1998:84-89). In this regard, any
practical natural resource conservation strategy requires a careful assessment of the nature of the
conservation problems faced by any country. The documentation of the views and perception of
nature and conservation found among the rural population and integration of these beliefs and
corresponding empirical realities are every important in the context of linking conservation and
development (Gomez-Pompa and Kaus, 1992:271-279).
The mountain environment of Nepal is a striking example of conditions where conservation re-
quirements clash with the challenge of fulfilling the basic needs of the ever-growing population.
Without any appropriate land-use planning and management, bio-diversity will remain threat-
ened by ever faster and vaster impoverishment, which will hinder or even reverse economic de-
velopment, unless the latter is guided and environmental policy that sustains bio-diversity. This
stress the necessity of reconciling the rationale of conservation with issues like land use and land
ownership, rights of access, and decision and control over natural resource utilization.
It is also sensible and useful to understand the socio-economic processes, which influence wild-
life human activities, along with the impact of the establishment of the buffer zone around the
Park and related conservation policies on the livelihood of the local people. The resource con-
flicts between people and wildlife that occur in the vicinity of National Parks have not only been

Aryal, Maniratna: Final Report
a burning issue in the management of national Parks but also, to a great extent, affected the na-
tional economy. If conservation management around the buffer zone is to be addressed, then the
attitudes of the rural communities towards conservation through national Parks must be studied
and the perceived needs and aspirations of the people taken into account.
Upreti (1985) realized that the success of a Park management system as a whole largely depen-
dent upon the understanding of the people and their acceptance of the concept of conservation.
Therefore, the assessment of local population’s understanding of values of national Parks is es-
sential. However, the consequences of social mobilization have not been so effective in the man-
agement of conflict in the community level. Thus, this study brought the in-depth analysis of the
conflict management and socio-economic development initiatives to reduce the dependency of
the local communities in Park resources.
The buffer zone management programme has been successful in reducing friction between the
Park and people, and also in improving the livelihood of the local community since the begin-
ning of implementation of this programme in Chitwan National Park. The Buffer Zone initiative
has served as a stepping-stone to the empowerment of local people, has enhanced their involve-
ment in conservation, and provided for the distribution of conservation benefits to local com-
munities (Budhathoki, 2001).
This field survey based research may be a valuable tool for consensus building in settling dis-
putes between the Park and the people. The broad based information can be utilized in planning
strategies for conflict resolution. It is necessary to explore options for alternative strategies,
which may eventually resolve conflicts, thereby creating harmony between people and nature.
Furthermore, the findings may be very much helpful for upcoming researchers as well as policy
makers and concerned agencies on the direction of sustainable natural resource management
through community development approach. The research findings may also be useful in formu-
lating policies in favor of the poor and ultra poor stakeholders of the buffer zone to ensure an
equitable sharing of the benefits.
Research Questions
1. What was the current socioeconomic status of local people in research site?
2. What were the types of natural resources used by local people?
3. What were the factors causing conflict in buffer zone management?

Aryal, Maniratna: Final Report
4. What was the farmers’ perception about buffer zone?
5. What were the costs and benefits of buffer zone management?
1.4 Objectives
To reconcile the existing problems and make a significant contribution to the lives of future gen-
erations of Park people relationships, the identification of causes of conflicts and impact of so-
cio-economic development initiatives was essential. This study aimed to assess the impact of
conflict management and community development initiative undertaken by Buffer Zone to re-
duce the dependency of the local communities on Park resources.
The overall goal of the study was to evaluate the existing Chitwan National Park buffer zone sys-
tem. The specific objectives of the study were:
• Benefit-Cost analysis of buffer zone management by local people.
• Analysis of factors affecting benefit distribution among the stakeholders.
• Assess willingness to pay by tourist to the Chitwan National Park.
• Estimate the opportunity cost of the Park measured in terms of agricultural production
• Evaluate the impact of the buffer zone creation in conflict resolution between local
people and National Park Management Authority.
1.5 Scope and Limitation of Study
It is obvious that there is conflict between the local communities and Park administration for the
use of Park resources. This scenario is most prevalent in the National Parks of Nepal. So there is
great scope of studying different aspects of socioeconomic development initiatives in the reduc-
tion of dependency of local communities in the utilization of Park/forest based natural resources.
The findings from this study would be helpful for making policies related to Park management,
socio-economic development of buffer zone, willingness to pay incremental fee, creation of
healthy environment between Park and people for study area and other areas of similar condi-
tions.
Respondents were very busy in harvesting and storage their farm products (e.g. Rice, wheat and
Maize) that did not correspond with study time; getting information on time with related person
was difficult. Due to the poor record keeping it was difficult to collect the data concerning finan-
cial situations especially saving funds of some CBO’s from the office of the UCs. The respon-
dents did not want to say openly regarding their household income.

Aryal, Maniratna: Final Report
1.6 Definitions of the Concept
BZMC: A Park/buffer zone level committee comprising of chairpersons of UCs representatives
of DDCs and Chief Warden.
Common property resources (CPR): Common property means a property owned in common
by an identifiable group of people.
Community forestry: It is a CPR managed by local people through Forest User Group (FUG).
Forestry: This includes areas on which timber as well as non timber forest plants are growing
naturally by human beings.
Farm: When the land, labor, and capital are organized into a productive unit that, in agriculture
called farm.
Farm household: A basic unit of farming system hierarchy in which a group of family mem-
bers, who live in a common house, share a common kitchen and have common financial transac-
tions.
Household: A group of individuals related to each other by blood, marriage, or cooperation, liv-
ing in one and the same residential unit, sharing a kitchen and same property.
Livelihood assets: They are assets on which livelihood are built and divided into five categories
(human, social, natural, physical and financial).
Livelihood outcomes: Livelihood outcomes are the achievements- the result of livelihood strat-
egies. Outcome categories can be examined in relation to the more income, increase well being,
reduce vulnerability, improved security, sustainable use of natural resources etc.
Livelihood strategy: The range and combination of activities and choices that people make in
order to achieve their livelihood goals.
Property right: A property, resource, regime is an institutional arrangement of rights and duties
(either explicit or implicit) that establishes the relationship between individuals with respect to a
specific resource. This means that a property regime defines a society’s collective perceptions
about the scarcity and value of resource protected by that regime.
Trench: A kind of barrier dug to control wild animals entering in to the cropland.
User committee (UC): A representative organization formed from the representative of UGs un-
der specific unit or area designed by the warden. According to the BZ regulation the formation of
UC is initiated by the warden.

Aryal, Maniratna: Final Report
User Groups (UG): A community based organization formed by the male and female adult
members of the households living within the BZ under the provision of various PAs rules and
regulations. It is mandatory for UGs to set up saving system.
VDC: Second lowest political boundary having owned autonomous elected body to perform ad-
ministrative and development activities.
Ward: Lowest political boundary, a VDC consists of nine wards.
Direct use value refers to the value obtained when using the commodity for its purpose.
Indirect use value refers to value obtained from using the commodity for other purposes.
Optional value is a value that compares current benefits with future benefits.
Bequest value is the use value for future generations.
Existence value comes from the knowledge that the resource exists and will continue to do so,
independent of the individuals’ current or future benefit from the resource.
Transaction cost: transaction costs that arise when individuals exchange ownership rights to
economic assets and enforce their exclusive rights.

Aryal, Maniratna: Final Report
2. REVIEW OF PAST WORKS
This research intended to study the conflict management and socio-economic development initia-
tives of buffer zone of Chitwan district. Therefore, this chapter deals with review of the past
work related to history of conservation, emergence of conflict in protected areas, and its resolu-
tion strategies inside and outside the country, recreational value of national Park that are relevant
to this study.
2.1 Master Plan for the Forestry Sector
Master Plan for the Forestry Sector (MPFS 1989) can be regarded as a revolution of forestry sec-
tor’s development prepared by the Ministry of Forests and Soil Conservation and approved by
the government in 1989 provides a 25-year policy and planning framework.
• To meet the people’s basic needs for forest products on a sustained basis;
• To conserve ecosystems and genetic resources;
• To protect land against degradation and other effects of ecological imbalance; and
• To contribute to local and national economic growth.
According to Gilmour and Fisher (1991) community forestry in terms of control and manage-
ment of forest resources by the rural people who use them for domestic purposes and as an
integral part of their farming system. Likewise, in a study of the Ministry of Population & Envi-
ronment (MOPE) has shown that forest is the main source of energy for about 70 % of the people
and around 42 % nutrient food to cattle is obtained from the forests.
When national Park and wildlife Act amendment came into existence in 1993, new concept of
buffer zone aroused and it has aimed to protect the peripheral areas of national Park through the
strong community participation. Till today buffer zone concept has brought tremendous changes
in the area of conservation and development in Nepal. These changes can be traced as participa-
tion of local people to conserve forest resources, protection of national Parks, search and devel-
opment of alternatives of forest resource (such as bio-gas, Bhuse Chulho, plantation of grass in
private land, etc.), collection of funds and investment in community development. Reachable
forest area of Nepal is 2.18 million ha (about 52% of total forest area). The biggest reachable
forest area is in Eastern Development Region (0.58 million ha) and the smallest in Western De-
velopment Region (0.26 million ha).
According to MPFS (1998), forestry along with fisheries and agriculture of Nepal contributes 50

Aryal, Maniratna: Final Report
% of GDP, a quarter of which (15%) is contributed by forestry alone. It directly contributes to
household and individual welfare by providing basic forest products and income and employ-
ment opportunities. About 18 % of the total labor force is found to be employed in the forestry
sector. Fuel wood from the forests remains the major source of household energy (66%) fol-
lowed by kerosene (13.5%). Furthermore, Community development through community forestry
is the major thrust of the Nepalese forest management due to its success in succeeding years.
Official report showed that there is about 11,860-forest user groups in the system of community
forestry and 940,491ha land would be handed over and 1,311,771 number household benefited
from the system (CF Division, 2003).
2.2 Initiation of Buffer Zone Concept
The concept of buffer zone was simply to safeguard the biodiversity of the Park and reserve from
the surrounding communities, by providing them with alternative economic opportunities and
resources and reduce conflicts between communities and Parks by compensating them for the
depredation caused by wildlife on their crop fields, livestock and even their lives (Tiwari, 1998
cited in Sherpa, 2000). These alternatives might include ecotourism, employment, agro forestry,
training and other activities which improve the socio-economy of the surrounding communities.
Wells et al., (1992) stated that the “sustainable” use of natural resources will be permitted in buf-
fer zones, which usually includes hunting or fishing, collecting fallen timber, harvesting fruit,
seasonal grazing of domestic stock, and cutting bamboo, rattan or grasses. Activities forbidden in
buffer zones generally include burning vegetation, cutting live trees, and construction of build-
ings.
Thus, the buffer zone is considered as a filter or barrier against human access and illegal use of
the strictly protected core zone or conservation area which extended the habitat. In Nepal, the
concept of buffer zone development was a new policy that has emerged in policy documents in
early 1990s. Traditionally a buffer zone was only a protective layer where land is partially re-
stricted (Mackinnon et al., 1986). It is also said that the Government introduced the buffer zone
initiative after the success of community forestry and conservation area management to mitigate
the diverse impact in the protected areas and increase local communities’ participation. The buf-
fer zone management provides for 30 to 50 % of earned income of protected areas to be spent on
Aryal, Maniratna: Final Report
community development works in consultation with local agencies and communities (NTNC,
1998).
The formal definition of a national Park given by IUCN is “a place where the ecosystem is not
materially altered by human exploitation and occupation, where the Park is protected by the
highest competent authority of the country and where visitors are allowed for inspirational,
educative, cultural and recreational purposes” (Dobson, 1996). A natural, undisturbed strip or
"green belt" surrounding a development or land disturbance activity or bordering a stream or
permanent water body is known as buffer zone. An influential book that emerged from the 1982
World Parks Congress, MacKinnon and others (1990 cited in Wells et al., 1992) offered the fol-
lowing: “Areas adjacent to protected areas, on which land is partially restricted to give an add-
ed layer of protection area itself while providing valued benefits to neighboring rural communi-
ties”. Sayer (1992 cited in Sherpa, 2000) defines a buffer zone as: “A zone peripheral to a na-
tional Park or equivalent reserve, where restrictions are placed upon resource use or special
development measures are undertaken to enhance conservation value of the area”. Buffer zone
may be defined as a process of management of a buffer zone with the objective of optimizing the
political, economic, social, cultural, ecological and intrinsic value of resources. It is usually
adaptive management and participative, with fairness to all groups, allowing for changing values
over time.
The buffer zone Programme in Nepal has been adopting an ecosystem approach to resource con-
servation and a sustainable human development approach to community development, based on
self-reliance and community mobilization principles. It aims to provide an alternative natural re-
source base and livelihood opportunity to buffer zone communities so that their dependence on
Park resources could be minimized, resulting in Park- people harmony for long term biodiversity
conservation. To date buffer zone around 9 protected Areas have been delineated and subsequent
delineation in other protected areas in underway.
The basic economy of the BZ area is agriculture for about 95 % of the households and more than
80 % of total income is derived from agriculture sector. The Park is a major source for the col-
lection of firewood for 31.4 % of the households; buffer zone forest is the dominant source of
firewood supply to the households (44%) in buffer zone (Upreti, 2002). Large number of lives-

Aryal, Maniratna: Final Report
tock in the buffer zone is a constant threat for sustainable management of the forest resources in
the Park and buffer zone (DNPWC/PPP, 2000).
One of such inevitable problems was the hostility between the buffer zone residents and the
Park’s management. By hostility, the animals of the Parks could freely go outside the periphery
and feast themselves on the crops planted, but it would be against the law if the buffer zone’s
animals would go into the Parks (Thapa, 2002). Thus, the Buffer Zone Regulations (1996) of
Nepal give priority to community participation and improvement of local socio-economic condi-
tions as a strategy to conserve biodiversity in a sustainable manner (DNPWC/PPP, 1996). The
Integrated Conservation and Development Projects operate with a goal of linking biodiversity
conservation in protected areas with local social and economic development. The project incor-
porates activities that focus on a Park or protected areas and, usually, the buffer zone around it
which strongly emphasizes the local participation in design and implementation.
2.3 Buffer Zone Management in Nepal
Buffer Zone Area Management Rules, 2052 BS states, Buffer Zone Area refers to area of forest
possibly in affection of National Parks and Reserves announced by the government indicating all
sides natural boundary. Nepal is one of the pioneer countries in combining conservation goals
with the need of local people (Rayamajhi, 2001). The earlier concept of conservation was the
"fences and fines" approach, which failed because of its top-down nature, ignorance to traditional
use rights as well as social and economic interests of local people and lack of local involvement
in decision-making activities (Paudel, 2002). So, the Buffer Zone (BZ) concept was first devel-
oped by UNESCO to provide additional layer of protection around protected area as well as to
bridge the gap between the immediate needs of local people and the long-term objective of Pro-
tected Area (PA) system. The Department of National Park and Wildlife Conservation
(DNPWC) proposed the BZ concept for the protected areas of Nepal sometimes in 1984. After
the fourth amendment of the National Parks and Wildlife Conservation (NPWC) Act of 1973 in
1992 the concept received concrete legal impetus. Now, 28,585 sq km (19.42% of the country)
areas in and around the 9 Protected Areas is declared as the Buffer Zone benefiting more than 44,
9000 population (DNPWC, 2002).
Park and People Programme (PPP) have resulted in the improvement of Park people relationship
thereby leading to living in harmony with nature. Strengthening of buffer zone institutions and

Aryal, Maniratna: Final Report
promoting targeted community development activities along with capacity enhancement of both
the communities as well as Park/reserve staff were the interventions that the programme has un-
dertaken. Community based participatory biodiversity conservation can only be successful if
people's participation is ensured in natural resource management. Participatory conservation ap-
proach is entirely rooted on the acceptance by the people making them the real stewards of con-
servation.
In Nepal, buffer zones and especially buffer zone community forestry were seen as means to de-
fine and demarcate places, where local people may legally extract goods that were either identic-
al to or relevant substitutes for products that are collected in protected areas. The intention was to
resolve Park-people conflicts over resource use. The study showed that products from Chitwan
National Park were of great importance to the livelihoods of local people. Accordingly, the study
illustrates that, irrespective of buffer zone community forestry, there was still gap between local
people's need for supplementing natural resources and their rights to satisfy them on a legal ba-
sis, which was likely to be unsustainable in the longer term.
The extent to which property rights have been transferred to the local level was evaluated and to
whom power has been devolved in the process was assessed. It seems that the current system for
community forestry creates sufficient incentives for local cooperation due to the potential for in-
creased access to important resources and a high perception of ownership of community forests
among the communities. However, emerging institutions vary in the extent to which they repro-
duce favorable resource access conditions for elites and benefit distribution does seem to be
skewed in favor of the wealthy and higher castes, even where management practices on the sur-
face appear fair. National policy creates sufficient but not necessary conditions for achieving
downward accountability, transparency and fairness. Greater attention to these issues is needed
for buffer zone community forestry to better serve the poor and marginalized populations within
user groups.
2.4 Community Forestry in Buffer Zone of Chitwan National Park
Restriction imposed on free access of local communities for basic forest products after estab-
lishment of the Park, reserve and the damage caused by wildlife on Park boundary are the main
causes of conflict between the people and Park management. The Timber Corporation Nepal
(TCN) as buffer zone left a 500m boarder strip of forest along the Northern boundary of Chitwan

Aryal, Maniratna: Final Report
National Park across the Rapti River in the earlier days but it was all vanished later. So after the
buffer zone management initiatives, buffer zone community Forestry User Group (BZCFUG) is
taken as a sub-unit of Buffer Zone User Community Forestry programme which is found to in-
crease progressively in buffer zone of Chitwan National Park. A recent half of the BZ of Chit-
wan National Park is under forest cover (Banskota et al., 1998) and its area is 26,421 ha exclud-
ing the rest part of Barandabhar corridor forest and part of forest between Dumkibas and Tribeni
VDC (DNPWC, 2000). Chitwan National Park has developed its own rule to handover the buffer
forest up to the distance of 300 m from the respective settlements as Buffer zone community
Forest (BZCF) in order to meet the basic needs of local people. 21 BZCFUG, out of 420 formed
groups have been handed over to 6,908 households benefiting 36,718 people of buffer zone. The
area handed over to the local community includes 1971.3 ha (0.29 ha/HH) (CNP, 2007).
2.5 Paradox of National Parks
Wells (1992) reported the expansion of the protected area network in the Third World has laid
the heaviest burden on local communities, which has proven to be a gross disincentive to effec-
tive conservation. In a sample of 100 Parks from 49 countries, Machlis and Tichnell (1985) iden-
tified 1611 specific threats to Parks (McNeely, 1989 cited in Nepal and Weber, 1995). The fun-
damental issue of these conflicts was the customary right of use of Park resources by local
people, which has raised basic questions of humanity survival. The national Parks and protected
areas system in other countries of the world followed the conservation philosophy of the United
States. However, many protected area management authorities failed to adopt appropriate prin-
ciple and guideline to protect their areas against the threats of inevitable human pressures for tra-
ditional exploitation of natural resources (Sharma, 1991).
Cahuita National Park in Costa Rica, which was established without the consultation of local res-
idents because of which, there was, escalated conflict between the Park and the people (Kutay,
1991 cited in Nepal and Weber, 1995). Similar conflicts had occurred in the Amboseli National
Park in Kenya where large mammals confined within the Park are subject to harassment by an
ever-increasing number of visitors (Western, 1982 cited in Nepal and Weber, 1995).
In Nepal, the United States system was tried at the beginning of the national Parks movement. It
was assumed that successful wildlife conservation hinged on the exclusion of those who grazed
their cattle and were dependent on fuel wood and construction timber within the Parks. The habi-

Aryal, Maniratna: Final Report
tants, who were used to the harsh climate of the mountains, were moved to the Terai where many
succumbed to malaria. The Government later decided the North America Model of national
Parks was not suitable for Nepal. In Nepal, the wildlife management measure was started in 1957
under the legal basis of the Wildlife Act 2015 BS (1957) to protect the rhinoceros. This, ‘Rhino
Patrol’ was established in 1957. In 1970, King Mahendra approved the creation of Chitwan Na-
tional Park as being the first National Park of Nepal.
The National Parks and Wildlife Conservation Act 2029 BS (1973 AD), is the main Act related
to the conservation of wildlife and protected areas in Nepal. It provides for the establishment and
administration for protected areas and the conservation of birds and their habitats. The Act was
amended in 2031 BS (1975AD), 2039 BS (1983 AD), and again in 1989 to allow for the estab-
lishment of the conservation areas. In 1993 a provision for buffer zone management was incor-
porated in the Act (DNPWC/PPP, 1996).
2.6 Conflict Resolution Strategy: Establishment of Buffer Zones
There can be no denial that the resolution of conflicts in resource use should be based on an
agreed framework, where the Park interests and satisfaction of the local community converge.
Conflicts can be settled congenially only if the Park authority and local people are convinced that
agreement is possible, although such conflicts exist. The future of the national Parks depends
greatly on the support by the local communities living in adjacent areas.
An integrated approach to the buffer zone concept emerged from the 1982 National Parks Con-
gress in Bali, Indonesia. It was realized that natural resources cannot be ‘locked away’ from the
surrounding population, as protected areas actually represent problems of integrating their man-
agement with development needs of the local population (Nepal and Weber, 1995).
People's participation in forest conservation, access to forest resource and fund generation is
some activities in the forest that help in development of CF and fund mobilization. Development
activities and equitable fund distribution are the part of fund mobilization ultimately contributing
in poverty reduction.

Aryal, Maniratna: Final Report
Figure 4: A relational Framework on Forest Resource and Poverty Reduction
2.7 Participatory Conservation Approach
Before the1980s, in the absence of community participation in decision making processes, many
of the past conservation practices have shown less success than anticipated (McNeely, 1993 cited
in Sherpa, 2000). After 1990s, different global conventions on protected area management and
bio-diversity conservation systems reversed the ‘people-out’ and ‘top-down’ approaches. The
congress also called for community participation and equity in decision-making processes, to-
gether with mutual respect among cultures to be achieved urgently (IUCN, 1993 cited in Poudel,
2003). The Michiru Mountain Conservation Area in Malawi serves as good example of unsuc-
cessful application of top-down approach. The failure to develop real power to the local level
resulted in a lack of people’s participation in Michiru. The top-down approach was unsuccessful,
as the benefits did not trickle down to the poor (Hough and Sherpa, 1989 as cited in Nepal and
Weber, 1995).
Local participation has been described as the empowerment of “people to mobilize their own ca-
pacities, be social actors rather than passive subjects, manage the resources, make decisions, and
control the activities that affect their lives” (Sherpa, 2000). It is now widely recognized that the
participation of local communities and the incorporation of their indigenous knowledge and

Aryal, Maniratna: Final Report
skills are crucial for the conservation and management of natural resources in and around the
protected areas. For the initiation of a people oriented approach in national Park management,
the G/N passed the Himalayan National Parks Regulation 2036 BS. The regulation provided lo-
cal people’s accessibility for the utilization of forest resources and grazing of their animals in the
Park area through permits from National Park Authority. Despite local people’s indigenous
knowledge and skills, they have often been involved in protected area planning and management
processes. This was especially so before the 1980s (Barzetti, 1993 cited in Sherpa, 2000). More
recently, there has been increasing recognition that local communities must be actively involved,
and their needs and aspiration considered, if biodiversity is to be considered (Sherpa, 2000).
Increasing difficulties faced in sustainable biodiversity conservation in mid-eighties provided a
basis for government to realize that the future of conservation can only be ensured by striking a
balance between wildlife and human needs. This gave rise to the initiation of community based
biodiversity conservation in Nepal, a major shift in conservation paradigm, leading to the estab-
lishment of the Conservation Areas in various parts of the country. By the early 1980s, a “con-
servation for Development” approach for saving and western model of Park management was
not going to work in Nepal where most of the people are dependent on natural resources to meet
their basic needs. This led to the realization of a bottom-up approach entailing people participa-
tion, ownership and empowerment in resource management.
In 1983, an autonomous, non-governmental, and non-profit National trust for Nature Conserva-
tion (NTNC) was established with the mandate of conserving natural resources by involving the
local people right from the planning stage to management decisions. The success of the Anna-
purna model has led to a third amendment of the conservation act in 1989 that allows other con-
servation areas to be established on this model.
Nepal became one of the first countries to endorse the principles of the World Conservation
Strategy emphasizing the importance of linking protected area management with the economic
activities of the local communities and prepared its own conservation strategy along this line in
1988 (NCS/N, 1988). Under the new act, user groups will receive all income from the communi-
ty forest and after making necessary disbursements for the development of forest, they may
spend the surplus for other public welfare activities. Those people living outside the Park boun-
daries have not been given legal compensation for the loss of these benefits. In the process of

Aryal, Maniratna: Final Report
modernization, the government assumed control of forests by passing the first forest legislation
in the history of Nepal in 1957 as the ‘Private Forest Nationalization Act’. This act not only un-
dermined the security of tree tenure ship all over the country but also led to weakening of a few,
localized traditional forest control systems. This alienated the common people and led them to
abuse and exploits the forest resources wherever there was an open access situation (Wallace,
1988).
The official policy of encouraging and resettling hill migrants in the Terai in 1950s (MPFS/N,
1988, Wallace, 1988) caused havoc on wildlife, both in terms of habitat loss and poaching.
Chitwan lost two–third of its forests in the span of a decade after the resettling began. Poaching
of rhinoceros for their horns (which commanded enormous prices) became widespread (Gurung,
1983). This led to the passage of first Wildlife Protection Act in 1958 which sought protection of
rhinoceros and their habitat in Chitwan (G/N, 1973).
Notwithstanding the act, the plight of rhinoceroses and their habitat continued. A population of
800 individuals of rhinoceros in 1951 reduced to less than 200 by the early 1960s, a rhinoceros
sanctuary was declared by a royal decree and rhino patrolling was enforced by a special guard
force. Shortly after, about 22,000 squatters were also forcibly removed from the rhinoceros habi-
tat (Dhungel and O’gara, 1991) indicating that the government was adopting the western conser-
vation paradigm, which entails setting aside areas for preservation under government ownership
and banning human residency and resource extraction within National Park (Harmon, 1987). The
Conservation Act of 1973 empowered the government to create and manage protected areas
which prohibited the activities such as land clearing (for shifting cultivation), grazing cattle, and
hunting. Since 1975 the government has kept Nepal Army in the Parks and reserves for the law
of enforcement purpose. All this alienated local people leading to widespread Park/people con-
flicts.
Moreover, the issues of conflict in natural resource sharing of Chitwan National Park is similar
to that of Bale Mountain National Park (BMNP) that were grazing of cattle, collection of fuel
wood from inside the Park’s boundaries, grazing pressure of domestic animals, crop depredation
(Flintan, 2000). The majorities of the local communities of BMNP see no benefits from the Park,
yet incur costs from the damage of crops by wild animals and restrictions on the use of natural
resources in the Park. This is also justified by the Food and Agriculture Organization of the

Aryal, Maniratna: Final Report
United Nations which has categorized the Himalayan Region of Asia as an “acute scarcity zone”
in 1980, where the demands could not even be met by over cutting of resources (Sharma, 1991).
Upreti (1985) stated that there is little understanding of the value of national Parks and little
awareness of the need for environmental conservation to the public of Nepal. This ignorance
could be a major source of conflict between the Park administrations and the local resource us-
ers. Kheral (1993) stated that the conflicts with protected area management can be attributed to
three basic problems: poverty, increasing need for land and processes of development. As a re-
sult of poverty, local people are forced to encroach over national Park territories for food, settle-
ment, and energy. The migration of the people from the mid hills to Terai in search of cultivable
land reflects similar problems in Nepal.
Pye-Smith (1988) argued that the people migrating to Chitwan would undoubtedly exert extreme
pressures on the Chitwan National Park. These pressures increased scarcity of land for settle-
ments. Lack of land and natural resources such as pasture, wood and medicinal herbs is already a
problem for the existing population in Chitwan (Sharma, 1991); a problem which is prominent
everywhere in Nepal. While some conflicts are caused by disagreements related to access and
distribution of community forestry resources, in many cases the causes are actually based on
class, caste, gender, and power but manifest them in the guise of community forestry (Bhatia,
1997). However, the BZMA of Nepal has not made any provisions for aboriginal ethnic groups
of Park which compelled them to remain helpless to survive. Once they were quite isolated and
lived near the forests and rivers for fishing and hunting (Bhandari, 1996 and Pyakurel, 1982).
Dhakal (2002), described that the socio-economic inequalities and ethnic/caste/gender discrimi-
nations; poor governance, demographic pressures, controversial and biased role of media and
civil society organizations are the root causes of conflict to harvest the natural resources. Anoth-
er equally eminent cause of people’s dissatisfaction with the protected areas is the restriction im-
posed on the use of forest resources which are available only inside the protected areas. The local
people did not have the access to alternative energy and energy saving devices, and there is lack
of forest products and grazing land outside the Park. The neighboring is tempted to use the pro-
tected areas for illegal grazing and collection of forest resources, leading to acrimonious relations
with the protection units. Moreover, due to the acute unemployment in the neighborhood, most
people have little purchasing power for their daily necessities. As such the local people are not
Aryal, Maniratna: Final Report
getting adequate benefits from the Parks and reserves, particularly from tourism, since revenue
from the latter mostly flow to outsiders. Overall, the impact of the protected areas on rural com-
munities has been limited.
2.8 Nepalese Context
Establishment and management of national Parks were started as the most important ways of en-
suring utilization of plant and wildlife resources in sustainable manner during 1970s (Hales,
1989). The global awareness had also extended to Nepal giving first birth to Chitwan National
Park in the year 1973 expanding over an area of 932 Sq.km (NTNC, 2002). Chitwan National
Park was declared “World Heritage Site” by UNESCO in 1984 (Shrestha, 2003 cited in Poudel,
2003). The National Parks and Wildlife Conservation Act 2029 B.S. (1973 A.D.), is the main
Act related to the conservation of wildlife and protected areas in Nepal. In 1993 a provision for
buffer zone management was incorporated in the Act (DNPWC/PPP, 1996).
Protected Areas in Nepal was not free from the Park-People conflicts. As reported by Nepal and
Weber (1995) regulations issued by the Sagarmatha National Park Authority provoked much re-
sentment among the indigenous Sherpa, and ever more frequent conflicts between the Park au-
thority and local people in the vicinity of the Chitwan National Park have continued to jeopard-
ize the integrity of that Park.
By the early 1980s, it was realized that a bottom-up approach entailing people participation,
ownership and empowerment is necessary in resource management. The Annapurna Conserva-
tion Area Project in Nepal serves as good example of bottom-up approaches. Here local people
were entrusted with considerable power and emphasized institution-building to foster conserva-
tion efforts and was able to establish village-level institutions.
The Buffer Zone management strategy adopted by Nepal has been fairly successful in demon-
strating strong linkages between social, economic and environmental issues, with an impact on
the conservation of natural resources and livelihood promotion. It is widely accepted that the ex-
isting conservation policies and legal frameworks of Nepal are one of the most people-oriented,
thereby allowing Park managers to share both resources and revenue with the local communities.
It has well defined strategies to achieve equity, sustainability, and harmony (ecological and eco-
nomic) in BZ management. In the case of Nepal, buffer zone management is not only a concept;
it is a well accepted conservation practice. The outputs are multi-dimensional and far reaching,

Aryal, Maniratna: Final Report
and policies and practices are exemplary. As a result, Park-people relations have been slowly
turning from conflict to co-operation, leading to the creation of socially and ecologically stable
areas around the protected areas of Nepal. It has been evident that without having strong (self-
reliant, self-governing and self-functioning) social organization, the true partnership between
Parks and their adjoining communities for the conservation of biodiversity cannot be achieved.
Legal and policy frameworks and appropriate institutional arrangements are very important to
increase the capability and capacity of the people. As the BZ policy and management strategy of
Nepal is based on a careful integration of conservation and development priorities, it is worth
recommending for wider applications with necessary local adjustment. However, it is also desir-
able to examine the strength, acceptance and adoption of this young and innovative conservation
initiative for its further refinement.
2.9 Conservation History
Modernization and population growth have led to the rapid depletion of natural resources. The
increasing pressure on land for agriculture has resulted in rapid deforestation, leading to deserti-
fication in many countries of the third world. Establishment and management of national Parks
has perhaps become one of the most important ways of ensuring the world’s natural resources
are utilized in a sustainable manner. During the 1970s, many national Parks and wildlife sanctu-
aries were established all over the world and by the early 1980s there were more than 2,600 pro-
tected areas in the world covering nearly 4 million square kilometers, established in 124 coun-
tries (Mackinnon et al., 1986).
The Yellowstone National Park of the United States was the first national Park established in
1872 which considered as the milestone in the evolution of the concept of the national Parks
(Mackinnon, 1986). In USA, the national Parks were established for the protection of nature and
natural resources where people were not permitted to harvest in any form from Park resources or
to live within the Park. The United States National Park System enjoys a high level of protection
against private exploitation while making them accessible in a natural condition (Frome et al.,
1990).
Since then, most countries have recognized the value of protected area for their people. In con-
trast to USA Park systems, the British system recognized man as an integral component of the
natural landscape (Nepal and Weber, 1993). There was an apparent distinction in the concept of

Aryal, Maniratna: Final Report
national Parks between these two systems. The western concept and its various approaches to
nature conservation have been widely criticized in the Third World, where realities are so differ-
ent. It has been realized that national Parks are embedded in a wider regional system which is
determined by its population, organization, technology, and environment by which they are sur-
rounded and with which they interact. In less developed countries, the concept of preservation of
natural resources came, most often, from foreign elites: colonial administrators, scientists, busi-
nessmen and affluent leisure seekers. During their period of hegemony, they were able to impose
a variety of Parks and reserves on indigenous peoples and cultures around the world (Allin,
1990).
In this way, the establishment of national Parks in the Third World was mainly adopted from the
U.S. Park Model. Through the years, the establishment of national Parks has had severe, adverse
impacts on the local traditions and beliefs or cultures as such, in some instances resulting in dis-
astrous side effects. Since insufficient attention was paid to indigenous people and their customa-
ry rights, many cultures, which otherwise could have been valuable in reinforcing conservation,
m have vanished gradually. Relocation, obsolescence of cultural values, social disintegration,
economic dependency, unsustainable harvesting and severe conflicts over resources use are some
of the negative impacts of the establishment of national Parks. The increase in population and the
necessity of growing more food for national for survival have led to exploitation of resources
within the Parks. In certain case, the Park has been illegally encroached either by farmers for
crop cultivation or livestock grazing, or by influential persons to exploit rare natural resources
(Nepal and Weber, 1993).
2.10 Participatory Conservation Programme
On the basis of the information received during consultative meetings a core problem “conflicts
between people and Park management” was identified by the project formulation team
(DNPWC/PPP, 1996). This team identified a number of causes leading to this problem which
were the crop damage, livestock depredation by wildlife, heavy grazing by domestic animals in
the Park/forest pasture land. Thus, realizing such situation of buffer zone, the G/N has initiated a
community oriented conservation and development Programme called as “Park and People Pro-
gramme”. Initially in 1995, the Programme was implemented in five Terai’s protected areas:
Sukhalaphanta Wildlife Reserves, Bardia and Chitwan National Park, Parse and Koshi-Tappu

Aryal, Maniratna: Final Report
Wildlife Reserve. Later in 1998, the Programme was extended in two hill Parks: Khaptad and
Rara National Park. The program has three components namely Parks/reserves management,
community development in BZ and corridor forest initiatives outside the buffer zone. The Pro-
gramme advocates a community-based approach to the conservation of Park resources by forging
partnership arrangements between community organizations and Park authorities.
The project document of PPP mentioned that “the project will directly benefit rural communities
living in the buffer zones of adjoining VDCs of the five Terai Parks and reserves with particular
emphasis on the most disadvantaged groups, especially backward ethnic groups, the landless and
women (DNPWC/PPP, 1996). Programme was focused on organizing the scattered mass popu-
lace in broad-based grass root level institutions in order to accomplish self reliant socio-
economic development initiatives (DNPWC/PPP, 1999). Various programmes such as institu-
tional, skill development, community capital generation, conservation education, productive in-
vestment, forestry initiatives and economic development activities have been implemented
through the male and female User Groups.
2.11 Community Mobilization Approach
In Nepal, community mobilization for buffer zone management has been based on the principles
of developing four capitals at the local level has embraced the four approaches. The approaches
are motivating, organizing and mobilizing both men and women into self governing, self func-
tioning and self reliant community organizations; encouraging the mobilization of financial capi-
tal resources through the promotion of community saving schemes; enhancing capacity of com-
munity organizations through training and skills development, and entrusting resource users the
rights to manage natural resources/environmental governance.
Social mobilization raises the skills and the efficiency of its beneficiary households as capital to
buy inputs becomes available. As a result, production and income increase. Increases in incomes
generally lead to increases in consumption and the kinds of improvements in living conditions
that require cash purchases and/or investments (UNDP, 2001). By realizing this fact PCP entered
the communities with the community mobilization approach as the most indispensible measures
to involve the pro-poor families in the people-centered conservation programmes. PCP has im-
plemented various community based biodiversity conservation activities through active involve-
ment of self-governed local organizations in the seven protected areas of Nepal which empowers

Aryal, Maniratna: Final Report
the communities to undertake self-reliant conservation and development activities
(DNPWC/PPP, 2000). As such, the grassroots level organizations are the only most effective te-
net where people exchange their ideas, identify their problems and find concrete avenues for its
resultant solutions. It seems that conflict would arise partly due to the dependence of local people
on Park resources for the maintenance of their livelihood and partly due to the existence of con-
troversial policy decisions which show failure to understand that conservation issues are inex-
tricable linked to examine these facts empirically in case of Park-people conflict.
Social capital
The number of User Groups in the PCP working areas in the buffer zones has crossed 3,678
(male: 1,863, female: 1,736 and mixed: 79) and are gradually being institutionalized. The G/N
has gazetted and declared the Buffer Zone of all the seven PCP working areas. Five Buffer Zone
Management Committees (in Chitwan and Bardia National Parks, Koshi Tappu, Suklaphanta and
Parsa Wildlife Reserves) have been operational and the formation of the Buffer Zone Manage-
ment Committees in Khaptad and Rara National Park is under full swing.
Human capital
The programme has given focus on building the capacity of both the Buffer Zone communities
and the Park/Reserve staff to improve and/or enhance their capability for improved management
and sustainable use of Protected Area resources as well as for Buffer Zone development. As a
result, a strong "green" cadre consisting of more than 123,000 Buffer Zone residents, including
women has been formed to work for conservation and development.
Financial capital
Besides the 30-50 % Park/Reserve revenue sharing mechanism with Buffer Zones, the communi-
ty savings and credit scheme has played a significant role in propelling the programme forward
and providing people easy access to loans at low interest rates without having to depend on other
sources. Seed grants and the Biodiversity Conservation Facility, a revolving fund (approx. NRs,
26.3 million) to finance micro enterprises, are also being provided for Buffer Zone development.
In order to institutionalize these financial mechanisms, 73 cooperative have been operational so
far and 32 more are in the pipeline.

Aryal, Maniratna: Final Report
Natural capital
In order to reduce the pressure on the natural resources of the Protected Areas, the programme
has achieved the following:
• 6,070 hectares of Buffer Zone community forest has been handed over to local users
• 14,196 hectares of potential community forest is under handover process
• Plantation in 1,789ha of land has been carried out by communities in the BZs
• Installation of more than 2,760 methane digester plants
• 100 km of Animal preventive infrastructure (Bio fence)/Stone wall have been erected/
constructed to minimize crop damage.
2.12 Benefits of Chitwan National Park
A survey on grass cutting during 1986 and 1987 showed that 55,379 and 57,391 permits respec-
tively had been issued. The total amount of khar khadai harvested from the Park was about
1,62,592 kg in 1986 and 1,34,625 kg in 1987. The total weight of the harvested resources was
estimated to be about 11,132 mt. its value was estimated to be about Rs. 99,40,393. This is a di-
rect benefit derived from the Park by the local people. Net benefits are calculated after extracting
accounting for travel time and other costs associated with harvesting the resources. It was also
found out that the amount of firewood stolen from the Park during grass cutting season was
equivalent to or exceeded the amount of all grass material removed from the Park (Lehmkuhl et
al., 1988).
2.13 Economic Approaches in Resource Evaluation
Willingness to Pay (WTP) is defined as maximum amount of money that may be contributed by
an individual to equalize a utility change. The technique is based on the principle that the maxi-
mum amount of money an individual is willing to pay for a commodity is an indicator of the val-
ue to him/her of that commodity.
This approach allows individuals to take account of all factors (e.g. disposable income, taste,
education level, recreational benefits etc.) which are important to them in the provision of the
service. For direct measurement of an individual’s WTP for non market goods, the Travel cost
method is attractive. The travel cost approach was based on the presumption that observed beha-
vior can be used to derive a demand curve (consumer surplus) for recreational services by treat-
ing travel cost as surrogate for variable admission price. Usually, the value of benefit or utility
Aryal, Maniratna: Final Report
derived from the Park is often much larger than the fee leaving a large consumer surplus to the
consumers.
Duffield (1984 as cited in Lesser et al., 1997) developed a Travel Cost Method (TCM) to esti-
mate the recreational value of visiting Kootenai Falls in North-Western Montana. He developed
a regression equation for value associated with a visit. Duffield estimated visits per capita as a
function of distance traveled rather than travel cost. He used estimates of value of time and the
unit of costs of travel of the respondents.
Khan (2004) estimated the benefits of establishing and managing the Margalla Hills National
Park near Islamabad using Individual Travel Cost Method (ITCM). The total annual consumer
surplus obtained from recreation in the Park was approximately Pakistani Rs. 23 million (US$
0.4 million). Improvements in the quality of the Park were likely to increase recreational benefits
by a significant 39%. The study recommends that a Park entrance fee of Rs. 20 per person be in-
troduced, which could be utilized for Park management. This would generate nearly Rs. 11 mil-
lion in revenues annually, a sizable amount of money that represents about 4 % of the annual
budget allocated to the environment sector in Pakistan.
Khan (2004) enlisted some of the important works done on economic evaluation of protected
areas using TCM. Chase et al. (1998 cited in Khan, 2004) studied ecotourism demand and the
differential pricing of National Park access in Costa Rica. The study presents conceptual frame-
work and an empirical analysis of the impacts of introducing a differential entrance fee policy at
three national Parks in Costa Rica. Similarly, Grandstaff and Dixon (1986 cited in Khan, 2004)
used the zonal TCM to valuate the Lumpinee Park in Thailand. The consumer surplus of Lumpi-
nee Park was found to be 132 million baht. Kaosa-ard et al. (1995 cited in Khan, 2004) also used
TCM to measure the Khao Yai National Park use value. The TCM estimates showed a direct
benefit of 1,420 baht per visit, of which 870 baht is the consumer surplus.
2.14 Recreation Benefits in an Alpine and Periyar National Park
The recreation benefits to a consumer are a measure of how much satisfaction or utility the con-
sumer obtains from the recreation experience (Loomis & Walsh, 1997). The measurement of
recreation benefits is based on comparing the utility of additional trips with the cost of additional
trips. Consumers will continue to take trips as long as the added utility (or benefits) of another
trip exceeds the price.

Aryal, Maniratna: Final Report
The travel cost method was created by Hotelling in 1946, in a response to a request from the US
National Park Service to find a way to make economic valuations of the benefits of national
Parks. Even though the travel cost method was first created for the valuations of the benefits for
national Parks, it can be used in many different valuations for different kinds of environmental
goods. The first Swedish application of the travel cost method was made for the purpose of esti-
mating the recreational value and water quality for a lake in the southern part of Sweden (Hjalte
et al., 1982).
Christiernsson (2003) estimated the consumer surplus in a travel cost method approach of the
coral reefs at PhiPhi islands to USD 110 millions. In a study performed by Frölander (1999),
where the zonal travel cost method was applied, the consumer surplus of the Victoria Falls was
estimated to USD 300 millions. Bulov and Lundgren (2007) found that the consumer surplus of
Periyar National Park was 15 billion USD by Travel Cost Method.
Aryal, Maniratna: Final Report
3. METHODOLOGY
The methodology consisted selection of the study area, sample size and sampling procedure,
sources of information and collection techniques, survey design and data collection procedure,
and methods and techniques of data analysis. The sample survey design was used for this study.
3.1 Selection of the Study Area
The study area was the command areas of Baghmara Buffer Zone Community Forest, Chitwan
National Park which covered the buffer zone of Bachhauli VDC (Ward number 1, 2, 3 and 4)
and community forest of Mrigakunja Buffer Zone User Committee. The study area was accessi-
ble round the year and the average road distance from the Park/ buffer zone headquarter was
about 26 km, the map of Nepal showing the Chitwan district and map of Chitwan district show-
ing study site are presented in figure 5 and 6 .
Chitwan National Park buffer zone is spread along an area of 750 Sq.km. Baghmara Buffer Zone
Community Forest (BBZCF) is one of the several community forests existing within Mrigakunja
buffer zone located at northern portion of the Park. This community forest belongs to Bacchauli
VDC-1, Chitwan, Nepal with the area of 400 hectares covering 779 households and population
of 4,546. Agriculture and tourism is the mainstay for the majority of the population. BBZCF, as a
result of protective measures has enormous wealth of bio-diversity. Thus, tourists from all over
the world have been attracted to BBZCF to observe wildlife, birds and vegetation. Canoeing and
Jungle-walking is the major attraction for tourists within the site (NTNC, 2002).
3.2 Selection of Members and Sample Size Determination
The target population for this study was the user group’s (UG) member of BBZCG under Mriga
Kunja buffer Zone. The respondents of this Community Forest were categorized into three strata
on the basis of the well being ranking. Well being ranking was conducted according to the local
criteria for the selection of respondents. The council members along with the other key persons
(both male and female) were involved in their respective settlements for this exercise. This type
of category was also used by Dhakal (2005) and Dhital (2004).

Aryal, Maniratna: Final Report
Figure 5: Map of Nepal showing Chitwan district
Figure 6: Map of Chitwan District showing the Chitwan National Park and Buffer Zone

Aryal, Maniratna: Final Report
Figure 6: Map of Chitwan District showing the Chitwan National Park and Buffer Zone
Aryal, Maniratna: Final Report
The criteria of well being ranking defined by users in different wards (1, 2, 3, and 4 only).
• Rank A (Rich)
More than one Bigha (20 Katha) land and Agriculture, tourism and business as the source
of income
• Rank B (Medium)
10-20 Katha land and Agriculture and other sources of income
• Rank C (Poor)
1 to 10 Katha land or land less with Daily wages and Agriculture as the main source of
income.
For selecting sample household, sampling frame was entered into MS excel and sample of prede-
termined size was selected by the help of computer. The appropriate size of participants selected
through the stratified random sampling techniques was surveyed using semi-structured question-
naires.
In case of stratified random sampling, (Miah, 1993)
Where, n = Sample size N = Total population size
Nh = Population size of h stratum Ph and Qh = Stratum population
D = Precision / Reliability = d / z ∑ = Summation
Sample size was determined as: n = 203 (A= 41, B= 67 and C = 95).
A total of 203 households (26.1 %) from 779 households of BBZCF were selected where 41 rich,
67 medium and 95 poor households. In addition, it was assumed that these selected study area
would render a good representation of the entire area. The above classification would obviously
provide ample opportunity to make a comparison in studying the complexities and dynamic of
natural resource conflict and the strategies and processes of resolving the Park – people conflict.
Selection of Park staff and tourists
A total of 20 staffs including both administration and security staffs of Park were selected for the
interview. In case of administration staffs, four wardens, three rangers, three game scouts and ten
security staffs were selected. Beside interview, several group discussions at different time hori-
zon were conducted with them in order to rectify the gathered information.
n = N∑NhPhQh
N2D2 + ∑NhPh*Qh

Aryal, Maniratna: Final Report
A total of 80 tourists were selected randomly for the interview to collect information for the cal-
culation of consumer surplus to maintain the Park quality, and recreational value of CNP.
3.3 Conceptual Framework
The conceptual frame work of the study showed the livelihood improvement through BZ man-
agement programme. Based on the six principle of BZ management (Figure 1), the programme
helps to improve rural livelihood through different activities. Skill oriented trainings help to en-
hance new skills and knowledge. The saving credit fund helps to improve the habit for saving
and establish the community fund which helps to get loans with low interest rate and can estab-
lish small enterprises. People can use their skill and knowledge for the enterprise development. It
helps to improve livelihood of the people. Similarly, formation of Community Based Organiza-
tion (CBOs) helped the flow of revenue for the community development activities. Community
forest plantation and protection of degraded forest helps to secure forest products more easily for
daily requirements to the community.
Figure 7: Buffer Zone Management, Biodiversity Conservation and Livelihood Improvement
Adopted and modified from: Gaire, D. 2006

Aryal, Maniratna: Final Report
3.4 Techniques of Data Collection
The participants were surveyed using participatory approach like Participatory Rural Appraisal
(PRA) tool. For certain research issues not available through participatory approach, individual
methods like key-informants’ interview and individual household (HH) survey has been done.
Reconnaissance survey
Before starting the questionnaire survey, the researcher himself has carried out a field visit of the
study area. The main objective of the visit was to become familiar with different features of the
study area such as the geography, the local community, and Government Organization (GO) and
Non Government Organization (NGO) involvement in the BZ of Chitwan National Park area.
During the reconnaissance survey informal meetings were conducted with key persons asso-
ciated with local NGO, UGs, UCs and Park authorities.
Questionnaires survey
The three sets of interview schedules were prepared for primary data collection from UG mem-
bers, tourist and Park staffs. For the construction of interview schedule, a coordination schema
was prepared to facilitate the identification of concepts and further level of abstraction to differ-
ent dimension based on the objectives of the study. Based on which, different variables were in-
cluded in the interview schedule. In the interview schedule different questions about respon-
dent’s family, income source, major areas of resource base conflict, impact of socioeconomic
development initiatives to reduce the Park dependency of the community, tourism impact, and
Park-people relationship were included. Third set of questionnaire include demographic informa-
tion of tourist, annual income, travel cost, willingness to pay more entrance fee. The majorities
of questions were in multiple-choice form, and were verified by the supervisor to make them
suitable for a field situation.
A semi-structured interview was organized with key informants such as the chair person of a lo-
cal NGO, former BZ development officers, national Park personnel, local leaders, and chair per-
sons of the Buffer Zone Forest Committees, President of Community Forest. During the field
survey, focus group discussion was organized in the Buffer zone area. The main objective of the
focus group discussion was to collect a variety of information before and after the BZ manage-
ment programme, verification of the information collected from the questionnaire survey and
discussion about the livelihood strategies.

Aryal, Maniratna: Final Report
Secondary data collection
The source of secondary data were publication of PPP, PCP, and related organizations such as
books, articles, periodical reports, case studies, laws, by-laws of buffer zone and Park manage-
ment, and so on. Major organization consulted were DNPWC, BZDC, NTNC warden office of
Chitwan National Park, Central Bureau of Statistics, UNDP, ICIMOD and IUCN. Sets of socio-
economic data such as population, age, gender and District Development Committee (DDC) of
Chitwan were consulted.
Pre-testing is the most important for checking the reliability and validity of interview schedule.
The pre-testing interview was done with 15 respondents from three category (5 from each cate-
gory), 5 Park staffs and 15 tourists randomly. Interview schedule was finalized by incorporating
correction made during pre-testing.
3.5 Field Data Collection
After the finalization of the questionnaire, the schedule of field visit was prepared to collect in-
formation with the help of enumerators. The enumerators were oriented about the set of ques-
tions. The data collected during this field survey was recorded for the period of March to May
2008. Respondents were interviewed by visiting their home in the morning and evening time by
considering their leisure time but there were some difficulties in identifying and meeting the res-
pondents. Tourist survey was conducted in hotels and rest places where tourist used to take
launch, breakfast, lodging and taking rest after returning from Park and with the help of nature
guide in Sauraha.
3.6 Methods and Techniques of Data Analysis
The quantitative data being collected using interview schedule was edited and coded before they
were entered into the computer for analysis. The information obtained during the observation
was also considered to describe situation and other activities. Data were analyzed using two dif-
ferent methods.
Descriptive statistics such as frequency, percentage, mean, standard deviation were used for the
analysis of background characteristics of the respondents and summarizing the data. Similarly,
inferential statistics like the chi-square test was used to examine the relationship between the va-
riables under study. The quantitative data obtained from the field was first coded, then the data
entry process was done using an appropriate computer package namely “Statistical Package for

Aryal, Maniratna: Final Report
Social Sciences (SPSS)”, which facilitates the process of data analysis in a more precise and ap-
propriate way (SPSS, 1999). Statistical tools such as the correlation between variables and chi
square were used. Simple statistics such as percentage and frequency count were used to analyze
the socio-economic data gathered from the household survey. Microsoft Excel was used for pro-
ducing descriptive statistics in form of bars diagrams, pie charts and tabular form. In addition, to
test the differences in significance, analysis of variance was used. Regression analysis was used
to estimate the willingness to pay by tourist.
3.6.1 Socio-Demographic and Farm Characteristics
For the descriptive analysis of the study area and population different variables like size of fami-
ly, occupation, education level, and occupation were included. They were analyzed by using de-
scriptive tools such as frequencies, percentage, mean, mode and standard deviations as per the
need.
3.6.2 Calculation of Benefit-Cost Ratio (B/C)
Costs include factors like entry fee, labor costs, salary of the buffer zone personnel, daily wages,
management cost etc. Benefits from the buffer zone may be direct or indirect. Direct benefits in-
clude extraction of natural resources like Timber Forest Products (TFPs) and Non-Timber Forest
Products (NTFPs). Indirect benefits may include recreational benefits, income from tourists and
extension of precious genetic resources. However, the latter is beyond the scope of our study and
will not be included in our research. If it is found that B/C is greater than one, then it can be con-
cluded that buffer zone management is helpful in minimizing conflicts and encroachment of Na-
tional Park by local stakeholders.
3.6.3 Willingness to Pay (WTP)
Travel Cost Method (TCM) was used to calculate WTP by a particular visitor. The TCM enables
an assessment of individual preferences for the consumption of non-market goods. It uses the
cost of traveling to a non-priced recreation site in order to infer recreational benefits provided by
the site, the effect of explanatory variable on WTP to visit the area was studied through the use
of Regression Model. According to Pearce et al., (1994) the total economic value consists of dif-
ferent values which can be seen in equation:
Total economic value = Existence value + Bequest value + Indirect use value + Option value
+ Direct use value

Aryal, Maniratna: Final Report
The indirect use value could in the case of Chitwan National Park be the shelter that it gives to
all life in the Park, whereas the direct use value would be the recreation gained by visiting the
Park. Optional value is a value that compares current benefits of the Park with future benefits.
The bequest is a value that represents the future use of Park for future generations. Existence
value could in the case of Chitwan National Park be the value that represents preserving biodi-
versity inside the Park.
The travel cost method applied surveys for people visiting a non-priced site for recreation; the
data collected from the surveys was data about their number of visits to the site and their differ-
ent costs in reaching the site. This cost can be used to derive the demand function for the site. It
was expected that the higher the cost of reaching a site was, the lower amount of visits to the site
will be made, ceteris paribus. Therefore, the demand curve was expected to be negatively sloped.
Garrod and Willis (1999) described the demand curve as a functional form that can be seen in
equation 1:
V= f (P, S) [1]
Where, V= Visit rate, P = Cost of travel to the site and S = Vector of travel cost to substitute sites
The individual travel cost methods trip generating function can according to Garrod and Willis
(1999) be defined as:
Vij = f (Pij Tij, Qi, Sj, Yi) [2]
Where, Vij = Number of visits made by individual i to site j
Pij =Travel cost incurred by individual i when visiting site j
Tij = Time cost incurred by individual i when visiting site j
Qi = Vector of perceived qualities for the individual i
Sj = Vector of the characteristics of available substitute sites
Yi = Household income of individual i
With this trip generating function the demand for visits to the Park can be derived and from the
demand, the consumer surplus can be derived. The most basic application of the travel cost me-
thod would only look at what people actually pay for reaching a site, leaving out other important
factors that may influence the visitors decision on visiting a site, the most important ones will
now be explained (Garrod and Willis, 1999). When travelling to a site time was spent on reach-
ing the site, time which instead could have been used for other activities, such as work. But most

Aryal, Maniratna: Final Report
people are not able to freely choose how many hours to work, as this was decided in their con-
tracts. So adding the entire wage rate might cause an overestimation of the recreational value.
There is uncertainty in the economic literature if the wage rate should be used or not, and if it’s
used how much of the wage rate that should be added. Previous studies by Cesario (1976) sug-
gest that one third of the hourly wage rate should be calculated for the time cost.
For visitors travelling a longer distance to visit the site it is more likely that their entire trip has
many destinations, and therefore if assigning the entire travel cost to the specific site would
cause an overestimation of the site’s recreational value (Garrod and Willis, 1999). This was
known as the problem with multiple visit journeys. If there is a lack of substitute sites an overes-
timation of willingness to pay may occur. A site for recreation that has a lack of substitute sites
may get visitors to choose to visit this site just because there is a lack of substitute sites for
recreation; therefore their willingness to pay is lower than what they are actually paying to visit
the site (Turner et al., 1994).
Congestion could be a problem for the application of the travel cost method. Congestion of a
Park is that total amount of visitors reaches a level where the Park is not able to accept any more
visitors due to supply limitations. For example if there is a finite amount of visitors that can go
on a boat ride in the Park and the boat is full, then the demand exceeds the supply. The result of
the demand not being satisfied could results in an underestimation of the demand function, this
leading to an underestimated consumer surplus (Garrod and Willis, 1999).
Model for the Consumer Surplus
The consumer surplus is the difference between what an individual is willing to pay at most and
what was actually paid for the use of a resource (Pearce and Turner, 1999). The consumer sur-
plus was used as a monetary estimate for the recreational value of the National Park. The con-
sumer surplus can be derived by first creating a trip generating function, in this case:
Vij = f (Pij, Tij, Qi, Sj, Yi),
So that the consumer demand for the site can be derived. This relationship is expected to be neg-
ative, so that the number of visits decreases as travelling cost increase.
According to Garrod and Willis (1999), consumer surplus can be defined as:
Consumer surplus = -V/Pij [3]
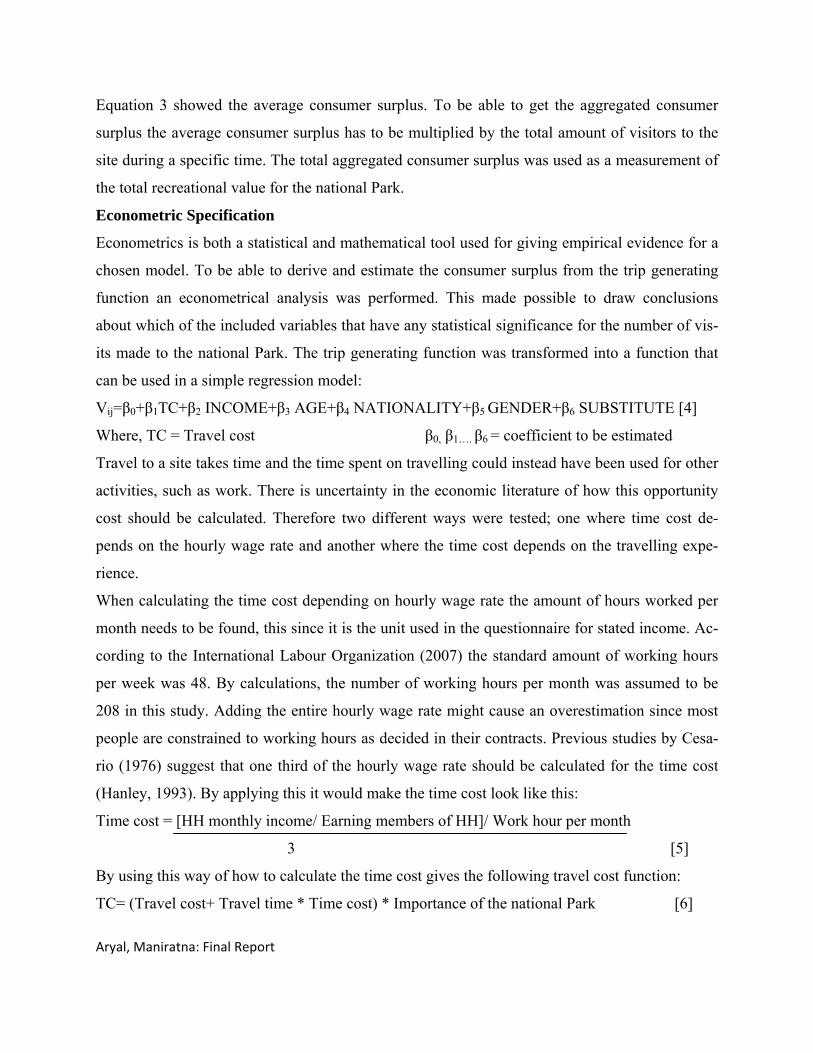
Aryal, Maniratna: Final Report
Equation 3 showed the average consumer surplus. To be able to get the aggregated consumer
surplus the average consumer surplus has to be multiplied by the total amount of visitors to the
site during a specific time. The total aggregated consumer surplus was used as a measurement of
the total recreational value for the national Park.
Econometric Specification
Econometrics is both a statistical and mathematical tool used for giving empirical evidence for a
chosen model. To be able to derive and estimate the consumer surplus from the trip generating
function an econometrical analysis was performed. This made possible to draw conclusions
about which of the included variables that have any statistical significance for the number of vis-
its made to the national Park. The trip generating function was transformed into a function that
can be used in a simple regression model:
Vij=β0+β1TC+β2 INCOME+β3 AGE+β4 NATIONALITY+β5 GENDER+β6 SUBSTITUTE [4]
Where, TC = Travel cost β0, β1…. β6 = coefficient to be estimated
Travel to a site takes time and the time spent on travelling could instead have been used for other
activities, such as work. There is uncertainty in the economic literature of how this opportunity
cost should be calculated. Therefore two different ways were tested; one where time cost de-
pends on the hourly wage rate and another where the time cost depends on the travelling expe-
rience.
When calculating the time cost depending on hourly wage rate the amount of hours worked per
month needs to be found, this since it is the unit used in the questionnaire for stated income. Ac-
cording to the International Labour Organization (2007) the standard amount of working hours
per week was 48. By calculations, the number of working hours per month was assumed to be
208 in this study. Adding the entire hourly wage rate might cause an overestimation since most
people are constrained to working hours as decided in their contracts. Previous studies by Cesa-
rio (1976) suggest that one third of the hourly wage rate should be calculated for the time cost
(Hanley, 1993). By applying this it would make the time cost look like this:
Time cost = [HH monthly income/ Earning members of HH]/ Work hour per month
3 [5]
By using this way of how to calculate the time cost gives the following travel cost function:
TC= (Travel cost+ Travel time * Time cost) * Importance of the national Park [6]

Aryal, Maniratna: Final Report
In the survey an approximation was made by the respondents on how much of the travel cost that
should be related to the trip to the national Park. The value stated in percentage was used in cal-
culating both the travel cost to the national Park and the travel cost to Nepal.
The respondents were asked to state their monthly household income in any currency. The in-
come variable was first recalculated to USD and then divided by the number of earning members
of the household. The respondents stated a lower income (due to tax imposition) may also have
stated a lower travel cost so that their travel cost seems reasonable in relation to their stated in-
come.
Dummy variables can be used as a way of introducing variables of qualitative nature into the re-
gression model. The advantage of doing this was that the results can show if the qualitative va-
riables has any statistical significance for the chosen model (Dougherty, 2002).
The substitute site variable was given the value 1 if the respondent stated that they had a substi-
tute site to visit if they did not visit Chitwan National Park and the value 0 if they didn’t state a
substitute site for the Park.
The gender variable was given the value 1 if the respondent stated that they were male and 0 if
they were female. A possible bias could be that while some of the respondents filled in that a
male had responded to the survey some of the results were from females.
The nationality variable was given the value 1 when the respondent stated that their nationality
was other than Europe, and when the respondent stated that their nationality was Europe the va-
riable was given the value 0.
Factors that Determine Recreational Demand
Various independent variables were used to explain variation in the dependent variable Vij. Both
economic theory and the considerable experience of recreation managers have shown that demo-
graphic and other independent variables influence recreation visitation. Apart from demographic
variables, the most important variables include travel cost, travel time, substitute sites, and site
quality and congestion. Demographic variables such as age, sex, education, income, employment
status affect recreational demand.
Intuitively, age would appear to be an important determinant of demand for Park visitation and is
expected to be inversely related. That is, as age increases, participation decreases. Sex may be
another determinant. We expect that men would be more likely to participate than women.

Aryal, Maniratna: Final Report
With regard to education, people with higher education, it could be said, appreciate outdoor na-
ture-based activities more than people with less formal education. Household income has also,
generally, been found to have a positive correlation with participation in many outdoor recreation
activities. We expect that the higher the household income, the higher the number of Park visita-
tions. Similarly, a better-quality Park may attract an individual more often than a degraded-
quality Park. The relationship between travel cost and Park visitation may be negative. On the
question of what costs should be included under travel costs, some researchers have inquired
closely into the costs of fuel, oil, tires, repairs and maintenance of vehicles in order to estimate
appropriate travel costs. Seller, et al., (1985) used the cost of fuel, accommodation and food
costs. Beal (1995) also found that a majority of respondents considered fuel, food, and accom-
modation costs as relevant to their trip decision.
Regarding the value of on-site time, McConnel (1992) argued that the opportunity cost of on-site
time should be included in the price variable. McConnel concluded that accounting for on-site
time was so difficult that no systematic method has been developed, either conceptually or em-
pirically. Smith, et al., (1983) suggested that cost would be some proportion k of each individu-
al's wage rate. Numerous attempts have been made to value travel time. It should be noted
though that despite the fact that the issue of valuing travel time has been addressed in several
studies, there seems to be no consensus on a consistent procedure yet (Nillesen, 2002). Cesario
(1976) argued that it seems more reasonable that a trade-off is made between time for travel and
leisure activities rather than between work and travel time. Like Freeman (1993), full wage was
used to value time in this study. If time costs are ignored, demand will be biased. The effects of
both time costs and transportation costs on the demand for recreation need to be estimated sepa-
rately. However, since the two may be highly correlated and a separate estimation too difficult to
carry out, time costs was given a monetary value and added to the transportation costs. In our
paper, travel costs include all monetary costs of travel to CN Park as well as time cost. The time
spent in traveling and time spent on the site were valued at the prevailing wage rate and were
added to the monetary cost of travel, including the cost of fuel (in case the visitor was using his
own car) or the fare of public transportation, meals, accommodation, etc. Prices of substitute
sites also affect recreational demand for CN Park. Some visitors may believe that each national
Park is unique and has no substitute. Conversely, some people use other forms of outdoor

Aryal, Maniratna: Final Report
recreation (like going to a movie) as substitutes for nature-based recreation in national Parks.
Freeman (1993) approached the substitute site dilemma by suggesting that researchers ask visi-
tors which other single site is visited frequently and include only that site's price as the relevant
substitute price. He asserted that a next-best site yielding similar characteristics and services (Na-
tional Park, in this instance) was the appropriate alternative. The possible inclusion of substitute
prices stems from the demand theory that states that the demand for a good is dependent on its
own price, prices and qualities of substitutes, and other factors. Hence, the demand for the envi-
ronmental good should include the prices of substitute goods. Site quality may also affect Park
visitation. The higher the site quality perceived by visitors, the higher the consumer benefit.
There may also be the issue of multi-purpose-or-destination trips. People often visit several sites
within one trip. The problem that arises is how to allocate the total travel costs among these mul-
tiple destinations. Loomis and Walsh (1977) suggested two options observations from multiple
destination trips and estimate demand with just the single destination users and compute a per-
visit consumer surplus figure based on these functions. This average visitor consumer surplus
can then be aggregated across all visitors to estimate total consumer surplus. Alternatively, one
could ask visitors what proportion of the cost of the trip should be attributed to each destination.
To provide for this, a multi-purpose question was asked and some crude allocation of costs was
used to estimate travel costs. Visiting a site may be part of round trip involving visits to other
locations.
Variables Expected Sign Description
Travel cost (-): It includes round trip total cost to and from CN Park including opportunity cost
of travel time and time spent at the site. It is hypothesized that the no. of visits to the site and tra-
vel cost are inversely related.
Household income (+): Household average monthly income in Nepal. Rupees (NRs.68 = 1 US$).
We also hypothesize that household income and the no. of visits to the site are positively related.
Price of substitute (+): Travel cost from a residence (place of living) to and from the next best
alternative substitute site including travel time and time spent at that site. It is hypothesized that
CN Park and BN Park are substitutes so that the travel cost of BN Park and the no. of visits to
CN Park are positively related.
Age (-): Age (in years) of the visitor/respondent at the time of interview. The hypothesis is that

Aryal, Maniratna: Final Report
the visitor's age and the no. of visits to MHN Park are inversely related.
Education (+): Highest level of education (in years) of the respondent. It is expected that the lev-
el of education of visitors and the no. of visits are directly/positively related.
Sex (+): Sex of respondents (D1 = 1 if male and 0 otherwise). We assume males will visit the
CN Park more often than females.
Park Quality (+): Quality of the site/Park (D3 = 1 if perception of the visitor is good about the
Park and 0 otherwise). It is assumed that if the visitors know that the quality of the Park is good,
then they will visit it more often than those who think that the quality of the Park is not good.
3.7 Overall Research Process
The research started by preparing a scientific research proposal with extensive literature review.
The draft of questionnaires was prepared in the university and tested in the field. A few questions
have been modified after the field verification, pre testing and adopted in the field for the study.
The proposal was also discussed with DNPWC personnel and local stakeholders who helped in
planning the fieldwork. Data was collected using household survey, group discussion, field visit
and the PRA tools. Compilation of necessary information, tabulation, processing and presenta-
tion were the part of the data analysis. Reporting the results and subsequent discussion led to the
conclusions and recommendations.
Figure 8: Overall research process

Aryal, Maniratna: Final Report
4. DESCRIPTION OF THE STUDY AREA
4.1 Chitwan District
Chitwan is one of the 75 districts of the country. It covers an area of 2218 sq. km with a total
population of 472,048 (CBS, 2002) and lies about 146 km Southwest from Kathmandu (The cap-
ital city of Nepal). It is located between longitudes 83021"to 27048' East and latitudes 27055' to
84053' North. Geographically, it is divided into Terai, Siwaliks and Middle mountain regions al-
though for administrative purposes it is divided into 40 Village Development Committees
(VDC), and two municipalities. About three fourths of the district’s land areas have high agricul-
tural potential and are relatively flat. Over 75% of the annual rainfall occurs during monsoon
from June through September, with average annual rainfall of 2000 mm (Pariyar & Singh, 1994).
Forest, agricultural lands, pasture/grazing lands, settlements and wastelands are the major land
use types in the district. The agro-climatic conditions are favorable for tropical to subtropical
crops, vegetables and fruits. Pariyar & Singh (1994) stated that there are three cropping seasons
in a year viz. monsoon (June to September), winter (October to February), and summer (March
to May). The important crops are paddy, maize and millet in monsoon, wheat, lentil and potato in
winter, paddy and maize in summer.
4.2 Chitwan National Park
Chitwan National Park is one of the first and the oldest national Parks, have been established in
1973, and covering 932 Sq. Km. in the sub-tropical lowlands of the country. It is famous for
unique biodiversity of flora and fauna, and outstanding natural features. The Park extends in 4
districts as: Chitwan, Makawanpur, Nawalparasi and Parsa. More than 74 % of the area of the
Chitwan National Park falls in Chitwan district. There is about 8 % in Nawalparasi district, 12 %
in Parsa and 6 % in the Makwanpur district. It is the suitable habitat of more than 50 species of
mammal, one horned rhino and the Bengal tiger. There are over 525 species of birds, including
the Bengal florican, Lesser florican, Giant hornbill, Black stork and White stork as well as more
than 35 amphibians and reptiles (MFSC, 2002). Tharus are the main indigenous ethnic groups in
this area. Recognizing its unique ecosystems of international significance, UNESCO declared
Chitwan National Park a World Heritage Site in 1984. An area of 750 Sq. Km. surrounding the
Park was declared as a buffer zone in 1996 which consists of forests and private lands (DNPWC,
2000)(Appendix 4).

Aryal, Maniratna: Final Report
The Chitwan National Park (CNP) is probably one of Nepal’s best known World Heritage prop-
erties. The Park holds such wonders as Triveni, the river confluence of extreme cultural impor-
tance; Balmiki Ashram temple; and Tikauli forest including Beesh Hazaar Tal etc. in case of
Chitwan National Park, the effective management of surrounding area and the sustenance of
communities within those areas may hold the key to Park’s survival (Carew-Reid, 1991). The
Park is just a short detour off the Prithvi Highway. The name Chitwan means heart of the jungle.
In recent years Park has risen meteorically on the lists of the Things to do in Nepal. It contains
the Churiya hills, ox-bow lakes and flood plains of Rapti, Reu and Narayani rivers. The Sal fo-
rests dominate the vegetation of the Park. The grasslands form a diverse and complex communi-
ty with over 50 species, the Sacchurun species, often called elephant grass, can reach 8m in
height.
The Park covers a pristine area with a unique ecosystem of significant value to the world. The
Park boundaries have been delineated by the Narayani and Rapti rivers in the north and west, and
the Reu River and Someshwor hills in the south and south-west. It shares its eastern border with
the Parsa Wildlife Reserve. It contains the Churiya hills, ox-bow lakes and flood plains of Rapti,
Reu, and Narayani Rivers. Approximately 70 % of the Park vegetation is Sal forest. The remain-
ing vegetation types include grassland (20 %), riverine forest (7 %), and Sal with Chirpine (3 %),
the latter occurring at the top of the Churiya range. The riverine forests consist mainly of Khair,
Sisoo, and Simal. The grasslands form a diverse and complex community with over 50 species.
The Park is especially renowned for its protection of the endangered one-horned rhinoceros, tig-
er, and gharial crocodile along with many other common species of wild animal. The Park has
long been used as a popular external recreational site. This practice can be traced back to mid
19th century when the rulers of Nepal used to organize big game hunting. Not only the Nepalese
high officials but also many of their guests from India and abroad were invited to use it as a recr-
eational area. These guests can be considered as some kind of tourists. At present tourism in the
Park is very important as it hosts more than 1,00,000 tourists, which are about 23 % of the total
number of tourists that arrive annually in the Kingdom of Nepal (Shrestha, 2003). Many people
in the area are engaged in tourism-related business, which has been a great source of livelihood
for them.

Aryal, Maniratna: Final Report
4.3 Buffer Zone of Chitwan National Park
The Buffer Zone is an area around a national Park or reserve, set aside for granting opportunities
to local people to use forest products on a regular basis (NPWC Act 1973). It is “an area adjacent
to a protected area on which land use is partially restricted to give an added layer of protection to
that PA, while providing valued benefits to neighboring rural communities”( Mackinnon as cited
in Wells & Brandon, 1993, p.159). The buffer zone of Chitwan National Park is divided into 21
units committees for its administrative management. One user committee in each UC is formed
comprising 13 members (of which one third are female). The major rivers of the buffer zone in-
cludes Narayani, Rapti, Reu, Budhi rapti etc. the other water bodies are Bishazari Tal, Devi Tal,
Pandeythan Tal, Khageri canal, Gaida Tal, Ox-bow lake etc which famous for the for many resi-
dent and migratory birds. The Bishajari Tal is listed in the Ramsar site in 2003 (Appendix 5).
4.4 Land Use of Buffer Zone
The buffer zone includes settlements, cultivated land; water bodies grass land and forest. Culti-
vated agricultural land is the dominant land use, spread over 46.3 %. Forest occupies 42.9 %,
grassland 1.1 %, shrub land 1.3 %, and another category, (river and sand banks) occupies 8.4 %
of the total surface of the buffer zone.
4.5 Baghmara Buffer Zone Community Forest
The Baghmara Community Forest is situated in Bachhauli VDC of Chitwan District. It lies be-
tween 27034’78”-27035’53” northern latitude and 84028’43”-84029’40” eastern longitude, in the
subtropical region of lowland Nepal. The Baghamra Buffer Zone Community Forest boarders
cultivated land to the east, Budhi rapti to west and north and Bodreni village and Rapti river to
south.
Local residents of Bachhauli VDC, ward number 1, 2, 3 and 4 are the members of UG. There are
a total of 779 users’ group households and 4,546 people (51.14 % male and 48.9 % female) in
the users’ group (Work Plan, 2001). The population of local indigenous people, Tharu is higher
in the user groups (57.84 %). The population ratio of other ethnic groups is 21 %, 16.67 % and
4.49 % of Mangol, Brahmin/Chettries and others respectively. Among them 93.5 % people are
permanent resident whereas remaining 6.5 % are frequently visiting the area (NTNC, 1997).
There are 3,944 livestock in the users group of this community forest. The major livestock are
cow 8.11 %, buffalo 14.40 %, ox/male buffalo 14.45 %, goat/sheep 35.98 %, pig 0.17 % and

Aryal, Maniratna: Final Report
chicken/ducks 39.02 %. Among the cattle buffaloes 78.7 % are grazer and 21.3 % are stall feeder
(NTNC, 1997).
The Baghmara Community Forest was established in 1989 on heavily overgrazed, almost bare
land. The area was formerly covered with riverine forest dominated by Bombax ceiba, Dalbergia
sissoo, Acacia catechu. The 400 ha Community Forest was handed completely over to forest us-
ers groups in 1995. In Baghamra community Forest, the members of the forest users group were
the households who were managing and utilizing the forest accessible since long time. Hence the
membership criteria in the users group were based on forest use, residential proximity and histor-
ical affiliation to the particular forest. Since the non members neither contributes towards the
protection and conservation of the forest nor use the forest. The users group was supposed to
make their own decisions about the management objectives, rules, and administrative arrange-
ments on consultation with other concerned people and organization. Users group committee
were comprises of 13 members representing all segments of the users group. The duties, respon-
sibilities and authority of the users’ group committee were specified in the work plan as agrees
between Chitwan National Park, and users’ group committee.
4.6 Ecotourism Potential
Ecotourism, also known as ecological tourism, is a form of tourism that appeals to the
ecologically and socially conscious individuals. Generally speaking, ecotourism focuses on
volunteering, personal growth, and learning new ways to live on the planet; typically involving
travel to destinations where flora, fauna, and cultural heritage are the primary attractions.
Responsible ecotourism includes programs that minimize the negative aspects of conventional
tourism on the environment, and enhance the cultural integrity of local people. Therefore, in
addition to evaluating environmental and cultural factors, an integral part of ecotourism is in the
promotion of recycling, energy efficiency, water conservation, and creation of economic
opportunities for the local communities.
Declaration of the buffer zone of CNP has given opportunities and challenges to the Park
managers to promote ecotourism in the buffer zone. Tourism in Chitwan must benefit local
communities while balancing the requirements of biodiversity conservation in national Park
setting and growth in wild life tourism. According to the current visitors survey two third of the
visitors perceived the problem of crowding and congestion in Sauraha of the Park. There is a
Aryal, Maniratna: Final Report
wide spread agreement among conservationist that pressure due to tourism activities, especially
due to elephant safari, jungle walk, canoe ride and jungle drive on the Park resources in Sauraha
area have already led to habitat degradation of several endangered wild species. The local people
residing in the densely populated buffer zone have not been able to participate in the Park related
tourism benefits to any considerable extent. The management seems to be unprepared for the
extraordinary growth of visitors to the Park. The provision of buffer zone has given tremendous
opportunity to organize the tourism sector to financial benefit the local communities. Some
successful examples such as Baghmara community forest and Kumroj community forest in the
buffer zone have shown that local communities see the benefit of community plantations that can
serve dual role, the source of firewood and fodder and site for nature based tourism. Declaration
of the buffer zone of CNP has given opportunities and challenges to the Park managers to
promote ecotourism in the buffer zone. Especially since the buffer zone encompasses tourist hot
spots like Sauraha, where almost all hotels and lodges are operating Park related tourism
business, appropriate interventions could bring out desirable changes (DFRS, 2001).
About 80-90 % of the total revenue of the CNP is due to tourism activities and the amount is
growing annually by 22.5 %. Tourism in Chitwan must benefit local communities while
balancing the requirement of biodiversity conservation in a national Park setting and growth in
wild life tourism.
4.7 Climate
The area has a tropical monsoon climate with relatively high humidity. The Chitwan National
Park falls in the bottom of Mahabharat range, where monsoon starts early in mid June and con-
tinues until late September. The mean annual rainfall ranges between 2000-2100mm, and annual
maximum and minimum temperatures recorded are 310C and 17.40C respectively (CNP & BZ
Management Plan, 2001-2005).
4.8 Geology and Soil
Chitwan National Park lies at north and south of Mahabharat and Churia ranges respectively and
runs from west to east. Soil types found in the valley has been identified as sandstone, conglome-
rates, quartzites, shales, and micaceous sandstones during soil survey in 1968. The Rapti valley
possesses alluvial deposition making the entire valley highly suitable for cultivation. The altitude
varies from 150 m to 750 m.
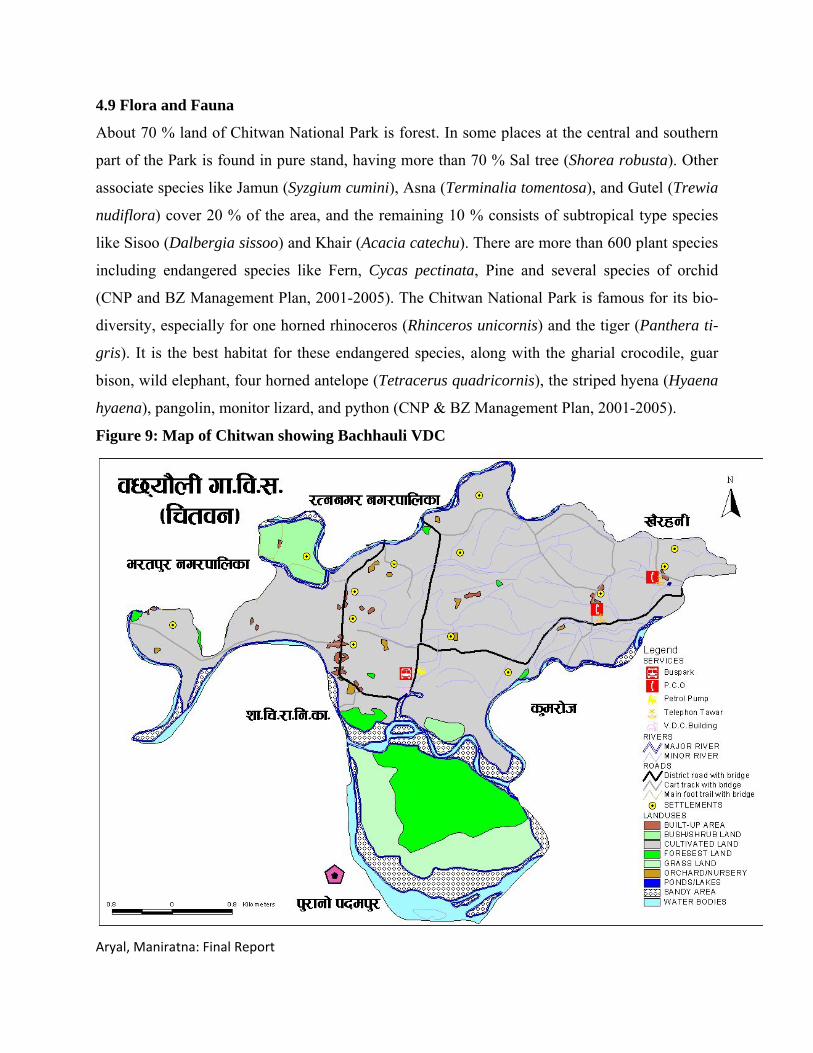
Aryal, Maniratna: Final Report
4.9 Flora and Fauna
About 70 % land of Chitwan National Park is forest. In some places at the central and southern
part of the Park is found in pure stand, having more than 70 % Sal tree (Shorea robusta). Other
associate species like Jamun (Syzgium cumini), Asna (Terminalia tomentosa), and Gutel (Trewia
nudiflora) cover 20 % of the area, and the remaining 10 % consists of subtropical type species
like Sisoo (Dalbergia sissoo) and Khair (Acacia catechu). There are more than 600 plant species
including endangered species like Fern, Cycas pectinata, Pine and several species of orchid
(CNP and BZ Management Plan, 2001-2005). The Chitwan National Park is famous for its bio-
diversity, especially for one horned rhinoceros (Rhinceros unicornis) and the tiger (Panthera ti-
gris). It is the best habitat for these endangered species, along with the gharial crocodile, guar
bison, wild elephant, four horned antelope (Tetracerus quadricornis), the striped hyena (Hyaena
hyaena), pangolin, monitor lizard, and python (CNP & BZ Management Plan, 2001-2005).
Figure 9: Map of Chitwan showing Bachhauli VDC

Aryal, Maniratna: Final Report
5. RESULT AND DISCUSSIONS
5.1 Demographic characteristics
5.1.1 Population distribution
The user group comprised of 779 households. The distribution of households in ward 1, 2, 3 and
4 were 109, 146, 362 and 162 respectively (Appendix 6).
Figure 10: Household distribution of Baghmara Buffer Zone Community Forest Users Group
The total population of the 203 sampled household was 1,305, out of which male (52 %) and fe-
male (48 %) in poor family, male (47.9 %) and female (52.1 %) in medium family and male
(53.8 %) and female (46.2 %) in rich family respectively (Table 1). In terms of gender, majority
(51 %) was male and there was variation in its distribution across the category.
Table 1: Distribution of the Respondents of Bachhauli VDC by gender (2008)
Category Male Female Total Average size
Rich 112(53.8) 96(46.2) 208(100) 5.1
Medium 205(47.9) 223(52.1) 428(100) 6.4
Poor 348(52) 321(48) 669(100) 7
Total 665(51) 640(49) 1305(100) 6.4
Source: Field Survey, 2008. *figures in parentheses indicate Percentage.
The population size (7) was greater in poor than that of both rich and medium class. The reason
for higher population size of poor might be the low level of literacy. The average family size

Aryal, Maniratna: Final Report
(6.4) was greater than that of national average of 5.6 (CBS, 2002). As the average family size
was found greater, this obviously demanded greater amount of forest resources.
5.1.2 Economically active population
The economically active populations considered are the population belonging to the age group
from 16 to 59 years. In the buffer zone of Chitwan National Park, 60 % of the people were eco-
nomically active. Remaining 40 % people were dependent on the income of the active family
members (figure 11).
Figure 11: Distribution of economically active population of the Respondents by gender
5.1.3 Ethnicity
On the basis of the GIS data of DDC (2002), the sampled households were categorized into four
major namely Tharu, Brahmin/Chettri (Upper caste), Lower/occupational caste (Bishwokarma,
Damai, Sharki), and other (Darai, Gurung, Bote, Majhi, Mushahar, Tamang). The same grouping
criteria were used by the Nepal and Weber (1993) and Poudel (2003) in studying Park and
people conflict of Chitwan National Park. The criterion was based on their similarities found in
living pattern, traditions, occupation, and other aspects. About 47.3 % of the households were
Tharu, 33 % Brahmin and Chettri, 3.9 % Occupational caste, and few (15.8 %) were of other
caste groups (figure 12).
It is evident that poor family was dominated by Tharu whereas upper castes were dominant for
medium and rich family except for traditional ethnic group (Tharu, Darai, Bote, Mushar), others
have migrated from hills after Malaria eradication in 1950s (Appendix 7). Due to this fact, study

Aryal, Maniratna: Final Report
area was marked by the continued process of migration. Thus, study area was intermingled with
diverse nature of population of different parts of the Kingdom.
There is much priority of caste/ethnicity of people because there is still exclusion in access of so
many public goods for so-called Dalits (lower caste) and disadvantage groups (Tharu, Darai,
Bote) in Nepal. In order to find out whether there was any discrimination in access of forest
product and the programme target for poor, question on caste/ethnicity was asked. The different
categories of Tharu have been separated because they have, by their occupation, lower socio-
economic status.
Figure 12: Distribution of the Respondents of Bachhauli VDC by ethnic group (2008)
The majority households were of Tharu because Chitwan District itself is dominated by these
traditional caste groups. While in case of District scenario, approximately 30 % of the household
was aboriginal caste group (DDC, 2001) where about 40 % of them were in buffer zone, who
exclusively depended on the forest resources for their survival. These Tharu had their own farm-
ing and living styles, which relied on the Park resources like collection thatching materials, wild
edibles, fishing, boating and enjoy their own culture.
5.1.4 Occupation
The basic economy of the households was agriculture where 50.2 % of the respondents were de-
pendent on agriculture. Almost 21.2 % respondents primarily earned their livelihood from wage
labor. About 18.7 % respondents engaged in government or private services including teaching

Aryal, Maniratna: Final Report
in school, nature guide, elephant riding, and boating and 8.9 % respondents were involved in
business as their primary occupation and 1 % of the respondents dependent on fishing (figure
13). The data showed that the majority households in the poor family involved in agriculture than
those of medium and rich family (Appendix 8). Some occupations were also found to be relying
on the ethnicity. Most of the Majhi were dependent on fishing as their source of income.
In Chitwan, Tharu was the traditional farming community, who nurtured rich and diverse farm-
ing practices based on their specific knowledge, suitable to the agro ecological situation of the
area since long ago. Besides the farming communities, there were large number of landless, dif-
ferent forest based occupational caste and traditional fishing and ferrying communities. Maj-
hi/Bote were the minority ethnic groups who were in hardship, barely managing a survival exis-
tence because of their reduced access to the resources for their customary occupations, now they
were in to various other alternative occupations (Paudel, 1999).
Agriculture remained as means of subsistence as well as for cash income for the households and
the occupation of respondents did not changed across the categories. Similar finding of Dhakal
(2002) and Poudel (2003) also showed that more than 87 % of buffer zone households primarily
depended on traditional farming practices.
Figure 13: Major occupation of the respondents of the Bachhauli VDC (2008)

Aryal, Maniratna: Final Report
5.1.5 Education
Educational status gives clear indication regarding level of awareness of the individuals. About
27 % of the buffer zone people were illiterate. The educational level of upper caste people was
relatively higher than the others. Majority (54.8 %) of the buffer zone people were below SLC
(figure 14). Drop outs at the schooling were more in Tharu, Dalits and Janajati and it was less in
upper caste (Field visit).
Figure 14: Educational attainment of Respondents in Bachhauli VDC of Chitwan (2008)
Majorities of the sampled households were found literate but had attained only lower level edu-
cation. Most of the disadvantaged castes were compelled to drop out the education due to low
economic status.
5.1.6 Sources of income
Most of the household income depends on agriculture in rural Nepal especially where there is
fertile land. Agriculture might not be sufficient to sustain the family round the year that's why
some members engage themselves in other income generating activities. They, therefore, sup-
plement household economy. Agriculture and livestock covers the most of the household income
in the study area. Agriculture and livestock farming depend, directly and indirectly, with forest

Aryal, Maniratna: Final Report
resource. So, this contribution goes to forest product as well. Forty three percent of the house-
holds were earning less than NRs.10, 000 annually. Majority of the people derived their income
mainly from agriculture and livestock. However, for high income groups, business and services
were the major contributing sector.
Table 2: Distribution of different level of income from different sources, 2008, (NRs. “000”)
Source of Income ≤10,000 10,001-20,000 20,001-40,000 ≥40,000
Agriculture 32(49.2) 16(24.6) 11(16.9) 6(9.2)
Business 11(18) 17(27.9) 21(34.4) 12(19.7)
Service 12(32.4) 18(48.6) 5(13.5) 2(5.4)
Wage labor 30(81.1) 5(13.5) 2(5.4) -
Fishing 3(100) - - -
Total 88(43.3) 56(27.6) 39(19.2) 20(9.9)
Source: Field Survey, 2008. *figures in parentheses indicate Percentage
5.1.7 Food security
The households were categorized into four types on the basis of the food sufficiency for round
the year from their own production.
Table 3: Different economic status and food security position of the Respondents (2008)
Sufficiency period Rich Medium Poor Total
≤3 months 5(12.2) 21(31.3) 62(65.3) 88(43.4)
3-6 months 15(36.6) 29(43.3) 21(22.1) 65(32)
6-9 months 9(21.9) 9(13.4) 12(12.6) 30(14.8)
≥9 months 12(29.3) 8(11.9) - 20(9.8)
Source: Field Survey, 2008. *figures in parentheses indicate Percentage.
The average crop production per household of buffer zone area of Bachhauli was very low. Most
of the farmers have small land holdings. The land was also less productive due to loss of top
soils by flood of Rapti, Rew and Narayani rivers. Majority (43.3 %) of the people did not have
sufficient food from their own production. Only 9.8 % of the people can have food for > 9
months from their own production. The rich family had better food secured than poor (Table 3).

Aryal, Maniratna: Final Report
Table 4: Alternative sources of earnings of the Respondents to cope food deficiency (2008)
Measures Rich Medium Poor Total
Daily wage earning 9(22) 21(31.3) 27(28.4) 57(28.1)
Share cropping 17(41.5) 29(43.3) 36(37.9) 82(40.4)
Seasonal migration 10(24.4) 11(16.4) 18(19) 39(19.2)
Others 5(12.2) 6(9) 14(14.7) 25(12.3)
Source: Field Survey, 2008. *figures in parentheses indicate Percentage.
Daily wage, Share cropping and seasonal migration were the major alternatives source of earn-
ings to cope the food deficiency of buffer zone area of Bachhauli. About 40.4 % households in-
volved in share cropping followed by daily wage earning (28.1 %) (Table 4). Before implemen-
tation of buffer zone management program, they used to be involved in illegal activities like tim-
ber selling, fishing, extraction of high value Non Timber Forest Product (NTFP). The descriptive
analysis showed that majority households adopted the illegal alternative means. After the imple-
mentation of buffer zone management program, people joined the buffer zone user groups. After
being the member of user groups of buffer zone such illegal activities have been minimized.
5.2 Park-People Interface
There were a number of spheres in the study area in general and subsistence pattern of people in
particular where Park-people interface was obvious and they were contradicting too. This study
explored some of such areas and issues. The major conflicts were for the forest/Park resources
and wild animal depredation to cultivated crops, animals and human.
5.2.1 Collection of thatching materials
The Park issues permission for 5 days per year during the month of January to local people to
collect thatch grass and reed. Thatching materials were mainly Siru-shorter grasses (Imperata
cylindrica) and Kans-elephant grass (Saccharum spontaneum). Saccharum spontaneum is re-
nowned for its immense height (up to 8m).
Table 5: Response of the Respondents for their khar/khadai requirement (2008)
Necessity Rich Medium Poor Total
Yes 12(29.3) 40(59.7) 70(73.7) 122(60.1)
No 29(70.7) 27(40.3) 25(26.3) 81(39.9)
Source: Field Survey, 2008. *figures in parentheses indicate Percentage.

Aryal, Maniratna: Final Report
**Khar is thin stem grass used as roofing materials
***khadai is thick stemmed grass used as walling materials
About 60.1 % of the people were using khar as roofing material and reed/khadai as wall of their
house. During 1995, Park was opened for 15 days but since 2004, the Park has opened for 5 days
during the month of January to collect khar khadai for the local. Majority of the respondents
were dissatisfied with the limited permission period by Park management authority (Table 6).
Five days period of khar khadai collection permitted to the local people by the buffer zone man-
agement committee satisfied about 29.3 % of the rich people and only 7.4 percent of the poor.
This showed inverse relation between the well being and the satisfaction level of the khar khadai
collection period. Just inverse the percentage of dissatisfaction of rich, medium and poor people
for the collection period was 70.7 %, 82.3 % and 90.6 % respectively (Table 6). Thus, the dissa-
tisfaction level of the people living around the buffer zone was directly related to the increase of
poverty.
Table 6: Perception of Respondents towards khar/khadai collection period (2008)
Satisfaction level Rich Medium Poor Total
Highly satisfied 3(7.3) - - 3(1.5)
Satisfied 9(22) 12(17.9) 7(7.4) 28(13.8)
Less satisfied 13(31.7) 21(31.3) 35(36.8) 69(34)
Dissatisfied 11(26.8) 15(22.4) 40(42.1) 66(32.5)
Highly dissatisfied 5(12.2) 19(28.6) 13(13.7) 37(18.2)
Source: Field Survey, 2008. *figures in parentheses indicate Percentage.
The collection period was equally dissatisfying to all respondents regardless of the well being
which could be the probable cause of conflict arising from resource allocation as evident by the
high proportion (60.1 %) who had the need for grasses and roofing materials for their houses.
5.2.2 Cooking materials
The firewood was used by majority (46.8 %) of the households followed biogas plants (35.5 %).
Other sources of cooking materials were Bhusechulo, LP gas, and kerosene. Moreover, the ener-
gy source was found irrespective of the well being (Table 7).

Aryal, Maniratna: Final Report
Table 7: Various sources of energy used by the Respondents for cooking (2008)
Category Firewood Biogas Kerosene LP gas Bhusechulo
Rich 8(8.4) 18(25) 3(75) 7(70) 5(22.7)
Medium 31(32.6) 20(28) 1(25) 3(30) 12(17.9)
Poor 56(58.9) 34(47) - - 5(54.4)
Total 95(46.8) 72(35.5) 4(2) 10(4.9) 22(10.8)
Source: Field Survey, 2008. *figures in parentheses indicate Percentage.
Though the number of biogas installers was lower in totally but the trend was gradually increas-
ing. Moreover, before the implementation of the Programme, there were hardly any biogas plants
in the buffer zone area. Nowadays, along with community forest programme, other organizations
like NTNC and NGOs were also facilitating the communities to install biogas plants with subsi-
dies. There were 1,134 plants installed in the buffer zone area of Chitwan National Park (Annual
Report, 2003/04). BZDC established the fund from which Rs. 1,500 was given as an incentive
grant to each users group (UG) member of the buffer zone, who had established the biogas plant.
However, group discussion showed that the distribution pattern of energy sources varied accord-
ing to the caste groups. Majority of Brahmin and Chettri had adopted the modern energy sources
like biogas, LP gas, Kerosene for cooking purpose. Tharu, Darai and Dalits were relatively poor
and dependent on firewood for cooking foods. The majority (52.2 %) of the people living around
the Chitwan National Park collected their required firewood from community forest (Table 8).
The results were opposite of Poudel (2003) as stated by firewood collection by Government for-
est was more than Community forest. Firewood collection from community forest was found
more after the implementation of buffer zone management program.
Table 8: Sources of collection of firewood by the Respondents in the Bachhauli VDC (2008)
Source Government forest Community forest Driftwood Private forest Saw mills
Rich 7(17.1) 19(46.3) 2(4.9) 9(21.9) 4(9.8)
Medium 8(11.9) 30(44.8) 7(10.5) 13(19.4) 9(13.4)
Poor 14(14.7) 57(60) 12(12.6) 5(5.3) 7(7.4)
Total 29(14.3) 106(52.2) 21(10.3) 27(13.3) 20(9.9)
Source: Field Survey, 2008. *figures in parentheses indicate Percentage.

Aryal, Maniratna: Final Report
About 14.3 % households obtained the firewood from the Government Forest which made a pro-
vision of collection of dead wood, off- and wind broken branches in certain time interval depend-
ing upon their own regulations. Other sources were driftwood (collected from river during rainy
season) by 10.3 %, private forest by 13.3 %, and Saw mills by 9.9 % of the households (Table 8).
The different sources of fuel wood used by the sampled HH were found irrespective of the cate-
gories. However, there was significant relationship between the educational level of the respon-
dents and the source of the firewood used by the sampled HH. Moreover, the educated house-
holds either developed own source or established the community forest for fire wood collection.
However, illiterate were those households who frequently went to Park.
It was evident that a large number of household were still using the firewood for cooking pur-
pose exclusively violating the rules and regulations of protected area. However, the trend of us-
ing legal source of fire wood collection was commonly found in more educated households than
the lower one. These facts suggestively indicated to the conspicuous encroachment over the pro-
tected area resources which became one of the common issues of conflict in the study area. After
the implementation of program, conflict on resource utilization is greatly reduced because local
peoples are the owner of the nearby forest of Park boundary which was handed to community
and made rules themselves as per the requirement of their household and there is found positive
relationship to minimize the conflict in resource use.
It was found that there was gradual reduction in the dependency of the people in the forest re-
source. This finding is similar to that of the Dhakal (2001) and Poudel (2003) where they men-
tioned that about 355 UG formed before 1998 are self reliant to meet their biomass (fodder, fo-
rage and timber) demand within the buffer zone and timber extraction was more from buffer
zone Community forest than Government forest. There were various sources of woodlot reported
by the sampled households for building materials.
The distribution pattern of source of the building materials was found similar to that of firewood.
These facts showed that the shifting tendency from illegal encroachment to the legal sources for
firewood and timber collection was found gradually increasing though there were still some
household’s involvements in the illegal encroachment for fulfilling their fire wood demand just
during at the time of Park opening for 5 days to collect thatch materials.

Aryal, Maniratna: Final Report
5.2.4 Livestock farming
Livestock rearing is an integral part of Nepalese farming system. Crop livestock mixed farming
system was common in the study area. Majority of farmers reared livestock in their farm mainly
cattle, buffalo, poultry, sheep, and goats. The Table 9 showed that average livestock holding size
was 4.08 Livestock Standard Unit (LSU) which was lower than the reported livestock holdings
over the period of last five years (compared to former estimate of 4.6 by Joshi, 1998 and 4.17 by
Poudel, 2003). The livestock herd size was higher in poor than medium and rich families. The
average livestock size and number of households involved in livestock rearing was decreasing.
Table 9: Distribution of livestock of the Respondents in Bachhauli VDC (2008)
Category Average size
Rich 3.1
Medium 4.02
Poor 5.12
Average 4.08
Source: Field Survey, 2008.
Rijal (1999) stated that the improved breed of livestock was increasing at the rate of 3.1 % in cat-
tle, 1.6 % in buffalo, and 4.8 % in goat/sheep around the buffer zone area of Chitwan National
Park. However, herd size of domestic animals was decreasing in this study.
Livestock Standard Unit (LSU) = 1.5 * (Number of Buffalo) + 1* (Number of Cattle) + 0.6 *
(Number of Pig/Swine) + 0.4 * (Number of Goat/Sheep)
Feeding system
Three types of feeding system were adopted by the farmers like: stall feeding, free grazing and
mixed type. The feeding system adopted by the respondents determined the demand of the fodder
or pasture. Majority (57.6%) kept their livestock under stall feeding however, there were only
29.1 % households who followed the mixed practice and 13.3 % households were followed the
free grazing system (figure 15).
The households were gradually shifting from traditional free grazing system of feeding to the
improved stall feeding system of livestock. Similar finding was also reported by Dhakal (2001)
and Poudel (2003) in the buffer zones of all Parks/reserve area of Nepal.

Aryal, Maniratna: Final Report
Figure 15: Feeding system adopted by the respondents of the Bachhauli VDC
5.2.5 Crop raiding and livestock depredation
Four major crops (paddy, wheat, maize, and oilseed) and others were considered on the basis of
the severity of damage caused by wild animals. The study of DNPWC/PPP (2002) had also
ranked these crops on the higher level of severity continuum. Among different crops, wheat was
most damaged crop followed by maize, paddy and oilseed. Crop losses were higher in Close to
Park (≤150m Park boundary) than Far to Park which was supported by the Poudel (2003) by
mentioning high intensity of damage by wildlife in a distance of 1-5 km from the
Park.
Figure 16: Frequently reported crop damage by wild animals in the Bachhauli VDC (2008)

Aryal, Maniratna: Final Report
Major three wild animals i.e., Rhinoceros, Wild pig (Bandel), Chital (Spotted deer) and elephant
caused damage to the standing crops. The intensity of damage caused by rhino was far more than
others (figure 17). The crop damage by wild animals from the Park was still a perennial problem
which in turn, had remained a source of Park people conflict (supported by Kheral, 1993 and
Poudel, 2003). This was further justified by the gradual reduction in the grassland area from
7051 ha to 5521 ha in a short time span of 22 years (1978-2000 A.D.) in the Park (DNPWC/PPP,
2000). To minimize the crop damage, different measures were in operation with the support of
programme and the individuals’ efforts in the study area. These were electric fencing, wire fenc-
ing, trench, watchman (Machhan) and altered cropping system (Appendix 11).
Figure 17: Wild animals causing damages in the Bachhauli VDC of Chitwan
Electric fencing was a new measure used in Bacchauli (Sauraha) area to protect the crops from
wild animals and was found more effective than other measures. More than 54 locals were sup-
ported that crop damages was controlled by electric fencing (Appendix 11). This system was
planned to extend in other areas too. After electric fencing, wire fencing and Machhan was found
more effective to control damage. Only about 46.3 % respondents rated the various control
measures as very effective. More respondents did not adopt the crop alternation practice. They
did not abandon the prevalent local farming practices, although use of the repelling crops was
reported very effective to reduce the wild animal damage in buffer zone of Bardia National Park

Aryal, Maniratna: Final Report
(Dhakal, 2001). Despite such, majorities of respondents were fully dependent on the barbed wire
fencing along the trenches which was not only a panacea of controlling the wildlife damage of
the study area.
DNPWC/PPP (2000) indicated that there was gradual reduction in wild animal intrusion in the
buffer zone of Chitwan National Park. There were some factual instances of reduction of the
crop damage in the study area. Dhakal (2001) stated that the intensity of crop damage in Chitwan
National Park was reduced by approximately 25 % through the adoption of animal preventive
measures after the programme implementation. Nearly 30 % of the respondents reported the crop
damage during interview. This might give ample instances for a positive signal towards the slight
reduction of wildlife damage to the standing crop. Electric fencing was the best measure to pro-
tect the standing crops and livestock from wild animals and helped to reduce more than 80 %
crop damages in Bachhuali and Patihani VDCs of Chitwan National Park (March/2008, Group
discussion).
5.2.6 Threats to human and animal life
This study showed that the wild animal damage declined as the distance increased from the Park
boundary. But, the trend of predation still persisted as alarming problem except in the area of
electric fencing. During 1998-99, 72 cattle, 3 goat and sheep were killed in the Goths or sheds
and 16 cases of human casualties and 42 cases of injuries by wild animals had been reported to
BZDC (Dhakal, 2001) which highlighted the conflicting situation between the Park and local
communities. About 163 animals were killed in sheds and 20 cases of human death and 22 cases
of injuries by wild animals had been reported to Chitwan National Park, Kasara, Chitwan (An-
nual report 2003/04).
The programme has a provision of compensation related to wildlife damage for general human
injury, injury leading to disability, human death, goat, sheep and cattle lifting. BZDC has sets
different limitations for compensation where Rs. 50,000 in case of human death. The victim
households would obtain 25 % (up to 5,000) of actual cost of the lifted goat/sheep/cattle from the
shed. However, the Programme has started compensation for crop loss also (seed donation). But
seed donation was not found as effective as the livestock compensation.
Though the victimized households obtained the compensation, majority households were not sa-
tisfied with such compensation but only 22.7 % households were satisfied where majority were

Aryal, Maniratna: Final Report
from rich family (Appendix 13). These facts showed that the depredation and crop damage as
well as human life loss/injuries were still in an alarming rate but measures taken were insuffi-
cient and less effective. Satisfaction level is in increasing trend than before. After the implemen-
tation of buffer zone programme, compensation system was initiated and now in increasing rate.
There was no compensation system for crop damage initially but now there is compensation sys-
tem for crop damages (seed supply). Therefore, such distressing instance had aggravated the con-
flicting situation of the sampled households with the Park administration as indicated by the
sampled household data.
5.2.7 Natural calamities
Based on the data/information gathered from PRA and field observation during meetings, there
were three main rivers (Narayani, Rapti, Reu) with many other small rivers (Dhungre khola,
Budhi Rapti) and springs which traversed along the study area. Therefore, there was severe prob-
lem of monsoon flooding causing the shift of river course toward farming and settlement area
thus resulting in the increment of the Park area from 932 sq. km. to 1182 sq.km due to the addi-
tion of the private cultivated land of the local communities (ECOS, 2002). Banstola et al., also
(1997 cited in DNPWC/PPP, 2002) reported that there was problem of erosion of agricultural
land with an average rate of 2.6 ha/year and land cutting by river resulted in a net increase of riv-
er and sand category of land from 10,649 ha in 1978 to 11,870 ha in 1992.
The chance of occurrence of monsoon flood was varied across and within the location. However,
there was almost no problem of flood in Far to Park (more than 150 m from forest boundary)
area because it was far from the river course. Of the total, 24.2 % respondents stated that they
were constantly facing the problem of monsoon flooding, 18.1 % household reported that there
was also chance of monsoon flooding of Rapti River, Reu khola but majority (57.6 %) did not
have the problem of flooding (Appendix 12).
During group discussion, the respondents pointed their pathetic moment of massive loss occurred
due to the flooding of Rapti in Sauraha and Jagatpur in 2002 where hundreds of households be-
came squatters and helpless and hundreds of cultivated land became barren field. However, these
victim households did not get any compensation for their gigantic loss. In fact, this situation had
further jeopardized the livelihood of the subsistence farmer and had constantly increased their
dependence on Park resources.

Aryal, Maniratna: Final Report
5.3 Human resource development
The programme organized various specialized training to enhance the institutionalized capacity
of UGs/UCs. Such specialized training were of two types (i) specialized training for organiza-
tional capacity building, and (ii) specialized training for income generation. Of the total trainees,
27 participated in institutional development i.e., record and book keeping, leadership develop-
ment and 38 households participated in skill enhancement training namely bee-keeping, poultry
farming, pump set maintenance, nature guide, off/seasonal vegetable production, bio-gas mason
(Appendix 14). it was seen that about 24 % participated in tourism related training as nature
guide followed by agro based (21 %) to increase the income level of respondents provided by
Baghmara community forest (figure 18).
Figure 18: Different trainings taken by respondents of the Bachhauli VDC of Chitwan (2008)
Majority (61.5 %) of the trained participants started training related professions like poultry
farming, off/seasonal vegetable production, biogas and pump set technician, nature/tourist guide,
hotel management, and cook. In case of agro based training, 19 members participated in
off/seasonal vegetable production where nearly 60 % started to produce vegetable in a small

Aryal, Maniratna: Final Report
scale and developed selling practice in the local market. Out of 38, seven teen trained partici-
pants in biogas and pump set repair and maintenance initiated rendering services for benefit of
their communities and on commercial basis (Group Discussion).
The study revealed that the nature guide and hotel management training was very effective where
all the participants immediately got job opportunities in the local hotel and lodges. Similarly, out
of 21 households of livestock based, 14 participants started poultry farming business at a com-
mercial scale as the major source of the income. In case of forest related training, nursery seedl-
ing raising was conducted in which one participant became nursery naike for the production of
seedlings with the financial support from the Programme.
5.4 Tourism pressure and impact
Majority of the respondents reported the positive consequences of tourism where most of them
were from rich followed by poor and medium family. Among the various positive consequences,
majority (33.8 %) stated that the tourism had created employment opportunities in local hotel
and lodge especially in the rich family. This is because the Chitwan National Park is the most
attractive and well-facilitated tourism destination in Nepal. A large number of tourists visited
every year was illustrated by the substantial increment of visitors from 836 in 1974/75 to
1,00,000 in 1999 (DNPWC/GN, 2001).
Similarly, other positive consequences were support for national revenue, market potentiality of
the local produce, and increased conservation strategy of natural flora and fauna from both pub-
lic and government sector. On the contrary, 30 % households also reported the considerable neg-
ative impacts of the tourism in the local community and environment which was also supported
by the finding of Sherpa (2000) in Sagarmatha National Park. These negative impacts were: -
changes in socio-cultural structures and practices, and economic imbalances and disparities re-
ported by 29.5 %, depletion of natural resources by 18 % and environmental pollution by 52.5 %
of the households (Appendix 15).
This data showed that there was unplanned and uncontrolled tourist influx and activities in study
area with limited economic opportunities for local people, which in turn, had adversely affected
the local cultural and social life. In the study area, the tourism activities was found highly loca-
lized in certain patches of study area i.e., only to Sauraha of Bachhauli VDC. There were inade-
quate infrastructures to promote community based eco-tourism in this study area.

Aryal, Maniratna: Final Report
The tourism affected the socio-economic patterns of the household and environment as a whole.
During the feasibility study of the PPP in 1994, the local communities of Chitwan and Bardia
were against the lodges and tented camps inside the national Parks and these communities stated
that the tourism might only be developed in the cost of the environment and could not contri-
buted much to the local economy (DNPWC/PPP, 1996). After six years of Programme, there was
not satisfactory improvement in tourism sector though the study area was renowned for its
unique natural beauty. Along this, respondents viewed tourism only from the materialistic benefit
point of view because only few respondents stated that tourism had helped in conservation of
natural flora and fauna.
5.5 Community development initiatives
From the beginning of the Programme implementation, community forestry focused on the vari-
ous community development and conservation awareness activities. In totality, more than 58 %
respondents perceived that the Programme focused on the public infrastructure development like
construction and/or maintenance of irrigation canal, deep tube well boring, roofing and repair of
school, electric pole supply, culvert making, gravelling of the road whereas only 30.1 % told that
the Programme had focused on the awareness creating activities in the study area (Figure 20).
This data sufficiently indicated that the Programme was diverted in the community development
rather than creating the awareness among the local people of the study area.
Figure 19: Perception of respondents in community development by community forest
However, it would be rather to sensitize the UG members towards the conservation issues of pro-
tected areas because there were huge mass of illiterate population in the study area. The Pro-

Aryal, Maniratna: Final Report
gramme progress report also stated that the Programme had emphasized the physical infrastruc-
tures development of the buffer zone (DNPWC/PPP, 2001).It might be difficult to involve them
in the conservation programs without motivating them in conservation issues.
5.6 Park management
Various environment friendly initiatives were undertaken inside the Park and community forest
areas to improve wildlife habitat. By realizing this fact, the Programme started different Park
management activities like improvement of about 31 km barbed wire with trench, 53 ha grass
land management, 3 ha wetland conservation in about 12 ha, 4 water hole management in Tamor
Tal, Lami Tal, Kamal Tal and Devi Tal, construction of 5.8 km fire line road and 4 animal or-
phanages inside the Park (DNPWC, 2002). The main thrust of these activities was to reduce the
conflict between Park and the people. Though the respondents reported different reasons, the
main factor was inadequate conservation education and awareness program and limited cover-
age. These facts gave an indication of relationship between Park and people but it was found the
situation did not satisfactory improve as it was expected. The cross tabulation value revealed that
the local people’s involvement in forest management activities did not depend on location, caste,
educational attainment level, occupation, food sufficiency period, co-operatives of Park adminis-
tration (Table 10).
Majority of the sampled households reported that these APIs were ineffective to control wildlife
intrusion in settlements. Also, Dhakal (2001) had reported increase in the population of rhino
after the PCP in Chitwan National Park. People’s participation in Park management for improved
effectiveness of APIs were significant in the conservation and increasing population of wild life,
but the APIs were not effective in controlling intrusion wildlife in the settlements except electric
fencing. Thus, this situation was still provocation of more conflicting situation between Park and
people jeopardizing relationship of buffer zone communities and Park administration.

Aryal, Maniratna: Final Report
Table 10: Relationship of Park management with other related variables (2008)
Relation between X2 df Level of significance
Park management and location 3.34 2 P<0.309(not significant)
Park management and education 5.41 6 P<0.621 (not significant)
Park management and caste 6.24 6 P<0.299(not significant)
Park management and occupation 4.85 8 P<0.663(not significant)
Park management and food sufficiency 8.82 6 P<0.132 (not significant)
Park management and cooperativeness 5.86 6 P<0.562(not significant)
Park management and effectiveness of APIs 9.74 4 P<0.030 (significant)
5.6.1 Cooperativeness of Park administration
Majority (59.6 %) of the households reported gradual improvement of cooperativeness of Park
administration; on the contrary, 6.4 % stated that the relationship was further deteriorated. Simi-
larly, 18.2 % households reported that they did not have any contact with Park staffs whereas 16
% households were in a state of static relationship with the Park administration (Figure 20).
Figure 20: Relationship of Park administration with the local people of Bachhauli
This finding was similar to that of the study conducted in similar programme areas of PCP.
ECOS (2002) stated that though the government had posted 700 Nepalese Army inside the Park,
however, their relationship with the local communities was not pleasing. On the contrary, due to

Aryal, Maniratna: Final Report
inadequate communication and interaction, the relationship had further accentuated infringement
between them.
5.7 Benefit sharing among the participants
Every member was getting benefits from community forest by either one or another way. The
facility of grass/fodder and fuel wood collection was the major activity from which all the users
groups were benefited from forest products. Community forest was generating income from eco-
tourism as well. The money from eco-tourism was partially spent on community development
activities. Bio-gas scheme was supported from community forest as an important alternative
energy source for fuel wood, which enhances the conservation as well as the health of local
people. To install biogas, finance was needed during initial stage. So the biogas scheme became
mainly useful for the middle class with some upper middle class families. So the lower class
families were not benefited from this scheme. Although the community forest was distributing
Improved Cooking Stoves (ICS) to the low income families, the benefit sharing was still unbal-
ance. In addition, women were more benefited than men as they were receiving trainings, im-
proved cooking stoves and biogas. Community forest was encouraging user’s group members to
construct toilets by providing material supports. Apart from these, the large amount of income
was used in development works like road gravelling, school, bridge and dam construction, and
donation for different developmental activities. Community forest also created employment op-
portunities for local people. Due to eco-tourism on community forest people working in the ho-
tels, lodges, elephant stable, tourist guides, and shops were indirectly benefited from community
forest. Most of the members were engaged in agricultural activities and stall feeding of livestock
was also higher in this area as results the people were encouraged to use biogas as an alternative
source of energy. Some people living adjacent to the Park still continue to rely heavily on vari-
ous wild edibles such as mushrooms, roots and tubers to supplement food deficiency and vegeta-
bles. The Darai, Tharu, and Bote ethnic groups are traditionally engaged in and dependent on
fishing. The Park provided special fishing concession to Bote ethnic groups. Fishing is a major
food and income source for these people.
Annual grass cutting operation in the Park
The establishment of CNP and subsequent reinforcement of the Park rules and regulations has
restricted many people from using the Park resources. Trespassing the Park boundary without a
Aryal, Maniratna: Final Report
valid reason was legally prohibited. However, people living outside the Park had no legal means
to claim any compensation for the damages caused by wildlife of the Park before the implemen-
tation of buffer zone. Consequently there is extensive dissatisfaction of the people, disobeying
Park regulations and sabotaging of Park properties, which have posed serious problems for the
Park management.
Because of these problems the national Park authorities has tried to reconcile between the con-
servation needs of the Park resources and meeting the immediate survival needs of the people
living adjacent to the Park. In 1976, Park authority opened the Park for collecting khar, kahadai
and grass for 20 days during the month of January. These materials were essential for housing
and other purposes and were not readily available adequately outside the Park. In 1881, the grass
cutting period was subsequently reduced to 15 days only which has further been reduced to 10
days from 1995 and 5 days since 2004 A.D.
Grass and Khadai harvest rate
A sample survey of 203 households indicated that an average harvest rate of 80 bales of grass per
household. Assuming that an average weight of a bale of grass is 3 kg, the amount of grass col-
lected per household is 240 kg. There are variations in the amount of grass collected by VDCs
and ethnic groups depending on the size of livestock, working members of the families and the
proximity to Park among other things.
Khadai is the local name for canes used as building material for house, fencing. The average
quantity of khadai collected per household was 25 mutha per year (150 kg per household per
year). Nepal and Weber (1992) reported an average of 12 loads of khadai per household. This
harvest rate was relatively higher (16 loads) among the households living closer to the forest.
The same study also indicated that among the sampled households living adjacent to the Park, 94
% of them extracted less than 26 loads, another 4 % harvested between 26 to 50 loads while the
rest extracted 51 to 75 loads of khadai. Considering that an average load of khadai consist of 3
mutha, the estimates reported in Nepal and Weber study matches fairly well with estimates of the
present survey reported.

Aryal, Maniratna: Final Report
5.8 Utilization and management of forest product
5.8.1 Forest resource demand and utilization
Average grass demand in the study area was 23.7 kghh-1 per day. The daily grass demand per
household was found 34 kg, 24 kg and 30 kg in Rich, Medium and Poor family respectively (Ta-
ble 14). Only 9.3 kg of the actual demand was collected in average by each household per day.
The amount of grass collection depended on the size of livestock and the distance from the grass
collection place. The quantity of grass collection per household was found higher in rich family
that may be due to the accessibility to community forest which lies very near to these areas.
Previous record showed the average fodder collected by households in CNP Buffer Zone was 29
kg. The average was slightly higher in summer than in winter season. Fodder harvest by house-
hold also varied with ethnic groups, size of livestock holdings, its composition and rearing prac-
tices, access to fodder sources etc. Tharu communities were found to have a relatively higher
harvest rate (34 kg) than other ethnic groups. This was because of the relatively greater extent of
stall feeding adopted by Tharu household (53 %) (NTNC,1996). The average grass demand re-
duced in this study was due to the reduction in LSU.
Table 11: Grass demand and Actual collection in the Bachhauli VDC (2008)
Category Grass demand(kg) Av. Grass
demand(kg/hh)
Grass
collection (kg)
Av. Grass collected
kg/hh
Rich 845 20.6 520 12.7
Medium 780 11.6 476 7.1
Poor 745 7.8 410 4.3
Total 2370 1406
Source: BBZCF, 2007/08
There was no restriction in grass/fodder collection in the community forest for user’s group
members. They could collect grass/fodder from sunrise to sunset each day. The community for-
est area alone was not sufficient to fulfill the demand of grass/fodder for user’s group members.
Only 12.1 % of the users group members were dependent community forest for grass collection.
In average 9.3 kg of grass per household per day were collected from Baghmara Community
Forest, the remaining demand was fulfilled either from forest or farm lands. Agricultural bypro-
ducts like crop residue were also used instead of grass/fodder. More than 33 % people were de-

Aryal, Maniratna: Final Report
pended on these by products as an alternate for fodder. Community forest area was well fenced
and grazing was banned.
5.8.2 Baghmara Buffer Zone Community Forest management
Forest management included activities carried out in the forest to improve its condition and long
run viability. The activities like weeding, thinning, pruning, clearing, and other planned activities
which are carried out for the improvement of forest were studied. Most of the forest management
activities are carried out in accordance with the forest users group work plan. The users group
committee found actively participated to implement these management operations. All manage-
ment works were found implemented with the technical and financial assistance and advice from
CNP. The users group committee members regularly meet on the second day of every new
month of Nepalese calendar to discuss various management issues. Rules and regulations to con-
trol livestock grazing inside the forest, illegal cutting of plants, wildlife poaching, and fishing
were found properly implemented. The forest and the plantation areas were barbed fencing and
electric fencing to protect from livestock grazing. Similarly to prevent from crop depredation
from Rhino trenches were also constructed.
Initially Baghmara community forest was opened to collect fuel wood for two days twice a year
(during May and November). But now it opened for three days twice a year. The period was ex-
tended due to high fuel wood demand. Only the users group members allowed to collect dead
woods, twigs and branches from community forest. Fresh plants were prohibited to collect.
Community forest alone was not being able to fulfill the demand of firewood.
Faunal diversity was higher in Baghmara community forest. Various management approaches
were adopted to manage wildlife inside the community forest. Strict rules and regulations were
applied and regulated for the conservation and management of these wildlife species. Poaching,
damaging and distributing any wildlife species were strictly prohibited inside the forest. Fishing
was completely banned. Since it was the only source of income of the Mushahar/Bote communi-
ty, they tried to do fishing escaping from the eyes of the forest guards. They still spread their nets
in the rivers of the community forest during early morning’s and late evenings. Habitat loss was
the major threat to the wildlife. Waterholes and grass land were restored to provide suitable habi-
tat for wildlife.

Aryal, Maniratna: Final Report
5.9 Utilization of financial resources of Baghamra Buffer Zone Community Forest
The major source of income of the Community Forest Users group could be classified into two
categories:
a. Income from eco-tourism
b. Income from forest products selling
5.9.1 Income from ecotourism
Ecotourism was one of the major sources of income of Baghmara Buffer Zone Community For-
est. This Community Forest was the first, which develop ecotourism programme, following the
successful re-colonization of forest by chariasmatic species including tiger and rhino (Cohrane,
1999). Activities like elephant ride, sleep over in Machan (viewing tower). Jungle walk and ca-
noeing including the entrance fee were the major source of income which was used for conserva-
tion and developmental activities. The local people were also getting various indirect benefits
from eco-tourism income. The government money that the local VDCs can spend on develop-
ments per year was NRs 10,00,000 which was less than Baghmara Community Forests annual
income.
5.9.2 Income from forest product
Selling of forest product was another source of income in Baghmara Community Forest has been
generating substantial amount of fund by selling fuel wood, dead and dying trees from thinning,
pruning and clearing activities. The area seems to be quite productive for other forest products
like medicinal plants. But the users group was not interested to produce such products. The main
reason for this may be the easy money generated from the eco-tourism activity.
Table 12: Annual savings of Baghmara Buffer Zone Community Forest in different years (NRs.)
Year Total income Total expense Savings
2061/62 23,26,977 21,27,342 1,99,635
2062/63 35,11,610 26,54,719 8,56,891
2063/64 55,57,146 39,95,182 15,61,964
5.10 Benefit Cost ratio of Chitwan National Park
Monetary value of the resources harvested during the grass cutting period varies across the stu-
dies depending the parameters used e.g. Number of people participating in each event, type of
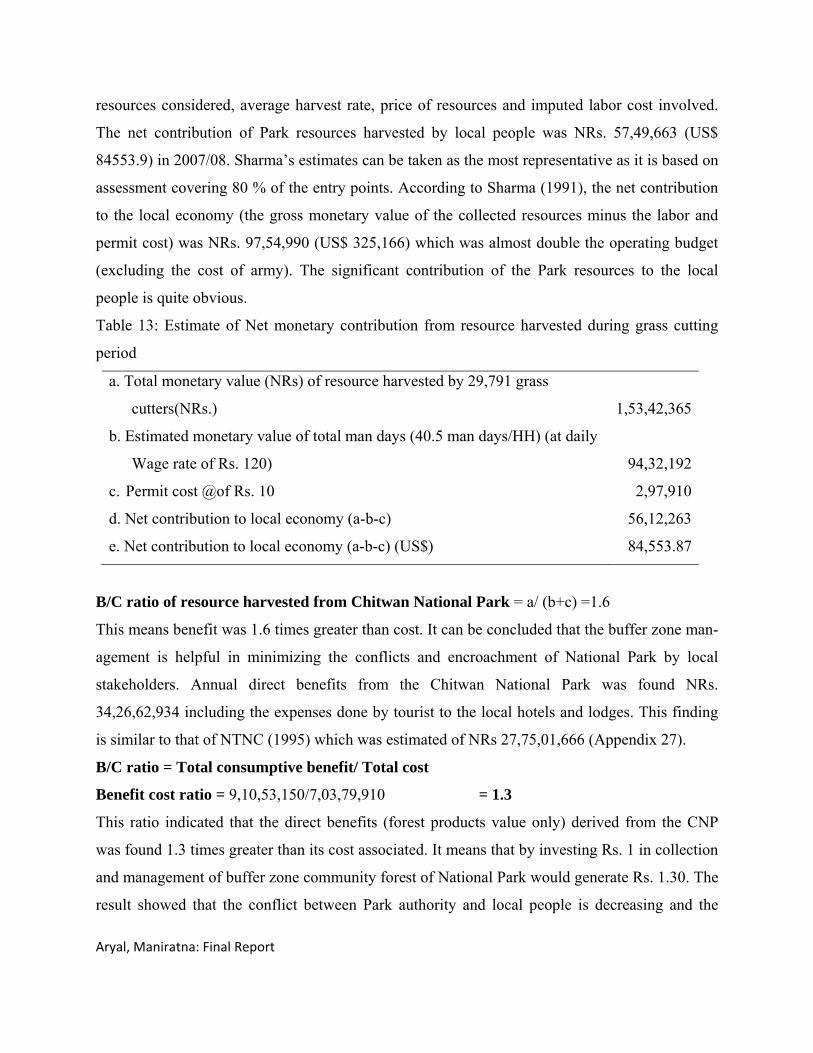
Aryal, Maniratna: Final Report
resources considered, average harvest rate, price of resources and imputed labor cost involved.
The net contribution of Park resources harvested by local people was NRs. 57,49,663 (US$
84553.9) in 2007/08. Sharma’s estimates can be taken as the most representative as it is based on
assessment covering 80 % of the entry points. According to Sharma (1991), the net contribution
to the local economy (the gross monetary value of the collected resources minus the labor and
permit cost) was NRs. 97,54,990 (US$ 325,166) which was almost double the operating budget
(excluding the cost of army). The significant contribution of the Park resources to the local
people is quite obvious.
Table 13: Estimate of Net monetary contribution from resource harvested during grass cutting
period
a. Total monetary value (NRs) of resource harvested by 29,791 grass
cutters(NRs.) 1,53,42,365
b. Estimated monetary value of total man days (40.5 man days/HH) (at daily
Wage rate of Rs. 120) 94,32,192
c. Permit cost @of Rs. 10 2,97,910
d. Net contribution to local economy (a-b-c) 56,12,263
e. Net contribution to local economy (a-b-c) (US$) 84,553.87
B/C ratio of resource harvested from Chitwan National Park = a/ (b+c) =1.6
This means benefit was 1.6 times greater than cost. It can be concluded that the buffer zone man-
agement is helpful in minimizing the conflicts and encroachment of National Park by local
stakeholders. Annual direct benefits from the Chitwan National Park was found NRs.
34,26,62,934 including the expenses done by tourist to the local hotels and lodges. This finding
is similar to that of NTNC (1995) which was estimated of NRs 27,75,01,666 (Appendix 27).
B/C ratio = Total consumptive benefit/ Total cost
Benefit cost ratio = 9,10,53,150/7,03,79,910 = 1.3
This ratio indicated that the direct benefits (forest products value only) derived from the CNP
was found 1.3 times greater than its cost associated. It means that by investing Rs. 1 in collection
and management of buffer zone community forest of National Park would generate Rs. 1.30. The
result showed that the conflict between Park authority and local people is decreasing and the
Aryal, Maniratna: Final Report
management of Park with the buffer zone programme is found effective to resolve the conflict
and conservation of natural resources, and biodiversity.
5.11 Opportunity cost of the Park measured in terms of local crop production
Opportunity cost of the Park has been estimated based on the productivity of the cultivated land
in and around the Park. The study deals with the question such as what would have been pro-
duced if the Park land were cultivated for agricultural production.
The average net income per katha from the agriculture of the study area is Rs. 583.9 per annum
(Table 14). The total area of Park land is 932 Sq.km, which is equivalent to 2819116.6 katha. If
the Parkland were cultivated, it would yield Rs. 2819116.6*583.9 = 1,64,60,82,182.74 equiva-
lent of the agriculture production per annum. The amount can be considered as the benefit fore-
gone by the nation in terms of crop production for the existence of the Park.
The estimated opportunity cost of the Park based on the crop production value in adjoining culti-
vated land, approximately 1.64 billion per year, is the benefit forgone by the nation for the estab-
lishment and development of the national Park. The present use value of the Park is inadequate
to compensate the benefit foregone. The Park has various intrinsic values other than the present
use value. What is crucial in this connection is the existence and option value of the Park. It is
due to the existence and option value of the Park that the nation is sacrificing a large amount of
economic value at present. The estimation of existence and option value of the Park is the area of
further research.
The government revenue generated from the Park has reached 5,44,92,333.4 for the fiscal year
2007/08. The number of visitors has reached 1,10,125 including Nepalese. The business sector
involvement in the Park is also an important aspect of income generation. The employment gen-
eration is one of the facets of the business sector involvement.
The Park has also been engaged in the local community development in surrounding area. The
Park management is interested in the community forest and other income generating projects in
the adjoining household. It is also involved in the local road construction. The buffer zone
scheme of the Park is also an attempt to facilitate the local development and the sustainable man-
agement of Park resources. The Park aims to involve local community in conservation efforts
with the sharing of 50 % Park revenue to be invested in the community development.

Aryal, Maniratna: Final Report
All these attempts of the Park can not be underestimated in terms of the present benefit. But the
present opportunity cost seems skyrocketing. The cost exceeds the benefit at present. However,
the future stream of benefits from nature conservation can not so easily be anticipated. Nature
conservation is a priceless regime.
Area equivalent
1 bigha = 20 katha
1 katha = 330.679 sq.m
1 sq.km = 3024.8033 katha
932 sq. km = 2819116.6 katha (CNP Total Area)
Table 14: Annual net income from one katha of cultivated land (Income from Agriculture)
Location Households Total annual Income Average annual income per katha
Rich 41 48,759 1,189
Medium 67 38,526 575
Poor 95 31,256 329
Total 203 1,18,541 583.9

Aryal, Maniratna: Final Report
6. TOURISM
6.1 Introduction
This chapter examines tourism activities in and around the national Park. Sustainable promotion
of tourism activities/ component in the national Park requires integrated management and devel-
opment of different components of tourism. Increasing local economic benefits of tourism have
been recognized as critical for conservation. Such benefits need to be directed towards local
people by developing stronger linkages with the local economy. In this chapter information ob-
tained from the tourism survey (visitor, hotel employee, and visitor guide surveys) are analyzed
including the impacts, perceptions and attitudes.
6.2 Tourism trends in Chitwan National Park
Since the establishment of the first wildlife safari lodge in 1965, Chitwan has grown as a tourist
destination. As a tourist destination, the Chitwan National Park is both a destination within Nepal
as well as a part of a tour circuit. In the seventh five year plan, (1987-1992), Chitwan National
Park became one of the five tour areas put forward as part of a tour package promoted by the
private sector (GoN/NPC, 1985). The number of tourists to Chitwan National Park has increased
from 836 in 1974 to over 64,000 in 1994/95 (Appendix 26). While this has followed the national
trend (13 %), a sharp increase in the tourist flow to Chitwan can be noticed after the completion
of feeder road from Narayangarh to Mungling in 1984, which has greatly increased the accessi-
bility to the national Park. Seven high cost tourist lodges (Concessionaires) have licensed to op-
erate inside the Park. The number of lodges outside the Park has also increased during this period
from about 10 in 1975 to 53 in 1995, which has provided employment and income opportunities
to many people.
6.3 Visitors survey results
Altogether 80 visitors were surveyed. Questionnaires were administered to visitors residing in
different hotels in Sauraha and were latter collected some were taken direct interview with the
tourist from their rest places.
6.3.1 Visitor’s characteristics
The majority of the tourist visiting the national Park were Europeans (43.8%) followed by North
Americans (28.7 %), Asians (16 %), Africa (3.8 %) and South American (3.8).

Aryal, Maniratna: Final Report
About 52.5 % of the visitors surveyed were male and the rest were females (47.5). The sex com-
position of the visitors varies across nationality. Visitors from African and North America were
mostly females (Table 15).
Table 15: Number and Percentage of visitors’ Nationality and sex composition (2008)
Nationality Male Female Total
Europe 19(45.2) 16(42.1) 35(43.8)
North America 11(26.2) 12(31.6) 23(28.7)
Asia 9(21.4) 7(18.4) 16(16)
South America 2(4.8) 1(2.6) 3(3.8)
Africa 1(2.4) 2(5.3) 3(3.7)
Total 42(52.5) 38(47.5) 80(100)
Source: Field Survey, 2008. *figures in parentheses indicate Percentage.
About 31.2 % of the visitors were 26-40 age groups. 27.5 % were less than 25 yrs of age while
those 41-55 years were about 18.8 % and above 56 years were 22.5 % (Table 16).
Table 16: Age distribution of visitors’ visiting the Chitwan National Park (2008)
Age(Years) Male Female Total
≤25 12(28.6) 10(26.3) 22(27.5)
26-40 13(31) 12(31.6) 25(31.2)
41-55 8(19) 7(18.4) 15(18.8)
≥56 9(21.4) 9(23.7) 18(22.5)
Source: Field Survey, 2008. *figures in parentheses indicate Percentage.
The majority (66.3 %) of them were earning less than US$ 30,000 annually, 25 % belonged to
annual income of US$ 30,001-45,000 annual income (Table 17).
Table 17: Annual income of sampled tourist visiting the Chitwan National Park (2008)
Annual Income(US$) Male Female Total
≤15,000 13(31) 11(28.9) 24(30)
15,001-30,000 16(38.1) 13(34.2) 29(36.3)
30,001-45,000 10(23.8) 10(26.3) 20(25)
45,001-75,000 3(7.1) 4(10.5) 7(8.7)
Source: Field Survey, 2008. *figures in parentheses indicate Percentage.

Aryal, Maniratna: Final Report
Service was the major occupation for majority of the visitors (46.3 %) followed by business (20
%) and student (16.3 %). Those falling in the lower income brackets were mostly students (Table
18).
Table 18: Occupation of tourist visiting the Chitwan National Park (2008)
Nationality Service Business Farmer Student Others
Europe 20(54.1) 6(37.5) - 5(38.5) 4(33.3)
North America 9(24.3) 5(31.3) 2(100) 3(23.1) 4(33.3)
Asia 6(16.2) 4(25) - 4(30.8) 2(16.7)
South America 1(2.7) 1(6.3) - - 1(8.3)
Africa 1(2.7) - - 1(7.7) 1(8.4)
Total 37(46.3) 16(20) 2(2.5) 13(16.3) 12(15)
Source: Field Survey, 2008. *figures in parentheses indicate Percentage.
6.3.2 Means of Travel
A large portion of the visitors (51.3 %) stated bus as their chief means of traveling to Chitwan.
28.8 % used private vehicles and only a few opted for the air service to Chitwan. Those who tra-
velled by air were mostly formed staying in expensive hotels. Most of those travelling to Chit-
wan by bus stayed in low budget hotels (Table 19).
Table 19: Means of travel used by tourist to visit the Chitwan National Park (2008)
Nationality Bus Plane Private Vehicles Others
Europe 17(41.5) 4(57.1) 12(52.2) 2(22.2)
North America 12(29.3) 3(42.8) 6(26.1) 2(22.2)
Asia 8(19.5) - 5(21.7) 3(33.3)
South America 2(4.9) - - 1(11.1)
Africa 2(4.9) - - 1(11.2)
Total 41(51.3) 7(8.8) 23(28.7) 9(11.2)
Source: Field Survey, 2008. *figures in parentheses indicate Percentage.

Aryal, Maniratna: Final Report
Table 20: Package tour and Average cost per package of tourist in Chitwan National Park
Nationality Package tour Other Average cost per package(US$)
Europe 25(46.3) 10(38.5) 175
North America 15(27.8) 8(30.8) 160
Asia 10(18.5) 6(23.1) 100
South America 3(5.6) - 140
Africa 1(1.9) 2(7.7) 125
Total 54(73.8) 26(26.2) 140
Source: Field Survey, 2008. *figures in parentheses indicate Percentage.
About 73.8 % tourist visited the Chitwan National Park in package through different travelling
agencies and rest used individual tour to Chitwan National Park (Table 20). Average cost per
package tour was found US$ 140 for 3 days and 2 night including travel cost from Kathmandu to
Chitwan National Park.
6.3.3 Duration of stay
A large majority of the visitors stay ≤3 days in Chitwan National Park (CNP). The average
length of visitors stay in CNP was 3.27 days, whereas the average intended length of stay in
Nepal was 24.88 days (Table 21). Only 13.1 % of the visitor’s total stay in Nepal is actually
spent in Chitwan, indicating that most tourists coming to Nepal have other destination besides
Chitwan National Park in Nepal. By nationality, the average length of stay in CNP was the high-
est for European group (3.89 days) followed by African (3.79 days). It was the lowest among
Asian tourists (2.57).
Table 21: Average days spent in Chitwan and Nepal by tourist (2008)
Nationality Average days in Chitwan Average days in Nepal
Europe 3.89±1.97 33.1±35.6
North America 2.79±1.19 41.1±59.2
Asia 2.57±0.78 12.5±6.9
South America 3.25±3.26 26.3±20.34
Africa 3.79±1.12 11.4±2.4
Total 3.27±1.66 24.88±25.38
Source: Field Survey, 2008. *figures in parentheses indicate Percentage.

Aryal, Maniratna: Final Report
6.3.4 Visitor’s willingness to pay a higher entrance fee
Information on visitor’s willingness to pay provides a realistic basis for setting visitor entrance
fees. Asked if they were willing to pay more for visiting the national Park under the current level
of services, about 75 % of the visitors surveyed responded affirmatively. This willingness to pay
higher entrance fee was relatively greater among European (48.3 %) and North American (33.3
%) visitors, who were mostly in the 26-55 yrs age group and belonged to middle income level
(US$ 15,000 to 45,000). Willingness to pay a higher entrance fee for the current services was
found to be generally higher among those who stayed relatively longer periods (2 to 4 wks) in
Nepal.
Table 22: Visitors reporting their willingness to pay more to visit Chitwan National Park
Nationality Yes No
Europe 29(48.3) 6(30)
North America 20(33.3) 3(15)
Asia 9(15) 7(35)
South America 1(1.7) 2(10)
Africa 1(1.7) 2(10)
Total 60(75) 20(25)
Source: Field Survey, 2008. *figures in parentheses indicate Percentage.
Information on the level of the incremental fee to the Park was also obtained form the visitors.
The average incremental fee based on the sample was US$ 7.86. There was a considerable varia-
tion in the maximum entrance fee by type of tourists. Large number of Europeans and North
Americans were willing to pay about the average of US$ 8 as incremental fee. The results indi-
cated that there is some potential for increasing the Park entrance fee without deterring visitors
and keeping the level of services to a desired level.
The willingness to pay incremental fee expressed by visitors also varied with the quality of guide
services. For example those who stated the guide services to be excellent expressed the need for
higher entrance fee than those who found guide services to be generally poor. This reflects the
need for enhancing the quality of guide services through proper training. About 45 % of the visi-
tors, mostly Europeans indicated that payment of higher entrance fee should be influenced by the
extent to which these resources were used for local development activities.

Aryal, Maniratna: Final Report
Table 23: Maximum Incremental Park entrance fee
Nationality Average
Europe 6.7±3.1
North America 7.1±3.6
Asia 9.2±2.1
South America 8.9±1.5
Africa 7.4±3.8
Total 7.86±4.3
6.5 Results from the Regression Analysis
Utility in economics is the satisfaction of individuals derives by consuming goods and services.
Utility increases at a decreasing rate with additional consumption until a saturation point occurs
and utility begins to fall. The incremental (marginal) utility can be represented as a downward
sloping demand curve to represent the rate of change in utility as consumption increases. It is
reasonable to assume that the quantity and quality of consumption depends on income and rela-
tive prices of the commodity consumed, among other things. Money prices then can be used to
measure an individual’s maximum willingness to pay, called the demand curve, to consume or
enjoy goods and services. The demand curve represents the amount of goods and services an in-
dividual is willing to pay at varying prices, given his income. The total willingness to pay also
represents total economic benefit. Often the willingness to pay exceeds the money price of the
item consumed or enjoyed by the consumer. The difference between the maximum willingness to
pay and the amount actually paid is known as consumer surplus. National Parks also offer satis-
faction as many individuals derive utility by observing wildlife, being in dense jungles, etc., for
which they spend a great deal of money. International visitors spend a great deal of money to vis-
it and enjoy national Parks in Nepal, e.g., travel expenses, accommodation and food, besides
paying for entrance fee.
There are difficulties in deriving demand curves for intangible services such as those enjoyed
from national Parks; since the different types of benefits that national Parks can offer varies sig-
nificantly. For many goods and services traded in the market, deriving demand curves are fairly
straight forward, but such is not the case for intangible benefits as in the case of national Parks.

Aryal, Maniratna: Final Report
Services can be simultaneously enjoyed by many and often it is not possible to exclude those
who are willing to pay to enjoy services (to a certain point). Such services posses the characteris-
tics of public goods. However, one faces both conceptual and practical problems in assigning
monetary value for intangible like recreational demand was the main component of demand.
Table 24: Results from the regression analysis of the trip generating function
Variables Coefficients T-values
Constant -0.07 -0.347
Travel cost -0.8 * 10-3 -0.627
Age 0.02 2.750
Gender 0.20 0.742
Nationality -0.12 * 10-2 -0.009
Income 0.57 * 10-4 0.418
Substitute -0.18 -1.190
Adjusted R2=0.384
Vij=-0.07-0.8*10-3TC+0.57*10-4Income+0.02Age-0.12*10-2Nationality+0.20Gender-0.18Substitute [8]
The R2 coefficient explains to what extent the included variables can explain the variation in the
number of visits made. The R2 value of the regression analysis was estimated to 38.4 %. Com-
pared to similar studies this value can be seen as a low value, and this would imply that the rela-
tionship between the number of trips made to the Park and the included variables is low.
And F-test to test the goodness of fit was performed with the F-value of 1.63 and the test could
not reject the null hypothesis at both one and 5 % significant level. This would imply that the
slope variables can not explain the number of visits made. The null hypothesis was that all slope
variables included in the model is equal to zero.
The income variable has the value of 0.57* 10-4; this means that the higher the household income
is the more visits you will do, ceteris paribus, which is correct according to economic theory. But
since the value is close to zero it would imply that a change in income has little effect on how
many visits that are made to the national Park.
The travel cost variable showed a negative value of -0.8*10-3, according to the theoretical
framework this seems correct, that the number of visits decrease as the travel cost increase. But

Aryal, Maniratna: Final Report
since the value is close to zero it would imply that a change in travel cost has little effect on how
many visits that are made to the national Park.
One of the dummy variables was the age variable which has the value 0.02, this would imply that
older people makes more visits. Gender was used as a dummy variable, the results showed that it
has a value of 0.20; meaning that if the respondent is a male more visits will be made than a fe-
male respondent would have made.
The respondents nationality was also used as a dummy variable, the results from this variable
was that if the respondent is a European they will make -0.12*10-2 less visits than others, which
seems correct since usually they have higher travel cost and would not make as many visits.
To test whether the coefficients are statistically significant to the number of visits a T-test was
performed. The results from the T-test showed that the only coefficient that was statistically sig-
nificant is the age coefficient. This does not mean that the other coefficient doesn’t have an ef-
fect on visits made, only that the model can’t prove it.
As expected, the travel cost has a negative relationship to the number of visits made to the Park
and income has a positive relationship to the number of visits made. But the model used to ex-
plain the number of trips made to the Park seems to be insufficient. This because of the values of
the travel cost coefficient and the income coefficient were close to zero and these two coeffi-
cients should be the two coefficients that has the biggest effect on how many trips that are made
to the Park.
6.6 The Consumer Surplus
As described above the individual average consumer surplus could, according to Garrod and
Willis (1999), be calculated as in equation (7).
Consumer surplus = Average visits/ Travel cost [9]
Applying the results in this model gave: 2112.5 = 1.69 / - 0.8 * 10-3 [10]
Aggregated consumer surplus = 1,10,125*2112.5 = 23,26,39,062.5 [11]
The aggregated consumer surplus for the national Park was calculated to 23 million USD, as
seen in equation 11. This value seems high, and a probable cause for the high consumer surplus
could be the low travel cost coefficient and survey of foreigners only. This since the consumer
surplus was calculated by dividing the average number of visits made to the Park by the travel
cost coefficient. A low travel cost coefficient would therefore result in a high consumer surplus.

Aryal, Maniratna: Final Report
Even though this value seems high it is possible that it is underestimated since the chosen me-
thod only captures the recreational value, and no other parts of the total economic value. In the
construction of the survey some of the problems with the travel cost method have been ap-
proached, but since we obtained a high estimate for the consumer surplus it seems likely that
some of the problems still remain. The consumer surplus has a high value and why the value
might be so high can, according to Garrod and Willis (1999), be that the consumer surplus is
highly sensitive to the specifications in the model.

Aryal, Maniratna: Final Report
7. SUMMARY OF MAJOR FINDINGS, CONCLUSIONS AND RECOMMENDATIONS
7.1 Summary of major findings
Participatory Conservation Programme and buffer zone was being implemented since 1995 and
1996 respectively in Chitwan District in order to reduce the Park people conflict through partici-
patory biodiversity conservation and socio-economic development initiatives. However, several
reviews of literature indicated that the situation had little improved. This gap created the oppor-
tunity to conduct this study to asses the conflict management and community development initia-
tives of buffer zone of Chitwan District through economic approach.
This study was carried out in Bachhauli VDC of Chitwan district by categorizing into three strata
based on well being ranking to harvest forest resources. From these a representative sample of
203 where 41 rich, 67 medium and 95 poor categories were selected respectively using stratified
random sampling technique proportionately. User group member, tourists and Park administra-
tion staffs were the primary source of primary data. Besides, other relevant and necessary infor-
mation were collected from secondary sources. For the evaluation of recreational benefit and
consumer surplus of Chitwan National Park, 80 tourists were selected for interview.
7.1.1 Socioeconomic characteristics
In this study, the average family size was 6.4, greater than the national average of 5.6 (CBS,
2002) which was found higher in poor because of lower level of literacy. In addition, this area
was typically composed of traditional ethnic groups. In terms of gender, majority (51 %) was
male. Thus, as the average family size of poor was found greater, this obviously demanded
greater amount of forest resources.
Mainly the economically active populations are the population belonging to the age group of 16-
59 years. It indicates that 60 % of population was economically active and remaining 40 % de-
pends on the income of their active members.
There was heterogeneous caste structure where majorities were Tharu (47 %) especially in Poor
category whereas majority of Brahmin and Chhetri were in rich category. Similarly, while look-
ing the District as a whole, approximately 30 % of the household was aboriginal caste group
(DDC, 2002) where about 40 % of them were in buffer zone, who exclusively depends on the
Park resources for their survival. On the other hand, in Chitwan the settlement was started only

Aryal, Maniratna: Final Report
after malaria eradication in 1950s. Therefore, Brahmin/Chhetri of hill migrants gradually dis-
placed the traditional caste groups.
From the descriptive analysis, it was found that the major occupation was agriculture (50.2 %).
The educational level of the households showed that the majority was limited within the school
level (58 % below SLC). The children were dropped out at the schooling period. The HH of rich
category was more educated than the poor where majorities of them were Brahmin and Chettries.
Most of the disadvantage castes were compelled to drop out the education due to low economic
status and lack of manpower to conduct household works. The traditional ethnic groups were
continuously losing their land for their survival while the so called higher caste had increased
their land size.
Most of the household income depends on agriculture in rural Nepal especially where there is
fertile land. Agriculture might not be sufficient to sustain the family in the whole year that's why
some members engage themselves in other income generating activities. They, therefore, sup-
plement household economy. Agriculture and livestock covers the most of the household income
in study area. Agriculture and livestock farming depend, directly and indirectly, with forest re-
source. So, this contribution goes to forest product as well. Fifty % of the households in the study
area were engaged in agriculture and would get some revenue from it.
7.1.2 Food security
In this study, majority households did not survive with their own production for the whole year.
However, only the so-called higher caste and rich group met their food requirement from their
own production. The findings revealed that there were a large number (43.4 %) of respondents
whose own production met only less than three months to whom UNDP categorized them as ul-
tra poor family. In order to cope such food deficit period, different alternative strategies were
adopted which were daily wage earner, sharecropping, kamaiya or bonded labor and seasonal
migration. In this way, majority households discontinued to use illegal alternatives means which
in turn reduced the conflicting situation.
7.1.3 Park resource using
In this study area, nearly 122 households were using khar as roofing material but majorities were
dissatisfied with the limited permission period of 5 days per year regardless of the well being and
different caste groups. Among various sources of cooking material, fuel wood was used by more

Aryal, Maniratna: Final Report
than 95 households followed by biogas adoption. Other energy sources of cooking material were
adopted by the small number of households. Though the number of biogas installers was lower in
totality but the trend was gradually increasing.
Moreover, before the implementation of BZ, there were hardly any biogas plants in the study
area. On the other hand, majority of Brahmin and Chettri used the modern energy sources like
biogas, LP gas, Kerosene whereas Tharu, Occupational caste and other were exclusively de-
pended on traditional energy source of firewood collected from government and buffer zone for-
est irrespective of the strict prohibition.
There was also a growing trend of developing the community forest for providing firewood to
the members of CFUG. However, the educated households either developed their own source or
established the community forest for firewood collection. But the fact was that the encroachment
over the protected area resources was found decreasing and gradually reducing the common is-
sues of conflict in the study area. However, overall shifting tendency from illegal encroachment
to the legal sources for fire wood and timber collection was found gradually improving.
7.1.4 Livestock, human and crop damaging nature
In this study area, nearly all the sampled households kept livestock and the number of livestock
ownership was somewhat higher in rich family. Though the average livestock size of the study
area was reducing (4.08 LSU), the number of households involved in livestock rearing was de-
creasing. On the Percentage basis, about half of the sampled households had gradually reduced
their livestock size while majority were of rich where majority had started the stall feeding sys-
tem (58 %). This was supported by the gradual increment of biogas technology adoption in study
area.
The finding showed that all respondents reported that their crops were damaged by wild animals
in which wheat was the most damaging crop. Among the three wildlife reported by respondents,
the intrusion of one horned rhino far exceeded the occurrence of wild pig and chital. This was
also justified by the gradual reduction of the grassland area from 7,051 ha to 5,521 ha in a short
time span of 22 years (1978-2000 AD) in the Park (DNPWC, 2000). In the study area, different
animal preventive measures were adopted but majority of them charged it as ineffective to con-
trol wildlife loss except electric fencing which was newly adopted technique. Electric fencing
was found quite effective to control wild animal depredation than other APIs as it was used in

Aryal, Maniratna: Final Report
Bachhauli area only and now extending in other areas also where electricity is available. Never-
theless of crop alternation practice, majority of respondents were fully dependent on the barbed
wire fencing along the trench, which was not only a panacea of controlling the wildlife damage
of the study area.
Despite such, the finding indicated that there was gradual reduction of wild animal intrusion in
the study area. For this, Dhakal (2001) stated that the intensity of crop damage in Chitwan Na-
tional Park was reduced by approximately 25 % through the adoption of animal preventive
measures after PCP and BZ with electric fencing. This would give an indication of positive sig-
nal towards the reduction of wild life damage to the standing crops of the study area however;
there was not provision of compensation to the crop damage in the study area except seed
amount. There was found the compensation of seed amount for crop damage which was not ac-
cepted by the locals and found ineffective in the study area.
In case of domestic animals attack and human casualties, the damage declined as the distance
increased from the Park boundary. Though the victimized households obtained the compensa-
tion, majority did not satisfy with such compensation. These facts suggested that the depredation
and crop damages as well as human life loss/injuries were in decreasing rate but measures taken
were insufficient and less effective. Therefore, such distressing instance had aggravated the con-
flicting situation of sampled households with the Park administration.
7.1.5 Natural calamity
There was severe problem of monsoon flooding particularly in the study area. This was proved
by the increment of the Park area from 932 to 1182 sq. km due to the addition of the private cul-
tivated land of the local communities (ECOS, 2002). However, these victims’ households did not
get any compensation for their gigantic loss. In fact, this situation had further jeopardized the
livelihood of the subsistence farmer and had constantly increased their dependency on Park re-
sources. Some organizations including buffer zones supplied some compensation to victimized
households but not sufficient.
7.1.6 Skill development
The findings showed that the majority of the trained participants started training related profes-
sions like poultry farming, fish farming, off/seasonal vegetable production, biogas and pump set
technician, nature/tourist guide, hotel management, and cook in which nature guide and hotel
Aryal, Maniratna: Final Report
management training was found very effective and with the development of a cadre of village
expertise, more income generation activities were in operation that had enhanced alternative live-
lihood opportunities of the respondents. Majority of the respondents of rich and medium family
reported that the tourism had created employment opportunities in local hotel and lodge, cart
mobilization (carting). However, there were only few respondents who reported that the tourism
helped in conservation of natural flora and fauna. Besides this, tourism increased the household
income of locals by creating part time employment and sells of local produce to local market and
expressing local culture like Tharu village.
7.1.7 Park management activities and cooperativeness
The Programme started various environment friendly initiatives inside the Park and forest areas
to improve wildlife habitat thereby reducing the conflict between Park and local people however,
the level of involvement households in conservation activities was very limited. It was found that
the respondents of rich and medium family were regularly participated in the Park management
activities than poor households.
Though majority of the households reported lack of leisure time as barrier but the important fac-
tor was the ineffectiveness of the adopted animal preventive measures except electric fencing.
The cross tabulation value revealed that the local people’s involvement in Park management ac-
tivities did not depend on the caste, educational attainment level, major occupation, food suffi-
ciency period, cooperativeness of Park administration. In comparison among three well being,
the households reporting the relationship as improved were found in the study area. Similarly,
the perception of the sampled households towards the cooperativeness of the Park administration
was found dependent on the effectiveness of the animal preventive measures. Further, majority
of the respondents indicated that the majority of the Park staffs were more unfriendly and un-
helpful. The government posted 700 Nepalese Army inside the Park however; their relationship
with the local communities was not pleasingly (ECOS, 2002). This was due to the inadequate
communication and interaction between the local communities and the Park administration.
The Park staffs reported that there were several incidents of local people being caught during or
collecting forest products. Thus, this situation acted as supplementary factor for the existence of
conflict. The finding of the study area revealed that there were differences in perceptions be-
tween Park staff and local people which indicated insufficient interaction for the management

Aryal, Maniratna: Final Report
issues of Chitwan National Park. Such distressing evidence could not favor the livelihood of suc-
cess of the sustainable biodiversity conservation activities.
7.1.8 Benefit Cost ratio of Chitwan National Park
Annual income of BBZCF was NRs 55,57,146 of which more than 80 % from tourism and an-
nual expenses was 39, 95,182 in the fiscal year 2007/08. It was found that NRs 15,61,964 was
the saving amount in BBZCF in the fiscal year 2007/08. The net contribution of Park resources
harvested by local people was Rs. 56,12,263 (US$ 84,553.9) in 2007/08. The significant contri-
bution of the Park resources to the local people is quite obvious. B/C ratio of CNP during grass
cutting period was found 1.3 and 1.6 of annual resource harvesting. This means benefits from the
forest/Park were greater than cost involved collecting the resources. An annual direct benefit
from the Chitwan National Park was found NRs. 34 million.
7.1.9 Visitors characteristics
The majority of the tourists were from Europe (43.8 %) and in terms of gender, 52.5 % were
male. It showed that 31.2 % of respondents were 26-40 yrs age groups. The majority (66.3 %) of
them were earning less than US$ 30,000 annually. Service was the major occupation for 46.3 %
visitors and 51.3 % stated that bus as the chief means of travelling to Chitwan. Most of the visi-
tors (73.8 %) stated that they visited the Park in package than individuals. Average cost per
package tour was found about US$ 140 for 3 days and 2 nights. Most of the visitors stayed 3.27
days in Chitwan of 24.88 days in Nepal.
7.2 Conclusion
The buffer zone program has been implemented due to conflict arising between park authorities
and people residing around the park. It has had several positive impacts on the BZ management
within the study area. Support from the BZ programme has been effective in livelihood support.
The following conclusions are made based on the findings of the study.
People are encouraged to manage buffer zone forest and conserve biodiversity. It is clearly
indicated that BZ forest condition has been improved by species richness, wild life, etc. Addi-
tionally, the forest products from the BZ forest are sufficient to meet and satisfy local residents’
needs. The buffer zone forest is the natural forest and its protection and conservation is getting
improved under the BZ program.
The institutional setup established during the implementation of the BZ program has in-

Aryal, Maniratna: Final Report
creased both men and women’s participation. There is a trend of increased networking not
only in this program but also in other government and non government institutions. Thus
people have benefited from other institutions in and around BZ area.
The programme has supported awareness activities such as workshops, observation tours and
seminars, trainings to enhance knowledge and skills in conservation and community devel-
opment through increased participation.
The communities have developed their own fund mobilization mechanism and the majorities
of the respondents are involved in saving /credit schemes.
The infrastructure developed through the programme includes renovated school buildings,
small irrigation schemes, health centers and subsidiary roads as well as biogas plant and toi-
lets. This has encouraged people to rely on alternative energy and thus consequently reduce
exploitative resource extraction and increase biodiversity in BZ area.
The increasing trend of alternative energy use, stall-feeding practice and participatory protec-
tion of the BZ forest are helping to meet conservation strategies adopted by the Program. Es-
tablishment of relief and saving credit funds provided opportunities for immediate rescue of
wildlife victims. The crop damage by wildlife has decreased after the construction of trench
and barbed wire fences. People in local communities have access to loans with low interest
rate from community managed co operatives.
The activities such as biogas installation as a source of alternative energy, fencing around the
forest area, gravel road construction and maintenance, providing alternative fuel resource
(such as an improved cooking stove), subsidy on deep boring for irrigation purposes, group
formation and organization support, providing compensation for the wildlife damages, and
the distribution of electricity poles has positive impacts on livelihoods.
Considering the small land holding of the majority of the households and foods security situ-
ation less than six months were found to be compelling factors for their dependency on the
Park resources as the alternative means for livelihood.
High level of illiteracy rate and very low level of schooling further inflected on the reduced
alternative job opportunities.
Limited time period for collecting thatch and roofing material were the major cause of con-
flict. The researcher own dialogue with the user and management people on this limited pe-

Aryal, Maniratna: Final Report
riod issue of accessibility for the forest resources revealed as temporary cause due to current
insurgencies and increased awareness about conservation of biodiversity.
Inadequate training and lack of employment opportunities have not improved their living
standard.
Replacement by high productive livestock was not sufficient reducing the herd size of the
local animals particularly in the rich family resulting in less productive and profitable lives-
tock raising.
Despite the efforts being made jointly in fencing off the wild animals from damaging their
crops and small animals were not found very effective except electric fencing and were still
inadequate although it had helped in the improvement of the conservation of the wildlife and
the Park resources.
Electric fencing was found effective among the APIs to control damages caused by wild an-
imals to crops, livestock and human death as well as injuries.
Flooding responsible for shifting the course of river has caused loss of productive land and
increased area in Park.
Reinforcement of the army personnel for the enactment of the security laws and regulations
was effective as the protection and conservation of Park means was concerned bit the public
relation was poor. This was found to be further aggravated by limited amount and coverage
of awareness programs for both parties through more educational practices.
The PCP areas had covered 34 VDCs and 2 municipalities expanding from Makwanpur to
Nawalparasi districts along the Rapti river course but the tourism centers were very few in
numbers and highly localized. Thus, this situation had limited the economic opportunities in
the buffer zone areas however; there was inadequacy in the quantitative coverage of the train-
ing programs related to tourism.
Benefit cost ratio of the CNP was found 1.3 during grass cutting period and 1.6 from the con-
sumptive use value of resources harvested from the CNP. It indicated that resources har-
vested from the Park are higher than the average cost involved to collect such resources from
the Park.
Given the growth in eco-tourism and increasing interest among NGOs and governments in
natural resource conservation, non-market valuation techniques are needed to estimate the

Aryal, Maniratna: Final Report
economic benefits of environmental resources such as national Parks. In this study, the indi-
vidual travel cost model was used to analyze and measure the recreational value of the CNP.
Our analysis showed that if the quality of CNP is improved, it will attract more visitors and,
in turn, generate greater revenue. Alternatively, the government could also consider introduc-
ing an entry fee to access the CNP. Since consumers are willing to pay much higher fees than
they actually do for Park visits, an entry fee of USD 15 can be imposed.
7.3 Recommendation
The buffer zone management programme has led to positive community developments and
increased the people’s participation in conservation and management of natural resources.
This programme is one of the most successful in PAs to improve rural livelihoods.
More literacy programs especially, functional literacy needs to be promoted at rapid scale.
Skill development training should be organized and attention be given to the more inclusion
of the people below poverty line and have not opportunities to move out of their settlements.
Higher productive animals should be replaced the local breeds by livestock improvement
programs.
More effective ways (electric fencing) fending off the predating wildlife should be adopted
with joint participation of the users and the Park management people.
Electric fencing should be promoted with joint participation of buffer zone and Park man-
agement as it is found most effective than others.
Increased river taming and erosion control measures are required putting heavy emphasis in
utilization of the local human resources and natural resources as well.
Both the management personnel and consumer groups need to work out the ways of improv-
ing their relationship and creating mass awareness. Alternative sources of fuel wood, timber,
and thatching materials and more permanent types of roofing structures should be made
available.
More tourism related training need to be provided to the local people especially the poor, and
tourism spots should be expanded. At the same time, eco-tourism should be promoted.
The joint efforts should be made to keep the security intact and the period for collecting
thatches and roofing materials be increased to a few more days. Here, the consumers should
be sharing more security responsibilities.
Aryal, Maniratna: Final Report
As identified repellent crops from other buffer zone areas of Nepal, should be introduced if
feasible for which assumed marketing and profitability needs to be explored, tested and im-
plemented in the buffer zone of Chitwan.
Compensation for the losses and insurance program at the time of the study was meager and
need to be increased. Donors and other agencies might be considered in the area of financial
help by developing appropriate strategies.
Compensation for crop losses should be provided as per the amount of crops and its current
market value.
Expansion of site specific on-farm income generating activities in the buffer zone is critically
needed.
Tourism is the main source of income generating activities so, Park and buffer zone should
focus on tourist management, availability of facilities and develop different programs to at-
tract tourist.
Tourists are willing to pay more entrance fee for the management of Park and its biodiversi-
ty. This should be implemented after the through study of tourism.
Tourism is the main sources of income of Park to spend in community development activities
and to pay compensation through buffer zones. Therefore, different facilities for the tourist
should be increased.
More educated people to guide the foreigner should be increased to attract more tourists and
increase the Park revenue.
The recreational benefits and entry fees estimated for CNP could provide guidance for Park
management beyond the CNP.
Complete record keeping of all the activities of Baghmara Buffer Zone Community Forest
and Park should be maintained that guide to correct the weakness at present and effective
planning for future.
Field level
1.Biogas with toilet is the good alternative source to reduce the local depen-
dency on the BZCF for their daily life. It will help to improve the health sta-
tus of people and save time for collection of firewood. It is therefore recom-
mended that the programme should more focus on alternative energy source

Aryal, Maniratna: Final Report
such as biogas with toilet attachment in future.
2.The awareness activities such as observation tour and literacy programme
should be implemented in the future.
3.The trench along the wire fence at the boundary of the BZ community for-
est and the human settlements should be maintained to reduce the injuries
caused by wild animals to human life and the agricultural property of the lo-
cal people.
4.The skill oriented training should be provided to the poor people and the
soft loan provision should be created to those people who participate in the
skill oriented training for the further establishment of enterprises.
PA management
1.The BZ management is the best example in this national park and can
support to the local community for their community development activities,
sustainable supply of forest resource, establishing the endowment fund for
vulnerability situation by implementing the new policy and strategy. Thus,
the BZ management programme can help to improve the livelihood of the
people. Therefore it is considered necessary to implement the BZ manage-
ment programme in all protected areas in the country.
2.From the above findings and conclusions of this case study, it is necessary
to establish the protected area and its buffer zone especially in developing
countries which are rich in biodiversity for the improvement of livelihood of
people and biodiversity conservation.

Aryal, Maniratna: Final Report
8. LITERATURE CITED
Abala, D. O. 1987. A Theoretical and Empirical Investigation of the Willingness to Pay for Re-
creational Services: A Case Study of Nairobi National Park. Eastern Economic Review,
3: 271-92.
Allin, C. W. 1990. Introduction: National Parks and Nature Reserves in Global Perspective. In-
ternational Handbook of National Parks and Nature Reserves. Greenwood Press, West-
port, Connecticut, USA.
Baral, J. C. 1994. "Equity Aspect of Community Forestry Development in the Hills of Nepal, A
Research Proposal."
Bateman, I. J. and K.G. Willis (eds). 1999. Valuing Environmental Resources: Theory and Prac-
tice of the Contingent Valuation Method in the US, EU, and Developing Countries. New
York: Oxford University Press.
Beal, D.J. 1995. Sources of Variation in Estimates of Cost Reported by Respondents in Travel
Cost Surveys. Australian Journal of Leisure and Recreation 5 (1): 3-8.
Bhandari, B. 1996. Wetlands Conservation, In: NCS Nepal; Quarterly Newsletter of National
Conservation Strategy Implemented by NPC/IUCN Nepal-The World Conservation Un-
ion. No 1 and 2.pp 1-22.
Bhatia, A. 1997. Power, Equity, Gender, and Conflicts in Common Property Resources in the
Hindu Kush-Himalayas. International Centre for Integrated Mountain Development
(ICIMOD), Kathmandu, Nepal. Issue in Mountain Development 97/7. Sep 1997.
Bhatta, S. R. 2005. Human-animal conflict: Conservation of World Heritage and sacrifice of Lo-
cal people. Biodiversity Conservation Efforts in Nepal, Special issue publish on the occa-
sion of 10th
Wildlife Week, April, 2005. Government of Nepal, Department of National
Park and Wildlife Conservation, Katmandu, Nepal.
Bhattarai, B. 1993. Protecting Ecosystem; People, Parks and Development. Spotlight. December
31: 16-21.
Brown, W. G. and F. Nawas. 1973. Impact of Aggregation on the Estimation of Outdoor
Recreation Demand Functions. American Journal of Agricultural Economics, 55: 246-9.

Aryal, Maniratna: Final Report
Budhathoki, P. 2003. Buffer Zone Initiatives in Nepal-Balancing the Scales. Paper Presented in
Seminar on Buffer Zone Management Organized by Ecology versus Economy in 7 No-
vember 2001, Wageningen, The Netherlands.
Budhathoki, P., M Basnyat. and S. Rayamajhi. 1998. Community Based Biodiversity Pro-
gramme, Strategy and Operational Framework: The Government of Nepal, Department of
National Park and Wildlife Conservation / Park People Programme (NEP/94/001).
Carew-Reid, J. 1991. In: Natural and Cultural Heritage in Nepal. Proceedings of the Workshop
on the Conservation of Heritage of National Significance. National Conservation Strategy
Implementation Programme, NPC and G/N (organizer) in Collaboration with Nepal Her-
itage Society and IUCN- The World Conservation Union. 18-23 August 1991. Kathman-
du, Nepal. pp 41-44.
CBD. 2004. Biodiversity issues for consideration in the planning, establishment and management
of protected area sites and networks; CBD technical series no.15.
CBS. 2002. Statistical Pocket Book Nepal, 2002. Government of Nepal National Planning
Commission Secretariat, Central Bureau of Statistics, Ramshahpath, Thapathali, Kath-
mandu, Nepal.
Cesario, F. 1976. Value of time in recreation benefits studies. Journal of Land Economics 52: p
32-41.
Chambers, R. and G. R. Conway. 1991. Sustainable rural livelihoods: Practical Concepts for the
21st century. IDS Discussion Paper 296. Brighton, UK, Institute of Development Studies.
Pp 29+IV.
Chandrasekharan, D. 1997. Proceedings: Electronic Conference on Addressing Natural Resource
Conflicts through Community Forestry, January-May 1996. Community Forestry/FTPP
Conflict Management Series. Rome, FAO.
Chase, L., D. Lee., W. Schulze. and D. Anderson. 1998. Ecotourism Demand and Differential
Pricing of National Park Access in Costa Rica. Land Economics, 74 (4): 466-482.
Christiernsson, A. 2003. An Economic Valuation of the Coral Reefs at Phi Phi Islands, Masters
Thesis, Luleå technological University.
Collier, P. 1998. Social capital and Poverty. Social Capital Initiatives Working Paper No. 4. The
World Bank, Social development Department, Washington DC, USA available at

Aryal, Maniratna: Final Report
www.worldbank.org/socialdevelopment
DDC. 2002. Summary Database of Chitwan District. NPC GIS Facility PDDP
(NEP/95/008)/DDC, Chitwan.
Department of Forests, 1990. Master Plan for the Forestry Sector, Nepal. Revised Sector Policy.
Nepal: G/N Press.
Department of Forests, 1992. Operational Guidelines of the Community Forest Programme.
Nepal: G/N Press.
DFID. 1999. Sustainable Livelihood Guidance Sheets. Department for International Develop-
ment, UK.
Dhakal, N. R. 2001. Report on Monitoring and Evaluation System: Park People Pro-
gramme/GoN/DNPWC/UNDP. Kathmandu, Nepal.
Dhital, K. 2004. Environmental Economic Methods of Evaluating Protected Area (A case study
of Chitwan National Park, Nepal. Printers world, Kathmandu.
Dhungel, S. and B. Adhikari. 1994. “People's Participation in Forest Resource Use”. The Rising
Nepal, October 26.
Dhungel, S. K. and B. W. O’gara. 1991. Ecology of the Hog Deer in Chitwan National Park,
Nepal, Wild I, Monogr. 119: 1-40.
DNPWC. 2000a. Buffer Zone Management Plan, 2001 – 2005 of CNP: His Majesty's Gov-
ernment, Ministry of Forest and Soil Conservation and Department of National Park
and Wildlife Conservation, Babarmahal, Kathmandu Nepal.
DNPWC. 2000b. Park People Programme. Consolidation conservation through people's partici-
pation. Annual Report 2000: Department of National Park and Wildlife Conservation
Park People Programme (NEP/94/001), Kathmandu Nepal.
DNPWC. 2004. Annual Report 2003-2004. His Majesty’s Government, Ministry of Forest and
Soil Conservation, Department of National Parks and Wildlife Conservation, Kathmandu,
Nepal.
DNPWC. 2005. Annual Report 2005-2006. His Majesty’s Government, Ministry of Forest and
Soil Conservation, Department of National Parks and Wildlife Conservation, Kathmandu,
Nepal.
DNPWC. 2006. Third National report to Convention on Biological diversity (CBD). The Gov-

Aryal, Maniratna: Final Report
ernment, Ministry of Forest and Soil Conservation, Department of National Parks and
Wildlife Conservation, Kathmandu, Nepal.
DNPWC. 2007. The impact of Participatory Conservation programme (PCP), an electronic ver-
sion available at http://www.dnpwc.gov.np/index.asp
DNPWC/GoN. 1995. Sanrankshan Samachar (Conservation News). Department of National
Parks and Wildlife Conservation, Kathmandu, Nepal.
DNPWC/GoN. 1999. Chitwan National Park and Buffer Zone: Management Plan (2000-2004).
Task Force of Chitwan National Park Dec 1999. Department of National Parks and Wild-
life Conservation, Ministry Of Forest and Soil Conservation, Kathmandu, Nepal. 113 p.
DNPWC/PCP. 2006. Participatory Conservation Programme at a glance. The Participatory Con-
servation Programme, available at
http://www.undp.org.np/closed/energy/projects/pcp/index.php
DNPWC/PPP. 1999. Socio-Economic Development Initiatives in Buffer Zones. Department of
National Parks and Wildlife Conservation/Park People Programme. UNDP, Kathmandu,
Nepal.
DNPWC/PPP. 2000. Consolidating conservation through people’s participation, Park and
People Programme, DNPWC, Kathmandu, Nepal.
DNPWC/PPP. 2000. Resource Profile of Chitwan National Park and BZ. Department of National
Parks and Wildlife Conservation/Park People Programme. UNDP, Kathmandu, Nepal.
DNPWC/PPP. 2001. Park People Programme. Completion Report 1994 -2001: DNPWC De-
partment of National Park and Wildlife Conservation Park People Programme
(NEP/94/001), Kathmandu Nepal.
DNPWC/PPP. 2002. Annual Report. Department of National Parks and Wildlife Conserva-
tion/Park People Programme. Kathmandu.
DNPWC/WWF. 1994. Project Document: Biodiversity Conservation Program in Nepal.
DNPWC/WWF, Kathmandu.
Dobson, A. 1996. Conservation and biodiversity, Scientific American Library, New York.
Dougherty, C. 2002. Introduction to Econometrics, Second edition, Oxford University Press,
New york.
Dr. Bhattarai, A. M. and D. Khanal. 2005. Communities, Forest and Law of Nepal, Present State
Aryal, Maniratna: Final Report
and Challenges.
Durojaiye, B. O. and A. E. Ipki. 1988. The Monetary Value of Recreational Facilities in a De-
veloping Country: A Case Study of Three Centres in Nigeria. Natural Resources Journal,
28: 315-28.
Echeverria, J., M. Hanrahan, and R. Solorazano. 1995. Valuation of Non-Priced Amenities Pro-
vided by the Biological Resources within the Monteverde Cloud Forest Preserve, Costa
Rica. Ecological Economics, 13: 43-52.
ECOS. 2002. Conflict and Unity between National Park and People: A Study (In Nepali ver-
sion). Ecological Services Center. Ganesh Chapakhana, Narayangarh, Chitwan.
FAO. 1997. Compilation of Discussion Papers Made to the Electronic Conference on Addressing
Natural Resource Conflicts through Community Forestry, January-May 1996. Communi-
ty Forestry/FTPP Conflict Management Series. Rome.
FAO. 1998. Integrating Conflict Management Considerations into National Policy Frame-
works. Proceedings of a Satellite Meeting to the XI World Forestry Congress, 10-13
October 1997, Antalya, Turkey. Community Forestry/FTPP Conflict Management
Series. Rome.
FAO. 2000. Asia and Pasific, National Forest programme, The update version 34, pp123. Food
and agricultural Organization of the United Nations.
Farber, S. 1988. The Value of Coastal Wetlands for Recreation: An Application of Travel Cost
and Contingent Valuation Methodologies. Journal of Environmental Management, 26:
299-312.
Freeman, A. M. III. 1993. The Measurement of Environmental and Resource Values: Theory and
Methods, Washington, D.C: Resources for the Future.
Gaire, D. 2006. An Assessment of community-based biodiversity conservation and rural livelih-
ood improvements in the buffer zone of Bardia National Park. A report submitted to The
Rufford Maurice Laing Foundation, Rufford Small Grant for Nature Conservation (RSG),
UK
Garrod, G. and K. G. Willis. 1999. Economic Valuation of the Environment: Methods and Case
Studies, Cheltenham, UK and Northampton, MA, USA: Edward Elgar.
Ghimire, G. P. 2003. "Buffer Zone Community Forestry Benefits for the Livelihoods of the

Aryal, Maniratna: Final Report
Poorest of the Poor Users, (A research report submitted in the partial fulfillment of the
requirement for the degree of Bachelor of science in Forestry)
GN/NPC. 2003. Tenth Five Year Plan (2002-2007). National Planning Commission, Singhadur-
bar, Kathmandu, Nepal.
GN/UNDP. 1994. Government of Nepal/United Nations Development Programme. Parks and
People Project Document. UNDP/DNPWC, Kathmandu, Nepal.
GoN. 1995. “Forest Act, 1993.” Kathmandu, Nepal.
GoN. 1995. “Forest Rule, 1995.” Kathmandu, Nepal.
Grandstaff, S. and J. A. Dixon. 1986. Evaluation of Lumpinee Park in Bangkok, Thailand', in
J.A. Dixon and M.M. Hufschmidt (eds). Economic Valuation Techniques for the Envi-
ronment: A Case Study Workbook. Baltimore: Johns Hopkins University Press.
Gum, R .L. and W.E. Martin. 1974. Problems and Solutions in Estimating the Demand for and
Value of Rural Outdoor Recreation', American Journal of Agricultural Economics. 56:
558-66.
Hales, D. 1989. Changing Concepts of National Parks. In western, D. and M.C. Pearl (eds.) Con-
servation in the Twenty-First Century, pp.139-144. New York: Oxford University Press.
Hanker, N. 1997. Willingness to Pay for Borivli National Park: Evidence from a Contingent
Valuation. Ecological Economics, 105-122.
Hotelling, H. 1947. The Economics of Public Recreation: The Prewitt Report. Washington, D.C:
National Park Services.
Hough, J. L. 1998. Obstacles to Effective Management Of Conflicts Between National Parks
And Surrounding Human Communities In Developing Countries, Environmental Conser-
vation 15 (2): 129-136.
http://www.fao.org/forestry/index.jsp
http://www.forestsandcommunities.org/proceedings/ses1.html#1
http://www.mtnforum.org/resources/library/keitr93a.html [Retrieved June 10 2007].
http://www.odifpeg.org.uk/activities/forests_and_the_poor
http://www.wfc2003.org/en/index.php
International Union for the Conservation of Nature and Natural Resources (IUCN). 1993. Parks
for Life: Report of the IVth World Congress on National Parks and Protected Areas.

Aryal, Maniratna: Final Report
Isangkura, A. 1998. Environmental Valuation: An Entrance Fee System for National Parks in
Thailand. EEPSEA Research Report Series. Economy and Environment Program for
South east Asia. Tanglin, Singapore.
IUCN. 1975. World directory of national Parks and other protected areas. International union for
conservation of nature of natural resources gland, Switzerland.
IUCN. 2003. Protected Areas Programme: The International Journal of Protected Area
Managers. Vol. 13, No. 2, pp22.
IUCN. 2005. Strengthening IUCN’s Programme on Protected Areas, 2005-2008. An electronic
version available at
http://www.iucn.org/themes/wcpa/pubs/pdfs/strengtheningiucnsworkonpas.pdf sited on
11/05/2007.
Kanel, K. R., D. P. Chapagain. and D. C. Regmi. 1999. Comparative Analysis decentralization
Forestry Act: Current Policy and Legal Context of the Forestry Sector with Reference to
the Community Forestry Programme in Nepal section 4.3, pp 37-38. A working overview
submitted to Nepal-UK Community Forestry Project Kathmandu, Nepal
Kaosa-ard, M., D. Patmasiriwat. T. Panayotou, and J. R. Deshazo. 1995. Green Financing: Val-
uation and Financing of Khao Yai National Park in Thailand. Thailand Development Re-
search Institute, Bangkok.
Keiter, R. B. 1993. Nepal’s Buffer Zone Legislation: Legal and Policy Issues. Thesis, Ph. D.
University of Utah, college of Law, Salt lake City, Utah, USA.
Kellert, S. R. 1993. The Biological Basis for Human Values of Nature. Pp 42-70 in Kellert and
Wilson (eds.). The Biophilia Hypothesis, Island Press, Washington, DC.
Khan, H. 2004. Demand for Eco-tourism: Estimation of Recreational Benefits from the Margalla
Hill National Park in Northern Pakistan. Working Paper No. 5-04. SANDEE, Kathman-
du, Nepal.
Lesser, J. A., D. E. Dodds and R. O. Zerbe. 1997. Environmental Economics and Policy. Mea-
suring Environmental Costs and Benefits. Addison-Wesley. pp. 302-303.
Lindberg, K. and R. L. Johnson. 1994. Estimating Demand for Ecotourism Sites in Developing
Nations, Trends, 31: 10-15.

Aryal, Maniratna: Final Report
Loomis, J. B. and R. G. Walsh. 1997. Recreation Economic Decisions: Comparing Benefits and
Costs, Venture Publishing, State College, PA.
Mackinnon, J. K., G. Child and J. Thorsell. 1986. Managing Protected Areas in the Tropics.
Workshop on Managing Protected Areas in the Tropics, World Congress On National
Parks, Bali, Indonesia, October 1982. Organized by IUCN Commission on National
Parks and Protected Areas, IUCN/UNEP, Gland, Switzerland.
McConnell, K. E. 1985. The Economics of Outdoor Recreation, in Allen V. Kneese and James L.
Sweeney (eds.), Handbook of Natural Resources and Energy Economics, Vol.1. Amster-
dam, The Netherlands: North-Holland.
McConnell, K. E. 1992. On-site Time in the Demand for Recreation. American Journal of Agri-
cultural Economics, 74: 918-25.
McKean, J. R., D. M. Johnson and R. G. Walsh. 1995. Valuing Time in Travel Cost Demand
Analysis: An Empirical Investigation. Land Economics. 71 (1): 96-105.
McNeely, J. A. 1989. Protected Areas and Human Ecology: How National Parks Can Contribute
to Sustaining Societies of the Twenty First Century, pages 150-157 in Western and Pearl
(eds.), Conservation for the Twenty First Century. WCI/NZS, New York.
Mehta J. N. and J. T. Heinen. 1998. Emerging Issues in Legal and Procedural Aspects of Buffer
Zone Management with Case Studies from Nepal.
Mehta, J. N. 1996. Park - People Interface in Parsa Wildlife Reserve, Nepal. TRI News: Journal
of the Tropical Resource Institute, 15: 11-12.
MFSC. 2005. Thematic Report on Mountain Ecosystem: Government of Nepal, Ministry of For-
est and Soil Conservation, Singhdurbar, Kathmandu, Nepal
MFSC/N. 2006. Third National Report to the Convention on Biological Diversity. Government
of Nepal. Ministry of Forests and Soil Conservation, Kathmandu, Nepal
Miah, A.Q. 1993. Applied Statistics, A Course Handbook for Human Settlements Planning. De-
termination of sample size. Division of Human Settlements Development, Asian Institute
of Technology, Thailand. p.303.
Ministry of Forest and Soil Conservation (MFSC). 1999. "Forest Resources of Nepal" (Kath-
mandu: MFSC).

Aryal, Maniratna: Final Report
Mishra, H. R. 1984. Delicate Balance: Tigers, Rhinoceros, Tourists and Park Management vs.
the Needs of the Local People in the Chitwan National Park. pp 197-205.
Mishra, M. K. 2005. Enhancing Our World Heritage Site, Chitwan National Park, Monitoring
and Managing for success in Natural World Heritage sites. A technical report no. 06
submitted to UNESCO-IUCN, Enhancing Our World Heritage Project.
Moran, D. 1994. Contingent Valuation and Biodiversity. Measuring the User Surplus of Kenyan
Protected Area. Biodiversity and Conservation, 3: 663-84.
MPFS/N. 1988. Master Plan for the Forestry Sector, Nepal. GN/ADB/FINNIDA, Kathmandu.
Munganata, E. D. and S. Navrud. 1994. Environmental Valuation in Developing Countries: The
Recreational Value of Wildlife Viewing. Ecological Economics, 11: 135-51.
Nepal, S. K. and K. E. Weber. 1993. Struggle for Existence: Park People Conflict on Chitwan
National Park, Nepal. Asian Institute of Technology, Bangkok, Thailand, 153 p.
Nepal, S. K. and K. E. Weber. 1995. Managing Resources and Resolving Conflicts: National
Parks and Local People. International Journal of Sustainable Development of World
Ecology, 2:11-25.
Nillesen, E. 2002. 'The Travel Cost Approach: An Application to Bellenden Ker National Park.
An Unpublished Thesis Submitted to the School of Economics. University of Queen-
sland, Australia.
NTNC. 2002. Sarasi Newletter, 7(19): 9-12. National Trust for Nature Conservation, Biodiversi-
ty Conservation Centre. Kathmandu, Nepal.
Oli, K. P. 2003. An Estimation of Revenue Generated From Community Forestry in Nepal. An
Unpublished Work on Forum for Promotion of Environmental Justice and Law (Kath-
mandu: FPEJL).
Pariyar, M. P. and G. Singh. 1994. GIS Based Model for Agro-Ecological Zoning: A case
study of Chitwan District, Nepal.
Personal communication, BBZUC office 2006.
Poudel, H. K. 2003. Conflict Management and Community Development Initiatives of Participa-
tory Conservation Programme in the Buffer Zone of Chitwan, Nepal. Thesis. M. Sc. Ag.
Tribhuwan University, Institute of Agriculture and Animal Sciences, Rampur, Nepal.
Poudel, K. N. 2003. Contribution of Community Forestry to the Livelihood of Disadvantaged

Aryal, Maniratna: Final Report
Groups: A case study of Baglung and Kaski district, Nepal. A thesis submitted in partial
fulfillment of the requirements for the degree of Master of Science at AIT, Thailand
Pradhan, N. M. 1995. Buffer Zone Management in Nepal: A Case Study in Bardia National Park
with Emphasis on Resources. A Thesis Submitted to Agricultural University of Norway
as Partial Fulfillment of Master's Degree in Science (Norway: AUN).
Pyakurel, K. N. 1982. Ethnicity and Rural Development: A Sociological Study of Four Tharu
Villages in Chitwan, Nepal. Thesis. Doctor of Philosophy. Michigan State University,
USA. pp 74-77.
Pye-Smith, C. 1988. Travel’s in Nepal: The Sequestered Kingdom. Arun Press Limited, 33 Mu-
seum Street, London, England.
Rawal, R. and T. B. Karki. 1999. A Study on Problems Facing Local People by the Establish-
ment of Royal Bardia National Park. In: Proceedings of III National Conference on
Science and Technology. Kathmandu, March 8-11, 1999. Nepal Academy of Science and
Technology, Kathmandu, Nepal. pp. 310-314.
Rayamajhi, S. 2001. Protected Area Biodiversity Management: Case of Royal Chitwan National
Park Management Planning. Balla, M. K., Raymajhi, S., Pradhan, N.M. B. (eds.) Pro-
ceeding of Regional Networking Seminar and Second General Assembly. 10-11 Feb
2001, Kathmandu, Nepal: 62-70.
Rijal, A. M. 1993. Ethno-Botany of Padampur: Analysis of Dependency and Conflicts. Thesis.
M. Sc. Agricultural University of Narway.
SASMoN. 2002. Social Mobilization Social Organization Operational Principles Social Mobili-
zation Process Savir Credit Capacity Building Productive Infrastructure Natural Resource
Management. Available: http://www.sasmon.org.html [Retrieved May 14 2008].
Sharma, U. R. 1998. Buffer Zone Policy and Analysis of Chitwan National Park. National Trust
for Nature Conservation, Nepal.
Sherpa, M. N. 2000. The View beyond the Park: Managing the Impacts of Sagarmatha National
Park and its tourism on the adjoining region of Park, Nepal. Thesis, M. Sc. The Universi-
ty of Wales, Aberystwyth, Uk.
Silwal, T. 2003. Rural livelihood and diversity in buffer zone. A case study from Bardia National
Park. A thesis Submitted in Partial Fulfillment of the Requirements for the Degree of

Aryal, Maniratna: Final Report
Master of Science in Forestry at IOF, Nepal.
SPSS. 1999. Statistical Package for Social Science Package, Version 12. Chicago, USA. submit-
ted to the United Nation Development Programme (UNDP), Kathmandu Nepal.
Tamrakar, S.M. and D.V. Neilson. 1991. Potential Community Forest Land in Nepal, Field doc-
ument No. 16.
UNESCO and IUCN, 2003. Enhancing Our Heritage Project: Monitoring and Managing for
Success in Natural World Heritage Sites. Initial Management Effectiveness Evaluation
Report section 4.3, pp37-38: Chitwan National Park, Nepal.
Upreti, B. N. 1991. Status of National Parks and Protected Areas in Nepal. Tiger paper (18):2.
Food and Agriculture Organization.
Upreti, B. R. 2000. Social Transformation through Community Forestry: Experiences and Les-
sons from Nepal. Mountain Forum On-line Library Document.
Upreti, D. R. 2005. Evaluation of Forest Sector Policy in Connection to Community Forestry of
Nepal, Submitted for the partial fulfillment of the Doctorate study in BOKU under the
topics mountain forest politics and policy (Vianna: University of Natural Resources and
Applied Life Science).
Varughese, G. 1999. “Villagers, Bureaucrats, and Forests in Nepal: Designing Governance for a
Complex Resource.” Ph.D dissertation, Indiana University, Bloomington.
Wells, M. 1992. Bio-diversity, Conservation, Affluence and Poverty: Mismatched Costs and
Benefits and Efforts to Remedy them. Ambio, 22: 157-162.
Wells, M. and K. Brandon. 1993. The principles and practice of buffer zones and local participa-
tion in biodiversity conservation. Ambio, 22(2-3), 157-162.
WWF. 2001. Integrating Conservation: A community approach to Conservation in Chitwan Na-
tional park, Nepal. WWF-Nepal Programme, Kathmandu Nepal.
WWF. 2007. Terai Arc Landscape (TAL), Nepal, Up to date information, an electronic version
available at http://www.panda.org/about_wwf/what_we_do/ spe-
cies/our_solutions/programmes/species_people/our_solutions/tal_nepal/index.cfm

Aryal, Maniratna: Final Report
9. APPENDICES
Appendix 1: List of Declared Protected Areas of Nepal
S.N. Name of Protected Areas Year of Declaration (A.D.) Areas (Sq. Km.)
National Park
1. Chitwan National Park 1973 932
2 Langtang National Park 1976 1710
3 Sagarmatha National Park 1976 1148
4 Rara National Park 1976 106
5 Se-Foksundo National Park 1974 3555
6 Khaptad National Park 1984 225
7 Bardia National Park 1976 968
8 Makalu Barun National Park 1991 1500
9 Shivapuri National Park 2002 144
Wildlife Reserve
1. Sukla Wildlife Reserve 1976 305
2. Koshi Tappu Wildlife Reserve 1976 175
3. Parsa Wildlife Reserve Not Available 499
Hunting Reserve
1. Dhor Patan Hunting Reserve 1987 1325
Other Protected Areas (Conservation area)
1. Annapurna Conservation Project 1992 7629
2. Kanchanjangha Conservation Project 1997 2035
3. Manasuli Conservation Project 1998 1663
Source: Poudel, 2003

Aryal, Maniratna: Final Report
Appendix 2: List of Buffer Zone declared National Park of Nepal
S.N. Name of National Park Year of Declaration (A.D.) Area (Sq. Km.)
1. Chitwan National Park 1996 750
2. Bardia National Park 1996 328
3. Langtang National Park 1998 420
4. Se-Foksundo National Park 1998 449
5. Makalu Barun National Park 1999 830
6. Sagarmatha National Park 2002 275
Total area 3,052
Source: Poudel, 2003
Appendix 3: List of Buffer Zone of Chitwan District
SN Name of Buffer Zone Area (ha) Number of UGs
1. Lother Buffer Zone User Committee 51
2. Khagendra malli Buffer Zone User Committee 102
3. Budhi rapti Buffer Zone User Committee 76
4. Mriga kunja Buffer Zone User Committee 3332 119
5. Baranda bhar Buffer Zone User Committee 56
6. Patihani Buffer Zone User Committee 50
7. Kerunga Buffer Zone User Committee 69
8. Pachpandav Buffer Zone User Committee 104
9. Kala banger Buffer Zone User Committee 46
10. Meghouli Buffer Zone User Committee 58
11. Ayodhyapuri Buffer Zone User Committee 60
12. Rewa Buffer Zone User Committee 115
13. Nirmal Thori Buffer Zone User Committee 92
Total 998
Source: Poudel, 2003

Aryal, Maniratna: Final Report
Appendix 4: Overview of Chitwan National Park
Established Date 1973 (2029 B.S.)
World Heritage Site Declared 1984 (2040 B.S.)
Area 932 Sq.km
Present Calculated area 1182 Sq. Km
Altitude 110 m to 850 m
Physiographic Region Terai-Siwalik
Position X1: 83050’23” Y1: 84046’25”
X2: 27016’ Y2: 27042’14”
Districts covered Chitwan, Nawalparasi, Parsa, and Makwanpur
Park Headquarter Kasara, Chitwan
Management Sector HQ East -Sauraha = (34440 ha covered)
Centre-Kasara = (27810 ha covered)
South – Bagai = (30890 ha covered)
West – Amaltari=(25060 ha covered)
Park entry gate Sunachuri via Sunachuri
Khagendramalli via Bhandara/Dadhuwa
Sauraha via Tandi(Ratnanagar)
Ghatgai via Patihani
Kasara via Jagatpur
Bhimle via Meghauli
Piprahar via Rajahar
Laukhani via Pragatinagar
Amaltari via Danda
Vegetation types Mainly Sal, Mixed Hardwood forest, Riverine, and Grass-
land
Flora and Fauna More than 600 plant species, 50 mammals, 526 birds and
49 amphibians and reptiles. Some of them are endangered.
Total visitors 1,10,125 (in 2007/08)

Aryal, Maniratna: Final Report
Appendix 5: Overview of Chitwan National Park Buffer Zone
Established date 1996 (2053 B.S.)
Number of VDCs 35
Number of Municipalities 2
Area Covered 76, 750 ha
BZ headquarters Kasara, Chitwan
District Covered Chitwan, Nawalparasi, Parsa, and Makwanpur
Boundary Longitude-83050’44”-84044’58”& Latitude-27016’56”-27042’13”
East sector Manahari VDC of Makawanpur district and Piple, Bhandara, Ka-
thar, Kumroj, Bachhauli and Padampur VDCs and Ratnanagar
Municipality of Chitwan district
Central sector Bhartpur Municipality and Gitanagar, Patihani, Jagatpur, Sukra-
nagar, Meghauli, Dibyanagar, and Gunjanagar VDCs of Chitwan
district
West sector Mukundapur, Amarapuri, Rajahar, Dibyapuri, Pragatinagar, Pi-
thauli, Kawaswati, Argyauli, Kumarworti, Koluwa, Narayani,
Prassauni, Nayabelhani, Dumkibas and Tribeni susta VDCs of
Nawalparasi
South sector Gardi, Bagauda, Kalyanpur, Ayodhyapuri VDCs of Chitwan dis-
trict, Thori, and Nirmalbasti VDCs of Parsa district
Households 36, 193
Total population 2,23, 260
Male 1,11,143
Female 1,12,117
Land use distribution
Cultivated land 35,501ha
Forest land 32,929 ha
Shrub and Grass land 974 ha and 870 ha
Others (river/sand) 6476 ha
Source: CNP, Kasara, 2001

Aryal, Maniratna: Final Report
Appendix 6: Total number of households in BBZCF Users Group (Ward 1, 2, 3 and 4)
Ward User group HH
1 109(14)
2 146(19)
3 362(46)
4 162(21)
Total 779(100)
Source: Baghmara Buffer Zone Community Forest *Figures in parentheses indicate Percentage
Appendix 7: Number and Percentage of ethnic groups of the Bachhauli VDC
Caste Rich Percent Medium Percent Poor Percent Total Percent
Upper caste 15 36.6 24 35.8 28 29.5 67 33
Tharu 15 36.6 29 43.3 52 54.7 96 47.3
Lower caste 0 0 1 1. 5 7 7.4 8 3.9
others 11 26.8 13 19.4 8 8.4 32 15.8
Appendix 8: Number and Percentage of major occupation of the Respondents
Occupation Rich Percent Medium Percent Poor Percent Total Percent
Agriculture 18 43.9 27 40.3 57 60 102 50.3
Business 10 24.4 5 7.5 3 3.2 18 8.9
Service 13 31.7 16 23.9 9 9.5 38 18.7
Wage labor - - 19 28.3 24 25.3 43 21.1
Fishing - - - - 2 2.1 2 1
Appendix 9: Feeding system adopted by the locals of buffer zone (2008)
Feeding system Rich Percent Medium Percent Poor Percent Total Percent
Stall feeding 26 63.4 43 64.2 48 50.5 117 57.6
Free grazing 5 12.2 9 13.4 13 13.7 27 13.3
Mixed type 10 24.4 15 22.4 34 35.8 59 29.1

Aryal, Maniratna: Final Report
Appendix 10: Wild animals causing damages to crops, livestock and human in study area
Animals Rich Medium Poor Total
Rhinoceros 23 41 66 130
Wild pig 9 13 9 31
Chital 5 8 12 25
others 4 5 8 17
Appendix 11: Effectiveness of measures to control crop raids
Measure Very effective Less effective Not effective
Electric fencing 54 - -
Wire fencing 15 36 11
Trench 11 18 8
Watchman (Machan) 6 11 6
Crop alternation practice 8 8 11
Total 94(46.3) 73(36) 36(17.7)
Appendix 12: Possibility of monsoon flooding in the study area
Flooding Total Percent
No problem 117 57.6
Not so much 37 18.2
Severe problem 49 24.1
Appendix 13: Satisfaction towards the compensation of loss caused by wild animals (2008)
Category Highly
satisfied
Satisfied Less
satisfied
Dissatisfied Highly
dissatisfied
Rich 5(12.2) 11(26.8) 14(34.2) 8(19.5) 3(7.3)
Medium 10(14.9) 14(20.9) 17(25.4) 21(31.3) 5(7.4)
Poor 13(13.7) 21(22.1) 34(35.8) 18(18.9) 9(9.5)
Total 28(13.8) 46(22.7) 65(32) 47(23.2) 17(8.4)
*figures in parentheses indicate Percentage.

Aryal, Maniratna: Final Report
Appendix 14: Types of training participated by the Respondents of the Bachhauli VDC
Type Rich Medium Poor Total
Institutional development 5 8 14 27
Agro based 12 13 18 43
Forest based 6 10 10 26
Livestock based 5 7 9 21
Skill enhancement 4 14 20 38
Tourism 9 15 24 48
Appendix 15: Consequences of tourism perceived by the Respondents
Consequences (Positive) Rich Medium Poor Total
National economic benefit 11(33.3) 8(19) 10(14.9) 29(20.4)
Job opportunity 9(27.3) 15(35.7) 24(35.8) 48(33.8)
Market potentiality 7(21.2) 10(23.8) 19(28.4) 36(25.4)
Conserved biodiversity 6(18.2) 9(21.4) 14(20.9) 29(20.4)
Total 33(80.5) 42(62.7) 67(70.5) 142(70)
Negative Consequences
Social and economic imbalance 3(37.5) 8(32) 7(25) 18(29.5)
Environment pollution 4(50) 12(48) 16(57.1) 32(52.5)
Natural resource depletion 1(12.5) 5(20) 5(17.8) 11(18)
Total 8(19.5) 25(37.3) 28(29.5) 61(30)
*figures in parentheses indicate %age
Appendix 16: Respondent’s perception of community forest in community development
Sector Rich Medium Poor Total
Public infrastructures 28(68.3) 36(53.7) 54(56.8) 118(58.1)
Conservation awareness 8(19.5) 21(31.3) 32(33.7) 61(30.1)
Both 5(12.2) 10(15) 9(9.5) 24(11.8)
*figures in parentheses indicate %age

Aryal, Maniratna: Final Report
Appendix 17: Value of resources harvested by local community
Resources
Total har-
vested(mt)
Harvested per
HH(kg)
Total monetary val-
ue(Rs'000) Value per HH(Rs)
Thatch 10,363 1,516 7,358 1,076
Reeds 6,147 899 7,007 1,076
Simthi 857 126 909 1,025
Babiyo 630 92 863 133
Firewood 2993 438 1945 126
Others 62 9 93 13
Total 21,052 3,079 18,175 2,659
Source: NTNC, 2007
Appendix 18: Estimate of Net monetary contribution from resources harvested during grass cut-
ting period to local economy
a. Total monetary value (NRs) of resource harvested by 61,614 grass
cutters (Unadjusted)(NRs) 20,315,451
b. Estimated monetary value of total man days(60.48 man days/HH: size
9.013)(at daily wage rate of Rs. 25) 1,02,62,391
c. Permit cost @of Rs. 5 3,08,070
d. Net contribution to local economy (a-b-c) 97,54,990
e. Net contribution to local economy (a-b-c) (US$) 3,25,166
Source: NTNC, 1995.

Aryal, Maniratna: Final Report
Appendix 19: Income of Chitwan National Park in different years
S.N Description 063/64 (NRs.) 064/65(NRs.)
1 Entry permit 2,94,01,217 3,54,39,646
2 Camping fee 7,53,400 10,34,600
3 Elephant fee 5,10,100 8,32,800
4 Hotel Royalty 62,98,971 1,30,03,587
5 Public Road 2,60,243.5 5,01,053
6 Vehicle permit 7,44,380 9,07,980
7 Fine 4,81,199 3,29,536
Forest product 82,975 1,78,630
Grazing 5,300 5,300
8 Sand Gravel Royalty 8,00,310 8,52,330
9 Tender Form shell 57,300 55,450
10 Ghat/ Tender Royalty 8,75,000 6,84,000
11 VAT 1,08,335 1,21,139
12 Grass cutting(Kharkhadai) 3,46,341 2,97,910
13 Miscellaneous 3,27,000 2,48,372
Total 4,10,52,072 5,44,92,333
Appendix 20: Estimated total monetary value of resource harvested from CNP during cutting
season
Resources Av. Harvest (kg/person) Price (Rs./kg) Monetary value (NRs.)
Thatch grass 118 2.1 73,82,210
Khadai 70 2.9 60,47,573
Note: Total permits issued for grass cutting in 2007/08 was 29,791. Prices of thatch and khar/khadai are from field inquiry. Per capita harvest rates are based on Dhakal (2005).

Aryal, Maniratna: Final Report
Appendix 21: Annual income of BBZCF in different years
Year Fuel wood selling Tourism Other income Total
2061/62 1,95,055(8.2) 18,84,465(81) 2,51,957(10.8) 23,26,977
2062/63 3,67,125(10.5) 28,21,460(80.3) 3,23,025(9.2) 35,11,610
2063/64 3,62,512(6.5) 47,97,536(86.3) 3,97,098(7.1) 55,57,146
Source: Audit report of BBZCF *figures in parentheses indicated Percentage.
Appendix 22: Annual expenditure of BBZCF in different years
Year Conservation
Fuel wood
collection
Social
development
Official
expense
Total
2061/62
5,19,323
(24.4)
2,48,800
(11.7)
6,27,499
(29.8)
7,31,720
(34.4)
21,27,342
2062/63
10,71,569
(40.4)
2,21,661
(8.3)
6,57,488
(24.8)
7,04,001
(26.5)
26,54,719
2063/64
10,60,174
(26.5)
3,27,588
(8.2)
19,04,487
(47.7)
7,02,933
(17.6)
39,95,182
Source: Audit report of BBZCF *figures in parentheses indicate Percentage.
Appendix 23: Estimated total monetary value of firewood and fodder: deficit assumed to be met
from CNP
Resource
Demand
(Ton)
Deficit
(Ton)
Price
(Rs./kg)
Monetary
Value (Rs.)
Net value by
Deducting 10%
Firewood 1,39,905 17,947 4 7,17,88,000 6,46,09,200
Fodder 42,622 8,913 1.3 1,15,86,900 1,04,28,210
Total 8,33,74,900 7,50,37,410
Note: fuel wood demand reduced through bio gas use is included in the above calculations. There are currently 5000 biogas plants in neighboring VDCs of CNP. Total firewood saving due to biogas is about 10 % of current firewood demand.

Aryal, Maniratna: Final Report
Appendix 24: Direct benefits derived from Chitwan National Park (2008)
Resources Monetary value (NRs.)
Thatch grass 73,82,210
Khar/khadai 60,47,573
Firewood 6,46,09,200
Fodder 1,04,28,210
Others (minor NTFP) 26,85,957
Total 9,10,53,150
Appendix 25: Direct Cost to collect such forest products
Resources Monetary value (NRs.)
Entry fee 2,97,910
Labor cost 5,95,82,000
Salary of buffer zone personnel 1,05,00,000
Total cost 7,03,79,910
Appendix 26: Number of tourist visiting Chitwan National Park in different years.
Years 2000/01 2001/02 2002/03 2003/04 2004/05 2005/06 2006/07 2007/08
Total 1,06,254 58,317 48,921 57,876 62,286 76,891 79,086 1,10,125
* A number of attempts were made at an official level to inquire about the costs of park and buf-
fer zone management, it was impossible to get such estimates from the relevant officials. No one
was in a position to provide such information. Thus, we could not simulate cost estimates of park
management like total cost for B/C ratio calculation effectively.

Aryal, Maniratna: Final Report
Appendix 27: Total value of benefits generated by Park in 2008
Values In NRs
Consumptive
Khar/khadai 73,82,210
Grass 60,47,573
Firewood 6,46,09,200
Fodder 1,04,28,210
Others 26,85,957
Productive use value
Visitor fee 3,54,39,646
Elephant ride fee 8,32,800
Royalty 1,30,03,587
Right of way 501053
Vehicle fee 9,07,980
Fines 3,29,536
Ghat toll 6,84,000
Grass cutting permits fee 2,97,910
Miscellaneous 2,48,372
Camping 10,34,600
Grazing fines 5,300
Tourism expenditure in hotels and food 19,82,25,000
Total value of benefits 34,26,62,934
Notes: others(minor products) =20% of the value of khar/khadai and grass, based on Sharma
(1991), the fodder is based on demand of domestic animals, forage demand has been adjusted
to reflect TDN requirement. Forage price is assumed to be Rs. 0.8 per kg income accruing to
hoteliers is derived through touring tourist in Baghmara forest. others sources of Park revenue
are based on Table 22 a tourist assumed to spend Rs. 1800 in hotels and food while visiting the
CNP

Aryal, Maniratna: Final Report
Picture 1: Board of Baghmara Buffer Zone Community Forest
Picture 2: Researcher (Right) gathering information from the BBZCF staff in office building

Aryal, Maniratna: Final Report
Picture 3: Researcher (left) taking interview with the tourists to collect information in Sauraha

Aryal, Maniratna: Final Report
Picture 4: Office building of BBZCF
Picture 5: Elephant with tourist moving towards BBZCF and CNP to view the wild animals inside Park

Aryal, Maniratna: Final Report
Picture 6: Women participating skill based training organized by Buffer Zone
Picture 7: Viewing tower of wild animals (Machan)

Aryal, Maniratna: Final Report
Picture 8: Machan to live wtachman and control wild animals causing damage to local community
Picture 9: One horned rhino, centre of attraction in Chitwan National Park

Aryal, Maniratna: Final Report
Picture 10: Enumerators (Januka and Prakash) taking interview with the tourist
Picture 11: Enumerators (Yadav and Prakash) participate in the interview taken by researcher (Centre) with the respondent (local of BBZCF)

Aryal, Maniratna: Final Report
Picture 12: Barbed wire fence in and around the BBZCF
Picture 13: Community development works to control the flooding during monsoon season in Rapti river

Aryal, Maniratna: Final Report
Picture 14: Tap water supply funded by BBZCF
Picture 15: Locals harvesting fodder from the BBZCF
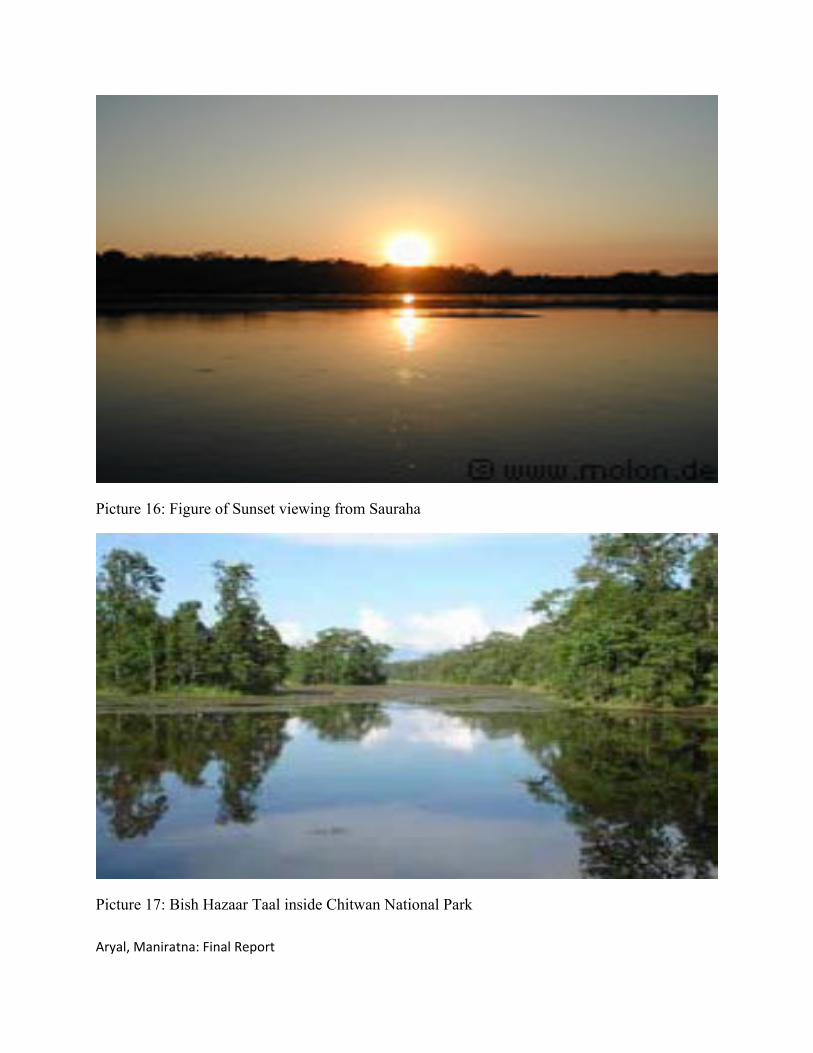
Aryal, Maniratna: Final Report
Picture 16: Figure of Sunset viewing from Sauraha
Picture 17: Bish Hazaar Taal inside Chitwan National Park

Aryal, Maniratna: Final Report
Picture 18: Toilet of locals funded by BBZCF
Picture 19: Bridge over the Reukhola of Madi

Aryal, Maniratna: Final Report
Picture 20: Biogas stove used to cook food funded by BBZCF
Picture 21: Rest place inside the BBZCF

Aryal, Maniratna: Final Report
Picture 22: Locals harvesting the Thatch grass from CNP during January, 2008

Aryal, Maniratna: Final Report
Photo of the Researcher

Aryal, Maniratna: Final Report
Household Survey Questionnaire Namaste, I am Maniratna Aryal, master’s student in Institute of Agriculture and Animal
Sciences (IAAS). I am here to collect data for my research on “Cost Benefit Analysis of Buffer
Zone Management in Chitwan National Park in Chitwan District, Nepal” which was funded
by South Asia Network of Economic Research Institute (SANEI)-Pakistan. I have chosen your
village as my study area. Your information will be precious for me to study the benefits generat-
ed by forest/Park, resource utilization and reasons for conflict between locals and Park manage-
ment authority. The information collected will be used solely for my thesis research. I am very
thankful for your kind co-operation and giving valuable time.
I. GENERAL INFORMATION OF INFORMANT
1. Name of the respondent:
2. Age:
3. Sex: Male ( ) Female( )
4. Ethnicity:
5. District:
6. VDC:
7. Ward No:
8. Village:
9. Well being of the Respondents
a. Rich ( ) b. Medium ( ) c. Poor ( )
10. Family Size
a. Male ( ) b. Female ( )
11. Number of Economically active members in your family
a. 0-15 yrs ( ) b. 16-59 yrs ( ) c. More than 60 yrs ( )
12. What is the major source of living?
a. Agriculture ( )b. Service ( )c. Business ( ) d. Wage labor ( ) e. Fishing ( )
13. What is your level of education?
a. Illiterate ( ) b. Below SLC ( ) c. Above SLC ( )

Aryal, Maniratna: Final Report
14. What is your annual income (NRs)?
a. ≤10,000 ( ) b. 10,001-20,000 ( ) c. 20,001-40,000 ( ) d. ≥ 40,000( )
15. Do you have livestock?
a. Yes ( ) b. No ( )
If yes,
S. No Types of Livestock Number
1. Cow
2. Buffalo
3. Goat
4. Poultry
5. Pigs
6. Others
16. How do you feed your livestock?
a. Stall feeding ( ) b. Free grazing ( ) c. Both ( )
17. For how many months your production is sufficient for home consumption?
a. ≤3 months ( ) b. 3-6 months ( ) c. 6-9 months ( ) d. ≥ 9 months ( )
18. How will you manage for the deficit month?
a. Daily wages earnings ( ) b. Share cropping ( ) c. Seasonal migration ( )
d. Others ( )
19. Do you have accessibility for harvesting resources in Baghmara community forest?
a. Yes ( ) b. No ( )
20. Do you collect thatch materials from Baghmara community forest or Park, CNP?
a. Yes ( ) b. No ( )
If no, what are the reasons?
21. Are you satisfied for the collection period provided by Park?
a. Highly satisfied ( ) b. Satisfied ( ) c. Less satisfied ( )
d. Dissatisfied ( ) e. Highly dissatisfied ( )
22. What is the source of energy for cooking?
a. Firewood ( ) b. Biogas ( ) c. Kerosene ( )

Aryal, Maniratna: Final Report
d. LP gas ( ) e. Bhusechulo ( )
23. From where do you receive firewood and timber?
a. Government forest ( ) b. Community forest ( ) c. Driftwood ( )
d. Private forest ( ) e. Sawmills ( )
24. What are the major Crops damaged by wild animals? (%age basis of production)
a. Paddy ( ) b. Wheat ( ) c. Maize ( )
d. Vegetables ( ) e. Oilseeds ( )
25. What is the Intensity of crop damage?
a. Very high ( ) b. High ( ) c. Moderate ( ) d. No damage ( )
26. What are the major wild animals causing damage to crops, livestock and human?
a. Wild pig ( ) b. Chital ( ) c. Rhino ( ) d. Others ( )
27. What are the methods used to control crop damage by wild animals?
a. Electric fence ( ) b. Trench ( ) c. Watchman/Machan ( ) d. Wire fence ( )
e. Crop alternation practice ( )
28. What is the level of Satisfaction towards the compensation provided by buffer zone?
a. Highly satisfied ( ) b. Satisfied ( ) c. Less satisfied ( )
d. Dissatisfied ( ) e. Highly dissatisfied ( )
29. What is the possibility of monsoon flooding in your locality?
a. No problem ( ) b. Not so much problem ( ) c. severe problem ( )
30. What are the efforts to control natural calamities?
a. Mass awareness ( ) b. Tat bandha at the riverbank ( ) c. Forestation ( )
d. Less grazing ( ) e. Check deforestation ( )
31. Have you participated in any types training? Yes/No
If Yes,
a. Leadership ( ) b. Agro based ( ) c. Livestock based ( )
d. Skill based ( ) e. Tourism ( )
32. What is the impact of tourism in your opinion? Positive/Negative
If (Positive)
a. Employment ( ) b. National revenue ( )
c. Market potentiality of local produce ( ) d. Conservation strategy increased ( )

Aryal, Maniratna: Final Report
If (Negative)
a. Economic imbalance ( ) b. Depletion of natural resources ( )
c. Environmental pollution ( )
33. What is your perception about community forest in community development initiatives
a. Public infrastructures ( ) b. Conservation strategy ( ) c. Both ( )
34. Have you participated in forest management? Yes/No
If no, why?
35. What do you feel about the Baghmara Buffer Zone Community Forest?
a. Positive ( ) b. Negative ( ) c. Neutral ( )
36. What are the factors affecting for local people’s involvement in forest management?
a. Location (Yes/No) b. Education (Yes/No) c. Caste (Yes/No)
d. Occupation (Yes/No) e. Food sufficiency (Yes/No) f. Cooperatives (Yes/No)
g. Effectiveness of Animals Preventive infrastructures (Yes/No)
37. What is the Cooperativeness of Park administration with the local people in buffer zones?
a. Improved ( ) b. Lack of relationship ( ) c. Stagnant ( ) d. Worst ( )
38. Have you participated in any forest conservation activities? Yes/No
39. What are the benefits do you get from the community forest?
40. Should women be involved in forest management activities? Yes/No
41. What is your demand for fodder, firewood, and grass per day and actual collection per day?
42. What is the amount of Thatch grass and Canes (khadai) collection during Park opening pe-
riod?
43. What is the annual lump sum net income from agricultural cultivation in one katha of land?
44. What is the consumption of forest products per day in your family?
45. How the User group members distributing the forest products?
46. Do you have any ideas about income source of community?
47. What is your role to protect community forest?
48. What is your suggestion to manage the Chitwan National Park and Community forest?
Name of Interviewer:……………………………………………….Date:…………../……/2008
Thank you
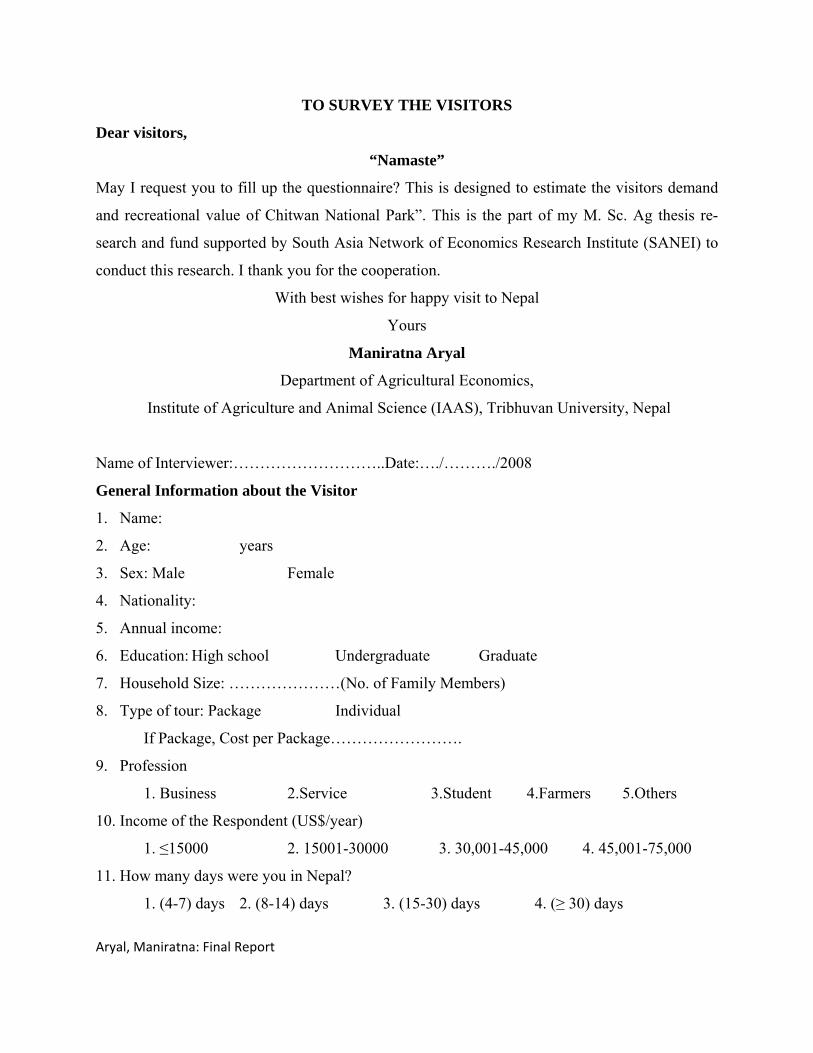
Aryal, Maniratna: Final Report
TO SURVEY THE VISITORS
Dear visitors,
“Namaste”
May I request you to fill up the questionnaire? This is designed to estimate the visitors demand
and recreational value of Chitwan National Park”. This is the part of my M. Sc. Ag thesis re-
search and fund supported by South Asia Network of Economics Research Institute (SANEI) to
conduct this research. I thank you for the cooperation.
With best wishes for happy visit to Nepal
Yours
Maniratna Aryal
Department of Agricultural Economics,
Institute of Agriculture and Animal Science (IAAS), Tribhuvan University, Nepal
Name of Interviewer:………………………..Date:…./………./2008
General Information about the Visitor
1. Name:
2. Age: years
3. Sex: Male Female
4. Nationality:
5. Annual income:
6. Education: High school Undergraduate Graduate
7. Household Size: …………………(No. of Family Members)
8. Type of tour: Package Individual
If Package, Cost per Package…………………….
9. Profession
1. Business 2.Service 3.Student 4.Farmers 5.Others
10. Income of the Respondent (US$/year)
1. ≤15000 2. 15001-30000 3. 30,001-45,000 4. 45,001-75,000
11. How many days were you in Nepal?
1. (4-7) days 2. (8-14) days 3. (15-30) days 4. (≥ 30) days

Aryal, Maniratna: Final Report
12. How many days were you in Chitwan?
1.(≤3) days 2.(4-7) days 3. (8-15) days 4. (≥ 15) days
13. How many times did you visit national Parks or nature-based recreation in Nepal within the
last 12 months for recreation purpose?
No. of times:
14. How much did you spend on eco-tourism during the last year?
15. How many times did you visit the Chitwan National Park within the last 12 months for
recreation purposes? No. of times:
16. How much did you spend on visiting CNP?
17. How many hours were you at the Park today? …………….. hours.
18. How did you come to this Park?
1. Bus 2.Private car/taxi 3.Plane 4. Others (please specify)
19. How much did you spend on your trip from Kathmandu to this national Park?
Transportation …………… Rs. (in case of public transport)
Fuel………………………Rs. (if private vehicle)
Food ………………………..Rs.
Accommodation……………..Rs.
Other ………………………….Rs.
Total ………………………….Rs.
20. How would you describe the quality of recreational benefits at CNP?
1. Very poor 2.Poor 3.Fair 4.Good 5. Excellent 6.Don't know
21. Are you satisfied with the existing recreational benefits of the Park? Yes /No.
22. Do you know any other National Park that you would like to visit instead of CNP? Yes/No
23. If yes, what would be your total cost to visit that Park as compared to CN Park? Rs……….
24. How much time would you spend at the next best alternative national Park?.............hours.
25. Would you like to have improved recreational services provided by the Park? Yes/ No.
26. If No, why?
1. Satisfied with the existing recreational benefits/services of CN Park.
2. Don’t have any money; cannot afford
3. Others (specify)

Aryal, Maniratna: Final Report
27. What types of improvements would you like to see at this Park?
(i) Recreational Site: Sight-seeing, Bird-watching, Relaxation, Walking tracks, Exercising,
Other
(ii) Information about CN Park: Maps, Information Sign, Precaution Sign, Tourist Informa-
tion Centre
(iii)Traffic: Road Conditions, Traffic Safety, Traffic Sign, Parking
(iv) Miscellaneous: Waste disposal, Lavatory, Food and Beverage Services, Accommodation
Visitor's Attitude towards Entrance Fees
28. What is the entry fee to CN Park……………….(Rs.)
29. Suppose there were no other sources of fund for the improvement of Park quality except im-
posing/raising entry fees, would you be willing to pay higher entry fee? Yes/ No
30. If the entry fee were US$ 15, would you be willing to pay it to visit the CN Park? Yes/No
31. What is the most you would be willing to pay for the entry fee to this Park?
Maximum amount (US$)
32. If you are willing to pay for improved quality of recreational services in the near future, per-
haps you may wish to come to the Park and spend more time for recreation. How many more
times would you then be here? ................... visits/year.
Thank you for your kind cooperation