Embed Size (px)
Citation preview
CBA for the Clean Air Policy Package
1
Cost-benefit Analysis of Final Policy Scenarios for the EU Clean Air Package Version 2
Corresponding to IIASA TSAP Report 11, Version 2a October 2014
CBA for the Clean Air Policy Package
1
Author: Mike Holland, EMRC: [email protected]
Acknowledgements: This report was produced under subcontract to IIASA (the International Institute for Applied Systems Analysis, Laxenburg, Austria) for the Service Contract on Monitoring and Assessment of Sectorial Implementation Actions (070307/2011/599257/SER/C3) of DG-Environment of the European Commission. The assistance of staff at IIASA, particularly Chris Heyes who provided input data for the modelling presented here, is gratefully acknowledged. Acknowledgement is also made of the contribution to the methods that underpin this analysis by numerous contributors in the past, particularly members of the ExternE Project team and those who collaborated on the CBA under the CAFE Project and subsequent work on revision of the Gothenburg Protocol and assessment of air pollution co-benefits of climate policies. The modelling approach that has been used for this report has been updated under the EC4MACS (European Consortium for the Modelling of Air pollution and Climate Strategies) project with financial contributions of the LIFE financial instrument of the European Community.
Changes compared to version 1: 1. NO2 effects are identified as unquantified in Table 3.14 and Table 3.15 dealing with healthcare
costs. 2. Minor clarifications to the text. 3. Hyperlinks are provided in the list of references to reviews by concawe. 4. Minor formatting changes.
Disclaimer: The orientation and content of this report cannot be taken as indicating the position of the European Commission or its services.
CBA for the Clean Air Policy Package
2
Executive Summary
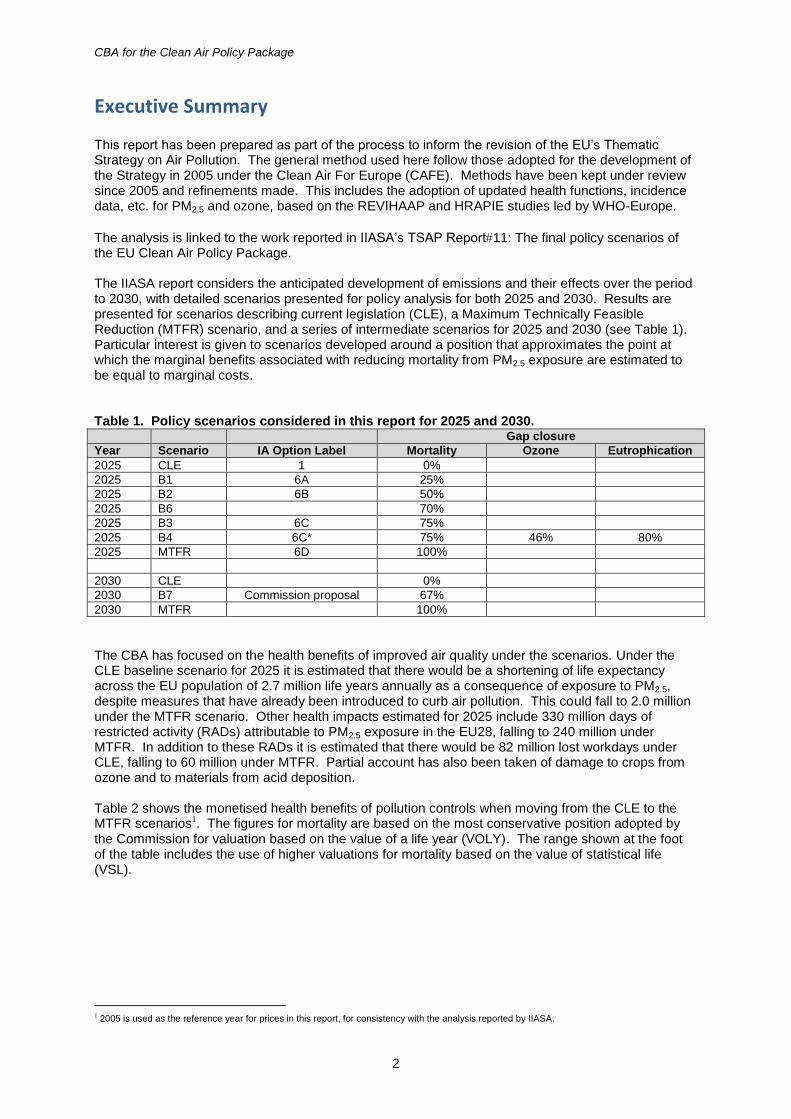
This report has been prepared as part of the process to inform the revision of the EU’s Thematic Strategy on Air Pollution. The general method used here follow those adopted for the development of the Strategy in 2005 under the Clean Air For Europe (CAFE). Methods have been kept under review since 2005 and refinements made. This includes the adoption of updated health functions, incidence data, etc. for PM2.5 and ozone, based on the REVIHAAP and HRAPIE studies led by WHO-Europe.
The analysis is linked to the work reported in IIASA’s TSAP Report11: The final policy scenarios of the EU Clean Air Policy Package. The IIASA report considers the anticipated development of emissions and their effects over the period to 2030, with detailed scenarios presented for policy analysis for both 2025 and 2030. Results are presented for scenarios describing current legislation (CLE), a Maximum Technically Feasible Reduction (MTFR) scenario, and a series of intermediate scenarios for 2025 and 2030 (see Table 1). Particular interest is given to scenarios developed around a position that approximates the point at which the marginal benefits associated with reducing mortality from PM2.5 exposure are estimated to be equal to marginal costs. Table 1. Policy scenarios considered in this report for 2025 and 2030. Gap closure
Year Scenario IA Option Label Mortality Ozone Eutrophication
2025 CLE 1 0%
2025 B1 6A 25%
2025 B2 6B 50%
2025 B6 70%
2025 B3 6C 75%
2025 B4 6C* 75% 46% 80%
2025 MTFR 6D 100%
2030 CLE 0%
2030 B7 Commission proposal 67%
2030 MTFR 100%
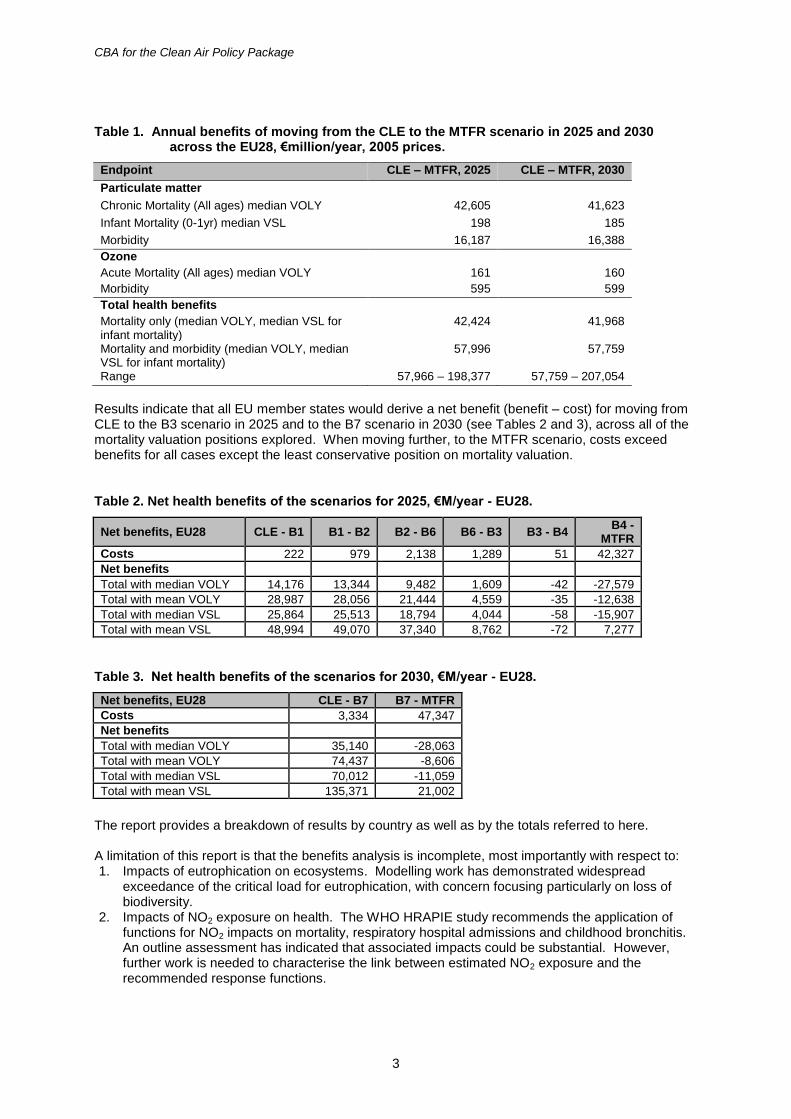
The CBA has focused on the health benefits of improved air quality under the scenarios. Under the CLE baseline scenario for 2025 it is estimated that there would be a shortening of life expectancy across the EU population of 2.7 million life years annually as a consequence of exposure to PM2.5, despite measures that have already been introduced to curb air pollution. This could fall to 2.0 million under the MTFR scenario. Other health impacts estimated for 2025 include 330 million days of restricted activity (RADs) attributable to PM2.5 exposure in the EU28, falling to 240 million under MTFR. In addition to these RADs it is estimated that there would be 82 million lost workdays under CLE, falling to 60 million under MTFR. Partial account has also been taken of damage to crops from ozone and to materials from acid deposition. Table 2 shows the monetised health benefits of pollution controls when moving from the CLE to the MTFR scenarios1. The figures for mortality are based on the most conservative position adopted by the Commission for valuation based on the value of a life year (VOLY). The range shown at the foot of the table includes the use of higher valuations for mortality based on the value of statistical life (VSL).
1 2005 is used as the reference year for prices in this report, for consistency with the analysis reported by IIASA.
CBA for the Clean Air Policy Package
3
Table 1. Annual benefits of moving from the CLE to the MTFR scenario in 2025 and 2030 across the EU28, €million/year, 2005 prices.
Endpoint CLE – MTFR, 2025 CLE – MTFR, 2030
Particulate matter
Chronic Mortality (All ages) median VOLY 42,605 41,623
Infant Mortality (0-1yr) median VSL 198 185
Morbidity 16,187 16,388
Ozone
Acute Mortality (All ages) median VOLY 161 160
Morbidity 595 599
Total health benefits
Mortality only (median VOLY, median VSL for infant mortality)
42,424 41,968
Mortality and morbidity (median VOLY, median VSL for infant mortality)
57,996 57,759
Range 57,966 – 198,377 57,759 – 207,054
Results indicate that all EU member states would derive a net benefit (benefit – cost) for moving from CLE to the B3 scenario in 2025 and to the B7 scenario in 2030 (see Tables 2 and 3), across all of the mortality valuation positions explored. When moving further, to the MTFR scenario, costs exceed benefits for all cases except the least conservative position on mortality valuation.
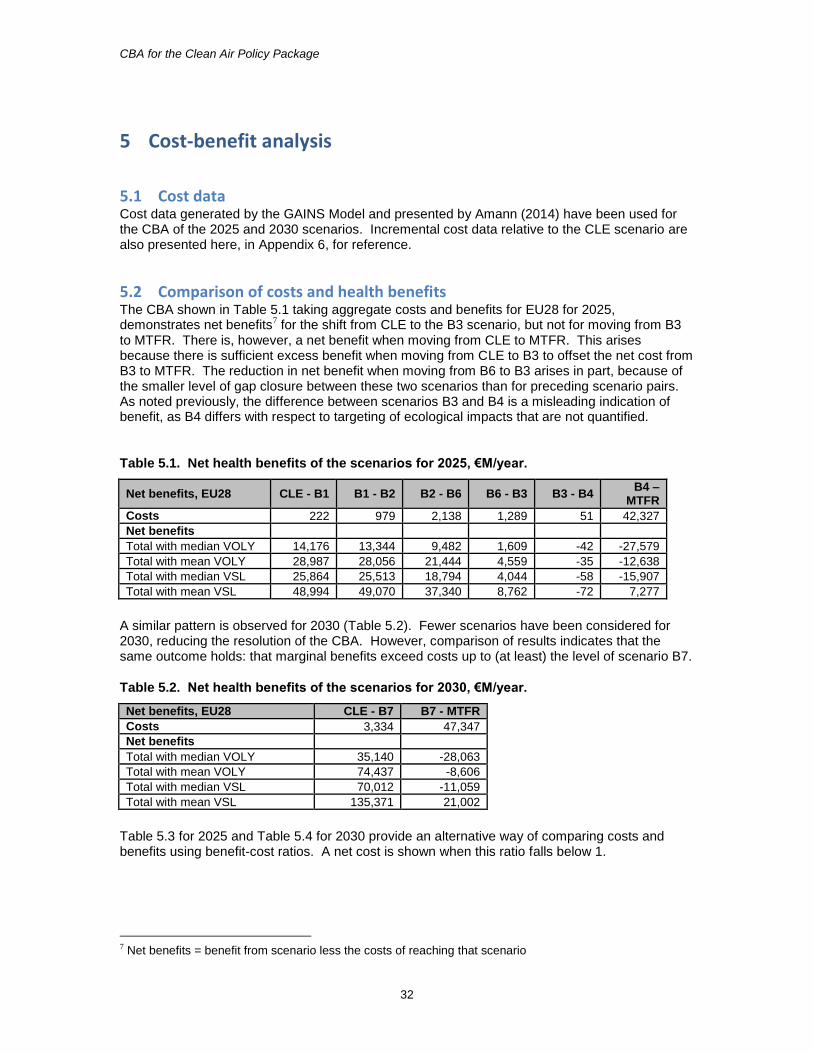
Table 2. Net health benefits of the scenarios for 2025, €M/year - EU28.
Net benefits, EU28 CLE - B1 B1 - B2 B2 - B6 B6 - B3 B3 - B4 B4 -
MTFR
Costs 222 979 2,138 1,289 51 42,327
Net benefits
Total with median VOLY 14,176 13,344 9,482 1,609 -42 -27,579
Total with mean VOLY 28,987 28,056 21,444 4,559 -35 -12,638
Total with median VSL 25,864 25,513 18,794 4,044 -58 -15,907
Total with mean VSL 48,994 49,070 37,340 8,762 -72 7,277
Table 3. Net health benefits of the scenarios for 2030, €M/year - EU28.
Net benefits, EU28 CLE - B7 B7 - MTFR
Costs 3,334 47,347
Net benefits
Total with median VOLY 35,140 -28,063
Total with mean VOLY 74,437 -8,606
Total with median VSL 70,012 -11,059
Total with mean VSL 135,371 21,002
The report provides a breakdown of results by country as well as by the totals referred to here. A limitation of this report is that the benefits analysis is incomplete, most importantly with respect to: 1. Impacts of eutrophication on ecosystems. Modelling work has demonstrated widespread
exceedance of the critical load for eutrophication, with concern focusing particularly on loss of biodiversity.
2. Impacts of NO2 exposure on health. The WHO HRAPIE study recommends the application of functions for NO2 impacts on mortality, respiratory hospital admissions and childhood bronchitis. An outline assessment has indicated that associated impacts could be substantial. However, further work is needed to characterise the link between estimated NO2 exposure and the recommended response functions.
CBA for the Clean Air Policy Package
4
Contents
1 INTRODUCTION ....................................................................................................................................... 5 1.1 BACKGROUND ..................................................................................................................................................... 5 1.2 SCENARIOS CONSIDERED .................................................................................................................................. 6 1.3 SCOPE ................................................................................................................................................................... 6
2 METHODS .................................................................................................................................................. 7 2.1 OVERVIEW........................................................................................................................................................... 7 2.2 BACKGROUND TO THE METHODS FOR BENEFITS ASSESSMENT .................................................................. 8 2.3 HEALTH IMPACT ASSESSMENT ......................................................................................................................... 8 2.4 VALUATION OF HEALTH IMPACTS ................................................................................................................ 11 2.5 NON HEALTH IMPACTS ................................................................................................................................... 14
3 HEALTH BENEFITS .............................................................................................................................. 15 3.1 TRENDS, 2010 TO 2030 ............................................................................................................................... 15 3.2 AGGREGATED RESULTS FOR THE EUROPEAN AND EU28 REGIONS: 2025 SCENARIOS ...................... 16 3.3 AGGREGATED RESULTS FOR THE EUROPEAN AND EU28 REGIONS: 2030 SCENARIOS ...................... 20 3.4 SENSITIVITY ANALYSIS: CHRONIC EXPOSURE AND OZONE MORTALITY ................................................. 22 3.5 IMPACTS ON LOST WORKING DAYS AND HEALTH CARE EXPENDITURE .................................................. 23 3.6 NATIONAL RESULTS ........................................................................................................................................ 27
4 NON-HEALTH BENEFITS .................................................................................................................... 28 4.1 MONETISED NON-HEALTH BENEFITS .......................................................................................................... 28 4.2 UN-MONETISED NON-HEALTH BENEFITS ................................................................................................... 31
5 COST-BENEFIT ANALYSIS .................................................................................................................. 32 5.1 COST DATA ....................................................................................................................................................... 32 5.2 COMPARISON OF COSTS AND HEALTH BENEFITS ....................................................................................... 32
6 DISCUSSION ............................................................................................................................................ 36
7 REFERENCES .......................................................................................................................................... 37
APPENDIX 1: RESPONSE TO STAKEHOLDER COMMENTS ............................................................... 42
APPENDIX 2: COMPARISON OF RESULTS FOLLOWING CAFE AND HRAPIE RECOMMENDATIONS ................................................................................................................................... 44
APPENDIX 3: KEY INDICATORS BY COUNTRY FOR THE BASELINE SCENARIOS, 2010 TO 2030 ................................................................................................................................................................... 47
APPENDIX 4: KEY HEALTH INDICATORS BY COUNTRY FOR THE POLICY SCENARIOS, 2025 AND 2030 ......................................................................................................................................................... 53
APPENDIX 5: TOTAL NATIONAL DAMAGE (COSTED AT EU AVERAGE) UNDER THE POLICY SCENARIOS ....................................................................................................................................................... 64
APPENDIX 6: POLICY SCENARIO COST INCREMENT OVER CLE SCENARIO FROM GAINS FOR 2025 AND 2030 (AMANN, 2014) .............................................................................................................. 66
CBA for the Clean Air Policy Package
5
1 Introduction
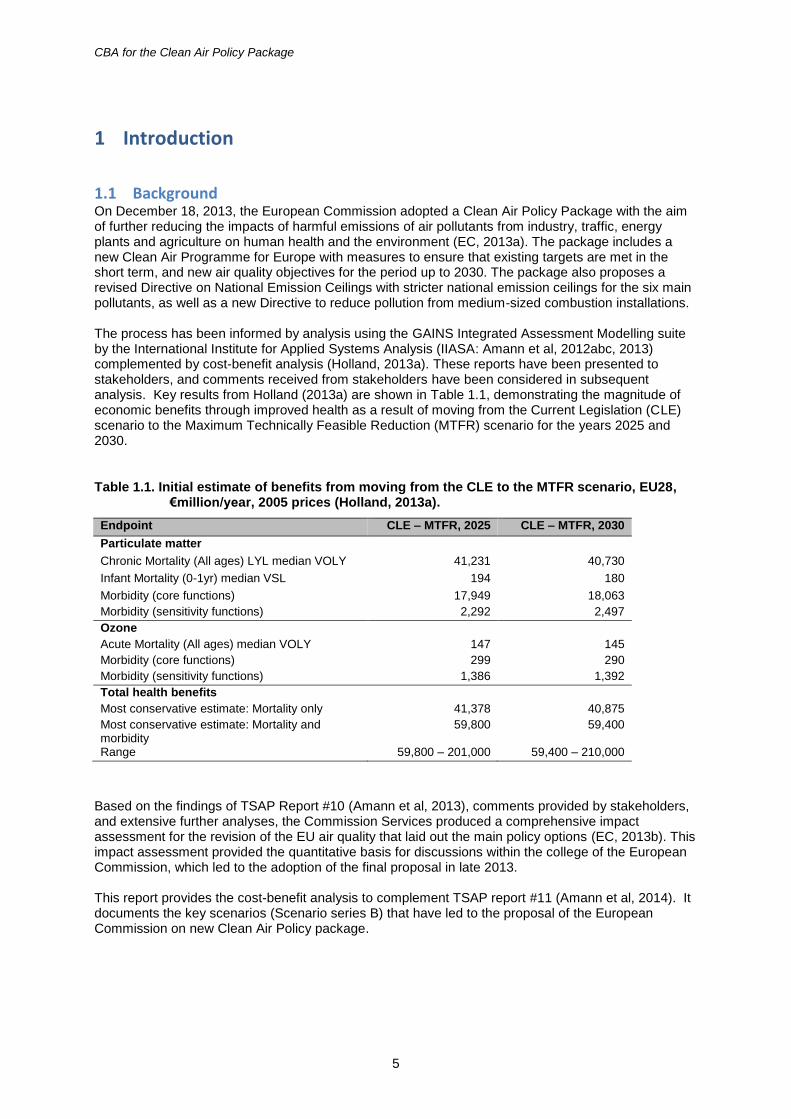
1.1 Background On December 18, 2013, the European Commission adopted a Clean Air Policy Package with the aim of further reducing the impacts of harmful emissions of air pollutants from industry, traffic, energy plants and agriculture on human health and the environment (EC, 2013a). The package includes a new Clean Air Programme for Europe with measures to ensure that existing targets are met in the short term, and new air quality objectives for the period up to 2030. The package also proposes a revised Directive on National Emission Ceilings with stricter national emission ceilings for the six main pollutants, as well as a new Directive to reduce pollution from medium-sized combustion installations. The process has been informed by analysis using the GAINS Integrated Assessment Modelling suite by the International Institute for Applied Systems Analysis (IIASA: Amann et al, 2012abc, 2013) complemented by cost-benefit analysis (Holland, 2013a). These reports have been presented to stakeholders, and comments received from stakeholders have been considered in subsequent analysis. Key results from Holland (2013a) are shown in Table 1.1, demonstrating the magnitude of economic benefits through improved health as a result of moving from the Current Legislation (CLE) scenario to the Maximum Technically Feasible Reduction (MTFR) scenario for the years 2025 and 2030.
Table 1.1. Initial estimate of benefits from moving from the CLE to the MTFR scenario, EU28, €million/year, 2005 prices (Holland, 2013a).
Endpoint CLE – MTFR, 2025 CLE – MTFR, 2030
Particulate matter
Chronic Mortality (All ages) LYL median VOLY 41,231 40,730
Infant Mortality (0-1yr) median VSL 194 180
Morbidity (core functions) 17,949 18,063
Morbidity (sensitivity functions) 2,292 2,497
Ozone
Acute Mortality (All ages) median VOLY 147 145
Morbidity (core functions) 299 290
Morbidity (sensitivity functions) 1,386 1,392
Total health benefits
Most conservative estimate: Mortality only 41,378 40,875
Most conservative estimate: Mortality and morbidity
59,800 59,400
Range 59,800 – 201,000 59,400 – 210,000
Based on the findings of TSAP Report #10 (Amann et al, 2013), comments provided by stakeholders, and extensive further analyses, the Commission Services produced a comprehensive impact assessment for the revision of the EU air quality that laid out the main policy options (EC, 2013b). This impact assessment provided the quantitative basis for discussions within the college of the European Commission, which led to the adoption of the final proposal in late 2013. This report provides the cost-benefit analysis to complement TSAP report #11 (Amann et al, 2014). It documents the key scenarios (Scenario series B) that have led to the proposal of the European Commission on new Clean Air Policy package.
CBA for the Clean Air Policy Package
6
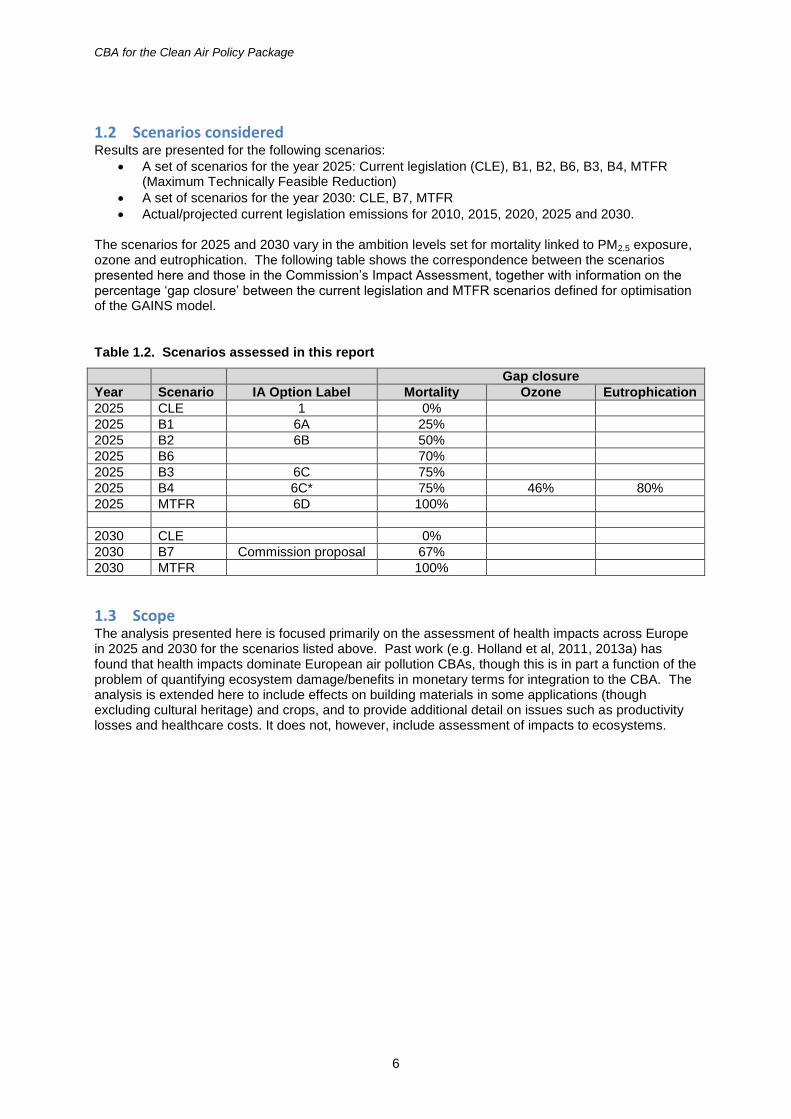
1.2 Scenarios considered Results are presented for the following scenarios:
A set of scenarios for the year 2025: Current legislation (CLE), B1, B2, B6, B3, B4, MTFR (Maximum Technically Feasible Reduction)
A set of scenarios for the year 2030: CLE, B7, MTFR
Actual/projected current legislation emissions for 2010, 2015, 2020, 2025 and 2030. The scenarios for 2025 and 2030 vary in the ambition levels set for mortality linked to PM2.5 exposure, ozone and eutrophication. The following table shows the correspondence between the scenarios presented here and those in the Commission’s Impact Assessment, together with information on the percentage ‘gap closure’ between the current legislation and MTFR scenarios defined for optimisation of the GAINS model.
Table 1.2. Scenarios assessed in this report
Gap closure
Year Scenario IA Option Label Mortality Ozone Eutrophication
2025 CLE 1 0%
2025 B1 6A 25%
2025 B2 6B 50%
2025 B6 70%
2025 B3 6C 75%
2025 B4 6C* 75% 46% 80%
2025 MTFR 6D 100%
2030 CLE 0%
2030 B7 Commission proposal 67%
2030 MTFR 100%
1.3 Scope The analysis presented here is focused primarily on the assessment of health impacts across Europe in 2025 and 2030 for the scenarios listed above. Past work (e.g. Holland et al, 2011, 2013a) has found that health impacts dominate European air pollution CBAs, though this is in part a function of the problem of quantifying ecosystem damage/benefits in monetary terms for integration to the CBA. The analysis is extended here to include effects on building materials in some applications (though excluding cultural heritage) and crops, and to provide additional detail on issues such as productivity losses and healthcare costs. It does not, however, include assessment of impacts to ecosystems.
CBA for the Clean Air Policy Package
7
2 Methods
2.1 Overview
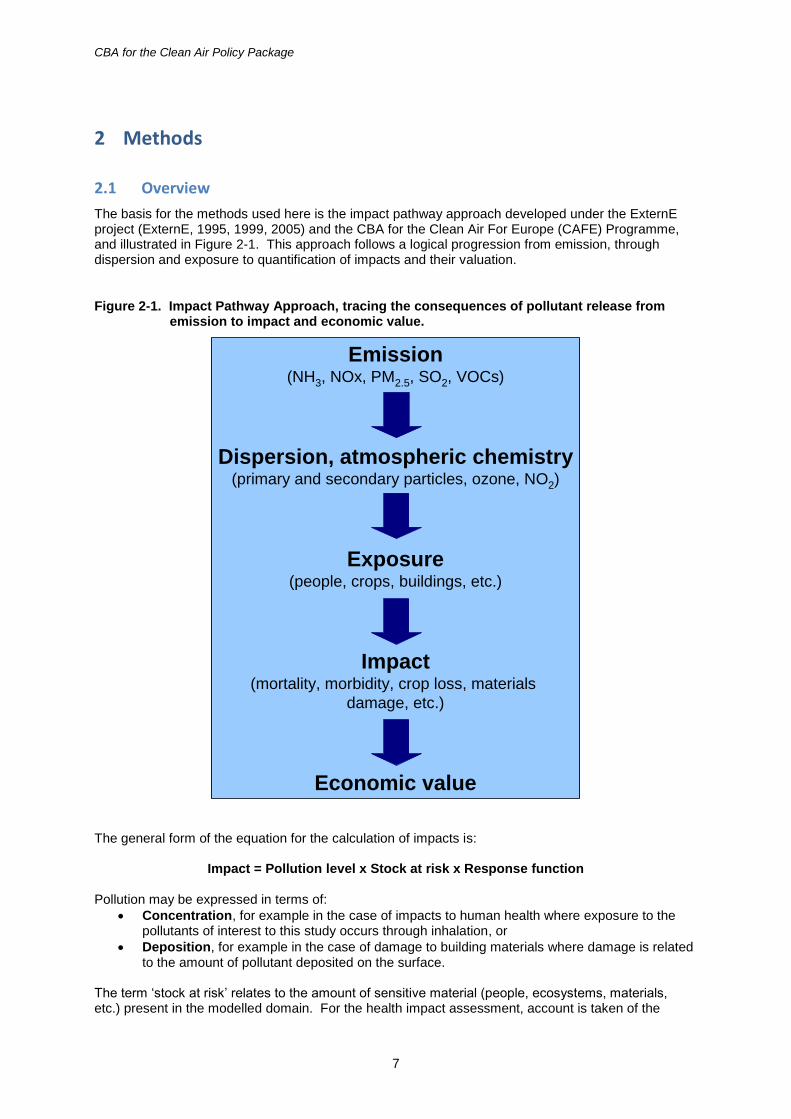
The basis for the methods used here is the impact pathway approach developed under the ExternE project (ExternE, 1995, 1999, 2005) and the CBA for the Clean Air For Europe (CAFE) Programme, and illustrated in Figure 2-1. This approach follows a logical progression from emission, through dispersion and exposure to quantification of impacts and their valuation.
Figure 2-1. Impact Pathway Approach, tracing the consequences of pollutant release from emission to impact and economic value.
Emission(NH3, NOx, PM2.5, SO2, VOCs)
Dispersion, atmospheric chemistry(primary and secondary particles, ozone, NO2)
Exposure(people, crops, buildings, etc.)
Impact(mortality, morbidity, crop loss, materials
damage, etc.)
Economic value
The general form of the equation for the calculation of impacts is:
Impact = Pollution level x Stock at risk x Response function Pollution may be expressed in terms of:
Concentration, for example in the case of impacts to human health where exposure to the pollutants of interest to this study occurs through inhalation, or
Deposition, for example in the case of damage to building materials where damage is related to the amount of pollutant deposited on the surface.
The term ‘stock at risk’ relates to the amount of sensitive material (people, ecosystems, materials, etc.) present in the modelled domain. For the health impact assessment, account is taken of the
CBA for the Clean Air Policy Package
8
distribution of population and of effects on demographics within the population, such as children, the elderly, or those of working age. Incidence and prevalence rates are used to modify the stock at risk for each type of impact quantified. Improved data availability has enabled this report to use country-specific rate data to a much greater degree than before.
2.2 Background to the methods for benefits assessment
The methods used by Holland et al (1999) and Holland and King (1998) for CBA of the original Gothenburg Protocol and EU NEC Directive were developed under the European Commission-funded ExternE (Externalities of Energy) Project during the 1990s. Whilst that work had been extensively reviewed during its development it was considered appropriate for the EU’s CAFE Programme to conduct a thorough review of the methods, to consult widely with stakeholders and to subject the methodology to a formal, independent and international peer review. This is documented as follows:
Methodology Volume 1: Overview of Methodology (Holland et al, 2005a)
Methodology Volume 2: Health Impact Assessment (Hurley et al, 2005)
Methodology Volume 3: Uncertainty in the CAFE-CBA (Holland, 2005b)
Peer review: Krupnick et al (2005) The methods developed under CAFE remain broadly applicable now, though some changes were made for the Gothenburg Protocol analysis (Holland et al, 2011). The most recent full account of the benefits assessment methods was provided for the EC4MACS study (Holland et al, 2013b). That report includes conclusions from the REVIHAAP project regarding updated mortality assessment for ozone and PM (WHO, 2013a). Subsequent work on the HRAPIE project (WHO, 2013b) provides further information on morbidity impacts (hospital admissions, incidence of bronchitis, lost work days, etc.), and has been used here. Other ongoing developments on ecological impact assessment, for example under the EC funded ECLAIRE Project are not sufficiently advanced for inclusion in the methods adopted here at this time. Comments received from stakeholders were noted (see Appendix 1). Relative to the analysis performed for the CAFE Programme in 2005 there have been a number of refinements to the dispersion modelling carried out by EMEP:
Use of a finer geographic resolution
Use of updated transfer matrices
The inclusion of fine secondary organic aerosol
The inclusion of a portion (27%) of what was earlier described as ‘coarse nitrate aerosol’ in estimated concentrations of PM2.5.
2.3 Health impact assessment
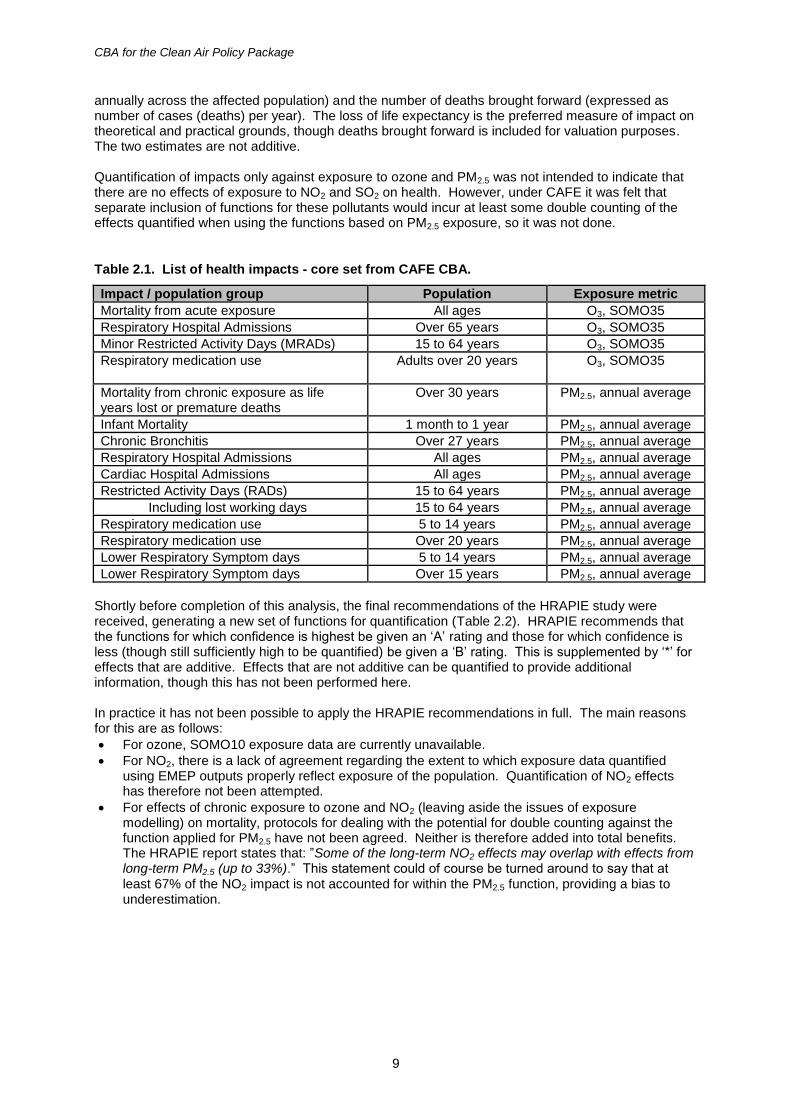
For the earliest analysis performed to inform review of the Thematic Strategy the health response functions adopted were those used in the earlier CAFE CBA work (Hurley et al, 2005). These are listed in Table 2.1, with details of the population considered for each effect. For the CAFE CBA two sets of response functions were identified, those for which evidence was considered most robust were grouped as the ‘core’ set whilst those for which quantification was considered less robust formed a ‘sensitivity’ set. In practice, the sensitivity functions were seldom used; although they extended the list of effects for quantification quite significantly, their contribution to total damage was small. In any case, the question of whether or not to include the sensitivity functions becomes insignificant when compared to other uncertainties, principally those associated with mortality valuation and the relative harm linked to different types of particle, and they were therefore not applied in analysis to support review of the Thematic Strategy. In line with WHO advice, all particles, irrespective of source2 and chemical composition, were considered equally harmful. Table 2.1 notes that the effect of chronic exposure to PM2.5 on mortality can be expressed in two ways, in terms of the loss of life expectancy (expressed as the total number of years of life lost [YOLL]
2 This excludes particles from natural sources as they are not included in the modelling, as they are not controllable using the measures considered in the setting of emission ceilings.
CBA for the Clean Air Policy Package
9
annually across the affected population) and the number of deaths brought forward (expressed as number of cases (deaths) per year). The loss of life expectancy is the preferred measure of impact on theoretical and practical grounds, though deaths brought forward is included for valuation purposes. The two estimates are not additive. Quantification of impacts only against exposure to ozone and PM2.5 was not intended to indicate that there are no effects of exposure to NO2 and SO2 on health. However, under CAFE it was felt that separate inclusion of functions for these pollutants would incur at least some double counting of the effects quantified when using the functions based on PM2.5 exposure, so it was not done.
Table 2.1. List of health impacts - core set from CAFE CBA.
Impact / population group Population Exposure metric
Mortality from acute exposure All ages O3, SOMO35
Respiratory Hospital Admissions Over 65 years O3, SOMO35
Minor Restricted Activity Days (MRADs) 15 to 64 years O3, SOMO35
Respiratory medication use Adults over 20 years
O3, SOMO35
Mortality from chronic exposure as life years lost or premature deaths
Over 30 years PM2.5, annual average
Infant Mortality 1 month to 1 year PM2.5, annual average
Chronic Bronchitis Over 27 years PM2.5, annual average
Respiratory Hospital Admissions All ages PM2.5, annual average
Cardiac Hospital Admissions All ages PM2.5, annual average
Restricted Activity Days (RADs) 15 to 64 years PM2.5, annual average
Including lost working days
15 to 64 years PM2.5, annual average
Respiratory medication use 5 to 14 years PM2.5, annual average
Respiratory medication use Over 20 years PM2.5, annual average
Lower Respiratory Symptom days 5 to 14 years PM2.5, annual average
Lower Respiratory Symptom days Over 15 years PM2.5, annual average
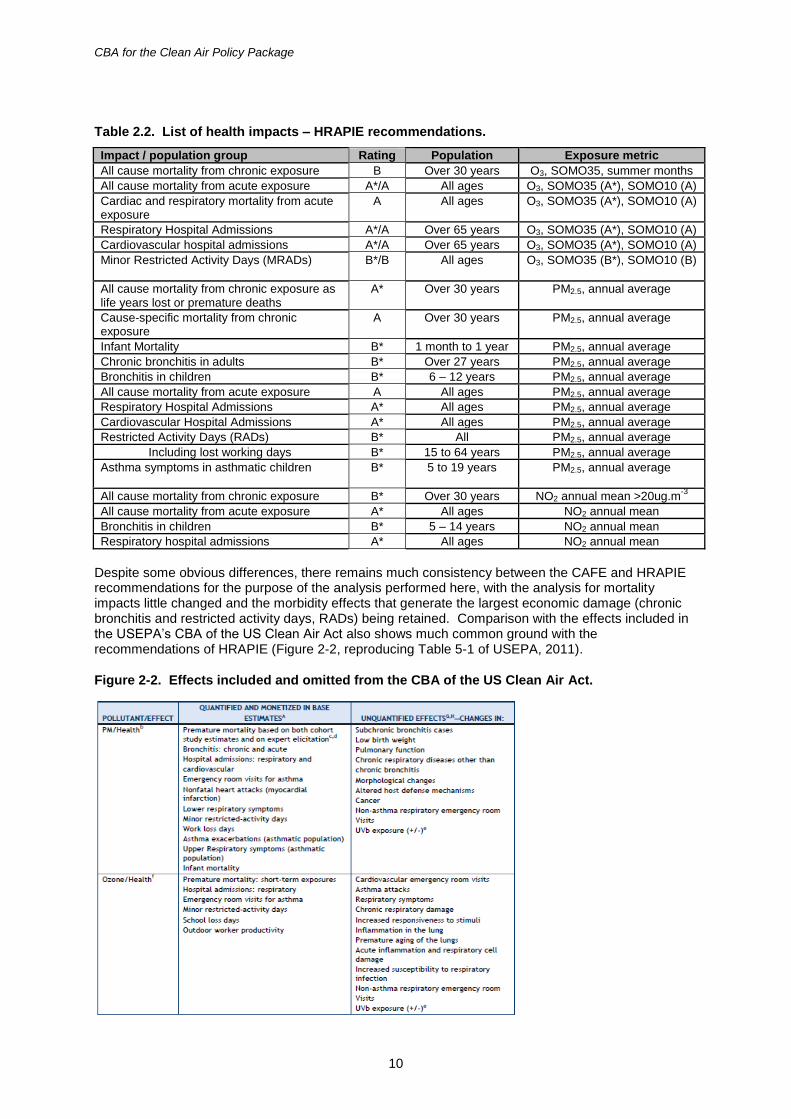
Shortly before completion of this analysis, the final recommendations of the HRAPIE study were received, generating a new set of functions for quantification (Table 2.2). HRAPIE recommends that the functions for which confidence is highest be given an ‘A’ rating and those for which confidence is less (though still sufficiently high to be quantified) be given a ‘B’ rating. This is supplemented by ‘*’ for effects that are additive. Effects that are not additive can be quantified to provide additional information, though this has not been performed here. In practice it has not been possible to apply the HRAPIE recommendations in full. The main reasons for this are as follows:
For ozone, SOMO10 exposure data are currently unavailable.
For NO2, there is a lack of agreement regarding the extent to which exposure data quantified using EMEP outputs properly reflect exposure of the population. Quantification of NO2 effects has therefore not been attempted.
For effects of chronic exposure to ozone and NO2 (leaving aside the issues of exposure modelling) on mortality, protocols for dealing with the potential for double counting against the function applied for PM2.5 have not been agreed. Neither is therefore added into total benefits. The HRAPIE report states that: ”Some of the long-term NO2 effects may overlap with effects from long-term PM2.5 (up to 33%).” This statement could of course be turned around to say that at least 67% of the NO2 impact is not accounted for within the PM2.5 function, providing a bias to underestimation.
CBA for the Clean Air Policy Package
10
Table 2.2. List of health impacts – HRAPIE recommendations.
Impact / population group Rating Population Exposure metric
All cause mortality from chronic exposure B Over 30 years O3, SOMO35, summer months
All cause mortality from acute exposure A*/A All ages O3, SOMO35 (A*), SOMO10 (A)
Cardiac and respiratory mortality from acute exposure
A All ages O3, SOMO35 (A*), SOMO10 (A)
Respiratory Hospital Admissions A*/A Over 65 years O3, SOMO35 (A*), SOMO10 (A)
Cardiovascular hospital admissions A*/A Over 65 years O3, SOMO35 (A*), SOMO10 (A)
Minor Restricted Activity Days (MRADs) B*/B All ages
O3, SOMO35 (B*), SOMO10 (B)
All cause mortality from chronic exposure as life years lost or premature deaths
A* Over 30 years PM2.5, annual average
Cause-specific mortality from chronic exposure
A Over 30 years PM2.5, annual average
Infant Mortality B* 1 month to 1 year PM2.5, annual average
Chronic bronchitis in adults B* Over 27 years PM2.5, annual average
Bronchitis in children B* 6 – 12 years PM2.5, annual average
All cause mortality from acute exposure A All ages PM2.5, annual average
Respiratory Hospital Admissions A* All ages PM2.5, annual average
Cardiovascular Hospital Admissions A* All ages PM2.5, annual average
Restricted Activity Days (RADs) B* All PM2.5, annual average
Including lost working days
B* 15 to 64 years PM2.5, annual average
Asthma symptoms in asthmatic children B*
5 to 19 years PM2.5, annual average
All cause mortality from chronic exposure B* Over 30 years NO2 annual mean >20ug.m-3
All cause mortality from acute exposure A* All ages NO2 annual mean Bronchitis in children B* 5 – 14 years NO2 annual mean Respiratory hospital admissions A* All ages NO2 annual mean
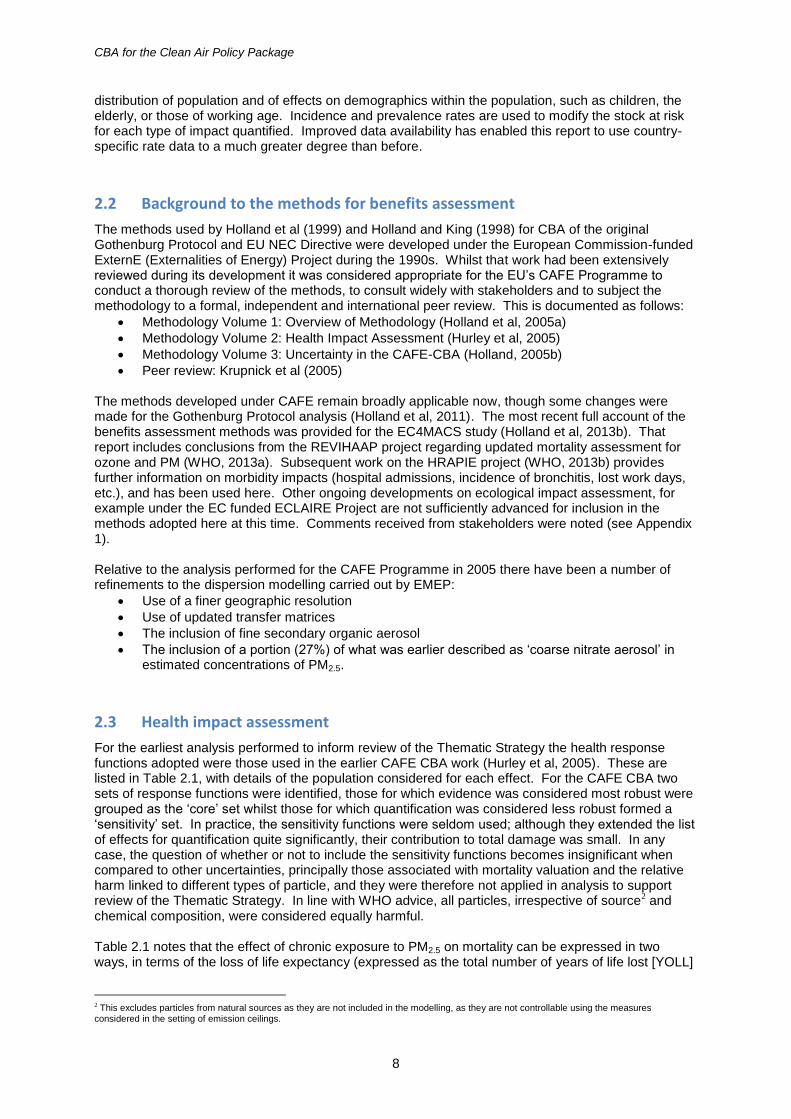
Despite some obvious differences, there remains much consistency between the CAFE and HRAPIE recommendations for the purpose of the analysis performed here, with the analysis for mortality impacts little changed and the morbidity effects that generate the largest economic damage (chronic bronchitis and restricted activity days, RADs) being retained. Comparison with the effects included in the USEPA’s CBA of the US Clean Air Act also shows much common ground with the recommendations of HRAPIE (Figure 2-2, reproducing Table 5-1 of USEPA, 2011).
Figure 2-2. Effects included and omitted from the CBA of the US Clean Air Act.
CBA for the Clean Air Policy Package
11
This Table suggests that the HRAPIE recommendations could be seen as cautious in some areas, for example through omission of ozone effects on school attendance and outdoor productivity. It also indicates that there is evidence for an association between air pollution and numerous unquantified health endpoints.
2.4 Valuation of health impacts
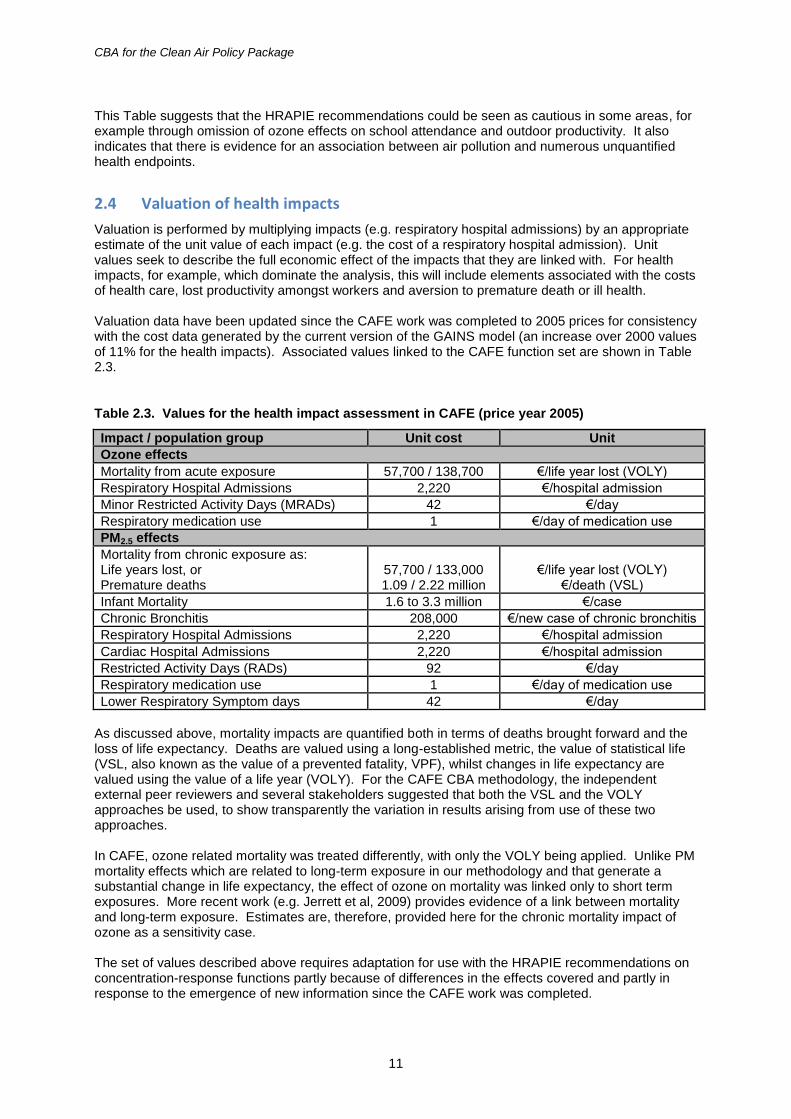
Valuation is performed by multiplying impacts (e.g. respiratory hospital admissions) by an appropriate estimate of the unit value of each impact (e.g. the cost of a respiratory hospital admission). Unit values seek to describe the full economic effect of the impacts that they are linked with. For health impacts, for example, which dominate the analysis, this will include elements associated with the costs of health care, lost productivity amongst workers and aversion to premature death or ill health. Valuation data have been updated since the CAFE work was completed to 2005 prices for consistency with the cost data generated by the current version of the GAINS model (an increase over 2000 values of 11% for the health impacts). Associated values linked to the CAFE function set are shown in Table 2.3.
Table 2.3. Values for the health impact assessment in CAFE (price year 2005)
Impact / population group Unit cost Unit
Ozone effects
Mortality from acute exposure 57,700 / 138,700 €/life year lost (VOLY)
Respiratory Hospital Admissions 2,220 €/hospital admission
Minor Restricted Activity Days (MRADs) 42 €/day
Respiratory medication use 1 €/day of medication use
PM2.5 effects
Mortality from chronic exposure as: Life years lost, or Premature deaths
57,700 / 133,000 1.09 / 2.22 million
€/life year lost (VOLY)
€/death (VSL)
Infant Mortality 1.6 to 3.3 million €/case
Chronic Bronchitis 208,000 €/new case of chronic bronchitis
Respiratory Hospital Admissions 2,220 €/hospital admission
Cardiac Hospital Admissions 2,220 €/hospital admission
Restricted Activity Days (RADs) 92 €/day
Respiratory medication use 1 €/day of medication use
Lower Respiratory Symptom days 42 €/day
As discussed above, mortality impacts are quantified both in terms of deaths brought forward and the loss of life expectancy. Deaths are valued using a long-established metric, the value of statistical life (VSL, also known as the value of a prevented fatality, VPF), whilst changes in life expectancy are valued using the value of a life year (VOLY). For the CAFE CBA methodology, the independent external peer reviewers and several stakeholders suggested that both the VSL and the VOLY approaches be used, to show transparently the variation in results arising from use of these two approaches. In CAFE, ozone related mortality was treated differently, with only the VOLY being applied. Unlike PM mortality effects which are related to long-term exposure in our methodology and that generate a substantial change in life expectancy, the effect of ozone on mortality was linked only to short term exposures. More recent work (e.g. Jerrett et al, 2009) provides evidence of a link between mortality and long-term exposure. Estimates are, therefore, provided here for the chronic mortality impact of ozone as a sensitivity case. The set of values described above requires adaptation for use with the HRAPIE recommendations on concentration-response functions partly because of differences in the effects covered and partly in response to the emergence of new information since the CAFE work was completed.
CBA for the Clean Air Policy Package
12
Table 2.4. Updated values for the health impact assessment (price year 2005)
Impact / population group Unit cost Unit
Ozone effects
Mortality from chronic exposure as: Life years lost, or Premature deaths
57,700 / 133,000 1.09 / 2.22 million
€/life year lost (VOLY)
€/death (VSL)
Mortality from acute exposure 57,700 / 138,700 €/life year lost (VOLY)
Respiratory Hospital Admissions 2,220 €/hospital admission
Cardiovascular Hospital Admissions 2,220 €/hospital admission
Minor Restricted Activity Days (MRADs)
42 €/day
PM2.5 effects
Mortality from chronic exposure as: Life years lost, or Premature deaths (all-cause and cause-specific mortality)
57,700 / 133,000 1.09 / 2.22 million
€/life year lost (VOLY)
€/death (VSL)
Mortality from acute exposure 57,700 / 138,700 €/life year lost (VOLY)
Infant Mortality 1.6 to 3.3 million €/case
Chronic Bronchitis in adults 53,600 €/new case of chronic bronchitis
Bronchitis in children 588 €/case
Respiratory Hospital Admissions 2,220 €/hospital admission
Cardiac Hospital Admissions 2,220 €/hospital admission
Restricted Activity Days (RADs) 92 €/day
Work loss days 130 €/day
Asthma symptoms, asthmatic children
42 €/day
NO2 effects (though not quantified in this report)
Mortality from chronic exposure as: Life years lost, or Premature deaths
57,700 / 133,000 1.09 / 2.22 million
€/life year lost (VOLY)
€/death (VSL)
Mortality from acute exposure 57,700 / 138,700 €/life year lost (VOLY)
Bronchitis in children 588 €/case
Respiratory Hospital Admissions
2,220 €/hospital admission
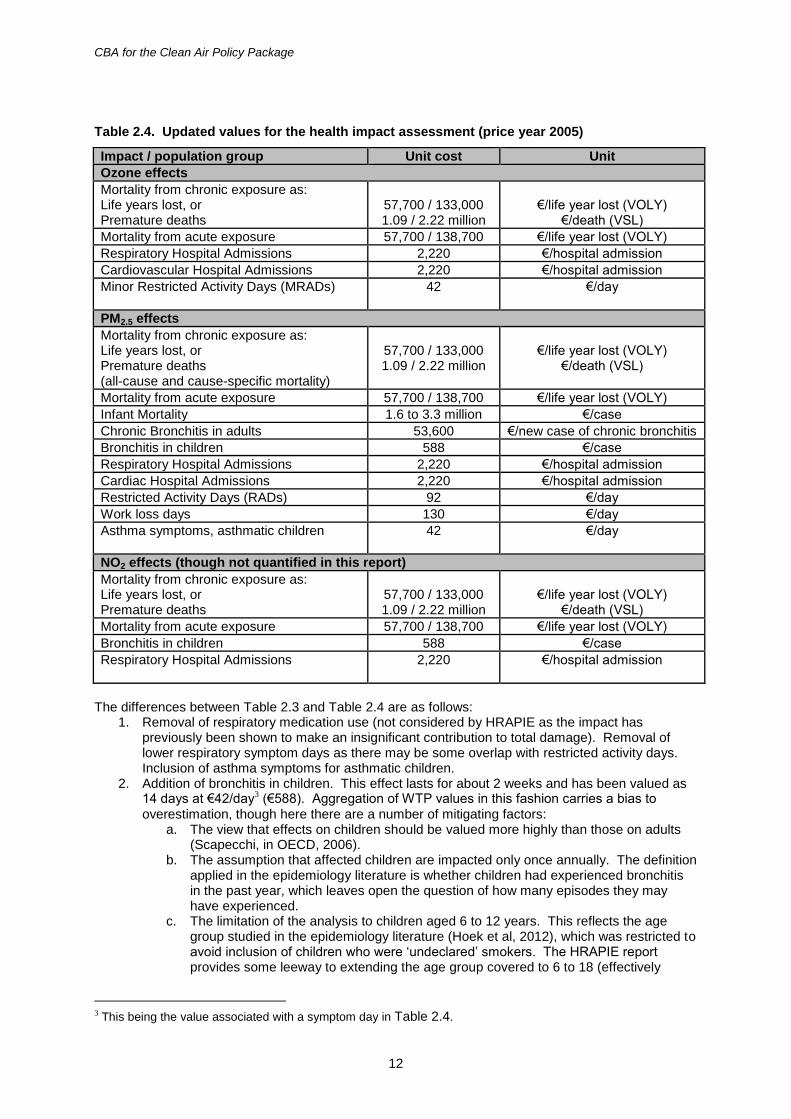
The differences between Table 2.3 and Table 2.4 are as follows:
1. Removal of respiratory medication use (not considered by HRAPIE as the impact has previously been shown to make an insignificant contribution to total damage). Removal of lower respiratory symptom days as there may be some overlap with restricted activity days. Inclusion of asthma symptoms for asthmatic children.
2. Addition of bronchitis in children. This effect lasts for about 2 weeks and has been valued as 14 days at €42/day3 (€588). Aggregation of WTP values in this fashion carries a bias to
overestimation, though here there are a number of mitigating factors: a. The view that effects on children should be valued more highly than those on adults
(Scapecchi, in OECD, 2006). b. The assumption that affected children are impacted only once annually. The definition
applied in the epidemiology literature is whether children had experienced bronchitis in the past year, which leaves open the question of how many episodes they may have experienced.
c. The limitation of the analysis to children aged 6 to 12 years. This reflects the age group studied in the epidemiology literature (Hoek et al, 2012), which was restricted to avoid inclusion of children who were ‘undeclared’ smokers. The HRAPIE report provides some leeway to extending the age group covered to 6 to 18 (effectively
3 This being the value associated with a symptom day in Table 2.4.
CBA for the Clean Air Policy Package
13
doubling the population at risk). Discussion with the HRAPIE team indicated that sensitivity may persist to around age 22, further extending the population at risk.
d. The likelihood that parents would need to take time off work to care for children. Being linked to long-term exposure, such effects would not be included in the assessment of work days lost.
e. The value obtained is broadly consistent with the $400 WTP for children suffering bronchitis for one week, measured by Dickie and Ulery (2001).
Overall, therefore, it is considered that the approach taken for valuation of this endpoint is a reasonable compromise.
3. The value for chronic bronchitis in adults has been reduced to €53,600, linked to the central value recommended for chronic bronchitis from the literature review in the HEIMTSA study (Hunt et al, 2011: €60,000 in 2010 prices). The decision to reduce the valuation is based on discussion with the HRAPIE team concerning the interpretation of ‘chronic bronchitis’. It is noted that the valuation applied by USEPA (2011, Table 5.4) is considerably higher, in the region of $450,000 (also considerably higher than the CAFE estimate of €208,000). The figure adopted is also towards the lower end of the range of $9,000 to $340,000 described by Abt Associates (2012, Table I-3) for use in the US BenMap model.
4. The valuation of work loss days was bound up with the valuation of restricted activity days in the CAFE work, with a value of €94/day (at 2005 rates) being applied, based on assessment of the costs of absenteeism to employers by the Confederation of British Industry (CBI, 1998). This value included only direct costs to employers, covering sick pay, lost output and provision of cover through temporary staff or overtime. It did not include indirect costs related to lower customer satisfaction and poorer quality of products or services leading to a loss of future business, which were estimated to be roughly twice as high as direct costs, though subject to higher uncertainty. A revised valuation here takes account of more recent publications from CBI covering the years 2010 (CBI, 2011) and 2012 (CBI, 2013) to provide a value of €130/day for the EU in 2005 prices, though this still excludes the indirect costs.
Databases from WHO provide further information on the time spent in hospital and on the ‘hotel’ costs of hospitalisation (‘hotel’ costs, not including the costs of specific treatments). These suggest that the costing adopted in CAFE and retained here underestimates costs. In CAFE, it was assumed that the average time spent in hospital following admission for respiratory or cardiac illness would be 3 days. WHO’s Hospital Morbidity Database instead indicates 7.3 days for respiratory admissions and 8.6 days for cardiovascular admissions as an average for EU countries. WHO’s CHOICE database then indicates that that the ‘hotel’ costs of hospitalisation are on average in the region of €280/day for the EU. Put together these data suggest that total ‘hotel’ costs per hospital admission are around €2,240, slightly greater than the figure shown in Table 2.4, but lacking treatment costs and the WTP not to require hospitalisation and the pain and suffering that goes with it. The CAFE values are representative of willingness to pay in EU Member States. Being based in willingness to pay, they are income dependent. For the CBA of the Gothenburg Protocol both estimated average EU-values and average values for the wider UNECE region (adjusted using population weighted PPP4-adjusted GDP/capita) were used to demonstrate sensitivity to assumptions
made at this point. The difference between the original EU valuations and the UNECE-Europe equivalent was shown to be small; the latter being lower by 18%. Here, however, only EU-averaged valuations are applied, given that the scenarios are focused on emission reductions within the EU. The results of the benefits analysis used by Amann et al (2013) to assess the point at which marginal costs and benefits are equal considered only impacts within the EU28. Consideration is given in the discussion at the end of this report to the likely effects of applying the VOLY derived by Desaigues et al (2011) and to the major review by OECD on the use of VSL to inform environmental policy making. A comparison of results based on CAFE and HRAPIE functions is provided in Appendix 2. It is concluded that differences in monetised damage estimates are small, slightly lower (around 5%) for HRAPIE than CAFE, but lacking quantification of effects of NO2.
4 Purchasing power parity
CBA for the Clean Air Policy Package
14
2.5 Non health impacts
Detailed quantification of effects of the policy scenarios on ozone damage to crops and acid damage to buildings requires additional pollutant metrics to those made available for this analysis. A simpler approach has therefore been taken, details of which were given by Holland et al (2011). It is noted that there are several limitations of this approach for quantifying non-health impacts:
It only permits quantification of crop and ‘utilitarian’ material damage.
It does not fully quantify effects on either utilitarian buildings or crops. For example, no account is taken of changes in the productivity of grassland that may impact production of livestock and associated goods, and no account is taken of the effects of particle emissions on building soiling.
It only accounts for effects within the EU.
It is based on emission scenarios for 2010, which may introduce significant error, particularly for ozone impacts due to their non-linearities and dependence on the overall pollution climate.
Damage to other non-health receptors, notably ecosystems and cultural heritage, has not been quantified.
CBA for the Clean Air Policy Package
15
3 Health benefits
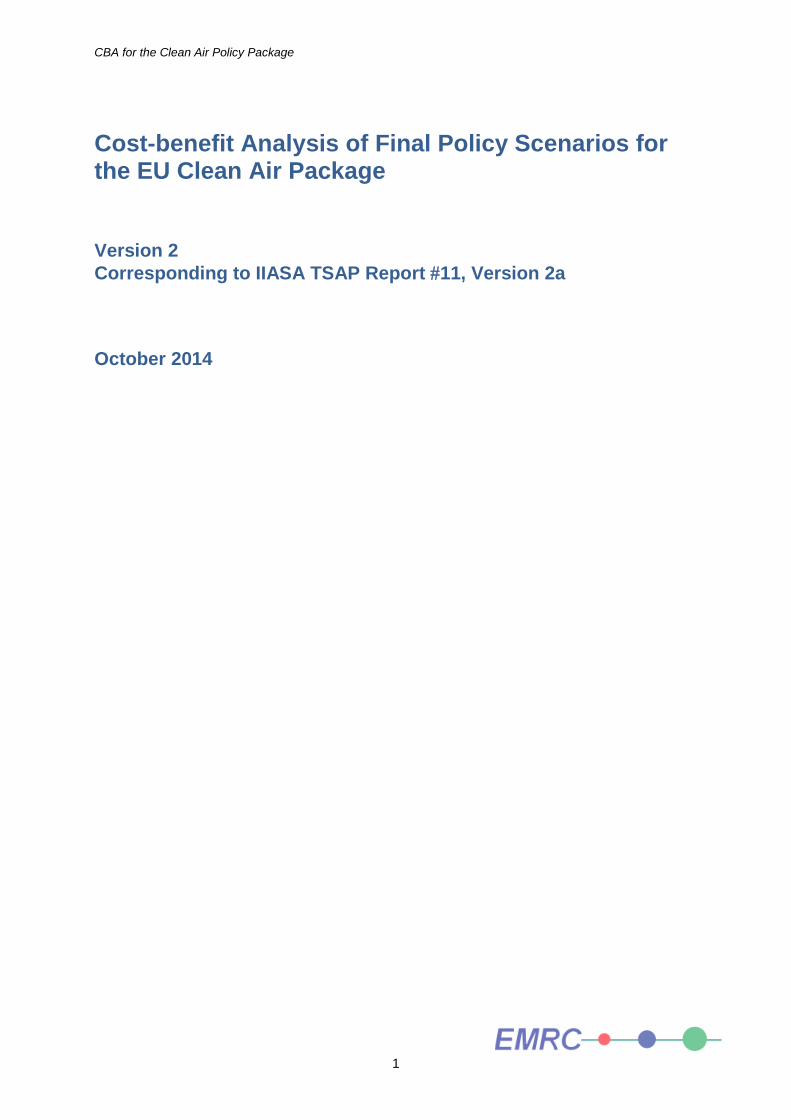
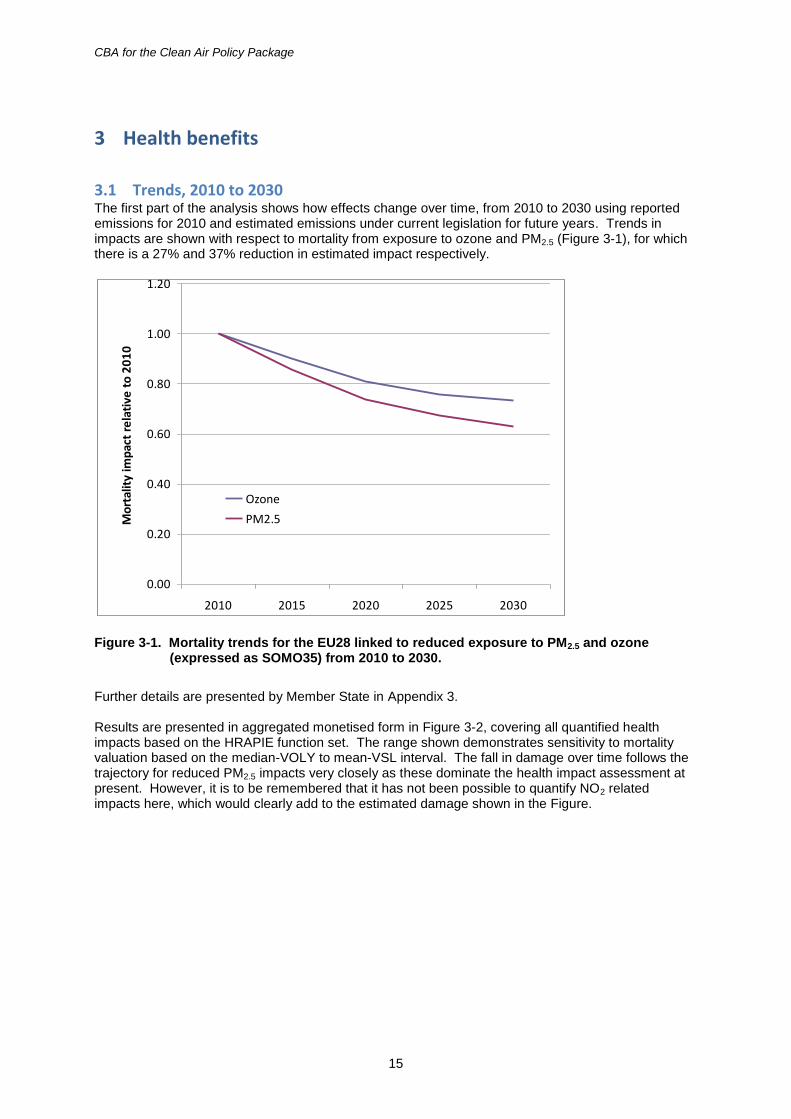
3.1 Trends, 2010 to 2030 The first part of the analysis shows how effects change over time, from 2010 to 2030 using reported emissions for 2010 and estimated emissions under current legislation for future years. Trends in impacts are shown with respect to mortality from exposure to ozone and PM2.5 (Figure 3-1), for which there is a 27% and 37% reduction in estimated impact respectively.
0.00
0.20
0.40
0.60
0.80
1.00
1.20
2010 2015 2020 2025 2030
Mo
rtal
ity
imp
act
rela
tive
to
20
10
Ozone
PM2.5
Figure 3-1. Mortality trends for the EU28 linked to reduced exposure to PM2.5 and ozone (expressed as SOMO35) from 2010 to 2030.
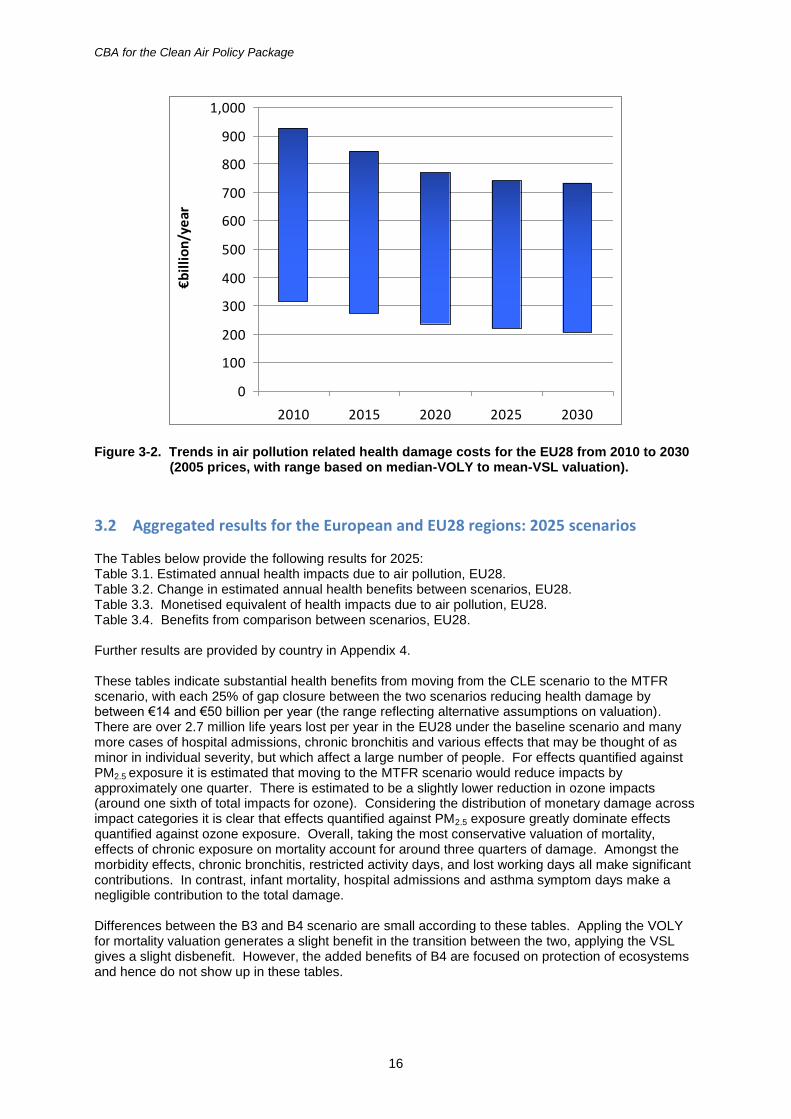
Further details are presented by Member State in Appendix 3. Results are presented in aggregated monetised form in Figure 3-2, covering all quantified health impacts based on the HRAPIE function set. The range shown demonstrates sensitivity to mortality valuation based on the median-VOLY to mean-VSL interval. The fall in damage over time follows the trajectory for reduced PM2.5 impacts very closely as these dominate the health impact assessment at present. However, it is to be remembered that it has not been possible to quantify NO2 related impacts here, which would clearly add to the estimated damage shown in the Figure.
CBA for the Clean Air Policy Package
16
0
100
200
300
400
500
600
700
800
900
1,000
2010 2015 2020 2025 2030
€billion/year
Figure 3-2. Trends in air pollution related health damage costs for the EU28 from 2010 to 2030 (2005 prices, with range based on median-VOLY to mean-VSL valuation).
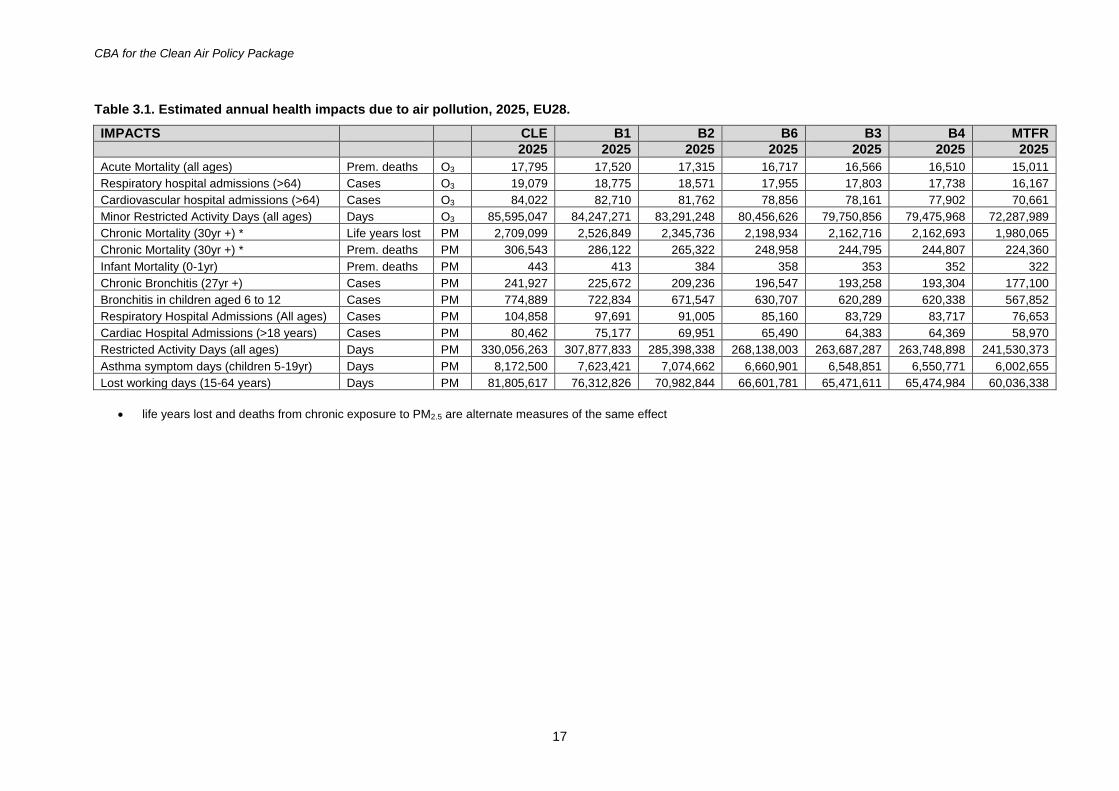
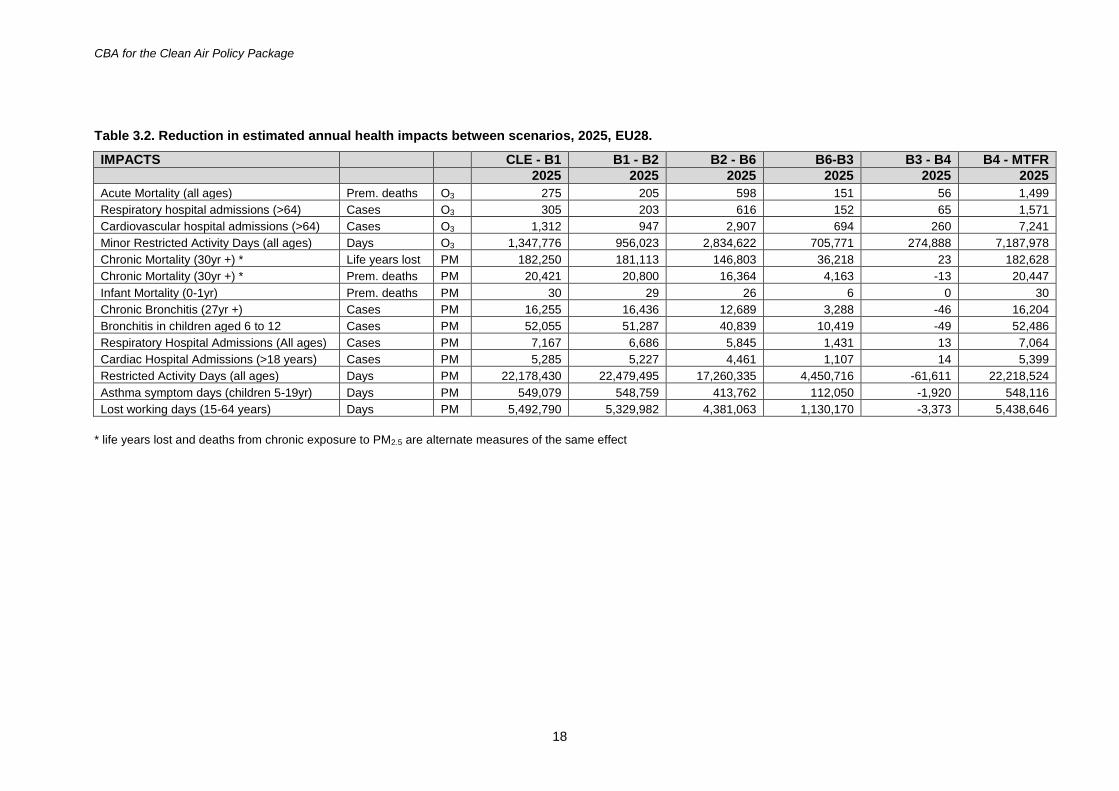
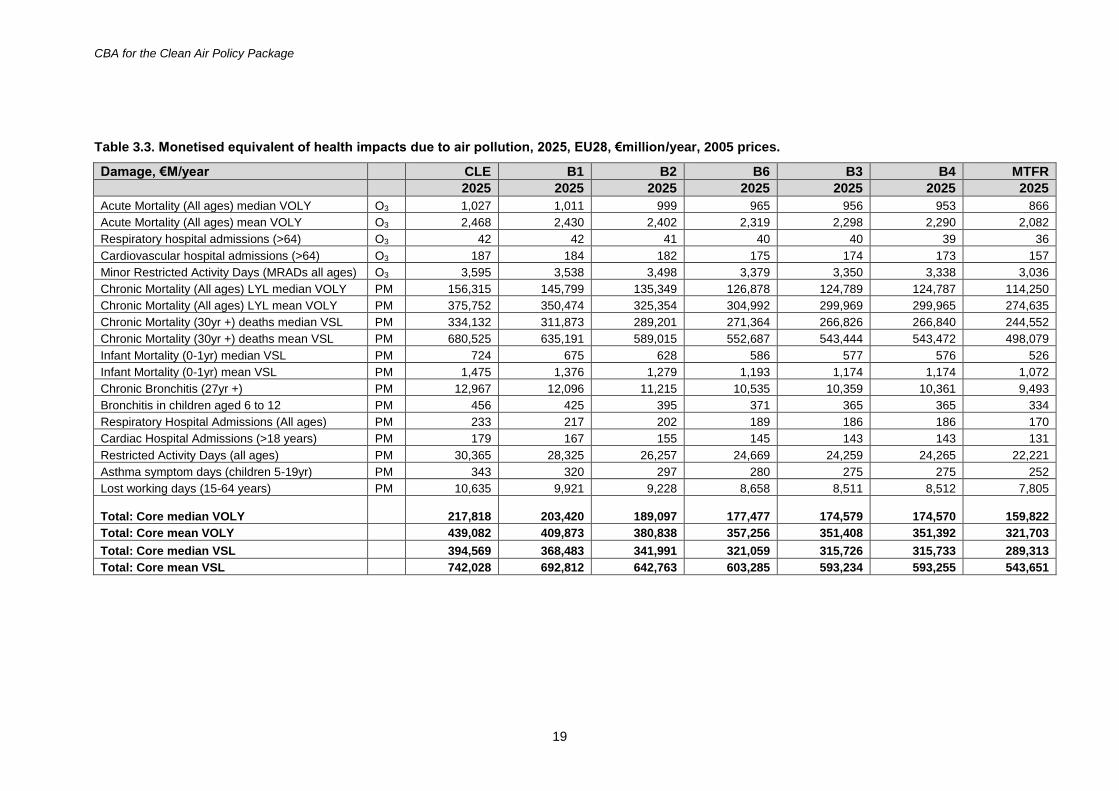
3.2 Aggregated results for the European and EU28 regions: 2025 scenarios The Tables below provide the following results for 2025: Table 3.1. Estimated annual health impacts due to air pollution, EU28. Table 3.2. Change in estimated annual health benefits between scenarios, EU28. Table 3.3. Monetised equivalent of health impacts due to air pollution, EU28. Table 3.4. Benefits from comparison between scenarios, EU28. Further results are provided by country in Appendix 4. These tables indicate substantial health benefits from moving from the CLE scenario to the MTFR scenario, with each 25% of gap closure between the two scenarios reducing health damage by between €14 and €50 billion per year (the range reflecting alternative assumptions on valuation). There are over 2.7 million life years lost per year in the EU28 under the baseline scenario and many more cases of hospital admissions, chronic bronchitis and various effects that may be thought of as minor in individual severity, but which affect a large number of people. For effects quantified against PM2.5 exposure it is estimated that moving to the MTFR scenario would reduce impacts by approximately one quarter. There is estimated to be a slightly lower reduction in ozone impacts (around one sixth of total impacts for ozone). Considering the distribution of monetary damage across impact categories it is clear that effects quantified against PM2.5 exposure greatly dominate effects quantified against ozone exposure. Overall, taking the most conservative valuation of mortality, effects of chronic exposure on mortality account for around three quarters of damage. Amongst the morbidity effects, chronic bronchitis, restricted activity days, and lost working days all make significant contributions. In contrast, infant mortality, hospital admissions and asthma symptom days make a negligible contribution to the total damage. Differences between the B3 and B4 scenario are small according to these tables. Appling the VOLY for mortality valuation generates a slight benefit in the transition between the two, applying the VSL gives a slight disbenefit. However, the added benefits of B4 are focused on protection of ecosystems and hence do not show up in these tables.
CBA for the Clean Air Policy Package
17
Table 3.1. Estimated annual health impacts due to air pollution, 2025, EU28.
IMPACTS CLE B1 B2 B6 B3 B4 MTFR
2025 2025 2025 2025 2025 2025 2025
Acute Mortality (all ages) Prem. deaths O3 17,795 17,520 17,315 16,717 16,566 16,510 15,011
Respiratory hospital admissions (>64) Cases O3 19,079 18,775 18,571 17,955 17,803 17,738 16,167
Cardiovascular hospital admissions (>64) Cases O3 84,022 82,710 81,762 78,856 78,161 77,902 70,661
Minor Restricted Activity Days (all ages) Days O3 85,595,047 84,247,271 83,291,248 80,456,626 79,750,856 79,475,968 72,287,989
Chronic Mortality (30yr +) * Life years lost PM 2,709,099 2,526,849 2,345,736 2,198,934 2,162,716 2,162,693 1,980,065
Chronic Mortality (30yr +) * Prem. deaths PM 306,543 286,122 265,322 248,958 244,795 244,807 224,360
Infant Mortality (0-1yr) Prem. deaths PM 443 413 384 358 353 352 322
Chronic Bronchitis (27yr +) Cases PM 241,927 225,672 209,236 196,547 193,258 193,304 177,100
Bronchitis in children aged 6 to 12 Cases PM 774,889 722,834 671,547 630,707 620,289 620,338 567,852
Respiratory Hospital Admissions (All ages) Cases PM 104,858 97,691 91,005 85,160 83,729 83,717 76,653
Cardiac Hospital Admissions (>18 years) Cases PM 80,462 75,177 69,951 65,490 64,383 64,369 58,970
Restricted Activity Days (all ages) Days PM 330,056,263 307,877,833 285,398,338 268,138,003 263,687,287 263,748,898 241,530,373
Asthma symptom days (children 5-19yr) Days PM 8,172,500 7,623,421 7,074,662 6,660,901 6,548,851 6,550,771 6,002,655
Lost working days (15-64 years) Days PM 81,805,617 76,312,826 70,982,844 66,601,781 65,471,611 65,474,984 60,036,338
life years lost and deaths from chronic exposure to PM2.5 are alternate measures of the same effect
CBA for the Clean Air Policy Package
18
Table 3.2. Reduction in estimated annual health impacts between scenarios, 2025, EU28.
IMPACTS CLE - B1 B1 - B2 B2 - B6 B6-B3 B3 - B4 B4 - MTFR
2025 2025 2025 2025 2025 2025
Acute Mortality (all ages) Prem. deaths O3 275 205 598 151 56 1,499
Respiratory hospital admissions (>64) Cases O3 305 203 616 152 65 1,571
Cardiovascular hospital admissions (>64) Cases O3 1,312 947 2,907 694 260 7,241
Minor Restricted Activity Days (all ages) Days O3 1,347,776 956,023 2,834,622 705,771 274,888 7,187,978
Chronic Mortality (30yr +) * Life years lost PM 182,250 181,113 146,803 36,218 23 182,628
Chronic Mortality (30yr +) * Prem. deaths PM 20,421 20,800 16,364 4,163 -13 20,447
Infant Mortality (0-1yr) Prem. deaths PM 30 29 26 6 0 30
Chronic Bronchitis (27yr +) Cases PM 16,255 16,436 12,689 3,288 -46 16,204
Bronchitis in children aged 6 to 12 Cases PM 52,055 51,287 40,839 10,419 -49 52,486
Respiratory Hospital Admissions (All ages) Cases PM 7,167 6,686 5,845 1,431 13 7,064
Cardiac Hospital Admissions (>18 years) Cases PM 5,285 5,227 4,461 1,107 14 5,399
Restricted Activity Days (all ages) Days PM 22,178,430 22,479,495 17,260,335 4,450,716 -61,611 22,218,524
Asthma symptom days (children 5-19yr) Days PM 549,079 548,759 413,762 112,050 -1,920 548,116
Lost working days (15-64 years) Days PM 5,492,790 5,329,982 4,381,063 1,130,170 -3,373 5,438,646
* life years lost and deaths from chronic exposure to PM2.5 are alternate measures of the same effect
CBA for the Clean Air Policy Package
19
Table 3.3. Monetised equivalent of health impacts due to air pollution, 2025, EU28, €million/year, 2005 prices.
Damage, €M/year CLE B1 B2 B6 B3 B4 MTFR
2025 2025 2025 2025 2025 2025 2025
Acute Mortality (All ages) median VOLY O3 1,027 1,011 999 965 956 953 866
Acute Mortality (All ages) mean VOLY O3 2,468 2,430 2,402 2,319 2,298 2,290 2,082
Respiratory hospital admissions (>64) O3 42 42 41 40 40 39 36
Cardiovascular hospital admissions (>64) O3 187 184 182 175 174 173 157
Minor Restricted Activity Days (MRADs all ages) O3 3,595 3,538 3,498 3,379 3,350 3,338 3,036
Chronic Mortality (All ages) LYL median VOLY PM 156,315 145,799 135,349 126,878 124,789 124,787 114,250
Chronic Mortality (All ages) LYL mean VOLY PM 375,752 350,474 325,354 304,992 299,969 299,965 274,635
Chronic Mortality (30yr +) deaths median VSL PM 334,132 311,873 289,201 271,364 266,826 266,840 244,552
Chronic Mortality (30yr +) deaths mean VSL PM 680,525 635,191 589,015 552,687 543,444 543,472 498,079
Infant Mortality (0-1yr) median VSL PM 724 675 628 586 577 576 526
Infant Mortality (0-1yr) mean VSL PM 1,475 1,376 1,279 1,193 1,174 1,174 1,072
Chronic Bronchitis (27yr +) PM 12,967 12,096 11,215 10,535 10,359 10,361 9,493
Bronchitis in children aged 6 to 12 PM 456 425 395 371 365 365 334
Respiratory Hospital Admissions (All ages) PM 233 217 202 189 186 186 170
Cardiac Hospital Admissions (>18 years) PM 179 167 155 145 143 143 131
Restricted Activity Days (all ages) PM 30,365 28,325 26,257 24,669 24,259 24,265 22,221
Asthma symptom days (children 5-19yr) PM 343 320 297 280 275 275 252
Lost working days (15-64 years) PM 10,635 9,921 9,228 8,658 8,511 8,512 7,805
Total: Core median VOLY 217,818 203,420 189,097 177,477 174,579 174,570 159,822
Total: Core mean VOLY 439,082 409,873 380,838 357,256 351,408 351,392 321,703
Total: Core median VSL 394,569 368,483 341,991 321,059 315,726 315,733 289,313
Total: Core mean VSL 742,028 692,812 642,763 603,285 593,234 593,255 543,651
CBA for the Clean Air Policy Package
20
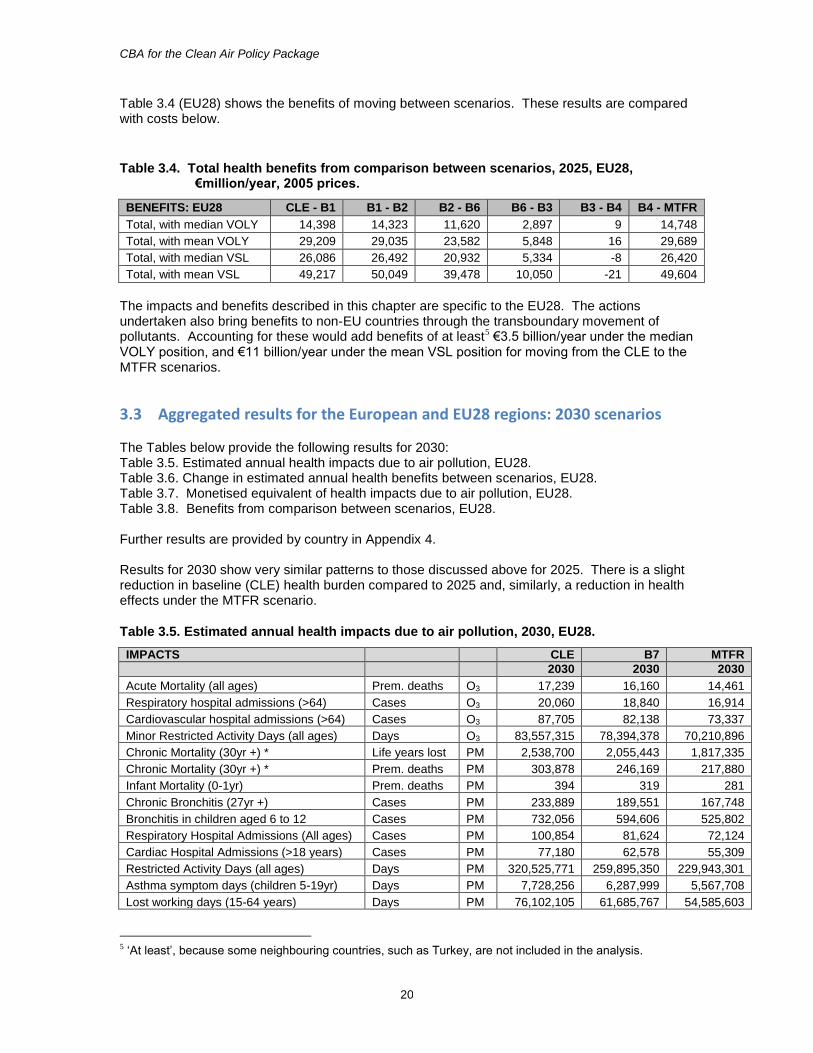
Table 3.4 (EU28) shows the benefits of moving between scenarios. These results are compared with costs below.
Table 3.4. Total health benefits from comparison between scenarios, 2025, EU28, €million/year, 2005 prices.
BENEFITS: EU28 CLE - B1 B1 - B2 B2 - B6 B6 - B3 B3 - B4 B4 - MTFR
Total, with median VOLY 14,398 14,323 11,620 2,897 9 14,748
Total, with mean VOLY 29,209 29,035 23,582 5,848 16 29,689
Total, with median VSL 26,086 26,492 20,932 5,334 -8 26,420
Total, with mean VSL 49,217 50,049 39,478 10,050 -21 49,604
The impacts and benefits described in this chapter are specific to the EU28. The actions undertaken also bring benefits to non-EU countries through the transboundary movement of pollutants. Accounting for these would add benefits of at least5 €3.5 billion/year under the median VOLY position, and €11 billion/year under the mean VSL position for moving from the CLE to the MTFR scenarios.
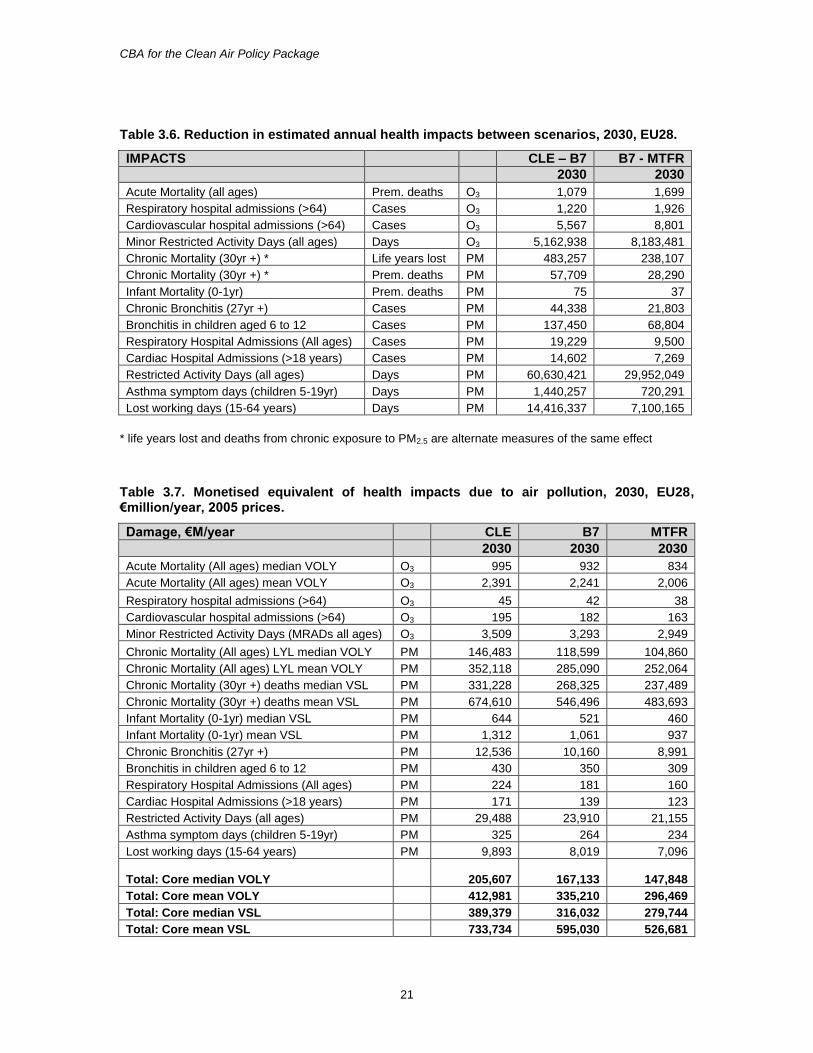
3.3 Aggregated results for the European and EU28 regions: 2030 scenarios The Tables below provide the following results for 2030: Table 3.5. Estimated annual health impacts due to air pollution, EU28. Table 3.6. Change in estimated annual health benefits between scenarios, EU28. Table 3.7. Monetised equivalent of health impacts due to air pollution, EU28. Table 3.8. Benefits from comparison between scenarios, EU28. Further results are provided by country in Appendix 4. Results for 2030 show very similar patterns to those discussed above for 2025. There is a slight reduction in baseline (CLE) health burden compared to 2025 and, similarly, a reduction in health effects under the MTFR scenario.
Table 3.5. Estimated annual health impacts due to air pollution, 2030, EU28.
IMPACTS CLE B7 MTFR
2030 2030 2030
Acute Mortality (all ages) Prem. deaths O3 17,239 16,160 14,461
Respiratory hospital admissions (>64) Cases O3 20,060 18,840 16,914
Cardiovascular hospital admissions (>64) Cases O3 87,705 82,138 73,337
Minor Restricted Activity Days (all ages) Days O3 83,557,315 78,394,378 70,210,896
Chronic Mortality (30yr +) * Life years lost PM 2,538,700 2,055,443 1,817,335
Chronic Mortality (30yr +) * Prem. deaths PM 303,878 246,169 217,880
Infant Mortality (0-1yr) Prem. deaths PM 394 319 281
Chronic Bronchitis (27yr +) Cases PM 233,889 189,551 167,748
Bronchitis in children aged 6 to 12 Cases PM 732,056 594,606 525,802
Respiratory Hospital Admissions (All ages) Cases PM 100,854 81,624 72,124
Cardiac Hospital Admissions (>18 years) Cases PM 77,180 62,578 55,309
Restricted Activity Days (all ages) Days PM 320,525,771 259,895,350 229,943,301
Asthma symptom days (children 5-19yr) Days PM 7,728,256 6,287,999 5,567,708
Lost working days (15-64 years) Days PM 76,102,105 61,685,767 54,585,603
5 ‘At least’, because some neighbouring countries, such as Turkey, are not included in the analysis.
CBA for the Clean Air Policy Package
21
Table 3.6. Reduction in estimated annual health impacts between scenarios, 2030, EU28.
IMPACTS CLE – B7 B7 - MTFR
2030 2030
Acute Mortality (all ages) Prem. deaths O3 1,079 1,699
Respiratory hospital admissions (>64) Cases O3 1,220 1,926
Cardiovascular hospital admissions (>64) Cases O3 5,567 8,801
Minor Restricted Activity Days (all ages) Days O3 5,162,938 8,183,481
Chronic Mortality (30yr +) * Life years lost PM 483,257 238,107
Chronic Mortality (30yr +) * Prem. deaths PM 57,709 28,290
Infant Mortality (0-1yr) Prem. deaths PM 75 37
Chronic Bronchitis (27yr +) Cases PM 44,338 21,803
Bronchitis in children aged 6 to 12 Cases PM 137,450 68,804
Respiratory Hospital Admissions (All ages) Cases PM 19,229 9,500
Cardiac Hospital Admissions (>18 years) Cases PM 14,602 7,269
Restricted Activity Days (all ages) Days PM 60,630,421 29,952,049
Asthma symptom days (children 5-19yr) Days PM 1,440,257 720,291
Lost working days (15-64 years) Days PM 14,416,337 7,100,165
* life years lost and deaths from chronic exposure to PM2.5 are alternate measures of the same effect
Table 3.7. Monetised equivalent of health impacts due to air pollution, 2030, EU28, €million/year, 2005 prices.
Damage, €M/year CLE B7 MTFR
2030 2030 2030
Acute Mortality (All ages) median VOLY O3 995 932 834
Acute Mortality (All ages) mean VOLY O3 2,391 2,241 2,006
Respiratory hospital admissions (>64) O3 45 42 38
Cardiovascular hospital admissions (>64) O3 195 182 163
Minor Restricted Activity Days (MRADs all ages) O3 3,509 3,293 2,949
Chronic Mortality (All ages) LYL median VOLY PM 146,483 118,599 104,860
Chronic Mortality (All ages) LYL mean VOLY PM 352,118 285,090 252,064
Chronic Mortality (30yr +) deaths median VSL PM 331,228 268,325 237,489
Chronic Mortality (30yr +) deaths mean VSL PM 674,610 546,496 483,693
Infant Mortality (0-1yr) median VSL PM 644 521 460
Infant Mortality (0-1yr) mean VSL PM 1,312 1,061 937
Chronic Bronchitis (27yr +) PM 12,536 10,160 8,991
Bronchitis in children aged 6 to 12 PM 430 350 309
Respiratory Hospital Admissions (All ages) PM 224 181 160
Cardiac Hospital Admissions (>18 years) PM 171 139 123
Restricted Activity Days (all ages) PM 29,488 23,910 21,155
Asthma symptom days (children 5-19yr) PM 325 264 234
Lost working days (15-64 years) PM 9,893 8,019 7,096
Total: Core median VOLY 205,607 167,133 147,848
Total: Core mean VOLY 412,981 335,210 296,469
Total: Core median VSL 389,379 316,032 279,744
Total: Core mean VSL 733,734 595,030 526,681
CBA for the Clean Air Policy Package
22
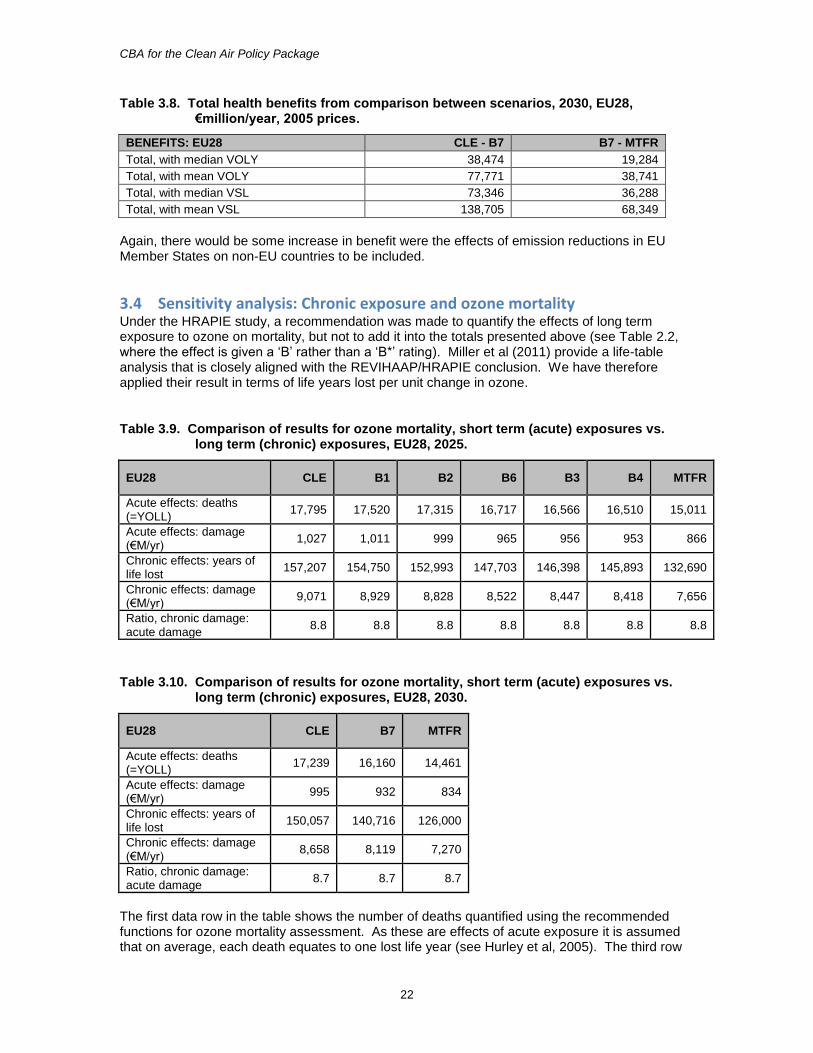
Table 3.8. Total health benefits from comparison between scenarios, 2030, EU28, €million/year, 2005 prices.
BENEFITS: EU28 CLE - B7 B7 - MTFR
Total, with median VOLY 38,474 19,284
Total, with mean VOLY 77,771 38,741
Total, with median VSL 73,346 36,288
Total, with mean VSL 138,705 68,349
Again, there would be some increase in benefit were the effects of emission reductions in EU Member States on non-EU countries to be included.
3.4 Sensitivity analysis: Chronic exposure and ozone mortality Under the HRAPIE study, a recommendation was made to quantify the effects of long term exposure to ozone on mortality, but not to add it into the totals presented above (see Table 2.2, where the effect is given a ‘B’ rather than a ‘B*’ rating). Miller et al (2011) provide a life-table analysis that is closely aligned with the REVIHAAP/HRAPIE conclusion. We have therefore applied their result in terms of life years lost per unit change in ozone.
Table 3.9. Comparison of results for ozone mortality, short term (acute) exposures vs. long term (chronic) exposures, EU28, 2025.
EU28 CLE B1 B2 B6 B3 B4 MTFR
Acute effects: deaths (=YOLL)
17,795 17,520 17,315 16,717 16,566 16,510 15,011
Acute effects: damage (€M/yr)
1,027 1,011 999 965 956 953 866
Chronic effects: years of life lost
157,207 154,750 152,993 147,703 146,398 145,893 132,690
Chronic effects: damage (€M/yr)
9,071 8,929 8,828 8,522 8,447 8,418 7,656
Ratio, chronic damage: acute damage
8.8 8.8 8.8 8.8 8.8 8.8 8.8
Table 3.10. Comparison of results for ozone mortality, short term (acute) exposures vs. long term (chronic) exposures, EU28, 2030.
EU28 CLE B7 MTFR
Acute effects: deaths (=YOLL)
17,239 16,160 14,461
Acute effects: damage (€M/yr)
995 932 834
Chronic effects: years of life lost
150,057 140,716 126,000
Chronic effects: damage (€M/yr)
8,658 8,119 7,270
Ratio, chronic damage: acute damage
8.7 8.7 8.7
The first data row in the table shows the number of deaths quantified using the recommended functions for ozone mortality assessment. As these are effects of acute exposure it is assumed that on average, each death equates to one lost life year (see Hurley et al, 2005). The third row
CBA for the Clean Air Policy Package
23
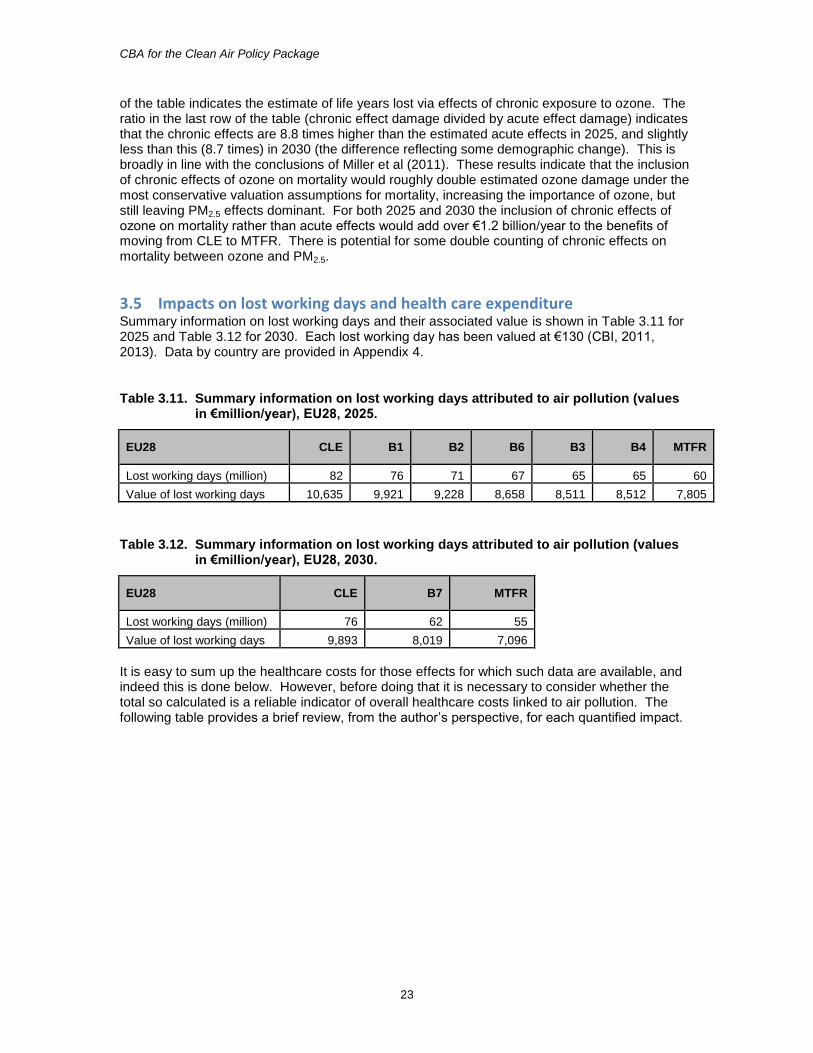
of the table indicates the estimate of life years lost via effects of chronic exposure to ozone. The ratio in the last row of the table (chronic effect damage divided by acute effect damage) indicates that the chronic effects are 8.8 times higher than the estimated acute effects in 2025, and slightly less than this (8.7 times) in 2030 (the difference reflecting some demographic change). This is broadly in line with the conclusions of Miller et al (2011). These results indicate that the inclusion of chronic effects of ozone on mortality would roughly double estimated ozone damage under the most conservative valuation assumptions for mortality, increasing the importance of ozone, but still leaving PM2.5 effects dominant. For both 2025 and 2030 the inclusion of chronic effects of ozone on mortality rather than acute effects would add over €1.2 billion/year to the benefits of moving from CLE to MTFR. There is potential for some double counting of chronic effects on mortality between ozone and PM2.5.
3.5 Impacts on lost working days and health care expenditure Summary information on lost working days and their associated value is shown in Table 3.11 for 2025 and Table 3.12 for 2030. Each lost working day has been valued at €130 (CBI, 2011, 2013). Data by country are provided in Appendix 4.
Table 3.11. Summary information on lost working days attributed to air pollution (values in €million/year), EU28, 2025.
EU28 CLE B1 B2 B6 B3 B4 MTFR
Lost working days (million) 82 76 71 67 65 65 60
Value of lost working days 10,635 9,921 9,228 8,658 8,511 8,512 7,805
Table 3.12. Summary information on lost working days attributed to air pollution (values in €million/year), EU28, 2030.
EU28 CLE B7 MTFR
Lost working days (million) 76 62 55
Value of lost working days 9,893 8,019 7,096
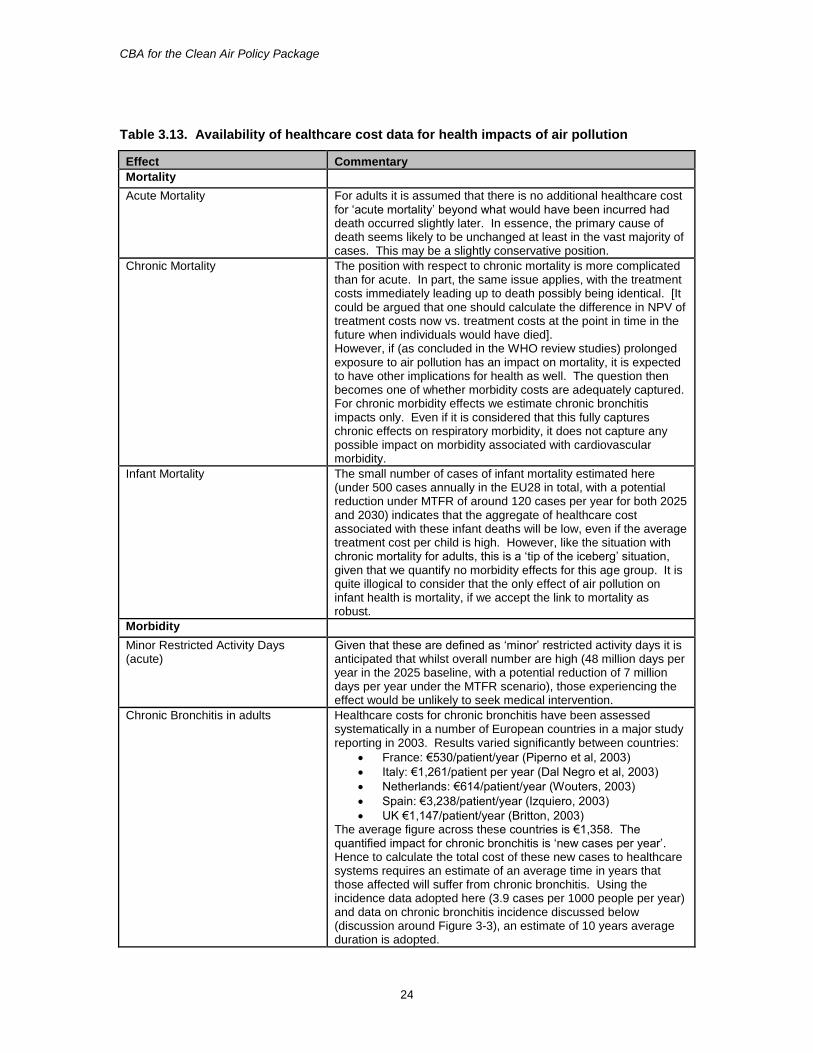
It is easy to sum up the healthcare costs for those effects for which such data are available, and indeed this is done below. However, before doing that it is necessary to consider whether the total so calculated is a reliable indicator of overall healthcare costs linked to air pollution. The following table provides a brief review, from the author’s perspective, for each quantified impact.
CBA for the Clean Air Policy Package
24
Table 3.13. Availability of healthcare cost data for health impacts of air pollution
Effect Commentary
Mortality
Acute Mortality For adults it is assumed that there is no additional healthcare cost for ‘acute mortality’ beyond what would have been incurred had death occurred slightly later. In essence, the primary cause of death seems likely to be unchanged at least in the vast majority of cases. This may be a slightly conservative position.
Chronic Mortality The position with respect to chronic mortality is more complicated than for acute. In part, the same issue applies, with the treatment costs immediately leading up to death possibly being identical. [It could be argued that one should calculate the difference in NPV of treatment costs now vs. treatment costs at the point in time in the future when individuals would have died]. However, if (as concluded in the WHO review studies) prolonged exposure to air pollution has an impact on mortality, it is expected to have other implications for health as well. The question then becomes one of whether morbidity costs are adequately captured. For chronic morbidity effects we estimate chronic bronchitis impacts only. Even if it is considered that this fully captures chronic effects on respiratory morbidity, it does not capture any possible impact on morbidity associated with cardiovascular morbidity.
Infant Mortality The small number of cases of infant mortality estimated here (under 500 cases annually in the EU28 in total, with a potential reduction under MTFR of around 120 cases per year for both 2025 and 2030) indicates that the aggregate of healthcare cost associated with these infant deaths will be low, even if the average treatment cost per child is high. However, like the situation with chronic mortality for adults, this is a ‘tip of the iceberg’ situation, given that we quantify no morbidity effects for this age group. It is quite illogical to consider that the only effect of air pollution on infant health is mortality, if we accept the link to mortality as robust.
Morbidity
Minor Restricted Activity Days (acute)
Given that these are defined as ‘minor’ restricted activity days it is anticipated that whilst overall number are high (48 million days per year in the 2025 baseline, with a potential reduction of 7 million days per year under the MTFR scenario), those experiencing the effect would be unlikely to seek medical intervention.
Chronic Bronchitis in adults Healthcare costs for chronic bronchitis have been assessed systematically in a number of European countries in a major study reporting in 2003. Results varied significantly between countries:
France: €530/patient/year (Piperno et al, 2003)
Italy: €1,261/patient per year (Dal Negro et al, 2003)
Netherlands: €614/patient/year (Wouters, 2003)
Spain: €3,238/patient/year (Izquiero, 2003)
UK €1,147/patient/year (Britton, 2003) The average figure across these countries is €1,358. The quantified impact for chronic bronchitis is ‘new cases per year’. Hence to calculate the total cost of these new cases to healthcare systems requires an estimate of an average time in years that those affected will suffer from chronic bronchitis. Using the incidence data adopted here (3.9 cases per 1000 people per year) and data on chronic bronchitis incidence discussed below (discussion around Figure 3-3), an estimate of 10 years average duration is adopted.
CBA for the Clean Air Policy Package
25
Effect Commentary
Chronic bronchitis in children It can be anticipated that children with persistent symptoms would be taken to the doctor. Drawing on Netten and Curtis (2000, as reported by Hurley et al, 2005) the cost of a consultation would be in the order of €45.
Respiratory Hospital Admissions (acute)
Hospital admissions are valued at €2,220 per case. Of this, €1,000 is attributed to healthcare costs. However, this seems likely to be an underestimate given the average stay lengths linked to respiratory hospital admissions in WHO’s Hospital Morbidity Database and costs indicated by WHO’s CHOICE database.
Cardiac Hospital Admissions (acute) Hospital admissions are valued at €2,220 per case. Of this, €1,000 is attributed to healthcare costs. However, this seems likely to be an underestimate given the average stay lengths linked to cardiovascular hospital admissions in WHO’s Hospital Morbidity Database and costs indicated by WHO’s CHOICE database.
Asthma symptom days (children 5-19yr)
As a minimum it would be anticipated that children experiencing an asthma symptom day would receive some medication, valued previously at €1 per day (Hurley et al, 2005).
Restricted Activity Days (acute) The broad definition of a ‘restricted activity day’ prevents attribution of an average cost for healthcare. In many cases it is envisaged that there would be no healthcare cost. However, given the large numbers involved (255 million RADs in the EU under the 2025 baseline for those of working age with a potential improvement of 115 RADS under MTFR, with numbers potentially 45% higher if those over 65 years are included) a significant aggregate cost could arise if just a minority of cases involved some level of intervention.
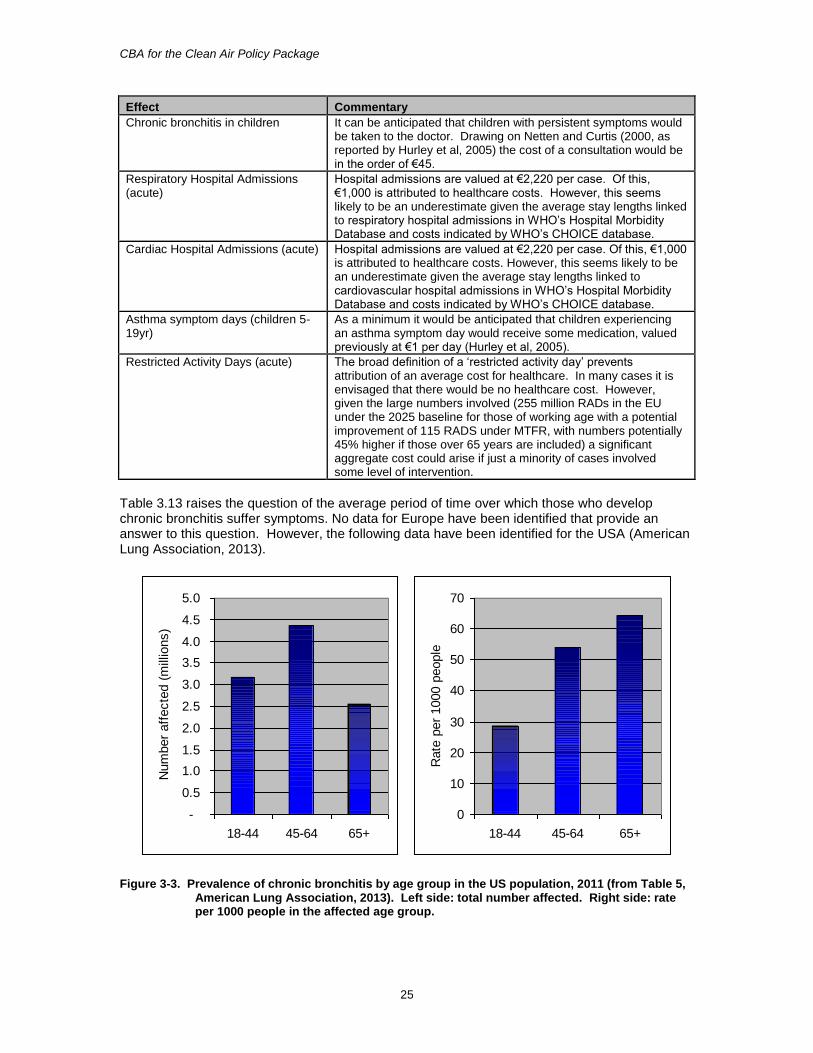
Table 3.13 raises the question of the average period of time over which those who develop chronic bronchitis suffer symptoms. No data for Europe have been identified that provide an answer to this question. However, the following data have been identified for the USA (American Lung Association, 2013).
-
0.5
1.0
1.5
2.0
2.5
3.0
3.5
4.0
4.5
5.0
18-44 45-64 65+
Num
ber
aff
ecte
d (
mill
ions)
0
10
20
30
40
50
60
70
18-44 45-64 65+
Rate
per
1000 p
eople
Figure 3-3. Prevalence of chronic bronchitis by age group in the US population, 2011 (from Table 5, American Lung Association, 2013). Left side: total number affected. Right side: rate per 1000 people in the affected age group.
CBA for the Clean Air Policy Package
26
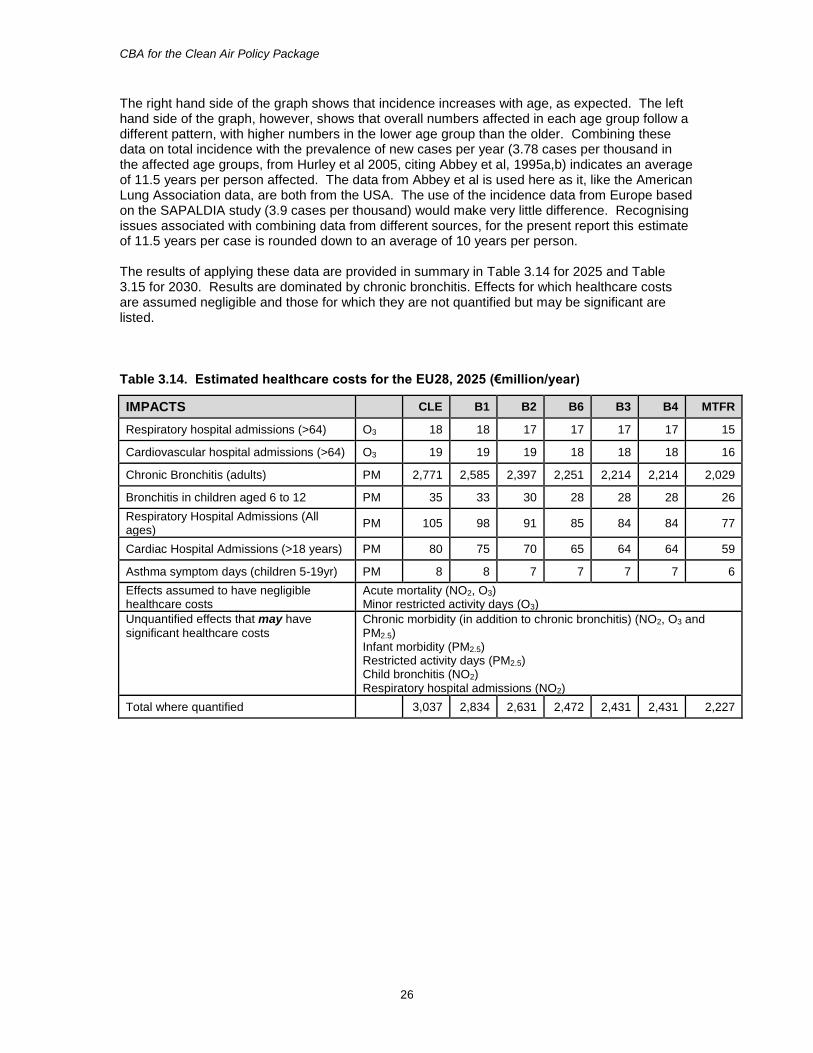
The right hand side of the graph shows that incidence increases with age, as expected. The left hand side of the graph, however, shows that overall numbers affected in each age group follow a different pattern, with higher numbers in the lower age group than the older. Combining these data on total incidence with the prevalence of new cases per year (3.78 cases per thousand in the affected age groups, from Hurley et al 2005, citing Abbey et al, 1995a,b) indicates an average of 11.5 years per person affected. The data from Abbey et al is used here as it, like the American Lung Association data, are both from the USA. The use of the incidence data from Europe based on the SAPALDIA study (3.9 cases per thousand) would make very little difference. Recognising issues associated with combining data from different sources, for the present report this estimate of 11.5 years per case is rounded down to an average of 10 years per person. The results of applying these data are provided in summary in Table 3.14 for 2025 and Table 3.15 for 2030. Results are dominated by chronic bronchitis. Effects for which healthcare costs are assumed negligible and those for which they are not quantified but may be significant are listed.
Table 3.14. Estimated healthcare costs for the EU28, 2025 (€million/year)
IMPACTS CLE B1 B2 B6 B3 B4 MTFR
Respiratory hospital admissions (>64) O3 18 18 17 17 17 17 15
Cardiovascular hospital admissions (>64) O3 19 19 19 18 18 18 16
Chronic Bronchitis (adults) PM 2,771 2,585 2,397 2,251 2,214 2,214 2,029
Bronchitis in children aged 6 to 12 PM 35 33 30 28 28 28 26
Respiratory Hospital Admissions (All ages)
PM 105 98 91 85 84 84 77
Cardiac Hospital Admissions (>18 years) PM 80 75 70 65 64 64 59
Asthma symptom days (children 5-19yr) PM 8 8 7 7 7 7 6
Effects assumed to have negligible healthcare costs
Acute mortality (NO2, O3) Minor restricted activity days (O3)
Unquantified effects that may have
significant healthcare costs Chronic morbidity (in addition to chronic bronchitis) (NO2, O3 and PM2.5) Infant morbidity (PM2.5) Restricted activity days (PM2.5) Child bronchitis (NO2) Respiratory hospital admissions (NO2)
Total where quantified 3,037 2,834 2,631 2,472 2,431 2,431 2,227

CBA for the Clean Air Policy Package
27
Table 3.15. Estimated healthcare costs for the EU28, 2030 (€million/year)
IMPACTS CLE B7 MTFR
Respiratory hospital admissions (>64) O3 17 16 14
Cardiovascular hospital admissions (>64) O3 20 19 17
Chronic Bronchitis (adults) PM 2,679 2,171 1,922
Bronchitis in children aged 6 to 12 PM 33 27 24
Respiratory Hospital Admissions (All ages)
PM 101 82 72
Cardiac Hospital Admissions (>18 years) PM 77 63 55
Asthma symptom days (children 5-19yr) PM 8 6 6
Effects assumed to have negligible healthcare costs
Acute mortality (NO2, O3) Minor restricted activity days (O3)
Unquantified effects that may have
significant healthcare costs Chronic morbidity (in addition to chronic bronchitis) (NO2, O3 and PM2.5) Infant morbidity (PM2.5) Restricted activity days (PM2.5) Child bronchitis (NO2) Respiratory hospital admissions (NO2)
Total where quantified 2,935 2,384 2,110
3.6 National results A summary of key health indicators is provided in Appendix 4, covering:
Life years lost (and deaths) to chronic exposure to PM2.5,
Deaths linked with short-term exposure to ozone,
Life years lost to chronic exposure to ozone (with associated values)
Work loss days (a subset of ‘restricted activity days’) associated with short-term PM2.5
exposure. Appendix 5 provides aggregated health damage cost data by country, taking the CAFE median VOLY approach to mortality valuation. This provides results that are about one third of those from use of the upper bound mean VSL option.
CBA for the Clean Air Policy Package
28
4 Non-health benefits
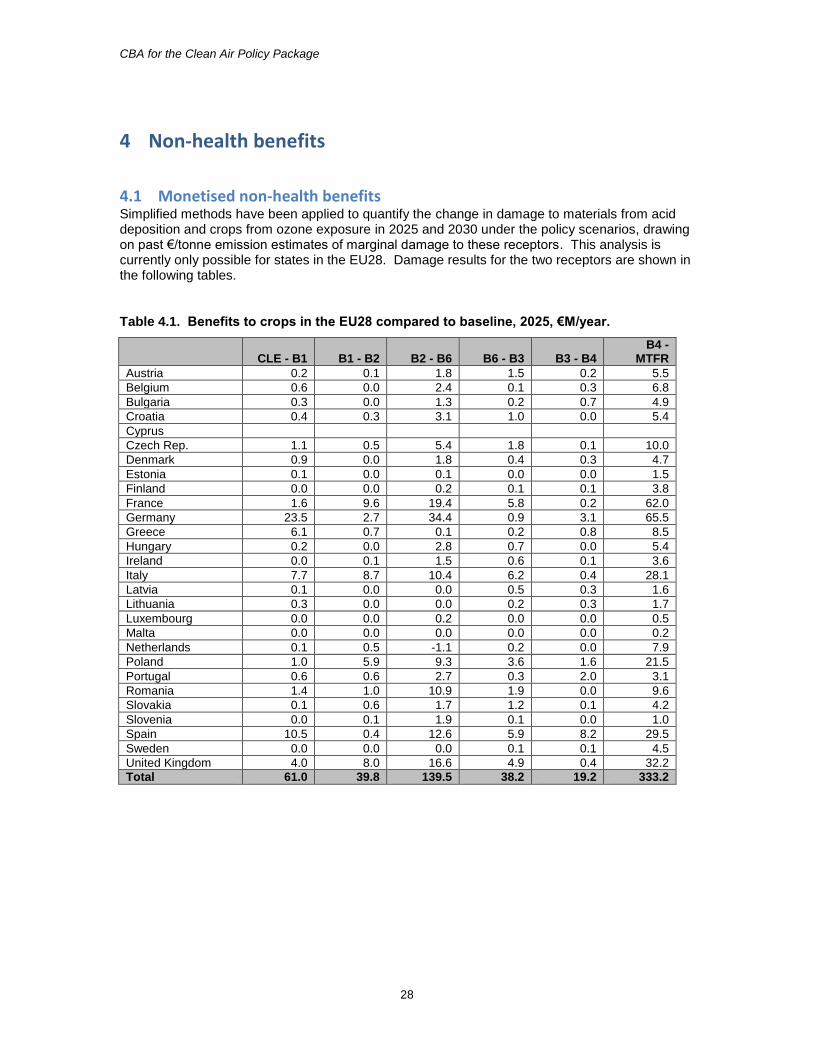
4.1 Monetised non-health benefits Simplified methods have been applied to quantify the change in damage to materials from acid deposition and crops from ozone exposure in 2025 and 2030 under the policy scenarios, drawing on past €/tonne emission estimates of marginal damage to these receptors. This analysis is currently only possible for states in the EU28. Damage results for the two receptors are shown in the following tables.
Table 4.1. Benefits to crops in the EU28 compared to baseline, 2025, €M/year.
CLE - B1 B1 - B2 B2 - B6 B6 - B3 B3 - B4 B4 -
MTFR
Austria 0.2 0.1 1.8 1.5 0.2 5.5
Belgium 0.6 0.0 2.4 0.1 0.3 6.8
Bulgaria 0.3 0.0 1.3 0.2 0.7 4.9
Croatia 0.4 0.3 3.1 1.0 0.0 5.4
Cyprus
Czech Rep. 1.1 0.5 5.4 1.8 0.1 10.0
Denmark 0.9 0.0 1.8 0.4 0.3 4.7
Estonia 0.1 0.0 0.1 0.0 0.0 1.5
Finland 0.0 0.0 0.2 0.1 0.1 3.8
France 1.6 9.6 19.4 5.8 0.2 62.0
Germany 23.5 2.7 34.4 0.9 3.1 65.5
Greece 6.1 0.7 0.1 0.2 0.8 8.5
Hungary 0.2 0.0 2.8 0.7 0.0 5.4
Ireland 0.0 0.1 1.5 0.6 0.1 3.6
Italy 7.7 8.7 10.4 6.2 0.4 28.1
Latvia 0.1 0.0 0.0 0.5 0.3 1.6
Lithuania 0.3 0.0 0.0 0.2 0.3 1.7
Luxembourg 0.0 0.0 0.2 0.0 0.0 0.5
Malta 0.0 0.0 0.0 0.0 0.0 0.2
Netherlands 0.1 0.5 -1.1 0.2 0.0 7.9
Poland 1.0 5.9 9.3 3.6 1.6 21.5
Portugal 0.6 0.6 2.7 0.3 2.0 3.1
Romania 1.4 1.0 10.9 1.9 0.0 9.6
Slovakia 0.1 0.6 1.7 1.2 0.1 4.2
Slovenia 0.0 0.1 1.9 0.1 0.0 1.0
Spain 10.5 0.4 12.6 5.9 8.2 29.5
Sweden 0.0 0.0 0.0 0.1 0.1 4.5
United Kingdom 4.0 8.0 16.6 4.9 0.4 32.2
Total 61.0 39.8 139.5 38.2 19.2 333.2
CBA for the Clean Air Policy Package
29
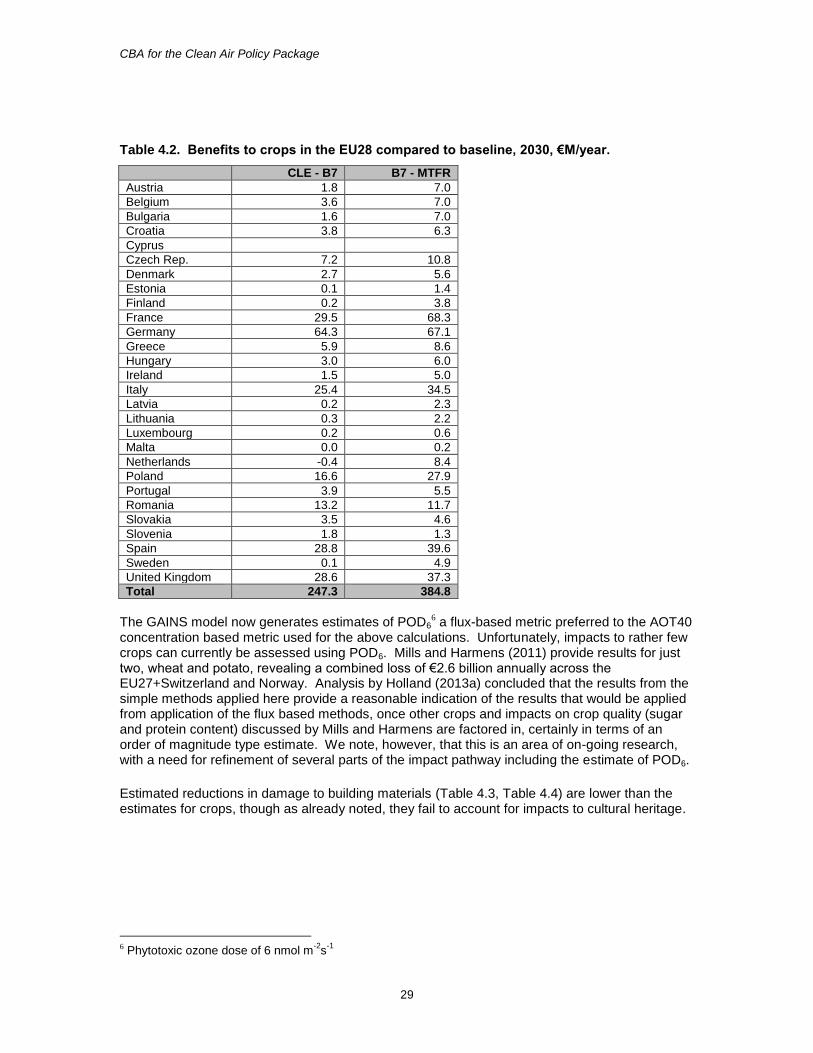
Table 4.2. Benefits to crops in the EU28 compared to baseline, 2030, €M/year.
CLE - B7 B7 - MTFR
Austria 1.8 7.0
Belgium 3.6 7.0
Bulgaria 1.6 7.0
Croatia 3.8 6.3
Cyprus
Czech Rep. 7.2 10.8
Denmark 2.7 5.6
Estonia 0.1 1.4
Finland 0.2 3.8
France 29.5 68.3
Germany 64.3 67.1
Greece 5.9 8.6
Hungary 3.0 6.0
Ireland 1.5 5.0
Italy 25.4 34.5
Latvia 0.2 2.3
Lithuania 0.3 2.2
Luxembourg 0.2 0.6
Malta 0.0 0.2
Netherlands -0.4 8.4
Poland 16.6 27.9
Portugal 3.9 5.5
Romania 13.2 11.7
Slovakia 3.5 4.6
Slovenia 1.8 1.3
Spain 28.8 39.6
Sweden 0.1 4.9
United Kingdom 28.6 37.3
Total 247.3 384.8
The GAINS model now generates estimates of POD6
6 a flux-based metric preferred to the AOT40 concentration based metric used for the above calculations. Unfortunately, impacts to rather few crops can currently be assessed using POD6. Mills and Harmens (2011) provide results for just two, wheat and potato, revealing a combined loss of €2.6 billion annually across the EU27+Switzerland and Norway. Analysis by Holland (2013a) concluded that the results from the simple methods applied here provide a reasonable indication of the results that would be applied from application of the flux based methods, once other crops and impacts on crop quality (sugar and protein content) discussed by Mills and Harmens are factored in, certainly in terms of an order of magnitude type estimate. We note, however, that this is an area of on-going research, with a need for refinement of several parts of the impact pathway including the estimate of POD6.
Estimated reductions in damage to building materials (Table 4.3, Table 4.4) are lower than the estimates for crops, though as already noted, they fail to account for impacts to cultural heritage.
6 Phytotoxic ozone dose of 6 nmol m
-2s
-1
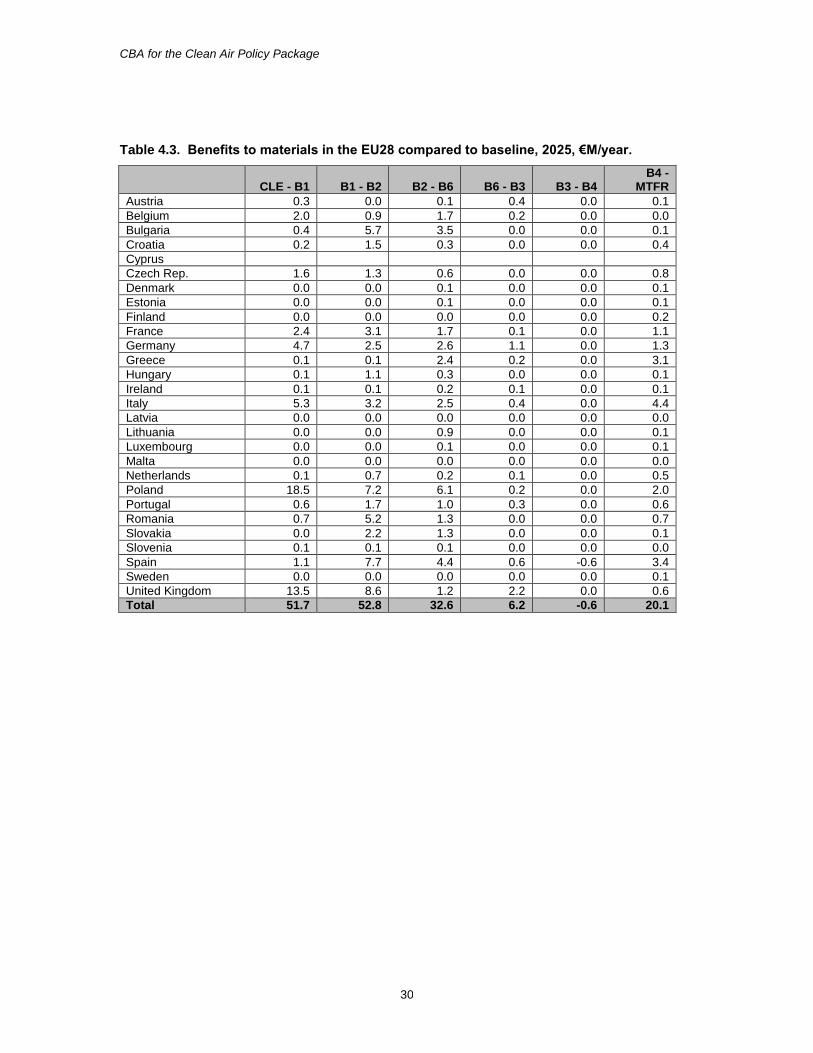
CBA for the Clean Air Policy Package
30
Table 4.3. Benefits to materials in the EU28 compared to baseline, 2025, €M/year.
CLE - B1 B1 - B2 B2 - B6 B6 - B3 B3 - B4 B4 -
MTFR
Austria 0.3 0.0 0.1 0.4 0.0 0.1
Belgium 2.0 0.9 1.7 0.2 0.0 0.0
Bulgaria 0.4 5.7 3.5 0.0 0.0 0.1
Croatia 0.2 1.5 0.3 0.0 0.0 0.4
Cyprus
Czech Rep. 1.6 1.3 0.6 0.0 0.0 0.8
Denmark 0.0 0.0 0.1 0.0 0.0 0.1
Estonia 0.0 0.0 0.1 0.0 0.0 0.1
Finland 0.0 0.0 0.0 0.0 0.0 0.2
France 2.4 3.1 1.7 0.1 0.0 1.1
Germany 4.7 2.5 2.6 1.1 0.0 1.3
Greece 0.1 0.1 2.4 0.2 0.0 3.1
Hungary 0.1 1.1 0.3 0.0 0.0 0.1
Ireland 0.1 0.1 0.2 0.1 0.0 0.1
Italy 5.3 3.2 2.5 0.4 0.0 4.4
Latvia 0.0 0.0 0.0 0.0 0.0 0.0
Lithuania 0.0 0.0 0.9 0.0 0.0 0.1
Luxembourg 0.0 0.0 0.1 0.0 0.0 0.1
Malta 0.0 0.0 0.0 0.0 0.0 0.0
Netherlands 0.1 0.7 0.2 0.1 0.0 0.5
Poland 18.5 7.2 6.1 0.2 0.0 2.0
Portugal 0.6 1.7 1.0 0.3 0.0 0.6
Romania 0.7 5.2 1.3 0.0 0.0 0.7
Slovakia 0.0 2.2 1.3 0.0 0.0 0.1
Slovenia 0.1 0.1 0.1 0.0 0.0 0.0
Spain 1.1 7.7 4.4 0.6 -0.6 3.4
Sweden 0.0 0.0 0.0 0.0 0.0 0.1
United Kingdom 13.5 8.6 1.2 2.2 0.0 0.6
Total 51.7 52.8 32.6 6.2 -0.6 20.1
CBA for the Clean Air Policy Package
31
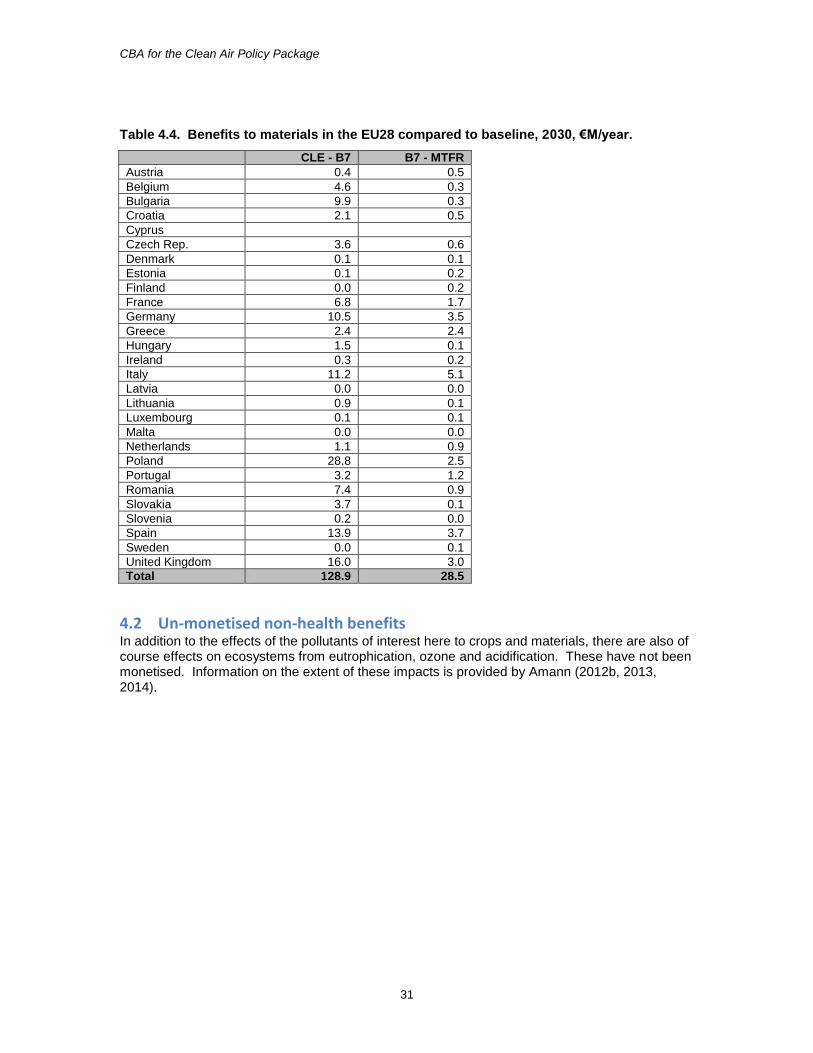
Table 4.4. Benefits to materials in the EU28 compared to baseline, 2030, €M/year.
CLE - B7 B7 - MTFR
Austria 0.4 0.5
Belgium 4.6 0.3
Bulgaria 9.9 0.3
Croatia 2.1 0.5
Cyprus
Czech Rep. 3.6 0.6
Denmark 0.1 0.1
Estonia 0.1 0.2
Finland 0.0 0.2
France 6.8 1.7
Germany 10.5 3.5
Greece 2.4 2.4
Hungary 1.5 0.1
Ireland 0.3 0.2
Italy 11.2 5.1
Latvia 0.0 0.0
Lithuania 0.9 0.1
Luxembourg 0.1 0.1
Malta 0.0 0.0
Netherlands 1.1 0.9
Poland 28.8 2.5
Portugal 3.2 1.2
Romania 7.4 0.9
Slovakia 3.7 0.1
Slovenia 0.2 0.0
Spain 13.9 3.7
Sweden 0.0 0.1
United Kingdom 16.0 3.0
Total 128.9 28.5
4.2 Un-monetised non-health benefits In addition to the effects of the pollutants of interest here to crops and materials, there are also of course effects on ecosystems from eutrophication, ozone and acidification. These have not been monetised. Information on the extent of these impacts is provided by Amann (2012b, 2013, 2014).
CBA for the Clean Air Policy Package
32
5 Cost-benefit analysis
5.1 Cost data Cost data generated by the GAINS Model and presented by Amann (2014) have been used for the CBA of the 2025 and 2030 scenarios. Incremental cost data relative to the CLE scenario are also presented here, in Appendix 6, for reference.
5.2 Comparison of costs and health benefits The CBA shown in Table 5.1 taking aggregate costs and benefits for EU28 for 2025, demonstrates net benefits7 for the shift from CLE to the B3 scenario, but not for moving from B3 to MTFR. There is, however, a net benefit when moving from CLE to MTFR. This arises because there is sufficient excess benefit when moving from CLE to B3 to offset the net cost from B3 to MTFR. The reduction in net benefit when moving from B6 to B3 arises in part, because of the smaller level of gap closure between these two scenarios than for preceding scenario pairs. As noted previously, the difference between scenarios B3 and B4 is a misleading indication of benefit, as B4 differs with respect to targeting of ecological impacts that are not quantified.
Table 5.1. Net health benefits of the scenarios for 2025, €M/year.
Net benefits, EU28 CLE - B1 B1 - B2 B2 - B6 B6 - B3 B3 - B4 B4 –
MTFR
Costs 222 979 2,138 1,289 51 42,327
Net benefits
Total with median VOLY 14,176 13,344 9,482 1,609 -42 -27,579
Total with mean VOLY 28,987 28,056 21,444 4,559 -35 -12,638
Total with median VSL 25,864 25,513 18,794 4,044 -58 -15,907
Total with mean VSL 48,994 49,070 37,340 8,762 -72 7,277
A similar pattern is observed for 2030 (Table 5.2). Fewer scenarios have been considered for 2030, reducing the resolution of the CBA. However, comparison of results indicates that the same outcome holds: that marginal benefits exceed costs up to (at least) the level of scenario B7.
Table 5.2. Net health benefits of the scenarios for 2030, €M/year.
Net benefits, EU28 CLE - B7 B7 - MTFR
Costs 3,334 47,347
Net benefits
Total with median VOLY 35,140 -28,063
Total with mean VOLY 74,437 -8,606
Total with median VSL 70,012 -11,059
Total with mean VSL 135,371 21,002
Table 5.3 for 2025 and Table 5.4 for 2030 provide an alternative way of comparing costs and benefits using benefit-cost ratios. A net cost is shown when this ratio falls below 1.
7 Net benefits = benefit from scenario less the costs of reaching that scenario
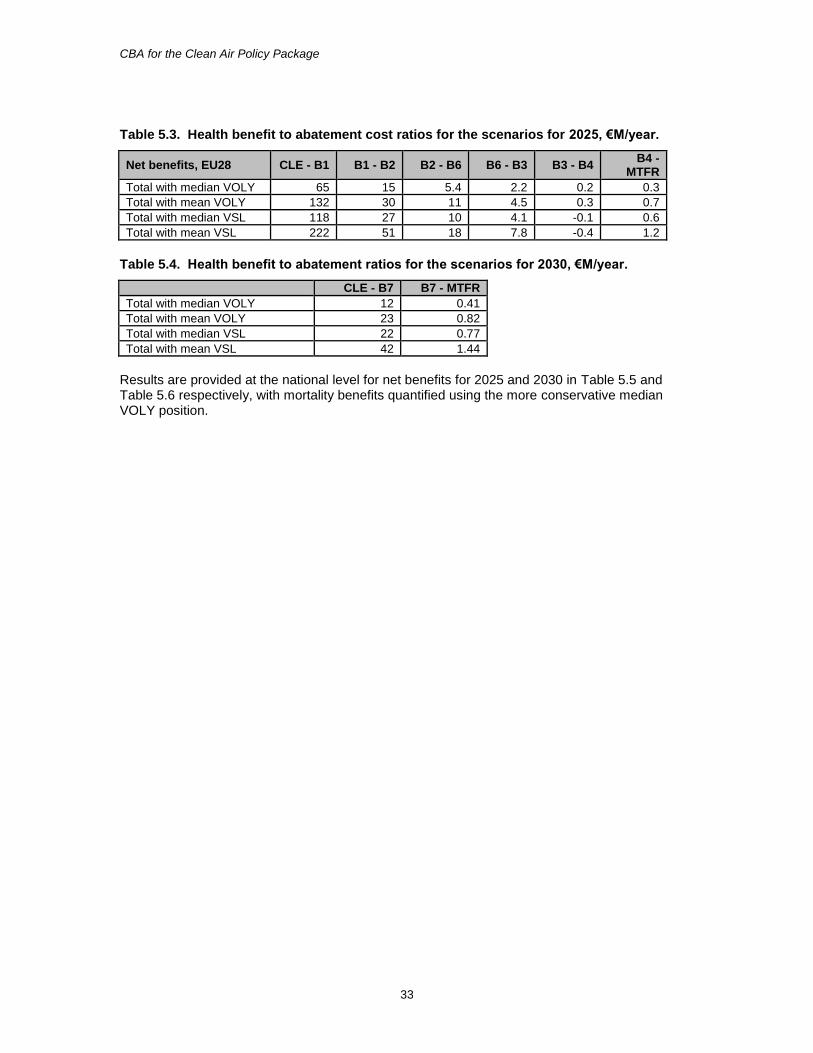
CBA for the Clean Air Policy Package
33
Table 5.3. Health benefit to abatement cost ratios for the scenarios for 2025, €M/year.
Net benefits, EU28 CLE - B1 B1 - B2 B2 - B6 B6 - B3 B3 - B4 B4 -
MTFR
Total with median VOLY 65 15 5.4 2.2 0.2 0.3
Total with mean VOLY 132 30 11 4.5 0.3 0.7
Total with median VSL 118 27 10 4.1 -0.1 0.6
Total with mean VSL 222 51 18 7.8 -0.4 1.2
Table 5.4. Health benefit to abatement ratios for the scenarios for 2030, €M/year.
CLE - B7 B7 - MTFR
Total with median VOLY 12 0.41
Total with mean VOLY 23 0.82
Total with median VSL 22 0.77
Total with mean VSL 42 1.44
Results are provided at the national level for net benefits for 2025 and 2030 in Table 5.5 and Table 5.6 respectively, with mortality benefits quantified using the more conservative median VOLY position.
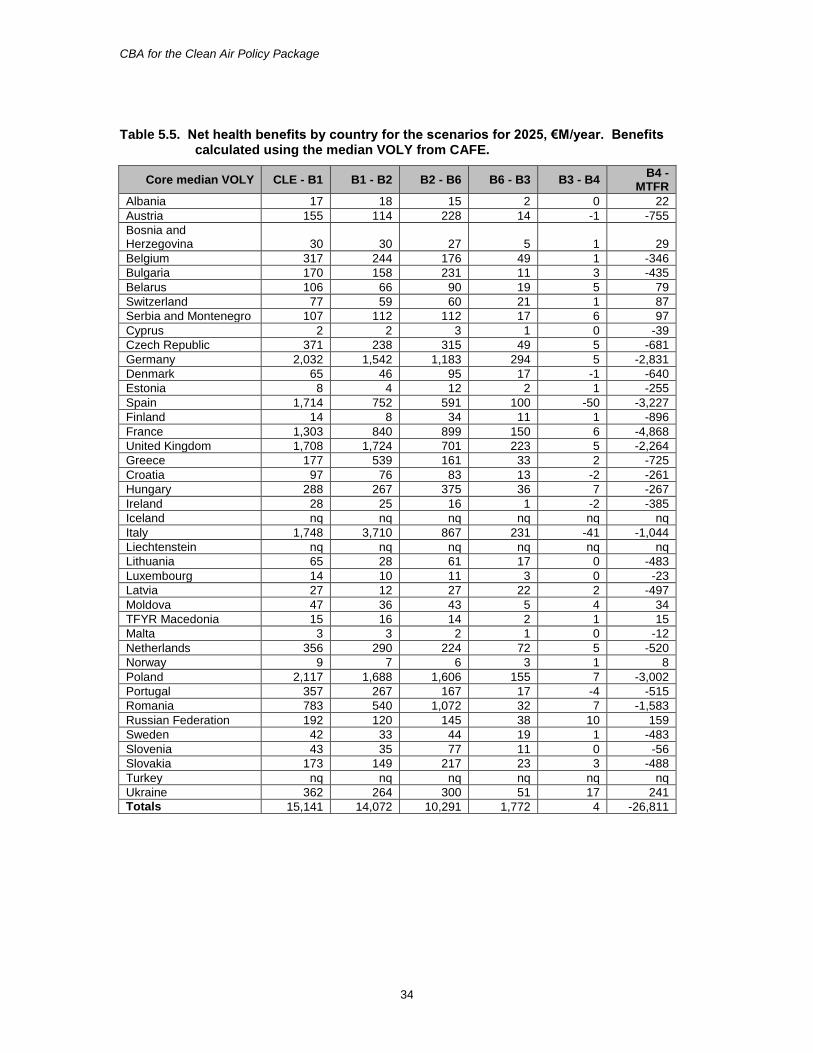
CBA for the Clean Air Policy Package
34
Table 5.5. Net health benefits by country for the scenarios for 2025, €M/year. Benefits calculated using the median VOLY from CAFE.
Core median VOLY CLE - B1 B1 - B2 B2 - B6 B6 - B3 B3 - B4 B4 -
MTFR
Albania 17 18 15 2 0 22
Austria 155 114 228 14 -1 -755
Bosnia and Herzegovina 30 30 27 5 1 29
Belgium 317 244 176 49 1 -346
Bulgaria 170 158 231 11 3 -435
Belarus 106 66 90 19 5 79
Switzerland 77 59 60 21 1 87
Serbia and Montenegro 107 112 112 17 6 97
Cyprus 2 2 3 1 0 -39
Czech Republic 371 238 315 49 5 -681
Germany 2,032 1,542 1,183 294 5 -2,831
Denmark 65 46 95 17 -1 -640
Estonia 8 4 12 2 1 -255
Spain 1,714 752 591 100 -50 -3,227
Finland 14 8 34 11 1 -896
France 1,303 840 899 150 6 -4,868
United Kingdom 1,708 1,724 701 223 5 -2,264
Greece 177 539 161 33 2 -725
Croatia 97 76 83 13 -2 -261
Hungary 288 267 375 36 7 -267
Ireland 28 25 16 1 -2 -385
Iceland nq nq nq nq nq nq
Italy 1,748 3,710 867 231 -41 -1,044
Liechtenstein nq nq nq nq nq nq
Lithuania 65 28 61 17 0 -483
Luxembourg 14 10 11 3 0 -23
Latvia 27 12 27 22 2 -497
Moldova 47 36 43 5 4 34
TFYR Macedonia 15 16 14 2 1 15
Malta 3 3 2 1 0 -12
Netherlands 356 290 224 72 5 -520
Norway 9 7 6 3 1 8
Poland 2,117 1,688 1,606 155 7 -3,002
Portugal 357 267 167 17 -4 -515
Romania 783 540 1,072 32 7 -1,583
Russian Federation 192 120 145 38 10 159
Sweden 42 33 44 19 1 -483
Slovenia 43 35 77 11 0 -56
Slovakia 173 149 217 23 3 -488
Turkey nq nq nq nq nq nq
Ukraine 362 264 300 51 17 241
Totals 15,141 14,072 10,291 1,772 4 -26,811

CBA for the Clean Air Policy Package
35
Table 5.6. Net health benefits by country for the scenarios for 2030, €M/year. Benefits calculated using the median VOLY from CAFE.
Core mid VOLY CLE - B7 B7 - MTFR
Albania 49 24
Austria 478 -790
Bosnia and Herzegovina 83 36
Belgium 719 -355
Bulgaria 496 -440
Belarus 243 103
Switzerland 195 115
Serbia and Montenegro 318 123
Cyprus 7 -39
Czech Republic 920 -688
Germany 4,585 -2,669
Denmark 186 -652
Estonia 23 -292
Spain 3,180 -3,388
Finland 56 -902
France 2,945 -4,548
United Kingdom 3,819 -2,168
Greece 839 -700
Croatia 242 -276
Hungary 901 -254
Ireland 61 -439
Iceland nq nq
Italy 5,717 -818
Liechtenstein nq nq
Lithuania 144 -533
Luxembourg 36 -21
Latvia 62 -509
Moldova 114 43
TFYR Macedonia 44 18
Malta 8 -12
Netherlands 843 -997
Norway 20 12
Poland 5,205 -3,443
Portugal 762 -554
Romania 2,117 -1,515
Russian Federation 424 206
Sweden 117 -491
Slovenia 145 -48
Slovakia 528 -521
Turkey nq nq
Ukraine 848 307
Totals 37,478 -27,077
CBA for the Clean Air Policy Package
36
6 Discussion The analysis presented above demonstrates that consideration of health effects alone is sufficient for the benefits for all scenarios up to B3 for 2025, and B7 for 2030, to exceed estimated costs. This applies at the national level as well as the EU28 level. Results also show that proceeding beyond this point to the MTFR scenario would not generate a net monetised health benefit compared to the costs under all cases except the least conservative position on mortality valuation8. The analysis has included the updated health functions for mortality recommended by WHO-Europe under the HRAPIE study. Estimates of working days lost and of costs to healthcare systems have been included. The estimate of lost working days may be reasonably complete, though does not include lost working days linked to some health impacts (e.g. chronic bronchitis). The estimated costs of lost working days do not include indirect effects on productivity, e.g. through reduced quality of outputs when using temporary staff who are not so experienced as those that they replace. Estimates are also provided of costs to healthcare services, in the order of €3 billion in the EU28 in both 2025 and 2030. The mortality valuation data, that dominate the CBA, are unchanged since 2005 when the CAFE study was undertaken. Consideration has been given as to whether newer information would change the conclusions reached here. A meta-analysis performed by the OECD (2012) suggests an increase in the value of statistical life beyond the upper limit considered under CAFE, to $US3.6 million (roughly €2.8 million). This would have no effect on the conclusions drawn from the analysis, given that the upper bound VSL used here is sufficient to generate a net benefit in all cases. Desaigues et al (2011) suggested a slightly lower VOLY than the lower bound adopted here (€40,000 vs. €57,700). A sensitivity analysis reveals that this would have no effect on the conclusions reached, being an insufficient change to generate net costs for any scenario where analysis using the lower bound VOLY adopted under CAFE indicates a net benefit. As noted, the analysis presented here is focused on health effects. Inclusion of other effects (such as the impacts to materials and crops assessed in Chapter 4) would strengthen the conclusions reached, though some trade-offs will be present (e.g. the effect of N deposition on carbon uptake by vegetation).
8 Even in this case, it is considered unlikely here that a true marginal analysis would show net benefits all the
way from the B3 and B7 scenarios to MTFR.
CBA for the Clean Air Policy Package
37
7 References Abt Associates (2012) BenMap: Environmental Benefits Mapping and Analysis Programme. User’s Manual, Appendices. www.epa.gov/airquality/benmap/models/BenMAPAppendicesOct2012.pdf. Abbey et al (1995a) Estimated long-term ambient concentrations of PM10 and development of respiratory symptoms in a nonsmoking population. International Archives for Occupational and Environmental Health, 50(2):139–152. Abbey DE et al. (1995b). Chronic respiratory symptoms associated with estimated long-term ambient concentrations of fine particulates less than 2.5 microns in aerodynamic diameter (PM2.5) and other air pollutants. Journal of Exposure Analysis and Environmental Epidemiology, 5(2):137–159. Ali R et al. (2010). General Lifestyle Survey 2008: overview report. Newport, Office of National Statistics (http://www.ons.gov.uk/ons/rel/ghs/general-lifestyle-survey/2008-report/index.html, accessed 20 November 2013). Amann M, Borken-Kleefeld J, Cofala J, et al. (2012a) Future emissions of air pollutants in Europe – Current legislation baseline and the scope for further reductions. TSAP Report #1. International Institute for Applied Systems Analysis, Laxenburg, Austria Amann, M. (Ed.) (2012b) TSAP-2012 Baseline: Health and environmental impacts. TSAP report no.6, International Institute for Applied Systems Analysis, Laxenburg, Austria Amann, M. (Ed.) (2012c) Scenarios of cost-effective emission controls after 2020. TSAP report no.7, International Institute for Applied Systems Analysis, Laxenburg, Austria. Amann, M. (Ed.) (2013) Policy scenarios for the revision of the Thematic Strategy on Air Pollution. March 2013. TSAP report no.10, International Institute for Applied Systems Analysis, Laxenburg, Austria. Amann, M. (Ed.) (2014) The final policy scenarios for the revision of the EU Clean Air Package. February 2014. TSAP report no.11, International Institute for Applied Systems Analysis, Laxenburg, Austria. American Lung Association (2013) Trends in COPD (chronic bronchitis and emphysema): mortality and morbidity. file:///C:/Documents%20and%20Settings/Mike/Desktop/Tripshack4/copd-trend-report%20US.pdf. Britton, M. (2003) The burden of COPD in the U.K.: results from the Confronting COPD survey. Respir Med. Mar;97 Suppl C:S71-9. Chanel, O and Luchini, S. (2014) Monetary values for risk of death from air pollution exposure: a context-dependent scenario with a control for intra-familial altruism. Journal of Environmental Economics and Policy, 3, 67-91. CBI (1998) Missing out: 1998 absence and labour turnover survey. Confederation of British Industry, London.
CBA for the Clean Air Policy Package
38
CBI (2011) Healthy returns? Absence and workplace health survey, 2011. Confederation of British Industry, London. http://www.cbi.org.uk/media/955604/2011.05-healthy_returns_-_absence_and_workplace_health_survey_2011.pdf CBI (2013) Fit for purpose: Absence and workplace health survey 2013. Confederation of British Industry, London. http://www.cbi.org.uk/media/2150120/cbi-pfizer_absence___workplace_health_2013.pdf Concawe (2012) Evaluating the Value of a Life Year (VOLY). Concawe Review, 21/2, 13-15. https://www.concawe.eu/DocShareNoFrame/docs/1/FJNDLCHBNLPNDCMBONJBDKML5CIT3G5C5JPYP3PDW69D/CEnet/docs/DLS/CONCAWE_CR212-2013-00753-01-E.pdf. Concawe (2013a) Concentration response functions for morbidity endpoints under the project HRAPIE. Concawe, The oil companies' European association for environment, health and safety in refining and distribution. https://www.concawe.eu/content/default.asp?PageID=580&DocID=43272 Concawe (2013b) CONCAWE Comments on the Key Submissions Associated with 5th Stakeholder Expert Group of the Air Quality Policy Review held in Brussels, 3rd April 2013. Cost Benefit Analysis under the Microscope. Concawe, The oil companies' European association for environment, health and safety in refining and distribution. https://www.concawe.eu/content/default.asp?PageID=580&DocID=43615 Dal Negro R, Rossi A, Cerveri I. (2003) The burden of COPD in Italy: results from the Confronting COPD survey. Respir Med. Mar;97 Suppl C:S43-50. Desaigues, B., et al (2011) Economic valuation of air pollution mortality: A 9-country contingent valuation survey of value of a life year (VOLY). Ecological Indicators 11 (2011) 902–910.
Dickie, M. and Ulery, V.L. (2001), “Valuing Health in the Household: Are Kids Worth More Than Parents?”, Paper presented at the Association of Environmental and Resource Economists 2001 Workshop: “Assessing and Managing Environmental and Public Health Risks”, June.
EC (2013a) Proposal for a Directive of the European Parliament and of the Council on the reduction of national emissions of certain atmospheric pollutants and amending Directive 2003/35/EC. European Commission (EC), Brussels, Belgium
EC (2013b) Impact Assessment accompanying the documents Communication from the Commission to the Council, the European Parliament, the European Economic and Social Committee and the Committee of the Regions -a Clean Air Programme for Europe. European Commission (EC), Brussels, Belgium
ExternE (1995) Volume 2: methodology. ExternE: Externalities of Energy. http://www.externe.info/externe_d7/?q=node/37.
ExternE (1999) DGXII (JOULE Programme) Externalities of Energy, ExternE Project, Report Number 7, Methodology: Update 1998. Holland, M.R. and Forster, D. (eds.).
ExternE (2005) Methodology, 2005 update. ExternE: Externalities of Energy. http://www.externe.info/externe_d7/?q=node/30.
Hoek G, Brunekreef B (1995). Effect of photochemical air pollution on acute respiratory symptoms in children. American Journal of Respiratory and Critical Care Medicine, 151(1):27–32.
CBA for the Clean Air Policy Package
39
Hoek G et al. (2012). PM10, and children’s respiratory symptoms and lung function in the PATY study. European Respiratory Journal, 40(3):538–547. Holland, M.R., Forster, D. and King, K. (1999) Cost-Benefit Analysis for the Protocol to Abate Acidification, Eutrophication and Ground Level Ozone in Europe. Report Number: Air and Energy 133, Ministry of Housing, Spatial Planning and Environment (MVROM), Directorate Air and Energy, ipc 640, P.O. Box 30945, 2500 GX The Hague, The Netherlands. Holland, M. and King, K. (1998) Economic Evaluation of Air Quality Targets for Tropospheric Ozone. Part C: Economic Benefit Assessment. http://ec.europa.eu/environment/enveco/air/pdf/tropozone-c.pdf Holland, M., Hunt, A., Hurley, F., Navrud, S., Watkiss, P. (2005a) Methodology for the Cost-Benefit analysis for CAFE: Volume 1: Overview of Methodology. http://www.cafe-cba.org/assets/volume_1_methodology_overview_02-05.pdf Holland, M., Hurley, F., Hunt, A. and Watkiss, P. (2005b) Methodology for the Cost-Benefit analysis for CAFE: Volume 3: Uncertainty in the CAFE CBA. Available at: http://www.cafe-cba.org/assets/volume_3_methodology_05-05.pdf Holland, M., Wagner, A., Hurley, F., Miller, B. and Hunt, A. (2011) Cost Benefit Analysis for the Revision of the National Emission Ceilings Directive: Policy Options for revisions to the Gothenburg Protocol to the UNECE Convention on Long-Range Transboundary Air Pollution. http://ec.europa.eu/environment/air/pollutants/pdf/Gothenburg%20CBA1%20final%202011.pdf Holland, M. (2012) Cost-benefit Analysis of Scenarios for Cost-Effective Emission Controls after 2020, Version 1, Corresponding to IIASA TSAP Report #7. November 2012. Holland, M. (2013a) Cost-benefit Analysis of Scenarios for Cost-Effective Emission Controls after 2020, Version 1, Corresponding to IIASA TSAP Report #10. March 2013. Holland, M. Pye, S., Jones, G., Hunt, A. and Markandya, A. (2013b) EC4MACS Modelling Methodology: The ALPHA Benefit Assessment Model. http://www.ec4macs.eu/content/report/EC4MACS_Publications/MR_Final%20in%20pdf/Alpha_Methodologies_Final.pdf. HRAPIE (see WHO, 2013b) Hunt, A., Navrud, S., Maca, V. and Scasny, M. (2011) Monetary values for health end-points used in the HEIMTSA/INTARESE Common Case Study. Thematic Priority 6.3, Deliverable 4.1.2. HEIMTSA (Health and Environment Integrated Methodology and Toolbox for Scenario Development. Sixth Framework Programme of the European Commission. http://www.heimtsa.eu/LinkClick.aspx?fileticket=Z79uJ1ZKuX8%3d&tabid=2937&mid=6403&language=en-GB. Hurley, F., Cowie, H., Hunt, A., Holland, M., Miller, B., Pye, S., Watkiss, P. (2005) Methodology for the Cost-Benefit analysis for CAFE: Volume 2: Health Impact Assessment. Available at: http://www.cafe-cba.org/assets/volume_2_methodology_overview_02-05.pdf Izquierdo, J.L. (2003) The burden of COPD in Spain: results from the Confronting COPD survey. Respir Med. Mar;97 Suppl C:S61-9. Jerrett M, Burnett R, Pope A C, Ito K, Thurston G. (2009). Long-term ozone exposure and mortality. N Engl J Med 360 (11) 1085-1095.
CBA for the Clean Air Policy Package
40
Krupnick, A., Ostro, B. and Bull, K. (2005) Peer review of the methodology of cost-benefit analysis of the Clean Air For Europe Programme. http://www.cafe-cba.org/assets/cafe_peer_review.pdf Miller, B., Hurley, J.F. and Shafrir, A. (2011) Health Impact Assessment for the National Emissions Ceiling Directive (NECD) – Methodological Issues http://ec.europa.eu/environment/air/pollutants/pdf/IOM%20Report%20methodology%20NECD%20HIA.pdf Mills, G. and Harmens, H. (Eds.) (2011) Ozone Pollution: A hidden threat to food security. http://icpvegetation.ceh.ac.uk/publications/documents/ozoneandfoodsecurity-ICPVegetationreport%202011-published.pdf Netten, A. and Curtis, L. (2000) Unit costs of Health and Social Care 2000. Personal Social Services Research Unit (PSSRU). http://www.pssru.ac.uk/index.htm. OECD (2006) Economic Valuation of Environmental Health Risks to Children. OECD, Paris. OECD (2012) Mortality Risk Valuation in Environment, Health and Transport Policies. OECD, Paris. Ostro BD (1987). Air pollution and morbidity revisited: a specification test. Journal of Environmental Economics Management, 14(1):87–98. Ostro BD, Rothschild S (1989). Air pollution and acute respiratory morbidity: an observational study of multiple pollutants. Environmental Research, 50:238–247. Piperno D, Huchon G, Pribil C, Boucot I, Similowski T. (2003) The burden of COPD in France: results from the Confronting COPD survey. Respir Med. Mar;97 Suppl C:S33-42. REVIHAAP (see WHO, 2013a) Schindler C et al. (2009). Improvements in PM10 exposure and reduced rates of respiratory symptoms in a cohort of Swiss adults (SAPALDIA). American Journal of Respiratory and Critical Care Medicine, 179(7):579–587. Stieb DM et al. (2002). Air pollution and disability days in Toronto: results from the national population health survey. Environmental Research, 89(3):210–221. Ward DJ, Ayres JG (2004). Particulate air pollution and panel studies in children: a systematic review. Occupational and Environmental Medicine, 61(4):e13. USEPA (2011) The Benefits and Costs of the Clean Air Act from 1990 to 2020. Final Report – Rev. A. U.S. Environmental Protection Agency, Office of Air and Radiation. http://www.epa.gov/air/sect812/feb11/fullreport_rev_a.pdf. WHO (2013a) REVIHAAP: Review of evidence on health aspects of air pollution – REVIHAAP project: final technical report. World Health Organization, Regional Office for Europe, Bonn, Germany. http://www.euro.who.int/en/health-topics/environment-and-health/air-quality/publications/2013/review-of-evidence-on-health-aspects-of-air-pollution-revihaap-project-final-technical-report. WHO (2013b) HRAPIE: Health risks of air pollution in Europe – HRAPIE project Recommendations for concentration–response functions for cost–benefit analysis of particulate matter, ozone and nitrogen dioxide. World Health Organization, Regional Office for Europe, Bonn, Germany. http://www.euro.who.int/en/health-topics/environment-and-health/air-
CBA for the Clean Air Policy Package
41
quality/publications/2013/health-risks-of-air-pollution-in-europe-hrapie-project-recommendations-for-concentrationresponse-functions-for-costbenefit-analysis-of-particulate-matter,-ozone-and-nitrogen-dioxide. WHO databases. Copenhagen, WHO Regional Office for Europe.
European mortality database (MDB): http://data.euro.who.int/hfamdb/ European detailed mortality database: http://data.euro.who.int/dmdb/ European health for all database: http://data.euro.who.int/hfadb/ European hospital morbidity database: http://www.euro.who.int/en/what-we-do/data-and-evidence/databases/european-hospital-morbidity-database-hmdb2
Wouters, E.F. (2003) The burden of COPD in The Netherlands: results from the Confronting COPD survey. Respir Med. Mar;97 Suppl C:S51-9.
CBA for the Clean Air Policy Package
42
Appendix 1: Response to Stakeholder Comments In the course of this work, written comments were received from concawe (2013a, b) addressing the response functions used for health impact analysis and associated valuation respectively. This appendix provides a response to those comments. Concawe (2013a) raises a number of questions about the inclusion of chronic bronchitis as an endpoint in the CBA from review of the methods adopted under the Clean Air For Europe (CAFE) Programme, concerning:
Attribution of the impact to the fine particle fraction
Conversion of exposure metrics to PM2.5
Use of a single study (Abbey et al, 1995a) [though this overlooks the fact that this study considered also Abbey et al, 1995b, but took the lower risk factor from Abbey et al, 1995a]
The lack of statistical significance of Abbey et al (1995a) at the 5% level
The use of data from California during the period of 1966-1988
The lack of adjustment of the baseline disease rate from US data These criticisms are broadly rejected by the HRAPIE report. Indeed, the function recommended by HRAPIE based on Abbey et al (1995b) indicates a higher risk than was previously considered under the CAFE Programme. However, it is still more conservative than the function derived from the European SAPALDIA study reported by Schindler et al (2009). The incidence rate reported by SAPALDIA was very similar to that of Abbey et al (3.9 cases per 1000 adults at risk vs. 3.78 cases). Concawe also raised a number of similar questions about the inclusion of RADs in the CBA. These concerned:
Attribution of impacts to fine PM
The adjustment of an ERF for PM10 to one based on PM2.5
Assessment of these endpoints being based on the results of a single, study, the Health Interview Study, as reported by Ostro et al (1987) and Ostro and Rothschild (1989)
The potential for socioeconomic confounding
The RAD background rate being taken from a U.S. study As for chronic bronchitis, these issues are broadly addressed in the HRAPIE report. For example, it is acknowledged that the literature in this area of research is limited. However, it is wrong to say that the assessment is based on a single study as there is a wider literature demonstrating association between minor symptoms and air pollution (e.g. Hoek and Brunekreef, 1995; Ward and Ayres, 2004); the study used as the basis for quantification is considered representative of the wider literature. Further to this, it is illogical to consider that there is a link between mortality and the air pollutants of interest here, but not a link with lesser symptoms. On the question of incidence data, rather similar rates are reported by Stieb et al (2002) for the Canadian population and by Ali et al (2010) for the UK population. If the rate reported by Ali et al were adopted on the grounds that it is European, the effect estimate for RADs would increase by 21%. Concawe (2013b) is critical of the mortality values adopted above (€57,700 / €138,700). They instead propose an approach described by concawe (2012) referred to as ‘Maximised Societal Revenue’ (MSR): “If a single value is adopted to describe such WTP surveys, then MSR is a more robust approach as it respects individual expressions of WTP of all respondents to the survey. As such it reflects the full distribution of WTP survey results and reduces the dominance of more extreme values. Disregarding the VOLY values of the NewExt study as this WTP survey was not designed to
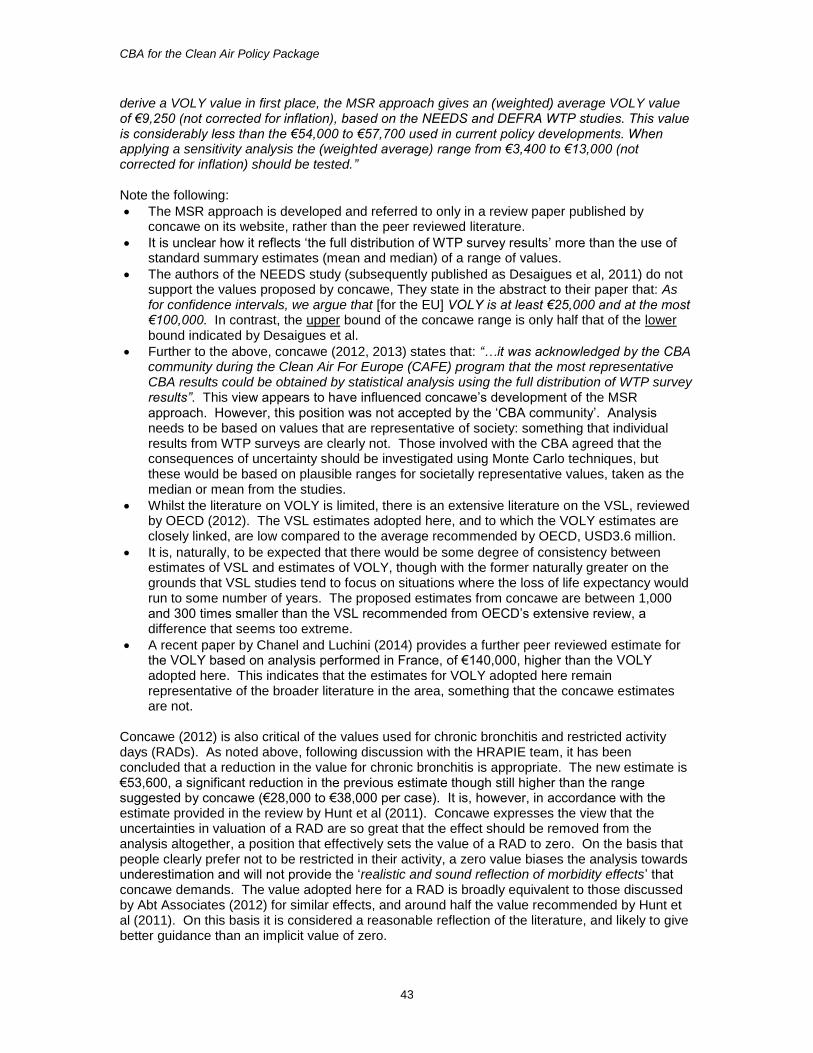
CBA for the Clean Air Policy Package
43
derive a VOLY value in first place, the MSR approach gives an (weighted) average VOLY value of €9,250 (not corrected for inflation), based on the NEEDS and DEFRA WTP studies. This value is considerably less than the €54,000 to €57,700 used in current policy developments. When applying a sensitivity analysis the (weighted average) range from €3,400 to €13,000 (not corrected for inflation) should be tested.” Note the following:
The MSR approach is developed and referred to only in a review paper published by concawe on its website, rather than the peer reviewed literature.
It is unclear how it reflects ‘the full distribution of WTP survey results’ more than the use of standard summary estimates (mean and median) of a range of values.
The authors of the NEEDS study (subsequently published as Desaigues et al, 2011) do not support the values proposed by concawe, They state in the abstract to their paper that: As for confidence intervals, we argue that [for the EU] VOLY is at least €25,000 and at the most €100,000. In contrast, the upper bound of the concawe range is only half that of the lower bound indicated by Desaigues et al.
Further to the above, concawe (2012, 2013) states that: “…it was acknowledged by the CBA community during the Clean Air For Europe (CAFE) program that the most representative CBA results could be obtained by statistical analysis using the full distribution of WTP survey results”. This view appears to have influenced concawe’s development of the MSR approach. However, this position was not accepted by the ‘CBA community’. Analysis needs to be based on values that are representative of society: something that individual results from WTP surveys are clearly not. Those involved with the CBA agreed that the consequences of uncertainty should be investigated using Monte Carlo techniques, but these would be based on plausible ranges for societally representative values, taken as the median or mean from the studies.
Whilst the literature on VOLY is limited, there is an extensive literature on the VSL, reviewed by OECD (2012). The VSL estimates adopted here, and to which the VOLY estimates are closely linked, are low compared to the average recommended by OECD, USD3.6 million.
It is, naturally, to be expected that there would be some degree of consistency between estimates of VSL and estimates of VOLY, though with the former naturally greater on the grounds that VSL studies tend to focus on situations where the loss of life expectancy would run to some number of years. The proposed estimates from concawe are between 1,000 and 300 times smaller than the VSL recommended from OECD’s extensive review, a difference that seems too extreme.
A recent paper by Chanel and Luchini (2014) provides a further peer reviewed estimate for the VOLY based on analysis performed in France, of €140,000, higher than the VOLY adopted here. This indicates that the estimates for VOLY adopted here remain representative of the broader literature in the area, something that the concawe estimates are not.
Concawe (2012) is also critical of the values used for chronic bronchitis and restricted activity days (RADs). As noted above, following discussion with the HRAPIE team, it has been concluded that a reduction in the value for chronic bronchitis is appropriate. The new estimate is €53,600, a significant reduction in the previous estimate though still higher than the range suggested by concawe (€28,000 to €38,000 per case). It is, however, in accordance with the estimate provided in the review by Hunt et al (2011). Concawe expresses the view that the uncertainties in valuation of a RAD are so great that the effect should be removed from the analysis altogether, a position that effectively sets the value of a RAD to zero. On the basis that people clearly prefer not to be restricted in their activity, a zero value biases the analysis towards underestimation and will not provide the ‘realistic and sound reflection of morbidity effects’ that concawe demands. The value adopted here for a RAD is broadly equivalent to those discussed by Abt Associates (2012) for similar effects, and around half the value recommended by Hunt et al (2011). On this basis it is considered a reasonable reflection of the literature, and likely to give better guidance than an implicit value of zero.
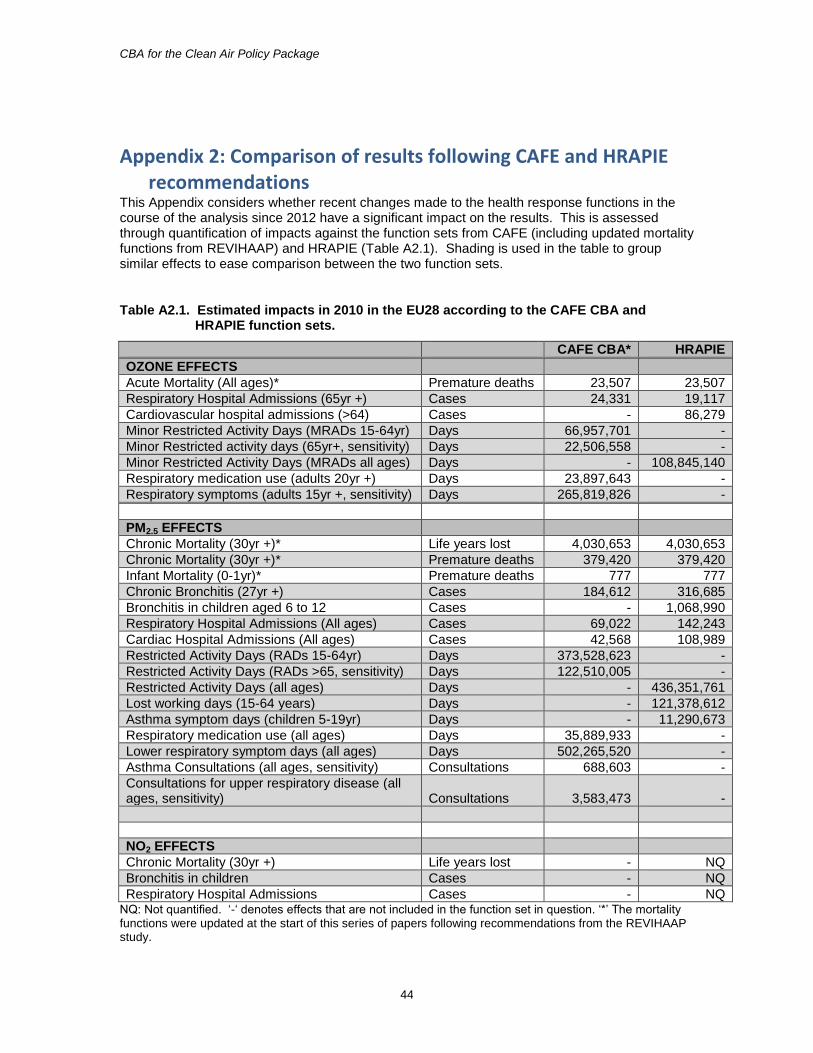
CBA for the Clean Air Policy Package
44
Appendix 2: Comparison of results following CAFE and HRAPIE recommendations
This Appendix considers whether recent changes made to the health response functions in the course of the analysis since 2012 have a significant impact on the results. This is assessed through quantification of impacts against the function sets from CAFE (including updated mortality functions from REVIHAAP) and HRAPIE (Table A2.1). Shading is used in the table to group similar effects to ease comparison between the two function sets.
Table A2.1. Estimated impacts in 2010 in the EU28 according to the CAFE CBA and HRAPIE function sets.
CAFE CBA* HRAPIE
OZONE EFFECTS
Acute Mortality (All ages)* Premature deaths 23,507 23,507
Respiratory Hospital Admissions (65yr +) Cases 24,331 19,117
Cardiovascular hospital admissions (>64) Cases - 86,279
Minor Restricted Activity Days (MRADs 15-64yr) Days 66,957,701 -
Minor Restricted activity days (65yr+, sensitivity) Days 22,506,558 -
Minor Restricted Activity Days (MRADs all ages) Days - 108,845,140
Respiratory medication use (adults 20yr +) Days 23,897,643 -
Respiratory symptoms (adults 15yr +, sensitivity) Days 265,819,826 -
PM2.5 EFFECTS
Chronic Mortality (30yr +)* Life years lost 4,030,653 4,030,653
Chronic Mortality (30yr +)* Premature deaths 379,420 379,420
Infant Mortality (0-1yr)* Premature deaths 777 777
Chronic Bronchitis (27yr +) Cases 184,612 316,685
Bronchitis in children aged 6 to 12 Cases - 1,068,990
Respiratory Hospital Admissions (All ages) Cases 69,022 142,243
Cardiac Hospital Admissions (All ages) Cases 42,568 108,989
Restricted Activity Days (RADs 15-64yr) Days 373,528,623 -
Restricted Activity Days (RADs >65, sensitivity) Days 122,510,005 -
Restricted Activity Days (all ages) Days - 436,351,761
Lost working days (15-64 years) Days - 121,378,612
Asthma symptom days (children 5-19yr) Days - 11,290,673
Respiratory medication use (all ages) Days 35,889,933 -
Lower respiratory symptom days (all ages) Days 502,265,520 -
Asthma Consultations (all ages, sensitivity) Consultations 688,603 -
Consultations for upper respiratory disease (all ages, sensitivity) Consultations 3,583,473 -
NO2 EFFECTS
Chronic Mortality (30yr +) Life years lost - NQ
Bronchitis in children Cases - NQ
Respiratory Hospital Admissions Cases - NQ NQ: Not quantified. ‘-‘ denotes effects that are not included in the function set in question. ‘*’ The mortality functions were updated at the start of this series of papers following recommendations from the REVIHAAP study.
CBA for the Clean Air Policy Package
45
For mortality, results are the same in both cases, given that functions were updated at the outset of this work in line with the REVIHAAP recommendations. These made only a small difference to the estimated mortality impact for both ozone and PM2.5. For ozone, we see a significant increase in the estimated number of hospital admissions through the inclusion of cardiovascular hospital admissions. The total number of MRADs is higher in HRAPIE through extension of application of the function to all ages. The omission of respiratory symptoms appears a significant difference, but under CAFE it was only included for sensitivity. For PM2.5 there is an increase in estimated incidence of bronchitis in both adults and children when moving to the HRAPIE functions (though this is reversed in the valuation, see below, given changes to the unit value applied). There is a significant increase in estimates of both respiratory and cardiovascular hospital admissions under HRAPIE. There is also an increase in the number of RADs under HRAPIE, through extension of the RAD function to all ages. Respiratory medication use and lower respiratory symptom days are not included in HRAPIE, neither are the two sensitivity functions for consultations. For NO2, none of the effects recommended for quantification under HRAPIE have been assessed for reasons described above. The effect of these changes in response functions and changes in valuations are shown in Table A2.2. Overall there is a 5% fall in damage for the new function set at the lower end of the range and a 4% fall at the upper end (including CAFE sensitivity functions). This is, however, a conservative view on the HRAPIE position given the lack of quantification to date for the NO2 functions, and the omission here of effects of long-term exposure to ozone on mortality. The conclusion, therefore, is that results derived using the CAFE functions and valuations provided very similar guidance through the CBA to the updated function/valuation dataset.
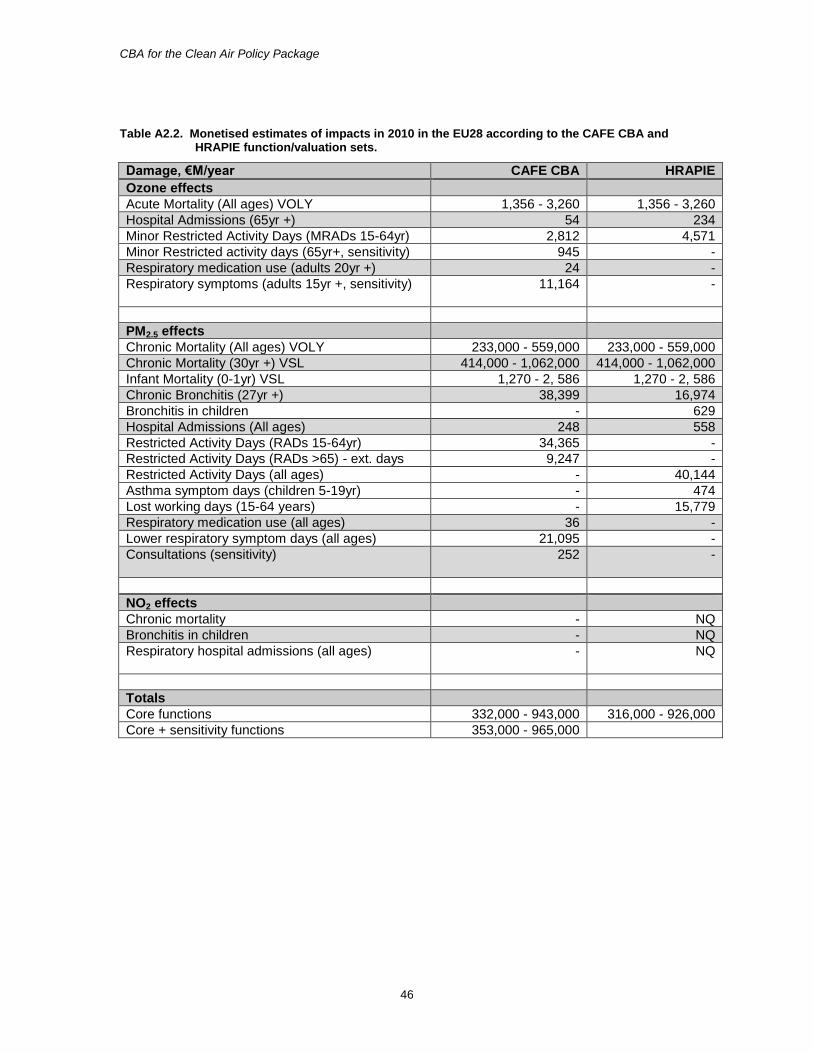
CBA for the Clean Air Policy Package
46
Table A2.2. Monetised estimates of impacts in 2010 in the EU28 according to the CAFE CBA and HRAPIE function/valuation sets.
Damage, €M/year CAFE CBA HRAPIE
Ozone effects
Acute Mortality (All ages) VOLY 1,356 - 3,260 1,356 - 3,260
Hospital Admissions (65yr +) 54 234
Minor Restricted Activity Days (MRADs 15-64yr) 2,812 4,571
Minor Restricted activity days (65yr+, sensitivity) 945 -
Respiratory medication use (adults 20yr +) 24 -
Respiratory symptoms (adults 15yr +, sensitivity)
11,164 -
PM2.5 effects
Chronic Mortality (All ages) VOLY 233,000 - 559,000 233,000 - 559,000
Chronic Mortality (30yr +) VSL 414,000 - 1,062,000 414,000 - 1,062,000
Infant Mortality (0-1yr) VSL 1,270 - 2, 586 1,270 - 2, 586
Chronic Bronchitis (27yr +) 38,399 16,974
Bronchitis in children - 629
Hospital Admissions (All ages) 248 558
Restricted Activity Days (RADs 15-64yr) 34,365 -
Restricted Activity Days (RADs >65) - ext. days 9,247 -
Restricted Activity Days (all ages) - 40,144
Asthma symptom days (children 5-19yr) - 474
Lost working days (15-64 years) - 15,779
Respiratory medication use (all ages) 36 -
Lower respiratory symptom days (all ages) 21,095 -
Consultations (sensitivity)
252 -
NO2 effects
Chronic mortality - NQ
Bronchitis in children - NQ
Respiratory hospital admissions (all ages)
- NQ
Totals
Core functions 332,000 - 943,000 316,000 - 926,000
Core + sensitivity functions 353,000 - 965,000
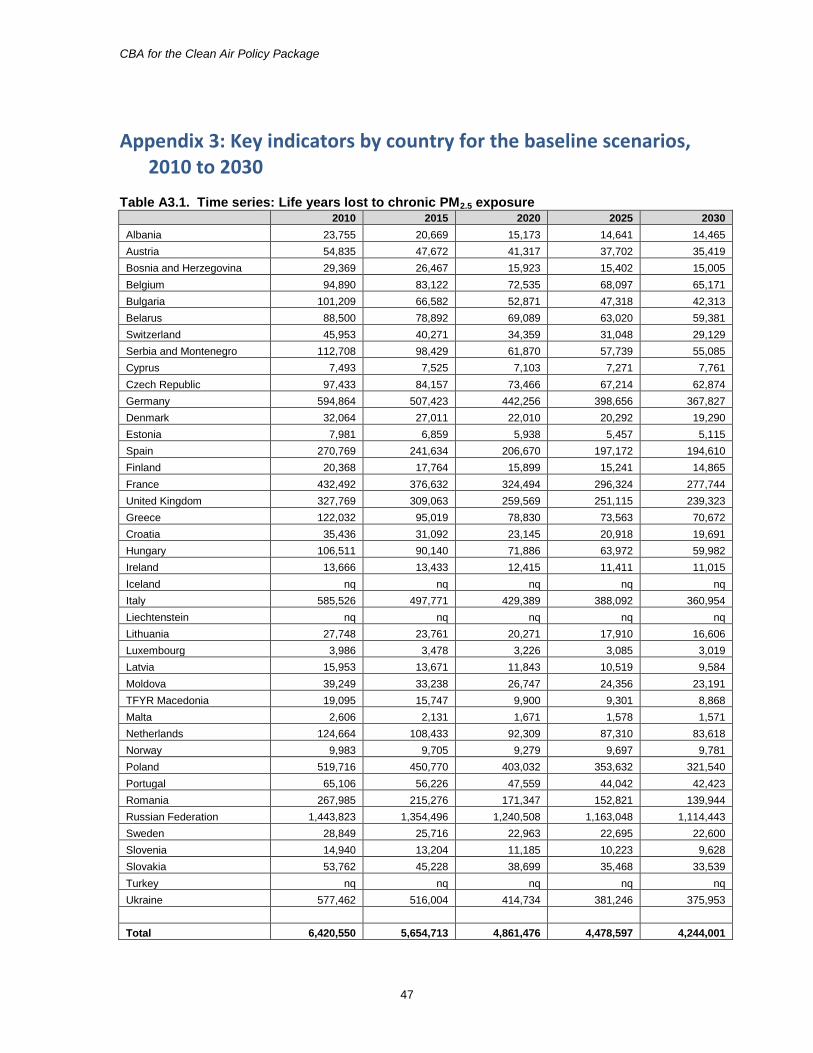
CBA for the Clean Air Policy Package
47
Appendix 3: Key indicators by country for the baseline scenarios, 2010 to 2030
Table A3.1. Time series: Life years lost to chronic PM2.5 exposure 2010 2015 2020 2025 2030
Albania 23,755 20,669 15,173 14,641 14,465
Austria 54,835 47,672 41,317 37,702 35,419
Bosnia and Herzegovina 29,369 26,467 15,923 15,402 15,005
Belgium 94,890 83,122 72,535 68,097 65,171
Bulgaria 101,209 66,582 52,871 47,318 42,313
Belarus 88,500 78,892 69,089 63,020 59,381
Switzerland 45,953 40,271 34,359 31,048 29,129
Serbia and Montenegro 112,708 98,429 61,870 57,739 55,085
Cyprus 7,493 7,525 7,103 7,271 7,761
Czech Republic 97,433 84,157 73,466 67,214 62,874
Germany 594,864 507,423 442,256 398,656 367,827
Denmark 32,064 27,011 22,010 20,292 19,290
Estonia 7,981 6,859 5,938 5,457 5,115
Spain 270,769 241,634 206,670 197,172 194,610
Finland 20,368 17,764 15,899 15,241 14,865
France 432,492 376,632 324,494 296,324 277,744
United Kingdom 327,769 309,063 259,569 251,115 239,323
Greece 122,032 95,019 78,830 73,563 70,672
Croatia 35,436 31,092 23,145 20,918 19,691
Hungary 106,511 90,140 71,886 63,972 59,982
Ireland 13,666 13,433 12,415 11,411 11,015
Iceland nq nq nq nq nq
Italy 585,526 497,771 429,389 388,092 360,954
Liechtenstein nq nq nq nq nq
Lithuania 27,748 23,761 20,271 17,910 16,606
Luxembourg 3,986 3,478 3,226 3,085 3,019
Latvia 15,953 13,671 11,843 10,519 9,584
Moldova 39,249 33,238 26,747 24,356 23,191
TFYR Macedonia 19,095 15,747 9,900 9,301 8,868
Malta 2,606 2,131 1,671 1,578 1,571
Netherlands 124,664 108,433 92,309 87,310 83,618
Norway 9,983 9,705 9,279 9,697 9,781
Poland 519,716 450,770 403,032 353,632 321,540
Portugal 65,106 56,226 47,559 44,042 42,423
Romania 267,985 215,276 171,347 152,821 139,944
Russian Federation 1,443,823 1,354,496 1,240,508 1,163,048 1,114,443
Sweden 28,849 25,716 22,963 22,695 22,600
Slovenia 14,940 13,204 11,185 10,223 9,628
Slovakia 53,762 45,228 38,699 35,468 33,539
Turkey nq nq nq nq nq
Ukraine 577,462 516,004 414,734 381,246 375,953
Total 6,420,550 5,654,713 4,861,476 4,478,597 4,244,001
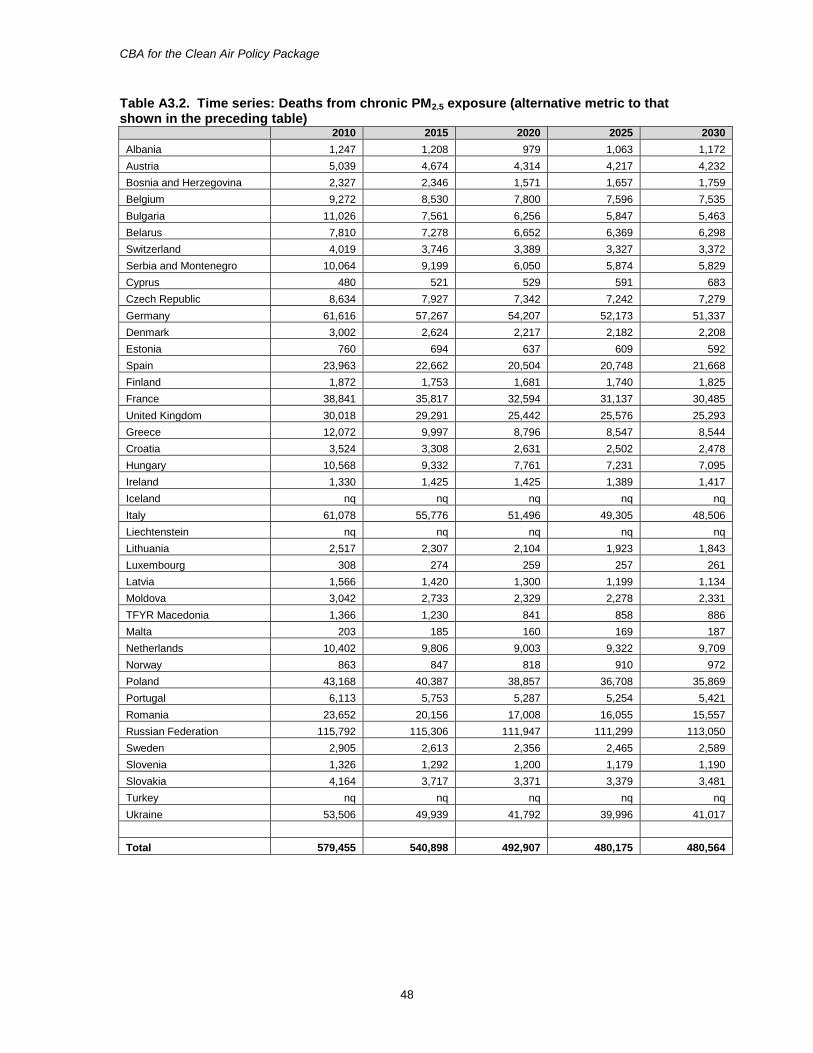
CBA for the Clean Air Policy Package
48
Table A3.2. Time series: Deaths from chronic PM2.5 exposure (alternative metric to that shown in the preceding table)
2010 2015 2020 2025 2030
Albania 1,247 1,208 979 1,063 1,172
Austria 5,039 4,674 4,314 4,217 4,232
Bosnia and Herzegovina 2,327 2,346 1,571 1,657 1,759
Belgium 9,272 8,530 7,800 7,596 7,535
Bulgaria 11,026 7,561 6,256 5,847 5,463
Belarus 7,810 7,278 6,652 6,369 6,298
Switzerland 4,019 3,746 3,389 3,327 3,372
Serbia and Montenegro 10,064 9,199 6,050 5,874 5,829
Cyprus 480 521 529 591 683
Czech Republic 8,634 7,927 7,342 7,242 7,279
Germany 61,616 57,267 54,207 52,173 51,337
Denmark 3,002 2,624 2,217 2,182 2,208
Estonia 760 694 637 609 592
Spain 23,963 22,662 20,504 20,748 21,668
Finland 1,872 1,753 1,681 1,740 1,825
France 38,841 35,817 32,594 31,137 30,485
United Kingdom 30,018 29,291 25,442 25,576 25,293
Greece 12,072 9,997 8,796 8,547 8,544
Croatia 3,524 3,308 2,631 2,502 2,478
Hungary 10,568 9,332 7,761 7,231 7,095
Ireland 1,330 1,425 1,425 1,389 1,417
Iceland nq nq nq nq nq
Italy 61,078 55,776 51,496 49,305 48,506
Liechtenstein nq nq nq nq nq
Lithuania 2,517 2,307 2,104 1,923 1,843
Luxembourg 308 274 259 257 261
Latvia 1,566 1,420 1,300 1,199 1,134
Moldova 3,042 2,733 2,329 2,278 2,331
TFYR Macedonia 1,366 1,230 841 858 886
Malta 203 185 160 169 187
Netherlands 10,402 9,806 9,003 9,322 9,709
Norway 863 847 818 910 972
Poland 43,168 40,387 38,857 36,708 35,869
Portugal 6,113 5,753 5,287 5,254 5,421
Romania 23,652 20,156 17,008 16,055 15,557
Russian Federation 115,792 115,306 111,947 111,299 113,050
Sweden 2,905 2,613 2,356 2,465 2,589
Slovenia 1,326 1,292 1,200 1,179 1,190
Slovakia 4,164 3,717 3,371 3,379 3,481
Turkey nq nq nq nq nq
Ukraine 53,506 49,939 41,792 39,996 41,017
Total 579,455 540,898 492,907 480,175 480,564
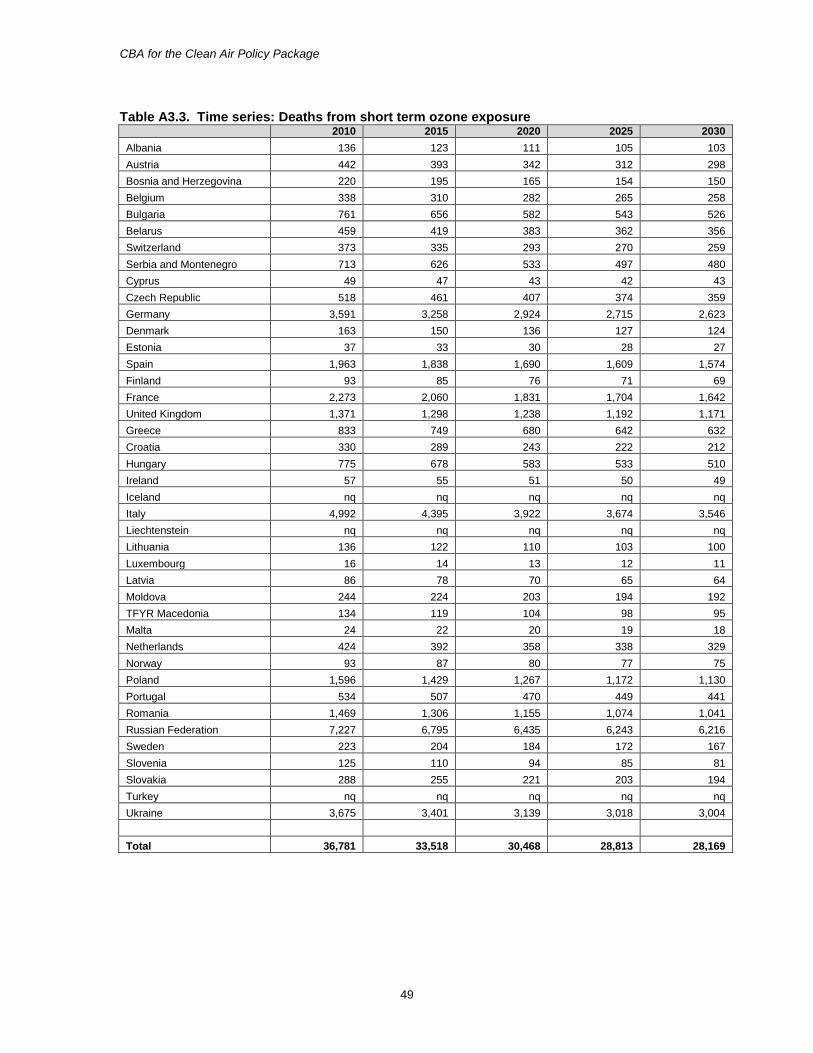
CBA for the Clean Air Policy Package
49
Table A3.3. Time series: Deaths from short term ozone exposure 2010 2015 2020 2025 2030
Albania 136 123 111 105 103
Austria 442 393 342 312 298
Bosnia and Herzegovina 220 195 165 154 150
Belgium 338 310 282 265 258
Bulgaria 761 656 582 543 526
Belarus 459 419 383 362 356
Switzerland 373 335 293 270 259
Serbia and Montenegro 713 626 533 497 480
Cyprus 49 47 43 42 43
Czech Republic 518 461 407 374 359
Germany 3,591 3,258 2,924 2,715 2,623
Denmark 163 150 136 127 124
Estonia 37 33 30 28 27
Spain 1,963 1,838 1,690 1,609 1,574
Finland 93 85 76 71 69
France 2,273 2,060 1,831 1,704 1,642
United Kingdom 1,371 1,298 1,238 1,192 1,171
Greece 833 749 680 642 632
Croatia 330 289 243 222 212
Hungary 775 678 583 533 510
Ireland 57 55 51 50 49
Iceland nq nq nq nq nq
Italy 4,992 4,395 3,922 3,674 3,546
Liechtenstein nq nq nq nq nq
Lithuania 136 122 110 103 100
Luxembourg 16 14 13 12 11
Latvia 86 78 70 65 64
Moldova 244 224 203 194 192
TFYR Macedonia 134 119 104 98 95
Malta 24 22 20 19 18
Netherlands 424 392 358 338 329
Norway 93 87 80 77 75
Poland 1,596 1,429 1,267 1,172 1,130
Portugal 534 507 470 449 441
Romania 1,469 1,306 1,155 1,074 1,041
Russian Federation 7,227 6,795 6,435 6,243 6,216
Sweden 223 204 184 172 167
Slovenia 125 110 94 85 81
Slovakia 288 255 221 203 194
Turkey nq nq nq nq nq
Ukraine 3,675 3,401 3,139 3,018 3,004
Total 36,781 33,518 30,468 28,813 28,169
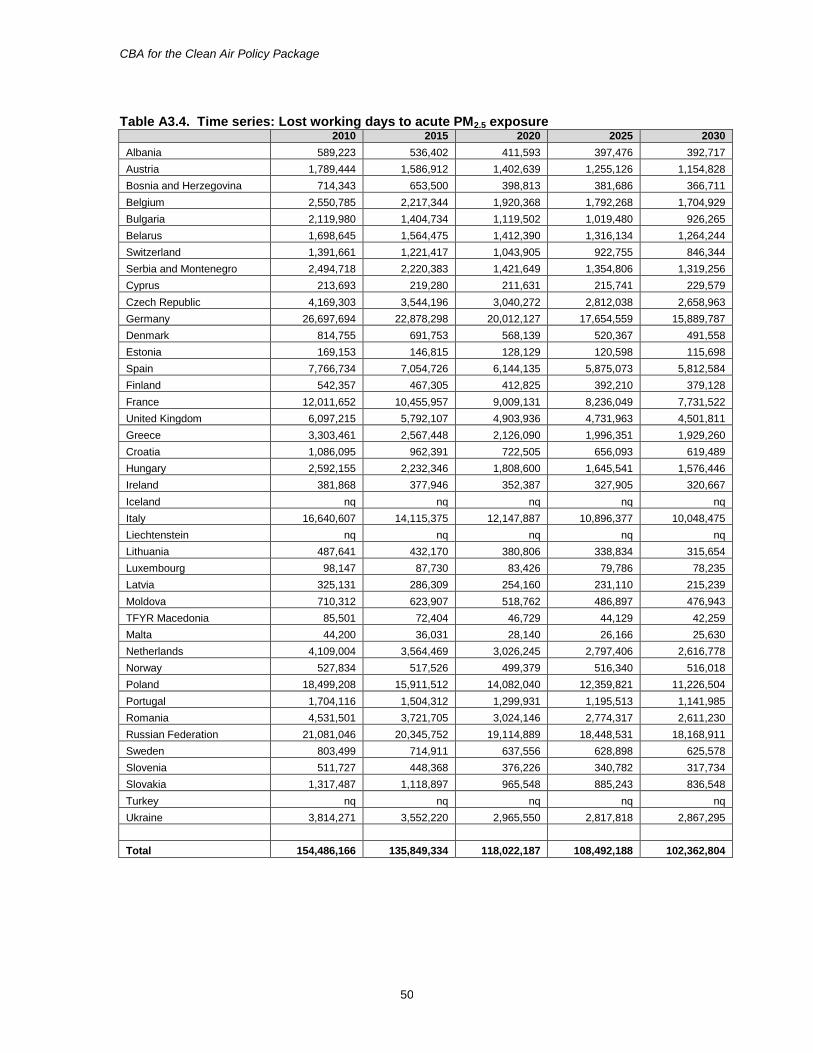
CBA for the Clean Air Policy Package
50
Table A3.4. Time series: Lost working days to acute PM2.5 exposure
2010 2015 2020 2025 2030
Albania 589,223 536,402 411,593 397,476 392,717
Austria 1,789,444 1,586,912 1,402,639 1,255,126 1,154,828
Bosnia and Herzegovina 714,343 653,500 398,813 381,686 366,711
Belgium 2,550,785 2,217,344 1,920,368 1,792,268 1,704,929
Bulgaria 2,119,980 1,404,734 1,119,502 1,019,480 926,265
Belarus 1,698,645 1,564,475 1,412,390 1,316,134 1,264,244
Switzerland 1,391,661 1,221,417 1,043,905 922,755 846,344
Serbia and Montenegro 2,494,718 2,220,383 1,421,649 1,354,806 1,319,256
Cyprus 213,693 219,280 211,631 215,741 229,579
Czech Republic 4,169,303 3,544,196 3,040,272 2,812,038 2,658,963
Germany 26,697,694 22,878,298 20,012,127 17,654,559 15,889,787
Denmark 814,755 691,753 568,139 520,367 491,558
Estonia 169,153 146,815 128,129 120,598 115,698
Spain 7,766,734 7,054,726 6,144,135 5,875,073 5,812,584
Finland 542,357 467,305 412,825 392,210 379,128
France 12,011,652 10,455,957 9,009,131 8,236,049 7,731,522
United Kingdom 6,097,215 5,792,107 4,903,936 4,731,963 4,501,811
Greece 3,303,461 2,567,448 2,126,090 1,996,351 1,929,260
Croatia 1,086,095 962,391 722,505 656,093 619,489
Hungary 2,592,155 2,232,346 1,808,600 1,645,541 1,576,446
Ireland 381,868 377,946 352,387 327,905 320,667
Iceland nq nq nq nq nq
Italy 16,640,607 14,115,375 12,147,887 10,896,377 10,048,475
Liechtenstein nq nq nq nq nq
Lithuania 487,641 432,170 380,806 338,834 315,654
Luxembourg 98,147 87,730 83,426 79,786 78,235
Latvia 325,131 286,309 254,160 231,110 215,239
Moldova 710,312 623,907 518,762 486,897 476,943
TFYR Macedonia 85,501 72,404 46,729 44,129 42,259
Malta 44,200 36,031 28,140 26,166 25,630
Netherlands 4,109,004 3,564,469 3,026,245 2,797,406 2,616,778
Norway 527,834 517,526 499,379 516,340 516,018
Poland 18,499,208 15,911,512 14,082,040 12,359,821 11,226,504
Portugal 1,704,116 1,504,312 1,299,931 1,195,513 1,141,985
Romania 4,531,501 3,721,705 3,024,146 2,774,317 2,611,230
Russian Federation 21,081,046 20,345,752 19,114,889 18,448,531 18,168,911
Sweden 803,499 714,911 637,556 628,898 625,578
Slovenia 511,727 448,368 376,226 340,782 317,734
Slovakia 1,317,487 1,118,897 965,548 885,243 836,548
Turkey nq nq nq nq nq
Ukraine 3,814,271 3,552,220 2,965,550 2,817,818 2,867,295
Total 154,486,166 135,849,334 118,022,187 108,492,188 102,362,804
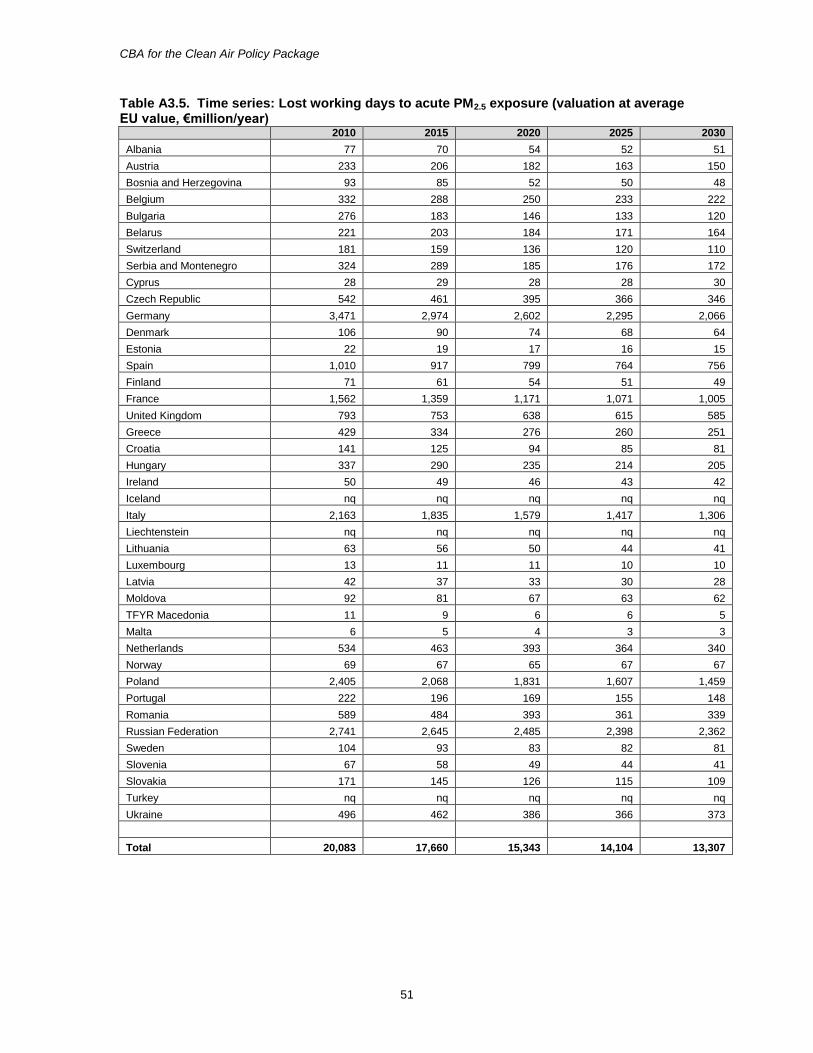
CBA for the Clean Air Policy Package
51
Table A3.5. Time series: Lost working days to acute PM2.5 exposure (valuation at average EU value, €million/year)
2010 2015 2020 2025 2030
Albania 77 70 54 52 51
Austria 233 206 182 163 150
Bosnia and Herzegovina 93 85 52 50 48
Belgium 332 288 250 233 222
Bulgaria 276 183 146 133 120
Belarus 221 203 184 171 164
Switzerland 181 159 136 120 110
Serbia and Montenegro 324 289 185 176 172
Cyprus 28 29 28 28 30
Czech Republic 542 461 395 366 346
Germany 3,471 2,974 2,602 2,295 2,066
Denmark 106 90 74 68 64
Estonia 22 19 17 16 15
Spain 1,010 917 799 764 756
Finland 71 61 54 51 49
France 1,562 1,359 1,171 1,071 1,005
United Kingdom 793 753 638 615 585
Greece 429 334 276 260 251
Croatia 141 125 94 85 81
Hungary 337 290 235 214 205
Ireland 50 49 46 43 42
Iceland nq nq nq nq nq
Italy 2,163 1,835 1,579 1,417 1,306
Liechtenstein nq nq nq nq nq
Lithuania 63 56 50 44 41
Luxembourg 13 11 11 10 10
Latvia 42 37 33 30 28
Moldova 92 81 67 63 62
TFYR Macedonia 11 9 6 6 5
Malta 6 5 4 3 3
Netherlands 534 463 393 364 340
Norway 69 67 65 67 67
Poland 2,405 2,068 1,831 1,607 1,459
Portugal 222 196 169 155 148
Romania 589 484 393 361 339
Russian Federation 2,741 2,645 2,485 2,398 2,362
Sweden 104 93 83 82 81
Slovenia 67 58 49 44 41
Slovakia 171 145 126 115 109
Turkey nq nq nq nq nq
Ukraine 496 462 386 366 373
Total 20,083 17,660 15,343 14,104 13,307
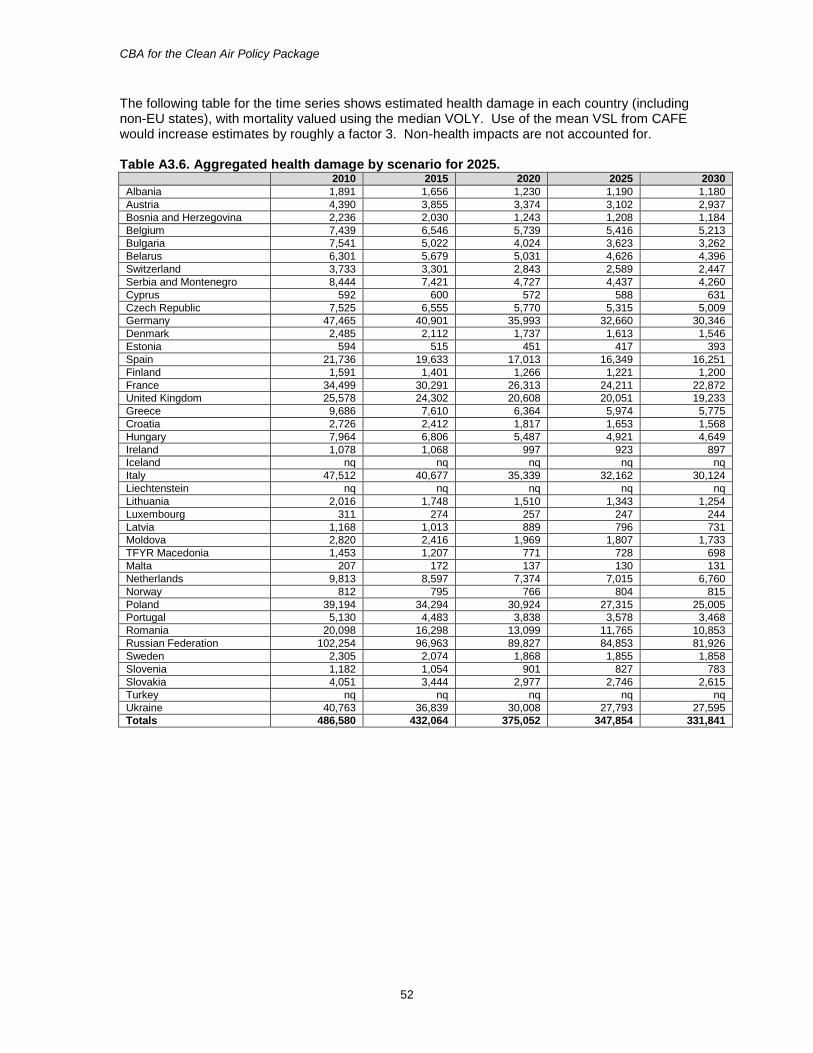
CBA for the Clean Air Policy Package
52
The following table for the time series shows estimated health damage in each country (including non-EU states), with mortality valued using the median VOLY. Use of the mean VSL from CAFE would increase estimates by roughly a factor 3. Non-health impacts are not accounted for. Table A3.6. Aggregated health damage by scenario for 2025.
2010 2015 2020 2025 2030
Albania 1,891 1,656 1,230 1,190 1,180
Austria 4,390 3,855 3,374 3,102 2,937
Bosnia and Herzegovina 2,236 2,030 1,243 1,208 1,184
Belgium 7,439 6,546 5,739 5,416 5,213
Bulgaria 7,541 5,022 4,024 3,623 3,262
Belarus 6,301 5,679 5,031 4,626 4,396
Switzerland 3,733 3,301 2,843 2,589 2,447
Serbia and Montenegro 8,444 7,421 4,727 4,437 4,260
Cyprus 592 600 572 588 631
Czech Republic 7,525 6,555 5,770 5,315 5,009
Germany 47,465 40,901 35,993 32,660 30,346
Denmark 2,485 2,112 1,737 1,613 1,546
Estonia 594 515 451 417 393
Spain 21,736 19,633 17,013 16,349 16,251
Finland 1,591 1,401 1,266 1,221 1,200
France 34,499 30,291 26,313 24,211 22,872
United Kingdom 25,578 24,302 20,608 20,051 19,233
Greece 9,686 7,610 6,364 5,974 5,775
Croatia 2,726 2,412 1,817 1,653 1,568
Hungary 7,964 6,806 5,487 4,921 4,649
Ireland 1,078 1,068 997 923 897
Iceland nq nq nq nq nq
Italy 47,512 40,677 35,339 32,162 30,124
Liechtenstein nq nq nq nq nq
Lithuania 2,016 1,748 1,510 1,343 1,254
Luxembourg 311 274 257 247 244
Latvia 1,168 1,013 889 796 731
Moldova 2,820 2,416 1,969 1,807 1,733
TFYR Macedonia 1,453 1,207 771 728 698
Malta 207 172 137 130 131
Netherlands 9,813 8,597 7,374 7,015 6,760
Norway 812 795 766 804 815
Poland 39,194 34,294 30,924 27,315 25,005
Portugal 5,130 4,483 3,838 3,578 3,468
Romania 20,098 16,298 13,099 11,765 10,853
Russian Federation 102,254 96,963 89,827 84,853 81,926
Sweden 2,305 2,074 1,868 1,855 1,858
Slovenia 1,182 1,054 901 827 783
Slovakia 4,051 3,444 2,977 2,746 2,615
Turkey nq nq nq nq nq
Ukraine 40,763 36,839 30,008 27,793 27,595
Totals 486,580 432,064 375,052 347,854 331,841
CBA for the Clean Air Policy Package
53
Appendix 4: Key health indicators by country for the Policy Scenarios, 2025 and 2030
Results are shown in this appendix by country for life years lost to chronic PM2.5 exposure, deaths linked to chronic PM2.5 exposure, deaths linked to short term ozone exposure, lost work days linked to short term PM2.5 exposure and the value of those lost work days. The first series of tables (A4.1 to A4.5) shows results for the 2025 scenarios, whilst the second set (A4.6 to A4.10) shows the results for 2030.
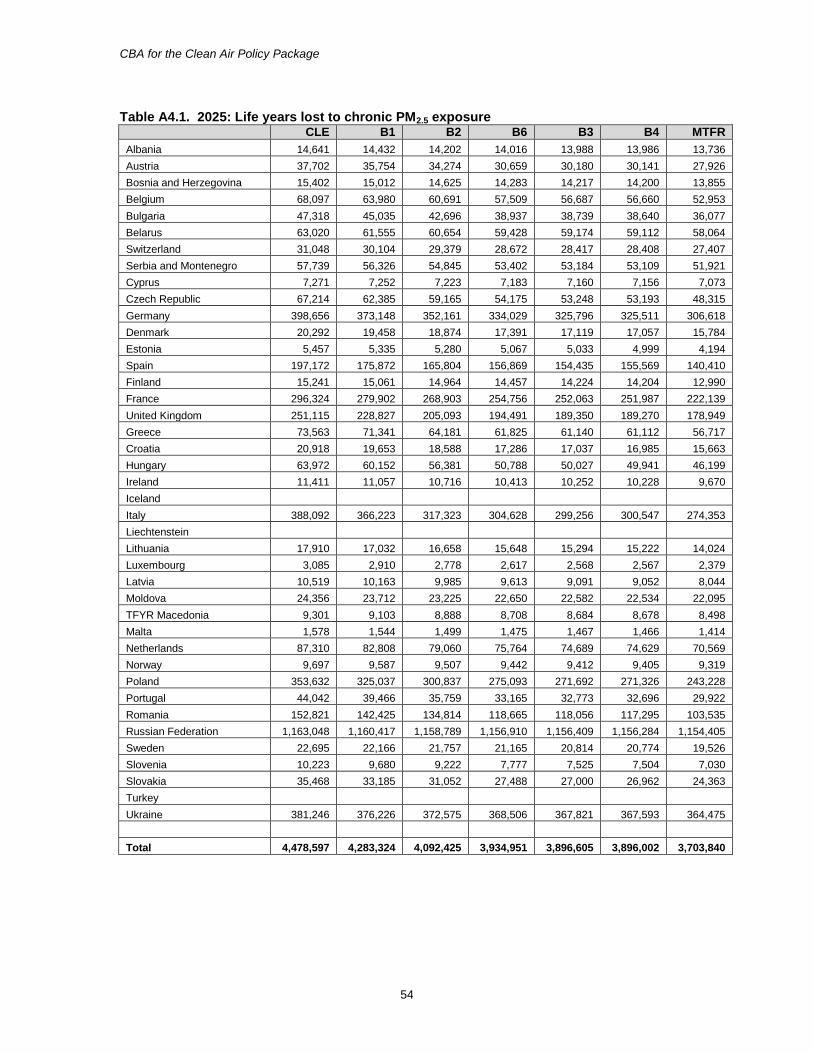
CBA for the Clean Air Policy Package
54
Table A4.1. 2025: Life years lost to chronic PM2.5 exposure CLE B1 B2 B6 B3 B4 MTFR
Albania 14,641 14,432 14,202 14,016 13,988 13,986 13,736
Austria 37,702 35,754 34,274 30,659 30,180 30,141 27,926
Bosnia and Herzegovina 15,402 15,012 14,625 14,283 14,217 14,200 13,855
Belgium 68,097 63,980 60,691 57,509 56,687 56,660 52,953
Bulgaria 47,318 45,035 42,696 38,937 38,739 38,640 36,077
Belarus 63,020 61,555 60,654 59,428 59,174 59,112 58,064
Switzerland 31,048 30,104 29,379 28,672 28,417 28,408 27,407
Serbia and Montenegro 57,739 56,326 54,845 53,402 53,184 53,109 51,921
Cyprus 7,271 7,252 7,223 7,183 7,160 7,156 7,073
Czech Republic 67,214 62,385 59,165 54,175 53,248 53,193 48,315
Germany 398,656 373,148 352,161 334,029 325,796 325,511 306,618
Denmark 20,292 19,458 18,874 17,391 17,119 17,057 15,784
Estonia 5,457 5,335 5,280 5,067 5,033 4,999 4,194
Spain 197,172 175,872 165,804 156,869 154,435 155,569 140,410
Finland 15,241 15,061 14,964 14,457 14,224 14,204 12,990
France 296,324 279,902 268,903 254,756 252,063 251,987 222,139
United Kingdom 251,115 228,827 205,093 194,491 189,350 189,270 178,949
Greece 73,563 71,341 64,181 61,825 61,140 61,112 56,717
Croatia 20,918 19,653 18,588 17,286 17,037 16,985 15,663
Hungary 63,972 60,152 56,381 50,788 50,027 49,941 46,199
Ireland 11,411 11,057 10,716 10,413 10,252 10,228 9,670
Iceland
Italy 388,092 366,223 317,323 304,628 299,256 300,547 274,353
Liechtenstein
Lithuania 17,910 17,032 16,658 15,648 15,294 15,222 14,024
Luxembourg 3,085 2,910 2,778 2,617 2,568 2,567 2,379
Latvia 10,519 10,163 9,985 9,613 9,091 9,052 8,044
Moldova 24,356 23,712 23,225 22,650 22,582 22,534 22,095
TFYR Macedonia 9,301 9,103 8,888 8,708 8,684 8,678 8,498
Malta 1,578 1,544 1,499 1,475 1,467 1,466 1,414
Netherlands 87,310 82,808 79,060 75,764 74,689 74,629 70,569
Norway 9,697 9,587 9,507 9,442 9,412 9,405 9,319
Poland 353,632 325,037 300,837 275,093 271,692 271,326 243,228
Portugal 44,042 39,466 35,759 33,165 32,773 32,696 29,922
Romania 152,821 142,425 134,814 118,665 118,056 117,295 103,535
Russian Federation 1,163,048 1,160,417 1,158,789 1,156,910 1,156,409 1,156,284 1,154,405
Sweden 22,695 22,166 21,757 21,165 20,814 20,774 19,526
Slovenia 10,223 9,680 9,222 7,777 7,525 7,504 7,030
Slovakia 35,468 33,185 31,052 27,488 27,000 26,962 24,363
Turkey
Ukraine 381,246 376,226 372,575 368,506 367,821 367,593 364,475
Total 4,478,597 4,283,324 4,092,425 3,934,951 3,896,605 3,896,002 3,703,840
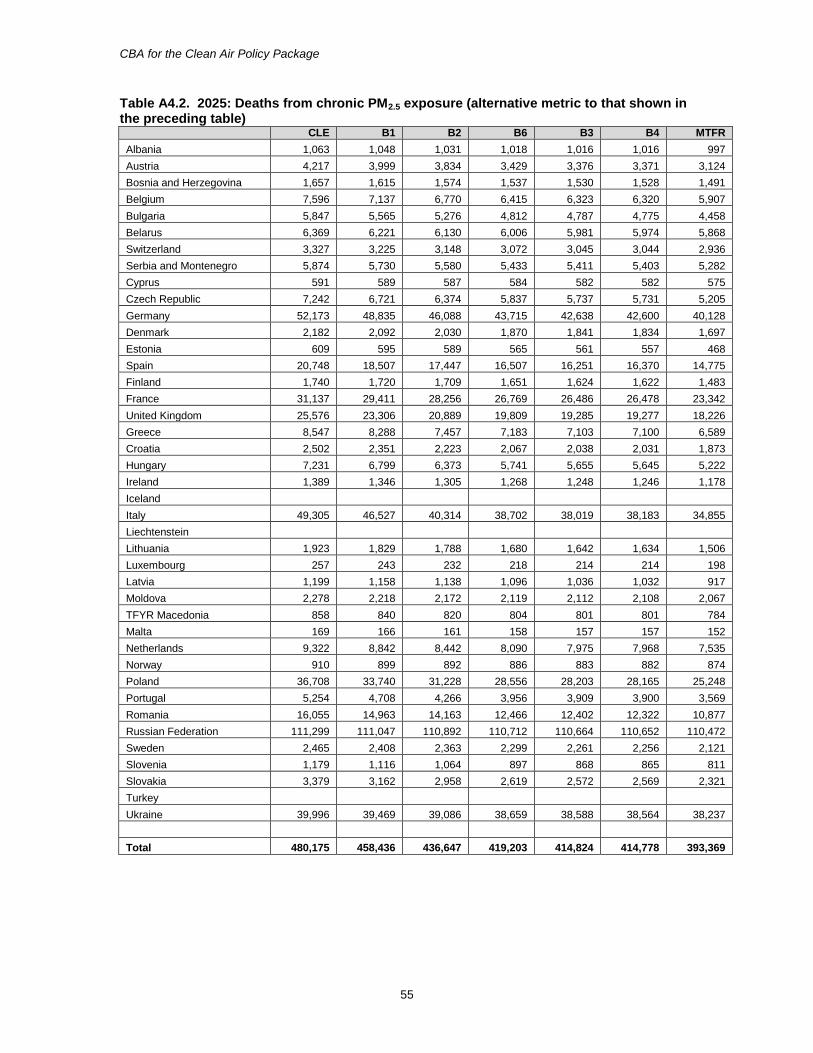
CBA for the Clean Air Policy Package
55
Table A4.2. 2025: Deaths from chronic PM2.5 exposure (alternative metric to that shown in the preceding table)
CLE B1 B2 B6 B3 B4 MTFR
Albania 1,063 1,048 1,031 1,018 1,016 1,016 997
Austria 4,217 3,999 3,834 3,429 3,376 3,371 3,124
Bosnia and Herzegovina 1,657 1,615 1,574 1,537 1,530 1,528 1,491
Belgium 7,596 7,137 6,770 6,415 6,323 6,320 5,907
Bulgaria 5,847 5,565 5,276 4,812 4,787 4,775 4,458
Belarus 6,369 6,221 6,130 6,006 5,981 5,974 5,868
Switzerland 3,327 3,225 3,148 3,072 3,045 3,044 2,936
Serbia and Montenegro 5,874 5,730 5,580 5,433 5,411 5,403 5,282
Cyprus 591 589 587 584 582 582 575
Czech Republic 7,242 6,721 6,374 5,837 5,737 5,731 5,205
Germany 52,173 48,835 46,088 43,715 42,638 42,600 40,128
Denmark 2,182 2,092 2,030 1,870 1,841 1,834 1,697
Estonia 609 595 589 565 561 557 468
Spain 20,748 18,507 17,447 16,507 16,251 16,370 14,775
Finland 1,740 1,720 1,709 1,651 1,624 1,622 1,483
France 31,137 29,411 28,256 26,769 26,486 26,478 23,342
United Kingdom 25,576 23,306 20,889 19,809 19,285 19,277 18,226
Greece 8,547 8,288 7,457 7,183 7,103 7,100 6,589
Croatia 2,502 2,351 2,223 2,067 2,038 2,031 1,873
Hungary 7,231 6,799 6,373 5,741 5,655 5,645 5,222
Ireland 1,389 1,346 1,305 1,268 1,248 1,246 1,178
Iceland
Italy 49,305 46,527 40,314 38,702 38,019 38,183 34,855
Liechtenstein
Lithuania 1,923 1,829 1,788 1,680 1,642 1,634 1,506
Luxembourg 257 243 232 218 214 214 198
Latvia 1,199 1,158 1,138 1,096 1,036 1,032 917
Moldova 2,278 2,218 2,172 2,119 2,112 2,108 2,067
TFYR Macedonia 858 840 820 804 801 801 784
Malta 169 166 161 158 157 157 152
Netherlands 9,322 8,842 8,442 8,090 7,975 7,968 7,535
Norway 910 899 892 886 883 882 874
Poland 36,708 33,740 31,228 28,556 28,203 28,165 25,248
Portugal 5,254 4,708 4,266 3,956 3,909 3,900 3,569
Romania 16,055 14,963 14,163 12,466 12,402 12,322 10,877
Russian Federation 111,299 111,047 110,892 110,712 110,664 110,652 110,472
Sweden 2,465 2,408 2,363 2,299 2,261 2,256 2,121
Slovenia 1,179 1,116 1,064 897 868 865 811
Slovakia 3,379 3,162 2,958 2,619 2,572 2,569 2,321
Turkey
Ukraine 39,996 39,469 39,086 38,659 38,588 38,564 38,237
Total 480,175 458,436 436,647 419,203 414,824 414,778 393,369
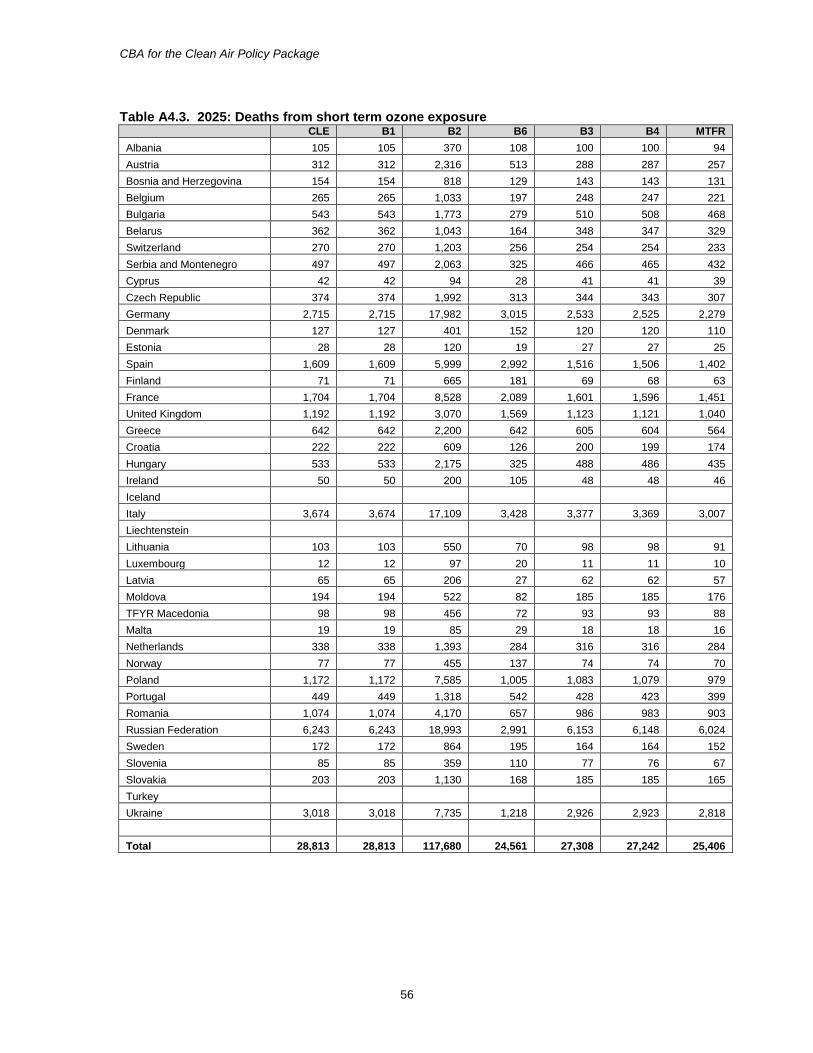
CBA for the Clean Air Policy Package
56
Table A4.3. 2025: Deaths from short term ozone exposure CLE B1 B2 B6 B3 B4 MTFR
Albania 105 105 370 108 100 100 94
Austria 312 312 2,316 513 288 287 257
Bosnia and Herzegovina 154 154 818 129 143 143 131
Belgium 265 265 1,033 197 248 247 221
Bulgaria 543 543 1,773 279 510 508 468
Belarus 362 362 1,043 164 348 347 329
Switzerland 270 270 1,203 256 254 254 233
Serbia and Montenegro 497 497 2,063 325 466 465 432
Cyprus 42 42 94 28 41 41 39
Czech Republic 374 374 1,992 313 344 343 307
Germany 2,715 2,715 17,982 3,015 2,533 2,525 2,279
Denmark 127 127 401 152 120 120 110
Estonia 28 28 120 19 27 27 25
Spain 1,609 1,609 5,999 2,992 1,516 1,506 1,402
Finland 71 71 665 181 69 68 63
France 1,704 1,704 8,528 2,089 1,601 1,596 1,451
United Kingdom 1,192 1,192 3,070 1,569 1,123 1,121 1,040
Greece 642 642 2,200 642 605 604 564
Croatia 222 222 609 126 200 199 174
Hungary 533 533 2,175 325 488 486 435
Ireland 50 50 200 105 48 48 46
Iceland
Italy 3,674 3,674 17,109 3,428 3,377 3,369 3,007
Liechtenstein
Lithuania 103 103 550 70 98 98 91
Luxembourg 12 12 97 20 11 11 10
Latvia 65 65 206 27 62 62 57
Moldova 194 194 522 82 185 185 176
TFYR Macedonia 98 98 456 72 93 93 88
Malta 19 19 85 29 18 18 16
Netherlands 338 338 1,393 284 316 316 284
Norway 77 77 455 137 74 74 70
Poland 1,172 1,172 7,585 1,005 1,083 1,079 979
Portugal 449 449 1,318 542 428 423 399
Romania 1,074 1,074 4,170 657 986 983 903
Russian Federation 6,243 6,243 18,993 2,991 6,153 6,148 6,024
Sweden 172 172 864 195 164 164 152
Slovenia 85 85 359 110 77 76 67
Slovakia 203 203 1,130 168 185 185 165
Turkey
Ukraine 3,018 3,018 7,735 1,218 2,926 2,923 2,818
Total 28,813 28,813 117,680 24,561 27,308 27,242 25,406
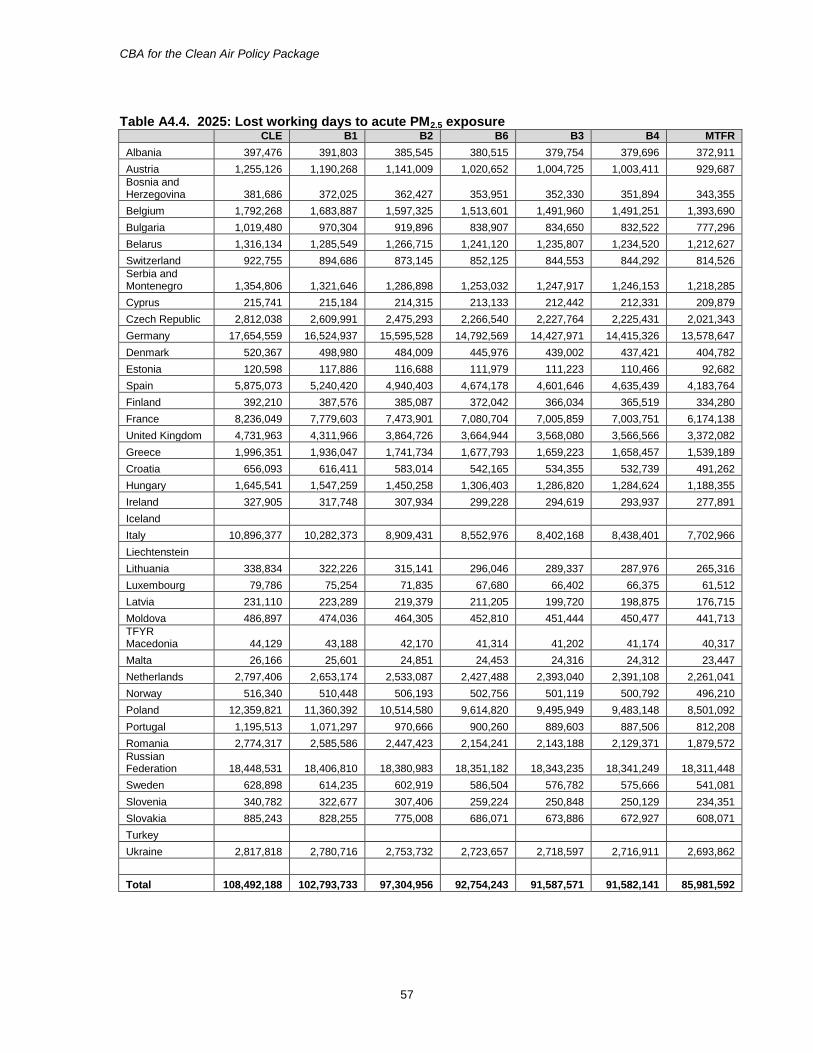
CBA for the Clean Air Policy Package
57
Table A4.4. 2025: Lost working days to acute PM2.5 exposure
CLE B1 B2 B6 B3 B4 MTFR
Albania 397,476 391,803 385,545 380,515 379,754 379,696 372,911
Austria 1,255,126 1,190,268 1,141,009 1,020,652 1,004,725 1,003,411 929,687
Bosnia and Herzegovina 381,686 372,025 362,427 353,951 352,330 351,894 343,355
Belgium 1,792,268 1,683,887 1,597,325 1,513,601 1,491,960 1,491,251 1,393,690
Bulgaria 1,019,480 970,304 919,896 838,907 834,650 832,522 777,296
Belarus 1,316,134 1,285,549 1,266,715 1,241,120 1,235,807 1,234,520 1,212,627
Switzerland 922,755 894,686 873,145 852,125 844,553 844,292 814,526
Serbia and Montenegro 1,354,806 1,321,646 1,286,898 1,253,032 1,247,917 1,246,153 1,218,285
Cyprus 215,741 215,184 214,315 213,133 212,442 212,331 209,879
Czech Republic 2,812,038 2,609,991 2,475,293 2,266,540 2,227,764 2,225,431 2,021,343
Germany 17,654,559 16,524,937 15,595,528 14,792,569 14,427,971 14,415,326 13,578,647
Denmark 520,367 498,980 484,009 445,976 439,002 437,421 404,782
Estonia 120,598 117,886 116,688 111,979 111,223 110,466 92,682
Spain 5,875,073 5,240,420 4,940,403 4,674,178 4,601,646 4,635,439 4,183,764
Finland 392,210 387,576 385,087 372,042 366,034 365,519 334,280
France 8,236,049 7,779,603 7,473,901 7,080,704 7,005,859 7,003,751 6,174,138
United Kingdom 4,731,963 4,311,966 3,864,726 3,664,944 3,568,080 3,566,566 3,372,082
Greece 1,996,351 1,936,047 1,741,734 1,677,793 1,659,223 1,658,457 1,539,189
Croatia 656,093 616,411 583,014 542,165 534,355 532,739 491,262
Hungary 1,645,541 1,547,259 1,450,258 1,306,403 1,286,820 1,284,624 1,188,355
Ireland 327,905 317,748 307,934 299,228 294,619 293,937 277,891
Iceland
Italy 10,896,377 10,282,373 8,909,431 8,552,976 8,402,168 8,438,401 7,702,966
Liechtenstein
Lithuania 338,834 322,226 315,141 296,046 289,337 287,976 265,316
Luxembourg 79,786 75,254 71,835 67,680 66,402 66,375 61,512
Latvia 231,110 223,289 219,379 211,205 199,720 198,875 176,715
Moldova 486,897 474,036 464,305 452,810 451,444 450,477 441,713
TFYR Macedonia 44,129 43,188 42,170 41,314 41,202 41,174 40,317
Malta 26,166 25,601 24,851 24,453 24,316 24,312 23,447
Netherlands 2,797,406 2,653,174 2,533,087 2,427,488 2,393,040 2,391,108 2,261,041
Norway 516,340 510,448 506,193 502,756 501,119 500,792 496,210
Poland 12,359,821 11,360,392 10,514,580 9,614,820 9,495,949 9,483,148 8,501,092
Portugal 1,195,513 1,071,297 970,666 900,260 889,603 887,506 812,208
Romania 2,774,317 2,585,586 2,447,423 2,154,241 2,143,188 2,129,371 1,879,572
Russian Federation 18,448,531 18,406,810 18,380,983 18,351,182 18,343,235 18,341,249 18,311,448
Sweden 628,898 614,235 602,919 586,504 576,782 575,666 541,081
Slovenia 340,782 322,677 307,406 259,224 250,848 250,129 234,351
Slovakia 885,243 828,255 775,008 686,071 673,886 672,927 608,071
Turkey
Ukraine 2,817,818 2,780,716 2,753,732 2,723,657 2,718,597 2,716,911 2,693,862
Total 108,492,188 102,793,733 97,304,956 92,754,243 91,587,571 91,582,141 85,981,592
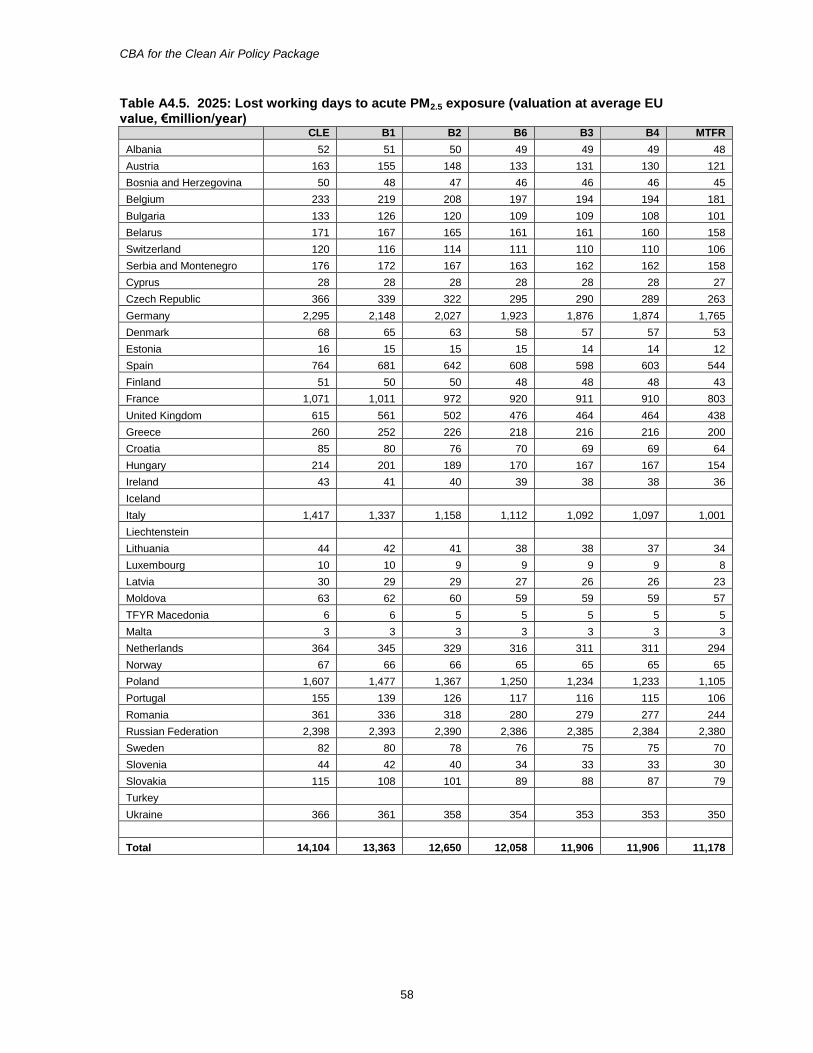
CBA for the Clean Air Policy Package
58
Table A4.5. 2025: Lost working days to acute PM2.5 exposure (valuation at average EU value, €million/year)
CLE B1 B2 B6 B3 B4 MTFR
Albania 52 51 50 49 49 49 48
Austria 163 155 148 133 131 130 121
Bosnia and Herzegovina 50 48 47 46 46 46 45
Belgium 233 219 208 197 194 194 181
Bulgaria 133 126 120 109 109 108 101
Belarus 171 167 165 161 161 160 158
Switzerland 120 116 114 111 110 110 106
Serbia and Montenegro 176 172 167 163 162 162 158
Cyprus 28 28 28 28 28 28 27
Czech Republic 366 339 322 295 290 289 263
Germany 2,295 2,148 2,027 1,923 1,876 1,874 1,765
Denmark 68 65 63 58 57 57 53
Estonia 16 15 15 15 14 14 12
Spain 764 681 642 608 598 603 544
Finland 51 50 50 48 48 48 43
France 1,071 1,011 972 920 911 910 803
United Kingdom 615 561 502 476 464 464 438
Greece 260 252 226 218 216 216 200
Croatia 85 80 76 70 69 69 64
Hungary 214 201 189 170 167 167 154
Ireland 43 41 40 39 38 38 36
Iceland
Italy 1,417 1,337 1,158 1,112 1,092 1,097 1,001
Liechtenstein
Lithuania 44 42 41 38 38 37 34
Luxembourg 10 10 9 9 9 9 8
Latvia 30 29 29 27 26 26 23
Moldova 63 62 60 59 59 59 57
TFYR Macedonia 6 6 5 5 5 5 5
Malta 3 3 3 3 3 3 3
Netherlands 364 345 329 316 311 311 294
Norway 67 66 66 65 65 65 65
Poland 1,607 1,477 1,367 1,250 1,234 1,233 1,105
Portugal 155 139 126 117 116 115 106
Romania 361 336 318 280 279 277 244
Russian Federation 2,398 2,393 2,390 2,386 2,385 2,384 2,380
Sweden 82 80 78 76 75 75 70
Slovenia 44 42 40 34 33 33 30
Slovakia 115 108 101 89 88 87 79
Turkey
Ukraine 366 361 358 354 353 353 350
Total 14,104 13,363 12,650 12,058 11,906 11,906 11,178
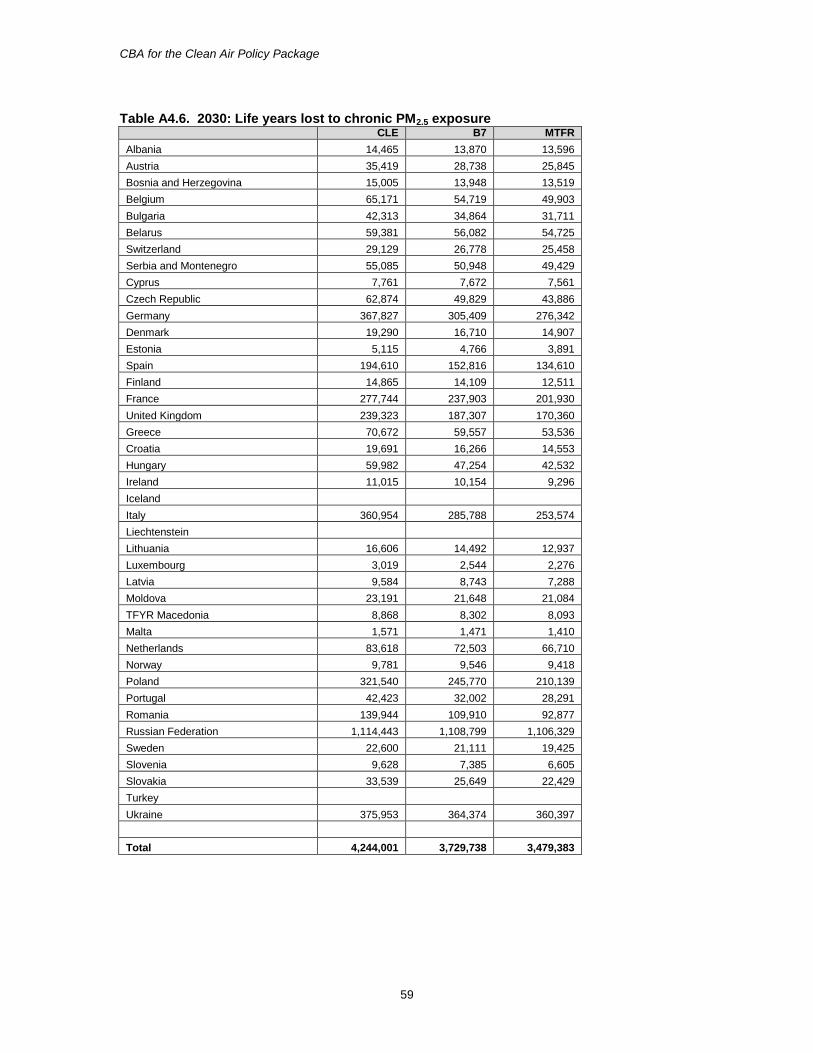
CBA for the Clean Air Policy Package
59
Table A4.6. 2030: Life years lost to chronic PM2.5 exposure
CLE B7 MTFR
Albania 14,465 13,870 13,596
Austria 35,419 28,738 25,845
Bosnia and Herzegovina 15,005 13,948 13,519
Belgium 65,171 54,719 49,903
Bulgaria 42,313 34,864 31,711
Belarus 59,381 56,082 54,725
Switzerland 29,129 26,778 25,458
Serbia and Montenegro 55,085 50,948 49,429
Cyprus 7,761 7,672 7,561
Czech Republic 62,874 49,829 43,886
Germany 367,827 305,409 276,342
Denmark 19,290 16,710 14,907
Estonia 5,115 4,766 3,891
Spain 194,610 152,816 134,610
Finland 14,865 14,109 12,511
France 277,744 237,903 201,930
United Kingdom 239,323 187,307 170,360
Greece 70,672 59,557 53,536
Croatia 19,691 16,266 14,553
Hungary 59,982 47,254 42,532
Ireland 11,015 10,154 9,296
Iceland
Italy 360,954 285,788 253,574
Liechtenstein
Lithuania 16,606 14,492 12,937
Luxembourg 3,019 2,544 2,276
Latvia 9,584 8,743 7,288
Moldova 23,191 21,648 21,084
TFYR Macedonia 8,868 8,302 8,093
Malta 1,571 1,471 1,410
Netherlands 83,618 72,503 66,710
Norway 9,781 9,546 9,418
Poland 321,540 245,770 210,139
Portugal 42,423 32,002 28,291
Romania 139,944 109,910 92,877
Russian Federation 1,114,443 1,108,799 1,106,329
Sweden 22,600 21,111 19,425
Slovenia 9,628 7,385 6,605
Slovakia 33,539 25,649 22,429
Turkey
Ukraine 375,953 364,374 360,397
Total 4,244,001 3,729,738 3,479,383
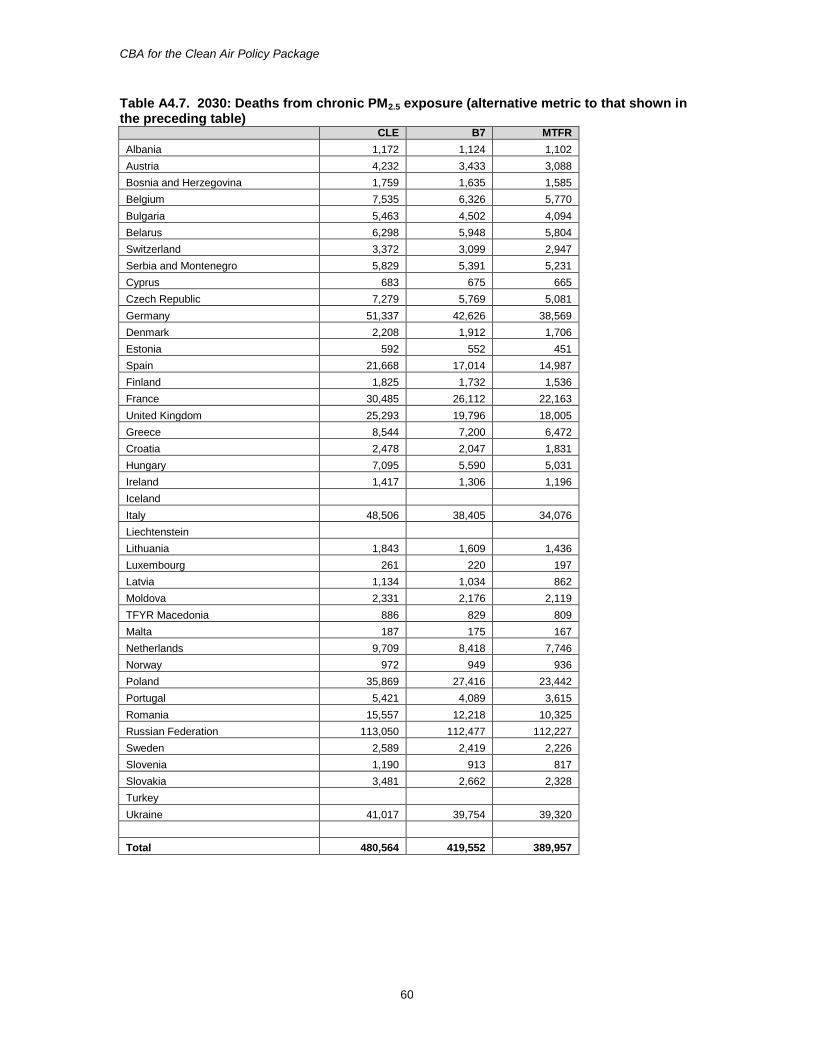
CBA for the Clean Air Policy Package
60
Table A4.7. 2030: Deaths from chronic PM2.5 exposure (alternative metric to that shown in the preceding table)
CLE B7 MTFR
Albania 1,172 1,124 1,102
Austria 4,232 3,433 3,088
Bosnia and Herzegovina 1,759 1,635 1,585
Belgium 7,535 6,326 5,770
Bulgaria 5,463 4,502 4,094
Belarus 6,298 5,948 5,804
Switzerland 3,372 3,099 2,947
Serbia and Montenegro 5,829 5,391 5,231
Cyprus 683 675 665
Czech Republic 7,279 5,769 5,081
Germany 51,337 42,626 38,569
Denmark 2,208 1,912 1,706
Estonia 592 552 451
Spain 21,668 17,014 14,987
Finland 1,825 1,732 1,536
France 30,485 26,112 22,163
United Kingdom 25,293 19,796 18,005
Greece 8,544 7,200 6,472
Croatia 2,478 2,047 1,831
Hungary 7,095 5,590 5,031
Ireland 1,417 1,306 1,196
Iceland
Italy 48,506 38,405 34,076
Liechtenstein
Lithuania 1,843 1,609 1,436
Luxembourg 261 220 197
Latvia 1,134 1,034 862
Moldova 2,331 2,176 2,119
TFYR Macedonia 886 829 809
Malta 187 175 167
Netherlands 9,709 8,418 7,746
Norway 972 949 936
Poland 35,869 27,416 23,442
Portugal 5,421 4,089 3,615
Romania 15,557 12,218 10,325
Russian Federation 113,050 112,477 112,227
Sweden 2,589 2,419 2,226
Slovenia 1,190 913 817
Slovakia 3,481 2,662 2,328
Turkey
Ukraine 41,017 39,754 39,320
Total 480,564 419,552 389,957
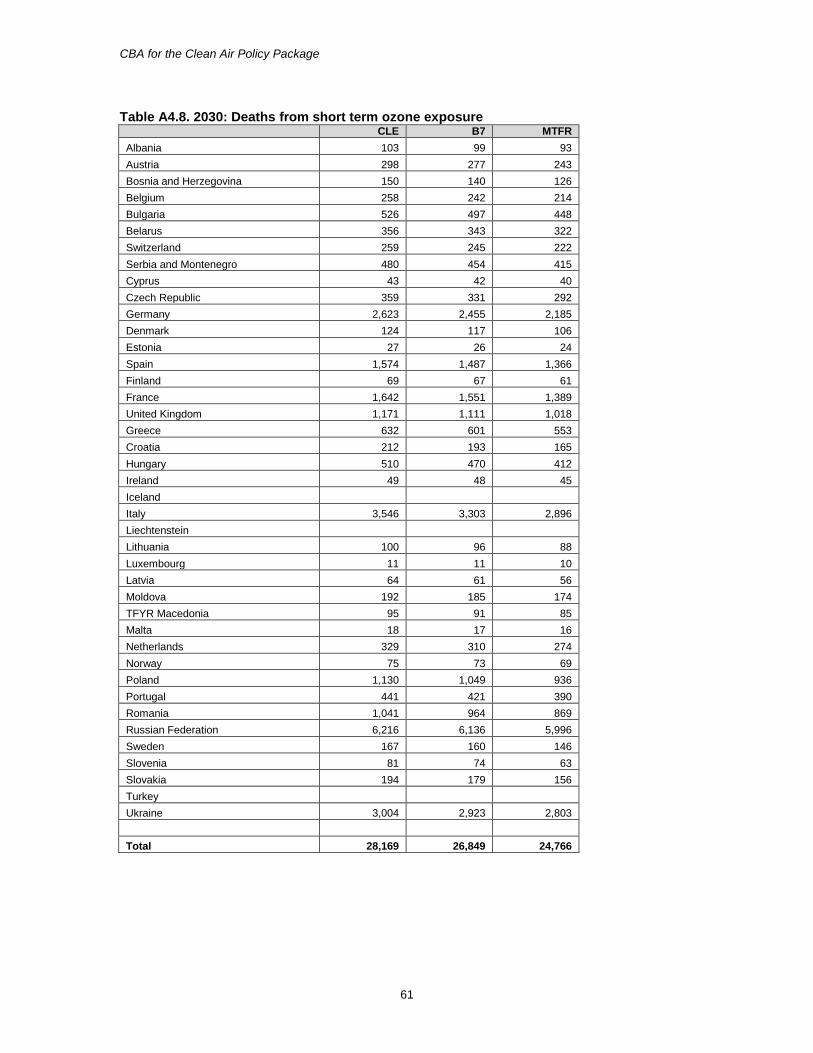
CBA for the Clean Air Policy Package
61
Table A4.8. 2030: Deaths from short term ozone exposure CLE B7 MTFR
Albania 103 99 93
Austria 298 277 243
Bosnia and Herzegovina 150 140 126
Belgium 258 242 214
Bulgaria 526 497 448
Belarus 356 343 322
Switzerland 259 245 222
Serbia and Montenegro 480 454 415
Cyprus 43 42 40
Czech Republic 359 331 292
Germany 2,623 2,455 2,185
Denmark 124 117 106
Estonia 27 26 24
Spain 1,574 1,487 1,366
Finland 69 67 61
France 1,642 1,551 1,389
United Kingdom 1,171 1,111 1,018
Greece 632 601 553
Croatia 212 193 165
Hungary 510 470 412
Ireland 49 48 45
Iceland
Italy 3,546 3,303 2,896
Liechtenstein
Lithuania 100 96 88
Luxembourg 11 11 10
Latvia 64 61 56
Moldova 192 185 174
TFYR Macedonia 95 91 85
Malta 18 17 16
Netherlands 329 310 274
Norway 75 73 69
Poland 1,130 1,049 936
Portugal 441 421 390
Romania 1,041 964 869
Russian Federation 6,216 6,136 5,996
Sweden 167 160 146
Slovenia 81 74 63
Slovakia 194 179 156
Turkey
Ukraine 3,004 2,923 2,803
Total 28,169 26,849 24,766
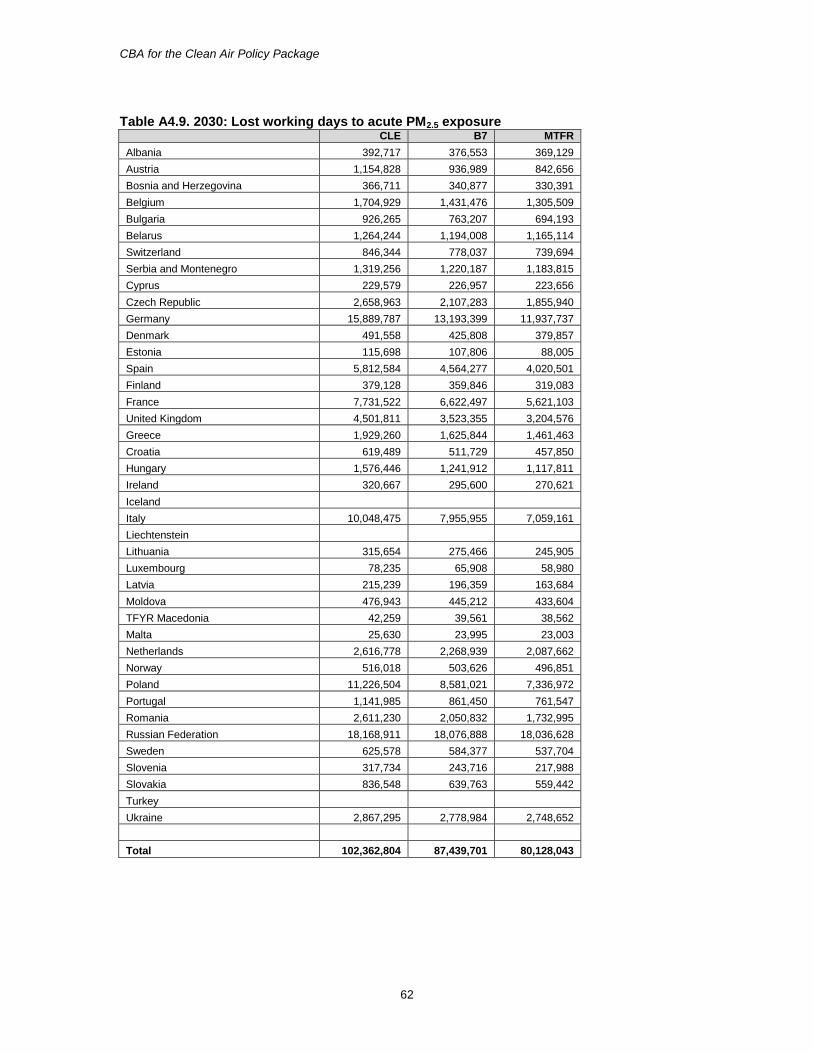
CBA for the Clean Air Policy Package
62
Table A4.9. 2030: Lost working days to acute PM2.5 exposure
CLE B7 MTFR
Albania 392,717 376,553 369,129
Austria 1,154,828 936,989 842,656
Bosnia and Herzegovina 366,711 340,877 330,391
Belgium 1,704,929 1,431,476 1,305,509
Bulgaria 926,265 763,207 694,193
Belarus 1,264,244 1,194,008 1,165,114
Switzerland 846,344 778,037 739,694
Serbia and Montenegro 1,319,256 1,220,187 1,183,815
Cyprus 229,579 226,957 223,656
Czech Republic 2,658,963 2,107,283 1,855,940
Germany 15,889,787 13,193,399 11,937,737
Denmark 491,558 425,808 379,857
Estonia 115,698 107,806 88,005
Spain 5,812,584 4,564,277 4,020,501
Finland 379,128 359,846 319,083
France 7,731,522 6,622,497 5,621,103
United Kingdom 4,501,811 3,523,355 3,204,576
Greece 1,929,260 1,625,844 1,461,463
Croatia 619,489 511,729 457,850
Hungary 1,576,446 1,241,912 1,117,811
Ireland 320,667 295,600 270,621
Iceland
Italy 10,048,475 7,955,955 7,059,161
Liechtenstein
Lithuania 315,654 275,466 245,905
Luxembourg 78,235 65,908 58,980
Latvia 215,239 196,359 163,684
Moldova 476,943 445,212 433,604
TFYR Macedonia 42,259 39,561 38,562
Malta 25,630 23,995 23,003
Netherlands 2,616,778 2,268,939 2,087,662
Norway 516,018 503,626 496,851
Poland 11,226,504 8,581,021 7,336,972
Portugal 1,141,985 861,450 761,547
Romania 2,611,230 2,050,832 1,732,995
Russian Federation 18,168,911 18,076,888 18,036,628
Sweden 625,578 584,377 537,704
Slovenia 317,734 243,716 217,988
Slovakia 836,548 639,763 559,442
Turkey
Ukraine 2,867,295 2,778,984 2,748,652
Total 102,362,804 87,439,701 80,128,043
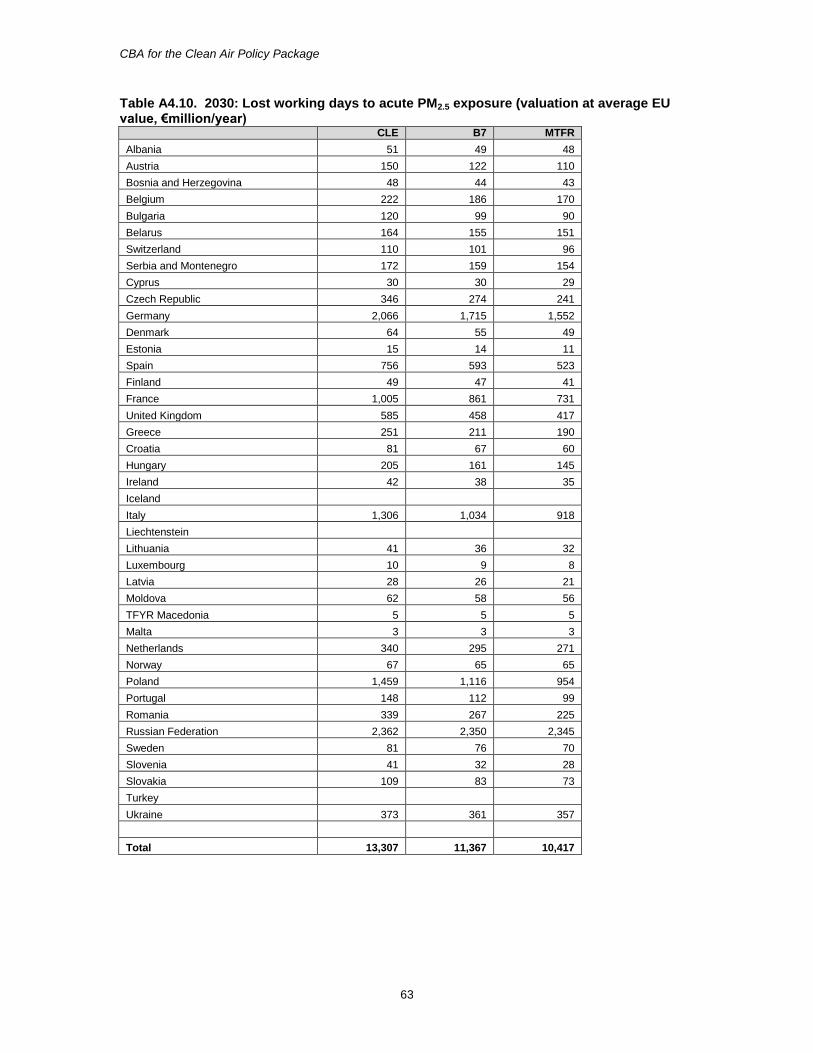
CBA for the Clean Air Policy Package
63
Table A4.10. 2030: Lost working days to acute PM2.5 exposure (valuation at average EU value, €million/year)
CLE B7 MTFR
Albania 51 49 48
Austria 150 122 110
Bosnia and Herzegovina 48 44 43
Belgium 222 186 170
Bulgaria 120 99 90
Belarus 164 155 151
Switzerland 110 101 96
Serbia and Montenegro 172 159 154
Cyprus 30 30 29
Czech Republic 346 274 241
Germany 2,066 1,715 1,552
Denmark 64 55 49
Estonia 15 14 11
Spain 756 593 523
Finland 49 47 41
France 1,005 861 731
United Kingdom 585 458 417
Greece 251 211 190
Croatia 81 67 60
Hungary 205 161 145
Ireland 42 38 35
Iceland
Italy 1,306 1,034 918
Liechtenstein
Lithuania 41 36 32
Luxembourg 10 9 8
Latvia 28 26 21
Moldova 62 58 56
TFYR Macedonia 5 5 5
Malta 3 3 3
Netherlands 340 295 271
Norway 67 65 65
Poland 1,459 1,116 954
Portugal 148 112 99
Romania 339 267 225
Russian Federation 2,362 2,350 2,345
Sweden 81 76 70
Slovenia 41 32 28
Slovakia 109 83 73
Turkey
Ukraine 373 361 357
Total 13,307 11,367 10,417
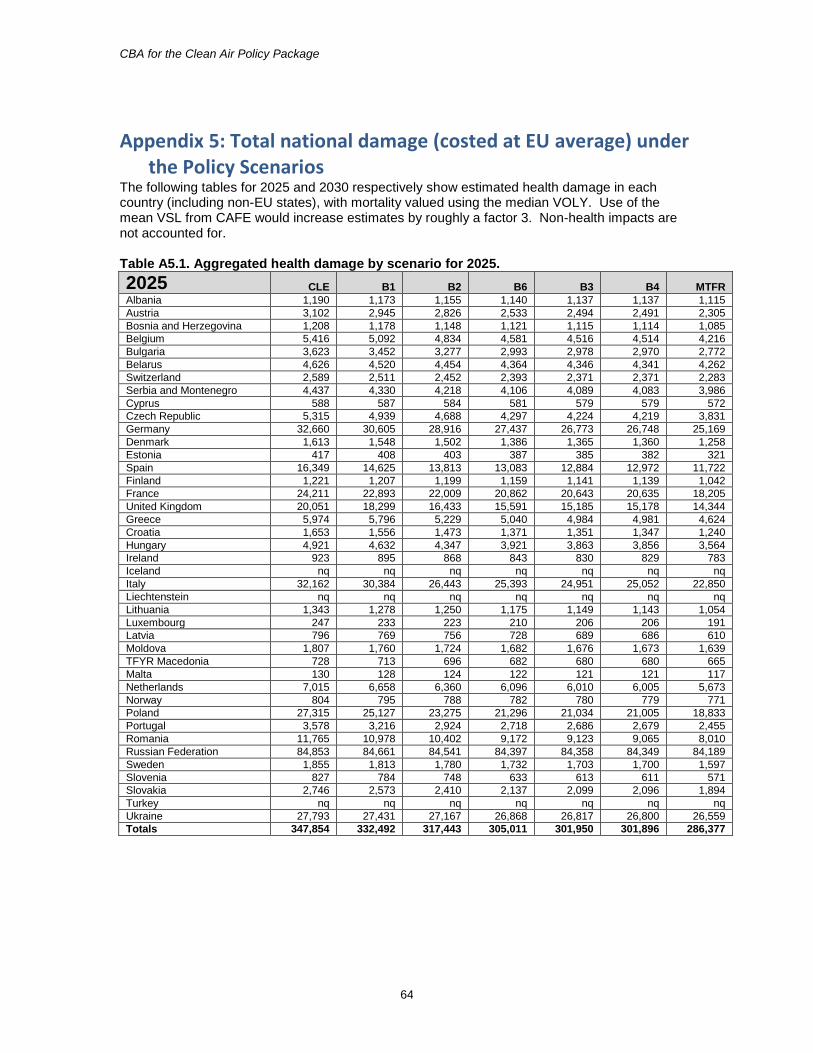
CBA for the Clean Air Policy Package
64
Appendix 5: Total national damage (costed at EU average) under the Policy Scenarios
The following tables for 2025 and 2030 respectively show estimated health damage in each country (including non-EU states), with mortality valued using the median VOLY. Use of the mean VSL from CAFE would increase estimates by roughly a factor 3. Non-health impacts are not accounted for. Table A5.1. Aggregated health damage by scenario for 2025.
2025 CLE B1 B2 B6 B3 B4 MTFR
Albania 1,190 1,173 1,155 1,140 1,137 1,137 1,115
Austria 3,102 2,945 2,826 2,533 2,494 2,491 2,305
Bosnia and Herzegovina 1,208 1,178 1,148 1,121 1,115 1,114 1,085
Belgium 5,416 5,092 4,834 4,581 4,516 4,514 4,216
Bulgaria 3,623 3,452 3,277 2,993 2,978 2,970 2,772
Belarus 4,626 4,520 4,454 4,364 4,346 4,341 4,262
Switzerland 2,589 2,511 2,452 2,393 2,371 2,371 2,283
Serbia and Montenegro 4,437 4,330 4,218 4,106 4,089 4,083 3,986
Cyprus 588 587 584 581 579 579 572
Czech Republic 5,315 4,939 4,688 4,297 4,224 4,219 3,831
Germany 32,660 30,605 28,916 27,437 26,773 26,748 25,169
Denmark 1,613 1,548 1,502 1,386 1,365 1,360 1,258
Estonia 417 408 403 387 385 382 321
Spain 16,349 14,625 13,813 13,083 12,884 12,972 11,722
Finland 1,221 1,207 1,199 1,159 1,141 1,139 1,042
France 24,211 22,893 22,009 20,862 20,643 20,635 18,205
United Kingdom 20,051 18,299 16,433 15,591 15,185 15,178 14,344
Greece 5,974 5,796 5,229 5,040 4,984 4,981 4,624
Croatia 1,653 1,556 1,473 1,371 1,351 1,347 1,240
Hungary 4,921 4,632 4,347 3,921 3,863 3,856 3,564
Ireland 923 895 868 843 830 829 783
Iceland nq nq nq nq nq nq nq
Italy 32,162 30,384 26,443 25,393 24,951 25,052 22,850
Liechtenstein nq nq nq nq nq nq nq
Lithuania 1,343 1,278 1,250 1,175 1,149 1,143 1,054
Luxembourg 247 233 223 210 206 206 191
Latvia 796 769 756 728 689 686 610
Moldova 1,807 1,760 1,724 1,682 1,676 1,673 1,639
TFYR Macedonia 728 713 696 682 680 680 665
Malta 130 128 124 122 121 121 117
Netherlands 7,015 6,658 6,360 6,096 6,010 6,005 5,673
Norway 804 795 788 782 780 779 771
Poland 27,315 25,127 23,275 21,296 21,034 21,005 18,833
Portugal 3,578 3,216 2,924 2,718 2,686 2,679 2,455
Romania 11,765 10,978 10,402 9,172 9,123 9,065 8,010
Russian Federation 84,853 84,661 84,541 84,397 84,358 84,349 84,189
Sweden 1,855 1,813 1,780 1,732 1,703 1,700 1,597
Slovenia 827 784 748 633 613 611 571
Slovakia 2,746 2,573 2,410 2,137 2,099 2,096 1,894
Turkey nq nq nq nq nq nq nq
Ukraine 27,793 27,431 27,167 26,868 26,817 26,800 26,559
Totals 347,854 332,492 317,443 305,011 301,950 301,896 286,377
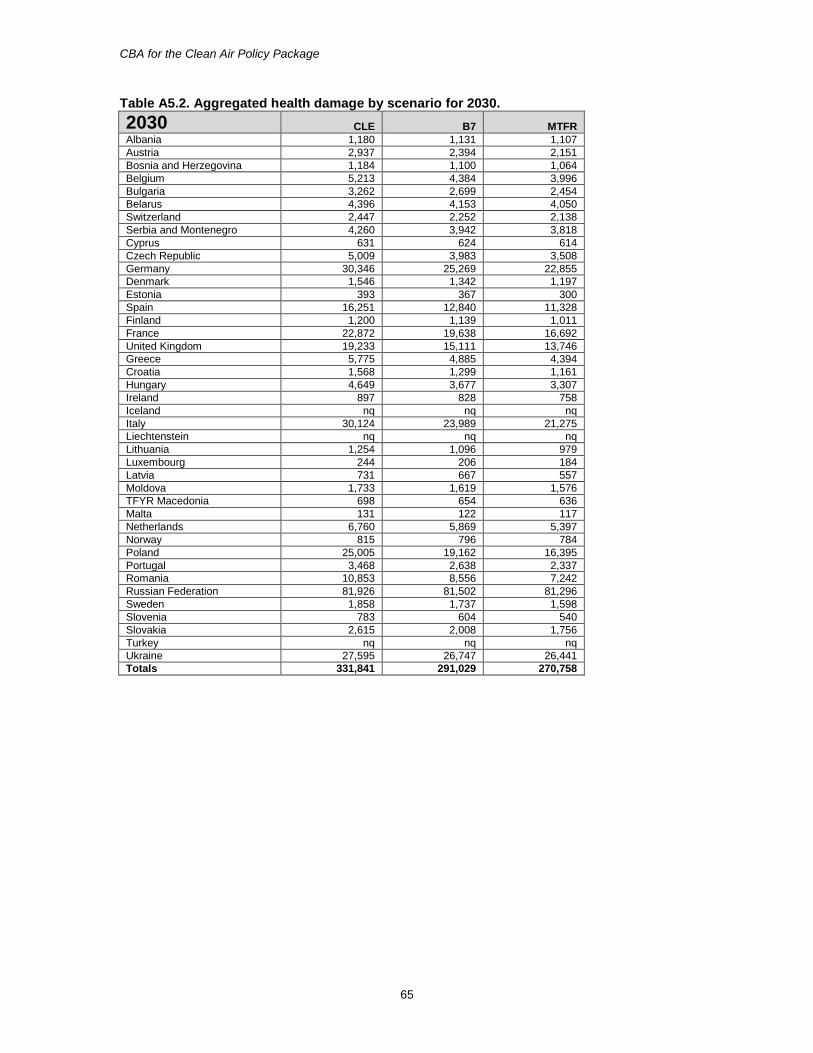
CBA for the Clean Air Policy Package
65
Table A5.2. Aggregated health damage by scenario for 2030.
2030 CLE B7 MTFR
Albania 1,180 1,131 1,107
Austria 2,937 2,394 2,151
Bosnia and Herzegovina 1,184 1,100 1,064
Belgium 5,213 4,384 3,996
Bulgaria 3,262 2,699 2,454
Belarus 4,396 4,153 4,050
Switzerland 2,447 2,252 2,138
Serbia and Montenegro 4,260 3,942 3,818
Cyprus 631 624 614
Czech Republic 5,009 3,983 3,508
Germany 30,346 25,269 22,855
Denmark 1,546 1,342 1,197
Estonia 393 367 300
Spain 16,251 12,840 11,328
Finland 1,200 1,139 1,011
France 22,872 19,638 16,692
United Kingdom 19,233 15,111 13,746
Greece 5,775 4,885 4,394
Croatia 1,568 1,299 1,161
Hungary 4,649 3,677 3,307
Ireland 897 828 758
Iceland nq nq nq
Italy 30,124 23,989 21,275
Liechtenstein nq nq nq
Lithuania 1,254 1,096 979
Luxembourg 244 206 184
Latvia 731 667 557
Moldova 1,733 1,619 1,576
TFYR Macedonia 698 654 636
Malta 131 122 117
Netherlands 6,760 5,869 5,397
Norway 815 796 784
Poland 25,005 19,162 16,395
Portugal 3,468 2,638 2,337
Romania 10,853 8,556 7,242
Russian Federation 81,926 81,502 81,296
Sweden 1,858 1,737 1,598
Slovenia 783 604 540
Slovakia 2,615 2,008 1,756
Turkey nq nq nq
Ukraine 27,595 26,747 26,441
Totals 331,841 291,029 270,758
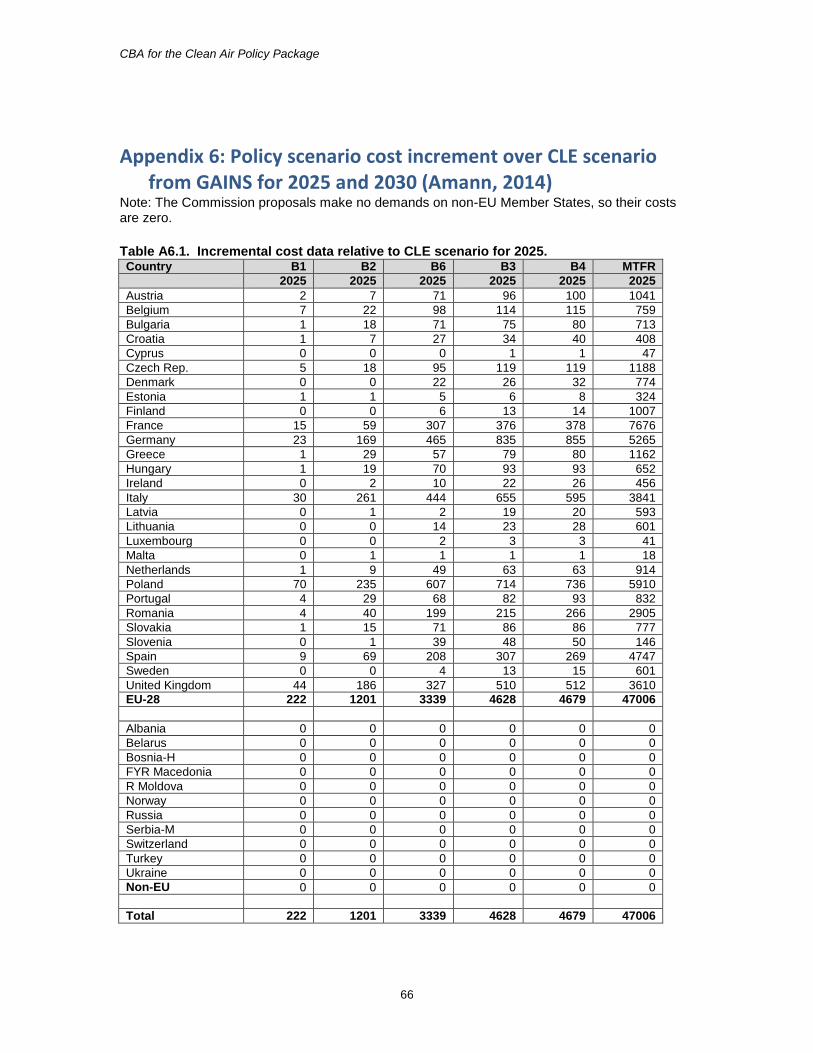
CBA for the Clean Air Policy Package
66
Appendix 6: Policy scenario cost increment over CLE scenario from GAINS for 2025 and 2030 (Amann, 2014)
Note: The Commission proposals make no demands on non-EU Member States, so their costs are zero.
Table A6.1. Incremental cost data relative to CLE scenario for 2025. Country B1 B2 B6 B3 B4 MTFR
2025 2025 2025 2025 2025 2025
Austria 2 7 71 96 100 1041
Belgium 7 22 98 114 115 759
Bulgaria 1 18 71 75 80 713
Croatia 1 7 27 34 40 408
Cyprus 0 0 0 1 1 47
Czech Rep. 5 18 95 119 119 1188
Denmark 0 0 22 26 32 774
Estonia 1 1 5 6 8 324
Finland 0 0 6 13 14 1007
France 15 59 307 376 378 7676
Germany 23 169 465 835 855 5265
Greece 1 29 57 79 80 1162
Hungary 1 19 70 93 93 652
Ireland 0 2 10 22 26 456
Italy 30 261 444 655 595 3841
Latvia 0 1 2 19 20 593
Lithuania 0 0 14 23 28 601
Luxembourg 0 0 2 3 3 41
Malta 0 1 1 1 1 18
Netherlands 1 9 49 63 63 914
Poland 70 235 607 714 736 5910
Portugal 4 29 68 82 93 832
Romania 4 40 199 215 266 2905
Slovakia 1 15 71 86 86 777
Slovenia 0 1 39 48 50 146
Spain 9 69 208 307 269 4747
Sweden 0 0 4 13 15 601
United Kingdom 44 186 327 510 512 3610
EU-28 222 1201 3339 4628 4679 47006
Albania 0 0 0 0 0 0
Belarus 0 0 0 0 0 0
Bosnia-H 0 0 0 0 0 0
FYR Macedonia 0 0 0 0 0 0
R Moldova 0 0 0 0 0 0
Norway 0 0 0 0 0 0
Russia 0 0 0 0 0 0
Serbia-M 0 0 0 0 0 0
Switzerland 0 0 0 0 0 0
Turkey 0 0 0 0 0 0
Ukraine 0 0 0 0 0 0
Non-EU 0 0 0 0 0 0
Total 222 1201 3339 4628 4679 47006
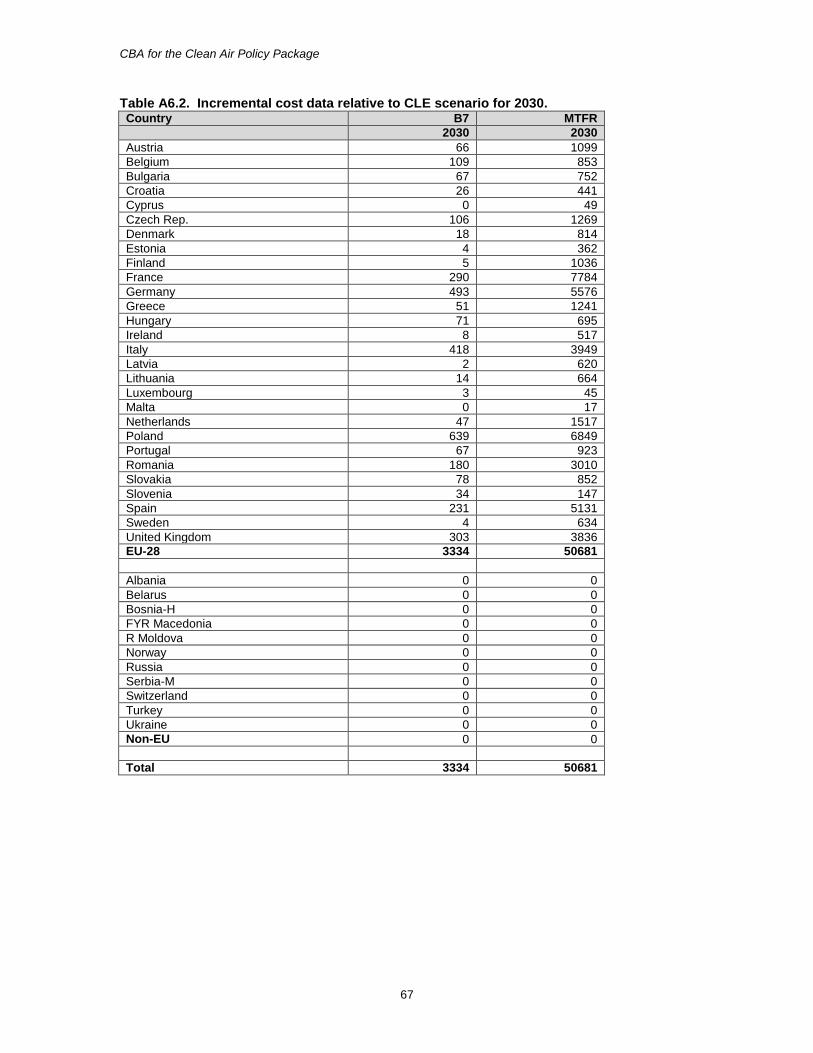
CBA for the Clean Air Policy Package
67
Table A6.2. Incremental cost data relative to CLE scenario for 2030. Country B7 MTFR
2030 2030
Austria 66 1099
Belgium 109 853
Bulgaria 67 752
Croatia 26 441
Cyprus 0 49
Czech Rep. 106 1269
Denmark 18 814
Estonia 4 362
Finland 5 1036
France 290 7784
Germany 493 5576
Greece 51 1241
Hungary 71 695
Ireland 8 517
Italy 418 3949
Latvia 2 620
Lithuania 14 664
Luxembourg 3 45
Malta 0 17
Netherlands 47 1517
Poland 639 6849
Portugal 67 923
Romania 180 3010
Slovakia 78 852
Slovenia 34 147
Spain 231 5131
Sweden 4 634
United Kingdom 303 3836
EU-28 3334 50681
Albania 0 0
Belarus 0 0
Bosnia-H 0 0
FYR Macedonia 0 0
R Moldova 0 0
Norway 0 0
Russia 0 0
Serbia-M 0 0
Switzerland 0 0
Turkey 0 0
Ukraine 0 0
Non-EU 0 0
Total 3334 50681