Embed Size (px)
Citation preview
COST-BENEFIT ANALYSIS
OF INCREASING
BREASTFEEDING RATE IN
NEW MEXICO
June 2015
Bureau of Business &
Economic Research
ii
Cost-Benefit Analysis of Increasing
Breastfeeding Rate in New Mexico
June 2015
Doleswar Bhandari, Ph.D.
Naresh Nepal, Ph.D.
Bureau of Business and Economic Research
MSC06 3510, 1 University of New Mexico
Albuquerque, NM 87131
Tel: (505) 277-2216
Fax: (505) 277-7066
Bureau of Business &
Economic Research
iii
CONTENTS
EXECUTIVE SUMMARY ........................................................................................................... ix
1. Introduction ........................................................................................................................ 1
2. Cost Analysis of Pediatric and Maternal Illnesses .............................................................. 2
2.1 Cost Analysis of Pediatric Illnesses Associated with Suboptimal Breastfeeding ............... 2
2.1.1. Relationship between Childhood Asthma and Breastfeeding .................................... 2
2.1.1 Relationship between Childhood Obesity and Breastfeeding ...............................14
2.1.2 Effects of Improving Breastfeeding Rate on Annual Medical Expenses through
obesity 23
2.1.3 Relationship between lower respiratory tract infection and breastfeeding ............25
2.1.4 Relationship between Gastroenteritis and Breastfeeding .....................................27
2.1.5 Otitis media ..........................................................................................................28
2.1.6 Childhood Leukemia ............................................................................................29
2.1.7 Necrotizing enterocolitis .......................................................................................31
2.1.8 Sudden Infant Death Syndrome ...........................................................................33
2.1.9 Illnesses Not Associated with Suboptimal Breastfeeding .....................................34
2.1.10 Pediatric Illnesses’ Cost estimation ......................................................................35
2.2 Cost Analysis of Maternal Illnesses Associated with Suboptimal Breastfeeding ..........39
2.2.1 Relationship between Breast Cancer and Breastfeeding .....................................39
2.2.2 Relationship between Ovary Cancer and Breastfeeding ......................................44
2.2.3 Cost Estimation of the Maternal Illnesses Associated with Suboptimal
Breastfeeding (based on Bartick et al. methodology and data) ..........................................48
References ........................................................................................................................52
3. Business Survey ...............................................................................................................56
3.1 Survey Sample ...........................................................................................................56
2.1 Survey Results ............................................................................................................57
2.1.1 About Respondent Businesses ............................................................................57
2.1.2 Awareness about the Breastfeeding Related Laws ..............................................61
2.1.3 Breastfeeding Support .........................................................................................62
2.1.4 Maternity Leave ...................................................................................................66
2.1.5 Maternity Leave Provision in Developed Countries ..............................................70
iv
2.1.6 Flexible Work Hours .............................................................................................72
2.1.7 Cost-Benefit of Breastfeeding Support to Businesses ..........................................73
4. Survey of Mothers .............................................................................................................84
4.1 Focus Group Discussions ...........................................................................................84
4.2 Survey Respondents ...................................................................................................86
4.3 Survey results .............................................................................................................89
4.3.1 Rating of Child’s health ........................................................................................89
4.3.2 Child’s Age ..........................................................................................................90
4.3.3 Employment and Childcare ..................................................................................91
4.3.4 Breastfeeding.......................................................................................................96
4.3.5 Maternal Wellbeing ..............................................................................................99
4.3.6 Determinants of Weekly Hours of Work and Monthly Income of New Mexico
Mothers 101
5. Cost-Benefit Analysis of Breastfeeding on New Mexico WIC Program ............................ 105
5.1 WIC Program Expenditures and Breastfeeding ......................................................... 107
6. Cost Benefit Analysis of Breastfeeding on New Mexico Medicaid Program ..................... 111
v
TABLE OF TABLES AND FIGURES Table 2.1 Descriptive Statistics ..................................................................................................................... 5
Table 2.2 Coefficient estimates from logistic regression .............................................................................. 8
Table 2.3 Per Person Average Annual Medical Expenses among children aged 5-19 with and without
asthma ......................................................................................................................................................... 10
Table 2.4 Key parameters used in the simulation ....................................................................................... 12
Table 2.5 Asthma prevalence rate and medical expenses for current and improved rate of breastfeeding
for New Mexico .......................................................................................................................................... 13
Table 2.6 Asthma prevalence rate and medical expenses for current and improved rate of breastfeeding in
New Mexico ................................................................................................................................................ 14
Table 2.7 Mixed-effect model coefficients for the effect of breastfeeding on obesity ............................... 18
Table 2.8 Average annual medical expenses among children aged 6-17 with and without obesity ........... 22
Table 2.9 Average annual medical expenses among adults aged 18 years or more with and without obesity
.................................................................................................................................................................... 23
Table 2.10 Key parameters used in the simulation ..................................................................................... 24
Table 2.11 Obesity prevalence rate and medical expenses for current and improved rate of breastfeeding
for New Mexico .......................................................................................................................................... 25
Table 2.12 Frequency and percentage of disease prevalence among US children below 5 ........................ 34
Table 2.13 Estimated current breastfeeding rate in New Mexico by month ............................................... 35
Table 2.14 Figures and Assumptions used in calculating cost impact for each disease ............................. 37
Table 2.15 Estimation of prevented incidences and associated cost saving as a result of 10% increase in
current rate of breastfeeding ....................................................................................................................... 38
Table 2.16 Per person average annual medical expenses with and without breast cancer .......................... 43
Table 2.17 Differences in breast cancer prevalence rate and total medical expenses ................................. 44
Table 2.18 Per person average annual medical expenses with and without ovary cancer .......................... 47
Table 2.19 Differences in breast cancer prevalence rate and total medical expenditures ........................... 47
Table 2.20 Information used by Bartick et al. in their simulation models .................................................. 49
Table 2.21 Lifetime incidence of maternal conditions at 1-year breastfeeding rate of 23% (in 2008) and 1-
year breastfeeding rate of 34%.................................................................................................................... 50
Table 2.22 Preventable incidences and direct and indirect cost estimates in 2013 dollars at 3% discount
rate .............................................................................................................................................................. 51
Table 3.1 No. of Businesses by Sector in the Sample and Population ........................................................ 58
Table 3.2 No. of Respondents by City ........................................................................................................ 59
Table 3.3 Percentage of Female Employment by Sector ............................................................................ 60
Table 3.4 Percentage of Female Employees by Employment Category ..................................................... 60
Table 3.5 Are you aware that mothers have a legal right to breastfeed in public? ..................................... 61
Table 3.6 Are you aware of the New Mexico workplace breastmilk pumping law? .................................. 62
Table 3.7 Do you know what makes a workplace breastfeeding friendly? ................................................. 62
Table 3.8 Does your entity have a space(s) for employees to nurse or express breastmilk for their babies?
.................................................................................................................................................................... 63
Table 3.9 Does your entity have a space(s) for employees to nurse or express breastmilk for their babies?
.................................................................................................................................................................... 64
Table 3.10 Number of Female Employees and Nursing Spaces by Employment Size .............................. 66
Table 3.11 No. of Businesses Providing Breastfeeding Support ................................................................ 66
vi
Table 3.12 How many days of unpaid maternity leave may an employee take in a year with rights to
return to work? ............................................................................................................................................ 67
Table 3.13 How many days of paid maternity leave may an employee take in a year? ............................. 68
Table 3.14 Is this paid maternity leave contingent on having sufficient balances of annual/sick leave? ... 69
Table 3.15 Is there a separate benefit to cover the cost of maternity leave? ............................................... 69
Table 3.16 Average Unpaid and Paid Maternity Leave by Size of Business .............................................. 69
Table 3.17 Maternity Leave Duration and Source of Funding in Developed Countries ............................ 71
Table 3.18 No. of Businesses Providing Flexible Work Environment ....................................................... 72
Table 3.19 In your view, what are the main constraints to providing flexible working hours for nursing
employees in your entity? ........................................................................................................................... 73
Table 3.20 Research has shown that there are lower medical costs and health insurance claims for
breastfeeding employees and their infants (relative to formula-fed). Is this true for your entity? .............. 73
Table 3.21 Average monthly value of productivity loss to accommodate the needs of a breastfeeding
employee ..................................................................................................................................................... 74
Table 3.22 Long-term average monthly value of increased productivity from employee job satisfaction
due to working in a supportive environment .............................................................................................. 75
Table 3.23 Estimated average annual cost of nursing spaces for New Mexico businesses ........................ 76
Table 4.1 Educational attainment of surveyed mothers and New Mexico’s women .................................. 87
Table 4.2 Survey sample and New Mexico ethnicity ................................................................................. 87
Table 4.3 What is the age of the mother? ................................................................................................... 88
Table 4.4 What is your current marital status? ........................................................................................... 88
Table 4.5 Averages by Ethnicity ................................................................................................................. 89
Table 4.6 Rate your youngest biological child's overall health (from birth through today) ....................... 90
Table 4.7 Has your youngest biological child ever had any of the following illnesses? Please check all that
apply. ........................................................................................................................................................... 90
Table 4.8 What is the age of your youngest biological child? .................................................................... 91
Table 4.9 How many hours do you work per week? ................................................................................... 91
Table 4.10 Why Moms Stay Home ............................................................................................................. 92
Table 4.11 How would you categorize your career?................................................................................... 93
Table 4.12 What is your current hourly salary rate? ................................................................................... 93
Table 4.13 Labor force participation rate, average work hours per week and average monthly income by
child’s age ................................................................................................................................................... 94
Table 4.14 Was your decision regarding whether to return to work influenced by childcare costs? .......... 94
Table 4.15 If you are not currently working, please estimate what your monthly childcare expenses would
be if you were working full time. ................................................................................................................ 95
Table 4.16 If you are currently breastfeeding, would you increase the number of hours you are working if
you were to discontinue breastfeeding? ...................................................................................................... 95
Table 4.17 If yes, by how many hours per week ........................................................................................ 95
Table 4.18 Did you breastfeed your youngest biological child? ................................................................. 96
Table 4.19 How long did you breastfeed? .................................................................................................. 96
Table 4.20 How is your youngest biological child fed now? ...................................................................... 97
Table 4.21 Baby Feeding Patterns by Age .................................................................................................. 97
Table 4.22 Mother’s leading reasons for not establishing and for discontinuing breastfeeding (check all
that apply) ................................................................................................................................................... 99
vii
Table 4.23 How satisfied are you? ............................................................................................................ 100
Table 4.24 Who provides support to you in your role as a mom? ............................................................ 101
Table 4.25 Descriptive Statistics ............................................................................................................... 102
Table 4.26 Determinants of Weekly Work Hours of New Mexico Mothers ............................................ 103
Table 4.27 Determinants of Monthly Wage and Salary of Mothers ......................................................... 104
Table 5.1 WIC Costs and Participation in New Mexico by Federal Fiscal Year ...................................... 105
Table 5.2 WIC Participants, Costs, and Rebates in Federal FY14 by Quarter ......................................... 106
Table 5.3 Breastfeeding status of New Mexico and WIC infants ............................................................. 106
Table 5.4 Estimation of breastfeeding, exclusive breastfeeding and exclusive formula feeding by infant
month ........................................................................................................................................................ 107
Table 5.5 Monthly cost of WIC food packages for infants and mothers, 2013 ........................................ 108
Table 5.6 Estimation of infants and mothers by infant month category ................................................... 108
Table 5.7 Annual WIC program food cost after rebate in FY14 for mother and infants .......................... 109
Table 5.8 Projected annual WIC food expenditures after rebate for mother-infant pairs, extreme cases. 110
Table 6.1 No. of children and low income children by health insurance provider FY12 ......................... 111
Table 6.2 New Mexico State Medicaid and CHIP income eligibility, 2014 ............................................. 112
Table 6.3 Medicaid payment in New Mexico and United States by enrollment group ............................ 112
Table 6.4 Federal and state share of Medicaid Expenditure FY12 ........................................................... 112
Table 6.5 Average growth in Medicaid Spending .................................................................................... 113
Table 6.6 Distribution of Medicaid Spending in New Mexico by Service (FY12) .................................. 113
Table 6.7 Hospitalization counts and total expenditures by payer category (FY11) ................................ 114
Table 6.8 Hospitalization counts of breastfeeding related illnesses by age category ............................... 114
Table 6.9 Hospitalization expenditures for breastfeeding-related illnesses .............................................. 115
Table 6.10 Medicaid expenditures due to hospitalization ......................................................................... 116
Figure 2.1 Predicted probabilities of obesity among children and adolescent for ever-breastfed and never
breastfed during infancy ............................................................................................................................. 19
Figure 2.2 Predicted probability of obesity among male children of age 10 years in relation to the duration
of breastfeeding during infancy .................................................................................................................. 20
Figure 2.3 Predicted probabilities of obesity for children and adolescents with respect to breastfeeding
period during infancy .................................................................................................................................. 21
Figure 4.1 Rate of exclusive breastfeeding from birth through 12 months ................................................. 98
viii
ACKNOWLEDGEMENT
As this report is the result of collaboration among many individuals and institutions, i t is not easy for
me to write an acknowledgement because I may exclude some important contributors’ names here. I
would like to express my sincere thanks to the New Mexico Breastfeeding Task Force for providing
funding and support to complete this study. Several individuals from the Task Force have contributed
to the completion of this study. I gratefully acknowledge Ms. Lissa Knudsen, Baby-Friendly Hospital
Project Director, who provided support and coordinated data collection. I would like to thank Ms. Heidi
Fredine, Health Science Associate Scientist from Center for Development and Disability, UNM, who
served as a chair person to the New Mexico Breastfeeding Task Force Data Committee to coordinate
the data collection effort. In addition, she supported BBER in many activities such as organizing and
leading focus group discussions, providing valuable feedbacks on business survey and mother survey
questionnaire, help finding mother survey respondents, etc. I would like to thank Mr. Tom Scharmen,
epidemiologist from the New Mexico Department of Health for providing data and support. I would like
to thank the following individuals and agencies that provided data, feedbacks, and/or support.
Ms. Cindy Chavez, State Coordinator, New Mexico Breastfeeding Task Force
Ms. Eirian Coronado, Epidemiologist, New Mexico Department of Health
Dr. Emilie Sebesta, Associate Professor, Department of Pediatrics, UNM
Ms. Sharon Giles-Pullen, NM WIC Breastfeeding Promotion Manager
Mary Shepherd, Epidemiologist, New Mexico Department of Health
Dr. Jim Fisk, Physician
Ms. Carol L’Esperance, Lactation Care Manager, Presbyterian Hospital
Mr. George Clarke, New Mexico Department of Information Technology
Ms. Kate Rooney, Women’s Resource Center, UNM
Ms. Summer Little, Women’s Resource Center, UNM
Thanks are due to New Mexico businesses for their kind support in filling out the survey and providing
data as well. I would like to thank the mothers who participated in focus group discussions and thank
mothers who fill out the survey.
As always, I appreciate the assistance provided by BBER staff and students. I would like to thank
BBER Director Dr. Lee Reynis for providing the necessary support to accomplish this study. Thanks
are due to Dr. Gwen Aldrich for her help from the beginning of the project, especially her help in
literature review, business survey, mother survey, and focus group discussion. I would like to thank
Suzan Reagan, Senior Program Manager, Data Bank, for her support in finding data. I would like to
thank Mr. Michael O'Donnell for editing business survey and mother survey reports. Special thanks
go to Pavel Babuska, BBER Research Assistant, for his effort in conducting business survey and
collecting data. I would like to thank Graham Gentz, BBER Research Assistant, for collecting data
and editing this report.
-Doleswar Bhandari
ix
EXECUTIVE SUMMARY
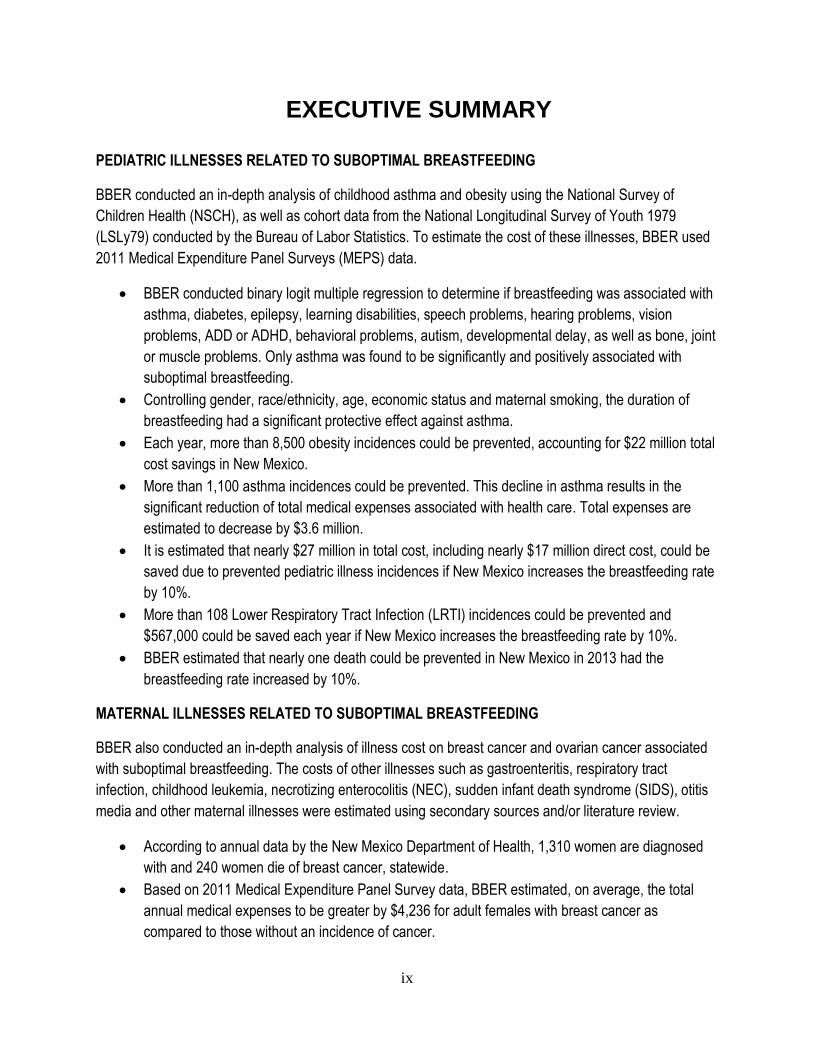
PEDIATRIC ILLNESSES RELATED TO SUBOPTIMAL BREASTFEEDING
BBER conducted an in-depth analysis of childhood asthma and obesity using the National Survey of
Children Health (NSCH), as well as cohort data from the National Longitudinal Survey of Youth 1979
(LSLy79) conducted by the Bureau of Labor Statistics. To estimate the cost of these illnesses, BBER used
2011 Medical Expenditure Panel Surveys (MEPS) data.
BBER conducted binary logit multiple regression to determine if breastfeeding was associated with
asthma, diabetes, epilepsy, learning disabilities, speech problems, hearing problems, vision
problems, ADD or ADHD, behavioral problems, autism, developmental delay, as well as bone, joint
or muscle problems. Only asthma was found to be significantly and positively associated with
suboptimal breastfeeding.
Controlling gender, race/ethnicity, age, economic status and maternal smoking, the duration of
breastfeeding had a significant protective effect against asthma.
Each year, more than 8,500 obesity incidences could be prevented, accounting for $22 million total
cost savings in New Mexico.
More than 1,100 asthma incidences could be prevented. This decline in asthma results in the
significant reduction of total medical expenses associated with health care. Total expenses are
estimated to decrease by $3.6 million.
It is estimated that nearly $27 million in total cost, including nearly $17 million direct cost, could be
saved due to prevented pediatric illness incidences if New Mexico increases the breastfeeding rate
by 10%.
More than 108 Lower Respiratory Tract Infection (LRTI) incidences could be prevented and
$567,000 could be saved each year if New Mexico increases the breastfeeding rate by 10%.
BBER estimated that nearly one death could be prevented in New Mexico in 2013 had the
breastfeeding rate increased by 10%.
MATERNAL ILLNESSES RELATED TO SUBOPTIMAL BREASTFEEDING
BBER also conducted an in-depth analysis of illness cost on breast cancer and ovarian cancer associated
with suboptimal breastfeeding. The costs of other illnesses such as gastroenteritis, respiratory tract
infection, childhood leukemia, necrotizing enterocolitis (NEC), sudden infant death syndrome (SIDS), otitis
media and other maternal illnesses were estimated using secondary sources and/or literature review.
According to annual data by the New Mexico Department of Health, 1,310 women are diagnosed
with and 240 women die of breast cancer, statewide.
Based on 2011 Medical Expenditure Panel Survey data, BBER estimated, on average, the total
annual medical expenses to be greater by $4,236 for adult females with breast cancer as
compared to those without an incidence of cancer.
x
On average, total annual medical expenses were estimated to be $4,851 more for adult females
with ovary cancer as compared to those without an incidence of cancer.
BBER estimates a significant reduction in hypertension (401 incidences), breast cancer (37
incidences), and MI (104 incidences) if New Mexico increased its breastfeeding rate by 11% in one
year. In addition, nearly 33 deaths could be prevented in New Mexico.
Among the maternal illnesses associated with suboptimal breastfeeding, hyper tension accounts
for the highest expenditures, with $2.8 million (43% of cost savings).
The second highest cost savings were estimated for MI ($1.7 million or 25%).
Type 2 diabetes accounts for nearly a million dollar savings. In the Bartick et al. estimation, using a
3% discount rate, the average cost of premature death was $4.15 million. If the same value of
statistical life is applied to New Mexico premature deaths (i.e. 33), it would be $137 million every
year in 2011 dollars.
BUSINESS SURVEY
As part of the cost-benefit analysis of breastfeeding in New Mexico, BBER conducted survey of New
Mexico businesses regarding the cost and availability of nursing room, maternity leave, flex-time,
awareness of the laws pertaining to the use of breast-pumps in the workplace, and business performance.
BBER conducted this survey by using Survey Monkey, an internet based platform, from mid of January to
the end of April, 2014. BBER sent survey requests to more than 17,000 New Mexico businesses and
received only 274 usable responses. The length and difficulty of the survey might explain the low response
rate. This also might indicate that businesses were reluctant to share their information on this issue. The
purpose of this business survey was not only to collect data but also to inform business about the best
practices for employee management and breastfeeding support needed for their employees. Due to low the
response rate, the margin of error on our estimates could be huge. Therefore, our results should be used
cautiously.
The BBER survey attempted to address following questions:
What is the cost for businesses to provide breastfeeding support to their employees? Are businesses
aware of the laws related to the use of breast pumps in the workplace? Do businesses provide nursing
space(s) for their breastfeeding employees? What kind of breastfeeding-related support do businesses
provide for their employees? Do businesses provide paid/unpaid maternity leave? Is paid maternity leave
contingent upon having sufficient balances of annual/sick leave or are there separate benefits to cover the
cost of maternity leave? Are businesses aware of what makes a workplace "breastfeeding friendly"? What
is the value of productivity loss that accommodates the needs of the breastfeeding employee? Are
businesses aware of the value in increased productivity from employee job satisfaction due to working in a
supportive environment?

xi
The main highlights of the survey findings are presented as follows:
Overall, small businesses employ a higher proportion of women compared to larger businesses.
Businesses with 50 or less employees have a larger share of female employees (50% or more)
compared to businesses with 201 or more employees (38%).
Nearly all responding businesses (95%) reported that they are aware of the legal right to
breastfeed in public.
A full 65% of businesses reported that they are aware of the New Mexico workplace breast milk
pumping law. The reported level of awareness, however, increases with size of businesses.
Overall, 65% of businesses reported they "know what makes a workplace breastfeeding friendly."
Across all businesses, 72% responded that they have space(s) for employees to nurse or express
breastmilk.
Survey results show that on average there is one nursing space available for 65 female employees
in New Mexico. This ratio decreases for smaller businesses.
Most businesses (73%) provide unpaid maternity leave for their employees; however, 3% reported
they do not provide any maternity leave and 19% reported they do not have fixed policy on
maternity leave.
Only 30% of businesses have a provision of maternity leave which is not contingent upon sufficient
balances of annual/sick leave. Of 180 responses, 16% of businesses indicated a separate benefit
to cover the cost of maternity leave.
The overall duration of average allowable unpaid maternity leave was 60 days.
Among OECD countries, Australia and United Kingdom ranked the highest in providing paid
maternity leave (52 weeks), followed by Norway (35 weeks), Slovakia (34 weeks), and Czech
Republic (28 weeks). Nearly all countries provide support through their social security programs or
social insurance programs. The United States is one of the few industrialized nations that does not
provide paid family leave for new parents.
Of the total 184 business responses, nearly 80% reported that they provide for a flexible work
environment with “part-time” options and almost 70% provide “flex-time” options.
The survey asked “Research has shown that there are lower medical cost and health insurance
claims for breastfeeding employees and their infants (relative to formula fed). Is this true for your
entity?” Of the 254 respondents, the vast majority (90%) reported that they did not know about it.
BBER estimated that the average monthly value of productivity loss to accommodate the needs of
a breastfeeding employee was $67.
86 businesses estimated the average monthly value of increased productivity due to working in a
supportive environment. A majority (60%) reported that they “do not know but save a lot”. The
average monthly value of increased productivity was $1,320.
On average, 71% of New Mexico businesses are spending $87 per month per nursing space; the
annual cost of 4,097 nursing spaces is estimated to be $4.2 million. This number is very small if
compared to the long-term average monthly value of increased productivity from employee job
satisfaction.

xii
MOTHER SURVEY
As part of the cost-benefit analysis of breastfeeding in New Mexico, BBER conducted survey of mothers to
estimate cost and benefit of breastfeeding and formula feeding. The main objective of the survey was to
understand mothers, their work-life balance, work hours, breastfeeding challenges and duration, childcare
costs, level of satisfaction as a mother, satisfaction with their health, their youngest child’s health, and
satisfaction with their family’s financial health.
Women over 18 years of age with at least one child less than 5 years of age were asked to participate. The
survey was conducted from May to June, 2014. The survey was designed and uploaded to the Survey
Monkey website. Survey questions were pretested and refined after two separate focus group discussions
with breastfeeding and formula feeding mothers. A total of 372 survey responses were collected.
Due to the lack of mothers’ contact addresses, BBER could not make a random sample of New Mexico
mothers. BBER relied on convenience sampling, a non-probability sampling technique where mothers were
selected through their convenient accessibility to social media such as Facebook, email, WIC clinic, and
referrals. BBER used two separate censored regression models to explain work hours and monthly
income.
The survey findings are as follows:
Only 54% of surveyed mothers with a child less than 5 years old work for remuneration. More than
30% of mothers worked 31 hours or more, 15% worked less than 20 hours per week and 7% work
between 21 to 30 hours.
The average number of work hours per week was 16 (SD=17.7) and average monthly wage or
salary of mother was $1,506 (SD=2003) including those who do not work at all. The average
household income was $4,454.
The level of education was significant in determining weekly work hours. Controlling other factors
(such as ethnicity, length of breastfeeding, mother’s age, number of children, and household
income), a one year increase in educational attainment results in a corresponding increase of 3.6
hours of work.
The length of breastfeeding was found to be negatively associated with weekly work hours.
Controlling other factors, roughly every 3 months increase of breastfeeding is associated with a
one hour decrease in weekly work hours.
Controlling other factors, married mothers work nearly 12 hours less compared to other categories
of marital status, just as single, divorced, or separated. Married mothers may possess more
resources (financial or otherwise) and thus be able to work shorter hours which can be used to
care for children.
Each additional child below 5 years of age results in a reduction of 8.2 work hours for mothers.

xiii
Controlling other factors, higher income families tends to work longer hours compared to lower
income family. Every additional one thousand dollar of monthly household income increases hours
of work per week by 1.2.
Controlling other factors, the length of breastfeeding is found to be significantly negative in relation
to mothers' monthly income. Each additional day of breastfeeding results in a reduction of $1.65 of
monthly income; each additional month of breastfeeding results in a reduction of $50 to mother’s
monthly income.
As the total number of children under 5 years of age increases, the mothers' monthly income
decreases. Each additional child under 5 years of age results in a reduction of $779 in monthly
income.
NEW MEXICO WOMEN-INFANTS-CHILDREN (WIC) PROGRAM
The WIC Nutrition Program provides nutrition services and food assistance for low -to-moderate income
families with pregnant women, breastfeeding and early postpartum mothers, infants and children up to their
fifth birthday. WIC services include nutrition education, breastfeeding support, healthcare and other
community services, and checks for specific nutritious foods that are redeemable at retail food outlets
throughout the state.
There were more than 8.3 million WIC participants in the US and 58,376 participants in New Mexico in
FY14. Total participation has declined from about 65,472 in FY10 to about 58,376 in FY14. Total program
cost in the same fiscal year was $6.3 billion in US and 41 million in New Mexico. Food cost accounted for
69% of the total expenditure in US and 64% in New Mexico, respectively. Monthly food cost per person in
FY14 was $33.80 in New Mexico, $9.85 lower than the national average.
Some highlights of the analysis are as follows:
About 49% women were partially breastfeeding and 51% women were fully breastfeeding. The
majority of infants (73%) were fully formula fed; only 19% were fully breastfed, and the remaining
8% were partially breastfed.
The total food cost for the New Mexico WIC program was $22.6 million. About 58% of the cost was
covered by rebates.
According to the USDA, Food & Nutrition Service program, a total of 13,276 infants and 8,136
mothers participated in WIC during federal FY14.
Of the 26,992 total live births in New Mexico, 63% infants enrolled in the WIC program in 2012-13.
The most expensive food package combinations were for exclusive formula during the infant's first
6 months.
Overall, the exclusive breastfeeding package cost $140 less during infant month 0-3.9 and $141
less during infant month 4-5.9 period and $35 less while the infant was six to 12 months of age.
xiv
If the statistics for mothers and infants were combined, the largest source of expenditure would
again be exclusive formula feeding in 0-3.9 months and 4-5.9 month age categories. The lowest
expenditure is estimated for the partial breastfeeding group.
The results show that exclusive breastfeeding of all WIC infants will save nearly $3.26 million a
year. BBER’s analysis clearly shows that there is significant saving in WIC food expenditure if more
women breastfeed their infants.
NEW MEXICO MEDICAID PROGRAM
In New Mexico, a total of 71,200 children (13%) below 19 years of age did not have health
insurance in FY12. In the case of low income children, only 10% were covered by employer-
sponsored insurance, but 68% of low-income children were covered by Medicaid. A relatively large
proportion (18%) of low income children did not have health insurance in FY12.
According to the Kaiser Foundation, New Mexico spent more than $3.3 billion in Medicaid
expenditure in FY10. Of the total, 48% was spent on children.
According to the American Academy of Pediatrics1, the total Medicaid expenditure for children’s
services (ages 0-20) was $1.1 billion in FY09 and $2,990 per child.
About 84% of Medicaid expenditures for hospitalizations occurred for breastfeeding-related
illnesses.
In New Mexico, 70% of the Medicaid expenditure is born by the federal government with the
remaining 30% sustained by the state.
Most of the Medicaid spending in New Mexico for FY12 was accounted for by acute care services
(88% or $3 billion) while 10% was accounted for by long-term care. The remaining 2% was
accounted for by Disproportional Share Hospital (DSH) payments.
A total 5,052 hospitalization occurred in New Mexico during 2011 with a total expenditure of $208.6
million. Medicare accounted for 37% (or 1859 cases) of hospitalization, and born 44% ($92.6
million) of the cost. Medicaid ranked third in terms of number of hospitalizations and total
expenditures. Medicaid paid for 20% of the hospitalizations in New Mexico with $22.4 million in
expenditures.
Of the illnesses related to breastfeeding, nearly 40% of total hospitalizations were diabetes.
Bronchiolitis composed 30% of hospitalizations, with breast cancer composing 11%.
1 Medicaid state report: http://www.aap.org/en-us/professional-resources/Research/research-
resources/Pages/Medicaid-State-Reports.aspx

1
1. Introduction
New Mexico Breastfeeding Task Force (NMBTF) commissioned the University of New
Mexico’s Bureau of Business and Economic Research (BBER) to conduct a cost-benefit analysis
of increasing the breastfeeding rate in New Mexico. Breastfeeding is associated with reduced
risk of many diseases in infants, children, adolescents, and mothers. Notwithstanding,
breastfeeding is also associated with earning losses for the mother, associated with fewer hours
of work, or no work, as well as decreased competitiveness in the job market. Some studies’
findings provide evidence in support of breastfeeding while others contradict them. The general
findings of these studies imply that breastfeeding not only impacts infants, children, mother, and
the entire family, but also health service providing organizations and job providing entities or
professions. Indeed, breastfeeding impacts society in various ways. Therefore, it is imperative
to conduct a holistic and objective analysis which takes into consideration the various parties that
may be impacted by breastfeeding. To this end, BBER conducted a cost-benefit analysis of
breastfeeding for families, New Mexico Employers, as well as Medicaid and WIC government
programs.
The rest of the report is organized as follows. Chapter 2 presents the cost analysis of pediatric
and maternal illnesses associated with suboptimal breastfeeding. BBER conducted an in-depth
analysis for childhood asthma and obesity using the National Survey of Children Health (NSCH)
as well as cohort data from the National Longitudinal Survey of Youth 1979 (LSLy79)
conducted by the Bureau of Labor Statistics, respectively. To estimate the cost of these illnesses,
BBER used 2011 Medical Expenditure Panel Surveys (MEPS) data. BBER also conducted in-
depth analysis of illness cost on breast cancer and ovarian cancer associated with suboptimal
breastfeeding. The costs of other illnesses, such as gastroenteritis, respiratory tract infection,
childhood leukemia, necrotizing enterocolitis (NEC), sudden infant death syndrome (SIDS),
otitis media and other maternal illnesses, were estimated using secondary sources and/or
literature review.
Chapter 3 discusses the survey of New Mexico businesses conducted from February to April,
2014. The survey collected data on the awareness of breastfeeding-related laws, breastfeeding
support, maternity leave, cost of support to breastfeeding employees, and also to inform
employee management best practices. Chapter 4 is devoted the survey of mothers. The main
objective was to understand mothers and their work-life balance, work hours, breastfeeding
challenges or duration, childcare cost, satisfaction as a mother, satisfaction of health and
youngest child’s health, as well as satisfaction of their family’s financial health. Chapter 5 and
Chapter 6 present the cost-benefit analysis of breastfeeding on New Mexico WIC program and
New Mexico Medicaid programs, respectively.
.

2
2. Cost Analysis of Pediatric and Maternal Illnesses
2.1 Cost Analysis of Pediatric Illnesses Associated with Suboptimal
Breastfeeding
2.1.1. Relationship between Childhood Asthma and Breastfeeding
2.1.1.1 Background
Asthma is a chronic lung disease that affects an estimated 16.4 million adults (aged ≥ 18 years)
and 7.0 million children (aged < 18 years) in the United States2. In 2008, an estimated 38,410
children in New Mexico had asthma with the current asthma prevalence being 7.6% among
children3.
General consensus is that breastfeeding protects against many infections, including childhood
asthma. Information from various studies and data sources was used to estimate the changes in
medical expenses attributable to childhood asthma in relation to improving breastfeeding rate for
New Mexico population. We first estimated the annual medical expenses attributable to
childhood asthma. Then, through the simulation, we estimated the effect of improving the
breastfeeding rate on childhood asthma prevalence rate and total medical expenses.
2.1.1.2 Studies on Childhood Asthma and Breastfeeding
During the last few decades the incidence of asthma among children under the age of 4 has risen
160% (Eichenfield et al., 2003). Although many studies have assessed the relationship between
breastfeeding and asthma, results tend to be equivocal due to the fact that many studies are
nonrandomized, retrospective, or observational (Greer et al., 2008). The Eidelman et al. (2012)
cites results published by Ip et al. (2007), which updated a 2001 meta-analysis (Gdalevich et al.,
2001) founding an odds ratio favoring exclusive breastfeeding for at least 3 months of 0.70 (95%
CI 0.60-0.81). Ip et al. (2007) stratified the updated meta-analysis by family history of asthma.
The meta-analysis of children without a family history of asthma yielded an odds ratio (OR) in
favor of exclusive breastfeeding (for at least 3 months) of 0.73 (95% CI 0.59-0.92). The meta-
analysis pertaining to children with a family history of asthma suggested no statistically
significant relationship between breastfeeding and asthma (ORadj 0.81 with 95% CI of 0.41-
1.60)4. However, the finding of non-significance was driven by the inclusion of one study –
2 National Health Interview Survey (NHIS), 2008
3 Behavioral Risk Factor Surveillance System (BRFSS), 2008
4 Studies new to the 2007 meta-analysis were: Kull et al. (2004); Wright et al. (2001); Burgess et al. (2006)

3
Wright et al. (2001), which (as noted by Ip et al.) differed from the other studies in that the age
of follow up was 13 years, while the age of follow up in other studies ranged from 2 to 9 years.
When Wright et al. (2001) was excluded from the meta-analysis update, results indicated that
exclusive breastfeeding for at least 3 months (for children with a family history of asthma) is
associated with a reduced risk of asthma (ORadj 0.60 with 95% CI of 0.43-0.82).
Greer et al. (2008) discussed the research conducted by Wright et al. (2001), and noted that the
definition of asthma used by Wright et al. is more accurate – in their study Wright et al.
distinguish between the “wheezy bronchitis associated with viral infections in younger children
and that of the allergic disease seen in older children” (Greer et al., 2008). This suggests that the
result found by Wright et al. – that exclusive breastfeeding (EBF) for any length of time is
associated with an increased risk of asthma in children with mothers who suffer from asthma –
may in fact result from the authors’ more accurate definition of asthma. A similar result (an
association between BF and an increased risk of asthma; however, the increased risk was not
associated with maternal asthma) was found in a New Zealand study (Sears et al., 2002),
although the study has been criticized for a number of design flaws.
Ultimately there appears to be a difference of opinion regarding how to interpret the divergent
results regarding the relationship between BF and asthma. The 2012 Eidelman et al. article
appears to interpret the results to mean that BF reduces the risk of asthma, while Greer et al.
(2008) appear to interpret the results to mean that an accurate definition of asthma may yield
results that suggest that BF increases the risk of asthma. As explained by Guilbert and Wright
(2012) in their brief review and discussion of the disparate results found by researchers, there are
numerous potential explanations for the disparity, including how exclusive breastfeeding is
defined, potential reverse causation, asthma definitions, etc.
Research conducted by Brew et al. (2012) aims to disentangle divergent results found in two
studies – one in Australia and a second in Sweden. The Australian study found that BF provided
no protection against asthma at 5 years of age, and furthermore that BF for at least 6 months was
associated increased sensitization to allergens at 5 years of age. In contrast, the Swedish study
found that BF did offer protection against asthma and allergen sensitization at both 4 and 8 years
of age. Brew et al. were able to obtain access to individual data from both studies and thus were
able to harmonize most (but not all) aspects of the studies and conduct a meta-regression (rather
than the typical meta-analysis). The authors found that once harmonized the results indicate that
longer BF duration in general had no impact on asthma risk. The one exception occurred within
the Swedish population, in which longer BF duration was associated with a somewhat increased
prevalence of asthma among 8 year olds.
A recent study by Silvers et al. (2012) attempted to address the discrepancies in results from
prior research pertaining to (a ) the relationship between breastfeeding and asthma in children of
different ages and (b) the relationship between breastfeeding and asthma in children either with
atopy or a family history of allergic disease. The study was stronger than many others in that it
4
was prospective and clear definitions were used for asthma and exclusive breastfeeding. Results
indicate that breastfeeding, and in particular exclusive breastfeeding, offers protection against
asthma in children ages 2 through 6. The intensity of protection offered by breastfeeding was
found to diminish with age. The protection offered by exclusive breastfeeding was more
pronounced among children with atopy who were more than 3 years of age. Silvers et al. discuss
differences between their results and those of other studies, in particular results derived by
Burgess et al. (2006), Mandhane et al. (2007), Sears et al. (2002), and Wright et al. (2001).
Studies that show no relationship between breastfeeding and asthma among older children may
simply reflect the diminished benefit found by Silvers et al. (2012). Studies that indicate that
breastfeeding increases the risk of asthma may suffer from poor data quality, in particular poor
quality breastfeeding data. Finally, Silvers et al. note that due to differences in food supply,
environmental contaminants, etc., it may not be appropriate to compare findings derived in
different geographic locations.
2.1.1.3 Data and Methods
This study uses the data from the National Survey of Children’s Health (NSCH) 2011/12, which
was collected by telephones during the period from February 28, 2011 to June 25, 2012 by the
Centers for Disease Control and Prevention (CDC) and the National Center for Health Statistics.
The survey was sponsored by the U.S. Department of Health and Human Services, Health
Resources and Services Administration, Maternal and Child Health Bureau. Randomly selected
telephone numbers were dialed to identify households with children ages 0-17. When a
household had two or more children, one child was randomly selected for the questionnaire. The
interview questions were asked to the adult in the household who knew more about the child’s
health. The data included 95,677 completed interviews in 50 States and DC with children ages 0-
17 years. The questions on breastfeeding were asked only for children ages 0-5 years, which
included 29,997 completed surveys.
There were 4 questions specific to a child’s breastfeeding:
[1] Was the child ever breastfed or fed breast milk? (Yes/No)
[2] How old was he/she when he/she completely stopped breastfeeding or being fed breast
milk? (Standardized to age in Days and top coded)
[3] How old was the child when he/she was first fed formula? (Standardized to age in Days)
[4] How old was the child when he/she was first fed anything other than breast milk or
formula? (Standardized to age in Days)
For each question, the respondent had the options of either responding with “Don’t know” or
“Refused to answer”. In order to examine the effect of breastfeeding on child asthma, we
generated the following five variables from the questions outlined above: 1) EVERBREASTFED,
2) DURATION, 3) DURATION_6M, 4) EX_DURATION, and 5) EX_DURATION_6M.
5
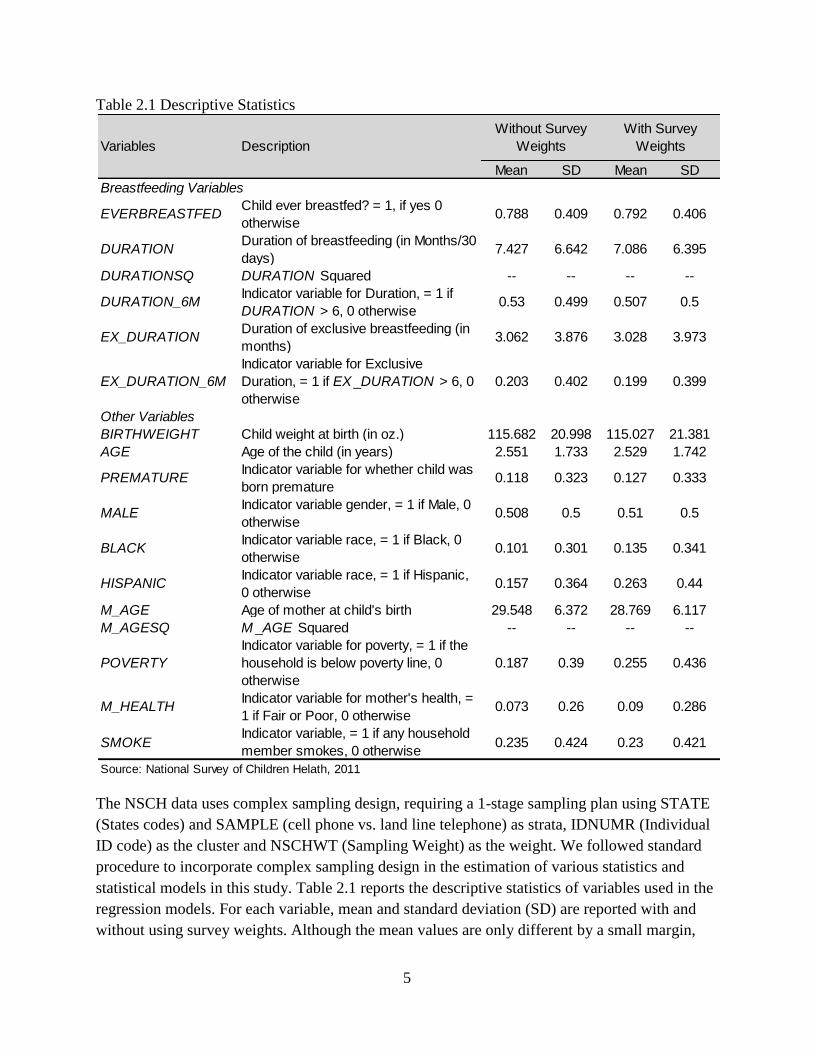
Table 2.1 Descriptive Statistics
The NSCH data uses complex sampling design, requiring a 1-stage sampling plan using STATE
(States codes) and SAMPLE (cell phone vs. land line telephone) as strata, IDNUMR (Individual
ID code) as the cluster and NSCHWT (Sampling Weight) as the weight. We followed standard
procedure to incorporate complex sampling design in the estimation of various statistics and
statistical models in this study. Table 2.1 reports the descriptive statistics of variables used in the
regression models. For each variable, mean and standard deviation (SD) are reported with and
without using survey weights. Although the mean values are only different by a small margin,
Mean SD Mean SD
EVERBREASTFEDChild ever breastfed? = 1, if yes 0
otherwise0.788 0.409 0.792 0.406
DURATIONDuration of breastfeeding (in Months/30
days)7.427 6.642 7.086 6.395
DURATIONSQ DURATION Squared -- -- -- --
DURATION_6MIndicator variable for Duration, = 1 if
DURATION > 6, 0 otherwise0.53 0.499 0.507 0.5
EX_DURATIONDuration of exclusive breastfeeding (in
months)3.062 3.876 3.028 3.973
EX_DURATION_6M
Indicator variable for Exclusive
Duration, = 1 if EX_DURATION > 6, 0
otherwise
0.203 0.402 0.199 0.399
BIRTHWEIGHT Child weight at birth (in oz.) 115.682 20.998 115.027 21.381
AGE Age of the child (in years) 2.551 1.733 2.529 1.742
PREMATUREIndicator variable for whether child was
born premature0.118 0.323 0.127 0.333
MALEIndicator variable gender, = 1 if Male, 0
otherwise0.508 0.5 0.51 0.5
BLACKIndicator variable race, = 1 if Black, 0
otherwise0.101 0.301 0.135 0.341
HISPANICIndicator variable race, = 1 if Hispanic,
0 otherwise0.157 0.364 0.263 0.44
M_AGE Age of mother at child's birth 29.548 6.372 28.769 6.117
M_AGESQ M _AGE Squared -- -- -- --
POVERTY
Indicator variable for poverty, = 1 if the
household is below poverty line, 0
otherwise
0.187 0.39 0.255 0.436
M_HEALTHIndicator variable for mother's health, =
1 if Fair or Poor, 0 otherwise0.073 0.26 0.09 0.286
SMOKEIndicator variable, = 1 if any household
member smokes, 0 otherwise0.235 0.424 0.23 0.421
Source: National Survey of Children Helath, 2011
Other Variables
Variables Description
Without Survey
Weights
With Survey
Weights
Breastfeeding Variables

6
they are nationally representative when survey weights are used in the calculation of these
statistics. As mentioned above, the dataset includes children of ages 0-5 years with an average
age of 2.53 years. The mean weight of children at birth was 115 oz. and approximately 13
percent of the children were born premature. The dataset was evenly distributed gender wise
with 51 percent of the children being male. About 13.5 and 26.3 percent of the children were
Black and Hispanic respectively. The mother’s age at the birth of child was on average 28.8
years. Similarly, 25.5 percent of the children belonged to families with reported income falling
below the poverty line. Approximately 9 percent of the respondents reported mother’s health as
fair or poor with about 23 percent of children having at least one household member with a
smoking habit.
Among the breastfeeding variables, the indicator variable EVERBREASTFED was generated
from the question number [1], which takes on value 1 if the respondent answered “Yes” and 0
otherwise. On average 79.2 percent of the children were breastfed at least once. Similarly, on
average a child was breastfed for approximately 7 months as is represented by the continuous
variable DURATION, which was derived from question [2] and represents the number of months
(or 30 days interval) the child was breastfed. The indicator variable DURATION_6M is also
derived from question [2], where it takes on value 1 if the DURATION is 180 days or more and 0
otherwise. Approximately 53 percent of the sample children were breastfed for 6 months.
The continuous variable EX_DURATION is derived from questions [2], [3] and [4], and refers to
the number of days until the child was exclusively breastfed. The child is said to be exclusively
breastfed when he/she was not being fed anything (formula or any other food) other than breast
milk. Finally, the indicator variable EX_DURATION_6M is derived, which takes on value 1 if
EX_DURATION is 180 or more and 0 otherwise. Only 20 percent of the sample children were
exclusively breastfed for six months.
One of the primary purposes of the NSCH survey was to facilitate the estimation of national and
state-level prevalence for a variety of child health indicators. The survey included information on
various child illnesses such as asthma, diabetes, learning disability, etc. The next section
describes the logistic regression method used to estimate the effect of breastfeeding on child
asthma. Based on the availability of information, this study includes a number of confounding
factors in the logistic regression to analyze the protective effect of breastfeeding on child asthma.
2.1.1.4 Empirical Estimation
This study uses logistic regression analysis to assess the effects of breastfeeding on the
probability of having asthma for children ages 0-5 years. The logistic (or logit) regression model
can be expressed as:
Pr(𝑦 = 1|𝐱) = Λ(𝐱𝛃) =exp(𝐱𝛃)
1 + exp(𝐱𝛃) (1)

7
where 𝑦 is the dependent binary variable, Pr(𝑦 = 1|𝐱) is the probability that 𝑦 takes on value 1
for given values of the vector of independent variables 𝐱, Λ represents link function and is the
cumulative standard logistic distribution function. The logistic regression of 𝑦 on independent
variables 𝐱 = 𝑥1, 𝑥2, … , 𝑥𝑘 estimates the parameter values for 𝛽 = 𝛽0, 𝛽1, … , 𝛽𝑘 using maximum
likelihood method such that
logit[Pr(𝑦 = 1|𝑥)] = log [
𝑃𝑟(𝑦 = 1|𝑥)
1 − 𝑃𝑟(𝑦 = 1|𝑥)]
= 𝛽0 + 𝛽1𝑥1 + 𝛽2𝑥2 +⋯+ 𝛽𝑘𝑥𝑘
(2)
which can be translated to the probabilities as
Pr(y = 1|x) =exp(β0 + 𝛽1𝑥1 + 𝛽2𝑥2 +⋯+ 𝛽𝑘𝑥𝑘)
1 + exp(𝛽0 + 𝛽1𝑥1 + 𝛽2𝑥2 +⋯+ 𝛽𝑘𝑥𝑘) (3)
Once the parameters are estimated, the probability of occurrence can be predicted for a given set
of data. The predicted probabilities are important in estimating the marginal effects or the effects
of discrete changes and are useful in sensitivity analysis.
2.1.1.5 Results
Table 2.2 shows the logistic regression results. Most of the sets of independent variables had
significant effects except birth weight, and mother's smoking on the probability of having
asthma. All breastfeeding related variables such as duration of breastfeeding, duration of
exclusive breastfeeding, and related indicator variables (except ever breastfed) are found to be
significant and negative in all models. Controlling gender, race and ethnicity, age, economic
status and maternal smoking, the duration of breastfeeding had a significant protective effect
against asthma. The ever breastfed variable was found to be not significant, indicating that
breastfeeding should be practiced up to a certain duration to have a protective effect against
asthma. This suggests that public health efforts towards increasing breastfeeding duration could
benefit from targeted interventions that have the potential to improve asthma care and the overall
health of children.

8
Table 2.2 Coefficient estimates from logistic regression
Variables Model 1 Model 2 Model 3 Model 4 Model 5
CONSTANT -1.0245 -1.1322 -1.192 -0.9195 -0.9384
-0.7782 -1.0183 -1.0162 -1.032 -1.0203
BIRTHWEIGHT -0.0039 -0.0025 -0.0027 -0.0029 -0.0032
-0.0027 -0.0033 -0.0033 -0.0033 -0.0033
AGE 0.2874*** 0.3283*** 0.3268*** 0.3145*** 0.3142***
-0.0297 -0.0338 -0.034 -0.0332 -0.0331
PREMATURE 0.4901*** 0.4872** 0.4797** 0.4660** 0.4565**
-0.1582 -0.2 -0.199 -0.1987 -0.2006
MALE 0.5280*** 0.5392*** 0.5501*** 0.5478*** 0.5557***
-0.1 -0.119 -0.12 -0.12 -0.1204
BLACK 0.5965*** 0.6962*** 0.7063*** 0.7069*** 0.6970***
-0.1251 -0.145 -0.1456 -0.1459 -0.1469
HISPANIC -0.2322 -0.2676* -0.2690* -0.2680* -0.2758*
-0.1427 -0.1554 -0.1558 -0.1553 -0.1554
M_AGE -0.1309*** -0.1388** -0.1417** -0.1567** -0.1560**
-0.0472 -0.0618 -0.0614 -0.0626 -0.0618
M_AGESQ 0.0017** 0.0019* 0.0020* 0.0022** 0.0022**
-0.0008 -0.001 -0.001 -0.001 -0.001
POVERTY 0.2945** 0.2353 0.2415 0.2344 0.2431
-0.1223 -0.1483 -0.148 -0.1487 -0.1482
M_HEALTH 0.6443*** 0.7932*** 0.7776*** 0.7957*** 0.7958***
-0.1586 -0.189 -0.1897 -0.1891 -0.1887
SMOKE 0.1152 0.1874 0.2005 0.208 0.1969
-0.1157 -0.1427 -0.1426 -0.1422 -0.1421
EVERBREASTFED -0.153
-0.1215
DURATION -0.0648***
-0.0213
DURATIONSQ 0.0017**
-0.0007
DURATION_6M -0.3610***
-0.12
EX_DURATION -0.0457***
-0.0152
EX_DURATION_6M -0.5137***
-0.1446
McFadden R-sq. 0.0832 0.0915 0.0911 0.0898 0.0912
N 24992 20140 20140 20212 20212
***, **, and * denotes significance at 0.01, 0.05, and 0.1 level; Standard errors are in parentheses
Source: Estimated by Bureau of Business and Economic Research, UNM

9
2.1.1.6 Estimation of Annual Medical Expenses attributable to Asthma
We estimated the annual medical expenditures of children and young-adults aged 5-19 years
associated with childhood asthma. The average medical expenditures attributable to childhood
asthma are estimated using the data from 2011 Medical Expenditure Panel Surveys (MEPS).
MEPS is a national representative survey of the civilian population that quantifies a person’s
total annual medical spending by type of service and source of payment. The data also included
information about each person’s health conditions as well as socio-demographic characteristics,
including age, sex, and race/ethnicity.
2.1.1.7 Method
BBER used a four-equation regression approach to predict annual medical spending attributable
to asthma among children ages 5-19 years. This approach was first proposed by authors of the
RAND Health Insurance Experiment5 and is now commonly applied in medical spending
analyses. The inclusion of variables describing prevalence of asthma into the regression model
allowed us to estimate the expenditures associated with these health conditions. The four
equations model is briefly outlined as follows5:
1) Estimate a logit equation for a dichotomous event of positive versus zero medical
expenditure.
2) Estimate a logit equation for a dichotomous event of positive versus zero inpatient
expense, given that the person has positive medical expenditure.
3) Estimate a linear model on the log scale of positive medical expenses, given that the
person has positive medical expenses but no inpatient expenses.
4) Estimate a linear model on the log scale of positive medical expenses, given that the
person has positive inpatient expenses.
Finally a consistent estimate of the expected medical expense for medical services based on the
four-equation model is given by
E(MedicalExpenditurei) = �̂�𝑖[(1 − �̂�𝑖) exp(𝑥𝑖�̂�3) �̂�3 + �̂�𝑖 exp(𝑥𝑖�̂�4) �̂�4] (4)
where,
�̂� = estimated probability of any medical expense,
�̂� = estimated conditional probability for a medical user to have any
inpatient expense
exp(𝑥𝑖�̂�3) �̂�3 = estimate of the conditional expense for medical services, given that the
person has positive medical expenses but no inpatient expenses
5 For detail see (Manning et al., 1987)
10
exp(𝑥𝑖�̂�4) �̂�4 = estimate of the conditional expense for medical services, given that the
person has positive inpatient expenses
�̂�3, �̂�4 = estimated retransformation factor, each calculated as
�̂�𝑗 =1
𝑛𝑗∑exp(𝜀�̂�𝑗)
𝑖
where,
𝑛𝑗 = sample size for equation 𝑗,
𝜀𝑖𝑗 = ln(𝑦𝑖𝑗) − 𝑥𝑖�̂�𝑗, and
�̂�𝑗 = OLS estimate of 𝛽𝑗
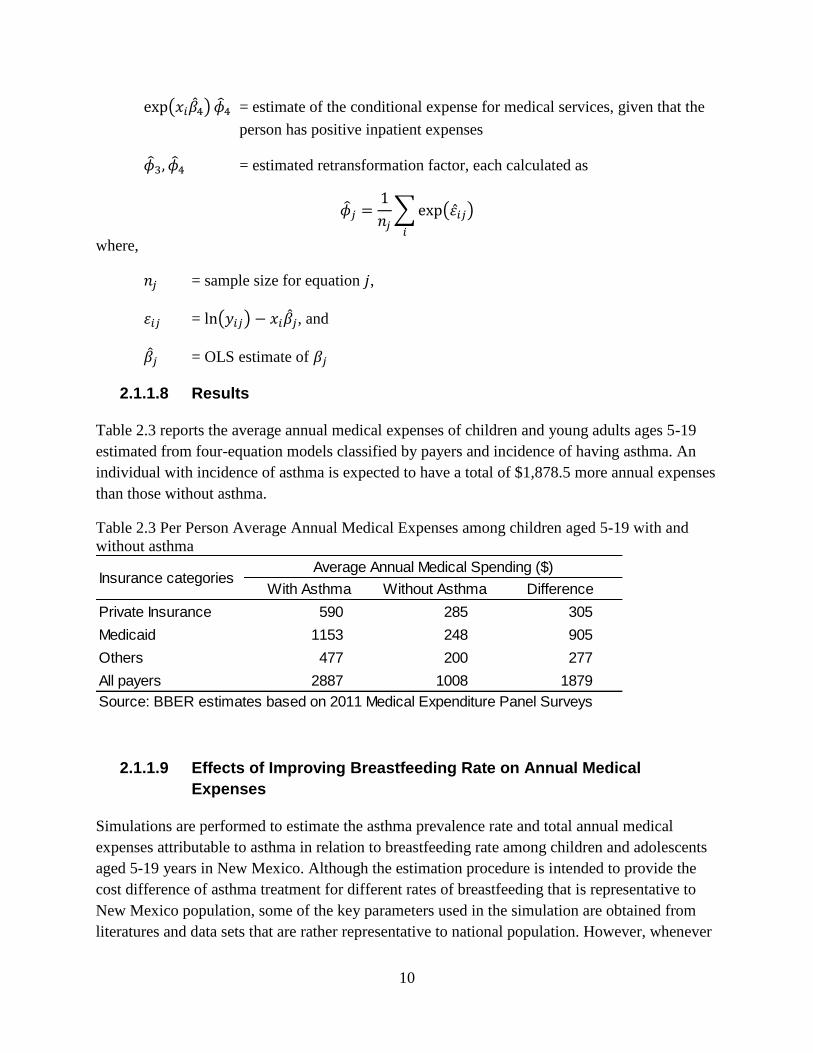
2.1.1.8 Results
Table 2.3 reports the average annual medical expenses of children and young adults ages 5-19
estimated from four-equation models classified by payers and incidence of having asthma. An
individual with incidence of asthma is expected to have a total of $1,878.5 more annual expenses
than those without asthma.
Table 2.3 Per Person Average Annual Medical Expenses among children aged 5-19 with and
without asthma
2.1.1.9 Effects of Improving Breastfeeding Rate on Annual Medical
Expenses
Simulations are performed to estimate the asthma prevalence rate and total annual medical
expenses attributable to asthma in relation to breastfeeding rate among children and adolescents
aged 5-19 years in New Mexico. Although the estimation procedure is intended to provide the
cost difference of asthma treatment for different rates of breastfeeding that is representative to
New Mexico population, some of the key parameters used in the simulation are obtained from
literatures and data sets that are rather representative to national population. However, whenever
With Asthma Without Asthma Difference
Private Insurance 590 285 305
Medicaid 1153 248 905
Others 477 200 277
All payers 2887 1008 1879
Source: BBER estimates based on 2011 Medical Expenditure Panel Surveys
Insurance categoriesAverage Annual Medical Spending ($)

11
the data are available, the parameters are derived for New Mexico population and are used in the
simulation procedure.
2.1.1.10 Simulation Procedure
The main objective of this simulation is to estimate the asthma prevalence and total medical
expenses in relation to estimated asthma prevalence rate for a given rate of breastfeeding in New
Mexico. Simulations are performed for different rates of breastfeeding, and the prevalence rate
and total expenses are computed. In each iteration of the simulations 100,000 individuals are
randomly generated and indicator variables for each individual are assigned on the basis of
whether or not they are breastfed. Each individual has a possibility of being breastfed and the
value of indicator variable depends on the pre-assigned probability. Given the breastfeeding
information, each individual has a possibility of having asthma. Finally, each individual is
assigned a set of health care expenses depending on whether the individual has asthma. Finally,
the average cost per person for each health care expense category is calculated for the entire
100,000 individuals. Since the simulation gives the average health care expenses for all of those
who may or may not have asthma, the total expenses for the entire New Mexico population is
obtained by multiplying each of the expenses by total population ages 5-19 years.
For breastfeeding rates, two scenarios are considered:
1) Ever-breastfed vs. Never breastfed
2) Breastfed 6 months or more vs. breastfed less than 6 months
The result of the simulations from this study is based on the assumption that there is a causal
effect of breastfeeding on childhood asthma so that the likelihood of a child having ‘ever asthma’
depends on whether the child is breastfed. Therefore, there are three key figures utilized while
determining an individual’s likelihood of having asthma: a) percentage of children who are
breastfed for each category, b) percentage of children having asthma for each breastfeeding
category, and c) odds-ratio representing the protective effect of breastfeeding on childhood
asthma. The first two components, namely the current rate of breastfeeding and the likelihood of
having asthma if never breastfed/ breastfed for less than six months, were obtained from
National Survey of Child Health (NSCH) 2011/12 data. From cross-frequency table, determined
11.38 percent of children were never breastfed also had asthma. Similarly, 7 percent of children
breastfed for less than six months reported having asthma. The information for the third
component, viz. odds ratios, was obtained from a recently published meta-analysis (Dogaru et
al., 2014). Table 2.4 summarizes source and values of the key information used in the simulation.

12
Table 2.4 Key parameters used in the simulation
Based on NSCH data, 80.8 percent of the children (ages 0-5 years) in New Mexico are breastfed
at least once and 42.5 percent are breastfed for 6 months (Table 2.3). There exists a wide range
of studies analyzing the effects of breastfeeding rate on asthma, with many supporting the
hypothesis that breastfeeding has protective effects on asthma. However, the actual odds-ratio
varies among studies. This study uses the odds-ratio from the recently published meta-analysis
(Dogaru et al., 2014). The reported odds ratios are the average values calculated for each
breastfeeding category. The average medical expenses were estimated from MEPS data set as
described above.
2.1.1.11 Results
The results from simulations reported in Table 2.6 show the asthma prevalence rate and total
medical expenses for the current rate of breastfeeding (defined as if the child is ever breastfed),
improved rate of breastfeeding (if 10 percent more children were ever breastfed) and the
differences. The results suggest that if the current rate of breastfeeding is increased by 10
percent, asthma prevalence rate decreases by 0.26 percent. This decline in asthma prevalence rate
results in significant reduction in total medical expenses associated with health care; total
expenses (all payers) are estimated to decrease by $2.1 million. The standard deviations and the
reported confidence intervals suggest that these differences are statistically significant
highlighting the importance of breastfeeding in reducing total medical expenses. The results in
Table 2.6 differ from Table 2.5 in terms of the breastfeeding variable used in the analysis.
Because the asthma prevalence rate of children breastfed for 6 months or less is lower than those
who were never breastfed, the asthma prevalence rate and medical expenses are lower in Table
2.6 than in Table 2.5. This shows that breastfeeding in early stage is more important than the
later stage.
Source Key Parameter Values
NSCH Ever-breastfed (New Mexico) 80.80%
Breastfed 6 months (New Mexico) 42.50%
Odds-ratio (ever breastfed vs. never
breastfed)0.76667
Odds-ratio (breastfed
6 months vs. < 6 months)
BBER Database Total population ages 5-19 (New Mexico) 428,469
Meta-analysis Study (Dogaru
et al., 2014)0.70667

13
Table 2.5 Asthma prevalence rate and medical expenses for current and improved rate of
breastfeeding for New Mexico
Current rate of
breastfeeding
Improved rate of
breastfeeding
(when 80.8 percent
were ever breastfed)
(if 90.8 percent were
ever breastfed)
Prevalence Rate 9.23 8.96 0.26
[9.05, 9.41] [8.79, 9.14] [0.01, 0.51]
Private Insurance 134,202.8 133,859 344
[133,966.3, 134,440] [133,631.4, 134,084.1] [14.4, 671.2]
Medicaid 142,111 141,091 1,020
[141,409.4, 142,813.5] [140,416.5, 141,758.6] [42.6, 1,989.8]
Others 96,528 96,216 312
[96,313.2, 96,743.3] [96,009, 96,420.1] [13, 609.5]
All Payers 506,204 504,087 2,117
[504,748.8, 507,662.6] [502,688.3, 505,473.3] [88.3, 4,129.2]
Source: Estimated by Bureau of Business and Economic Research, UNM
Prevalence rate and expense
categories
Difference in
asthma prevalence
and total expenses
for New Mexico
Notes: Prevalence rates are in percentages and expenses are in $1,000 for entire NM population ages 5-19 years. 95%
Confidence Intervals in brackets.

14
Table 2.6 Asthma prevalence rate and medical expenses for current and improved rate of
breastfeeding in New Mexico
2.1.2 Relationship between Childhood Obesity and Breastfeeding
2.1.2.1 Background
Obesity among children has both immediate and long-term effects on health and well-being.
Obesity has more than doubled in children and tripled in adolescents in the past 30 years with an
increase in obese children ages 6-11 years from 7% in 1980 to nearly 18% in 2010 and an
increase in obese adolescents ages 12-19 years from 5% to 18% over the same period (National
Center for Health Statistics (US), 2011; Ogden CL et al., 2012).
2.1.2.2 Studies on Childhood Obesity and Breastfeeding
Metzger and McDade (2010) use linear, logistic and sibling fixed-effects regression models to
evaluate the association between infant feeding history and body mass index in late childhood or
Current rate of
breastfeeding
Improved rate of
breastfeeding
(when 42.5 percent were
breastfed for 6 months)
(if 52.5 percent
were breastfed for 6
months)
Prevalence Rate 6.13 5.92 0.2
[5.98, 6.28] [5.78, 6.08] [-0.01, 0.41]
Private Insurance 130,147.80 129,882 265.8
[129,952.2, 130,342.2][129,694.5,
130,087][-14.4, 535.2]
Medicaid 130,090 129,302.10 787.9
[129,510.2, 130,666.2][128,746.1,
129,909.7][-42.7, 1,586.4]
Others 92,845.60 92,604.20 241.4
[92,668, 93,022.1] [92,433.9, 92,790.4] [-13.1, 486]
All Payers 481,258.40 479,623.40 1,635.10
[480,055.1, 482,454][478,469.5,
480,884.3][-88.5, 3,292.2]
Source: Estimated by Bureau of Business and Economic Research
Prevalence rate and
expense categories
Difference in asthma
prevalence and total
expenses for New
Mexico
Notes: Prevalence rates are in percentages and expenses are in $1,000 for entire NM population
ages 5-19 years. 95% Confidence Intervals in brackets

15
adolescence. Using the data from the 2002 Child Development supplement of the Panel Study of
Income Dynamics, the authors conclude that breastfeeding in infancy may be an important
protective factor against the development of obesity in the United States. A recent study of 7798
children at nine years of age from Ireland used multivariable analysis to show that children who
were breastfed for 13 to 25 weeks were associated with a 38 percent (p < 0.05) reduction in the
risk of obesity and those who were breastfed for 26 weeks or more were associated with a 51
percent (p < 0.01) reduction in the risk of obesity (McCrory and Layte, 2012).
Using an odd-ratio for obesity as outcome variables, two meta-analyses (Arenz et al., 2004;
Owen et al., 2005b) show that the breastfeeding has a consistent protective effect against obesity
in children with an adjusted odds-ratio of becoming obese after having been breastfed ranging
from 0.78 to 0.93 after controlling for other risk factors. Harder et al (2005) use weighted
regression on the odds ratio of overweight from 17 published studies to show a significant
inverse linear relation between the duration of breastfeeding and the risk of overweight. In
another meta-analysis, Owen et al. (2005a) compared the mean differences in BMI between
breastfed and formula-fed children. The authors found that the mean BMI associated with
breastfeeding was slightly lower the mean BNI associated with formula feeding. Nevertheless,
the effect no longer remained significant after taking into account socioeconomics as well as
other confounding factors. Beyerlein and Kries (2011) use quantile regression for data on pre-
school children in southern Germany to show that the protective effect of breastfeeding was
confined to higher BMI percentiles (90th
and 97th
) with no significant point estimates for middle
ranges of percentiles (40th
to 80th
). Crume et al (2012) found similar results for the data on
retrospective cohort children from Denver, Colorado. The authors detected no significant
differences in mean levels of childhood adiposity levels between adequate and low breastfeeding
status using the linear regression. However, the quantile regression showed lower levels of
adiposity levels were associated with adequate breastfeeding for those in the upper percentiles,
particularly the 85th
and 95th
percentiles for BMI. These studies suggest that breastfeeding may
shift individual BMI to the mean and prevent being overweight as well as being underweight.
Oddy (2012) explained the mechanisms behind the associations of breastfeeding, formula-
feeding and later obesity risk observed in epidemiological studies. Infant feeding practices,
growth patterns among infants and presence of bioactive compounds in breast milk have been
found to be important mechanisms associated with the protective effects of breastfeeding against
obesity. Bottle-fed infants in early infancy are more likely to empty bottle or cup during feeding
in late infancy than infants fed directly at the breast (Li et al., 2010). The risk for excess weight
during late infancy is negatively associated with breastfeeding intensity but positively associated
with infant-initiated bottle emptying during early infancy (Li et al., 2008). Hence formula fed
infants may be more likely to have larger meals consuming up to a 20-30% higher volume than
breastfed infants (Sievers et al., 2002). However, a recent trial found the role of free glutamate in
the infant’s regulation of intake, calling into question the claim that formula-feeding impairs
infants’ abilities to self-regulate energy intake (Ventura et al., 2012).

16
Infant growth patterns have also been associated with breastfeeding. By the end of first year,
formula fed-infants weight on average 400-600 grams more than breastfed infants (Gale et al.,
2012). Both observational studies and randomized trials support the hypothesis that a rapid infant
growth is related to the higher risk of obesity (Fewtrell, 2011). Few studies have reported the
associations between protein intake and growth velocity and weight gain (Axelsson et al., 1989;
Fomon et al., 1995). Higher protein content of formula is responsible for an increased growth
rate and adiposity during the influential period of infancy (Koletzko et al., 2009). The studies
that support this early protein hypothesis have compared the BMI infants fed high-protein
formula versus infants fed low-protein formula, showing a higher BMI at 2 years in the high-
protein group and that the BMI values are closer to that of breastfed infants in the low-protein
group (Grote et al., 2010). High-protein intake during 12 months to 24 months of age was
associated with an unfavorable body composition, as measured by BMI and percentage of body
fat, at the age of 7 years (Günther et al., 2007). The presence of bioactive compounds such as
hormones and growth factors in breastmilk appear to be the most important factor contributing to
the protective effects of breastfeeding against obesity in childhood and later in life (Garofalo and
Goldman, 1998; Hamosh, 2001; Lustig, 2001; Savino et al., 2009).
2.1.2.3 Association between breastfeeding and childhood obesity (BBER
analysis)
BBER used a growth curve model to estimate the association between breastfeeding and obesity
among children and young adults. The children and young adult (Child/YA) cohort data from
National Longitudinal Survey of Youth 1979 (NLSY79) was used to assess the association
between breastfeeding and obesity. NLSY79 is a nationally representative dataset containing
information on height and weight of respondents as well as information on breastfeeding and
various socioeconomic characteristics. BMI for each respondent was calculated from the
reported height and weight of each respondent using standard formula. Obesity is determined by
using the CDC’s growth chart: a child or adolescent is considered obese if the calculated BMI
exceeds 95th
percentile of the given age cohort.
2.1.2.4 Method
BBER used two-level mixed effect models to estimate the effect of breastfeeding on obesity. The
two-level growth curve model can be written in the simple form as
logit(𝑝𝑖𝑗) = 𝛽0 + 𝛽1𝑥𝑖𝑗 + 𝑢𝑗+𝜀𝑖𝑗, (5)
where 𝑝𝑖𝑗 is the probability that 𝑦𝑖𝑗 equals one, 𝑦𝑖𝑗 is the binary response variable representing
obesity, 𝑥𝑖𝑗 are the confounders and 𝑢𝑗 is the random effect at level two, 𝜀𝑖𝑗 is the level one
random effect.

17
2.1.2.5 Results
Results from the random intercept model are presented in Table 2.7. All of the variables are
highly significant. The estimated coefficients of all of the variables representing breastfeeding
information have negative signs, which imply that breastfeeding has protective effect against
obesity. The coefficient on EVERBREASTFED in Model 1 is -0.364, which yields an odds-ratio
of 0.695 and indicates that the risk of obesity is 1.44 times higher among children who were
never breastfed than among those who were ever breastfed. In Model 2 the variable DURATION
appears as a quadratic function. Although the estimated coefficient for the DURATION2 term is
insignificant, the estimated coefficient for DURATION is negative and statistically significant,
implying that the risks of obesity decreases with an additional week of breastfeeding (odds-ratio,
OR 0.98). The two breastfeeding variables included in Model 3 (SHORTDURATION and
LONGDURATION) both have negative and statistically significant coefficients, implying that
breastfed infants have a lower risk of obesity in childhood and adolescence, regardless of
whether they were breastfed for a short or long duration. More precisely, children who were
never breastfed are 1.318 (OR 0.759) and 1.487 (OR 0.672) times more likely to be obese than
are those who were breastfed for a short or long period, respectively.
Regression results are used to calculate the predicted probabilities of obesity among children and
adolescents. Model 1 results are used to calculate the predicted probabilities in Figure 1 – the
predicted probabilities of obesity at ages 2 through 20 years among male and female children and
adolescents with respect to whether they were ever-breastfed. Figure 1 clearly illustrates that
predicted obesity probabilities are higher for those who were never breastfed, irrespective of
race, ethnicity, or gender. Figure 2.1 is developed using results from Model 2 and shows the
predicted probabilities of obesity among 10 year old male children with respect to the duration of
breastfeeding. The shape of the probability plots indicate that the protective effects of
breastfeeding against obesity is larger during the initial period. Similar relationships between
breastfeeding duration and predicted probabilities were obtained at different ages and among
females.
The greater importance of the initial weeks of breastfeeding is reiterated by resulted depicted in
Figure 2.2, derived using Model 3 regression results. Figure 2.3 shows the predicted probability
of obesity as a function of short versus long breastfeeding duration. Predicted probabilities are
clearly much lower for breastfed children and adolescents regardless of age, race, ethnicity, or
gender. The largest decrease in the predicted probability of obesity stems from the first 24 weeks
of breastfeeding; those breastfed for more than 24 weeks have only slightly more protection
against obesity than those breastfed for less than 24 weeks.
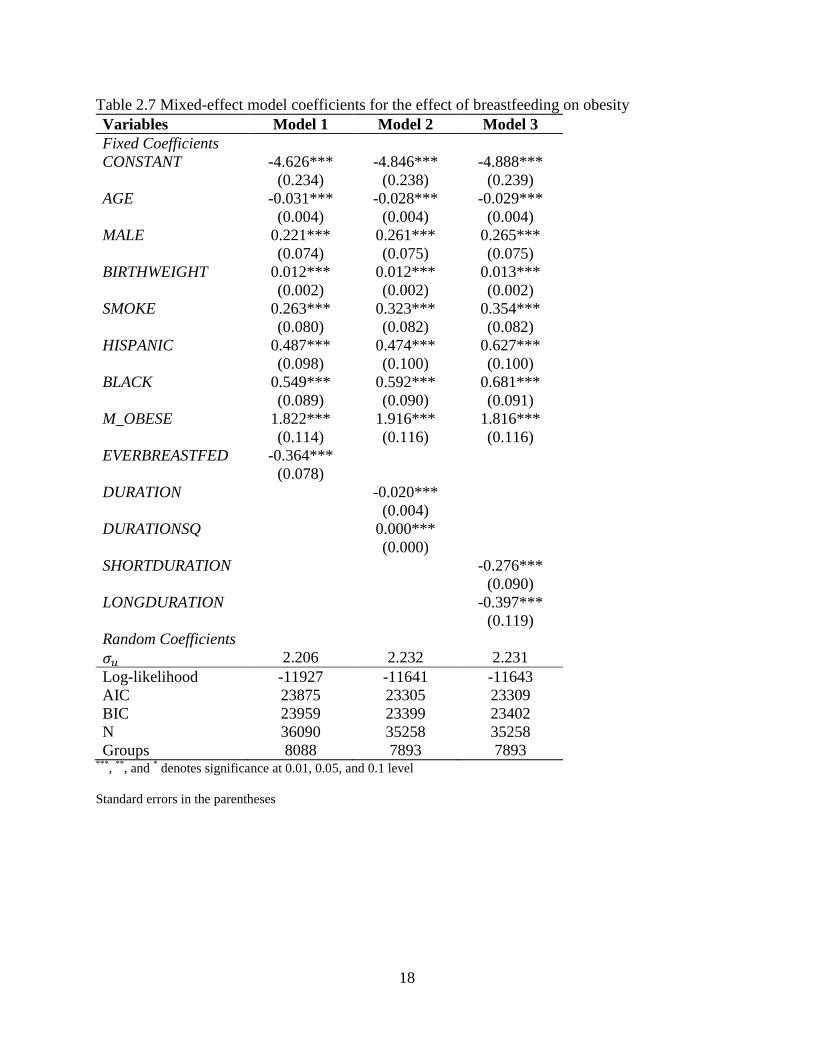
18
Table 2.7 Mixed-effect model coefficients for the effect of breastfeeding on obesity
Variables Model 1 Model 2 Model 3
Fixed Coefficients
CONSTANT -4.626*** -4.846*** -4.888***
(0.234) (0.238) (0.239)
AGE -0.031*** -0.028*** -0.029***
(0.004) (0.004) (0.004)
MALE 0.221*** 0.261*** 0.265***
(0.074) (0.075) (0.075)
BIRTHWEIGHT 0.012*** 0.012*** 0.013***
(0.002) (0.002) (0.002)
SMOKE 0.263*** 0.323*** 0.354***
(0.080) (0.082) (0.082)
HISPANIC 0.487*** 0.474*** 0.627***
(0.098) (0.100) (0.100)
BLACK 0.549*** 0.592*** 0.681***
(0.089) (0.090) (0.091)
M_OBESE 1.822*** 1.916*** 1.816***
(0.114) (0.116) (0.116)
EVERBREASTFED -0.364***
(0.078)
DURATION -0.020***
(0.004)
DURATIONSQ 0.000***
(0.000)
SHORTDURATION -0.276***
(0.090)
LONGDURATION -0.397***
(0.119)
Random Coefficients
𝜎𝑢 2.206 2.232 2.231
Log-likelihood -11927 -11641 -11643
AIC 23875 23305 23309
BIC 23959 23399 23402
N 36090 35258 35258
Groups 8088 7893 7893 ***
, **
, and * denotes significance at 0.01, 0.05, and 0.1 level
Standard errors in the parentheses
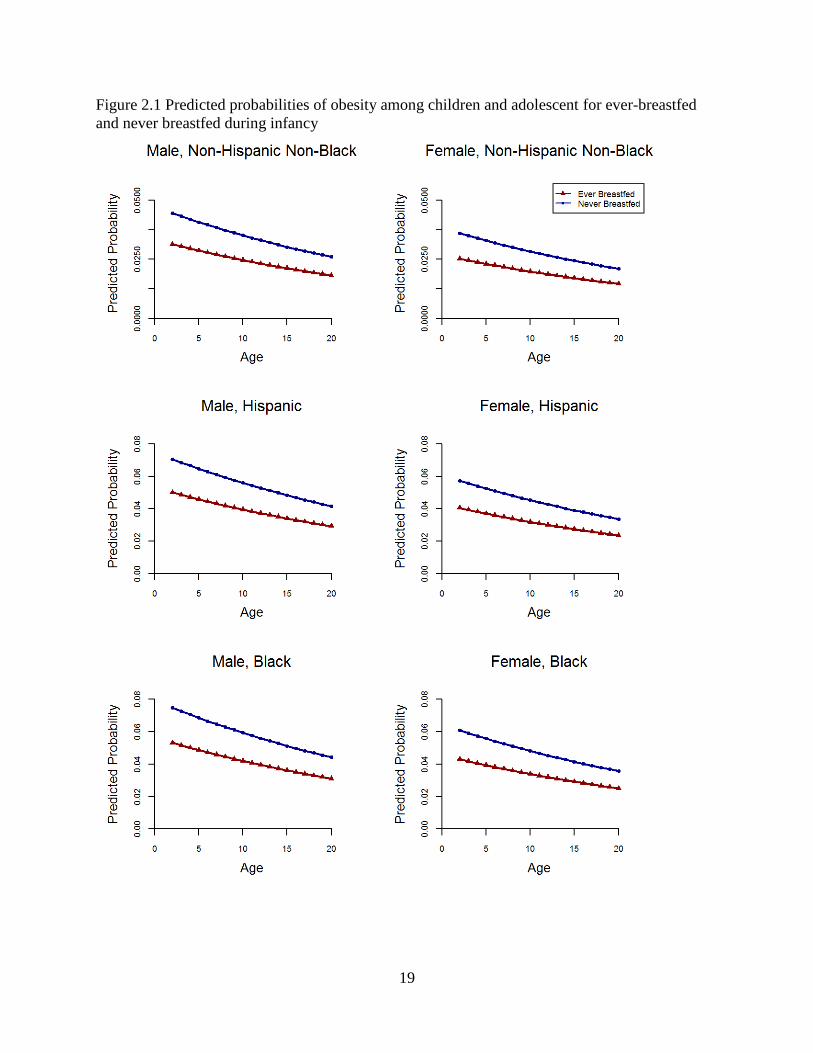
19
Figure 2.1 Predicted probabilities of obesity among children and adolescent for ever-breastfed
and never breastfed during infancy

20
Figure 2.2 Predicted probability of obesity among male children of age 10 years in relation to the
duration of breastfeeding during infancy
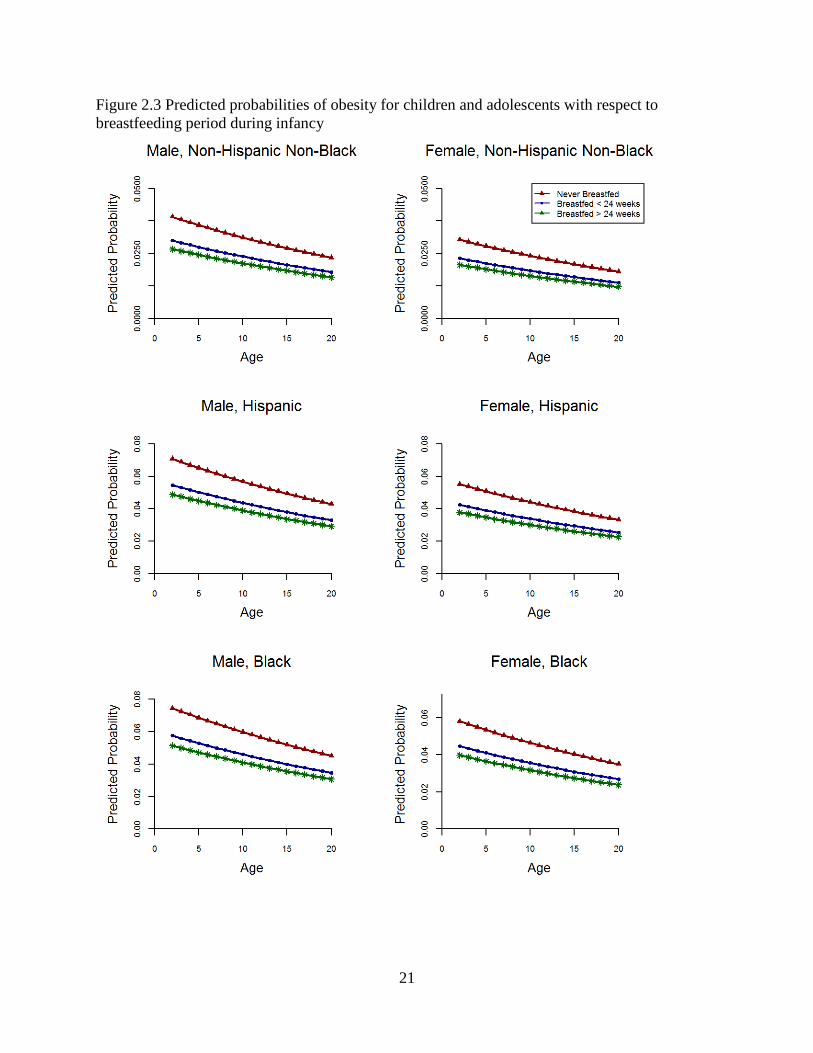
21
Figure 2.3 Predicted probabilities of obesity for children and adolescents with respect to
breastfeeding period during infancy

22
2.1.2.6 Estimation of Annual Medical Expenses attributable to Childhood
and Adult Obesity
We estimated the average annual medical expenditures of children and young-adults aged 6-17
years and adults aged 18 years or more with and without obesity. We utilized the data from 2011
Medical Expenditure Panel Surveys (MEPS) for the estimation of expenses. MEPS data included
information about each person’s health conditions, medical expenses as well as socio-
demographic characteristics, including age, sex, and race/ethnicity. The data also included
information on body mass index (BMI) for children and adults, which were used in the
estimation of medical expenses associated with obesity.
2.1.2.7 Method
We used a four-equation regression approach to predict annual medical spending attributable to
obesity separately for children aged 6-17 years and adults aged 18 years or more. The details of
four-equation regression approach are described in the section: ‘Estimation of Annual Medical
Expenses attributable to Childhood Asthma’.
2.1.2.8 Results
Table 2.8 reports the average annual medical expenses of children and young adults ages 6-17
estimated from four-equation models classified by payers and incidence of obesity. Although the
average annual medical expenses for adults have been found to be significantly larger for obese
individuals as compared to individuals with normal weight, we did not find similar results among
children and young adults.
Table 2.8 Average annual medical expenses among children aged 6-17 with and without obesity
Table 2.9 reports the average annual medical expenses of adults ages 18 years or more estimated
from four-equation models classified by payers and incidence of obesity. The total expenses are
$1,074.8 higher for an average obese adult than for non-obese adult.
With Obesity Without Obesity Difference
Private 203.76 440.01 -236.25
Medicaid 382.08 279.8 102.28
Others 167.02 290.38 -123.36
All payers 1045 1415.1 -370.1
Source: BBER estimates based on 2011 Medical Expenditure Panel Surveys
Insurance
categories
Average Annual Medical Spending ($)
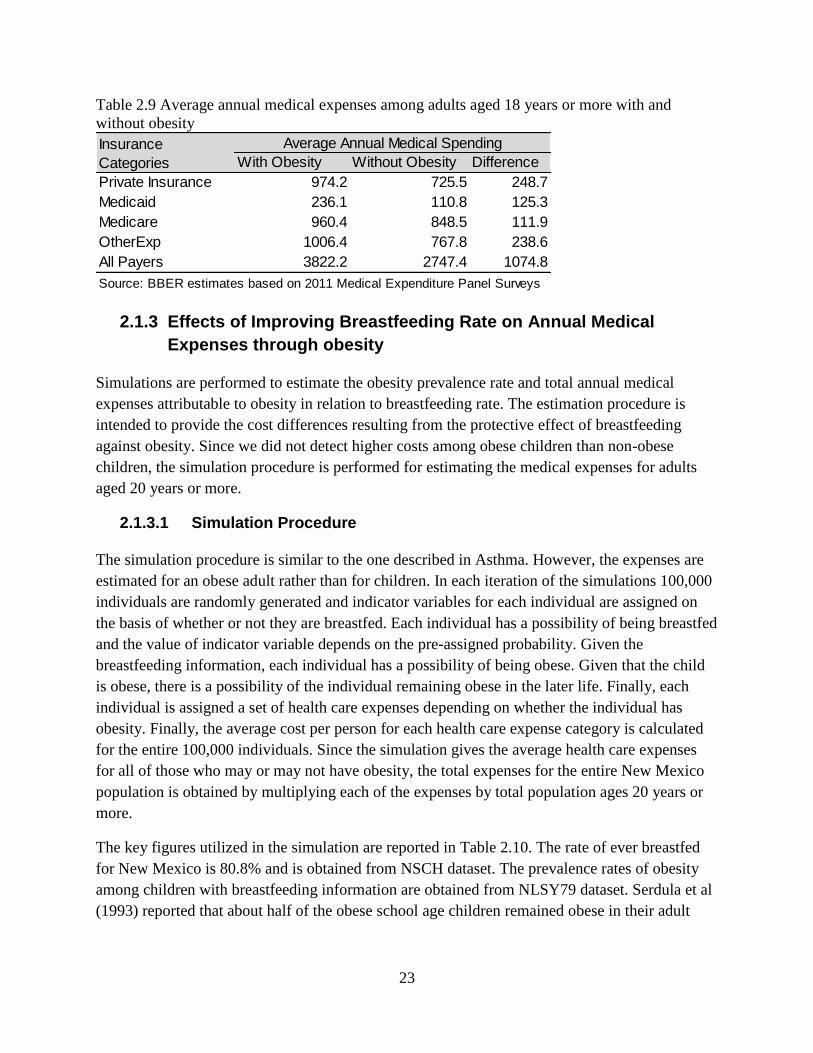
23
Table 2.9 Average annual medical expenses among adults aged 18 years or more with and
without obesity
2.1.3 Effects of Improving Breastfeeding Rate on Annual Medical
Expenses through obesity
Simulations are performed to estimate the obesity prevalence rate and total annual medical
expenses attributable to obesity in relation to breastfeeding rate. The estimation procedure is
intended to provide the cost differences resulting from the protective effect of breastfeeding
against obesity. Since we did not detect higher costs among obese children than non-obese
children, the simulation procedure is performed for estimating the medical expenses for adults
aged 20 years or more.
2.1.3.1 Simulation Procedure
The simulation procedure is similar to the one described in Asthma. However, the expenses are
estimated for an obese adult rather than for children. In each iteration of the simulations 100,000
individuals are randomly generated and indicator variables for each individual are assigned on
the basis of whether or not they are breastfed. Each individual has a possibility of being breastfed
and the value of indicator variable depends on the pre-assigned probability. Given the
breastfeeding information, each individual has a possibility of being obese. Given that the child
is obese, there is a possibility of the individual remaining obese in the later life. Finally, each
individual is assigned a set of health care expenses depending on whether the individual has
obesity. Finally, the average cost per person for each health care expense category is calculated
for the entire 100,000 individuals. Since the simulation gives the average health care expenses
for all of those who may or may not have obesity, the total expenses for the entire New Mexico
population is obtained by multiplying each of the expenses by total population ages 20 years or
more.
The key figures utilized in the simulation are reported in Table 2.10. The rate of ever breastfed
for New Mexico is 80.8% and is obtained from NSCH dataset. The prevalence rates of obesity
among children with breastfeeding information are obtained from NLSY79 dataset. Serdula et al
(1993) reported that about half of the obese school age children remained obese in their adult
With Obesity Without Obesity Difference
Private Insurance 974.2 725.5 248.7
Medicaid 236.1 110.8 125.3
Medicare 960.4 848.5 111.9
OtherExp 1006.4 767.8 238.6
All Payers 3822.2 2747.4 1074.8
Source: BBER estimates based on 2011 Medical Expenditure Panel Surveys
Average Annual Medical SpendingInsurance
Categories

24
life. Therefore, the simulation generates indicator variable denoting obesity at adult life in such a
way that only half of the obese children remain obese.
Table 2.10 Key parameters used in the simulation
2.1.3.2 Results
The results from simulations reported in Table 2.11 show the obesity prevalence rate and total
medical expenses for the current rate of breastfeeding (defined as whether the child is ever
breastfed), improved rate of breastfeeding (if 10 percent more children were ever breastfed) and
the differences. The results suggest that if current rate of breastfeeding is increased by 10
percent, obesity prevalence rate among adult decreases by 0.15 percent. This decline in obesity
prevalence rate results in significant reduction in total medical expenses associated with health
care; total expenses (all payers) are estimated to decrease by $709,000.
It should be noted that the actual obesity prevalence rate among adults may be different than
those reported in Table 2.11. For instance, Ogden et al (2014) reported that 16.9% of children
and adolescents were obese in 2011/12 whereas 34.9% adults were obese during the same period.
Since the goal of this study is to estimate the difference in the obesity prevalence rate resulting
from the change in the breastfeeding rate, the obesity prevalence rate reflects only the projection
from obese children. The simulation in this study is based on the assumption that half of the
obese children remain obese as adults and ignores the other determinants of obesity among
adults.
Source Key Parameter Values
NSCH Ever-breastfed (New Mexico) 80.80%
Prevalence rate of obesity
among children without
breastfeeding
16.14%
BBER DatabaseTotal population ages > 19 (New
Mexico)1,513,533
NLSY
13.08%
Prevalence rate of obesity
among children with
everbreastfed

25
Table 2.11 Obesity prevalence rate and medical expenses for current and improved rate of
breastfeeding for New Mexico
2.1.4 Relationship between lower respiratory tract infection and
breastfeeding
Among U.S. children and infants respiratory infections are more common than any other medical
problem, and three percent of U.S. infants are hospitalized each year with a moderate or severe
respiratory infection. Citing a meta-analysis published by Bachrach et al. in 2003, the AAP states
that infants who are exclusively breastfed for at least 4 months are 72% less likely to be
hospitalized for LRTI (Eidelman et al., 2012).
As noted in the section above pertaining to gastroenteritis, research published by Quigley et al.
(2007) uses breastfeeding and outcome data from the same month to assess the effect of current
breastfeeding. Outcome data from the months after breastfeeding cessation was used to assess
the effects of past breastfeeding. The large sample size (15,890 infants) allowed for more
complex analysis and an ability to account for a wide range of potential confounders. Quigley et
al. find that infants who were exclusively breastfed were less likely to be hospitalized for LRTI
than were infants who were never breastfed (ORadj =0.66, 95% CI 0.47-0.92). As with GI, partial
breastfeeding did not have a statistically significant protective effect, and results indicate that
breastfeeding’s protective effect diminishes after cessation of breastfeeding.
Current rate of
breastfeeding
Improved rate of
breastfeeding
(when 80.8 percent
were ever breastfed)
(if 90.8 percent were
ever breastfed)
Prevalence Rate 6.84 6.68 0.15
[6.67, 6.99] [6.53, 6.84] [-0.07, 0.37]
Private Insurance 318,127.1 317,963 164
[317,954.4, 318,294.4] [317,799.8, 318,127.1] [-71.4, 392.2]
Medicaid 51,140 51,057 83
[51,052.8, 51,224.2] [50,974.9, 51,139.8] [-36, 197.6]
Medicare 366,822 366,748 74
[366,744.4, 366,897.4] [366,674.9, 366,822.1] [-32.1, 176.5]
Other sources 335965 335,807.60 157.4
[335,799.3, 336,125.5] [335,651, 335,965] [-68.5, 376.3]
All Payers 1,208,650 1,207,941 709
[1,207,903.5,
1,209,372.9]
[1,207,235.6,
1,208,649.7][-308.6, 1694.8]
Source: Estimated by Bureau of Business and Economic Research, UNM
Prevalence rate and expense categories
Difference in adult obesity
prevalence and total
expenses for New Mexico
Notes: Prevalence rates are in percentages and expenses are in $1,000 for entire NM population ages 20 years or more. 95% Confidence
Intervals in brackets.

26
Duijts et al. (2010) report on a portion of the results from an ongoing Generation R Study in the
Netherlands (see the section above pertaining to gastroenteritis). The authors find that relative
to infants who were never breastfed, infants who were partially breastfed for less at least 4
months had a decreased risk of developing LRTI (ORadj =0.56, 95% CI ) between the ages of 7
and 12 months. Additionally, and again relative to never breastfed infants, infants who were
exclusively breastfed for at least 4 months and partially breastfed thereafter had a decreased
likelihood of LRTI during both the first 6 months of life (ORadj =0.50, CI 0.32-0.79), as well as
between 7 and 12 months of age (ORadj =0.46, 95% CI 0.31-0.69).
Fisk et al. (2011) note a gap in the existing literature – much of the existing research has focused
on hospital admissions (rather than a broader morbidity outcome) and lacks adjustment for
confounders. Fisk et al. use the Southampton Women’s Survey (a longitudinal birth cohort
study) to focus on the relationship between breastfeeding and LRTI symptoms and adjust for
confounders. The analysis presented by Fisk et al. involved 1,764 infants born to the 12,583
women enrolled in the Southampton Women’s Survey (SWS). Outcomes of interest were
captured both for ages 0-6 months and 6-12 months. Exposure was breastfeeding duration, where
breastfeeding was any and all breastfeeding, and thus included mixed feeding. The statistical
analysis approach taken by the authors differs from that of others. Univariate regressions were
used to assess the relationships between breastfeeding duration (the dependent variable) and
various maternal and infant characteristics (such as maternal age, gestational age, etc.). Those
variables that were statistically significant were subsequently included in a multivariate
breastfeeding duration model. Those variables that were statistically significant in the
multivariate model were considered to be potential confounders and were thus included as
covariates in the morbidity models. Results indicate that breastfeeding duration decreases the
relative risk for all outcomes (including LRTI) during the first 6 months of life. However,
breastfeeding duration did not have a statistically significant impact on the relative risk of LRTI
during the second 6 months of life. To assess whether the protective effects of breastfeeding
endured after cessation of breastfeeding the authors assessed relative risks during the second 6
months of life for those infants who had been breastfed for less than 6 months, and found no
evidence for protective effects beyond breastfeeding cessation.
A recent article (Morales et al., 2012) (referred to in the previous section) reports on a
prospective population-based study conducted in Spain, for which one of the outcomes of
interest was physician-confirmed LRTI diagnosis. The adjusted odds ratios suggests that
predominant breastfeeding for 2-4 months has a protective effect against LRTI (ORadj =0.33,
95% CI 0.13-0.86), while predominant breastfeeding for 4-6 months also decreases the risk of
LRTI diagnosis between 7 and 14 months of age (ORadj =0.51, 95% CI 0.31-0.83) as well as
recurrent LRTIs (ORadj =0.48, 95% CI 0.24-0.96). Estimation of annual medical expenses
attributable to LRTI is presented in Section 2.1.11.
27
2.1.5 Relationship between Gastroenteritis and Breastfeeding
In their 2012 policy statement regarding breastfeeding, the American Academy of Pediatrics
(AAP) states that breastfeeding (regardless of exclusivity) is associated with a 64 percent lower
incidence of gastoenteritis (gastrointestinal infections) (Eidelman et al., 2012). A meta-analysis
conducted by Chien and Howie (2001) is reviewed in the Agency for Healthcare Research and
Quality, U.S. Department of Health and Human Services 2007 report (Ip et al., 2007), which
notes that of the 19 studies reviewed by Chien and Howie, only 4 meet various quality criteria6.2
Of these 4 studies, 3 provided evidence that breastfeeding reduces the risk of gastroenteritis; the
other study found no association.
One of the more recent articles pertaining to the relationship between breastfeeding and
gastrointestinal tract infections is that by Morales et al. (2012). The authors report on a
prospective population-based study conducted in Spain, for which one of the outcomes of
interest was gastroenteritis. Complete information was obtained from 580 (88%) participants.
The exposure variable used was “predominant breastfeeding,” defined as breastmilk
supplemented with non-milk liquids only (e.g. water, tea, fruit juice), for periods of < 2 months,
2-4 months, 4-6 months, and > 6 months. The adjusted odds ratios suggest that predominant
breastfeeding for 4-6 months has a protective effect against GI during the first 6 months of life
(ORadj =0.34, 95% confidence interval (CI) 0.31-0.83), as well as recurrent GI (ORadj =0.37, 95%
CI 0.17-0.77).
Duijts et al. (2010) report on a portion of the results from an ongoing Generation R Study in the
Netherlands. The study is a prospective cohort study – nearly 8,000 mothers of children born
between 2002 and 2006 were enrolled while pregnant. Infectious disease and breastfeeding
duration and exclusivity information was obtained through surveys completed at 6 and 12
months of age. Although the survey did yield information regarding whether the child had
experienced a serious gastrointestinal tract infection, the survey did not yield information
regarding the number of such infections. In addition to breastfeeding variables, covariates
included ethnicity, mother’s education, family medical history, gestational age, birth weight, day
care attendance, and others. Regression analysis was used to assess the importance of the
duration of any breastfeeding and the importance of the duration of exclusive breastfeeding.
Relative to infants who were never breastfed, the risk of gastroenteritis during the first 6 months
of life was lower in infants who were exclusively breastfed for 4 months and subsequently
partially breastfed (OR=0.41, 95% CI 0.26-0.64). However, results pertaining to an association
between gastroenteritis during the first 6 months of life and other breastfeeding measures
(including partial BF for <4 mo with no BF thereafter, partial BF for 4-6 mo, exclusive BF for 4
mo with no BF thereafter, and exclusive BF for 6 months) were all statistically insignificant.
Similarly, no statistically significant associations were found between any of the breastfeeding
6 The criteria are: controlling for detection bias, analyses of confounders, and using clear definitions of infant
feeding practices and outcomes.

28
measures used in the Duijts et al. study and the occurrence of gastroenteritis between 7 and 12
months of age.
Results from research conducted in the UK were published by Quigley et al. (2007). The
breastfeeding exposure variable differs from those used in other studies; the authors used
breastfeeding and outcome data from the same month to assess the effect of current
breastfeeding, and used outcome data from the months after breastfeeding was ceased to assess
the effects of past breastfeeding. The study was also quite large – 15,890 infants were included in
the study, allowing for the more complex analysis and an ability to account for a wide range of
potential confounders. The authors find that infants who were exclusively breastfed were much
less likely to be hospitalized for diarrheal infection than were infants who were never breastfed
(ORadj =0.37, 95% CI 0.18-0.78). Partial breastfeeding did not have a statistically significant
protective effect. Results also provide statistical evidence that shows that breastfeeding’s
protective effect diminishes after cessation of breastfeeding. Estimation of annual medical
expenses attributable to gastroenteritis with suboptimal breastfeeding is presented in Section
2.1.11.
2.1.6 Otitis media
Otitis media is one of the most common infections affecting children; 44 percent of children
have at least one otitis media episode during their first year of life. Formula feeding has been
implicated in increasing infants’ risk of developing otitis media (OM). In their 2007 meta-
analysis of five cohort studies, Ip et al. find that relative to infants who were exclusively
breastfed for either 3 or 6 months, those who received any formula during the first 6 months of
life were twice as likely to develop acute otitis media (95% CI 1.40-2.78). In addition, relative to
those who were ever breastfed, those who were exclusively breastfed had a risk of acute OM that
was reduced by 23 percent.
In 2010 McNiel et al. noted that much of the literature uses formula feeding as the normative
practice and presents the benefits of breastfeeding rather than the risks of formula feeding. The
authors review studies indexed in PubMed that include measures of exclusive breastfeeding, and
re-calculate the odds ratios to reflect the risks of formula use. Pooling the results from three otitis
media studies7, McNiel et al. show that the introduction of formula within the first 3 to 6 months
of life is associated with an odds ratio of 2.00 (95% CI 1.40-2.78).
Abrahams and Labbok (2011) provide a review of more recently published studies (from 2010
and early-2011). Research conducted in Crete (Ladomenou et al., 2010) found a statistically
significant relationship between duration of exclusive breastfeeding and risk of OM in the first
year of life, but an insignificant relationship when exclusive breastfeeding was used as a
dichotomous variable. Due to its use of a large prospective cohort and precise measures of
7 Studies included in their review are 1997 and earlier –Duffy et al. (1997), Scariati et al. (1997); Duncan et al
(1993).
29
breastfeeding, Abrahams and Labbok consider the Ladomenou et al. (2010) study to be of
particular importance. A Finland study (Hatakka et al., 2010) compared infants partially
breastfed for at least 6 months with those partially breastfed less than 6 months and found
breastfeeding to be protective (OR=0.20, 95% CI 0.07-0.56). However, the study does not
include information regarding exclusivity, which thereby limits the ability to interpret results. As
noted by Abrahams and Labbok, a lack of information regarding exclusivity also limits
interpretation of results from a study conducted in the Netherlands, which found no associated
between acute otitis media in the second year of life and infant feeding practices (Labout et al.,
2011). Finally, a small prospective longitudinal study involving 128 children conducted in the
US (McCormick et al., 2011) found no relationship between ever breastfeeding and symptom
severity. However, this study also lacked information regarding exclusivity, as well as duration.
Abrahams and Labbok note that future research should use more precise and consistent
definitions of infant feeding alternatives, and should also distinguish between direct
breastfeeding and the feeding of breast milk via bottle.
Further support for breastfeeding providing protection against OM is provided by Nokso-
Koivisto et al. (2014), who find that infants who are not breastfed (measured as a dichotomous
variable) are at increased risk for developing OM (OR=1.46, P value 0.013). Although their
study was focused on the issue of whether administering a poliovirus vaccine could decrease the
occurrence of otitis media during the first two years of life, Seppala et al. (2011) also control for
breastfeeding (specifically, whether the child was breastfed for more than 6 months), gender, age
at which daycare attendance began, whether pets are present in the home, and number of
siblings. The authors find that breastfeeding had no significant effect on the rate of otitis media
infection, although the study suffers from lack of precise breastfeeding measures. Similarly,
results from a study published by ?, which measures breastfeeding as not breastfed or breastfed
<1 week, 1 week to 3 months, 3-6 months, and >6 months, found no evidence of an association
between breastfeeding and otitis media. Estimation of annual medical expenses attributable to
otitis media with suboptimal breastfeeding is presented in Section 2.1.11.
2.1.7 Childhood Leukemia
In the United States leukemia is the most common cause of cancer morbidity in children under
the age of 15. Acute lymphoblastic leukemia (ALL) and acute myeloid leukemia (AML)
accounted for 78 and 16 percent, respectively, of all childhood leukemia cases diagnosed in the
US between 1975 and 1995 (Kwan et al., 2004). Thus ALL and AML are the focus of research
pertaining to the association between breastfeeding and childhood leukemia.
Eidelman et al. (2012) (the current AAP policy statement regarding breastfeeding) states that
relative to infants who are never breastfed, the risk of developing ALL (AML) is 12 (10) percent
lower in infants BF for less than 6 months and 20 (15) percent lower in infants breastfed for 6
months or longer. A meta-analysis by Martin et al. (2005) found that relative to those who were
never breastfed, those who were ever breastfed had a 9% decrease in their relative risk for ALL.
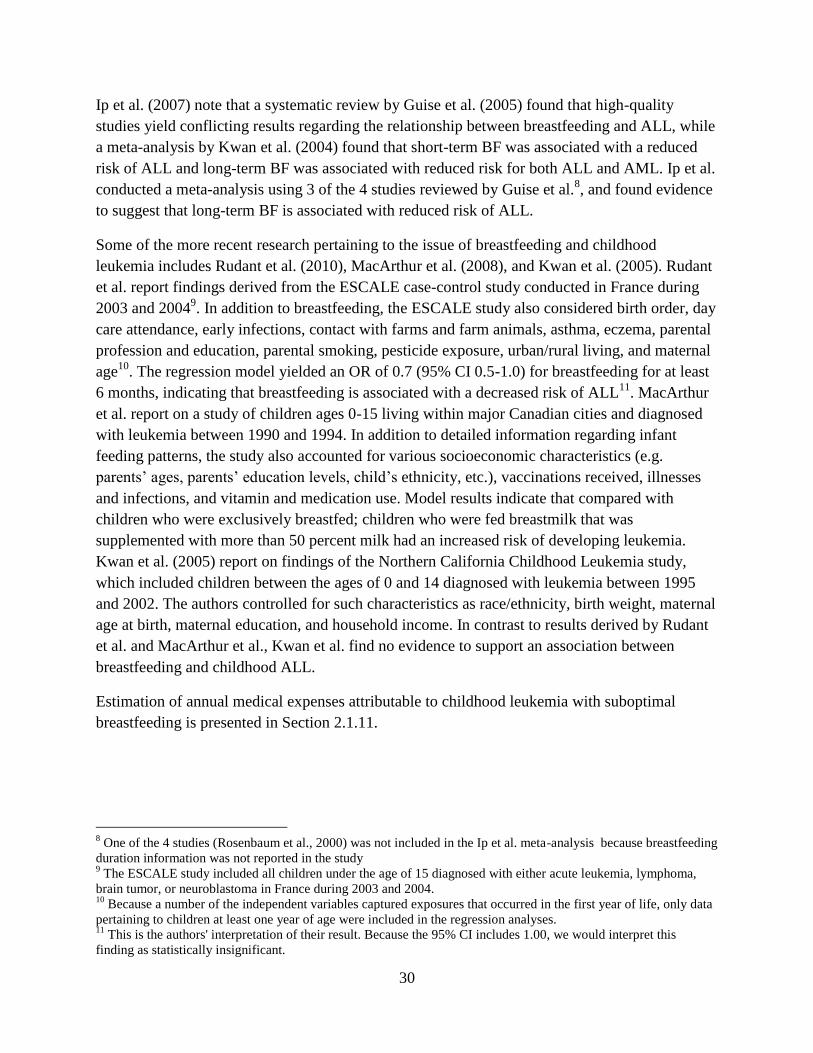
30
Ip et al. (2007) note that a systematic review by Guise et al. (2005) found that high-quality
studies yield conflicting results regarding the relationship between breastfeeding and ALL, while
a meta-analysis by Kwan et al. (2004) found that short-term BF was associated with a reduced
risk of ALL and long-term BF was associated with reduced risk for both ALL and AML. Ip et al.
conducted a meta-analysis using 3 of the 4 studies reviewed by Guise et al.8, and found evidence
to suggest that long-term BF is associated with reduced risk of ALL.
Some of the more recent research pertaining to the issue of breastfeeding and childhood
leukemia includes Rudant et al. (2010), MacArthur et al. (2008), and Kwan et al. (2005). Rudant
et al. report findings derived from the ESCALE case-control study conducted in France during
2003 and 20049. In addition to breastfeeding, the ESCALE study also considered birth order, day
care attendance, early infections, contact with farms and farm animals, asthma, eczema, parental
profession and education, parental smoking, pesticide exposure, urban/rural living, and maternal
age10
. The regression model yielded an OR of 0.7 (95% CI 0.5-1.0) for breastfeeding for at least
6 months, indicating that breastfeeding is associated with a decreased risk of ALL11
. MacArthur
et al. report on a study of children ages 0-15 living within major Canadian cities and diagnosed
with leukemia between 1990 and 1994. In addition to detailed information regarding infant
feeding patterns, the study also accounted for various socioeconomic characteristics (e.g.
parents’ ages, parents’ education levels, child’s ethnicity, etc.), vaccinations received, illnesses
and infections, and vitamin and medication use. Model results indicate that compared with
children who were exclusively breastfed; children who were fed breastmilk that was
supplemented with more than 50 percent milk had an increased risk of developing leukemia.
Kwan et al. (2005) report on findings of the Northern California Childhood Leukemia study,
which included children between the ages of 0 and 14 diagnosed with leukemia between 1995
and 2002. The authors controlled for such characteristics as race/ethnicity, birth weight, maternal
age at birth, maternal education, and household income. In contrast to results derived by Rudant
et al. and MacArthur et al., Kwan et al. find no evidence to support an association between
breastfeeding and childhood ALL.
Estimation of annual medical expenses attributable to childhood leukemia with suboptimal
breastfeeding is presented in Section 2.1.11.
8 One of the 4 studies (Rosenbaum et al., 2000) was not included in the Ip et al. meta-analysis because breastfeeding
duration information was not reported in the study 9 The ESCALE study included all children under the age of 15 diagnosed with either acute leukemia, lymphoma,
brain tumor, or neuroblastoma in France during 2003 and 2004. 10
Because a number of the independent variables captured exposures that occurred in the first year of life, only data
pertaining to children at least one year of age were included in the regression analyses. 11
This is the authors' interpretation of their result. Because the 95% CI includes 1.00, we would interpret this
finding as statistically insignificant.

31
2.1.8 Necrotizing enterocolitis
NEC is the third most common cause of death in newborns (Weimer, 2001). Approximately 90
percent of NEC cases occur among infants born prematurely, while 10 percent of cases occur in
term babies. NEC often results in death; the mortality rate among well-established cases is
between 20 and 40 percent (Lucas and Cole, 1990). Holman et al. (2006) provides NEC rates by
region, race, gender, birth-weight, hospital type & size, median HH income by patients’ zip code,
and primary payer. During 2000, 4,463 infants were hospitalized in the U.S. for NEC
(approximately 110 hospitalizations per 100,000 live births) and had a median hospital stay of 49
days. The mortality rate among infants hospitalized for NEC was approximately 15%
(approximately 1 in 7). Among very low birth weight infants, the NEC incidence rate is between
7 and 13 percent, while the incidence rate is even higher among extremely low birth weight
infants (Meinzen-Derr et al., 2009). Severity is also inversely related to gestational age and birth
weight.
In their most recent statement regarding the impacts of breastfeeding on infant and maternal
health (Eidelman et al., 2012), the AAP references the 2007 Agency for Healthcare Research and
Quality (AHRQ) report and its finding that human milk reduces the incidence of NEC by 58
percent12
. The AAP also references a more recent study (Sullivan et al., 2010) that finds that
preterm infants fed solely human milk were 77 percent less likely to develop NEC than were
preterm infants fed a combination of human milk and formula.
In the mid-1980s results from three randomized controlled trials were published (Gross (1983),
Behrman et al. (1983), and Lucas et al. (1984)). Each study assessed the risk of NEC as a
function of diet, comparing NEC-related health outcomes among preterm infants fed some form
of formula (e.g. formula or preterm formula) with outcomes among preterm infants fed some
form of human milk (e.g. unfortifed term donor breast milk). A meta-analysis (McGuire and
Anthony, 2001) of these three studies found no statistically significant difference in NEC risk
among infants. Ip et al. (2007) updates McGuire and Anthony’s meta-analysis, including another
randomized controlled trial (RCT) – Schanler et al. (2005) – and finds breast milk lowers the risk
of developing NEC. Specifically, Ip et al. report a risk ratio of 0.42 (with a 95% CI of 0.18, 0.96)
– a small but statistically significant reduction in the occurrence of NEC due to feeding breast
milk.
Studies published subsequent to the AHRQ report include one by Meinzen-Derr et al. (2009),
who use data pertaining to infants enrolled between October 1999 and August 2001 in a
multicenter, randomized, double-masked study conducted by the National Institute of Child
Health and Human Development Neonatal Network. Data from a subset of 1,272 of the enrolled
infants was used by Meinzen-Derr et al.. The 1,272 infants met various inclusion criteria – the
12
Because NEC is most common in preterm infants who thus experience difficulties with breastfeeding, the focus of
NEC research has been on the differences in health outcomes when human milk (from the mother or a milk bank) is
provided compared with formula or cow's milk.

32
infants had a gestational age of at least 23 weeks, weighed between 401 and 1,000 g at birth,
were not moved to a different facility, and survived NEC-free for at least 14 days. The outcome
assessed is development of NEC13
or death between (a) the age of 14 days and (b) either hospital
discharge or the age of 120 days, whichever occurred first. The independent variables that are of
particular interest are different measures of the amount of maternal milk given, and were
measured over the first 14 days of life (an arbitrary cutoff imposed by the authors). Two models
were used to assess the effects of maternal milk as (a) the proportion of total (enteral and
parenteral intake) and (b) the proportion of enteral intake.
A third model (which included only infants who received at least some maternal milk) was used
to assess whether a dose-response relationship exists between the total volume of maternal milk
given per unit body weight (ml kg−1) and NEC or death after the age of 14 days. Potential
confounders included in the regression analyses were birth weight, race, and various medical
care covariates known to be associated with NEC or death. The model that included maternal
milk as a portion of total (enteral and parenteral) intake yielded a hazard ratio (HR) of 0.83, with
a 95% CI of 0.72 to 0.96. The model that included maternal milk as a portion of enteral intake
found no statistically significant relationship. Results from the third and final model indicate
that increasing the total volume of maternal milk received during the first 2 weeks of life by 100
ml kg−1 decreased the hazard of NEC or death by 13 percent (HR=0.87, with 95% CI 0.77,
0.97). The study therefore provides credence to the concept of a dose-response relationship
between breast milk and NEC.
In a paper aimed at assessing the effects on NEC incidence rates of an exclusively human-milk
diet versus a diet comprised of both human milk and bovine milk-based products, Sullivan et al.
(2010) report that infants receiving solely a human milk diet experienced lower rates of NEC and
NEC requiring surgery. Note – this paper has a somewhat different focus. Earlier research
compared the incidence of NEC in preterm infants fed formula and that among those fed preterm
infant formula fortified with bovine milk-based human milk fortifier, but found no significant
difference. Sullivan et al. compare NEC incidence rates in preterm infants fed mother’s milk and
donor milk supplemented with human milk-based human milk fortifier (HMF) versus rates in
preterm infants fed mother’s milk and preterm formula supplemented with bovine milk-based
HMF.
Lucas and Cole (1990) randomly assigned 926 preterm babies to one of several feeding
programs: (a) donated breastmilk, (b) preterm formula, (c) term formula, (d) mother’s milk +
donated breastmilk, (e) mother’s milk + preterm formula, and (f ) mother’s milk + term formula.
Rate of NEC was the same among infants fed the two different types of formula, and the same
between infants fed donated or maternal breastmilk. Lucas and Cole were thus able to divide the
926 infants into 3 groups: formula only, formula + breastmilk, and breastmilk only. Results
indicate that infants receiving formula only were 6 times more likely to develop NEC than
13
Specifically, Belle’s stage II or III (Bell et al., 1978)

33
infants receiving breastmilk only. Infants receiving formula only were also 3.5 times more likely
to develop NEC than were infants receiving both formula and breastmilk, which suggests that
even when formula is used as a supplement to breastmilk, the breastmilk serves to protect against
NEC.
Estimation of annual medical expenses attributable to NEC with suboptimal breastfeeding is
presented in Section 2.1.11.
2.1.9 Sudden Infant Death Syndrome
Much of the literature regarding breastfeeding and SIDS is somewhat dated. However, in 2009
published results from a case-control study of SIDS conducted in Germany. Included in the study
were 333 infants who died of SIDS and 998 age-matched controls. Conditional logistic
regression analysis was used to assess the association between SIDS and breastfeeding while
controlling for maternal smoking during pregnancy, maternal age at delivery, socioeconomic
status, birth weight, various SIDS risk factors, etc. Three models used three different
breastfeeding variables – any breastfeeding at 2 weeks of age; exclusive, partial, or no
breastfeeding at 1 month of age; and exclusive, partial, or no breastfeeding during the last month
before death (cases) or interview (controls). Results indicate that any breastfeeding at 2 weeks of
age provides protection (OR=0.43, 95% CI 0.27-0.69). Although partial breastfeeding at one
month of age was not shown to have a protective effect, exclusive breastfeeding was (OR=0.48,
95% CI 0.28-0.82). In the last month before death/interview, both exclusive and partial
breastfeeding were shown to be protective; exclusive breastfeeding had an OR of 0.27, 95% CI
0.13-0.56, while partial breastfeeding had an OR of 0.29, 95% CI 0.16-0.53.
In 2011 Hauck et al. published a meta-analysis of studies published between 1966 and 2009. Of
twenty-four original case-control studies addressing breastfeeding and SIDS, eighteen passed
quality control criteria and were included in the meta-analysis. The association between SIDS
and breastfeeding was assessed using three different breastfeeding definitions – (1) any
breastfeeding, (2) breastfeeding of any amount at 2 months, and (3) exclusive breastfeeding for
any duration. Seven studies provided the information necessary for a multivariate pooled
analysis regarding the association of SIDS with any breastfeeding; the analysis yielded an OR of
0.55, with a 95% CI of 0.44-0.69. Only three studies provided information regarding
breastfeeding (of any amount) at 2 months of age, and only two of the three provided a
multivariate analysis (the remaining study provided only a univariate analysis). Analysis
pertaining to the association of breastfeeding at 2 months of age and SIDS was therefore
restricted to a univariate analysis, which yielded an OR of 0.38 (95% CI 0.27-0.54). Finally,
eight studies provided information regarding exclusive breastfeeding, although the meta-analysis
was once again restricted to a univariate analysis due to the lack of multivariate analysis in all 8
studies. The univariate pooled analysis of the association of SIDS and exclusive breastfeeding
yielded a summary OR of 0.27 (95% CI 0.24-0.31). The meta-analysis thus provides evidence
that breastfeeding offers protection against SIDS, and furthermore, that breastfeeding exclusively
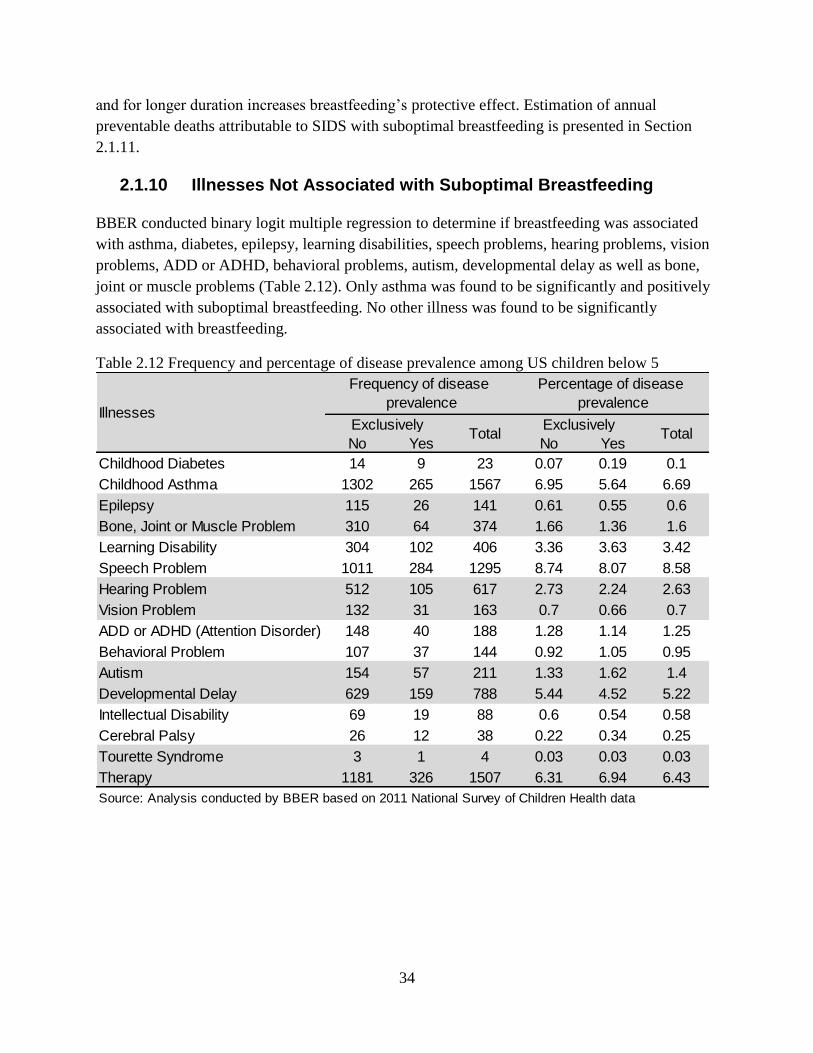
34
and for longer duration increases breastfeeding’s protective effect. Estimation of annual
preventable deaths attributable to SIDS with suboptimal breastfeeding is presented in Section
2.1.11.
2.1.10 Illnesses Not Associated with Suboptimal Breastfeeding
BBER conducted binary logit multiple regression to determine if breastfeeding was associated
with asthma, diabetes, epilepsy, learning disabilities, speech problems, hearing problems, vision
problems, ADD or ADHD, behavioral problems, autism, developmental delay as well as bone,
joint or muscle problems (Table 2.12). Only asthma was found to be significantly and positively
associated with suboptimal breastfeeding. No other illness was found to be significantly
associated with breastfeeding.
Table 2.12 Frequency and percentage of disease prevalence among US children below 5
No Yes No Yes
Childhood Diabetes 14 9 23 0.07 0.19 0.1
Childhood Asthma 1302 265 1567 6.95 5.64 6.69
Epilepsy 115 26 141 0.61 0.55 0.6
Bone, Joint or Muscle Problem 310 64 374 1.66 1.36 1.6
Learning Disability 304 102 406 3.36 3.63 3.42
Speech Problem 1011 284 1295 8.74 8.07 8.58
Hearing Problem 512 105 617 2.73 2.24 2.63
Vision Problem 132 31 163 0.7 0.66 0.7
ADD or ADHD (Attention Disorder) 148 40 188 1.28 1.14 1.25
Behavioral Problem 107 37 144 0.92 1.05 0.95
Autism 154 57 211 1.33 1.62 1.4
Developmental Delay 629 159 788 5.44 4.52 5.22
Intellectual Disability 69 19 88 0.6 0.54 0.58
Cerebral Palsy 26 12 38 0.22 0.34 0.25
Tourette Syndrome 3 1 4 0.03 0.03 0.03
Therapy 1181 326 1507 6.31 6.94 6.43
Source: Analysis conducted by BBER based on 2011 National Survey of Children Health data
Illnesses
Frequency of disease
prevalence
Percentage of disease
prevalence
Exclusively Total
Exclusively Total

35
2.1.11 Pediatric Illnesses’ Cost estimation
Due to the lack of cost data on various pediatric illnesses, BBER used secondary sources for cost
estimation. BBER followed the methodology used by Weimer14
and Bartick and Reinhold15
.
BBER used breastfeeding data from the 2013 birth cohort of the National Immunization Survey
by the Center for Disease Control and Prevention (CDC). The CDC reported some key indicators
of breastfeeding such as ever breastfed, breastfeeding at 6 months, breastfeeding at 12 months,
exclusive breastfeeding at 3 months, and exclusive breastfeeding at 6 months. Using New
Mexico breastfeeding indicators such as those, BBER further expanded to 12 months (Table
2.13).
Table 2.13 Estimated current breastfeeding rate in New Mexico by month
Table 2.14 below shows the odds ratios and incidence rates cost for different illnesses borrowed
from the Matrick and Reinhold paper. Following their procedure, we obtained differential
incidence of illness in breastfed and non-breastfed children by using the following formula.
𝑥 = 𝑠/(𝑏𝑟 + 1 − 𝑏) where x is the incidence in non-breastfed children, s is the overall incidence
of the illness, b is the current breastfeeding rate, r is the odds ratio in favor of breastfeeding, and
xr is the incidence of illnesses in breastfeeding children.
The cost data presented in Table 2.14 are in 2007 dollars. The direct cost of otitis media was
$156 and total cost was $291 per episode. These cost estimates were obtained from the Agency
14
Weimer J. The Economic Benefits of Breastfeeding: A Review and Analysis, Washington, DC. Food and Rural
Economics Division Economic Research Services, US Department of Agriculture, 2001. 15
Matrick, M. and A. Reinhold. The Burden of Suboptimal Breastfeeding in the United States: A Pediatric Cost
Analysis. Pediatrics Vol 125 (5), 2010.
Month BreastfeedingExclusive
Breastfeeding
Exclusive
Formula
0 85% 85% 15%
1 79% 67% 21%
2 72% 48% 28%
3 66% 30% 34%
4 60% 26% 40%
5 53% 23% 47%
6 47% 19% 53%
7 44% 15% 56%
8 40% 12% 60%
9 37% 8% 63%
10 34% 4% 66%
11 30% 1% 70%
Source: Estimated based CDC's 2013 rates for New Mexico
Bureau of Business & Economic Research, University of New Mexico, 2014

36
for Healthcare Research and Quality, part of the U.S. Department of Health and Human Services.
The cost estimates for gastroenteritis were obtained from a secondary source16
. The average
direct cost of visits and hospitalizations were $66.15 and $2,395, respectively. Outpatient
indirect costs were $273, including work missed and personal expenses. Bartick and Reinhold
obtained NEC cost data from a secondary source17
. The direct cost of surgical NEC and medical
NEC in “very low birth weight” (VLBW) infants was $260,506 and $140,858, respectively.
Bartick and Reinhold used Weimer18
’s figure ($150,406) for surgical NEC. The median cost of
hospitalization for a LRTI patient was $4,33819
. The annual cost of childhood asthma was
$77320
. To obtain the cost of obesity, BBER used the Medical Expenditure Panel Survey 2011
data (please see section: 2.1.2.6). BBER could not find a significant difference in medical
expenditure between obese children and non-obese children. However, Bartick and Reinhold
used different sources21
22
23
for estimating the cost of childhood obesity. They estimated $1,460
and $2,285, both direct and total cost for childhood obesity per year, respectively. Therefore,
BBER used their obesity cost numbers in this analysis. BBER converted all costs in 2013 dollars.
Table 2.15 presents age group (of which the cost estimation was based), number of children
falling under that group in 2013, number of prevented incidences, type and duration of
breastfeeding, 10% increased breastfeeding rate and direct and total cost by illness. The cost for
gastroenteritis was separately estimated for hospitalization and outpatient rates. Using separate
odds ratios for hospitalization and outpatient visits, BBER estimated six gastroenteritis
hospitalization that could have been prevented and 482 preventable outpatient visits. The cost of
other illnesses was estimated per year per case basis possibly including both outpatient visit and
hospitalization cost. The saving cost for asthma was estimated based on the Medical Expenditure
Panel Survey 2011. BBER estimated the total cost savings for asthma by multiplying direct cost
by 1.7, the ratio of total to direct cost estimated by Bartick and Reinhold.
16
Zimmerman, C.M., J.S. Bresee, U.D. Parshar, T.L. Riggs, R.C. Holman, R.I. Glass. 2001. Cost of diarrhea-
associated hospitalizations and outpatient visits in an insured population of young children in the U.S. Pediatr Infect
Dis. Vol 20(1): 14-9. 17
Bisquera, J.A., T.R. Cooper, C.L. Berseth. 2002. Impact of necrotizing enterocolitis on length of stay and hospital
charges in very low birth weight infants. Pediatrics Vol 109(3):423-428. 18
Weimer, J. 2001. The economic benefits of breastfeeding: a review and analysis. U.S. Department of Agriculture.
Food Assistance and Nutrition Research Report No. (FANRR-13) 20. 19
Obtained from Yorita, K.L., R.C. Holman, C.A. Steiner, et al. 2007. Severe bronchiolitis and respiratory syncytial
virum among young children in Hawai. Pediatr Infect Dis Vol 26(12):1081-1088. 20
Obtained from Wang, L.Y. Y. Zhong, L. Wheeler 2005. Direct and indirect cost of asthma in school-aged
children. Prev Chronic Dis Vol 2(1): A11. 21
Simpson LA, Cooper J. Paying for obesity: a changing landscape. Pediatrics. 2009;123(suppl 5):S301–S307 22
Thomson Medstat. 2006. Childhood obesity: costs, treatment patterns, disparities in care, and prevalent medical
condition. 23
Centers for Disease Control and Prevention. Childhood overweight and obesity. Available at:
www.cdc.gov/obesity/childhood/index.html and US Department of Health and Human Services and National
Institutes of Health. Statistics related to overweight and obesity. www.win.niddk.nih.gov/statistics/#preval.

37
Table 2.14 Figures and Assumptions used in calculating cost impact for each disease
It is estimated that nearly $27 million in total cost, including nearly $17 million direct cost, could
have been saved due to prevented pediatric illness incidences if New Mexico increases the
breastfeeding rate by 10%. The first most important childhood health condition was obesity.
More than 8,500 childhood obesity incidences could have been prevented accounting for 82%
($22 million) of the cost savings. More than 1,100 prevented asthma incidences accounted for
nearly $3.6 million or 13% of the total cost savings. The third most important illness is lower
respiratory tract infection (LRTI) of which 108 incidences could have been prevented. LRTI
IllnessType and Duration of
Breastfeeding
OR in favor of
BreastfeedingOverall incidence Cost
Otitis MediaEBF and any
breastfeeding for 3 mo
0.77 for any breastfeeding,
0.5 for EBF
1.9 episodes in first year
(reported data are fro children
6-11 mo old)
$156 direct cost per episode, $291
total cost per episode
Gestroenteritis EBF for 6 mo 0.36
0.222 ambulatory visits,
0.00298 hospitalizations in
infants <1 yr old
$66 direct cost per outpatient visit,
2395 direct cost per hospitalization,
$339 total costs per outpatient visit:
$2668 total cost per hospitalization
Necrotising
enterocolitis
Exclusively breast milk
fed for 3 moRisk Ratio of 0.42
LBW infants: 0.00308; VLBW
infants 0.0414
LBW: $150 406 direct cost surgical
NEC:$81 219 direct cost medical
NEC VLBW:$260 506 direct cost
surgical NEC;$140 858 direct cost
medical NEC LBW:$155 845 total cost
surgical NEC;$84 858 total cost
medical NEC; VLBW:$265 945 total
cost surgical NEC;$144 497 total cost
medical NEC
NEC deathsExclusively breast milk
fed for 3 moRisk Ratio 0.42
LBW: 0.058 of NEC; VLBW:
0.20 of NEC$10 560 000 per case
Lowr Respiratory Tract
InfectionEBF for 4 mo 0.28 0.0409
$4338 direct cost per case; $4680
total cost per case
Death from LRTI EBF for 4 mo 0.28 0.0000732 $10 560 000 per case
Sudden Infant Death
SyndromeAny breastfeeding 0.64 0.00054 $10 560 000 per case
Childwood Asthma Any breastfeeding 0.73 0.127
$453 direct cost per y; $3633 direct
cost for 10 y; $774 total cost per y;
$6602 total cost per case
Childwood deaths from
asthma
Any breastfeeding for 3
months0.73 0.00000273 $10 560 000 per case
Childwood LeukemiaAny breastfeeding for 6
mo0.81 for All; 0.85 for AML
0.0000321 for ALL (74% of
cases) 0.0000113 for AML
$136 444 direct cost per case; $153
617 total cost per case
T1DAny breastfeeding for 3
mo
0.77 (average of 2 OR
listed in AHRQ: 0.81 and
0.73)
0.000186
$4390 direct cost per y; $77 463
direct per case; $7378 total cost per y;
$130,187 total cost per case
Deaths from T1DAny breastfeeding for 3
mo0.75 0.00000121 $10 560 000 per case
Childhood obesity* Ever vs Never 0.695 0.176 by age 19 y
$1460 direct cost per y; $28 758
direct cost per case; $2285 total per y;
$36,040 total cost per case
*Chi ldhood obes i ty odds ratio i s based on BBER analys is
ABBREVIATIONS NEC—necrotizing enterocol i ti s OM— oti ti s mediaAHRQ—Agency for Healthcare Research and Qual i ty LRTI—lower respiratory tract infection
AD—atopic dermati ti s SIDS—sudden infant death syndrome T1D—type 1 diabetes CDC—Centers for Disease Control and Prevention OR— odds ratioEBF—
exclus ively breastfed EFF— exclus ively formula fed LBW—low birth weight VLBW—very low birth weight ALL—acute lymphocytic leukemia AML—acute
myelogenous leukemia
Source: Bartick, M, A. Reinhodl, "The Burden of Suboptimal Breastfeeding in the United States: A Pediatric Cost Analysis, Pediatrics 2010; 125

38
accounted for about 2% of the total cost savings. BBER estimated that nearly 1 death could have
been prevented in New Mexico in 2013 had the breastfeeding rate increased by 10%. Bartick and
Reinhold put a $10 million price tag on human life in their study. If we put the similar price tag
on prevented deaths from increased breastfeeding rate, additional $10 million could have been
saved. Please note that this analysis may underestimate the true pediatric costs of suboptimal
breastfeeding, we estimated the effect of breastfeeding on only selected nine pediatric health
conditions.
Table 2.15 Estimation of prevented incidences and associated cost saving as a result of 10%
increase in current rate of breastfeeding
Name of Illness Age group
No. of
Children in
New Mexico in
2013
Type and Duration of
Breastfeeding
10%
increase in
current BF
rate
Prevented
incidences
Total direct
cost savings
Total cost
savings
Otitis Media <1 year old 29,788 Any BF for 6 mo 57% 1,460 $255,811 $477,186
Gestroenteritis <1 year old 29,788 EBF for 6 mo 29% 482 $16,145 $17,986
Necrotising enterocolitislow birth
weight infants2,621 EBF for 3 mo 40% 0.6 $51,733 $92,039
NEC deaths NEC patient 8 EBF for 3 mo 40% 0.033 - -
LRTI <1 year old 29,788 EBF for 4 mo 36% 108 $526,007 $567,476
Death from LRTI <1 year old 29,788 EBF for 4 mo 76% 1.0 - -
Sudden Infant Death
Syndrome<1 year old 29,788 Any BF for 3 mo 76% 0.8 - -
Childwood Asthma 5-19 year old 428,469 Everbreastfed 90% 1,114 $2,117,000 $3,598,900
Childwood deaths from
asthma0-10 year old 324,860 Any BF for 3 mo 76% 0.029 - -
Childwood Leukemia 0-5 year old 177,261 Any BF for 6 mo 57% 0.119 $18,199 $20,489
T1D 0-17 year old 527,597 Any BF for 3 mo 76% 3 $13,125 $22,058
Deaths from T1D 0-17 year old 527,597 Any BF for 3 mo 76% 0.019 - -
Childhood obesity 0-19 year old 439,904 Any BF for 3 mo 95% 8,574 $13,929,692 $22,011,996
Total $16,927,712 $26,808,130
Source: All the cost estimates except asthma are estimated by BBER based on Bartick and Reinhold cost data. Asthma direct cost was estimated
based on Medical Expenditure Panel Survey 2011. Bartick and Reinhold's estimate for total cost of asthma was 1.7 times the direct cost.
39
2.2 Cost Analysis of Maternal Illnesses Associated with
Suboptimal Breastfeeding
2.2.1 Relationship between Breast Cancer and Breastfeeding
2.2.1.1 Background
According to Breastcancer.org24
, about 1 in 8 U.S. women (just under 12%) will develop
invasive breast cancer over the course of her lifetime. In 2013, an estimated 232,340 new cases
of invasive breast cancer were expected to be diagnosed in women in the U.S., along with 64,640
new cases of non-invasive (in situ) breast cancer. About 2,240 new cases of invasive breast
cancer were expected to be diagnosed in men in 2013. A man’s lifetime risk of breast cancer is
about 1 in 1,000. Breast cancer incidence rates in the U.S. began decreasing in the year 2000,
after increasing for the previous two decades. They dropped by 7% from 2002 to 2003 alone.
One theory is that this decrease was partially due to the reduced use of hormone replacement
therapy (HRT) by women after the results of a large study called the Women’s Health Initiative
were published in 2002. These results suggested a connection between HRT and increased breast
cancer risk.
About 39,620 women in the U.S. were expected to die in 2013 from breast cancer, though death
rates have been decreasing since 1989 — with larger decreases in women under 50. These
decreases are thought to be the result of treatment advances, earlier detection through screening,
and increased awareness. For women in the U.S., breast cancer death rates are higher than those
for any other cancer, besides lung cancer. Besides skin cancer, breast cancer is the most
commonly diagnosed cancer among American women. Just under 30% of cancers in women are
breast cancers.
White women are slightly more likely to develop breast cancer than African-American women.
However, in women under 45, breast cancer is more common in African-American women than
white women. Overall, African-American women are more likely to die of breast cancer. Asian,
Hispanic, and Native-American women have a lower risk of developing and dying from breast
cancer. In 2013, there were more than 2.8 million women with a history of breast cancer in the
U.S. This includes women currently being treated and women who have finished treatment.
According to New Mexico Department of Health, in New Mexico 1,310 women are diagnosed
with breast cancer and 240 women die of breast cancer each year.
24
Breastcancer.org is a nonprofit organization dedicated to providing information about breast cancer.

40
2.2.1.2 Studies on association between breast cancer and breastfeeding
Using data from the Nurses’ Health Study25
, Warner et al. (2013) assess the relationships
between invasive premenopausal breast cancer and various reproductive factors (e.g. age at
menarche, age at first birth, parity, and breastfeeding). The authors were interested in assessing
whether the relationships between reproductive factors and premenopausal breast cancer differed
for women less than age 40 and older premenopausal women.26
A mother was considered to have
never breastfed if she breastfed for less than 1 month. Breastfeeding duration was measured in
yearly increments (i.e., <1 month, 1-12 months, 12-24 months, and ≤24 months). Multivariate
relative risks and associated 95% CIs were estimated using Cox proportional hazard models.
Results suggest that associations between reproductive factors and the risk of premenopausal
breast cancer do not vary with age at diagnosis. Due to the small number of breast cancer cases
in women before age 40 (374 cases), numerous Warner et al. analyses suffered from limited
statistical power. However the authors did find evidence that ever breastfeeding reduces the risk
of breast cancer older premenopausal women (for those less than 40 years of age, relative risk
(RR) = 0.84 with a 95% CI of 0.57-1.22; for those age 40 or older, RR = 0.85 with a 95% CI of
0.72-0.99).
Stuebe et al. (2009b) also used data from the Nurses’ Health Study (specifically, NHS II) to
assess the association between breastfeeding and premenopausal invasive breast cancer27
. A Cox
proportional hazards model was used to model the relative risk of breast cancer as a function of
health status (measured by such variables as BMI, physical activity, and alcohol consumption),
family breast cancer history, and various reproductive factors (such as age at menarche, parity,
age at first birth, and breastfeeding). As in Warner et al. (2013), women who breastfed for less
than one month were considered to have never breastfed. Model results suggest that
breastfeeding does offer protection against premenopausal breast cancer, but that the protection
(a 59 percent reduction in risk; HR=0.41, 95% CI 0.22-0.75) is restricted to women with a first-
degree family history of breast cancer. Although the authors also assessed both duration and
exclusivity of breastfeeding, neither was found to be a significant determinant of breast cancer
risk. To differentiate between the effects of parity and lactation the authors assessed additional
models that included only women with 1 child. Findings suggest that the association between
breastfeeding and cancer is stronger among women with only 1 child, although duration again
was insignificant.
25
The Nurses’ Health Study (NHS I and NHS II) are ongoing prospective cohort studies of U.S. female nurses. NHS
I began in 1976 with the enrollment of 121,700 primarily Caucasian nurses ages 30-55. NHS II began in 1989 with
the enrollment of 116,608 primarily Caucasian nurses ages 25-42. Questionnaires are mailed to all enrollees
biennially, and cover such topics as medical history, risk factors for cancer, and current health status. 26
NHS I included an assessment of breastfeeding in the 1986 questionnaire, yet no breast cancers were diagnosed
among NHS I women less than 40 years of age after the 1986-1988 cycle, Warner et al. (2013) therefore limit their
breastfeeding analysis to NHS II. 27
Women with in situ breast cancer were excluded from the analysis.

41
Stendell-Hollis et al. (2013) use data from the Women’s Health Initiative (WHI) Hormone Trial
(HT) and Observational Study (OS), a retrospective cohort analysis, to examine the effect of
lactation for a period of at least 24 months on breast cancer risk in postmenopausal women (ages
50-79) exposed and not exposed to hormone therapy28
. The WHI study gathered information on
the following breastfeeding characteristics: number of children breastfed (1-2, 3-5, and >5), age
of first and last breastfeeding (<20, 20-24, 25-29, 30-34, and ≥35 years), and cumulative
breastfeeding duration (1-3,4-12, 13-23, and ≥24 months)29
. Hazard ratios and 95% CIs were
estimated using Cox proportional hazards regressions stratified by age at diagnosis (<40 and
≥40). The study yielded few statistically significant results pertaining to breastfeeding, but did
indicate a significantly increased breast cancer risk (HR=1.66; 95% CI 1.14-2.41) among women
in the OS who first breastfed when at least 30 years of age and who reported CEE/MPA30
hormone use. Breast cancer risk was also higher among women who last breastfed when they
were at least 35 years of age (HR=1.50; 95% CI 1.05-2.14). The authors note that analyses
pertaining to extended breastfeeding duration of at least 24 months were impeded by a relatively
small sample size for such women. Although results have not been consistent, some prior
research has indicated that any benefits construed by breastfeeding may diminish with time, and
that breastfeeding might be more protective again premenopausal cancer than postmenopausal
cancer. The lack of results derived by Stendell-Hollis et al. pertaining to breastfeeding might also
be due to the large number of women in the WHI study (65.4%) with BMIs of at least 25 kg/m2.
One further drawback to the analysis is the lack of a breastfeeding intensity or exclusivity
measure.
The approach taken by Gaudet et al. (2011) differs notably from that of other papers discussed
herein – the authors consider breast cancer molecular subtypes. Prior research has shown that
among postmenopausal women breast cancer risk factors differ by cancer subtype. Gaudet et al.
(2011) apply a multivariate polytomous regression model to case-control data to address this
issue among women ≤ 56 years of age. The presence of various breast cancer molecular subtypes
was modeled as a function of breastfeeding (specifically, duration in 6 month increments), as
well as numerous additional independent variables, including age, numerous reproductive
variables (such as age at menarche, ate at first birth, oral contraceptive use, and menopausal
status), family breast cancer history, and others. The authors find that women who have done
little or no breastfeeding have an increased risk of triple negative breast cancer (OR=0.76, 95%
CI 0.64-0.90)31
, 18 but no significant association between breastfeeding and other molecular
subtypes of breast cancer. As noted by the authors, understanding the risk factors for triple
negative breast cancer is of particular importance due to the lack of targeted therapies, poor 5-
28
As noted by Stendell-Hollis et al., much of prior research has focused on premenopausal women. 29
Women who breastfed less than one month were considered to have never breastfed. 30
CEE/MPA denotes conjugated equine estrogen (CEE) plus medroxyprogesterone acetate (MPA). 31
Triple negative breast cancer does not express genes for estrogen receptor, progesterone receptor, or Her2/neu.
This makes treatment difficult, as most chemotherapies target one of these three receptors.

42
year survival rate for such cancer, and the fact such cancer accounts for 15-20 percent of all
breast cancers.
Ma et al. (2010) assess associations between reproductive factors and postmenopausal diagnosis
of (a) invasive breast cancer (in general or by hormone receptor subtype) and (b) breast
carcinoma in situ (CIS). Data from the California Teachers Study were used in multivariable
Cox proportional hazards regression models to assess the relative risks for postmenopausal
breast cancer associated with breastfeeding duration, parity, age at first full-term pregnancy,
nausea or vomiting during pregnancy, and preeclampsia. Breastfeeding duration is designated as
never, <6, 6-11, 12-23, and ≥24 months. The study yielded no evidence of an association
between breastfeeding and breast cancer (either CIS or invasive). The lack of statistical evidence
for an association between breastfeeding duration and breast cancer may result from the fact that
the study focuses on postmenopausal breast cancer – other studies have found stronger
associations in younger or premenopausal women, while others have found that the protective
effect of breastfeeding diminishes as time after most recent pregnancy increases.
The Long Island Breast Cancer Study Project (1996-1997) was a population-based case-control
study involving 3,064 women ages 20 to 98. Shantakumar et al. (2007) used data from the study
to assess relationships between various reproductive factors and breast cancer among three sub-
groups of women created based upon age and menopausal status: premenopausal,
postmenopausal and less than 65 years old, and postmenopausal and 65 years old or older. The
study included women recently diagnosed with either in situ or invasive breast cancer.
Unconditional logistic regressions were used to model breast cancer as a function of
breastfeeding as well as age, education, age at menarche, time to onset of regular menstrual
cycles, parity, age at first birth, age at last birth, and time since last birth. Ever having breastfed
was found to have no effect on the risk of breast cancer among premenopausal women or
postmenopausal women under the age of 65, but decreased the risk of breast cancer among
postmenopausal women age 65 or older. Specifically, relative to women who had never
breastfed, those who had breastfed had a hazard ratio of 0.67 with a 95% CI of 0.48-0.92. In
addition, evidence of a dose-response relationship was found among older postmenopausal
women – a longer lifetime duration of breastfeeding was found to decrease the risk of breast
cancer (HR=0.40, 95% CI 0.21-0.76).
2.2.1.3 Estimation of Annual Medical Expenses attributable to Breast Cancer
We estimated the average annual medical expenditures of adult females (≥ 25 years) with an
incidence of breast cancer diagnosed and compare the results with those without cancer. We
utilized the data from 2011 Medical Expenditure Panel Surveys (MEPS) for the estimation of
expenses. MEPS data included information about each person’s health conditions, medical
expenses as well as socio-demographic characteristics, including age, sex, and race/ethnicity.

43
2.2.1.4 Method
We used a four-equation regression approach to predict annual medical spending attributable to
breast cancer among adult females. The details of four-equation regression approach are
described in the section: ‘Estimation of Annual Medical Expenses attributable to Childhood
Asthma’.
2.2.1.5 Results
Table 2.16 reports the average annual medical expenses of adult females aged years or more
estimated from four-equation models classified by payers and incidence of breast cancer. On
average, the total annual medical expenses were estimated to be larger by $4,236 for adult
females with breast cancer as compared to those without an incidence of cancer.
Table 2.16 Per person average annual medical expenses with and without breast cancer
2.2.1.6 Effects of Improving Breastfeeding Rate on Annual Medical
Expenses
We estimated the differences in the breast cancer prevalence rate and direct total annual medical
expenses for the entire NM female population of ages 25 year or more. We utilized various
sources for the key parameters in estimating the breast cancer prevalence rate and direct medical
expenses. We used the relative risk ratio from Warner et al. (2013). The current prevalence rate
of breast cancer was obtained from CDC’s website (US Cancer Statistics Working Group, 2013).
Average annual medical expenses were used from the estimated values utilizing MEPS data
(previous section). We obtained the differential incidence of disease in breastfed and non-
breastfed women at the current rate of breastfeeding by using the following formula: x= x/(br+1-
b), where x is the incidence in non-breastfed women, s is the overall incidence of the disease, b is
the current breastfeeding rate, and r is the odds ratio (OR) in favor of breastfeeding. The
incidence of disease in breastfed subjects is xr (Weimer, 2001). Table 2.17 reports the estimated
differences in breastfeeding prevalence rate and total medical expenses in New Mexico. Nearly
$54,000 could be saved in New Mexico if 10% more women ever breastfeed their children.
BBER also estimated cost savings by using Bartick et al. method and data in section 2.2.3 and
With Breast
CancerWithout Cancer Difference
Private 1,612 839 773
Medicaid 790 288 502
Medicare 2,013 712 1,301
Others 1,867 767 1,100
All payers 7,054 2,818 4,236
Source: BBER estimates based on 2011 Medical Expenditure Panel Surveys
Insurance
categories
Average Annual Medical Spending
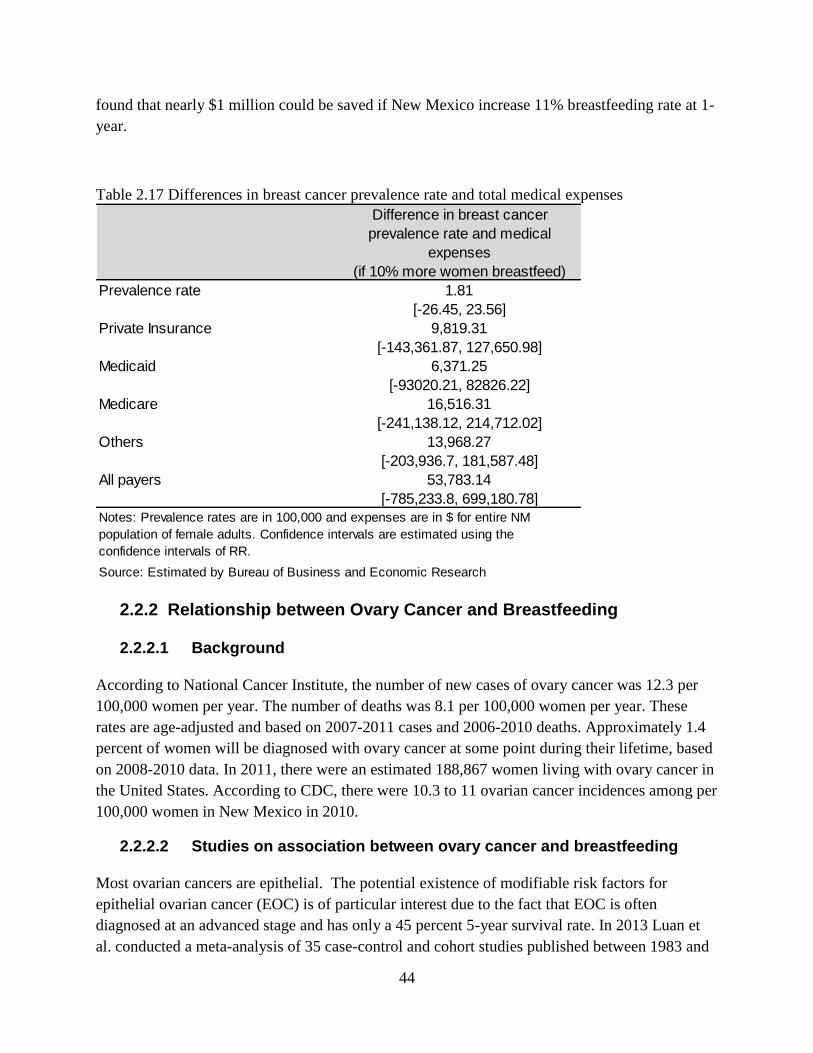
44
found that nearly $1 million could be saved if New Mexico increase 11% breastfeeding rate at 1-
year.
Table 2.17 Differences in breast cancer prevalence rate and total medical expenses
2.2.2 Relationship between Ovary Cancer and Breastfeeding
2.2.2.1 Background
According to National Cancer Institute, the number of new cases of ovary cancer was 12.3 per
100,000 women per year. The number of deaths was 8.1 per 100,000 women per year. These
rates are age-adjusted and based on 2007-2011 cases and 2006-2010 deaths. Approximately 1.4
percent of women will be diagnosed with ovary cancer at some point during their lifetime, based
on 2008-2010 data. In 2011, there were an estimated 188,867 women living with ovary cancer in
the United States. According to CDC, there were 10.3 to 11 ovarian cancer incidences among per
100,000 women in New Mexico in 2010.
2.2.2.2 Studies on association between ovary cancer and breastfeeding
Most ovarian cancers are epithelial. The potential existence of modifiable risk factors for
epithelial ovarian cancer (EOC) is of particular interest due to the fact that EOC is often
diagnosed at an advanced stage and has only a 45 percent 5-year survival rate. In 2013 Luan et
al. conducted a meta-analysis of 35 case-control and cohort studies published between 1983 and
Difference in breast cancer
prevalence rate and medical
expenses
(if 10% more women breastfeed)
Prevalence rate 1.81
[-26.45, 23.56]
Private Insurance 9,819.31
[-143,361.87, 127,650.98]
Medicaid 6,371.25
[-93020.21, 82826.22]
Medicare 16,516.31
[-241,138.12, 214,712.02]
Others 13,968.27
[-203,936.7, 181,587.48]
All payers 53,783.14
[-785,233.8, 699,180.78]
Source: Estimated by Bureau of Business and Economic Research
Notes: Prevalence rates are in 100,000 and expenses are in $ for entire NM
population of female adults. Confidence intervals are estimated using the
confidence intervals of RR.
45
2012, and assessed the association between EOC and both ever breastfeeding & the duration of
breastfeeding. The meta-analysis included 14,465 cases and 706,152 non-cases. Results indicate
that ever breastfeeding reduced the risk of EOC by 24 percent (RR 0.76, 95% CI 0.69-0.83), and
also provide evidence of a dose-response relationship – every 5-month increase in total
breastfeeding duration was associated with an 8 percent decrease in EOC risk (RR 0.92, 95% CI
0.90-0.95). Studies were conducted in a number of different countries, thereby enabling
subgroup analysis based upon study population. Results of the subgroup analysis imply that
breastfeeding duration has a significant protective effect only in American populations (RR 0.55,
95% CI 0.43-0.71). The authors surmise that this result may be attributed to the greater variation
in breastfeeding duration that exists in the American population.
In a September 2007 - November 2011 study of 1,346 women living in Poland (1,144 healthy
women and 202 women with ovarian cancer), Pieta et al. (2012) calculate odds ratios associated
with various obstetric history variables and the incidence of ovarian cancer. The authors find
significant relationships between ovarian cancer and age at menarche, age at menopause, age at
first pregnancy, number of pregnancies, miscarriage, age at first live delivery, breastfeeding, and
duration of breastfeeding. Relative to those who had breastfed; those who had never breastfed
were 1.7 times more likely to develop ovarian cancer (OR 1.73, 95% CI 1.22-2.45).
Between 2001 and 2005 Jordan et al. (2010) conducted a case-control study of epithelial ovarian
cancer among parous women between the ages of 17 and 89 living in Australia. Ultimately their
results suggest that breastfeeding reduces the risk of ovarian cancer, and that this reduction in
risk is independent of the reduction in risk that arises as a result of parity. However, the effect of
breastfeeding on the risk of ovarian cancer varied by histological subtype. Various breastfeeding
measures were used in regression analyses – ever breastfed, total months of breastfeeding, a
categorical total breastfeeding duration variable (0.1-6, 6.1-18, 18.1-30, 30.1-42, and >42
months), and average months of breastfeeding (total duration divided by number of live births).
Conditional logistic regressions also included covariates such as age at first birth, duration of
oral contraceptive use, menopausal status, family history, and others. Relative to parous women
who had never breastfed, those who had ever breastfed had a relative risk of 0.77 (with a 95% CI
of 0.61-0.96). Each additional month of breastfeeding was estimated to reduce the risk of
ovarian cancer by 1.4%. Results also suggest that the protective effect of breastfeeding varies by
histological subtype; no association was found between breastfeeding and serous borderline
cancers, and while ever breastfed provided protection against mucinous cancers, the duration of
breastfeeding did not appear to matter for this histological subtype.
Using data from the Nurses’ Health Study (NHS) and Nurses’ Health Study II (NHS II),
Danforth et al. (2007) provide a prospective analysis pertaining to the relationship between
breastfeeding and ovarian cancer. Multivariate Cox proportional hazards regression models were
used to assess the association between various breastfeeding measures and the risk of ovarian
cancer. Three different breastfeeding measures were used – (1) ever breastfed versus never
breastfed, (2) categorical breastfeeding duration (0, 1-6, 7-11, 12-18, 18+ months), and (3)
46
continuous breastfeeding duration19. Models adjust for age, parity, duration of oral contractive
use, tubal ligation, and age at menarche. Results indicate that ever breastfeeding is not
significantly associated with ovarian cancer (RR = 0.86, 95% CI 0.70-1.06). However, the
median breastfeeding duration was 9 months and thus may not be of sufficient length to yield a
significant effect. Analysis using the categorical breastfeeding duration variable suggests that a
duration of 18 months or longer yields a protective effect (RR = 0.66, CI 0.46-0.96). Regression
results from the model using the “continuous” breastfeeding duration variable indicate a weak
protective effect (RR = 0.98, CI 0.97-1.00). As noted by the authors, because the data did not
enable assessment of the exclusivity of breastfeeding, the results may underestimate
breastfeeding’s protective effect.
2.2.2.3 Estimation of Annual Medical Expenses attributable to Breast Cancer
We estimated the average annual medical expenditures of adult females (≥ 25 years) with an
incidence of diagnosed ovary cancer and compare the results with those without cancer. We
utilized the data from 2011 Medical Expenditure Panel Surveys (MEPS) for the estimation of
expenses. MEPS data included information about each person’s health conditions, medical
expenses as well as socio-demographic characteristics, including age, sex, and race/ethnicity.
2.2.2.4 Method
We used a four-equation regression approach to predict annual medical spending attributable to
ovary cancer among adult females. The details of four-equation regression approach are
described in the section: ‘Estimation of Annual Medical Expenses attributable to Childhood
Asthma’.
2.2.2.5 Results
Table 2.18 reports the average annual medical expenses of adult females aged years or more
estimated from four-equation models classified by payers and incidence of ovary cancer. On
average, the total annual medical expenses were estimated to be larger by $4,851 for adult
females with ovary cancer as compared to those without an incidence of cancer.
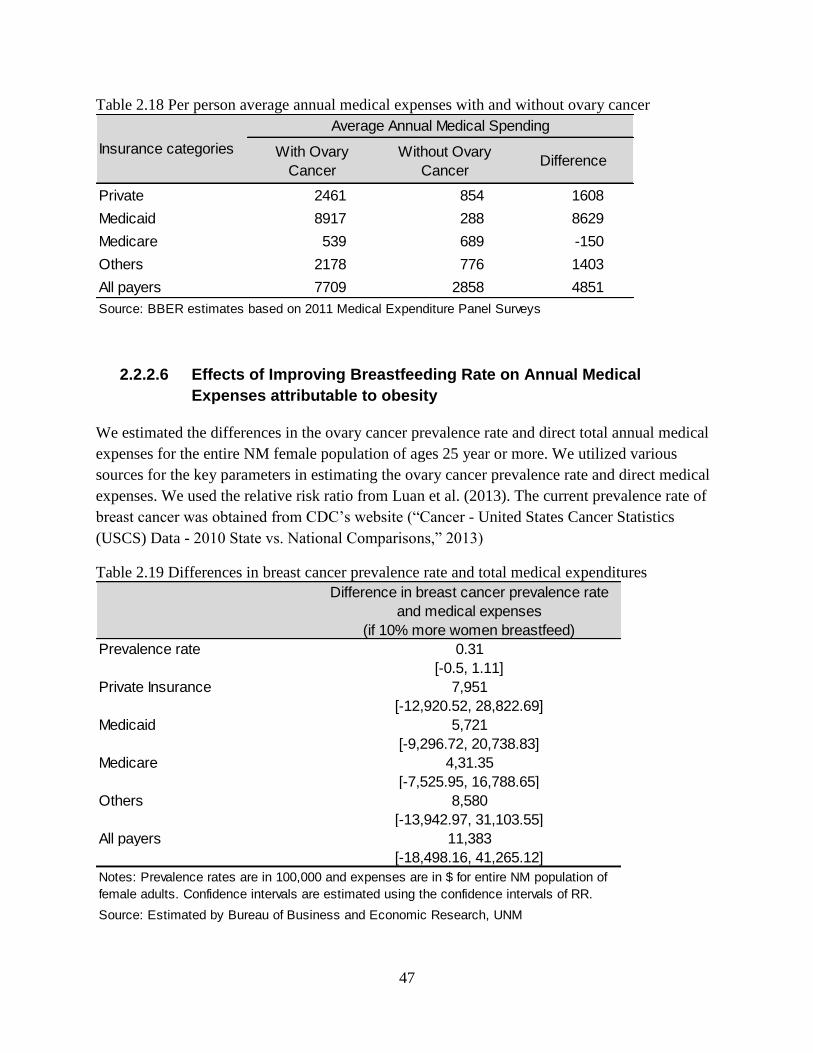
47
Table 2.18 Per person average annual medical expenses with and without ovary cancer
2.2.2.6 Effects of Improving Breastfeeding Rate on Annual Medical
Expenses attributable to obesity
We estimated the differences in the ovary cancer prevalence rate and direct total annual medical
expenses for the entire NM female population of ages 25 year or more. We utilized various
sources for the key parameters in estimating the ovary cancer prevalence rate and direct medical
expenses. We used the relative risk ratio from Luan et al. (2013). The current prevalence rate of
breast cancer was obtained from CDC’s website (“Cancer - United States Cancer Statistics
(USCS) Data - 2010 State vs. National Comparisons,” 2013)
Table 2.19 Differences in breast cancer prevalence rate and total medical expenditures
With Ovary
Cancer
Without Ovary
CancerDifference
Private 2461 854 1608
Medicaid 8917 288 8629
Medicare 539 689 -150
Others 2178 776 1403
All payers 7709 2858 4851
Source: BBER estimates based on 2011 Medical Expenditure Panel Surveys
Insurance categories
Average Annual Medical Spending
Difference in breast cancer prevalence rate
and medical expenses
(if 10% more women breastfeed)
Prevalence rate 0.31
[-0.5, 1.11]
Private Insurance 7,951
[-12,920.52, 28,822.69]
Medicaid 5,721
[-9,296.72, 20,738.83]
Medicare 4,31.35
[-7,525.95, 16,788.65]
Others 8,580
[-13,942.97, 31,103.55]
All payers 11,383
[-18,498.16, 41,265.12]
Source: Estimated by Bureau of Business and Economic Research, UNM
Notes: Prevalence rates are in 100,000 and expenses are in $ for entire NM population of
female adults. Confidence intervals are estimated using the confidence intervals of RR.
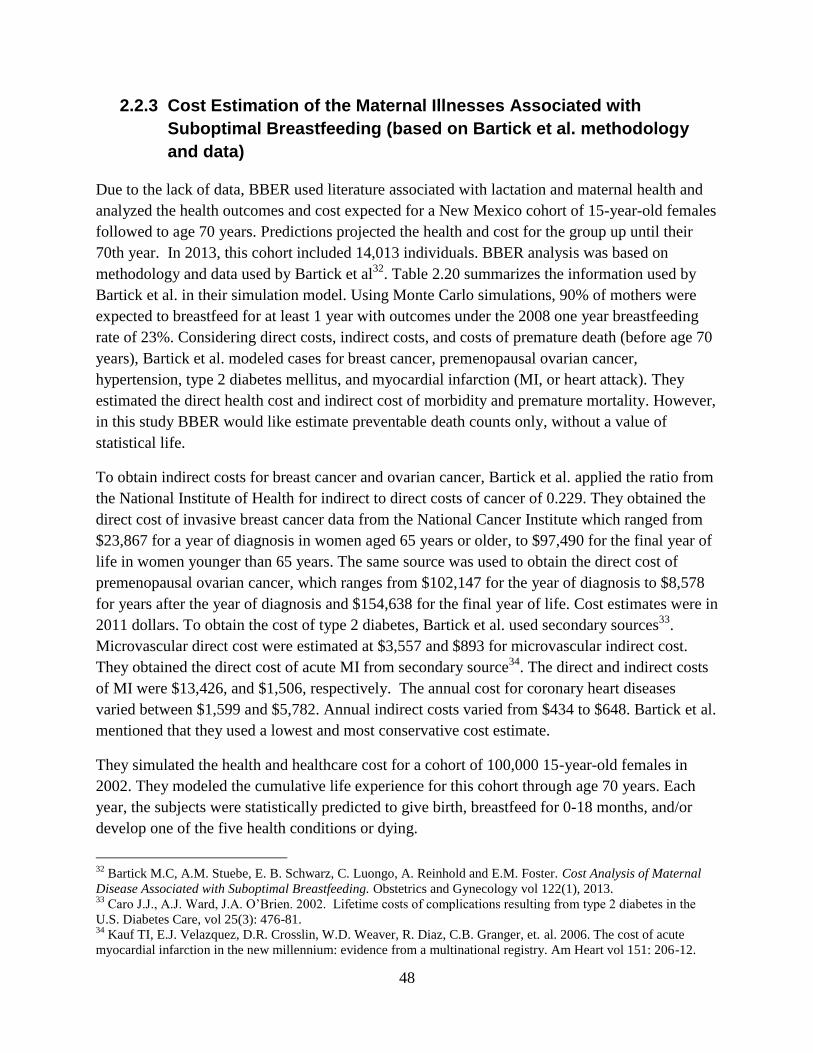
48
2.2.3 Cost Estimation of the Maternal Illnesses Associated with
Suboptimal Breastfeeding (based on Bartick et al. methodology
and data)
Due to the lack of data, BBER used literature associated with lactation and maternal health and
analyzed the health outcomes and cost expected for a New Mexico cohort of 15-year-old females
followed to age 70 years. Predictions projected the health and cost for the group up until their
70th year. In 2013, this cohort included 14,013 individuals. BBER analysis was based on
methodology and data used by Bartick et al32
. Table 2.20 summarizes the information used by
Bartick et al. in their simulation model. Using Monte Carlo simulations, 90% of mothers were
expected to breastfeed for at least 1 year with outcomes under the 2008 one year breastfeeding
rate of 23%. Considering direct costs, indirect costs, and costs of premature death (before age 70
years), Bartick et al. modeled cases for breast cancer, premenopausal ovarian cancer,
hypertension, type 2 diabetes mellitus, and myocardial infarction (MI, or heart attack). They
estimated the direct health cost and indirect cost of morbidity and premature mortality. However,
in this study BBER would like estimate preventable death counts only, without a value of
statistical life.
To obtain indirect costs for breast cancer and ovarian cancer, Bartick et al. applied the ratio from
the National Institute of Health for indirect to direct costs of cancer of 0.229. They obtained the
direct cost of invasive breast cancer data from the National Cancer Institute which ranged from
$23,867 for a year of diagnosis in women aged 65 years or older, to $97,490 for the final year of
life in women younger than 65 years. The same source was used to obtain the direct cost of
premenopausal ovarian cancer, which ranges from $102,147 for the year of diagnosis to $8,578
for years after the year of diagnosis and $154,638 for the final year of life. Cost estimates were in
2011 dollars. To obtain the cost of type 2 diabetes, Bartick et al. used secondary sources33
.
Microvascular direct cost were estimated at $3,557 and $893 for microvascular indirect cost.
They obtained the direct cost of acute MI from secondary source34
. The direct and indirect costs
of MI were $13,426, and $1,506, respectively. The annual cost for coronary heart diseases
varied between $1,599 and $5,782. Annual indirect costs varied from $434 to $648. Bartick et al.
mentioned that they used a lowest and most conservative cost estimate.
They simulated the health and healthcare cost for a cohort of 100,000 15-year-old females in
2002. They modeled the cumulative life experience for this cohort through age 70 years. Each
year, the subjects were statistically predicted to give birth, breastfeed for 0-18 months, and/or
develop one of the five health conditions or dying.
32
Bartick M.C, A.M. Stuebe, E. B. Schwarz, C. Luongo, A. Reinhold and E.M. Foster. Cost Analysis of Maternal
Disease Associated with Suboptimal Breastfeeding. Obstetrics and Gynecology vol 122(1), 2013. 33
Caro J.J., A.J. Ward, J.A. O’Brien. 2002. Lifetime costs of complications resulting from type 2 diabetes in the
U.S. Diabetes Care, vol 25(3): 476-81. 34
Kauf TI, E.J. Velazquez, D.R. Crosslin, W.D. Weaver, R. Diaz, C.B. Granger, et. al. 2006. The cost of acute
myocardial infarction in the new millennium: evidence from a multinational registry. Am Heart vol 151: 206-12.

49
Table 2.20 Information used by Bartick et al. in their simulation models
Table 2.21 presents the incidence of maternal illnesses at one year breastfeeding rate of 23% and
34%. the latter is considered as the optimal breastfeeding goal in Healthy People 2020 set by
Condition SourceMeasure of
Association
Effect on
Maternal Risk of
Condition
Measure of
Lactation
Maximum
Duration of
Lactation With
Effect on
Condition in
Model
Cost Estimates
(in 2011 dollars)
Breast cancerCollaborative
Group 2002Relative risk 4.3% (2.9-5.8%) Per year lifetime 4 year lifetime
$23,863 for year of
diagnosis in women
aged 65 years or older
to $97,490 for the final
year of life in women
younger than 65
0.66 (0.46-0.96)18 or more mo
lifetime
0.82 (0.54-1.24) 12-17 mo lifetime
0.76 (52-1.11) 7-11 mo lifetime
0.96 (0.76-1.21) 1-6 mo lifetime
1.0 (referent) Never
0.53 (0.40-0.70)More than 23 mo
lifetime
0.76 (0.59-0.98) From 11 to 23 mo
0.76 (0.58-0.99)More than 6 to 11
mo lifetime
0.78 (0.57-1.06) From 3 to 6 mo
1.03 (0.80-1.35)Any lacatation from
0 to 3 mo lifetime
1.0 (referent) Never
1.0 (referent)12 or more mo per
birth
1.07 (0.99-1.17)9 to less than 12 mo
per birth
1.09 (1.02-1.18)6 to less than 9 mo
per birth
1.19 (1.11-1.28)More than 3 to less
than 6 mo per birth
1.21 (1.12-1.30)More than 0 to 3 mo
per birth
1.22 (1.13-1.32) Never
0.66 (0.49-0.89) More than 23 mo
0.89 (0.71-1.1)More than 11 to 23
mo
0.96 (0.76-1.21More than 6 to 11
mo
0.98 (0.8-1.21) More than 3 to 6 mo
0.94 (0.79-1.12) More than 0 to 3 mo
1.0 (referent) Never
Source: Bartick et al. 2013
Premenopausal
ovarian cancer
Table 2,
Danforth el al,
2007
Relative risk
$102,147 for the year of
diagnosis to $578 for
years after the year of
diagnosis and $154,658
for the final year of life
(before 65)
Direct cost: $3,557 per
year; Indirect cost: $892
per year
18 mo lifetime
direct cost:998 per year;
indirect cost $98 per
year
Direct cost for acute MI
$13,426; indirect cost
$1506; After MI, annual
ongoing cost for
coronary heart disease
vary between $1,599
and $5,782; yearly
indirect cost: $434 to
$648
Type 2 diabetes
mellitus
Table 5, Stuebe
et al, 2005Hazard ratio
24 mo lifetime;
risk reduction
lasts 15 y after
the woman's
last birth
12 mo per birth
for up to four
births
24 mo lifetime
risk reduction
last 30 y after
the woman
HypertensionTable 3, Stube
et al, 2011Hazard ratio
MI, mycardial
infarction
Table 3, Stube
et al, 2009
Hazard
Ratio

50
U.S. Department of Health and Human Services. BBER used the mean difference with one year
breastfeeding rate change from 23% to 34% and applied to the New Mexico 15 year old female
population in 2013. As indicated in the last column of Table 2.21, there is significant reduction
in hypertension (401 incidences), breast cancer (37 incidences) , and MI (104 incidences).
Increasing 11% of one year breastfeeding rate would prevent 33 deaths in New Mexico. Bartick
et al model found that at national level, 34% breastfeeding in one year would prevent 8.5% (95%
CI 3.9-12.7%) of maternal MI, 5.5% (95% CI 4.6-6.6%) of maternal hypertension and 4.3%
(95% CI 3.5-5.3%) of the breast cancer.
Table 2.21 Lifetime incidence of maternal conditions at 1-year breastfeeding rate of 23% (in
2008) and 1-year breastfeeding rate of 34%
Table 3.16 shows the preventable incidences and direct and indirect cost estimates in 2013
dollars at 3% discount rate. BBER converted direct and indirect cost used by Bartick et al. into
2013 dollars for each health condition. Since they estimated cost of life time health condition of
15-year-female cohorts using a different discount rate (0%, 3% and 5%), BBER used a 3%
discount rate in this analysis. Among the maternal illnesses associated with suboptimal
breastfeeding, hyper tension accounts for the highest expenditures, with $2.8 million (43% of
cost savings). The second highest cost savings was estimated for MI ($1.7 million or 25%). Type
2 diabetes accounts for nearly a million dollar savings. Based on Bartick et al. methodology and
data, we estimated 33 preventable deaths (from those five causes) and $6.6 million cost savings
in 2013 as a result of an 11% increase in breastfeeding rate at one year. In Bartick et al.
estimation, using 3% discount rate, the average cost of premature death was $4.15 million. If the
same value of statistical life is applied to New Mexico premature deaths (i.e. 33), it would be
$137 million every year in 2011 dollars.
Diseases
Current rates of
breastfeeding,
cases/1000
women*
Optimal
breastfeeding,
cases/1000
women**
Mean difference with
change from current to
optimal breastfeeding,
cases/1000 women
(95% CI)
Excess Annual Cases of
New Mexico Maternal
Diseases Resulting from
Suboptimal Breastfeeding
(95% CI)
Breast Cancer 61 58.3 2.65 (2.1-3.2) 37 (29-45)
Premenopausal ovarian
cancer0.581 0.566 0.02 (-0.01-0.05) 0 (0-1)
Hypertension 515.7 487.1 28.60 (23.3-34.3) 401 (327-481)
Type 2 Diabetes melitus 67.3 65 2.38(-0.42-4.3) 33 (-6-60)
MI 86.8 79.4 7.41(3.4-11.2) 104 (48-157)
Death before age 70 year 66.1 63.8 2.33(-0.04-4.2) 33 (-1-59)
Source: Bartick et al. 2013 for estimation of current rate of breastfeeding and optimal breastfeeding per 100 women and excess
annual cases for new mexico are based on 14,013 15-year old New Mexico women per year
*Bartick et al. used 2008 1-year breastfeeding rate of 23%. **2020 objectives for breastfeeding in 1-year was 34.1%.
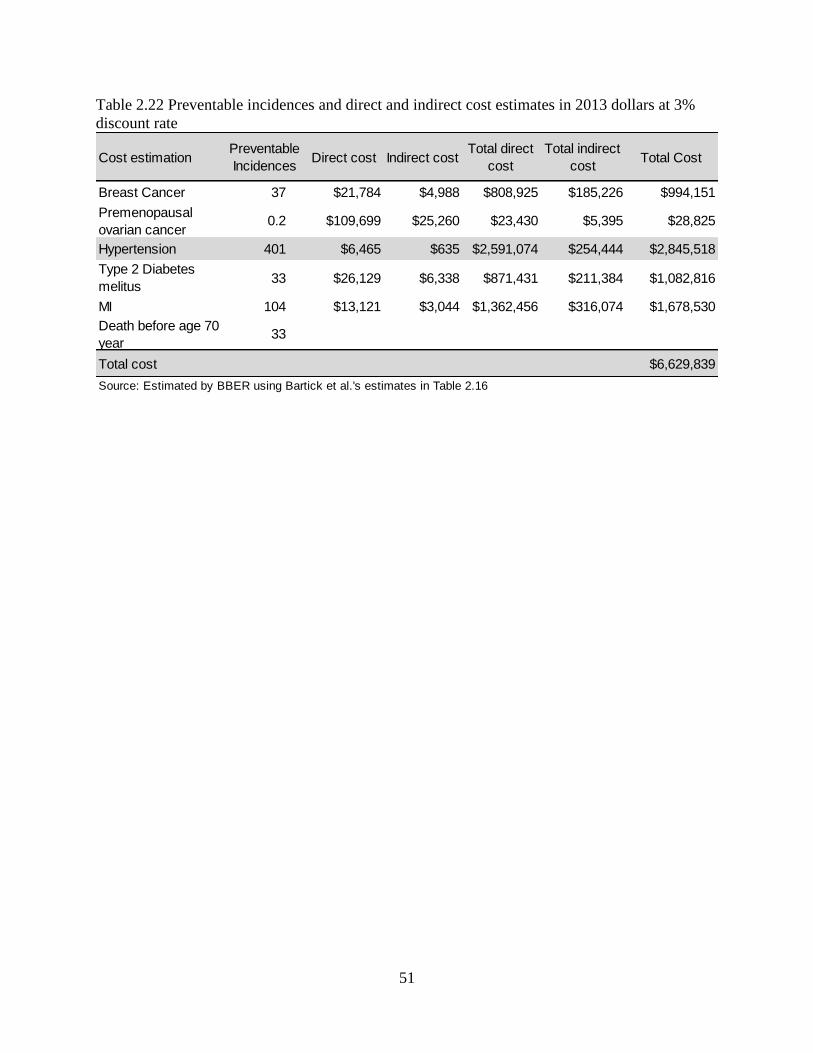
51
Table 2.22 Preventable incidences and direct and indirect cost estimates in 2013 dollars at 3%
discount rate
Cost estimationPreventable
IncidencesDirect cost Indirect cost
Total direct
cost
Total indirect
costTotal Cost
Breast Cancer 37 $21,784 $4,988 $808,925 $185,226 $994,151
Premenopausal
ovarian cancer0.2 $109,699 $25,260 $23,430 $5,395 $28,825
Hypertension 401 $6,465 $635 $2,591,074 $254,444 $2,845,518
Type 2 Diabetes
melitus33 $26,129 $6,338 $871,431 $211,384 $1,082,816
MI 104 $13,121 $3,044 $1,362,456 $316,074 $1,678,530
Death before age 70
year33
Total cost $6,629,839
Source: Estimated by BBER using Bartick et al.'s estimates in Table 2.16
52
References
Arenz, S., Rückerl, R., Koletzko, B., von Kries, R., 2004. Breast-feeding and childhood
obesity—a systematic review. International Journal of Obesity 28, 1247–1256.
doi:10.1038/sj.ijo.0802758
Axelsson, I.E.M., Ivarsson, S.A., Raiha, N.C.R., 1989. Protein Intake in Early Infancy: Effects
on Plasma Amino Acid Concentrations, Insulin Metabolism, and Growth. Pediatric
Research 26, 614–615. doi:10.1203/00006450-198912000-00020
Bartick, M.C., A.M. Stuebe, E.B. Schwarz, A.G. Reinhold, E.M. Foster, 2013. Cost Analysis of
Maternal Diseases Associated with Suboptimal Breastfeeding. Obstetrics and
Gynecology, vol 122(1).
Beyerlein, A., Kries, R. von, 2011. Breastfeeding and body composition in children: will there
ever be conclusive empirical evidence for a protective effect against overweight? The
American Journal of Clinical Nutrition 94, 1772S–1775S. doi:10.3945/ajcn.110.000547
Brew, B.K., Kull, I., Garden, F., Almqvist, C., Bergström, A., Lind, T., Webb, K., Wickman, M.,
Marks, G.B., 2012. Breastfeeding, asthma, and allergy: a tale of two cities. Pediatric
Allergy and Immunology 23, 75–82. doi:10.1111/j.1399-3038.2011.01229.x
Burgess, S.W., Dakin, C.J., O’Callaghan, M.J., 2006. Breastfeeding Does Not Increase the Risk
of Asthma at 14 Years. Pediatrics 117, e787–e792. doi:10.1542/peds.2005-1753
Cancer - United States Cancer Statistics (USCS) Data - 2010 State vs. National Comparisons
[WWW Document], 2013. URL http://apps.nccd.cdc.gov/uscs/statevsnational.aspx
(accessed 7.3.14).
Crume TL, Bahr TM, Mayer-Davis EJ, et al, 2012. Selective protection against extremes in
childhood body size, abdominal fat deposition, and fat patterning in breastfed children.
Archives of Pediatrics & Adolescent Medicine 166, 437–443.
doi:10.1001/archpediatrics.2011.1488
Dogaru, C.M., Nyffenegger, D., Pescatore, A.M., Spycher, B.D., Kuehni, C.E., 2014.
Breastfeeding and Childhood Asthma: Systematic Review and Meta-Analysis. Am. J.
Epidemiol. kwu072. doi:10.1093/aje/kwu072
Eichenfield, L.F., Hanifin, J.M., Beck, L.A., Lemanske, R.F., Sampson, H.A., Weiss, S.T.,
Leung, D.Y.M., 2003. Atopic Dermatitis and Asthma: Parallels in the Evolution of
Treatment. Pediatrics 111, 608–616. doi:10.1542/peds.111.3.608
Eidelman, A.I., Schanler, R.J., Johnston, M., Landers, S., Noble, L., Szucs, K., Viehmann, L.,
2012. Breastfeeding and the Use of Human Milk. Pediatrics 129, e827–e841.
doi:10.1542/peds.2011-3552
Fewtrell, M.S., 2011. Breast-feeding and later risk of CVD and obesity: evidence from
randomised trials. Proceedings of the Nutrition Society 70, 472–477.
doi:10.1017/S0029665111000589
Fomon, S.J., Ziegler, E.E., Nelson, S.E., Frantz, J.A., 1995. What is the safe protein-energy ratio
for infant formulas? The American Journal of Clinical Nutrition 62, 358–363.
53
Gale, C., Logan, K.M., Santhakumaran, S., Parkinson, J.R., Hyde, M.J., Modi, N., 2012. Effect
of breastfeeding compared with formula feeding on infant body composition: a
systematic review and meta-analysis. The American Journal of Clinical Nutrition 95,
656–669. doi:10.3945/ajcn.111.027284
Garofalo, R.P., Goldman, A.S., 1998. Cytokines, Chemokines, and Colony-Stimulating Factors
in Human Milk: The 1997 Update. Biology of the Neonate 74, 134–142.
doi:10.1159/000014019
Gdalevich, M., Mimouni, D., Mimouni, M., 2001. Breast-feeding and the risk of bronchial
asthma in childhood: A systematic review with meta-analysis of prospective studies. The
Journal of Pediatrics 139, 261–266. doi:10.1067/mpd.2001.117006
Greer, F.R., Sicherer, S.H., Burks, A.W., 2008. Effects of Early Nutritional Interventions on the
Development of Atopic Disease in Infants and Children: The Role of Maternal Dietary
Restriction, Breastfeeding, Timing of Introduction of Complementary Foods, and
Hydrolyzed Formulas. Pediatrics 121, 183–191. doi:10.1542/peds.2007-3022
Grote, V., von Kries, R., Closa-Monasterolo, R., Scaglioni, S., Gruszfeld, D., Sengier, A.,
Langhendries, J.-P., Koletzko, B., 2010. Protein Intake and Growth in the First 24
Months of Life: Journal of Pediatric Gastroenterology and Nutrition 51, S117–S118.
doi:10.1097/MPG.0b013e3181f96064
Guilbert, T.W., Wright, A.L., 2012. Does Breastfeeding Impact Lung Function and Asthma
Risk? American Journal of Respiratory and Critical Care Medicine 185, 801–802.
doi:10.1164/rccm.201202-0239ED
Günther, A.L., Buyken, A.E., Kroke, A., 2007. Protein intake during the period of
complementary feeding and early childhood and the association with body mass index
and percentage body fat at 7 y of age. Am J Clin Nutr 85, 1626–1633.
Hamosh, M., 2001. Bioactive Factors in Human Milk. Pediatric Clinics of North America 48,
69–86. doi:10.1016/S0031-3955(05)70286-8
Harder, T., Bergmann, R., Kallischnigg, G., Plagemann, A., 2005. Duration of Breastfeeding and
Risk of Overweight: A Meta-Analysis. American Journal of Epidemiology 162, 397–403.
doi:10.1093/aje/kwi222
Ip, S., Chung, M., Raman, G., Chew, P., Magula, N., DeVine, D., Trikalinos, T., Lau, J., 2007.
Breastfeeding and maternal and infant health outcomes in developed countries. Evid Rep
Technol Assess (Full Rep) 1–186.
Koletzko, B., Kries, R. von, Monasterolo, R.C., Subías, J.E., Scaglioni, S., Giovannini, M.,
Beyer, J., Demmelmair, H., Anton, B., Gruszfeld, D., Dobrzanska, A., Sengier, A.,
Langhendries, J.-P., Cachera, M.-F.R., Grote, V., 2009. Can infant feeding choices
modulate later obesity risk? The American Journal of Clinical Nutrition 89, 1502S–
1508S. doi:10.3945/ajcn.2009.27113D
Kull, I., Almqvist, C., Lilja, G., Pershagen, G., Wickman, M., 2004. Breast-feeding reduces the
risk of asthma during the first 4 years of life. Journal of Allergy and Clinical Immunology
114, 755–760. doi:10.1016/j.jaci.2004.07.036

54
Li, R., Fein, S.B., Grummer-Strawn, L.M., 2008. Association of Breastfeeding Intensity and
Bottle-Emptying Behaviors at Early Infancy With Infants’ Risk for Excess Weight at
Late Infancy. PEDIATRICS 122, S77–S84. doi:10.1542/peds.2008-1315j
Li, R., Fein, S.B., Grummer-Strawn, L.M., 2010. Do Infants Fed From Bottles Lack Self-
regulation of Milk Intake Compared With Directly Breastfed Infants? Pediatrics 125,
e1386–e1393. doi:10.1542/peds.2009-2549
Lustig, R.H., 2001. The neuroendocrinology of childhood obesity. Pediatric Clinics of North
America 48, 909–930. doi:10.1016/S0031-3955(05)70348-5
Mandhane, P.J., Greene, J.M., Sears, M.R., 2007. Interactions between breast-feeding, specific
parental atopy, and sex on development of asthma and atopy. Journal of Allergy and
Clinical Immunology 119, 1359–1366. doi:10.1016/j.jaci.2007.01.043
Manning, W.G., Newhouse, J.P., Duan, N., Keeler, E.B., Leibowitz, A., 1987. Health Insurance
and the Demand for Medical Care: Evidence from a Randomized Experiment. The
American Economic Review 77, 251–277.
McCrory, C., Layte, R., 2012. Breastfeeding and risk of overweight and obesity at nine-years of
age. Social Science & Medicine 75, 323–330. doi:10.1016/j.socscimed.2012.02.048
Metzger, M.W., McDade, T.W., 2010. Breastfeeding as obesity prevention in the United States:
A Sibling Difference Model. American Journal of Human Biology 22, 291–296.
National Center for Health Statistics (US), 2011. Health, United States, 2010: With Special
Feature on Death and Dying, Health, United States. National Center for Health Statistics
(US), Hyattsville (MD).
Oddy, W.H., 2012. Infant feeding and obesity risk in the child. Breastfeeding review:
professional publication of the Nursing Mothers’ Association of Australia 20, 7–12.
Ogden CL, Carroll MD, Kit BK, Flegal KM, 2012. Prevalence of obesity and trends in body
mass index among us children and adolescents, 1999-2010. JAMA 307, 483–490.
doi:10.1001/jama.2012.40
Owen, C.G., Martin, R.M., Whincup, P.H., Davey-Smith, G., Gillman, M.W., Cook, D.G.,
2005a. The effect of breastfeeding on mean body mass index throughout life: a
quantitative review of published and unpublished observational evidence. The American
Journal of Clinical Nutrition 82, 1298–1307.
Owen, C.G., Martin, R.M., Whincup, P.H., Smith, G.D., Cook, D.G., 2005b. Effect of Infant
Feeding on the Risk of Obesity Across the Life Course: A Quantitative Review of
Published Evidence. Pediatrics 115, 1367–1377. doi:10.1542/peds.2004-1176
Savino, F., Fissore, M.F., Liguori, S.A., Oggero, R., 2009. Can hormones contained in mothers’
milk account for the beneficial effect of breast-feeding on obesity in children? Clinical
Endocrinology 71, 757–765. doi:10.1111/j.1365-2265.2009.03585.x
Sears, M.R., Greene, J.M., Willan, A.R., Taylor, D.R., Flannery, E.M., Cowan, J.O., Herbison,
G.P., Poulton, R., 2002. Long-term relation between breastfeeding and development of
atopy and asthma in children and young adults: a longitudinal study. The Lancet 360,
901–907. doi:10.1016/S0140-6736(02)11025-7
55
Sievers, E., Oldigs, H.-D., Santer, R., Schaub, J., 2002. Feeding Patterns in Breast-Fed and
Formula-Fed Infants. Annals of Nutrition and Metabolism 46, 243–248.
doi:10.1159/000066498
Silvers, K.M., Frampton, C.M., Wickens, K., Pattemore, P.K., Ingham, T., Fishwick, D., Crane,
J., Town, G.I., Epton, M.J., 2012. Breastfeeding Protects against Current Asthma up to 6
Years of Age. The Journal of Pediatrics 160, 991–996.e1.
doi:10.1016/j.jpeds.2011.11.055
Ventura, A.K., Beauchamp, G.K., Mennella, J.A., 2012. Infant regulation of intake: the effect of
free glutamate content in infant formulas. The American Journal of Clinical Nutrition 95,
875–881. doi:10.3945/ajcn.111.024919
Wright, A.L., Holberg, C.J., Taussig, L.M., Martinez, F.D., 2001. Factors influencing the
relation of infant feeding to asthma and recurrent wheeze in childhood. Thorax 56, 192–
197. doi:10.1136/thorax.56.3.192

56
3. Business Survey
As part of the cost-benefit analysis of breastfeeding in New Mexico, BBER surveyed New
Mexico businesses regarding the cost and availability of nursing room, maternity leave, flex-
time, their knowledge about the laws pertaining to the use of breast-pumps in the workplace, and
employees' performance. BBER conducted this survey by using Survey Monkey, an internet-
based platform from mid-January to the end of April, 2014. The basic purpose of the business
survey was not only to collect data, but also to inform businesses about employee management
practices and breastfeeding support needed for their employees. It served as an advertisement
for breastfeeding support policy in workplaces in New Mexico. As a result, the survey
instrument was relatively longer than most business surveys.
With this report BBER will shed light on the knowledge of New Mexico businesses on the laws
pertaining to the use of breast pumps in the workplace, their support to nursing employees, cost
and availability of nursing room, maternity leave, flexi-time, etc. to the report also addresses the
following questions:
What is the cost for businesses to provide breastfeeding support to their employees?
Are businesses aware of the laws related to the use of breast pumps in the workplace?
Do businesses provide nursing space(s) for their breastfeeding employees?
What kind of breastfeeding-related support do businesses provide for their employees?
Do businesses provide paid/unpaid maternity leave?
Is paid maternity leave contingent upon having sufficient balances of annual/sick leave?
Or are there separate benefits to cover the cost of maternity leave?
Are businesses aware of what makes a workplace "breastfeeding friendly"?
What is the value of productivity loss that accommodates the needs of the breastfeeding
employee?
Are businesses aware to the value in increased productivity from employee job
satisfaction due to working in a supportive environment?
3.1 Survey Sample
To produce a representative sample of New Mexico businesses, BBER separated businesses into
six categories based on their number of employees. These categories are as follows:
1 to 4 employees
5 to 10 employees
11 to 50 employees
51 to 100 employees
101 to 250 employees
251 or more employees
57
As a survey sample, BBER included all the largest employers, 50% of the employers who
employ 51 to 250 people, 20% of employers who employ 10 to 50 people and 10% of the
employers who employ 4 to 10 people and 2.5% from the employers who employ less than 5
people. BBER used the modified Dillman survey method with one pre-notification, a survey
message, and one reminder notice. Once the survey was finalized, BBER sent pre-notification
emails to 15,441 New Mexico businesses and business departments. BBER found that many
emails were invalid, expired or not updated; as a result, the sent e-mails either bounced back or
did not reach to the intended respondents. BBER had no way to knowing how many surveys
actually reached to intended respondents. Business contact addresses were collected using
various databases, including Dun & Bradstreet, InfoUSA, and email-list.com. BBER sent survey
messages with the Survey Monkey link to the businesses and/or their departments a week after
the pre-notification email was sent. Follow up emails were sent to non-respondent businesses
after two to three weeks of the first mailing. BBER received 268 usable survey responses from
New Mexico businesses.
3.2 Survey Results
3.2.1 About Respondent Businesses
Table 3.1 presents comparison of percentages between the survey sample and New Mexico
businesses population. A total of 268 businesses identified their primary industry. Professional
and business services accounted for 26% of the sample, followed by educational services (16%),
health care and social assistance (10%), manufacturing (7%) and government (7%) (Table 3.1).
Professional and business services and retail trade account for a largest share (12% each)
followed by health care (11%), construction (10%) and accommodation and food services (7%).
When comparing the survey sample percentage with the New Mexico business establishments’
percentage, we found that some sectors are overrepresented (such as educational services,
manufacturing) and some sector are underrepresented (such as retail trade and construction).
Therefore, we cautiously generalize our results to the New Mexico business population.

58
Table 3.1 No. of Businesses by Sector in the Sample and Population
presents the respondent-businesses by city. Many businesses operate in more than one cities.
Most respondent businesses operate in City of Albuquerque (169) followed by Santa Fe (46), Las
Cruces (30), and Rio Rancho (10). Our sample represents many other cities such as Los Alamos,
Farmington, Alamogordo, Roswell, Clovis, Bloomfield, etc.
Table 3.3 and Table 3.4 present the percentage of female employees by sector and employment
category, respectively according to the survey. Across the businesses, 40% of the employments
are reported to be taken by women in New Mexico which 7% lower than what reported by
Bureau of Labor statistics in 2012. This shows that women are underrepresented in this survey.
The survey indicates that 66% of workers in the "healthcare" sector are women. Other businesses
that employ women in larger proportions include finance and insurance (51%), “arts,
entertainments, and recreation” (47%) and educational services (42%). Women in construction
and wholesale businesses comprise less than 20%. Overall, small businesses employ a higher
proportion of women compared to larger businesses. Businesses with 50 or less employees have
a larger share of female employees (50% or more) compared to businesses with 51 to 200
employees (46%) and businesses with 201 or more employees (38%). (Table 3.4).
No. of
BusinessesPercent
No. of
BusinessesPercent
Professional and Business Services 70 26% 6,612 12%
Educational Services 44 16% 799 1%
Health Care and Social Assistance 27 10% 5,977 11%
Manufacturing 20 7% 1,666 3%
Government 19 7% 3,764 7%
Retail Trade 15 6% 6,385 12%
Finance and Insurance 12 4% 2,722 5%
Information 12 4% 928 2%
Construction 9 3% 5,573 10%
Arts, Entertainment, and Recreation 8 3% 701 1%
Wholesale Trade 8 3% 2,992 5%
Accomodation and food services 7 3% 4,084 7%
Transportation, Warehousing and Utilities 6 2% 1,488 3%
Other Category 11 4% 11,794 21%
Grand Total 268 100% 55,485 100%
Bureau of Business & Economic Research, University of New Mexico, 2013
Survey Sample New MexicoNAICS Industry
Source: Sample data was obtained from business survey conducted by Bureau of Business and Economic
Research; and New Mexico business establishment numbers were obtained from New Mexico Department of
Workforce Solutions' QCEW unit
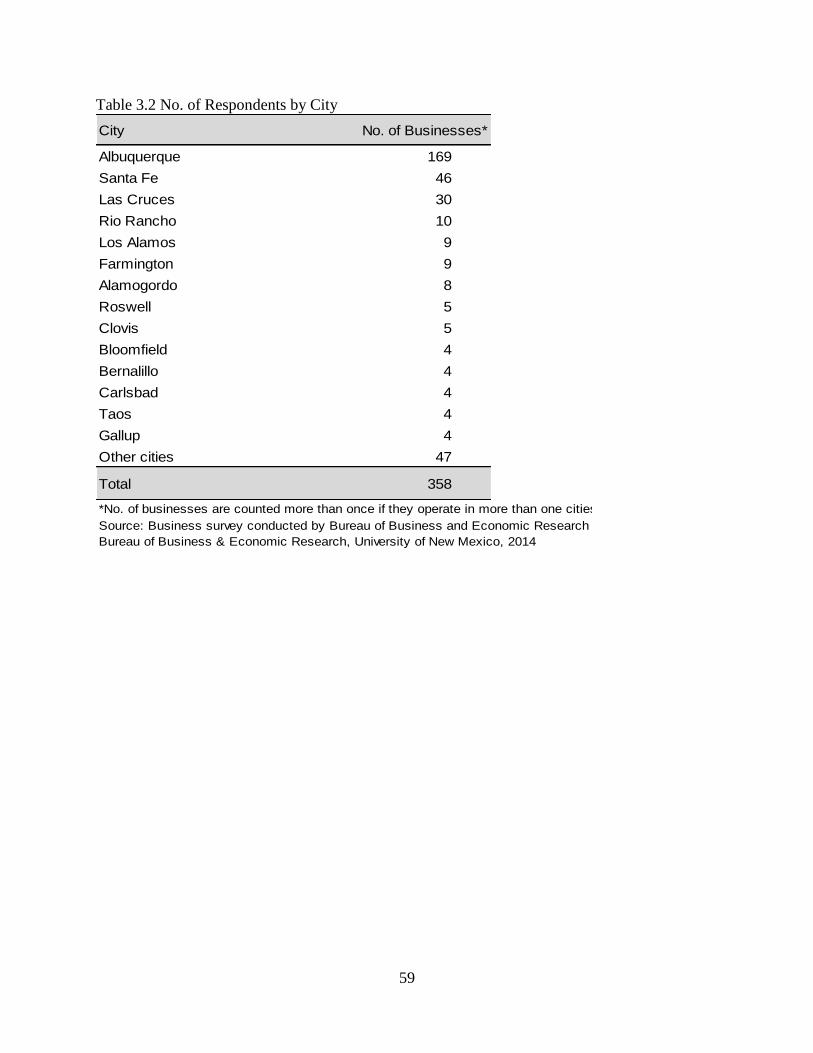
59
Table 3.2 No. of Respondents by City
City No. of Businesses*
Albuquerque 169
Santa Fe 46
Las Cruces 30
Rio Rancho 10
Los Alamos 9
Farmington 9
Alamogordo 8
Roswell 5
Clovis 5
Bloomfield 4
Bernalillo 4
Carlsbad 4
Taos 4
Gallup 4
Other cities 47
Total 358
*No. of businesses are counted more than once if they operate in more than one cities.
Source: Business survey conducted by Bureau of Business and Economic Research
Bureau of Business & Economic Research, University of New Mexico, 2014
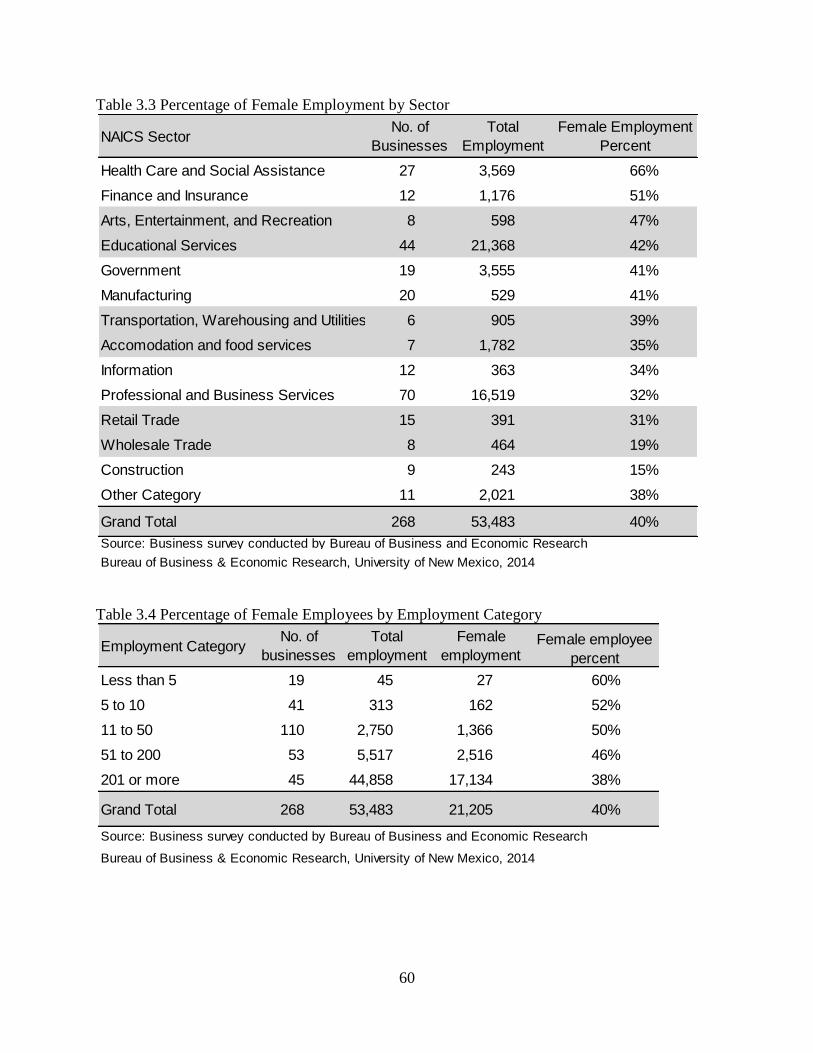
60
Table 3.3 Percentage of Female Employment by Sector
Table 3.4 Percentage of Female Employees by Employment Category
NAICS SectorNo. of
Businesses
Total
Employment
Female Employment
Percent
Health Care and Social Assistance 27 3,569 66%
Finance and Insurance 12 1,176 51%
Arts, Entertainment, and Recreation 8 598 47%
Educational Services 44 21,368 42%
Government 19 3,555 41%
Manufacturing 20 529 41%
Transportation, Warehousing and Utilities 6 905 39%
Accomodation and food services 7 1,782 35%
Information 12 363 34%
Professional and Business Services 70 16,519 32%
Retail Trade 15 391 31%
Wholesale Trade 8 464 19%
Construction 9 243 15%
Other Category 11 2,021 38%
Grand Total 268 53,483 40%
Source: Business survey conducted by Bureau of Business and Economic Research
Bureau of Business & Economic Research, University of New Mexico, 2014
Employment CategoryNo. of
businesses
Total
employment
Female
employmentFemale employee
percent
Less than 5 19 45 27 60%
5 to 10 41 313 162 52%
11 to 50 110 2,750 1,366 50%
51 to 200 53 5,517 2,516 46%
201 or more 45 44,858 17,134 38%
Grand Total 268 53,483 21,205 40%
Source: Business survey conducted by Bureau of Business and Economic Research
Bureau of Business & Economic Research, University of New Mexico, 2014
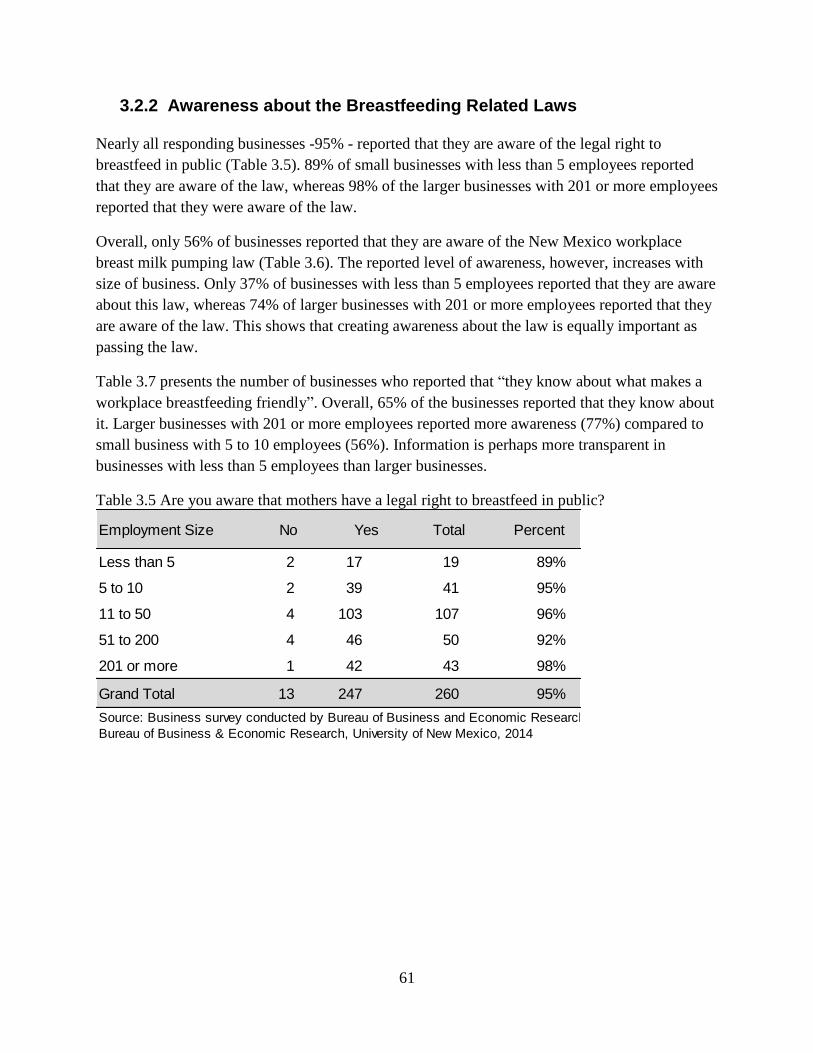
61
3.2.2 Awareness about the Breastfeeding Related Laws
Nearly all responding businesses -95% - reported that they are aware of the legal right to
breastfeed in public (Table 3.5). 89% of small businesses with less than 5 employees reported
that they are aware of the law, whereas 98% of the larger businesses with 201 or more employees
reported that they were aware of the law.
Overall, only 56% of businesses reported that they are aware of the New Mexico workplace
breast milk pumping law (Table 3.6). The reported level of awareness, however, increases with
size of business. Only 37% of businesses with less than 5 employees reported that they are aware
about this law, whereas 74% of larger businesses with 201 or more employees reported that they
are aware of the law. This shows that creating awareness about the law is equally important as
passing the law.
Table 3.7 presents the number of businesses who reported that “they know about what makes a
workplace breastfeeding friendly”. Overall, 65% of the businesses reported that they know about
it. Larger businesses with 201 or more employees reported more awareness (77%) compared to
small business with 5 to 10 employees (56%). Information is perhaps more transparent in
businesses with less than 5 employees than larger businesses.
Table 3.5 Are you aware that mothers have a legal right to breastfeed in public?
Employment Size No Yes Total Percent
Less than 5 2 17 19 89%
5 to 10 2 39 41 95%
11 to 50 4 103 107 96%
51 to 200 4 46 50 92%
201 or more 1 42 43 98%
Grand Total 13 247 260 95%
Source: Business survey conducted by Bureau of Business and Economic Research
Bureau of Business & Economic Research, University of New Mexico, 2014

62
Table 3.6 Are you aware of the New Mexico workplace breastmilk pumping law?
Table 3.7 Do you know what makes a workplace breastfeeding friendly?
3.2.3 Breastfeeding Support
When asked “Does your entity have a space(s) for employees to nurse or express breast milk for
their babies?", 260 businesses responded (Table 3.8). Across all businesses, 72% responded with
'yes'. A higher proportion (80% or more) of business with 51 or more employee reported that
they have a space for nursing or to express breast milk. Table 3.9 shows the reported “yes”
responses to the same question by sector. As expected, manufacturing and construction sector
businesses reported the lowest number of 'yes' compared to other sectors. Surprisingly, the
government sector was found to be the third lowest sector to report their 'yes' to the same
question.
Employment Size No Yes Total Percent
Less than 5 12 7 19 37%
5 to 10 19 22 41 54%
11 to 50 56 51 107 48%
51 to 200 16 33 49 67%
201 or more 11 32 43 74%
Grand Total 114 145 259 56%
Source: Business survey conducted by Bureau of Business and Economic Research
Bureau of Business & Economic Research, University of New Mexico, 2014
Employment Size No Yes Total Percent
Less than 5 6 13 19 68%
5 to 10 18 23 41 56%
11 to 50 44 63 107 59%
51 to 200 13 37 50 74%
201 or more 10 34 44 77%
Grand Total 91 170 261 65%
Source: Business survey conducted by Bureau of Business and Economic Research
Bureau of Business & Economic Research, University of New Mexico, 2014
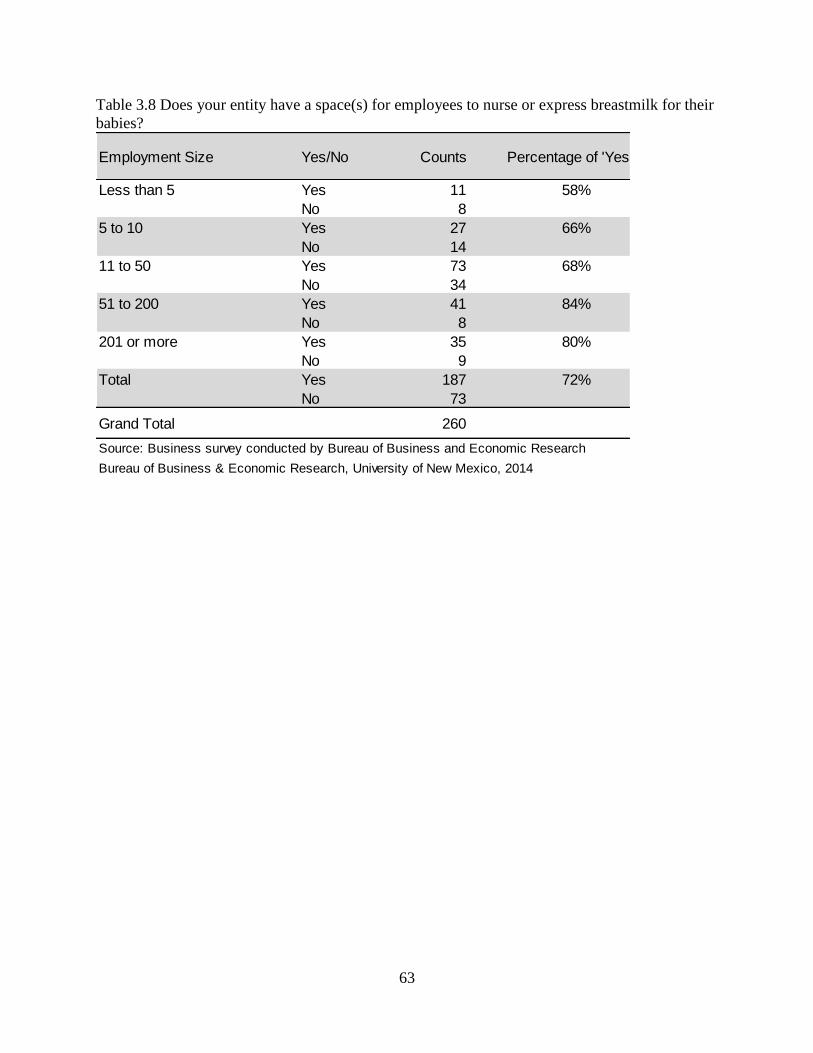
63
Table 3.8 Does your entity have a space(s) for employees to nurse or express breastmilk for their
babies?
Employment Size Yes/No Counts Percentage of 'Yes'
Less than 5 Yes 11 58%
No 8
5 to 10 Yes 27 66%
No 14
11 to 50 Yes 73 68%
No 34
51 to 200 Yes 41 84%
No 8
201 or more Yes 35 80%
No 9
Total Yes 187 72%
No 73
Grand Total 260
Source: Business survey conducted by Bureau of Business and Economic Research
Bureau of Business & Economic Research, University of New Mexico, 2014

64
Table 3.9 Does your entity have a space(s) for employees to nurse or express breastmilk for their
babies?
Table 3.10 presents the number of female employees and nursing spaces by employment size.
The total number of nursing spaces for all businesses with less than 5 employees and all
businesses with 5 to 10 employees were virtually the same (25 and 26, respectively) despite the
total number of all employees of all businesses with 5 to 10 employees being 7 times the total
employees of all businesses with less than 5 employees. Additionally, the ratio of female
employee/nursing space for businesses with less than 5 employees is 1:1, while for businesses
with 5 to 10 employees the ratio is 6:1. This correlation continues as businesses increase in size:
the ratio of female employee/nursing space for businesses with 11 to 50 employees is 20:1, for
businesses with 51 to 200 employees the ratio is 43:1, and for businesses with 201 or more
employees the ratio is 107:1. As expected, larger businesses reported having higher number of
nursing spaces than smaller businesses. However, the number of female employees to nursing
space ratio is higher for larger employers. Larger employers generally have an advantage over
smaller employer to provide nursing space because of economies of scale. In other words, more
mothers can utilize the same space for nursing their baby or to express milk.
NAICS Industry No Yes Percent of 'Yes'
Professional and Business Services 16 53 77%
Educational Services 13 29 69%
Health Care and Social Assistance 5 20 80%
Government 7 10 59%
Information 2 10 83%
Manufacturing 10 10 50%
Retail Trade 5 10 67%
Finance and Insurance 2 9 82%
Arts, Entertainment, and Recreation 1 7 88%
Wholesale Trade 2 6 75%
Accomodation and food services 2 5 71%
Construction 4 5 56%
Transportation, Warehousing and Utilities 2 4 67%
Other Category 2 9 82%
Grand Total 73 187 72%
Source: Business survey conducted by Bureau of Business and Economic Research
Bureau of Business & Economic Research, University of New Mexico, 2014
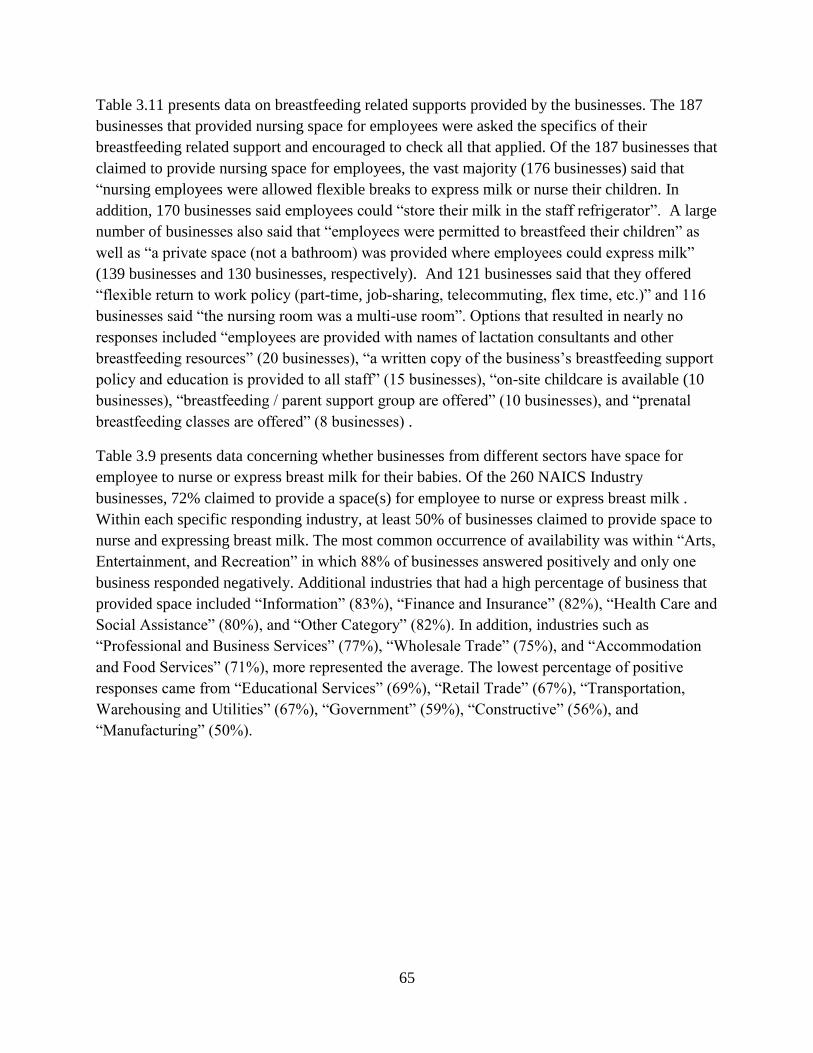
65
Table 3.11 presents data on breastfeeding related supports provided by the businesses. The 187
businesses that provided nursing space for employees were asked the specifics of their
breastfeeding related support and encouraged to check all that applied. Of the 187 businesses that
claimed to provide nursing space for employees, the vast majority (176 businesses) said that
“nursing employees were allowed flexible breaks to express milk or nurse their children. In
addition, 170 businesses said employees could “store their milk in the staff refrigerator”. A large
number of businesses also said that “employees were permitted to breastfeed their children” as
well as “a private space (not a bathroom) was provided where employees could express milk”
(139 businesses and 130 businesses, respectively). And 121 businesses said that they offered
“flexible return to work policy (part-time, job-sharing, telecommuting, flex time, etc.)” and 116
businesses said “the nursing room was a multi-use room”. Options that resulted in nearly no
responses included “employees are provided with names of lactation consultants and other
breastfeeding resources” (20 businesses), “a written copy of the business’s breastfeeding support
policy and education is provided to all staff” (15 businesses), “on-site childcare is available (10
businesses), “breastfeeding / parent support group are offered” (10 businesses), and “prenatal
breastfeeding classes are offered” (8 businesses) .
Table 3.9 presents data concerning whether businesses from different sectors have space for
employee to nurse or express breast milk for their babies. Of the 260 NAICS Industry
businesses, 72% claimed to provide a space(s) for employee to nurse or express breast milk .
Within each specific responding industry, at least 50% of businesses claimed to provide space to
nurse and expressing breast milk. The most common occurrence of availability was within “Arts,
Entertainment, and Recreation” in which 88% of businesses answered positively and only one
business responded negatively. Additional industries that had a high percentage of business that
provided space included “Information” (83%), “Finance and Insurance” (82%), “Health Care and
Social Assistance” (80%), and “Other Category” (82%). In addition, industries such as
“Professional and Business Services” (77%), “Wholesale Trade” (75%), and “Accommodation
and Food Services” (71%), more represented the average. The lowest percentage of positive
responses came from “Educational Services” (69%), “Retail Trade” (67%), “Transportation,
Warehousing and Utilities” (67%), “Government” (59%), “Constructive” (56%), and
“Manufacturing” (50%).

66
Table 3.10 Number of Female Employees and Nursing Spaces by Employment Size
Table 3.11 No. of Businesses Providing Breastfeeding Support
3.2.4 Maternity Leave
Maternity leave refers to the period of time that a new mother takes off from work following the
birth of her baby. When asked “how many days of unpaid maternity leave may an employee take
in a year with rights to return to work”, 172 businesses responded to the question (Table 3.12).
Among those, 3% reported that they do not provide any maternity leave for their employee. This
number could be higher because many non-respondents may fall under this category. 11
Employment SizeNo. of
Businesses
No. of
Employees
No. of
Nursing
Spaces
No. of Female
Employees
Female employee-
nursing space ratio
Less than 5 19 45 25 27 1
5 to 10 41 313 26 162 6
11 to 50 110 2,750 70 1,366 20
51 to 200 53 5,517 58 2,516 43
201 or more 45 69,232 182 19,534 107
Grand Total 268 77,857 361 23,605 65
Source: Business survey conducted by Bureau of Business and Economic Research
Bureau of Business & Economic Research, University of New Mexico, 2014
Breastfeeding related supportNo. of
businesses
Employees are permitted to breastfeed their children on 139
Nursing employees are allowed flexible breaks to express
milk or nurse their children.176
A private space (not a bathroom) is provided where
employees may express milk.130
The nursing room is a multi-use room. 116
Employees may store their milk in the staff refrigerator. 170
On-site childcare is available. 10
Prenatal breastfeeding classes are offered. 8
Breastfeeding / parenting support groups are offered. 10
Employees are provided with names of lactation consultants
and other breastfeeding resources.20
We offer flexible return to work policy (part-time, job sharing,
telecommuting, flex time, etc.)121
A written copy of the business's breastfeeding support
policy and education is provided to all staff.15
Source: Business survey conducted by Bureau of Business and Economic Research
Bureau of Business & Economic Research, University of New Mexico, 2014
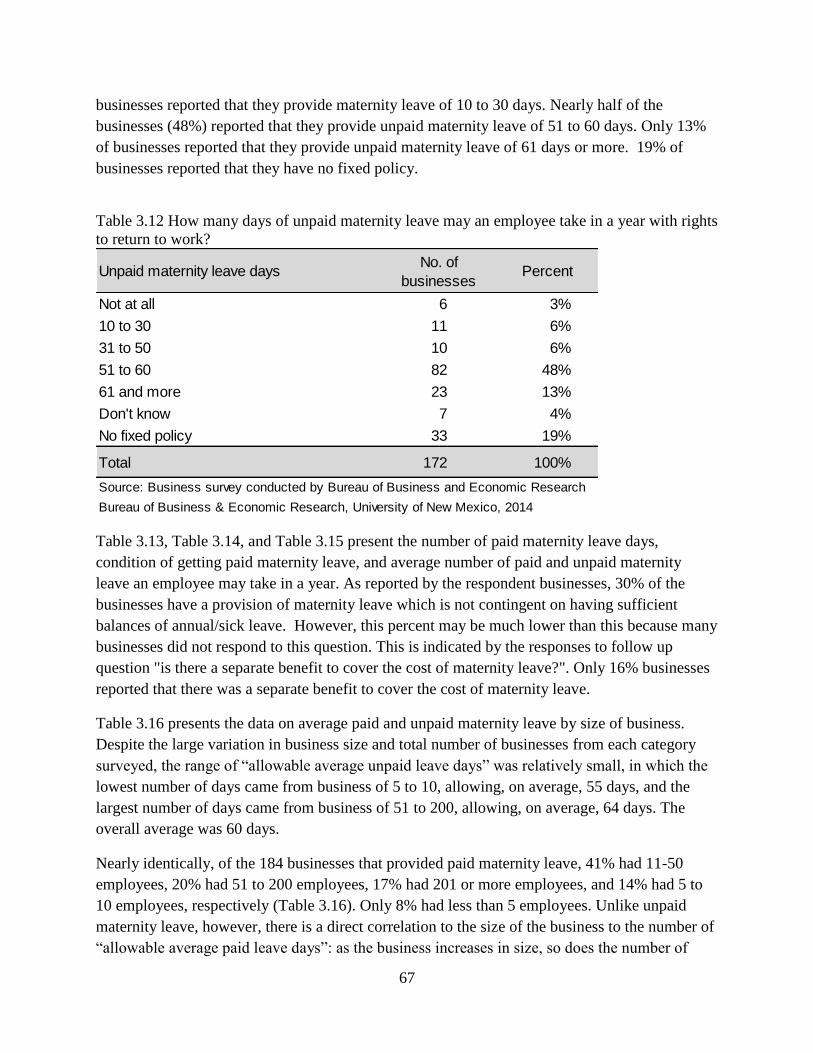
67
businesses reported that they provide maternity leave of 10 to 30 days. Nearly half of the
businesses (48%) reported that they provide unpaid maternity leave of 51 to 60 days. Only 13%
of businesses reported that they provide unpaid maternity leave of 61 days or more. 19% of
businesses reported that they have no fixed policy.
Table 3.12 How many days of unpaid maternity leave may an employee take in a year with rights
to return to work?
Table 3.13, Table 3.14, and Table 3.15 present the number of paid maternity leave days,
condition of getting paid maternity leave, and average number of paid and unpaid maternity
leave an employee may take in a year. As reported by the respondent businesses, 30% of the
businesses have a provision of maternity leave which is not contingent on having sufficient
balances of annual/sick leave. However, this percent may be much lower than this because many
businesses did not respond to this question. This is indicated by the responses to follow up
question "is there a separate benefit to cover the cost of maternity leave?". Only 16% businesses
reported that there was a separate benefit to cover the cost of maternity leave.
Table 3.16 presents the data on average paid and unpaid maternity leave by size of business.
Despite the large variation in business size and total number of businesses from each category
surveyed, the range of “allowable average unpaid leave days” was relatively small, in which the
lowest number of days came from business of 5 to 10, allowing, on average, 55 days, and the
largest number of days came from business of 51 to 200, allowing, on average, 64 days. The
overall average was 60 days.
Nearly identically, of the 184 businesses that provided paid maternity leave, 41% had 11-50
employees, 20% had 51 to 200 employees, 17% had 201 or more employees, and 14% had 5 to
10 employees, respectively (Table 3.16). Only 8% had less than 5 employees. Unlike unpaid
maternity leave, however, there is a direct correlation to the size of the business to the number of
“allowable average paid leave days”: as the business increases in size, so does the number of
Unpaid maternity leave daysNo. of
businessesPercent
Not at all 6 3%
10 to 30 11 6%
31 to 50 10 6%
51 to 60 82 48%
61 and more 23 13%
Don't know 7 4%
No fixed policy 33 19%
Total 172 100%
Source: Business survey conducted by Bureau of Business and Economic Research
Bureau of Business & Economic Research, University of New Mexico, 2014
68
average paid leave days. Businesses of less than 5 employees averaged 22 days, businesses of 5
to 10 employees averaged 23 days, businesses of 11 to 50 employees averaged 30 days,
businesses of 51 to 200 employees averaged 52 days, and businesses of 201 or more employees
averaged 55 days. The overall average was 37 days (Table 3.16)
Of the 179 businesses that responded, 41% allowed their employees to take paid maternity leave
“based on [the employee’s] accrued leave balance.” 22% of businesses allowed their employees
to take “11 to 30” paid maternity leave days. The remaining results are split fairly evenly
amongst “31 to 60”, “Not at all”, “2 to 10”, “61 or more”, “No fixed policy”, and “Don’t know”
with 9%, 7%, 6%, 6%, 5%, and 3%, respectively (Table 3.13).
Table 3.13 How many days of paid maternity leave may an employee take in a year?
Of the 178 responses, half or more of each business, regardless of size, confirmed paid maternity
leave was contingent upon sufficient balances of annual/sick leave. 81% of businesses with 51 to
200 employees confirmed the necessity of sufficient annual/sick leave, and businesses with 11 to
50 and 201 or more employees confirmed 70% and 69%, respectively. The smallest business
sizes confirmed the smallest percentages, with businesses with 5 to 10 and businesses with less
than 5 employees confirmed the necessity of sufficient annual/sick leave at 64% and 50%,
respectively. Overall, 70% of all businesses confirmed paid maternity leave was contingent upon
sufficient balances of annual/sick leave (Table 3.14).
Of the 180 responses, only 25% of businesses with 51 to 200 employees indicated there was a
separate benefit to cover the cost of maternity leave (Table 3.15). Similarly, 21% businesses with
less than 5 employees also confirmed separate benefits. Businesses of 11 to 50 employees and 5
to 10 employees confirmed separate benefits with 16% and 12%, respectively. Only 3% of
businesses with 201 or more employees confirmed separate benefits. Overall, 16% of all
business confirmed a separate benefit to cover the cost of maternity leave.
Paid maternity leave daysNo. of
BusinessesPercent
Not at all 13 7%
2 to 10 10 6%
11 to 30 40 22%
31 to 60 17 9%
61 or more 10 6%
Based on accrued leave balance 74 41%
No fixed policy 9 5%
Don't know 6 3%
Total 179 100%
Source: Business survey conducted by Bureau of Business and Economic Research
Bureau of Business & Economic Research, University of New Mexico, 2014
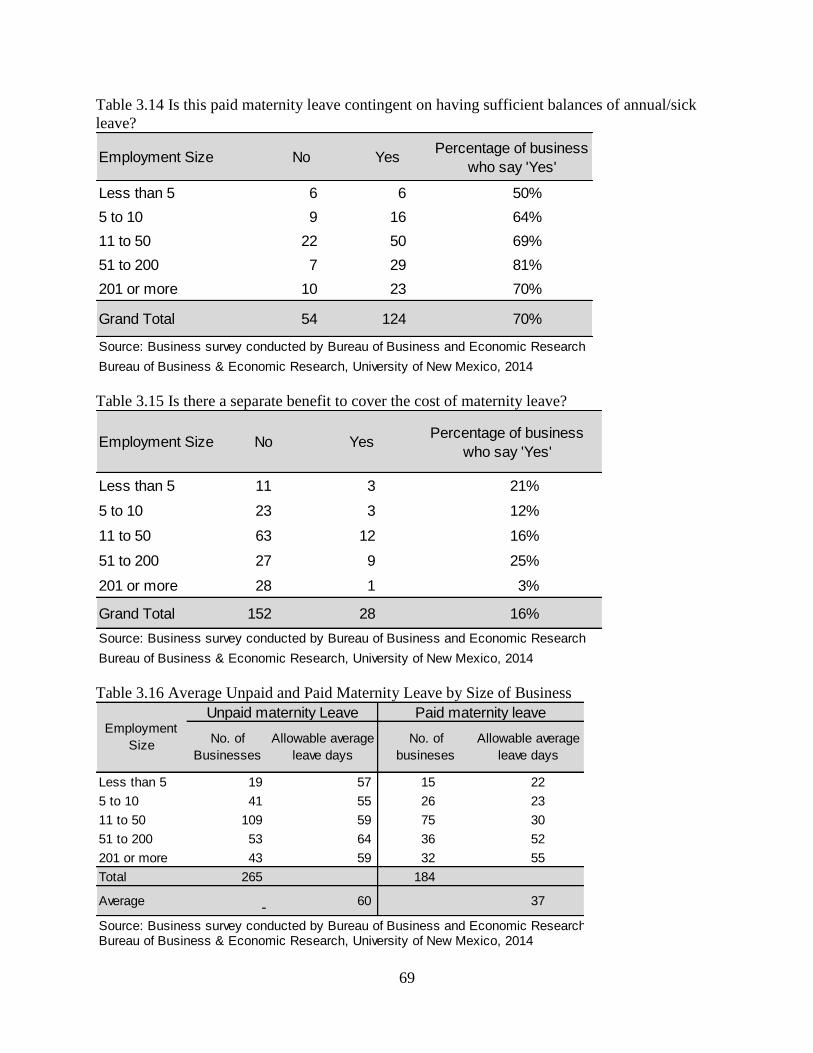
69
Table 3.14 Is this paid maternity leave contingent on having sufficient balances of annual/sick
leave?
Table 3.15 Is there a separate benefit to cover the cost of maternity leave?
Table 3.16 Average Unpaid and Paid Maternity Leave by Size of Business
Employment Size No YesPercentage of business
who say 'Yes'
Less than 5 6 6 50%
5 to 10 9 16 64%
11 to 50 22 50 69%
51 to 200 7 29 81%
201 or more 10 23 70%
Grand Total 54 124 70%
Source: Business survey conducted by Bureau of Business and Economic Research
Bureau of Business & Economic Research, University of New Mexico, 2014
Employment Size No YesPercentage of business
who say 'Yes'
Less than 5 11 3 21%
5 to 10 23 3 12%
11 to 50 63 12 16%
51 to 200 27 9 25%
201 or more 28 1 3%
Grand Total 152 28 16%
Source: Business survey conducted by Bureau of Business and Economic Research
Bureau of Business & Economic Research, University of New Mexico, 2014
No. of
Businesses
Allowable average
leave days
No. of
busineses
Allowable average
leave days
Less than 5 19 57 15 22
5 to 10 41 55 26 23
11 to 50 109 59 75 30
51 to 200 53 64 36 52
201 or more 43 59 32 55
Total 265 184
Average - 60 37
Source: Business survey conducted by Bureau of Business and Economic ResearchBureau of Business & Economic Research, University of New Mexico, 2014
Unpaid maternity Leave Paid maternity leaveEmployment
Size
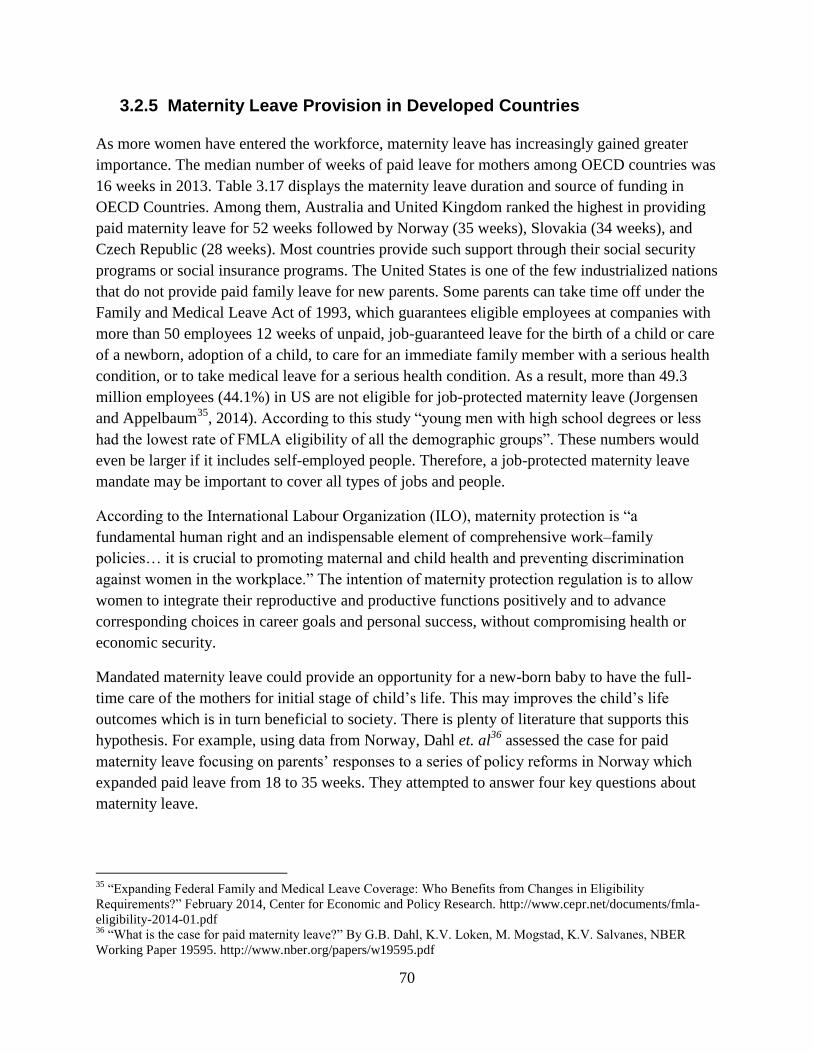
70
3.2.5 Maternity Leave Provision in Developed Countries
As more women have entered the workforce, maternity leave has increasingly gained greater
importance. The median number of weeks of paid leave for mothers among OECD countries was
16 weeks in 2013. Table 3.17 displays the maternity leave duration and source of funding in
OECD Countries. Among them, Australia and United Kingdom ranked the highest in providing
paid maternity leave for 52 weeks followed by Norway (35 weeks), Slovakia (34 weeks), and
Czech Republic (28 weeks). Most countries provide such support through their social security
programs or social insurance programs. The United States is one of the few industrialized nations
that do not provide paid family leave for new parents. Some parents can take time off under the
Family and Medical Leave Act of 1993, which guarantees eligible employees at companies with
more than 50 employees 12 weeks of unpaid, job-guaranteed leave for the birth of a child or care
of a newborn, adoption of a child, to care for an immediate family member with a serious health
condition, or to take medical leave for a serious health condition. As a result, more than 49.3
million employees (44.1%) in US are not eligible for job-protected maternity leave (Jorgensen
and Appelbaum35
, 2014). According to this study “young men with high school degrees or less
had the lowest rate of FMLA eligibility of all the demographic groups”. These numbers would
even be larger if it includes self-employed people. Therefore, a job-protected maternity leave
mandate may be important to cover all types of jobs and people.
According to the International Labour Organization (ILO), maternity protection is “a
fundamental human right and an indispensable element of comprehensive work–family
policies… it is crucial to promoting maternal and child health and preventing discrimination
against women in the workplace.” The intention of maternity protection regulation is to allow
women to integrate their reproductive and productive functions positively and to advance
corresponding choices in career goals and personal success, without compromising health or
economic security.
Mandated maternity leave could provide an opportunity for a new-born baby to have the full-
time care of the mothers for initial stage of child’s life. This may improves the child’s life
outcomes which is in turn beneficial to society. There is plenty of literature that supports this
hypothesis. For example, using data from Norway, Dahl et. al36
assessed the case for paid
maternity leave focusing on parents’ responses to a series of policy reforms in Norway which
expanded paid leave from 18 to 35 weeks. They attempted to answer four key questions about
maternity leave.
35
“Expanding Federal Family and Medical Leave Coverage: Who Benefits from Changes in Eligibility
Requirements?” February 2014, Center for Economic and Policy Research. http://www.cepr.net/documents/fmla-
eligibility-2014-01.pdf 36
“What is the case for paid maternity leave?” By G.B. Dahl, K.V. Loken, M. Mogstad, K.V. Salvanes, NBER
Working Paper 19595. http://www.nber.org/papers/w19595.pdf

71
“Does paid leave increase available parental time with children, or does it simply crowd
out unpaid leave?”
“What effect does paid leave have on a broad range of child, parent and family
outcomes?
“How do any benefits compare relative to costs?
“Are there progressive or regressive distributional effects?
Table 3.17 Maternity Leave Duration and Source of Funding in Developed Countries
Source: International Labor Organization. http://www.ilo.org/wcmsp5/groups/public/---dgreports/---
dcomm/documents/publication/wcms_242615.pdf
Country
Duration of maternity
leave (in national
legislation)
Amount of maternity leave cash
benefits (% previous earnings)
Source of funding of maternity leave cash
benefits
Australia 52 weeks (parental leave)18 weeks at the federal minimum
wage level
Social security (public funds – federal
government)
Austria 16 weeks 100% Social security (social insurance)
Belgium 15 weeks82% for the first 30 days; 75% for the
remainder (up to a ceiling)Social security (social insurance)
Canada 17 weeks (federal) 55% for 15 weeks up to a ceiling Social security (social insurance)
Chile 18 weeks 100% up to a ceiling Social security (social insurance)
Czech Republic 28 weeks 70% Social security (social insurance)
Denmark 18 weeks 100% Mixed (public funds and employer)
Estonia 140 days (20 weeks) 100% Social security (social insurance)
Finland105 working days (18
weeks)70% Social security (social insurance)
France 16 weeks 100% up to a ceiling Social security (social insurance)
Germany 14 weeks 100%Mixed (social insurance for a flat rate benefit
and employer liability)
Greece 119 days (17 weeks) 100%Social security (public insurance and public
funds)
Hungary 24 weeks 70% Social security (social insurance)
Iceland 3 months 80% Social security (social insurance)
Ireland26 weeks paid (plus 16
weeks unpaid)80% up to a ceiling for 26% weeks Social security (social insurance)
Israel 14 weeks 100% up to a ceiling Social security (social insurance)
Italy 5 months (22 weeks) 80% Social security (social insurance)
Japan 14 weeks 66.70% Social security (social insurance)
Korea, Republic of 90 days (13 weeks) 100%Mixed (two-thirds employer; one-third social
insurance
Luxembourg 16 weeks 100% Social security (social insurance)
Mexico 12 weeks 100% Social security (social insurance
Netherlands 16 weeks 100% up to a ceiling Social security (social insurance)
New Zealand 14 weeks 100% up to a ceiling Social security (public funds - State)
Norway 35 (or 45) weeks 100% (or 80% for 45 weeks) Social security (social insurance)
Porland 26 weeks 100% Social security (social insurance)
Portugal120 (150) days (17 or 21
weeks)100% (or 80% for 150 days) Social security (social insurance)
Slovakia 34 weeks 65% Social security (social insurance)
Slovenia 105 days (15 weeks) 100% Social security (social insurance)
Spain 16 weeks 100% Social security (social insurance)
Sweden 14 weeks 80% Social security (social insurance)
Switzerland 14 weeks 80% up to a ceilingSocial security and mandatory private
insurance (50% employer; 50% employee)
Turkey 16 weeks 66.70% Social security (social insurance)
United Kingdom 52 weeks
6 weeks paid at 90%; lower of
90%/flat rate for weeks 7-39; weeks
40-52 unpaid
Mixed (employers reimbursed up to 92% by
public funds)
United States 12 weeks (federal) Unpaid No federal programme

72
Their conclusion for the first question was that additional maternity leave caused an increase in
mother’s time spent at home after birth, without a reduction in family income. Second, expansion
of paid maternity leave “had little effect on a wide variety of outcomes, including children’s
school outcomes, parental earnings, and participation in the labor market in the short or long run,
marriage and divorce”. Third, the paid maternity leave resulted in regressive transfer of
payments. That means it did not support the low income families. Fourth, it did not impact on
future parents tax payments and benefit receipt. The study concludes that “the large increases in
public spending on parental leave imply a considerable increase in taxes, at a cost to economic
efficiency.”
3.2.6 Flexible Work Hours
Of the total 184 business responses, nearly 80% reported that they provide “Part-time” and
nearly 70% provide “Flex-time” options for a flexible work environment (Table 3.18).
According to this survey, 50% provide staggered hours/shift work, 47% provide working at
home/teleworking and only 26% and 15% provide “comp time” and “compressed hours” options
for a flexible work environment, respectively).
Table 3.18 No. of Businesses Providing Flexible Work Environment
Table 3.19 presents responses about the main constraints to provide flexible work hours for
nursing employees. Of the 81 businesses that responded to this question, 41 businesses showed
their “concerns about treating employees equally”, 38 businesses reported that they were
concerned about “loss of productivity”, 26 businesses have their concern about the abuse of
policies and so on.
Flexible working arrangementNo. of
Businesses
Part-time 145
Flex-time 125
Staggered hours/shift work 93
Compressed hours 29
Comp time 48
Working at home /Teleworking 86
Source: Business survey conducted by Bureau of Business and Economic Research
Bureau of Business & Economic Research, University of New Mexico, 2014

73
Table 3.19 In your view, what are the main constraints to providing flexible working hours for
nursing employees in your entity?
3.2.7 Cost-Benefit of Breastfeeding Support to Businesses
Table 3.20 shows that whether businesses have any idea about medical cost difference between
breastfeeding employees and formula feeding employees. Of the 254 respondents, the vast
majority “didn’t know” totaling 90%. About 7% said “yes”, saying that their breastfeeding
employees indeed had lower costs, and 4% said “no”.
Table 3.20 Research has shown that there are lower medical costs and health insurance claims
for breastfeeding employees and their infants (relative to formula-fed). Is this true for your
entity?
Table 3.21 presents the reported average monthly value of productivity loss to accommodate the
needs of a breastfeeding employee. A majority of the businesses (54%) said that they did not
incur any cost to accommodate the needs of a breastfeeding employees. 14 businesses (12%)
reported the average monthly value of productivity loss between $6 to $1,000 per month. When
both categories were combined, the data indicate an average loss $67 per month. Finally, nearly
one fourth of the businesses reported that they have no idea about the loss of productivity.
ConstraintsNo. of
Businesses
Concerns about treating employees equally 41
Loss of productivity 38
Resentment from co-workers 27
Concerns about abuse of policies 26
Difficulty with supervision 19
Concerns about reactions of customers and clients 16
Source: Business survey conducted by Bureau of Business and Economic Research
Bureau of Business & Economic Research, University of New Mexico, 2014
Employment Size Yes No Don't know Grand Total
Less than 5 4 0 15 19
5 to 10 2 1 35 38
11 to 50 9 5 92 106
51 to 200 1 1 48 50
201 or more 1 2 38 41
Grand Total 17 9 228 254
Percent 7% 4% 90% 100%
Source: Business survey conducted by Bureau of Business and Economic Research
Bureau of Business & Economic Research, University of New Mexico, 2014
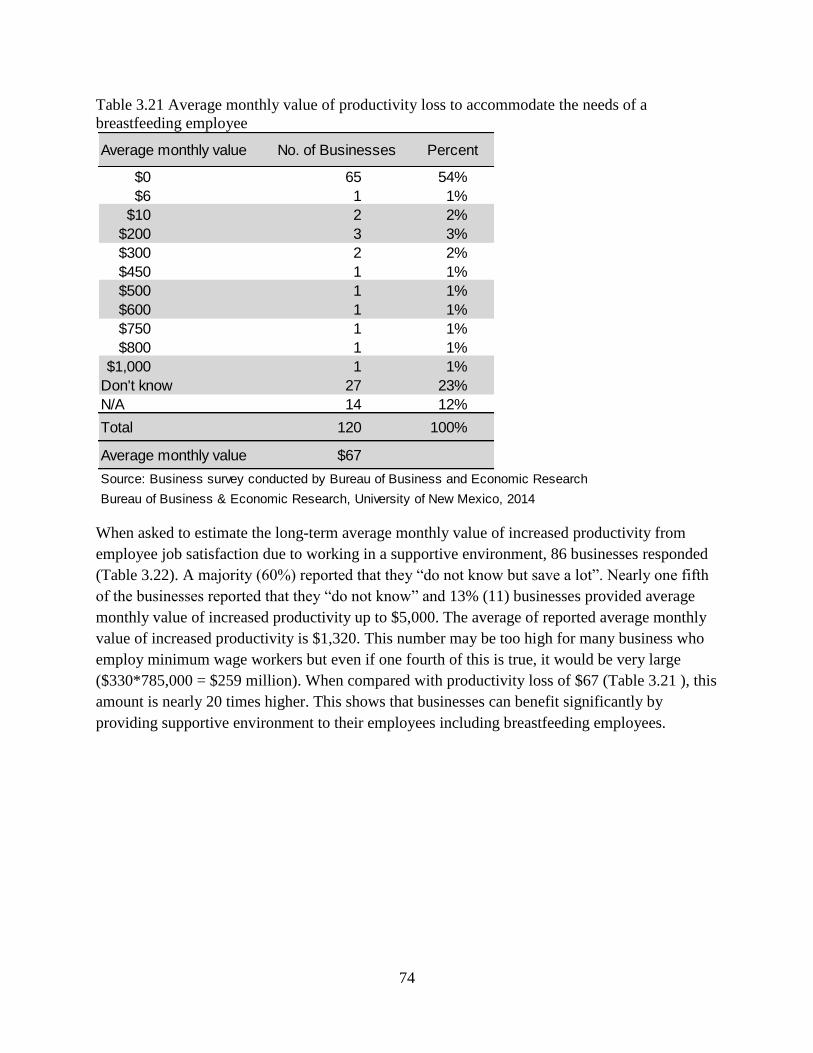
74
Table 3.21 Average monthly value of productivity loss to accommodate the needs of a
breastfeeding employee
When asked to estimate the long-term average monthly value of increased productivity from
employee job satisfaction due to working in a supportive environment, 86 businesses responded
(Table 3.22). A majority (60%) reported that they “do not know but save a lot”. Nearly one fifth
of the businesses reported that they “do not know” and 13% (11) businesses provided average
monthly value of increased productivity up to $5,000. The average of reported average monthly
value of increased productivity is $1,320. This number may be too high for many business who
employ minimum wage workers but even if one fourth of this is true, it would be very large
($330*785,000 = $259 million). When compared with productivity loss of $67 (Table 3.21 ), this
amount is nearly 20 times higher. This shows that businesses can benefit significantly by
providing supportive environment to their employees including breastfeeding employees.
Average monthly value No. of Businesses Percent
$0 65 54%
$6 1 1%
$10 2 2%
$200 3 3%
$300 2 2%
$450 1 1%
$500 1 1%
$600 1 1%
$750 1 1%
$800 1 1%
$1,000 1 1%
Don't know 27 23%
N/A 14 12%
Total 120 100%
Average monthly value $67
Source: Business survey conducted by Bureau of Business and Economic Research
Bureau of Business & Economic Research, University of New Mexico, 2014

75
Table 3.22 Long-term average monthly value of increased productivity from employee job
satisfaction due to working in a supportive environment
Table 3.23 presents estimated average monthly and annual cost of maintaining nursing spaces for
New Mexico businesses. The businesses who reported that they provide nursing space for
breastfeeding employees were asked to estimate the cost of providing nursing space such as
breast pumps, furnishing, refrigerator, rental, utilities, etc. Since many businesses used multi-
purpose room for this purpose, they did not have additional expenses. Fewer businesses (36 to
47) provided the cost information. Please see appendix .. for details.
According to the Bureau of Labor Statistics, women accounted for 47.8% of all employees in
2012. Using the same percentage, it is estimated that there were 375,000 women in the
workforce in New Mexico. BBER survey shows 71% of businesses have a space(s) for employee
to nurse or express breast milk for their babies. It is estimated that each nursing space is shared
by 65 women including non-nursing women in New Mexico. Using this ratio, BBER estimated a
total 4,097 nursing spaces in New Mexico. This does not mean that businesses provided those
many dedicated rooms for nursing employees. This simply means that 71% of New Mexico
businesses are accommodating nursing employees need by providing clean, private, non-
bathroom space including multipurpose rooms, offices, etc.
On average, 71% of New Mexico businesses are spending $87 per month per nursing space.
Annual cost of 4,097 nursing spaces is estimated to be $4.2 million (Table 3.23). This number is
very small if compared with the conservative estimate of the long-term average monthly value
Average monthly value No. of Businesses Percent
$0 1 1%
$10 1 1%
$450 1 1%
$600 1 1%
$900 1 1%
$1,000 1 1%
$1,125 2 2%
$1,313 1 1%
$3,000 1 1%
$5,000 1 1%
Don't know 15 17%
Don't know but save a lot 52 60%
N/A 8 9%
Grand Total 86 100%
Average of average
monthly value$1,320
Source: Business survey conducted by Bureau of Business and Economic Research
Bureau of Business & Economic Research, University of New Mexico, 2014
76
($330*785,000=$259 million) of increased productivity from employee job satisfaction due to
working in a supportive environment.
Table 3.23 Estimated average annual cost of nursing spaces for New Mexico businesses
Cost ItemOne time
cost
Average
monthly cost
Number of
nursing spaces*Annual cost Assumptions
Breast pump $50 $2.08 5,740 $143,505A breast pump
lasts for 2 years
Nursing room
furnishings$321 $3.34 5,740 $230,325
Furnitures last for
8 years
Refrigerator $265 $3.15 5,740 $217,307A refrigerator
lasts for 7 years
Nursing space rent - $57 5,740 $3,926,295
Utility cost - $21 5,740 $1,446,530
Total $87 $5,963,963
Source: Business survey conducted by Bureau of Business and Economic Research
Bureau of Business & Economic Research, University of New Mexico, 2014
*Number of nursing spaces is estimated using New Mexico female employee percent times number of total
New Mexico employment divided by female employee/nursing space ratio. ((785,448*47.8%)/65)
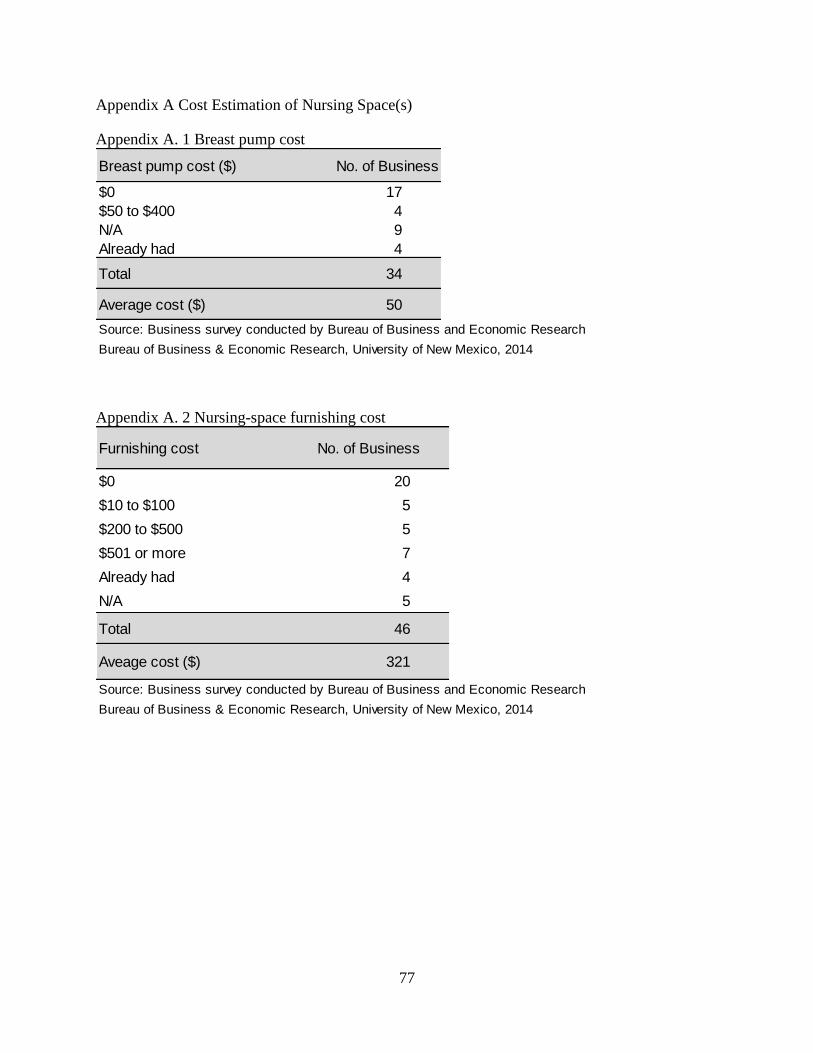
77
Appendix A Cost Estimation of Nursing Space(s)
Appendix A. 1 Breast pump cost
Appendix A. 2 Nursing-space furnishing cost
Breast pump cost ($) No. of Business
$0 17
$50 to $400 4
N/A 9
Already had 4
Total 34
Average cost ($) 50
Source: Business survey conducted by Bureau of Business and Economic Research
Bureau of Business & Economic Research, University of New Mexico, 2014
Furnishing cost No. of Business
$0 20
$10 to $100 5
$200 to $500 5
$501 or more 7
Already had 4
N/A 5
Total 46
Aveage cost ($) 321
Source: Business survey conducted by Bureau of Business and Economic Research
Bureau of Business & Economic Research, University of New Mexico, 2014

78
Appendix A. 3 Cost of refrigerator
Appendix A. 4 Nursing space rental cost
Appendix A. 5 Nursing space utility cost
Cost of Refrigerator No. of Businesses
$0 15
$50 to 500 13
$501 or more 9
Already had 4
N/A 5
Total 46
Average Cost ($) 265
Source: Business survey conducted by Bureau of Business and Economic Research
Bureau of Business & Economic Research, University of New Mexico, 2014
Rental Cost No. of Businesses
$0 21
$25 to 500 6
Shared 5
N/A 6
Total 38
Average Rental cost ($) 57
Source: Business survey conducted by Bureau of Business and Economic Research
Bureau of Business & Economic Research, University of New Mexico, 2014
Utility Cost ($) No. of Businesses
$0 17
10 2
25 4
65 1
150 1
200 1
Included in office expenses 6
N/A 5
Total 37
Average Cost ($) 21
Source: Business survey conducted by Bureau of Business and Economic Research
Bureau of Business & Economic Research, University of New Mexico, 2014

79
Appendix A. 6 Survey Participants Comments
Getting set locations for nursing mother's has been a challenge, but not because nursing
mothers are seen as low value - instead because of a lack of understand of the needs that
the nursing mothers have as well as availability of resources. We have a large campus
so we will always have to deal with case by case situations to meet needs but it has been
very important to establish at least some permanent spaces to help in that
education/awareness. We now have a standard and specs for adding nursing spaces as
new buildings are added, a standard way to inform managers of the need and plans to
create "multi-use" spaces that give nursing mother's priority but also sever as a place for
an employee to take a short break to stretch or a few minutes of relaxation or
biofeedback. If formulas are available to calculate questions 26 and 27 - please share
them - this would help with the argument for maintenance of corporate space for nursing
mom's and potential for things like on site day-care. Additionally, for question 18 we can
get health care cost - but currently would not have data on who breast fed vs formula fed.
Accommodating breast-feeding may or may not be happening. But I don't think anyone
here, especially our supervisors, even care.
We are a hospital and we encourage employed pregnant mothers to breast feed.
We have very few instances, however, we do all possible to accommodate.
I breastfed in the work place I was treated unfairly and unkindly while working at **.
This is an important question for employees and staff morale. Unfortunately, we are a
nonprofit, in a crowded facility, with no capital funding to create separate spaces. We
are working hard not to create a break room, and this could accommodate nursing
mothers who work for us or who visit our YMCA. We could put chairs in a couple of
restroom/locker areas, but these are common, open areas and not private.
As a woman who breastfed her own children, this is near and dear to my heart. That said,
the tone of this survey was a turn-off. If you are hoping to encourage employers to be
breast-feeding friendly, this will not be helpful. We are a business. We have requirements
to which we must adhere or we will cease to be a business. As a business, we only have
so much space and we are bursting at the seams. To have a dedicated breastfeeding room
isn't going to happen. It can't happen, we don't have the space. That said, we do have
spaces that can and do serve more than one function. We will make REASONABLE
ACCOMMODATIONS to assure breastfeeding moms are able to do what they need to do.
We will NOT purchase breast pumps! (Really??) That is mom's responsibility. No
business should be required to do anything more than make reasonable accommodations
to meet this need. It's too easy to sit in an office at a university and judge when you are
not actually trying to work out all these details. You do more to harm your cause that
way. (See, you made me feel all defensive and I SUPPORT BREASTFEEDING!) Take
note.

80
I am not in a supervisory role, so I do not know answers to a lot of these questions. I did
not breastfeed when I returned to work, so my knowledge is very limited.
We provide our employees the ability to pump in their personal offices by providing a
secure/private atmosphere if they choose to.
In 2 years, we have only had one employee give birth and request breastfeeding
assistance. This is not really an issue for us.
We are a predominantly male workforce environment. As a result we have not been faced
with breast feeding issues. We would create a supportive environment if the situation
presented itself.
We have a limited-term contractor who also needs breastfeeding rooms and we included
her in our numbers above.
No employees who have babies or young children right now, but that could change, of
course.
We have never had an employee with the desire to breast feed or pump however would be
willing to accommodate though it seems to also require a daycare arrangement in the
office which is a bigger problem. I would be interested in becoming more aware of the
possibilities in the event that there is an employee with the desire to breast feed.
We have not experienced any difficulty accommodating new mothers.
As a small company with mostly male employees and female employees over child
bearing age, we are not often in the situation of needing to accommodate a breastfeeding
mother, but we would accommodate a breastfeeding mother to the best of our ability,
complying with applicable laws, within reason and without negatively affecting our
business.
We do not & have not had any women of child bearing age for a long time so this survey
was very difficult to answer properly.
We are a small business with only 3 female employees - 2 of which are family members.
Unfortunately this survey does not really pertain to our business.
Understand, we have a primarily male staff (engineering tends to fall that way), our
female employees are all beyond their child-rearing times. That said, our male employees
benefit greatly from flexible schedules/etc. for dealing with sick children, healthy
children, etc. I have formulated my responses on that basis.
Questions are not well written; they do not accommodate answers that do not elicit the
desired responses you are seeking
I found it hard to assign dollar values to savings and expenses.
We have had one breast feeding employee in 20 years. Provided office space and
refrigeration, flexible work hours. Not an issue.
Given the chance, and request, I would gladly work with any female employee who
wanted to pump breast milk. In our manufacturing/ institutional environment it would
not be feasible to bring baby to work, though we would allow some flexibility with
schedule.
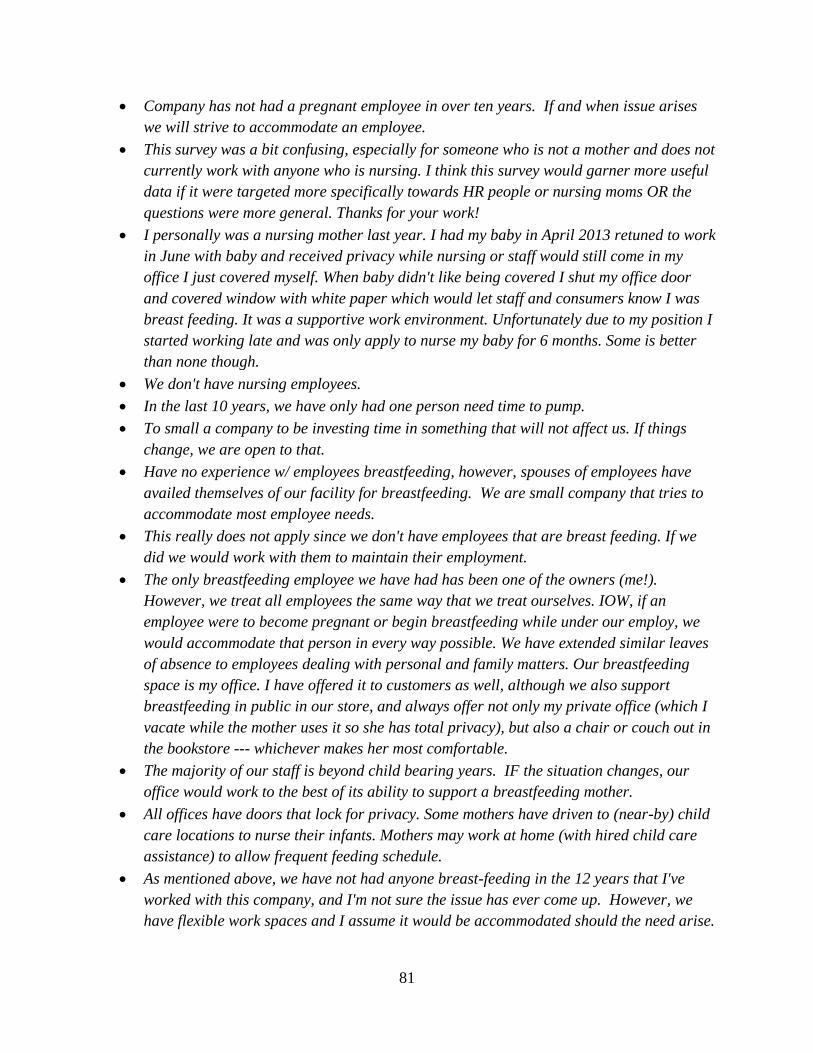
81
Company has not had a pregnant employee in over ten years. If and when issue arises
we will strive to accommodate an employee.
This survey was a bit confusing, especially for someone who is not a mother and does not
currently work with anyone who is nursing. I think this survey would garner more useful
data if it were targeted more specifically towards HR people or nursing moms OR the
questions were more general. Thanks for your work!
I personally was a nursing mother last year. I had my baby in April 2013 retuned to work
in June with baby and received privacy while nursing or staff would still come in my
office I just covered myself. When baby didn't like being covered I shut my office door
and covered window with white paper which would let staff and consumers know I was
breast feeding. It was a supportive work environment. Unfortunately due to my position I
started working late and was only apply to nurse my baby for 6 months. Some is better
than none though.
We don't have nursing employees.
In the last 10 years, we have only had one person need time to pump.
To small a company to be investing time in something that will not affect us. If things
change, we are open to that.
Have no experience w/ employees breastfeeding, however, spouses of employees have
availed themselves of our facility for breastfeeding. We are small company that tries to
accommodate most employee needs.
This really does not apply since we don't have employees that are breast feeding. If we
did we would work with them to maintain their employment.
The only breastfeeding employee we have had has been one of the owners (me!).
However, we treat all employees the same way that we treat ourselves. IOW, if an
employee were to become pregnant or begin breastfeeding while under our employ, we
would accommodate that person in every way possible. We have extended similar leaves
of absence to employees dealing with personal and family matters. Our breastfeeding
space is my office. I have offered it to customers as well, although we also support
breastfeeding in public in our store, and always offer not only my private office (which I
vacate while the mother uses it so she has total privacy), but also a chair or couch out in
the bookstore --- whichever makes her most comfortable.
The majority of our staff is beyond child bearing years. IF the situation changes, our
office would work to the best of its ability to support a breastfeeding mother.
All offices have doors that lock for privacy. Some mothers have driven to (near-by) child
care locations to nurse their infants. Mothers may work at home (with hired child care
assistance) to allow frequent feeding schedule.
As mentioned above, we have not had anyone breast-feeding in the 12 years that I've
worked with this company, and I'm not sure the issue has ever come up. However, we
have flexible work spaces and I assume it would be accommodated should the need arise.

82
This company is mostly male; however, I am female and I was able to breastfeed and
bring my babies to work with me while I breastfed. I did not have a separate room, but I
have an office with a door and all I had to do was close the door when I needed to feed
the baby or pump. I was very grateful to be able to share this time with my children. It is
very hard to put a value on the long-term increased productivity that I have experienced.
I have been here for 15 years and had 3 children while I have worked here. I brought two
of the three to work with me while they were infants, and I was able to share that special
time with them.
We have two nursing mothers out of 14 employees! We know that keeping the babies
healthy and happy makes everyone healthy and happy.
Stupid questions about dollars. Focus on the law and health benefits
We advocated on behalf of the legislation to protect breastfeeding employees in the
workplace.
I am currently breastfeeding and taking my daughter to work. My work has been very
flexible with this but this will change soon. It has been difficult to keep up with work and
there are many days in which I have to work extra hours but it has been worth it to have
her here with me. I am much more satisfied with my work having her here and am able
to be more productive in that way.
We are a small firm so it is easier to work with our employees on an individual basis than
a 100 person or 1000 person firm.
We work hard to work on value for our employees and have done well.
We don't have women employees due to lifting requirements
We are a small company, we have rarely had women with young children work for us, we
offer flexibility on a case-by-case basis depending on the employee's sales.
I am answering these questions for our department only. We are an offsite location and I
am not familiar with their set up. We have not had any breast feeding employees;
however, would accommodate as necessary in order to make the transition easier on the
employee(s).
While I was an independent contractor at the Massage Therapy Training Institute, I gave
birth to two children, two years apart. I was able to bring both children to work with me.
They slept in a wrap while I worked, nursed on demand, and were cared for by myself
and the rest of the community here at the school. This has contributed immensely to my
dedication and loyalty to this business. Students often bring their children into the school
while they are in class or working in the student clinic. One of our independent
contractors is a certified infant massage instructor, another has been a certified
professional midwife for decades, and the owner of the school was a stay at home father
for many years. The environment here is incredibly supportive of family and all that it
entails, including breastfeeding.
Both women who work here have older children and will not be nursing in the near
future.

83
We have a few employees and each has their own office, so they can have privacy if they
need it. We are flexible on break times, but depending on the position they might have to
work from the office in order to do their job.
I do not think we've ever had a nursing mother on staff. We would accommodate if/when
this should occur. In general at our company, if employees behave responsibly and get
their work done they are treated like grownups and have as much flexibility as they need.
State Government should replace the workplace regulations poster with an online
certificate of completion where the business owner or delegate must watch videos, take
periodic surveys and yield to an exam regarding workplace laws. This would be more
productive than this poster. Of course one of the online courses would target
breastfeeding. Also, perhaps your organization can start a contest whereby employers
submit breastfeeding policies, gaining further breastfeeding awareness and good public
relation for business.
We had one employee who used a breast-pump in her office several years ago. This
seemed to work well. I am not a manager and I do not know what our rules are on
maternity leave, etc.
I own my business and have one female employee; neither of us plan on having children.
I know the boss breast fed while on the job. I also know one of her other employees from
a long time ago had maternity leave and flexible work hours etc. while breastfeeding.
84
4. Survey of Mothers
The University of New Mexico’s Bureau of Business and Economic Research (BBER)
conducted a study called “benefit-cost analysis of improving New Mexico’s breastfeeding rate”
to estimate cost and benefit of breastfeeding and formula feeding. Women over 18 years of age
with at least one child less than 5 years of age were asked to participate. The survey was
conducted in May to June, 2014. The survey was designed and uploaded to the Survey Monkey
website. Survey questions were pretested and refined after two separate focus group discussions
with breastfeeding and formula feeding mothers. Focus group participants were asked to fill out
the survey and give their feedback on the survey. A focus group discussion report is presented in
separate section below.
The main objective of the survey was to understand mothers, their work-life balance, work
hours, breastfeeding challenges and duration, childcare cost, their level of satisfaction as a
mother, satisfaction on their health, their youngest child health, and satisfaction on their family’s
financial health.
Due to the lack of mothers’ contact addresses, BBER could not make a random sample of New
Mexico mothers. BBER relied on convenience sampling which is a non-probability sampling
technique where mothers were selected because of their convenient accessibility through social
media such as facebook, emails, WIC clinic, and referrals. BBER compared educational
attainment and race and ethnicity of respondent mothers and New Mexico women age 25 or
over.
4.1 Focus Group Discussions
BBER and the New Mexico Breastfeeding Task Force held two focus groups – one with
breastfeeding mothers only (held March 27, 2014) and a second with a mix of mothers who were
either currently formula feeding, had fed formula in the past, switched from breastfeeding to
formula-feeding, or supplemented with formula (held May 16, 2014). The primary purpose of
these focus groups was to ensure the survey we had developed for mothers was clear and would
yield the types of information and data we required, and whether there were key issues we had
omitted. The focus groups also served as a means of acquiring additional understanding of the
challenges mothers face in their feeding and parenting decisions. A total of 8 women attended
the first focus group, while 5 mothers and 2 fathers attended the second focus group.
As expected, the focus groups led to modifications of the mother’s survey, although the
modifications were minor. As hoped, the focus groups also yielded more in-depth understanding
of the broad spectrum of issues faced by mothers in their feeding and parenting decisions. Below
we have summarized the comments and insights shared by mothers regarding parenting and
feeding.

85
Mothers who worked prior to the birth of their child were asked if they received any maternity
leave. Responses indicate that due to a lack of maternity leave, most mothers must use
accumulated sick and annual leave in order to stay home with their baby. No focus group
attendee was able to spend more than three months at home with their newborn child.
Only one mother received actual maternity leave. The mother worked for a private company and
was given one month of paid maternity leave. Other mothers stayed home with their infant child
between two weeks and three months. One mother did not work either before or after her child
was born, and was therefore unconstrained in the amount of time spent with her newborn.
Mothers were asked whether their partners were able to take any leave when their child was
born. Responses indicate that paternity leave is scarcer than maternity leave.
Of the five partners associated with the participants in the second focus group, only two were
given paid leave. One of the two works for a family company and was given three weeks of paid
leave, while another was given one month of leave. One father was allowed to take two weeks of
unpaid leave to be with his newborn child, while another did not work either before or after her
child was born, and was therefore unconstrained in the amount of time he spent with his
newborn.
Mothers who had breastfed were asked when they stopped breastfeeding and why. Breastfeeding
durations ranged from a few months to 1.5 years. Reasons for using formula ranged from child
being given formula in the NICU to convenience. Responses suggest that hospitals, lactation
consultants, daycares, and others can play important roles in supporting and enabling
breastfeeding.
One mother breastfed only for a couple of weeks, as she and her baby had difficulty establishing
a solid latch and thus switched to formula. The strong desire some babies have for their mothers
to hold them and interact with them while breastfeeding has caused some to resist accepting
breast milk from a bottle. As a consequence some babies ultimately discontinue breastfeeding
when they begin attending daycare. At least two mothers stated that they have supplemented
with formula due to insufficient breast milk production. One such mother exclusively breastfed
for 3 months and subsequently supplemented with approximately 10 percent formula until her
child was 18 months old. The other such mother stated that formula was introduced to her baby
by the hospital while the baby was in the NICU. One mother indicated that she breastfed
exclusively for more than 2 months, but that her baby weaned himself at 4 months and ultimately
she found formula feeding to be more convenient.
We asked mothers about where they found support as a new mom. Families, partners, early
childhood development programs, and work environments were all mentioned as important
sources of support. One mother stated that nurses at the hospital helped her establish
breastfeeding, and subsequently called on numerous occasions to offer support. One mother cited
weekly home visits from the City of Albuquerque’s Early Head Start Program as an important
86
source of support. Another mother cited the importance of the socialization, developmental,
educational, and breastfeeding support she received through New Mexico’s Home Visiting
program. The work environment was noted as an important source of support by a mother who
works in a group comprised mostly of women of childbearing age, and who was given time and
space to pump at work.
In addition to asking about important sources of support, we also asked where support was
lacking. Responses indicate that daycare centers have room for improvement both in terms of
supporting breastfeeding mothers and providing quality care (particularly to infants under the age
of one). One mother was working and attending school when her child was just 8 weeks old. She
found that daycares do not provide quality care for children under the age of one; her baby was
left sitting in a chair or lying down most of the time, and was not given tummy time. She felt her
young baby needed more one-on-one time, and found that the bond she shared with her baby was
harmed by his time in daycare. As a consequence she removed her child from daycare and placed
him in the care of a friend while at work and school.
4.2 Survey Respondents
Table 4.1 demonstrates the level of education of survey responders compared to the overall
education of women in New Mexico. Within the 372 total responds, a full third “graduated from
college” (33%) and nearly a quarter completed professional degrees, a Master’s degree or Ph.D.
(24%). Only 14% completed “2 to 3 years of college” or an associate degree. When comparing
the survey sample percentage with the New Mexican women levels of education, we found that
some levels of education are overrepresented (specifically that of a higher level of education,
with a Bachelor’s degree or higher) and some levels of education are underrepresented (such as
New Mexicans with only a high school education or “some college”). Therefore, we would like
to only tentatively postulate our results as representative of the overall education of the New
Mexico population.
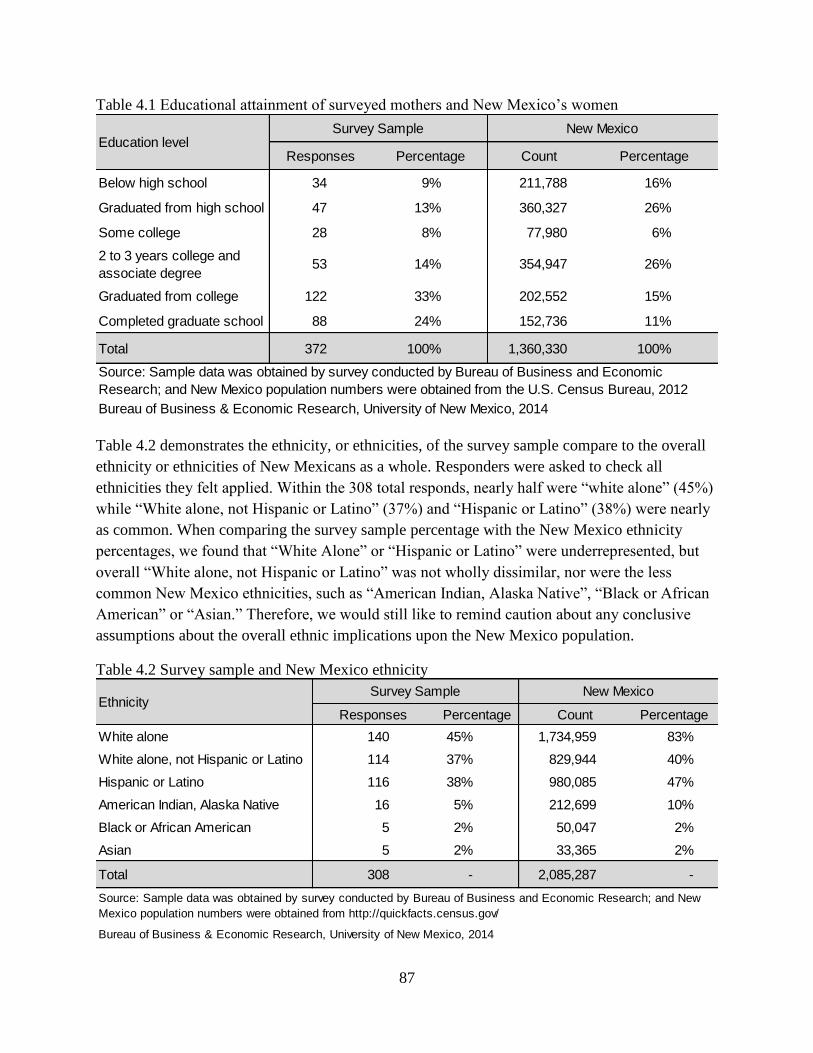
87
Table 4.1 Educational attainment of surveyed mothers and New Mexico’s women
Table 4.2 demonstrates the ethnicity, or ethnicities, of the survey sample compare to the overall
ethnicity or ethnicities of New Mexicans as a whole. Responders were asked to check all
ethnicities they felt applied. Within the 308 total responds, nearly half were “white alone” (45%)
while “White alone, not Hispanic or Latino” (37%) and “Hispanic or Latino” (38%) were nearly
as common. When comparing the survey sample percentage with the New Mexico ethnicity
percentages, we found that “White Alone” or “Hispanic or Latino” were underrepresented, but
overall “White alone, not Hispanic or Latino” was not wholly dissimilar, nor were the less
common New Mexico ethnicities, such as “American Indian, Alaska Native”, “Black or African
American” or “Asian.” Therefore, we would still like to remind caution about any conclusive
assumptions about the overall ethnic implications upon the New Mexico population.
Table 4.2 Survey sample and New Mexico ethnicity
Responses Percentage Count Percentage
Below high school 34 9% 211,788 16%
Graduated from high school 47 13% 360,327 26%
Some college 28 8% 77,980 6%
2 to 3 years college and
associate degree 53 14% 354,947 26%
Graduated from college 122 33% 202,552 15%
Completed graduate school 88 24% 152,736 11%
Total 372 100% 1,360,330 100%
Bureau of Business & Economic Research, University of New Mexico, 2014
Source: Sample data was obtained by survey conducted by Bureau of Business and Economic
Research; and New Mexico population numbers were obtained from the U.S. Census Bureau, 2012
Education levelSurvey Sample New Mexico
Responses Percentage Count Percentage
White alone 140 45% 1,734,959 83%
White alone, not Hispanic or Latino 114 37% 829,944 40%
Hispanic or Latino 116 38% 980,085 47%
American Indian, Alaska Native 16 5% 212,699 10%
Black or African American 5 2% 50,047 2%
Asian 5 2% 33,365 2%
Total 308 - 2,085,287 -
Bureau of Business & Economic Research, University of New Mexico, 2014
Source: Sample data was obtained by survey conducted by Bureau of Business and Economic Research; and New
Mexico population numbers were obtained from http://quickfacts.census.gov/
EthnicitySurvey Sample New Mexico

88
A total of 262 responders described their age (Table 4.3). The vast majority of responders were
either “21 to 30” years of age (45%) or “31 to 40” years of age (45%). The remaining 10% was
split evenly between mothers “20 or less” years of age (5%) or “41 or above” years of age (5%).
Table 4.3 What is the age of the mother?
A total of 275 responders described their marital status (Table 4.4). Over 68% of responders
were “Married” and 23% were “Single”. The remaining responders fell under “Other” (7%),
“Divorced” (1%), or “Separated” (1%).
Table 4.4 What is your current marital status?
Table 4.5 displays the average of different variables by ethnicity. On average, Hispanic White
women work relatively longer hours compared to women from other groups. Anglo-White
women, on average, earn more compared to other women. In terms of “ever breastfeeding
percent”, all groups of women have high percentages (94% or more). “Ever breastfeed percent”
of Anglo-White mothers is 98% and non-White Hispanic mother is 94%. On average, non-White
non-Hispanic household income is lower than any other. The percentage of married women was
highest in Anglo-White (82%) and lowest in non-White non-Hispanic (45%). However, this
difference may be due to small sample size (only 20) of non-White non-Hispanic.
Age in years Responses Percentage
20 or less 13 5%
21 to 30 119 45%
31 to 40 117 45%
41 or above 13 5%
Total 262 100%
Source: Survey conducted by Bureau of Business and Economic Research
Bureau of Business & Economic Research, University of New Mexico, 2014
Marital status Responses Percentage
Married 186 68%
Single 64 23%
Divorced 4 1%
Separated 2 1%
Other 19 7%
Total 275 100%
Source: Survey conducted by Bureau of Business and Economic Research
Bureau of Business & Economic Research, University of New Mexico, 2014
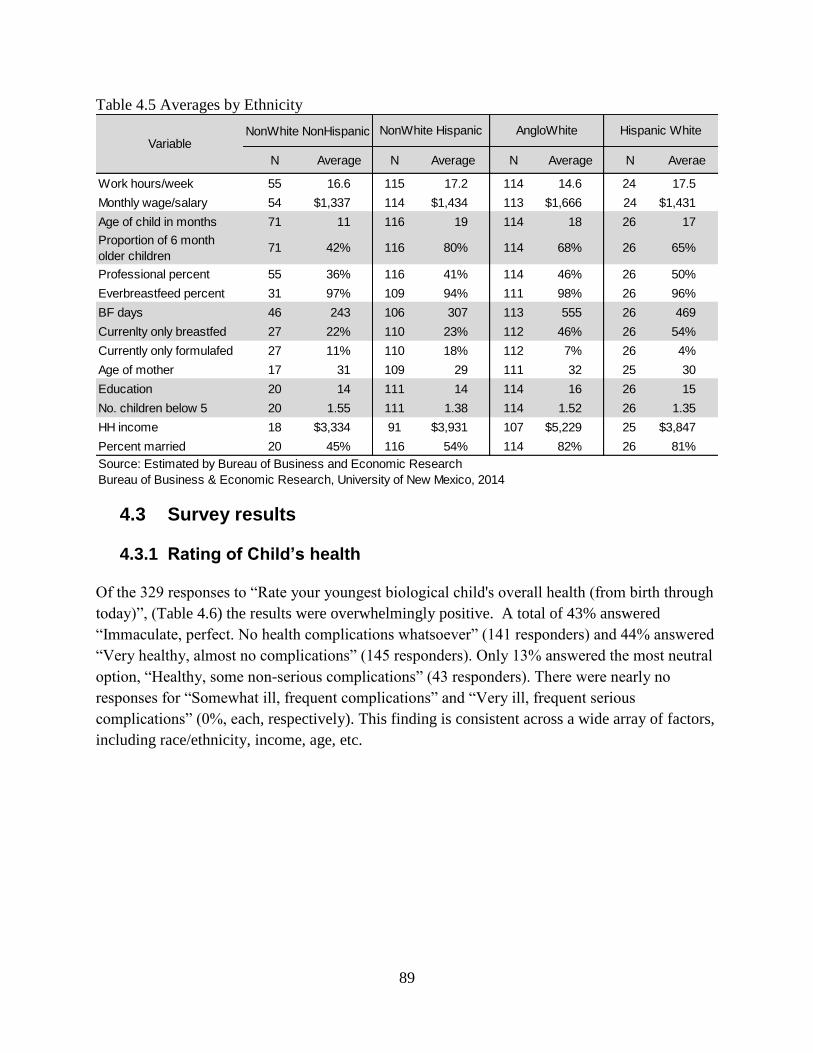
89
Table 4.5 Averages by Ethnicity
4.3 Survey results
4.3.1 Rating of Child’s health
Of the 329 responses to “Rate your youngest biological child's overall health (from birth through
today)”, (Table 4.6) the results were overwhelmingly positive. A total of 43% answered
“Immaculate, perfect. No health complications whatsoever” (141 responders) and 44% answered
“Very healthy, almost no complications” (145 responders). Only 13% answered the most neutral
option, “Healthy, some non-serious complications” (43 responders). There were nearly no
responses for “Somewhat ill, frequent complications” and “Very ill, frequent serious
complications” (0%, each, respectively). This finding is consistent across a wide array of factors,
including race/ethnicity, income, age, etc.
NonWhite NonHispanic
N Average N Average N Average N Averae
Work hours/week 55 16.6 115 17.2 114 14.6 24 17.5
Monthly wage/salary 54 $1,337 114 $1,434 113 $1,666 24 $1,431
Age of child in months 71 11 116 19 114 18 26 17
Proportion of 6 month
older children71 42% 116 80% 114 68% 26 65%
Professional percent 55 36% 116 41% 114 46% 26 50%
Everbreastfeed percent 31 97% 109 94% 111 98% 26 96%
BF days 46 243 106 307 113 555 26 469
Currenlty only breastfed 27 22% 110 23% 112 46% 26 54%
Currently only formulafed 27 11% 110 18% 112 7% 26 4%
Age of mother 17 31 109 29 111 32 25 30
Education 20 14 111 14 114 16 26 15
No. children below 5 20 1.55 111 1.38 114 1.52 26 1.35
HH income 18 $3,334 91 $3,931 107 $5,229 25 $3,847
Percent married 20 45% 116 54% 114 82% 26 81%
Source: Estimated by Bureau of Business and Economic Research
Bureau of Business & Economic Research, University of New Mexico, 2014
Hispanic WhiteVariable
NonWhite Hispanic AngloWhite
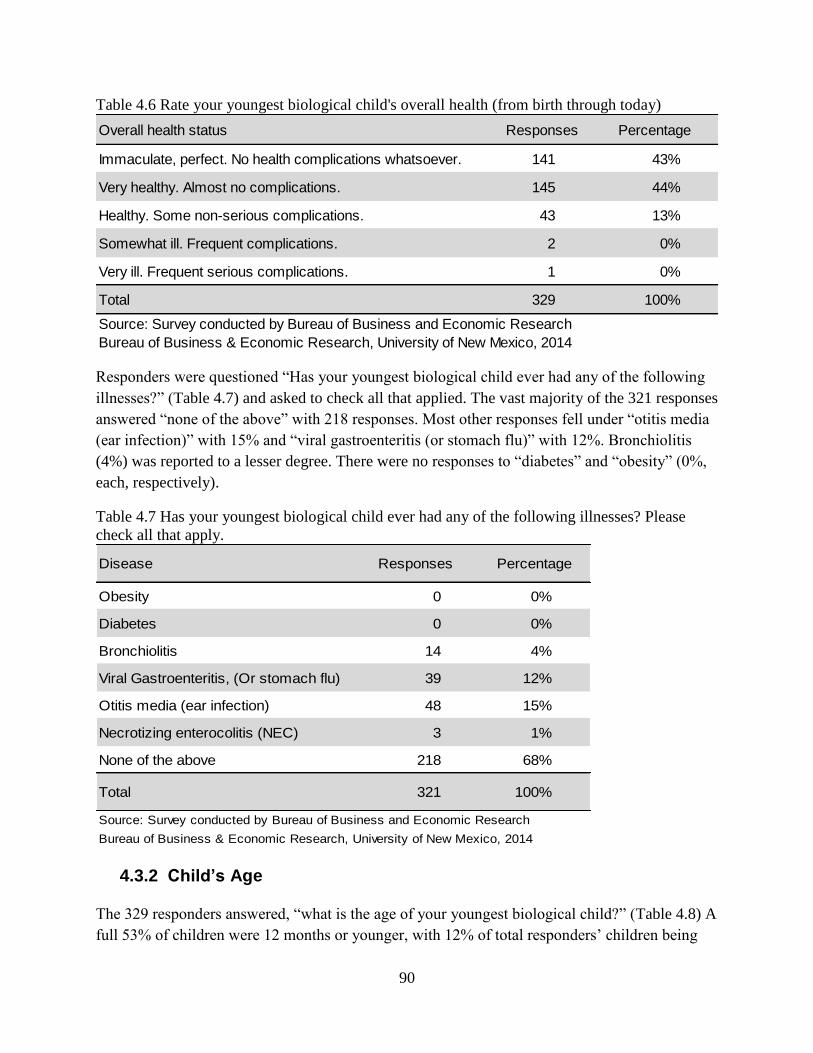
90
Table 4.6 Rate your youngest biological child's overall health (from birth through today)
Responders were questioned “Has your youngest biological child ever had any of the following
illnesses?” (Table 4.7) and asked to check all that applied. The vast majority of the 321 responses
answered “none of the above” with 218 responses. Most other responses fell under “otitis media
(ear infection)” with 15% and “viral gastroenteritis (or stomach flu)” with 12%. Bronchiolitis
(4%) was reported to a lesser degree. There were no responses to “diabetes” and “obesity” (0%,
each, respectively).
Table 4.7 Has your youngest biological child ever had any of the following illnesses? Please
check all that apply.
4.3.2 Child’s Age
The 329 responders answered, “what is the age of your youngest biological child?” (Table 4.8) A
full 53% of children were 12 months or younger, with 12% of total responders’ children being
Overall health status Responses Percentage
Immaculate, perfect. No health complications whatsoever. 141 43%
Very healthy. Almost no complications. 145 44%
Healthy. Some non-serious complications. 43 13%
Somewhat ill. Frequent complications. 2 0%
Very ill. Frequent serious complications. 1 0%
Total 329 100%
Source: Survey conducted by Bureau of Business and Economic Research
Bureau of Business & Economic Research, University of New Mexico, 2014
Disease Responses Percentage
Obesity 0 0%
Diabetes 0 0%
Bronchiolitis 14 4%
Viral Gastroenteritis, (Or stomach flu) 39 12%
Otitis media (ear infection) 48 15%
Necrotizing enterocolitis (NEC) 3 1%
None of the above 218 68%
Total 321 100%
Source: Survey conducted by Bureau of Business and Economic Research
Bureau of Business & Economic Research, University of New Mexico, 2014

91
less than one month. Commonality of age group decreased as age increased, with a significant
20% of responders describing their children as “1 to 2 years” of age and 14% of responders
describing their children as “2 to 3 years” of age. Small numbers of responders had children
above this threshold, with only 6% of responders describing their children as “3 to 4 years” of
age, 5% of responders describing their children as “4 to 5 years” of age.
Table 4.8 What is the age of your youngest biological child?
4.3.3 Employment and Childcare
Of the 329 responders, a large section (43%) answered that they did not work (Table 4.9). The
largest section of working responders worked between “31 to 40” hours per week (25%). There
were mostly scattered responses for the remaining categories, with 9% for “11 to 20” hours per
week, 6% for “up to 10” hours per week, 7% for “21 to 30” hours per week, 4% for “41 or more”
hours per week.
Table 4.9 How many hours do you work per week?
Age Responses Percentage
Less than 1 Month 38 12%
1 to 6 Months 73 22%
7 to 12 Months 64 19%
1 to 2 Years 67 20%
2 to 3 Years 47 14%
3 to 4 Years 20 6%
4 to 5 Years 20 6%
Total 329 100%
Source: Survey conducted by Bureau of Business and Economic Research
Bureau of Business & Economic Research, University of New Mexico, 2014
Hours per week Responses Percentage
Don't work 143 46%
Up to 10 20 6%
11 to 20 29 9%
21 to 30 23 7%
31 to 40 82 27%
41 or more 12 4%
Total 309 100%
Source: Survey conducted by Bureau of Business and Economic Research
Bureau of Business & Economic Research, University of New Mexico, 2014

92
For those who did not work, BBER did not ask the reason for staying home. However, the
Working Mother Research Institute have produced a survey report (2011) which asked “why
moms stay home”. They surveyed more than 3,700 women to find out who ends up at home.
Their results are presented in Table 4.10. The top reasons cited in their survey were children’s
need (44%), the cost of childcare (35%), birth of additional children (19%), spouse’s expectation
to stay home with children (19%) and lack of flexibility in start/stop time at work (12%).
Table 4.10 Why Moms Stay Home
A total of 237 responders described their career in general terms (Table 4.11). 62% described
their career as simply “Professional”, while 19% were either “administrative” or “secretarial”.
The remaining 19% fell under various miscellaneous categories.
Factors Percentage
The needs of my children 44%
Cost of child care 35%
The salary I earned did not justify the cost of working 26%
Long-standing desire to be a stay-at-home mom 20%
Birth of additioanl children 19%
My spouse/partner expected me to stay home with children 19%
Lack of flexibility in start/stop time at work 12%
Lack of high-quality child care 9%
Lack of part-time work options 8%
Having to work more than 40 hours a week 7%
Lack of support from my manager 5%
Lack of meaningful part-time work 5%
Other family members expected me to stay home 5%
The amount of travel required by my job 5%
Lack of paid parental leave 3%
Discrimination against working moms by my employer at the time 3%
Lack of support from my co-workers 2%
Source: Working Mother Research Institute,
http://www.wmmsurveys.com/WhatMomsChoose.pdf

93
Table 4.11 How would you categorize your career?
There were 312 responses to “what is your current hourly salary rate” (Table 4.12). Majority
(51%) of them did not work. 4% of responders made “less than $10” per hour. The results leaned
towards the more affluent responders, with 14% making “$10-15” per hours and a full 19%
making “$16-30” per hour. The top 12% of responders made “$31 dollars or more” per hour.
Table 4.12 What is your current hourly salary rate?
Table 4.13 displays labor force participation rate, average work hours, and average monthly
income of mothers by child’s age. As expected, mothers with younger children are less likely to
be in the labor force than mother with older children. The labor force participation rate of mother
with children under 6 months old (33%) was lower than the rate of those whose youngest child
were 6 months or older. Average work hours per week and the average monthly income of
mothers with young children were lower than mothers with older children.
Career Responses Percentage
Professional 148 62%
Admin/secretarial 44 19%
Other 45 19%
Total 237 100%
Source: Survey conducted by Bureau of Business and Economic Research
Bureau of Business & Economic Research, University of New Mexico, 2014
Rate (Per Hour) Responses Percentage
Don't work 158 51%
Less than $10 12 4%
$10-15 45 14%
$16-30 59 19%
$31+ 38 12%
Total 312 100%
Source: Survey conducted by Bureau of Business and Economic Research
Bureau of Business & Economic Research, University of New Mexico, 2014

94
Table 4.13 Labor force participation rate, average work hours per week and average monthly
income by child’s age
A total of 264 answered whether or not their “decision … to return to work was influenced by
childcare costs” (Table 4.14). Responds were fairly split, with 48% saying “yes” and 52% saying
“no”.
Table 4.14 Was your decision regarding whether to return to work influenced by childcare costs?
There were 103 estimations by responders of their monthly childcare expenses if they were
working full time (Table 4.15). About a third, each, estimated $501 to $800 per month (33%) and
$801 or more per month (32%), respectively. Only 20% estimated their childcare expenses to be
$301 to $500 per month and 15% estimated $300 or less per month.
Child's age Total number
Labor force
participation
rate
Average work
hours/week
Average
monthly
income
0-6 months 90 33% 25.3 $2,539
6-12 months 61 48% 32.6 $2,993
12-24 months 57 65% 28.8 $2,922
> 24 months 79 62% 27.8 $2,786
Total 287 49% 28.5 $2,812
Source: Mother survey conducted by Bureau of Business and Economic Research, UNM
Response Total Percent
No 137 52%
Yes 127 48%
Total 264 100%
Source: Survey conducted by Bureau of Business and Economic Research
Bureau of Business & Economic Research, University of New Mexico, 2014
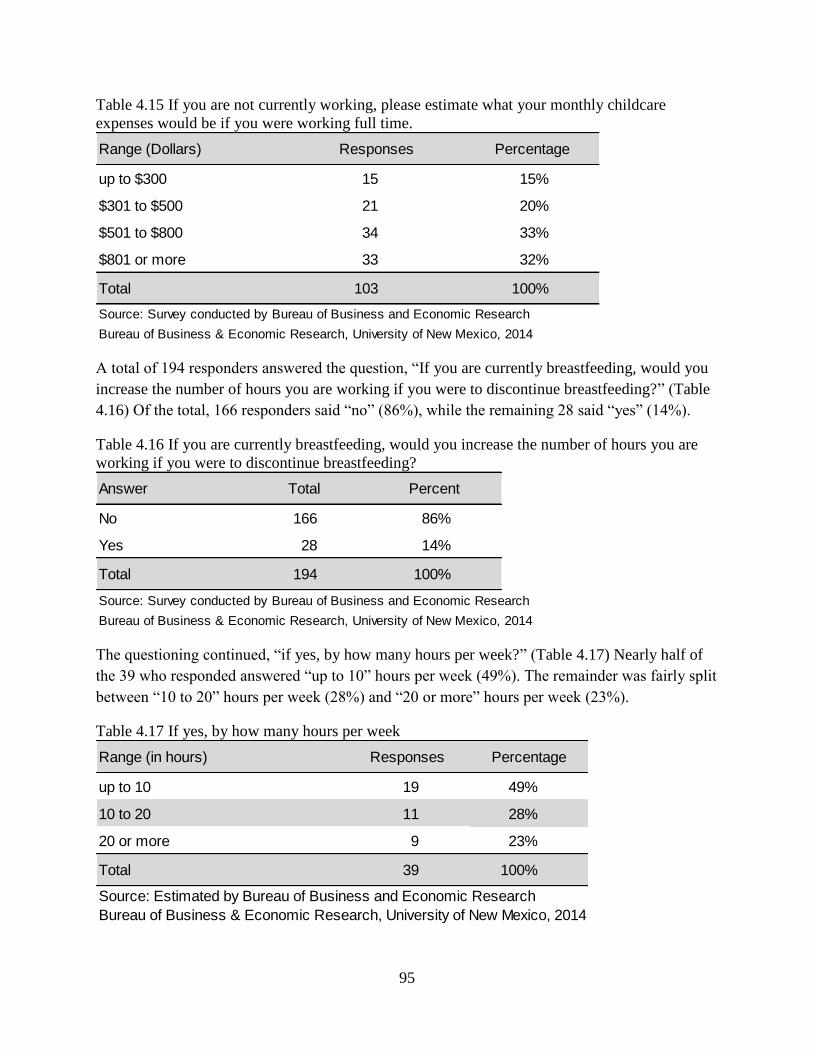
95
Table 4.15 If you are not currently working, please estimate what your monthly childcare
expenses would be if you were working full time.
A total of 194 responders answered the question, “If you are currently breastfeeding, would you
increase the number of hours you are working if you were to discontinue breastfeeding?” (Table
4.16) Of the total, 166 responders said “no” (86%), while the remaining 28 said “yes” (14%).
Table 4.16 If you are currently breastfeeding, would you increase the number of hours you are
working if you were to discontinue breastfeeding?
The questioning continued, “if yes, by how many hours per week?” (Table 4.17) Nearly half of
the 39 who responded answered “up to 10” hours per week (49%). The remainder was fairly split
between “10 to 20” hours per week (28%) and “20 or more” hours per week (23%).
Table 4.17 If yes, by how many hours per week
Range (Dollars) Responses Percentage
up to $300 15 15%
$301 to $500 21 20%
$501 to $800 34 33%
$801 or more 33 32%
Total 103 100%
Source: Survey conducted by Bureau of Business and Economic Research
Bureau of Business & Economic Research, University of New Mexico, 2014
Answer Total Percent
No 166 86%
Yes 28 14%
Total 194 100%
Source: Survey conducted by Bureau of Business and Economic Research
Bureau of Business & Economic Research, University of New Mexico, 2014
Range (in hours) Responses Percentage
up to 10 19 49%
10 to 20 11 28%
20 or more 9 23%
Total 39 100%
Source: Estimated by Bureau of Business and Economic Research
Bureau of Business & Economic Research, University of New Mexico, 2014
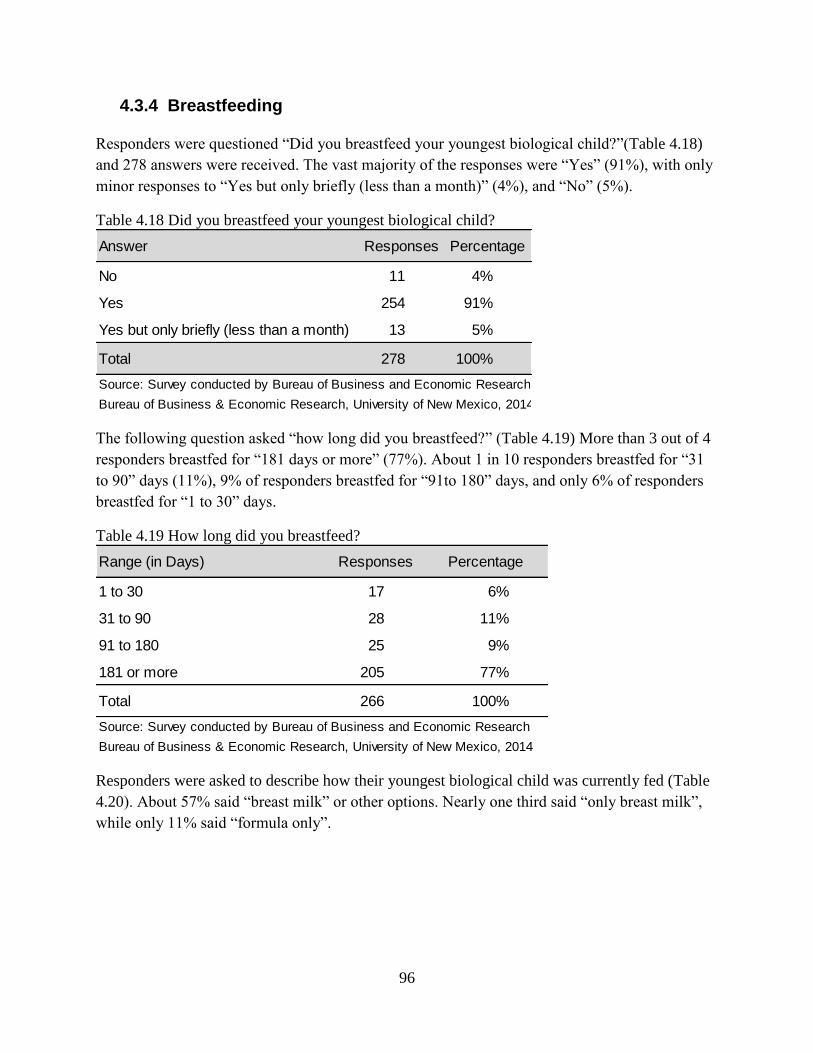
96
4.3.4 Breastfeeding
Responders were questioned “Did you breastfeed your youngest biological child?”(Table 4.18)
and 278 answers were received. The vast majority of the responses were “Yes” (91%), with only
minor responses to “Yes but only briefly (less than a month)” (4%), and “No” (5%).
Table 4.18 Did you breastfeed your youngest biological child?
The following question asked “how long did you breastfeed?” (Table 4.19) More than 3 out of 4
responders breastfed for “181 days or more” (77%). About 1 in 10 responders breastfed for “31
to 90” days (11%), 9% of responders breastfed for “91to 180” days, and only 6% of responders
breastfed for “1 to 30” days.
Table 4.19 How long did you breastfeed?
Responders were asked to describe how their youngest biological child was currently fed (Table
4.20). About 57% said “breast milk” or other options. Nearly one third said “only breast milk”,
while only 11% said “formula only”.
Answer Responses Percentage
No 11 4%
Yes 254 91%
Yes but only briefly (less than a month) 13 5%
Total 278 100%
Source: Survey conducted by Bureau of Business and Economic Research
Bureau of Business & Economic Research, University of New Mexico, 2014
Range (in Days) Responses Percentage
1 to 30 17 6%
31 to 90 28 11%
91 to 180 25 9%
181 or more 205 77%
Total 266 100%
Source: Survey conducted by Bureau of Business and Economic Research
Bureau of Business & Economic Research, University of New Mexico, 2014
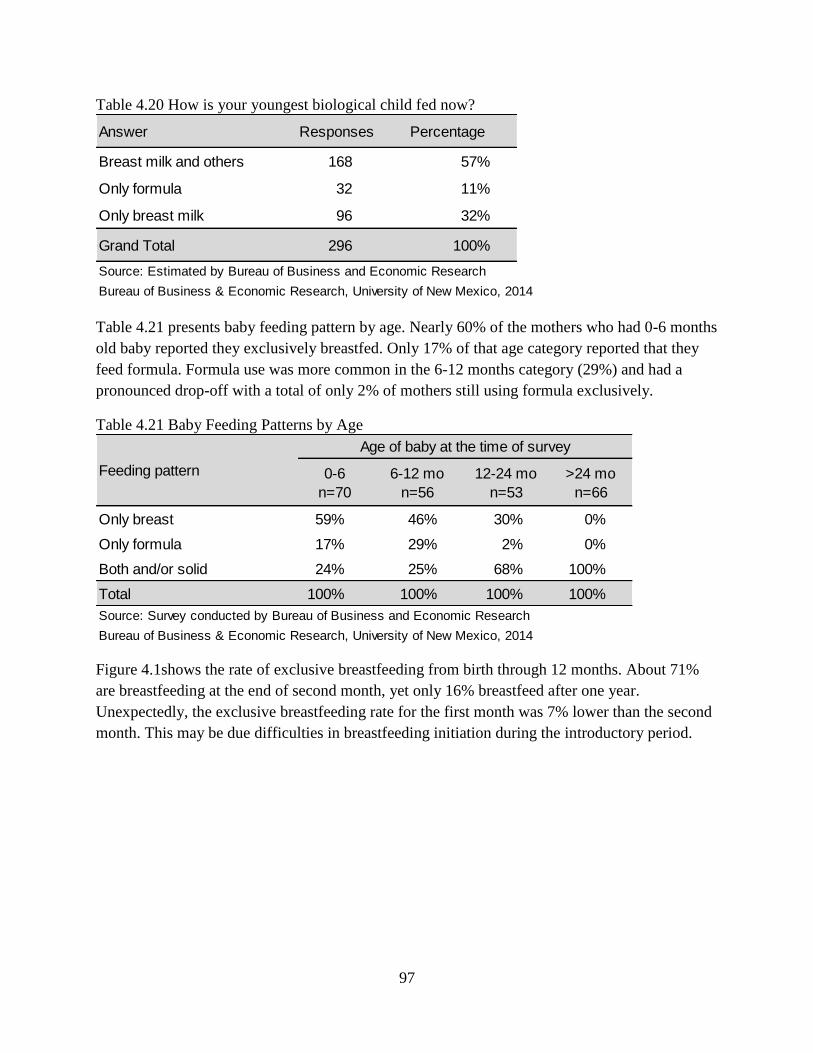
97
Table 4.20 How is your youngest biological child fed now?
Table 4.21 presents baby feeding pattern by age. Nearly 60% of the mothers who had 0-6 months
old baby reported they exclusively breastfed. Only 17% of that age category reported that they
feed formula. Formula use was more common in the 6-12 months category (29%) and had a
pronounced drop-off with a total of only 2% of mothers still using formula exclusively.
Table 4.21 Baby Feeding Patterns by Age
Figure 4.1shows the rate of exclusive breastfeeding from birth through 12 months. About 71%
are breastfeeding at the end of second month, yet only 16% breastfeed after one year.
Unexpectedly, the exclusive breastfeeding rate for the first month was 7% lower than the second
month. This may be due difficulties in breastfeeding initiation during the introductory period.
Answer Responses Percentage
Breast milk and others 168 57%
Only formula 32 11%
Only breast milk 96 32%
Grand Total 296 100%
Source: Estimated by Bureau of Business and Economic Research
Bureau of Business & Economic Research, University of New Mexico, 2014
0-6
n=70
6-12 mo
n=56
12-24 mo
n=53
>24 mo
n=66
Only breast 59% 46% 30% 0%
Only formula 17% 29% 2% 0%
Both and/or solid 24% 25% 68% 100%
Total 100% 100% 100% 100%
Source: Survey conducted by Bureau of Business and Economic Research
Bureau of Business & Economic Research, University of New Mexico, 2014
Age of baby at the time of survey
Feeding pattern
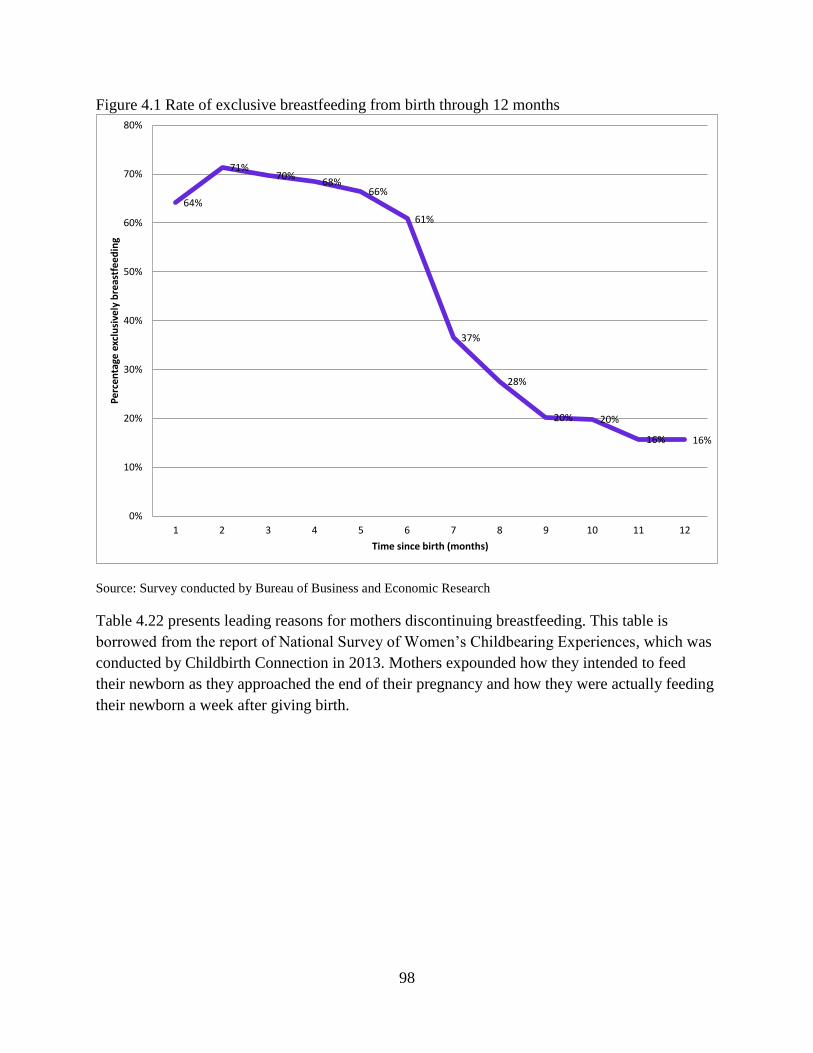
98
Figure 4.1 Rate of exclusive breastfeeding from birth through 12 months
Source: Survey conducted by Bureau of Business and Economic Research
Table 4.22 presents leading reasons for mothers discontinuing breastfeeding. This table is
borrowed from the report of National Survey of Women’s Childbearing Experiences, which was
conducted by Childbirth Connection in 2013. Mothers expounded how they intended to feed
their newborn as they approached the end of their pregnancy and how they were actually feeding
their newborn a week after giving birth.
64%
71%70%
68%66%
61%
37%
28%
20% 20%
16% 16%
0%
10%
20%
30%
40%
50%
60%
70%
80%
1 2 3 4 5 6 7 8 9 10 11 12
Per
cen
tage
exc
lusi
vely
bre
astf
eed
ing
Time since birth (months)

99
Table 4.22 Mother’s leading reasons for not establishing and for discontinuing breastfeeding
(check all that apply)
4.3.5 Maternal Wellbeing
Responders were asked to rate their satisfaction with “being a mother”, their own health, their
youngest biological child’s health, and their family’s financial stability. (Table 4.23) Options for
rating included “Very satisfied”, “satisfied”, “neither satisfied nor dissatisfied”, “dissatisfied”,
and “very dissatisfied”.
The responders were overwhelming “very satisfied” being a mother (91%). Secondarily, another
8% were “satisfied”. Almost no responders were “neither satisfied nor dissatisfied” (1 responder,
totaling overall as 0%), and there for no responses for “dissatisfied” and “very dissatisfied”
(Table 4.23). Since the responses were not distributed to other categories level of satisfaction,
BBER did not analyze those responses further.
Responders were split on their own health, while still remaining largely positive: 44% were
“very satisfied” and 40% were “satisfied” (Table 4.23). Similarly, “neither satisfied nor
dissatisfied” (8%) and “dissatisfied” (8%) were also split. A small percentage, however, were
also “very dissatisfied” (1%).
My baby had difficulty nursing 31%I had trouble getting breastfeeding
going well39%
It was too hard to get breastfeeding
going23%
Formula or solid food was more
convenient22%
Formula was more convenient 23%I fed my baby breast milk as long as I
had planned22%
I didn’t get enough support to get
breastfeeding going17%
My baby stopped nursing; it was the
baby's decision18%
I didn’t plan to breastfeed much anyway,
as I
planned to go back to my paying job
soon
13%
I was working at a paying job or school,
and other people were feeding the
baby
9%
I had to take medicine and didn’t want
my baby to get it through breast milk12%
I did not have enough help to work
through the challenges8%
I tried breastfeeding and didn’t like it 12%I had to take medicine and didn’t want
my baby to get it through breast milk8%
It was too hard with my own health
challenges12%
After the birth, I changed my mind about
wanting to breastfeed9%
Source: Listening to Mothers III, a survey conducted by Childbirth Connection: www.childbirthconnection.org
Base: intended to breastfeed at end of pregnancy
among follow-up LTM III mothers n=614
Reasons cited by 8% or more mothers for not
breastfeeding at one week
Base: breastfeeding at one week among follow-
up LTM III mothers n=551
Reasons cited by 8% or more mothers for not
breastfeeding at time of survey

100
There is a strong positive correlation between responders’ satisfaction in “being a mother” to
their satisfaction with their youngest biological child’s health (Table 4.23). The responders were
overwhelming “very satisfied” with their youngest biological child’s health (79%). Secondarily,
another 20% were “satisfied”. Almost no responders were “neither satisfied nor dissatisfied”
(1%). No responders were “dissatisfied” or “very dissatisfied”. This shows that, in general,
respondent mothers seemed very satisfied or satisfied with their life situations.
Easily the most varied answered from Table 4.23 came from the rated satisfaction of their
“family’s financial stability”. It was the only question in which the most positive option, “very
satisfied” was not the most chosen response. “Satisfied” was by far the most common response
(40%), with “very satisfied” (22%) and “dissatisfied” (20%) yielding very similar results. Only
17% were “neither satisfied nor dissatisfied”. The financial stability of the responder’s family
yielded the most “very dissatisfied” answers amongst the four questions asked in this manner (6
responders, totaling overall as 2%).
Table 4.23 How satisfied are you?
Responders were questioned “who provides support to you in your role as a mom?” and were
asked to check all that applied (Table 4.24). Since each responder was able to select any
applicable answer, the results were quite large. Results were split fairly even amongst
“Partner(s)” (36%), “[their] parents” (27%) and “Friends” (24%). The least number of responds
came with “Neighbors” (5%) as well as more specific and miscellaneous answers (7%).
Level of
Satisfaction
Being a
motherPercent
Your
HealthPercent
Child's
HealthPercent
Financial
StabilityPercent
Very satisfied 256 91% 121 44% 215 79% 59 22%
Satisfied 23 8% 109 40% 53 20% 109 40%
Neither satisfied
nor dissatisfied1 0% 23 8% 3 1% 46 17%
Dissatisfied 0 0% 21 8% 0 0% 54 20%
Very dissatisfied 0 0% 1 0% 0 0% 6 2%
Total 280 100% 275 100% 271 100% 274 100%
Source: Survey conducted by Bureau of Business and Economic Research
Bureau of Business & Economic Research, University of New Mexico, 2014
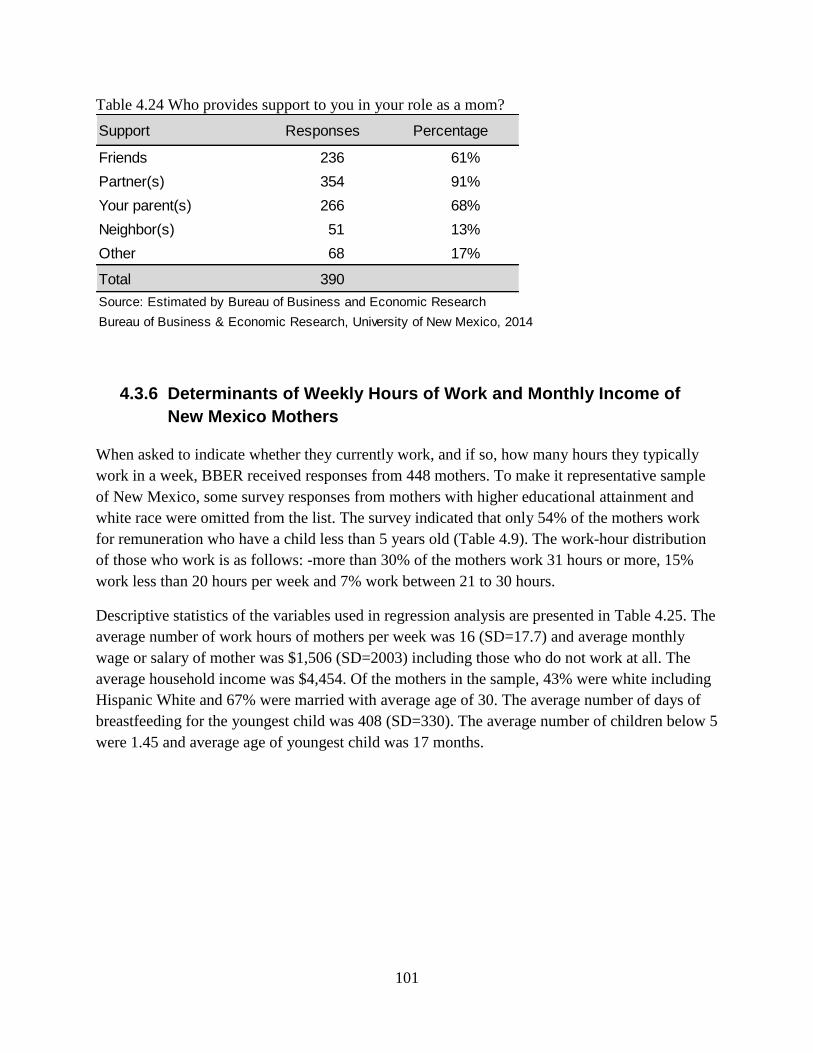
101
Table 4.24 Who provides support to you in your role as a mom?
4.3.6 Determinants of Weekly Hours of Work and Monthly Income of
New Mexico Mothers
When asked to indicate whether they currently work, and if so, how many hours they typically
work in a week, BBER received responses from 448 mothers. To make it representative sample
of New Mexico, some survey responses from mothers with higher educational attainment and
white race were omitted from the list. The survey indicated that only 54% of the mothers work
for remuneration who have a child less than 5 years old (Table 4.9). The work-hour distribution
of those who work is as follows: -more than 30% of the mothers work 31 hours or more, 15%
work less than 20 hours per week and 7% work between 21 to 30 hours.
Descriptive statistics of the variables used in regression analysis are presented in Table 4.25. The
average number of work hours of mothers per week was 16 (SD=17.7) and average monthly
wage or salary of mother was $1,506 (SD=2003) including those who do not work at all. The
average household income was $4,454. Of the mothers in the sample, 43% were white including
Hispanic White and 67% were married with average age of 30. The average number of days of
breastfeeding for the youngest child was 408 (SD=330). The average number of children below 5
were 1.45 and average age of youngest child was 17 months.
Support Responses Percentage
Friends 236 61%
Partner(s) 354 91%
Your parent(s) 266 68%
Neighbor(s) 51 13%
Other 68 17%
Total 390
Source: Estimated by Bureau of Business and Economic Research
Bureau of Business & Economic Research, University of New Mexico, 2014
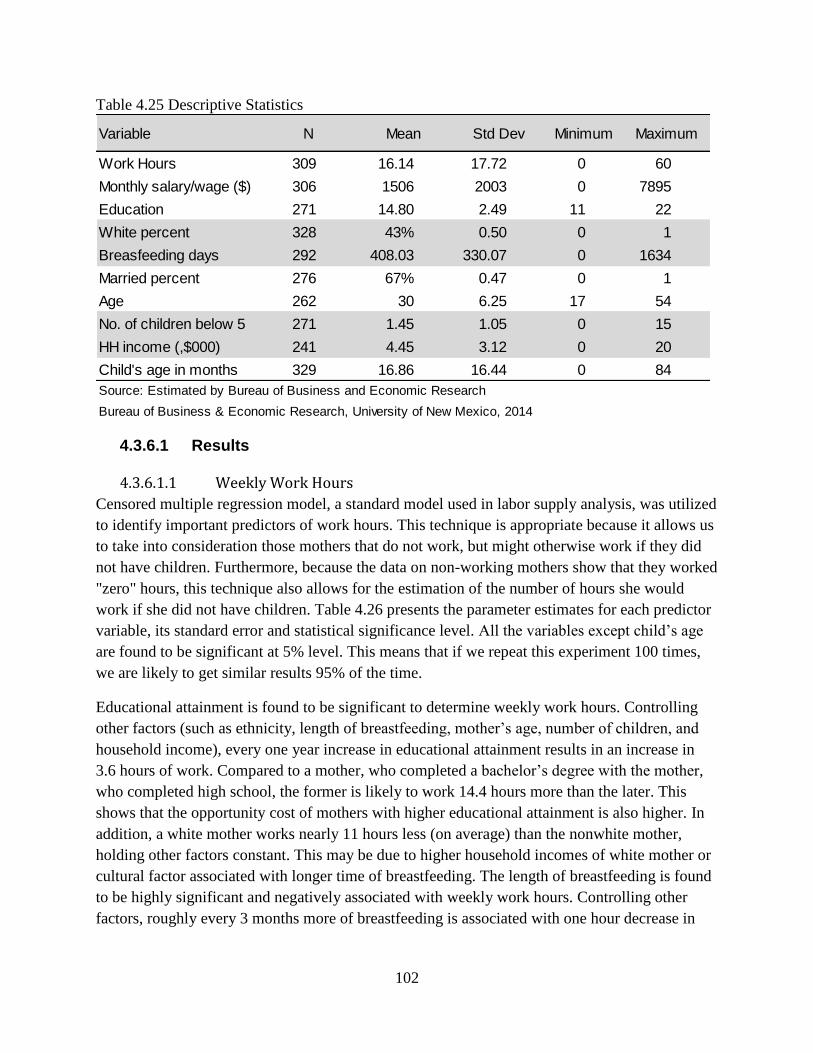
102
Table 4.25 Descriptive Statistics
4.3.6.1 Results
4.3.6.1.1 Weekly Work Hours
Censored multiple regression model, a standard model used in labor supply analysis, was utilized
to identify important predictors of work hours. This technique is appropriate because it allows us
to take into consideration those mothers that do not work, but might otherwise work if they did
not have children. Furthermore, because the data on non-working mothers show that they worked
"zero" hours, this technique also allows for the estimation of the number of hours she would
work if she did not have children. Table 4.26 presents the parameter estimates for each predictor
variable, its standard error and statistical significance level. All the variables except child’s age
are found to be significant at 5% level. This means that if we repeat this experiment 100 times,
we are likely to get similar results 95% of the time.
Educational attainment is found to be significant to determine weekly work hours. Controlling
other factors (such as ethnicity, length of breastfeeding, mother’s age, number of children, and
household income), every one year increase in educational attainment results in an increase in
3.6 hours of work. Compared to a mother, who completed a bachelor’s degree with the mother,
who completed high school, the former is likely to work 14.4 hours more than the later. This
shows that the opportunity cost of mothers with higher educational attainment is also higher. In
addition, a white mother works nearly 11 hours less (on average) than the nonwhite mother,
holding other factors constant. This may be due to higher household incomes of white mother or
cultural factor associated with longer time of breastfeeding. The length of breastfeeding is found
to be highly significant and negatively associated with weekly work hours. Controlling other
factors, roughly every 3 months more of breastfeeding is associated with one hour decrease in
Variable N Mean Std Dev Minimum Maximum
Work Hours 309 16.14 17.72 0 60
Monthly salary/wage ($) 306 1506 2003 0 7895
Education 271 14.80 2.49 11 22
White percent 328 43% 0.50 0 1
Breasfeeding days 292 408.03 330.07 0 1634
Married percent 276 67% 0.47 0 1
Age 262 30 6.25 17 54
No. of children below 5 271 1.45 1.05 0 15
HH income (,$000) 241 4.45 3.12 0 20
Child's age in months 329 16.86 16.44 0 84
Source: Estimated by Bureau of Business and Economic Research
Bureau of Business & Economic Research, University of New Mexico, 2014

103
weekly work hours. This shows that breastfeeding poses a cost to the mothers in terms of her
work hours, although the magnitude of the impact seems to be relatively small.
Controlling other factors, married mothers work nearly 12 hours less compared to single,
divorced, separated or other category. This shows that married mothers may afford to work
longer hours and married women have more resources (financial or otherwise) that can be used
to care for the children. Mother’s age is positively associated with weekly work hours. Each
additional year of age results in 0.6 hours of additional work in a week. Number of children
below 5 is negatively associated with the weekly work hours. In this case, each additional child
below 5 results in reduction of 8.2 hours of weekly work. We tested whether income is
associated with more work hours or not. Our results show that higher income family work longer
hours compared to lower income family. Every one thousand dollar additional monthly income is
associated with additional 1.2 hours of work per week. This may be due to higher income is
associated with higher educational attainment.
Table 4.26 Determinants of Weekly Work Hours of New Mexico Mothers
4.3.6.1.1 Monthly Wage or Salary Income
The same censored multiple regression model was utilized to estimate the predictors of monthly
wage and salary of mothers. All the variables except child's age and marital status of mothers are
found to be significant. Educational attainment is found to be the one of the greatest contributors
to the monthly income. Controlling other factors, every additional year of schooling causes an
increase additional monthly income of $515. Mothers' ethnicity was found to be significant
determinant of her monthly income. Controlling other factors, 'White' mothers earn $1009 less
than their non-White counterparts. This is due to less hours of work by the white mothers. As
expected, length of breastfeeding is found to be significant and negative. Each additional day of
VariableParameter
Estimate
Standard
Errort Value Approx Pr > |t|
Intercept -53.76 12.63 -4.26 <.0001
Child age in months 0.13 0.10 1.33 0.1851
Educational attainment 3.61 0.71 5.08 <.0001
White=1, else=0 -10.92 3.37 -3.24 0.0012
Length of breastfeeding in days -0.01 0.01 -2.66 0.0079
Married=1, else=0 -11.89 3.86 -3.08 0.0021
Mother's age 0.61 0.30 2.04 0.0416
No. of children -8.24 2.78 -2.96 0.003
HH Income 1.22 0.53 2.32 0.0202
Source: Estimated by Bureau of Business and Economic Research
Bureau of Business & Economic Research, University of New Mexico, 2014

104
breastfeeding results in reduction of $1.65 monthly income. In other words, one more month of
breastfeeding is associated with reduction of monthly income of $50.
The model predicted that, holding other factor constant, a married mother earns $687 less
compared to single, divorced or separated mothers. However, this variable is not statistically
significant. As expected, mother age is associated with higher earning and is statistically
significant. Age is associated with experience. Every additional year of age of mother is
associated with additional $97 monthly income. Having children under 5 is found to be
statistically significant and negative. Each additional child under 5 results in reduction of $779
monthly income. We were not sure the direction of causality of higher household income on
mother's monthly income. It is found to be positive and significant. Every additional thousand
dollars household income is associated with additional $177 monthly income. Our analysis
shows that there is motherhood cost together with breastfeeding cost. Motherhood costs are
associated with child's age, and number of young children, and marriage. Controlling other
factors, the coefficient (-$1.65) associated with length of breastfeeding is clearly a cost of
breastfeeding to a mother. Each additional day of breastfeeding results in reduction of $1.65
monthly income.
Table 4.27 Determinants of Monthly Wage and Salary of Mothers
Parameter Estimate Standard Error t Value Approx Pr > |t|
Intercept -7777 21 -366.79 <.0001
Child's age in months 9.7 10.9 0.89 0.371
Educational attainment 515 62 8.26 <.0001
White=1, else=0 -1009 378 -2.67 0.008
Length of breastfeeding -1.65 0.60 -2.73 0.006
Married=1, else=0 -687 435 -1.58 0.114
Mother's age 97 31 3.16 0.002
No. of children -779 299 -2.61 0.009
HH income 177 59 3.02 0.003
Source: Estimated by Bureau of Business and Economic Research
Bureau of Business & Economic Research, University of New Mexico, 2014

105
5. Cost-Benefit Analysis of Breastfeeding on New
Mexico WIC Program
The WIC Nutrition Program provides nutrition services and food assistance to low-to-moderate
income families with pregnant women, breastfeeding and early postpartum mothers, infants and
children up to their fifth birthday. WIC services include nutrition education, breastfeeding
support, help finding healthcare and other community services, and checks for specific nutritious
foods that are redeemable at retail food outlets throughout the state. WIC is federally funded by
USDA under the federal Child Nutrition Act of 1966. It is not an entitlement program; rather the
number of participants served depends upon the amount of the discretionary grant appropriated
annually by Congress plus subsequent reallocation of prior year unspent funds.
There were more than 8.3 million WIC participants in the US and 58,376 participants in New
Mexico in FY14. Table 5.1 presents WIC costs and participation by year. Total participation has
declined from 65.5 thousands in FY10 to 58.3 thousands in FY14. Total program cost in the
same fiscal year was $6.3 billion in US and E41 million in New Mexico. Food cost accounted for
69% and 64% of the total expenditure in US and New Mexico, respectively. Monthly food cost
per person in FY14 was $33.8 in New Mexico which is $9.85 lower than national average.
Table 5.1 WIC Costs and Participation in New Mexico by Federal Fiscal Year
Table 5.2 presents WIC participation counts, food cost, and rebates by quarter. Of the 55,787
WIC participants, women and infants each accounted for 24% and children accounted for 52% of
the total participants in FY14. Of the women participants, the largest share (40%, 5,473) was
accounted for by pregnant women, and 35% (or 4,722) was accounted for by breastfeeding
women and 25% (3,414) was accounted for by postpartum women. In terms of breastfeeding
status, 49% women were partially breastfeeding and 51% women were fully breastfeeding. The
distribution of infants in terms of their feeding status is as follows: -majority of infants 73% were
fully formula fed; only 19% were fully breastfed and remaining 8% were partially breastfed. The
total food cost for New Mexico WIC program was $22.6 million and 58% of which was covered
WIC cost and participation FY10 FY11 FY12 FY13 FY14
Total participation 65,472 64,304 63,844 61,405 58,376
Food cost ($million) $26.28 $29.82 $29.31 $26.53 $26.28
Nurtrition service/admin cost ($ Million) $15.73 $13.96 $14.43 $14.58 $14.77
Total cost ($ Million) $42.01 $43.79 $43.73 $41.11 $41.04
Percentage of food cost 63% 68% 67% 65% 64%
Average monthly benefit $33 $39 $38 $36 $38
Source: United States Department of Agriculture, http://www.fns.usda.gov/pd/wic-program
Bureau of Business & Economic Research, University of New Mexico, 2015

106
by rebates. The percentage of food cost covered by rebate in New Mexico is 16% higher than the
national percentage. The average monthly food cost per person was $34 in FY14. Of the 26,992
total live births in New Mexico, 63% of infants were enrolled in the WIC program in 2012-13.
Table 5.2 WIC Participants, Costs, and Rebates in Federal FY14 by Quarter
According to CDC, the percentage of New Mexico infants who begin breastfeeding is low at
77% which is 2.3% lower than the national rate. The percentage of NM infants who were
breastfed at 6 months of age is 3.5% lower than the national average. However, New Mexico has
a 2.4% higher than the national rate on exclusive breastfeeding at 3 months of infant age. Based
on CDC numbers, BBER estimated the percentage of infants for each breastfeeding category by
month (Table 5.4).
Table 5.3 Breastfeeding status of New Mexico and WIC infants
WIC participants and cost Qt1 Qt2 Qt3 Qt4 Annual
Number of pregnant women participating 5,859 5,106 5,383 5,544 5,473
Women fully breastfeeding 2,354 2,308 2,435 2,466 2,391
Women partially breastfeeding 2,445 2,359 2,243 2,277 2,331
Number of breastfeeding women participating 4,799 4,667 4,677 4,743 4,722
Number of postpartum women participating 3,368 3,466 3,508 3,314 3,414
Total number of women participating 14,026 13,239 13,568 13,601 13,609
Infants fully breastfed 2,536 2,542 2,641 2,633 2,588
Infants partially breastfed 1,073 1,055 1,022 1,057 1,052
Infants fully formula-fed 9,985 9,523 9,551 9,486 9,636
Number of infants participating 13,594 13,120 13,213 13,176 13,276
Number of children participating 30,386 28,275 28,259 28,690 28,903
Total number of participants 58,006 54,634 55,041 55,467 55,787
Average monthly food cost per person $35 $29 $35 $36 $34
Food costs $6,093,595 $4,674,787 $5,811,064 $6,043,282 $22,622,728
Rebates received $3,122,034 $4,094,168 $2,971,060 $2,903,462 $13,090,724
Source: United States Department of Agriculture, http://www.fns.usda.gov/pd/wic-program
Bureau of Business & Economic Research, University of New Mexico, 2015
Breastfeeding Status NM percent US percent NM WIC percent
Ever Breastfed 76.9% 79.2% 77.7%
Breastfeeding at 6 months 45.9% 49.4%
Breastfeeding at 12 months 28.3% 26.7%
Exclusive Breastfeeding at 3 months 43.1% 40.7%
Exclusive breastfeeding at 6 months 16.1% 18.8% 19.3%
Bureau of Business & Economic Research, University of New Mexico, 2015
Source: Breastfeeding Report Card, 2014, Center for Disease Control,
http://www.cdc.gov/breastfeeding/pdf/2013breastfeedingreportcard.pdf and NM WIC

107
Table 5.4 Estimation of breastfeeding, exclusive breastfeeding and exclusive formula feeding by
infant month
5.1 WIC Program Expenditures and Breastfeeding
The food packages for breastfeeding infant-mother pairs provide incentives for continued
breastfeeding. The 2014 cost of infant formula and WIC mothers' packages for New Mexico
was obtained from New Mexico WIC office. WIC food packages are customized for various
combinations of mother-infant categories ranging from exclusively breastfed infants to
exclusively formula fed infants and newly born infants to 11 month old infants. It would be
simplistic to categorize infants and mothers as exclusively breastfeeding, partially
breastfeeding, and exclusively formula feeding; however, BBER used these categories due to
their commonness in the WIC literature. The exclusively breastfeeding package includes the
most amount of food for postpartum mothers and no formula. The exclusively formula
feeding package contains much less food for the postpartum mother and mostly formula. The
partially breastfeeding package includes less food than the breastfeeding package and less
formula than the exclusively formula feeding package. The partially breastfeeding and
formula feeding packages provide less food for the postpartum mother, which explains some
of the cost differences seen in Table 5.1.
Table 5.1 presents the monthly cost of WIC food packages for infants and mothers for 2014.
This shows that the most expensive package combinations are for exclusive formula during
infant months 0-5.9. Overall, the exclusive breastfeeding package cost $140 less during
infant months 0-3.9 and $141 less during infant month 4-5.9 period and $35 less during
infant months 6-11.9. The exclusively breastfeeding category describes a WIC food package
which does not include formula. Costs rise after 6 months of age due to the addition of solid
Month BreastfeedingExclusive
Breastfeeding
Exclusive
Formula
0 79% 79% 21%
1 74% 67% 26%
2 68% 55% 32%
3 63% 43% 37%
4 57% 34% 43%
5 51% 25% 49%
6 46% 16% 54%
7 43% 13% 57%
8 40% 11% 60%
9 37% 8% 63%
10 34% 5% 66%
11 31% 3% 69%
12 28% 0% 72%
Source: Estimated based on CDC's 2014 rates
Bureau of Business & Economic Research, University of New Mexico, 2015

108
foods for the infant added to the continued food package for the nursing mother. Please note
that the costs associated with infants under 6 months of age in the exclusively breastfeeding
categories ($1.22 for infants 0-3.9 months and $0.23 for infants 4-5.9 months) are due to an
expenditure on breast pumps that are available to breastfeeding mothers at no cost.
According to USDA’s Food and Nutrition Service Department, a total of 13,276 infants and
8,136 mothers participated in WIC during federal fiscal year 2014 (Table 5.1). Table 5.6
presents the number of participants by infant’s age category.
Table 5.5 Monthly cost of WIC food packages for infants and mothers, 2014
Table 5.6 Estimation of infants and mothers by infant month category
Infant's Age
0-3.9 months 4-5.9 months 6-11.9 months
Exclusive Formula $166.44 $166.44 $137.85
Partial breastfeeding $113.20 $117.26 $114.20
Exclusive breastfeeding $1.22 $0.23 $47.86
Exclusive Formula $29.62 $29.62 $0.00
Partial breastfeeding $35.98 $35.98 $35.98
Exclusive breastfeeding $54.52 $54.52 $54.52
Exclusive Formula $196.06 $196.06 $137.85
Partial breastfeeding $149.18 $153.24 $150.18
Exclusive breastfeeding $55.74 $54.75 $102.38Source: New Mexico WIC
Bureau of Business & Economic Research, University of New Mexico, 2015
Mother + Infant Package
Infant Participants
Mother Participants
0-3.9 months 4-5.9 months 6-11.9 months Total
Infant participants
Exclusive formula 2,659 2,799 4,178 9,636
Partial/occasional breastfed 459 400 193 1,052
Exclusive breastfed 994 939 655 2,588
Total 4,112 4,138 5,026 13,276
Mother participants
Exclusive formula 942 992 1,480 3,414
Partial/occasional breastfed 1,016 886 429 2,331
Exclusive breastfed 918 868 605 2,391
Total 2,877 2,745 2,514 8,136
Source: Estimated based on 2014 cumulative WIC participants data obtained from NM WIC
Bureau of Business & Economic Research, University of New Mexico, 2015
StatusInfant's Age

109
When the information on per participant cost provided in Table 5.5 is combined with monthly
participation figure from Table 5.6, total annual WIC food costs follow as in Table 5.7. The
largest source of expenditures is for infants aged 6-11.9 months who are exclusively formula fed
at $2.9 million which is, partly, due to a larger number of infants in that category. If mother and
infants are combined, the largest source is again exclusive formula feeding in all age categories.
The lowest expenditure is estimated for the partial breastfeeding group. BBER also conducted
sensitivity analysis of cost for various scenarios. Table 5.8 presents a comparison of current
expenditures (after rebate) with extreme cases, such as assuming all infants are exclusively
formula fed, exclusively breastfed or half and half–exclusively breastfed and exclusively
formula fed. The results show that compared to current food expenditures, exclusive
breastfeeding of all WIC infants will save $3.26 million a year. In other words, the greatest
savings ($3.26 million) would be generated from exclusive breastfeeding. Our analysis clearly
shows that there is significant savings in WIC food expenditures if more women breastfeed their
infants.
Table 5.7 Annual WIC program food cost after rebate in FY14 for mother and infants
0-3.9 months 4-5.9 months 6-11.9 months Total
Infant participants
Exclusive formula $2,237,839 $2,355,644 $2,912,022 $7,505,505
Partial breastfeeding $262,483 $236,918 $111,675 $611,075
Exclusive breastfeeding $6,146 $1,097 $158,404 $165,647
Mother participants
Exclusive formula $334,788 $352,438 $0 $687,226
Partial breastfeeding $438,775 $382,556 $185,007 $1,006,338
Exclusive breastfeeding $600,728 $567,632 $395,680 $1,564,039
Mother and Infants Total
Exclusive formula $2,572,628 $2,708,082 $2,912,022 $8,192,731
Partial breastfeeding $701,258 $619,474 $296,682 $1,617,413
Exclusive breastfeeding $606,874 $568,729 $554,084 $1,729,687
Grand Total $3,880,759 $3,896,284 $3,762,788 $11,539,831
Source: Estimated based on WIC New Mexico data
Bureau of Business & Economic Research, University of New Mexico, 2015
Infant Age
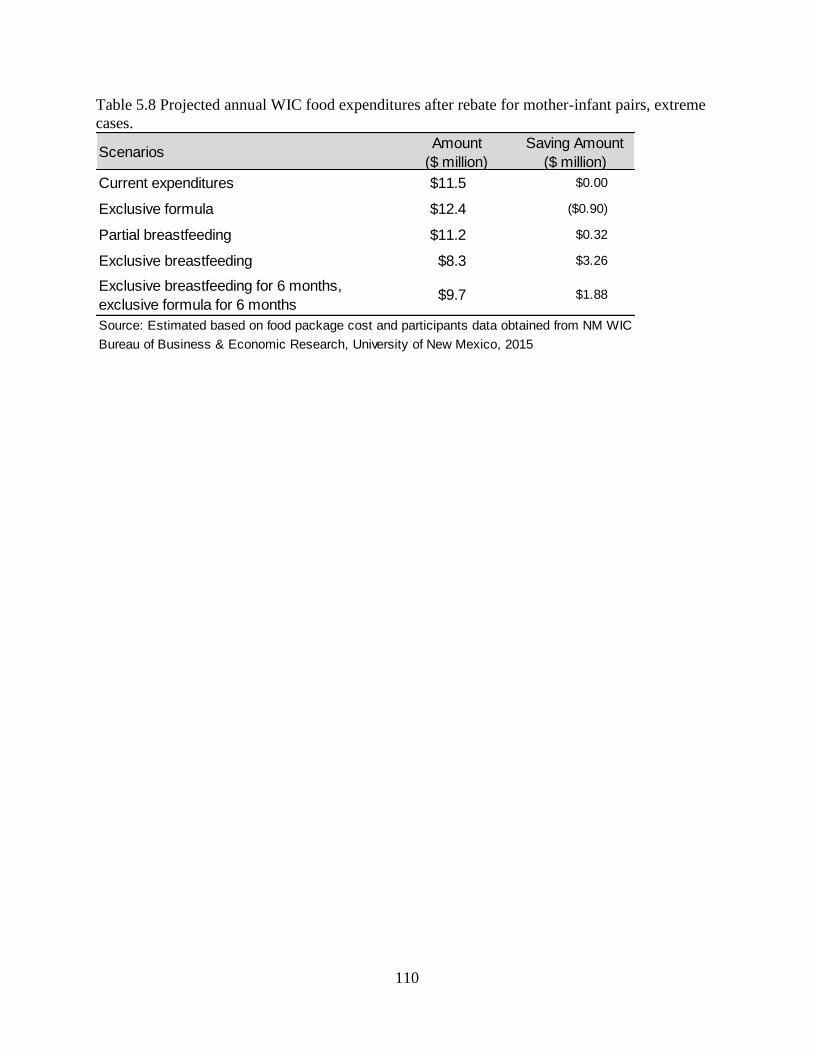
110
Table 5.8 Projected annual WIC food expenditures after rebate for mother-infant pairs, extreme
cases.
ScenariosAmount
($ million)
Saving Amount
($ million)
Current expenditures $11.5 $0.00
Exclusive formula $12.4 ($0.90)
Partial breastfeeding $11.2 $0.32
Exclusive breastfeeding $8.3 $3.26
Exclusive breastfeeding for 6 months,
exclusive formula for 6 months$9.7 $1.88
Source: Estimated based on food package cost and participants data obtained from NM WIC
Bureau of Business & Economic Research, University of New Mexico, 2015

111
6. Cost Benefit Analysis of Breastfeeding on New
Mexico Medicaid Program
Medicaid is a public program that provides free healthcare coverage for low-income children and
adults. This is the largest source of funding for medical and health-related services for people
with low income in the United States. Medicaid in New Mexico is jointly funded by the state and
federal government and managed by the state. According to the Center for Medicaid and CHIP
Services, a total of 635,321 people in New Mexico have enrolled in Medicaid by then end of
April 2014. Only 38% of New Mexicans have employer-sponsored health insurance, compared
to a national average of 48%37
; therefore, importance of Medicare in New Mexico is immense.
New Mexico ranks one the highest uninsured state where 21% of the population does not have
health insurance. A total of 71,200 children (13%) below 19 did not have health insurance in
FY12. In the case of low income children, only 10% were covered by employer sponsored
insurance and 68% were covered by Medicaid (Table 6.1). Relatively large proportion (18%) of
low income children did not have health insurance in FY12.
Table 6.1 No. of children and low income children by health insurance provider FY12
Table 6.2 presents NM Medicaid and CHIP income eligibility criteria. In these criteria, children
under 19, pregnant women, parents and other adults are eligible if they have income below
modified adjusted gross income (MAGI). According to Kaiser foundation, New Mexico spent
more than $3.3 billion in Medicaid expenditure in FY10. In the same period, the United States
spent more $363 billion in Medicaid. The distribution of Medicaid expenditure in New Mexico is
as follows: Aged 50%, disabled 31%, adult 19% and children 48%. In New Mexico, 70% of the
Medicaid expenditure is born by federal government and rest 30% is by the state (Table 6.4);
whereas in the national level, only 57% of the Medicaid expenditure is born by the federal
government.
37
Kaiser Foundation, http://www.nmvoices.org/fpp_attachments/medicaid-economy-
update-9-10.pdf
Provider No. of children PercentNo. of low
income childrenPercent
Employer 188,900 35% 30,600 10%
Medicaid 252,400 47% 209,100 68%
Other private and public 25,800 5% 13,400 4%
Unisured 71,200 13% 54,900 18%
Total 538,300 100% 308,000 100%
Source: Kaiser Foundation, http://kff.org/other/state-indicator/children-0-18/
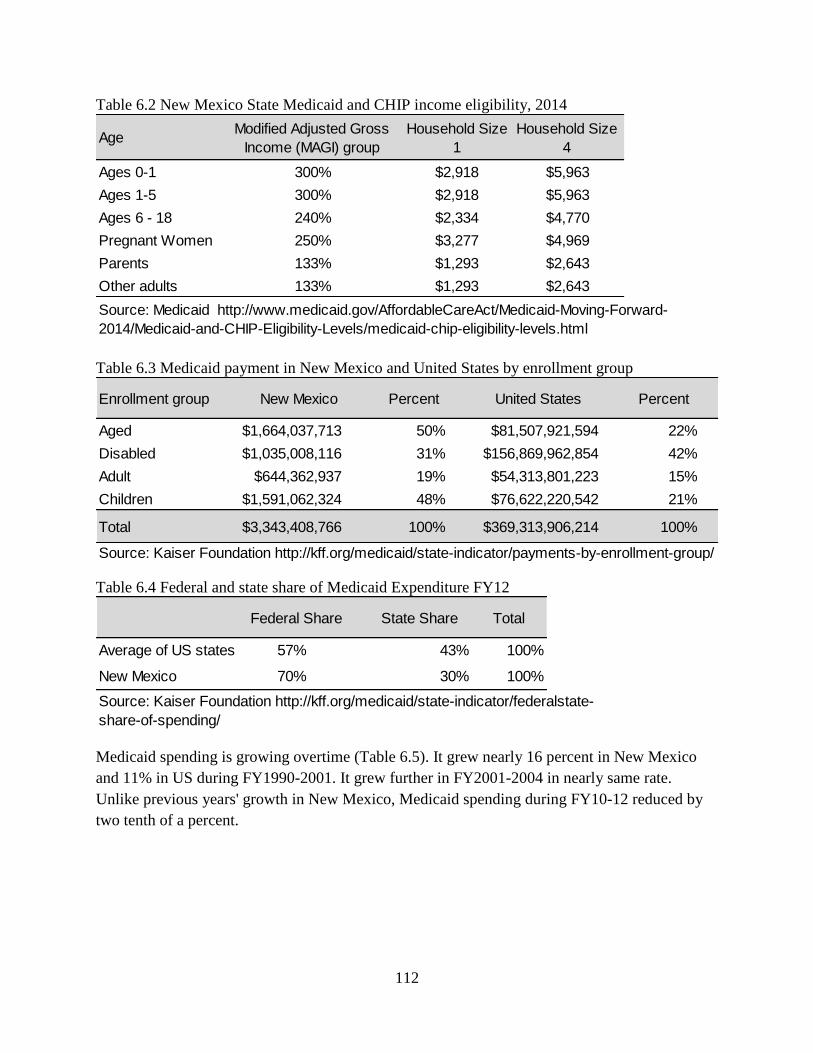
112
Table 6.2 New Mexico State Medicaid and CHIP income eligibility, 2014
Table 6.3 Medicaid payment in New Mexico and United States by enrollment group
Table 6.4 Federal and state share of Medicaid Expenditure FY12
Medicaid spending is growing overtime (Table 6.5). It grew nearly 16 percent in New Mexico
and 11% in US during FY1990-2001. It grew further in FY2001-2004 in nearly same rate.
Unlike previous years' growth in New Mexico, Medicaid spending during FY10-12 reduced by
two tenth of a percent.
AgeModified Adjusted Gross
Income (MAGI) group
Household Size
1
Household Size
4
Ages 0-1 300% $2,918 $5,963
Ages 1-5 300% $2,918 $5,963
Ages 6 - 18 240% $2,334 $4,770
Pregnant Women 250% $3,277 $4,969
Parents 133% $1,293 $2,643
Other adults 133% $1,293 $2,643
Source: Medicaid http://www.medicaid.gov/AffordableCareAct/Medicaid-Moving-Forward-
2014/Medicaid-and-CHIP-Eligibility-Levels/medicaid-chip-eligibility-levels.html
Enrollment group New Mexico Percent United States Percent
Aged $1,664,037,713 50% $81,507,921,594 22%
Disabled $1,035,008,116 31% $156,869,962,854 42%
Adult $644,362,937 19% $54,313,801,223 15%
Children $1,591,062,324 48% $76,622,220,542 21%
Total $3,343,408,766 100% $369,313,906,214 100%
Source: Kaiser Foundation http://kff.org/medicaid/state-indicator/payments-by-enrollment-group/
Federal Share State Share Total
Average of US states 57% 43% 100%
New Mexico 70% 30% 100%
Source: Kaiser Foundation http://kff.org/medicaid/state-indicator/federalstate-
share-of-spending/
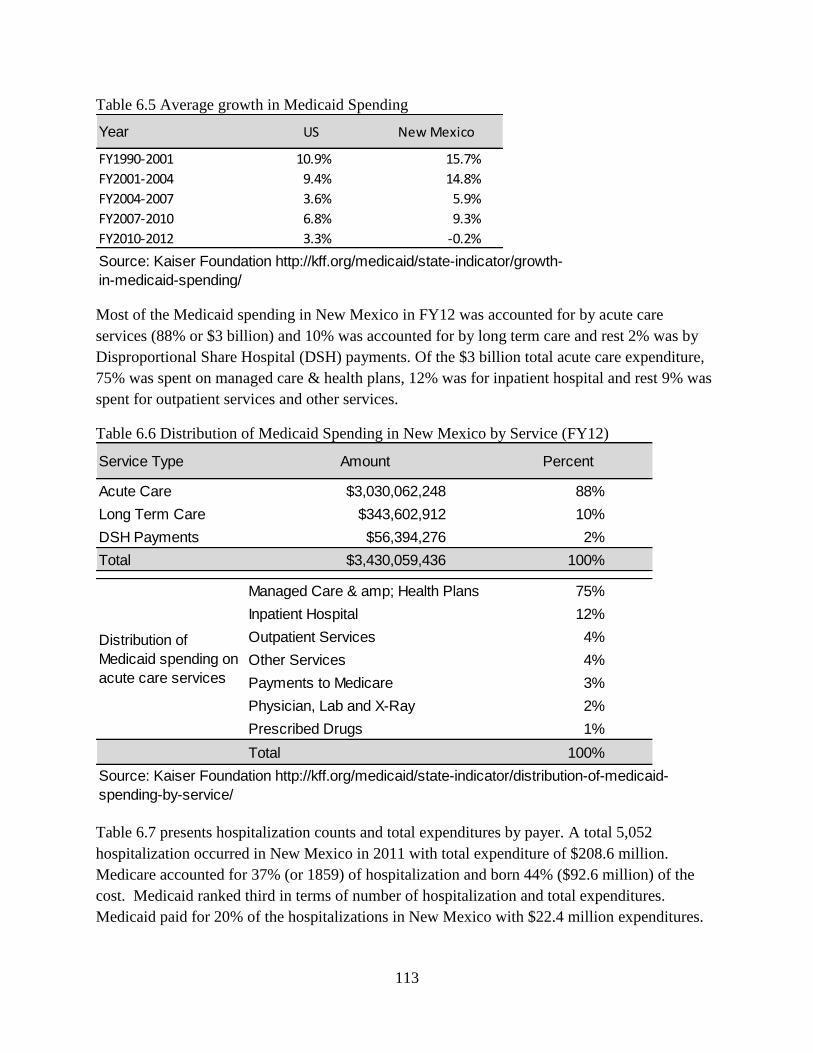
113
Table 6.5 Average growth in Medicaid Spending
Most of the Medicaid spending in New Mexico in FY12 was accounted for by acute care
services (88% or $3 billion) and 10% was accounted for by long term care and rest 2% was by
Disproportional Share Hospital (DSH) payments. Of the $3 billion total acute care expenditure,
75% was spent on managed care & health plans, 12% was for inpatient hospital and rest 9% was
spent for outpatient services and other services.
Table 6.6 Distribution of Medicaid Spending in New Mexico by Service (FY12)
Table 6.7 presents hospitalization counts and total expenditures by payer. A total 5,052
hospitalization occurred in New Mexico in 2011 with total expenditure of $208.6 million.
Medicare accounted for 37% (or 1859) of hospitalization and born 44% ($92.6 million) of the
cost. Medicaid ranked third in terms of number of hospitalization and total expenditures.
Medicaid paid for 20% of the hospitalizations in New Mexico with $22.4 million expenditures.
Year US New Mexico
FY1990-2001 10.9% 15.7%
FY2001-2004 9.4% 14.8%
FY2004-2007 3.6% 5.9%
FY2007-2010 6.8% 9.3%
FY2010-2012 3.3% -0.2%
Source: Kaiser Foundation http://kff.org/medicaid/state-indicator/growth-
in-medicaid-spending/
Service Type Amount Percent
Acute Care $3,030,062,248 88%
Long Term Care $343,602,912 10%
DSH Payments $56,394,276 2%
Total $3,430,059,436 100%
Managed Care & amp; Health Plans 75%
Inpatient Hospital 12%
Outpatient Services 4%
Other Services 4%
Payments to Medicare 3%
Physician, Lab and X-Ray 2%
Prescribed Drugs 1%
Total 100%
Source: Kaiser Foundation http://kff.org/medicaid/state-indicator/distribution-of-medicaid-
spending-by-service/
Distribution of
Medicaid spending on
acute care services
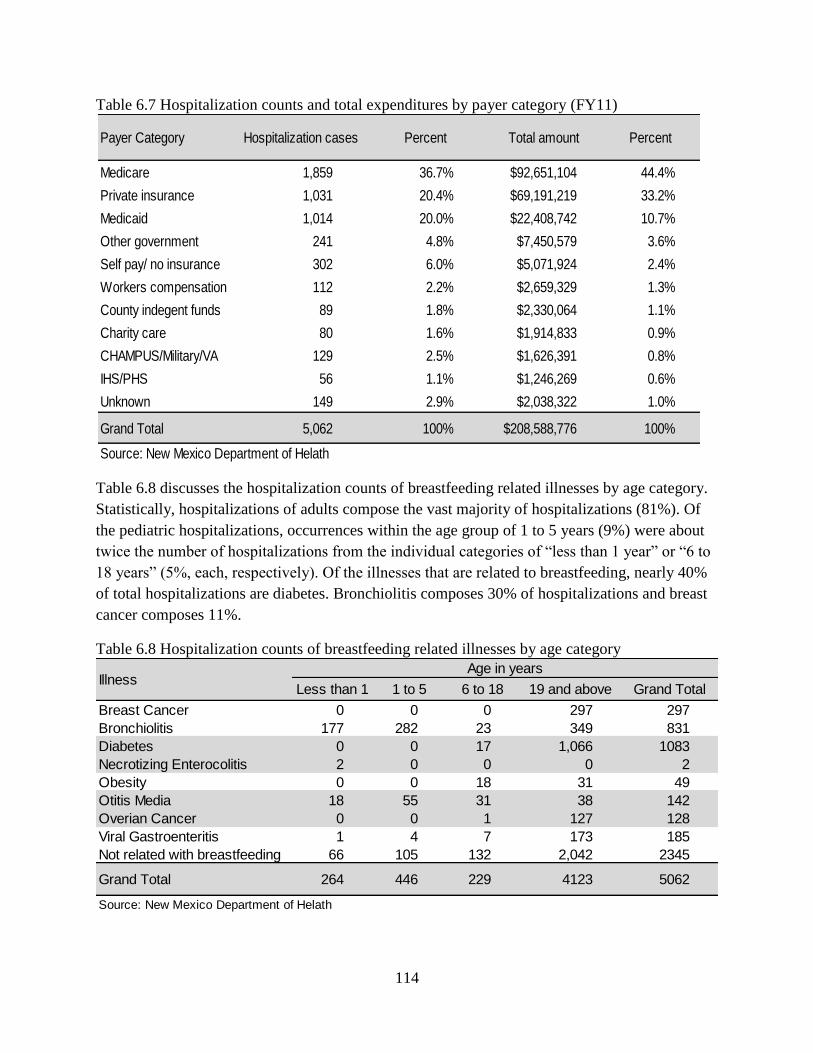
114
Table 6.7 Hospitalization counts and total expenditures by payer category (FY11)
Table 6.8 discusses the hospitalization counts of breastfeeding related illnesses by age category.
Statistically, hospitalizations of adults compose the vast majority of hospitalizations (81%). Of
the pediatric hospitalizations, occurrences within the age group of 1 to 5 years (9%) were about
twice the number of hospitalizations from the individual categories of “less than 1 year” or “6 to
18 years” (5%, each, respectively). Of the illnesses that are related to breastfeeding, nearly 40%
of total hospitalizations are diabetes. Bronchiolitis composes 30% of hospitalizations and breast
cancer composes 11%.
Table 6.8 Hospitalization counts of breastfeeding related illnesses by age category
Payer Category Hospitalization cases Percent Total amount Percent
Medicare 1,859 36.7% $92,651,104 44.4%
Private insurance 1,031 20.4% $69,191,219 33.2%
Medicaid 1,014 20.0% $22,408,742 10.7%
Other government 241 4.8% $7,450,579 3.6%
Self pay/ no insurance 302 6.0% $5,071,924 2.4%
Workers compensation 112 2.2% $2,659,329 1.3%
County indegent funds 89 1.8% $2,330,064 1.1%
Charity care 80 1.6% $1,914,833 0.9%
CHAMPUS/Military/VA 129 2.5% $1,626,391 0.8%
IHS/PHS 56 1.1% $1,246,269 0.6%
Unknown 149 2.9% $2,038,322 1.0%
Grand Total 5,062 100% $208,588,776 100%
Source: New Mexico Department of Helath
Less than 1 1 to 5 6 to 18 19 and above Grand Total
Breast Cancer 0 0 0 297 297
Bronchiolitis 177 282 23 349 831
Diabetes 0 0 17 1,066 1083
Necrotizing Enterocolitis 2 0 0 0 2
Obesity 0 0 18 31 49
Otitis Media 18 55 31 38 142
Overian Cancer 0 0 1 127 128
Viral Gastroenteritis 1 4 7 173 185
Not related with breastfeeding 66 105 132 2,042 2345
Grand Total 264 446 229 4123 5062
Source: New Mexico Department of Helath
IllnessAge in years

115
Table 6.9 addresses hospitalization expenditures for breastfeeding related illnesses by age
category. Again, “19 Years and above” is the category that dominates the overall percentage
(92%). Of the pediatric categories, “Less than 1 Year” displays the highest expenditures, with
$9,033,797 (4%). “1 to 5 Years” follows with an expenditure of $6,232,600 (3%). The lowest
expenditure occurred within the “6 to 18 years” category, with $1,907,709 (1%). There is
$86,774,386 in expenditures that are not related to breastfeeding. Amongst expenditures that are,
indeed, related to breastfeeding, 72% are for diabetes, dominating other categories. The next
highest level comes with bronchiolitis at 15% of total breastfeeding related expenditures.
Table 6.9 Hospitalization expenditures for breastfeeding-related illnesses
Table 6.10 addresses Medicaid expenditures due to hospitalizations in specific age categories.
Almost half of all Medicaid expenditures occur within the “19 Years and above” age category
(47%). Nearly a third of all Medicaid expenditures occur within the “Less than 1 Year” age
category (30%). A total of 19% of Medicaid expenditures are within the “1 to 5 Years” age
category. Only 4% of Medicaid expenditures occur for those between the ages of “6 to 18
Years”. A full 47% of overall Medicaid expenditures occurred for bronchiolitis. The only other
category is diabetes, accounting for 13% of total Medicaid expenditures.
Less than 1 1 to 5 6 to 18 19 and above Grand Total
Breast Cancer $0 $0 $0 $6,502,999 $6,502,999
Bronchiolitis $8,362,691 $5,275,634 $350,111 $4,412,181 $18,400,617
Diabetes $0 $0 $93,877 $87,273,957 $87,367,834
Necrotizing Enterocolitis $108,769 $0 $0 $0 $108,769
Obesity $0 $0 $5,392 $365,487 $370,879
Otitis Media $74,001 $126,287 $25,176 $339,146 $564,610
Overian Cancer $0 $0 $23,885 $5,190,082 $5,213,967
Viral Gastroenteritis $1,179 $16,273 $30,557 $3,211,357 $3,259,366
Not related with breastfeeding $487,157 $814,406 $1,378,711 $84,119,461 $86,799,735
Grand Total $9,033,797 $6,232,600 $1,907,709 $191,414,670 $208,588,776
Source: New Mexico Department of Helath
Age in yearsIllness

116
Table 6.10 Medicaid expenditures due to hospitalization
According to the American Academy of Pediatrics38
, the total Medicaid expenditure for
children’s services (ages 0-20) was $1,091million in FY09 and per child expenditure was $2,990.
As Table 6.9 shows, about 84% of Medicaid expenditures for hospitalizations occurred for
breastfeeding-related illnesses. If we assume that 84% ($916 million) of the Medicaid
expenditures for children was related to breastfeeding-related illnesses, then there could be a
significant reduction in Medicaid expenditure as a result of increasing the breastfeeding rate. If
only 5% of Medicaid cost can be reduced with the increasing breastfeeding rate, then New
Mexico can save nearly $46 million a year. However, due to lack of illness specific data, BBER
could not make any conclusion regarding the cost savings for the New Mexico Medicaid
program.
38
Medicaid state report: http://www.aap.org/en-us/professional-resources/Research/research-
resources/Pages/Medicaid-State-Reports.aspx
Less than 1 1 to 5 6 to 18 19 and above Grand Total
Breast Cancer $0 $0 $0 $1,264,210 $1,264,210
Bronchiolitis $6,263,233 $3,802,159 $125,722 $357,612 $10,548,726
Diabetes $0 $0 $69,346 $2,885,228 $2,954,574
Necrotizing Enterocolitis $108,769 $0 $0 $0 $108,769
Obesity $0 $0 $3,617 $173,833 $177,450
Otitis Media $46,416 $85,111 $18,362 $34,154 $184,043
Overian Cancer $0 $0 $23,885 $271,088 $294,973
Viral Gastroenteritis $0 $10,098 $5,067 $485,045 $500,210
Medicaid Total $6,418,418 $4,279,235 $917,229 $10,475,197 $22,408,742
Source: New Mexico Department of Health
IllnessAge in years