Embed Size (px)
Citation preview

C7047
Cost-benefit analysis of the
ICCAT GBYP tagging programme
ICCAT- GBYP 08/2015, Item B
David Righton, Jose De Oliveira, Julian Metcalfe, Andrew Payne, Ainsley Riley, Joe Scutt-
Phillips, Serena Wright


C7047
Cost-benefit analysis for the ICCAT GBYP tagging programme Page 1 of 63
Table of Contents
D4 Executive summary, including recommendations ...................................................................... 3
Introduction ........................................................................................................................................... 7
D1 Review of the ICCAT GBYP tagging activities ............................................................................. 9
Background ......................................................................................................................................... 9
Design of the GBYP tagging programme ........................................................................................... 10
Operational meetings, training and awareness campaign ............................................................... 13
Field equipment ................................................................................................................................ 17
Field activities ................................................................................................................................... 19
Analyses ............................................................................................................................................ 22
Use of tagging data in assessment and operating models ............................................................... 27
D2: Improvement of knowledge of bluefin tuna: distribution, growth and behaviour ................. 31
Improvement of knowledge of distribution and migration .............................................................. 31
Improvement of knowledge of bluefin tuna growth ........................................................................ 38
Improvement of knowledge of bluefin tuna habitat utilisation ....................................................... 40
D3 Propose future strategies and improvements ............................................................................ 45
References ........................................................................................................................................... 51

C7047
Cost-benefit analysis for the ICCAT GBYP tagging programme Page 2 of 63

C7047
Cost-benefit analysis for the ICCAT GBYP tagging programme Page 3 of 63
D4 Executive summary, including recommendations
In 2009, the objectives of the Grande Bluefin Tuna Year Programme (GBYP) programme were defined by the ICCAT Standing Committee on Research and Statistics (SCRS) as:
1. Improve basic data collection through data mining (including information from traps, observers, and vessel monitoring systems (VMS), developing methods to estimate sizes of fish caged, elaborating accurate CPUE indices for Mediterranean purse seine fleets, development of fisheries-independent information surveys and implementing a large scale scientific conventional tagging programme;
2. Improve understanding of key biological and ecological processes through electronic tagging experiments to determine habitat and migration routes, broad scale biological sampling of live fish and dead fish landed (e.g. gonads, liver, otoliths, spines, etc.), histological analyses to determine bluefin tuna reproductive state, biological and genetics analyses to investigate mixing and population structure; and ecological processes, including predator-prey relationships;
3. Improve assessment models and provision of scientific advice on stock status through improved modelling of key biological processes (including growth and stock-recruitment), further developing stock assessment models including mixing among areas, and developing and use of biologically realistic operating models for more rigorous management option testing.
The GBYP was initiated in March 2010 as a six year programme with the purpose of improving basic data collection, improving understanding of key biological and ecological processes and improving assessment models and provision of scientific advice. Within that scope, a large-scale tagging programme was designed and has the following scientific objectives (Di Natale & Idrissi, 2015):
1. Validation of current stock units, and improve knowledge on potential sub-stock units and mixing
2. Estimate fishing mortality (M) and or natural mortality (Z) by age/age-groups 3. Estimate natural growth rates 4. Estimate tag recovery rates by fishery, making use of the observer programmes in
the Mediterranean 5. Evaluate habitat-utilisation, movement patterns, maturity-dependent distribution
and spawning-ground use of Atlantic bluefin tuna (ABFT) from electronic tag data
The GBYP is known globally as a significant scientific endeavour. The value of the programme in raising public awareness is very high. ICCAT should be lauded for embarking on the programme in the first instance. Key achievements within the GBYP tagging programme between 2010 and 2015 are:
A comprehensive tagging programme that has succeeded in deploying nearly 25,000 tags on more than 16,000 ABFT across a broad area of the Mediterranean and eastern Atlantic, despite significant logistic constraints, and at lower than expected cost;
Development of an ABFT tuna tagging manual and incremental improvement of tagging techniques (both conventional tags and electronic tags) that provide confidence in the GBYP tag deployments;

C7047
Cost-benefit analysis for the ICCAT GBYP tagging programme Page 4 of 63
Coordination of a tag awareness and return programme that has resulted in nearly 400 tags being returned over five years, representing a near doubling of the data available on eastern Atlantic and Mediterranean tuna from the previous 30 years. These returns help to validate the current paradigm of eastern and western stock components;
Recovery of ~180 datasets from electronic tags that provide evidence of the complexity and diversity of bluefin movements and behaviour within the Mediterranean and eastern Atlantic.
Development of modelling and assessment frameworks in readiness for use of the tagging data. The uptake of tagging data into the assessments will help to identify the strengths and weaknesses of the tagging data, and to further refine the tagging programme in the future.
These achievements have been made possible through the work of a consistent GBYP coordination team. Based on our assessment of the achievements and benefits of the tagging programme so far, we can make a number of recommendations based on the long-term achievement of the high-level objectives.
R1: Undertake a comprehensive and systematic analysis of all tagging data returned to date
There is now a comprehensive database of ABFT movements available for the eastern component of the stock, but there has been no systematic analysis, and relatively little has been published in the formal peer-review literature. This situation presents a risk to the effectiveness and transparency of ICCAT assessment science for ABFT. Although the data are being worked with in SCRS activities, we recommened that a systematic analysis of ICCAT’s ABFT tagging data collected during the GBYP tagging programme should now be conducted, ideally in collaboration with the US NOAA ABFT tagging programme. This would help to stimulate the development of ICCATs assessment and management science.
R2: Long-term planning for the next stage of the GBYP
The GBYP should be credited for helping collect data that is assisting the recovery of ABFT stocks in the eastern Atlantic and Mediterranean. The key now is to build on what the GBYP has achieved. The GBYP programme is due for consideration for renewal into a second stage (2017-2022). Our assessment of the GBYP tagging programme is that a significant operational success has been achieved, but the scientific benefits from the programme are yet to be achieved in full. Without improving the use of the very valuable data collected in the GBYP, its value as an exemplary scientific programme in support of fisheries management is diminished. The coordination of the GBYP should be strengthened to ensure that the scientific aims of the GBYP are providing the back up to the management and assessment of ABFT that the programme was designed to achieve. Sufficient resource should be made available to ensure that the data archives that have been developed in GBYP can now be used more extensively to provide information relevant to fisheries management and advice.
C7047
Cost-benefit analysis for the ICCAT GBYP tagging programme Page 5 of 63
R3: Modify the GBYP tagging and sampling design and move, largely, to fishery independent data retrieval
The conventional tagging programme in GBYP cost almost €3 million. To date, there are nearly 400 returns of tags (a 1.7% return rate over 5 years), and probably a similar number more can be expected in the coming years. In contrast, 234 electronic tags were deployed, and nearly 180 datasets (80%) have been recovered through satellite transmitted data. The cost of deploying electronic tags is higher, per unit, but data retrieval is 80% to 90% certain. If the primary management interest is in migrations and movements then electronic tags provide better and more reliable data. In the future, we suggest that all GBYP tagging activities within GBYP are focussed on electronic tagging. The outcome of R1 (comprehensive analysis of all GBYP tagging data) will identify the areas and techniques that are most likely to succeed in reducing uncertainty in assessment operating models, or in the stock assessments. Other techniques, such as close-kin genetic studies and otolith micro-chemistry, should be used in parallel with migration and behavioural studies to provide a comprehensive assessment of ABFT spatial biology.
R4: Improve awareness of tagging programme though coordinated campaign of peer-review, popular articles, and social media
One of the five pillars of the SCRS strategy is ‘Dialogue and communication’. The goals of this pillar provide a number of goals to improve communication between a wide range of stakeholders, from scientists to fishers and the general public. From our perspective, the value that tagging alone can have in raising understanding and awareness of the dynamics of (highly migratory) stocks such as tuna is valuable and relatively easily achievable. To date, the awareness programme of the GBYP has focussed only on tag returns, rather than the benefits achieved by the programme. However, the high quality of the work undertaken in the GBYP tagging programme is ideally suited to wider dissemination and is of wide interest to a number of audiences. By raising awareness of the importance of the research within the scientific community, CPCs, RFMOs and the general public/ fishers, the role of the GBYP in improving ABFT stock assessments and management advice will become more widely understood and so support for the programme will increase.
Fulfilment of these recommendations would help contribute towards the current SCRS strategic goals of communication (goal 4: improve communication of data to the scientific community), research (goal 2: acquire the necessary biological knowledge in tuna) and data collection (goal 3: other biological data).

C7047
Cost-benefit analysis for the ICCAT GBYP tagging programme Page 6 of 63

C7047
Cost-benefit analysis for the ICCAT GBYP tagging programme Page 7 of 63
Introduction
In 2009, the objectives of the Grande Bluefin Tuna Year Programme (GBYP programme), officially the Atlantic-wide Research Programme for Bluefin Tuna, were defined by the ICCAT Standing Committee on Research and Statistics (SCRS) as:
1. Improve basic data collection through data mining (including information from traps, observers, and vessel monitoring systems (VMS), developing methods to estimate sizes of fish caged, elaborating accurate CPUE indices for Mediterranean purse seine fleets, development of fisheries-independent information surveys and implementing a large scale scientific conventional tagging programme;
2. Improve understanding of key biological and ecological processes through electronic tagging experiments to determine habitat and migration routes, broad scale biological sampling of live fish and dead fish landed (e.g. gonads, liver, otoliths, spines, etc.), histological analyses to determine bluefin tuna reproductive state, biological and genetics analyses to investigate mixing and population structure; and ecological processes, including predator-prey relationships;
3. Improve assessment models and provision of scientific advice on stock status through improved modelling of key biological processes (including growth and stock-recruitment), further developing stock assessment models including mixing among areas, and developing and use of biologically realistic operating models for more rigorous management option testing.
The GBYP was initiated in March 2010 as a six year programme with the purpose of improving basic data collection, improving understanding of key biological and ecological processes and improving assessment models and provision of scientific advice. Within that scope, a large-scale tagging programme was designed with the following scientific objectives (Di Natale & Idrissi, 2015), with priorities for action (3 highest, 1 lowest) suggested by Fonteneau et al., 2014 in a mid-term review:
1. Validation of current stock units, and improve knowledge on potential sub-stock units and mixing (Priority 3*)
2. Estimate M and or Z by age/age-groups (Priority 2) 3. Estimate natural growth rates (Priority 2) 4. Estimate tag recovery rates by fishery, making use of the observer programmes in the
Mediterranean (Priority 2) 5. Evaluate habitat-utilisation, movement patterns, maturity-dependent distribution and
spawning-ground use of BFT from electronic tag data (Priority 1-3)
To achieve these aims, the GBYP tagging programme also had the following operational objectives (Di Natale & Idrissi, 2015):
A Test and identify the most appropriate tagging approach for different areas and size of fish
B Test and identify the most resistant conventional tagging methodologies C Provide rewards and dedicated feedbacks for all tags reported D Improve tag recovery and reporting rates
In December 2015, a contract was agreed for Cefas to provide ICCAT with an independent review of the GBYP tagging programme in its entirety since inception in relation to the overarching of that specific aspect of the whole programme, and to recommend future
C7047
Cost-benefit analysis for the ICCAT GBYP tagging programme Page 8 of 63
activities. The agreed work programme for this contract is found at Annex A. During the review the project team:
(i) Undertook a project initiation visit to the Secretariat during the week of 11th January 2016 to establish links with key ICCAT staff, and to understand specific concerns or issues to address. Further to identify any limitations, and to gather together any necessary data and documents.
(ii) Reviewed available documentation provided on the GBYP website, material associated that was discovered using internet search, and specifically requested documentation
The project team was struck by the expertise, enthusiasm and engagement of the ICCAT GBYP coordination staff, and are grateful to them for the information they provided during the visit to Madrid and for the helpful and timely way in which they subsequently contributed to this review.
The review is presented in three main parts, but with an Executive Summary and Recommendations preceding this Introduction:
D1: A comprehensive review of the ICCAT GBYP tagging activities conducted so far, specifically dealing with Task 1, and a cost-benefit analysis, taking into account any available index, including any possible improvement for the BFT assessment or use in the Management Strategy Evaluation (MSE) process induced by the results of the GBYP tagging activities;
D2: An analysis of how GBYP tagging has improved the knowledge of bluefin tuna distribution, growth and behaviour, taking into account Task 2 and Task 3 above, or has the potential to do so with additional analyses of the data already collected.
D3: Proposals for future strategies or improvements, taking into account the original tagging design, the objectives, the different strategies in the various years and the results obtained thus far, and taking into account the cost and logistic constraints.

C7047
Cost-benefit analysis for the ICCAT GBYP tagging programme Page 9 of 63
D1 Review of the ICCAT GBYP tagging activities
Background
After the general principles of the GBYP had been agreed by the European Union (EU), ICCAT
and contracting parties in 2008/9, planning and coordination of the GBYP programme began
in March 2010 following the appointment of the GBYP coordinator. To date, five phases of the
programme have been completed (Phase 5 formally ends on 23 February 2016), with the sixth
to be undertaken in 2016/2017. The general goals of the programme were determined over
the first phase based on planning activities undertaken during that phase of the programme.
Tagging activities within the GBYP fall into five categories:
1. Design 2. Operational meetings, training, campaigns 3. Field Equipment 4. Field Activities 5. Analysis
The first Phase focussed on planning, which has been followed by four annual field programmes. The sixth Phase is to be conducted during 2016/2017.
Figure 1. Cost and scheduling of tagging programme activities by phase. Cells are colour coded by cost, with red
cells indicating the more costly components of the programme. Financial data provided by GBYP coordination team
in ‘cost indicators Tagging.xls’.
The initial, short-term GBYP objective was to implant 30,000 conventional tags and 300 electronic tags into Atlantic bluefin tuna (ABFT) over a period of three years in the eastern Atlantic and Mediterranean. More refined objectives have been set during the programme as results from the earlier phases became available. All objectives are identified and reviewed by the GBYP Steering Committee, the ABFT species group of the SCRS, the SCRS and finally by the ICCAT. Such review meetings ensure that operational and financial constraints are identified and mitigated for.
The cost of the GBYP tagging programme to date (end of Phase 5) has reached more than €3.5 million, against an original projection of €9,765,000 (~38%). The primary reason that the work has been conducted with a much smaller budget than anticipated is that some of the expected contributions from the contracting parties (CPCs) were not realised. The performance and the expected benefits of the programme have to be assessed with this in mind. Furthermore, in assessing the cost-benefit of the GBYP tagging activities, it needs to be borne in mind that many of the expected benefits of the GBYP programme are intangible, knowledge-based benefits that cannot be monetized. To assess benefit, therefore, we broke down each of the five activities into a range of ‘defined benefits’ that were agreed during a two-day visit to ICCAT to discuss the GBYP tagging programme. We gathered evidence from

C7047
Cost-benefit analysis for the ICCAT GBYP tagging programme Page 10 of 63
GBYP coordination and GBYP ICCAT outputs to assess how important these benefits were and identified the evidence required to assess whether they were being realised. Most of the evidence is based on a review of published outputs available from ICCAT. We were thus able to determine whether the defined benefits had been achieved in part or in full. Rather than assess success in a binary way (i.e. succeeded or failed), we have described the strengths and weaknesses of the work undertaken, and use this assessment to make recommendations about the implementation of the programme in future.
Design of the GBYP tagging programme
Tag return rates for ABFT peaked in the 1960s and 1970s and have been in decline ever since (Figure 2, data provided by GBYP coordination team). Return rates fell dramatically following the introduction of the recovery plan for ABFT in 2007, so information on mortality and growth rates, and on movement patterns of tuna has become scarce and less useful in ABFT fishery management. To improve such a situation, particularly in the eastern Atlantic and Mediterranean, a systematic and coordinated tagging effort was required.
Figure 2. Proportional tag returns from tuna tagging programmes in the Atlantic and Mediterranean by year since 1954. Data from ‘_tagBFT_20150923.xlsx, Tabla 2’
The design of the tagging programme and publication of an ICCAT ABFT tagging manual was undertaken during Phase 1 of the GBYP, following the submission of a single bid in response to tender (ICCAT GBYP Steering Committee, 2010). The design focussed on the concept of a three year burst of tagging with ID tags in 2011 to 2013, followed by a 10 year period of tag recovery until 2023. The tagging programme design for the use of electronic tags was not considered. The assumptions of the ID tag programme design were that there is complete population mixing of ABFT within the eastern stock (eastern Atlantic and Mediterranean), that there would be implementation of a general tag awareness programme, and that experiments would be performed to determine the tag retention and reporting rates. It was recommended then that varying tag rewards should be used.
C7047
Cost-benefit analysis for the ICCAT GBYP tagging programme Page 11 of 63
The tagging programme design was discussed at the GBYP Operational Meeting on Tagging, held in Madrid on February 18, 2011, immediately following a GBYP Steering Committee meeting. Although some minor amendments were suggested, the design was revised and adopted and thereafter formed the basis of the GBYP tagging activity in phases 2 through 5. The performance against the plan was evaluated on an annual basis by GBYP Steering Committee, the SCRS and operational meetings.
The main outputs from this activity were a statistically designed tagging plan and a synthesis of tagging protocols and fishing methods for tagging in the Eastern Atlantic (Cort et al., 2011; Belda et al., 2011). The strengths and weaknesses of the work are presented in Table 1. Although the tagging plan did not extensively review previous tagging efforts to determine the critical gaps in knowledge and potential logistic hurdles, the documents provided a sound basis for decision making on tag purchases and deployment schedules within the GBYP. In our opinion, an improvement to the tagging design would have been an assessment of the expected number of tag returns under various return rate scenarios, so that performance of the tagging programme against the design could be judged. Additionally, we feel that an assessment of historic tagging programmes, tag return rates and locations would have helped identify potential future logistic hurdles, and set expectations for tag returns in GBYP. Overall however, the intended benefits of the design activity of the GBYP tagging programme were realised, and we judge the effectiveness of this element of the programme to be high.
C7047
Cost-benefit analysis for the ICCAT GBYP tagging programme Page 12 of 63
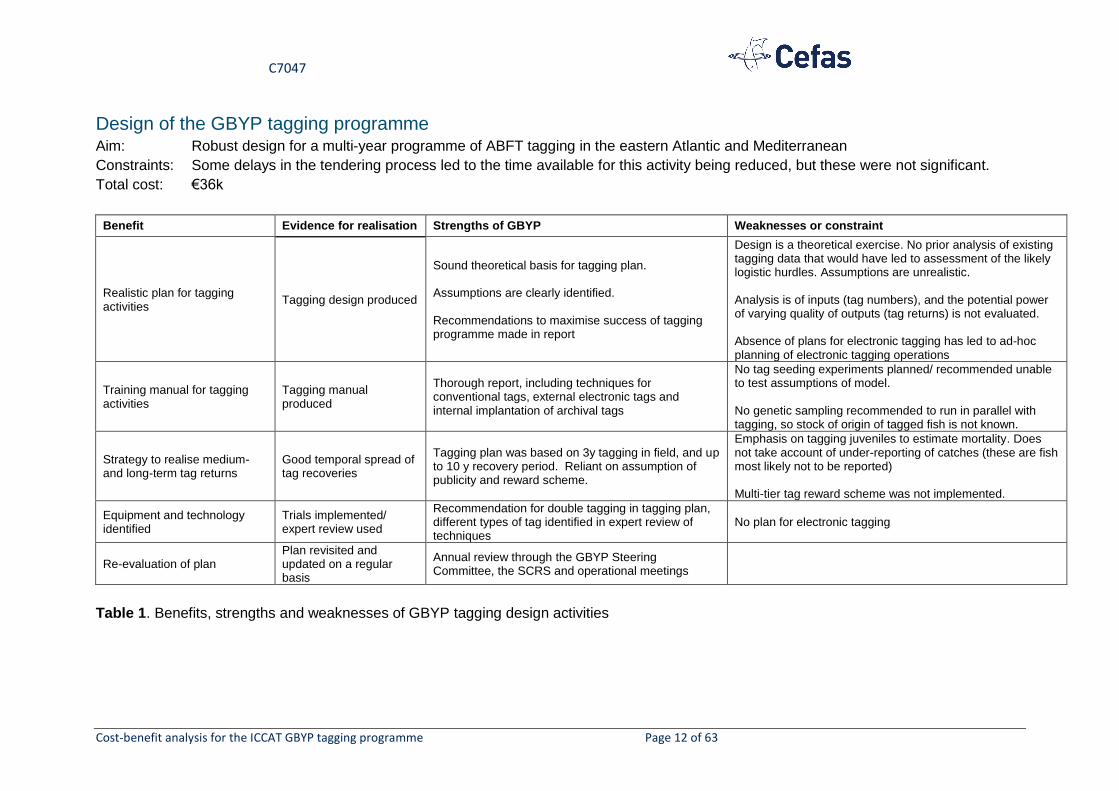
Design of the GBYP tagging programme Aim: Robust design for a multi-year programme of ABFT tagging in the eastern Atlantic and Mediterranean
Constraints: Some delays in the tendering process led to the time available for this activity being reduced, but these were not significant.
Total cost: €36k
Benefit Evidence for realisation Strengths of GBYP Weaknesses or constraint
Realistic plan for tagging activities
Tagging design produced
Sound theoretical basis for tagging plan. Assumptions are clearly identified. Recommendations to maximise success of tagging programme made in report
Design is a theoretical exercise. No prior analysis of existing tagging data that would have led to assessment of the likely logistic hurdles. Assumptions are unrealistic. Analysis is of inputs (tag numbers), and the potential power of varying quality of outputs (tag returns) is not evaluated. Absence of plans for electronic tagging has led to ad-hoc planning of electronic tagging operations
Training manual for tagging activities
Tagging manual produced
Thorough report, including techniques for conventional tags, external electronic tags and internal implantation of archival tags
No tag seeding experiments planned/ recommended unable to test assumptions of model. No genetic sampling recommended to run in parallel with tagging, so stock of origin of tagged fish is not known.
Strategy to realise medium- and long-term tag returns
Good temporal spread of tag recoveries
Tagging plan was based on 3y tagging in field, and up to 10 y recovery period. Reliant on assumption of publicity and reward scheme.
Emphasis on tagging juveniles to estimate mortality. Does not take account of under-reporting of catches (these are fish most likely not to be reported) Multi-tier tag reward scheme was not implemented.
Equipment and technology identified
Trials implemented/ expert review used
Recommendation for double tagging in tagging plan, different types of tag identified in expert review of techniques
No plan for electronic tagging
Re-evaluation of plan Plan revisited and updated on a regular basis
Annual review through the GBYP Steering Committee, the SCRS and operational meetings
Table 1. Benefits, strengths and weaknesses of GBYP tagging design activities

C7047
Cost-benefit analysis for the ICCAT GBYP tagging programme Page 13 of 63
Operational meetings, training and awareness campaign
Fishers and processors are generally familiar with the concept of using fish tags for research purposes, and fish tags contain reward and return information on them that enables their recovery to the tagging entity. As a consequence, tags are often returned even with relatively little publicity. However, to maximise tag recovery rates and to increase the levels of engagement of stakeholders, it is widely considered necessary to raise awareness of a tagging programme and its aims so that those who may come across tags are more likely to (a) post and identify the tags; (b) understand the purpose of the programme and are motivated to return a tag if one is discovered. For fisheries that operate within the context of an observer programme, it is critical that observers are fully trained in tag observation and return to source. The number of ABFT tags returned annually to ICCAT has been in decline since the 1970s (Figure 1), and fell below 10 tags in the years 2008 to 2010.
Figure 3. Number of tag returns in the last 20y from tuna tagged in the Atlantic and Mediterranean.
Tag awareness was considered to be high priority (ICCAT GBYP Steering Committee, 2011), and needed to be implemented from the ‘bottom up’. In 2011, campaign material in 12 languages was designed (posters and stickers) and disseminated by ICCAT to government agencies, scientific institutes, individual scientists, tuna processing industries, fishers (sports and commercial, and their associations), and Regional Fisheries Management Organisations (RFMOs) and Regional Advisory Councils (RACs) to maximise awareness of those most likely to encounter tags. Visits were made to ports and fisheries to ensure that information was visible and that the requirement to return tags was understood. There was strong cooperation with ICCAT Regional Observer Programmes (ROPs), but national obsever programmes were harder to reach in most of the cases. Information posters are now present in most of the ports where bluefin tuna are usually or potentially landed, at tuna farms, tuna traps, industries, sport fishers clubs, fishers associations, bars frequented by fishers, local port authorities and on many fishing vessels. An additional campaign was undertaken in 2014 focusing on the dissemination of campaign material to stakeholders in 14 countries bordering the Mediterranean Sea. The primary targets in this latter campaign were regional observers and

C7047
Cost-benefit analysis for the ICCAT GBYP tagging programme Page 14 of 63
national authorities, with the aim to reach them personally rather than by post or email. In all, more than 15,000 posters and 18,000 stickers have been produced and distributed to more than 90 countries and more than 110 locations around the globe (Figure 4).
Figure 4. Overview of the localities where the ICCAT GBYP tag awareness material (http://www.iccat.int/GBYP/en/AwCamp.asp) was distributed. The ICCAT GBYP web page has the full list of contacts (https://www.iccat.int/en/links.htm).
The publicity material is also available on the ICCAT GBYP website. Some newspaper and web articles were also produced and they have been published in newspapers, magazines and the internet. A reward scheme was implemented that provides €50 or a T-shirt per tag, with reward of €1000 for an electronic tag. An annual lottery prize of €1000 and two second place prizes of €500 are awarded to those who return conventional tags.
The reward and awareness programmes were approved by the Steering Committee in 2011 and have been subject to annual review during operational and Steering Committee meetings. Additional staff were brought in on an as needed basis to assist with the workload of responding to queries and tag returns, and to help distribute campaign and training material.
The number of countries and stakeholders that need to be reached by the awareness campaign is large because tagged tuna may be encountered in all countries bordering the Mediterranean and Atlantic Ocean. Tagged tuna may also be encountered at several stages in the capture and processing chain. Returning a tag takes time and effort on behalf of the person who discovers the tag and, in consequence, many tags will go unreported. Furthermore, there are geopolitical, cultural and sectoral barriers to overcome to ensure that a tag on a tuna is recovered.
Much of the formal cost of the GBYP tag awareness campaign was associated with the award of contracts for specific awareness activities such as design of publicity material (Figure 4b) and targeted awareness efforts (COFREPECHE-OCEANIS, 2010-2011; COFREPECHE, 2014; Di Natale A., 2015). Some of the tagging awareness activities have been undertaken within the day to day coordination of the GBYP programme. In total, 388 tags have been returned in the 5 years since the inception of the GBYP tagging programme (data from GBYP
C7047
Cost-benefit analysis for the ICCAT GBYP tagging programme Page 15 of 63
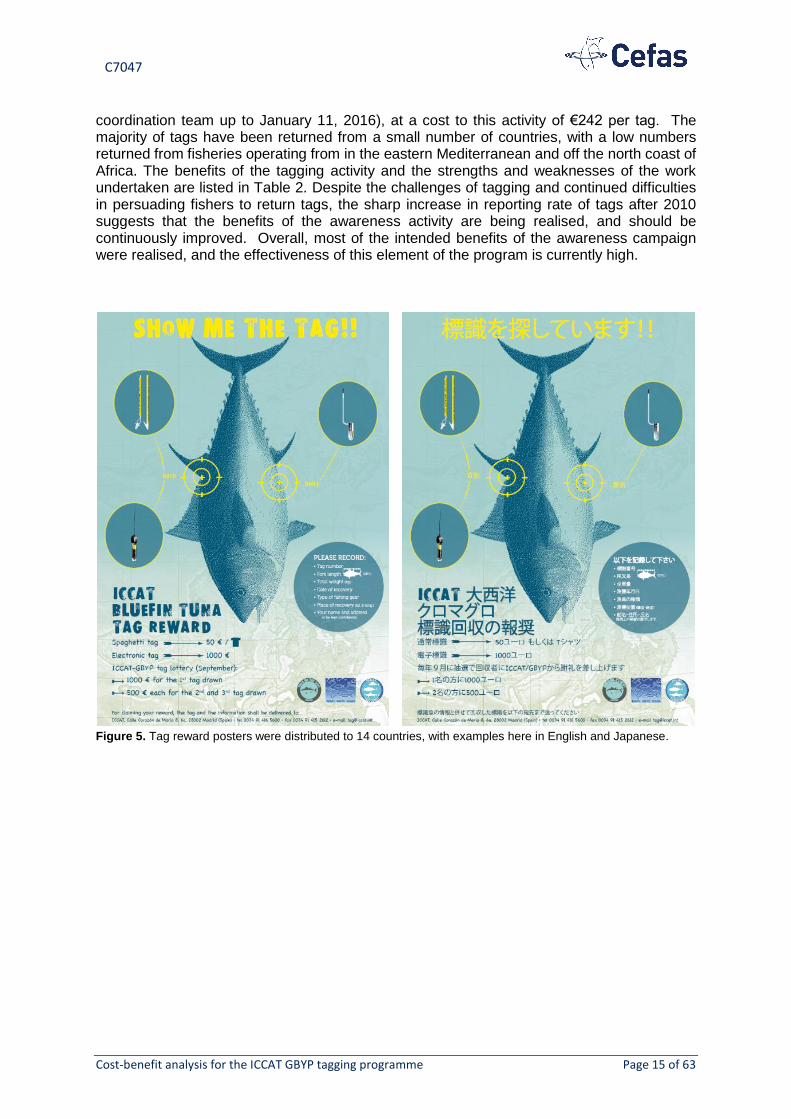
coordination team up to January 11, 2016), at a cost to this activity of €242 per tag. The majority of tags have been returned from a small number of countries, with a low numbers returned from fisheries operating from in the eastern Mediterranean and off the north coast of Africa. The benefits of the tagging activity and the strengths and weaknesses of the work undertaken are listed in Table 2. Despite the challenges of tagging and continued difficulties in persuading fishers to return tags, the sharp increase in reporting rate of tags after 2010 suggests that the benefits of the awareness activity are being realised, and should be continuously improved. Overall, most of the intended benefits of the awareness campaign were realised, and the effectiveness of this element of the program is currently high.
Figure 5. Tag reward posters were distributed to 14 countries, with examples here in English and Japanese.

C7047
Cost-benefit analysis for the ICCAT GBYP tagging programme Page 16 of 63
Operational meetings, training and awareness campaign of the GBYP tagging programme Aim: Maximise the effectiveness of the GBYP field activities through a well coordinated tagging, tag return and observer programme
Constraints: Broad geographic remit, coupled with cultural and sectoral barriers
Cost: €94,174, plus day to day input from GBYP coordination
Benefit Evidence for realisation Strengths of GBYP Weaknesses or constraint
Stakeholder engagement Dissemination and engagement with aims and results of tagging programme
Wide dissemination of campaign material, including internet. Good dialogue with those returning tags which may lead to better relationship with industry
No dedicated tagging observers. Difficult to reach stakeholders in some countries. Evidence that some countries are more likely to return tags due to lack of engagement. Social media strategy not defined.
Training- tagging/ observer
Training records and clear protocols for tagging and reporting
Strong interaction with ICCAT ROP programme
Unable to reach some national observers with same efficacy. Some tagging occurs without notification to ICCAT, so complete information is missing for some returns
Tag recoveries Number of tag recoveries (& quality of associated data)
Number of tag recoveries has sharply increased during GBYP
Cultural and sectoral issues in diverse fisheries are a challenge to overcome. Reporting directly to ICCAT may put fishers off returning tags to avoid providing details of fishing activity even if confidentialty is provided
Tag reporting Knowledge of reporting rates
Tag return numbers by fishery is available. Some anecdotal information on tag reporting practice within fisheries and countries is available
No tag seeding experiments could be undertaken, so there is no knowledge of reporting rate within fishery. Variable skills within obsever programme. E.g. ICCAT ROPs more skilled than national observers.
Table 2. Benefits, strengths and weaknesses of GBYP tagging programme operational activites

C7047
Cost-benefit analysis for the ICCAT GBYP tagging programme Page 17 of 63
Field equipment
A variety of tagging equipment is available for use on tuna and other fish. It is critical that tags are fit for purpose; anchoring, visibility, and impact all need to be considered. Prior to the inception of the GBYP, a number of tuna tagging studies had been undertaken that helped to guide the selection of equipment for this particular programme.
ICCAT procured sufficient equipment for tagging tuna with conventional tags as per the design of the tagging plan approved in early 2011. The equipment purchased included 60,000 spaghetti tags of three different types, more than 12,500 conventional tag applicators, 132 mini-PATs pop-up satellite archival tags, 50 archival tags (for internal implantation). Collaborative opportunities were taken advantage of that enabled the released of another 14 min-PATs and 8 acoustic tags. Costs for data transmission and preliminary analysis for satellite communicating tags were included in the costs of this activity. At the beginning of the GBYP programme, the tagging design included the use of PIT tags, for which 40 PIT tag readers were purchased. However, due to legal objections raised by one of the ICCAT CPCs, these were ineligible for use.
Procurement of tags was undertaken only after approval by the Steering Committee, which involved scrutiny of the aims of the tagging and the budget. The number of providers of conventional tags and electronic tags is relatively limited. It was agreed to limit the number of providers, chosen on expert advice, to ensure consistency throughout the tagging campaign and with the main US tagging programmes.
The cost of 60,000 conventional tags was €61543, at an average cost of €1.02. A total of 12,500 tag applicators were also purchased at a unit cost of €2.48. This high ratio of applicators to tags ensured that applicators would be used for less than the usual average number of tags (1 in 25), and thereby minimise the risk of injuring or damaging the tuna to be tagged that can sometimes occur due to degradation of the applicator blade. However, the majority of cost within this element of the programme is strongly influenced by the choice of electronic tag (satellite transmitting or internal archival); to date, €637952 has been spent on procurement of tags and recovering their data; approximately €2726 per tag. This technology is expensive by nature and comparable equipment from alternative manufacturers would have cost the same. Cheaper, but less reliable or capable equipment is now becoming available, but was not available when decisions on procurement for the first phases were being made. Some tags were provided by other organisations (e.g. WWF) to the GBYP at no cost, thereby increasing the cost-effectiveness of the procurement. Overall, we consider that the benefits of the tag procurement activity were mostly realised and the effectiveness of this element of the program is high. Consideration of alternative new electronic tag technology for future purchases, such as small, lower cost satellite tags (e.g. Wildlife Computers’ Mark-Recapture PAT, Desert Star SeaTag-LOT, etc.) may increase cost-effectiveness in any extension of the programme.
C7047
Cost-benefit analysis for the ICCAT GBYP tagging programme Page 18 of 63
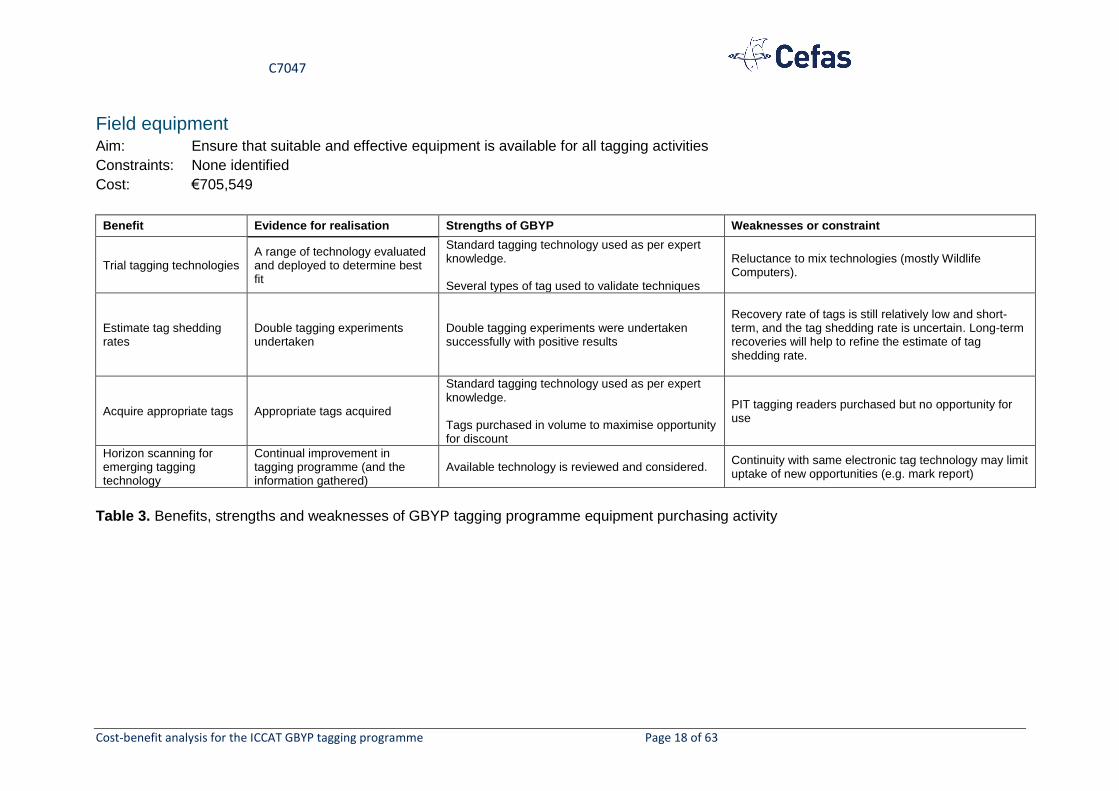
Field equipment Aim: Ensure that suitable and effective equipment is available for all tagging activities
Constraints: None identified
Cost: €705,549
Benefit Evidence for realisation Strengths of GBYP Weaknesses or constraint
Trial tagging technologies A range of technology evaluated and deployed to determine best fit
Standard tagging technology used as per expert knowledge. Several types of tag used to validate techniques
Reluctance to mix technologies (mostly Wildlife Computers).
Estimate tag shedding rates
Double tagging experiments undertaken
Double tagging experiments were undertaken successfully with positive results
Recovery rate of tags is still relatively low and short-term, and the tag shedding rate is uncertain. Long-term recoveries will help to refine the estimate of tag shedding rate.
Acquire appropriate tags Appropriate tags acquired
Standard tagging technology used as per expert knowledge. Tags purchased in volume to maximise opportunity for discount
PIT tagging readers purchased but no opportunity for use
Horizon scanning for emerging tagging technology
Continual improvement in tagging programme (and the information gathered)
Available technology is reviewed and considered. Continuity with same electronic tag technology may limit uptake of new opportunities (e.g. mark report)
Table 3. Benefits, strengths and weaknesses of GBYP tagging programme equipment purchasing activity

C7047
Cost-benefit analysis for the ICCAT GBYP tagging programme Page 19 of 63
Field activities
Tagging activities have been undertaken in Phases 2 through 5 of the GBYP (ICCAT GBYP Annual Reports: 2011; 2012; 2013; 2015) and more are planned in Phase 6. Tagging with conventional tags was the focus of activity in phases 2, 3 and 4. Electronic tagging has been the focus in Phases 4 and 5, and will be again in Phase 6. The design implemented on the concept of a three year burst of tagging with ID tags in 2011 to 2013, followed by a 10 year period of tag recovery until 2023. The target of the conventional tagging programme was tuna aged 1-3 years (40 to 100 cm fork length), although some tuna of >100cm FL were tagged. The tagging design for the use of electronic tags was more ad-hoc, and focussed on specific hypotheses regarding migration of mature tuna (typically >200cm FL) from specific areas within the eastern Atlantic and Mediterranean. A full account of the tagging activities and achievements is presented in Table 3. To date, 24,637 conventional spaghetti tags have been deployed on 16,959 tuna against a target of 30,000. 46% of tunas were double tagged against a target of 40%. In total, 234 electronic tags have been deployed, against a target of 300. Due to the difficulties of deploying sufficient numbers of conventional tags, and the difficulty in estimating reporting rates of each fishery, the focus of the tagging programme has been shifted to electronic tagging (fishery independent) in the more recent phases of the GBYP.
Since tagging comprises the most significant part of the budget, the tagging activities are under constant review and scrutiny by the GBYP coordination owing to the nature of the tendering process and many operational constraints. In recent years, the Steering Committee has recommended a change in strategy, moving away from conventional tagging to an electronic tagging strategy because the expected gains in information on tag reporting rate from the conventional tagging programme could not be materialised.
There are significant constraints on the field programme, principally operational and logistic. A number of factors can affect the success of tagging missions, such as weather, success of fishing (numbers and suitability of captured fish), the size of fish being targeted, environmental changes, short and long-term changes in governance of fisheries, economic effects on fishing operations (e.g. sales of quota, collapse of metier), and willingness of fishers to engage in tagging activities. As such, catch and tagging rates are impossible to predict and guarantee. This is demonstrated by the variable success rates of the tagging missions (Table 4), which ranged from €51 per deployed tag to €439 per deployed conventional tag, and from €177 to €3000 per deployed electronic tag. Most reports of tagging contracts stated achievement of original objectives (Table 4). One significant goal of the original design, to undertake tag seeding experiments so that tag reporting rates could be estimated, proved to be impossible to achieve.
Overall, the cost of deployment of 24,637 conventional tags averages out at a unit cost of ~€102 per tag, or ~€149 per tagged tuna, whereas the cost of deploying 234 electronic tags works out at a unit cost of €1103 per tuna. However, this estimate is slightly conservative because 128 of the electronic tags were deployed at the same time as conventional tags, which increased efficiency; tagging missions that were solely based on electronic tagging required a unit cost of €2388. The majority of effort and funding was expended on conventional tagging, at a ratio of 10:1. The goals of the tagging activities were only partially met; 57% of the target for conventionally tagged fish has been reached so far, along with 78% of the target for electronically tagged fish. Given the financial resources invested (only ~1/3rd of expected funding for the GBYP tagging programme was realised) and the range of logistic issues experienced during the tagging programme it is clear that, despite falling short of the original targets, the achievements have generally exceeded expectations.

C7047
Cost-benefit analysis for the ICCAT GBYP tagging programme Page 20 of 63
Table 4. GBYP tagging activity: success and costs of each tagging contract. (Cost data provided by GBYP coordination team: ‘31_12_Final_Tables_Tagging_Activities_Phases2-
5.xls’, tagging data gathered from reports of tagging contracts supplemented by additional information from GBYP coordination team)
Phase Contractor Area
Fish
double
tagged
% double
tagging
Cost per
tag (€)
Cost
per fish
(€)
Contract
complete
Total Conv PSAT DST Sonic Total Conv PSAT DST Sonic
Bay of Biscay 1774 1279 0 0 0 1279 1279 0 0 0 495 120 158 Mostly
Strait of Gibraltar 1781 1391 1 0 0 1391 1391 1 0 0 604 Mostly
Western Mediterranean(Med) 1170 911 13 0 0 913 911 13 0 0 258 Mostly
Activity in Morocco (GBYP,WWF,INRH) Atlantic Morocco 15 0 11 0 0 10 0 11 0 0 5 118 177 Fully
4740 3578 25 0 0 3593 3581 25 0 0 1362 37.9
Bay of Biscay 4836 3413 3 13 0 3413 1987 0 13 0 1399 127 193 Fully
Strait of Gibraltar 2732 1489 21 25 0 1489 253 21 25 0 1190 Mostly
Western Mediterranean 405 313 5 0 0 313 221 5 0 0 87 Partly
Central Mediterranean 97 97 0 0 0 97 97 0 0 0 0 Partly
8070 5312 29 38 0 5312 2558 26 38 0 2676 50.4
Consortium (h. AZTI) Bay of Biscay 4615 4608 7 0 0 3009 1403 7 0 0 1599 54 83 Fully
Consortium (h. AZTI) Strait of Gibraltar 4105 4099 6 0 0 2681 1257 6 0 0 1418 Fully
Portugal 204 204 0 0 0 116 28 0 0 0 88
Consortium (h. COMBIOMA) Western Mediterranean 427 427 0 0 0 420 413 0 0 0 7 211 214 Mostly
Consortium (h. UNIMAR) Central Med: Tyrrhenian Sea
Kali Tuna Central Med: Adriatic Sea
Consortium (h. INRH) Atlantic Morocco 417 387 22 0 8 273 129 7 0 1 121 287 439 Fully
11574 11512 42 12 8 7807 4040 27 12 1 3712 47.5
Consortium (h. University of Istanbul) East Med: Turkey 30 0 30 0 0 30 0 30 0 0 0 3001 3001 Mostly
Consortium (h. COMBIOMA) Western Mediterranean 29 1 28 0 0 29 1 28 0 0 0 1724 1724 Fully
Consortium (h. INRH) Atlantic Morocco 44 24 20 0 0 44 24 20 0 0 0 2402 2402 Fully
Consortium (h. Federcoopesca) complimentary Central Med: Tyrrhenian Sea 136 131 5 0 0 136 131 5 0 0 0 Fully
5
Tag Nos. Fish Nos.
4
3
1806 1787 7 12 0 1308 810 7 Fully
2Consortium (h. IEO)
Consortium (h. AZTI)
12 0 479 51 70
C7047
Cost-benefit analysis for the ICCAT GBYP tagging programme Page 21 of 63
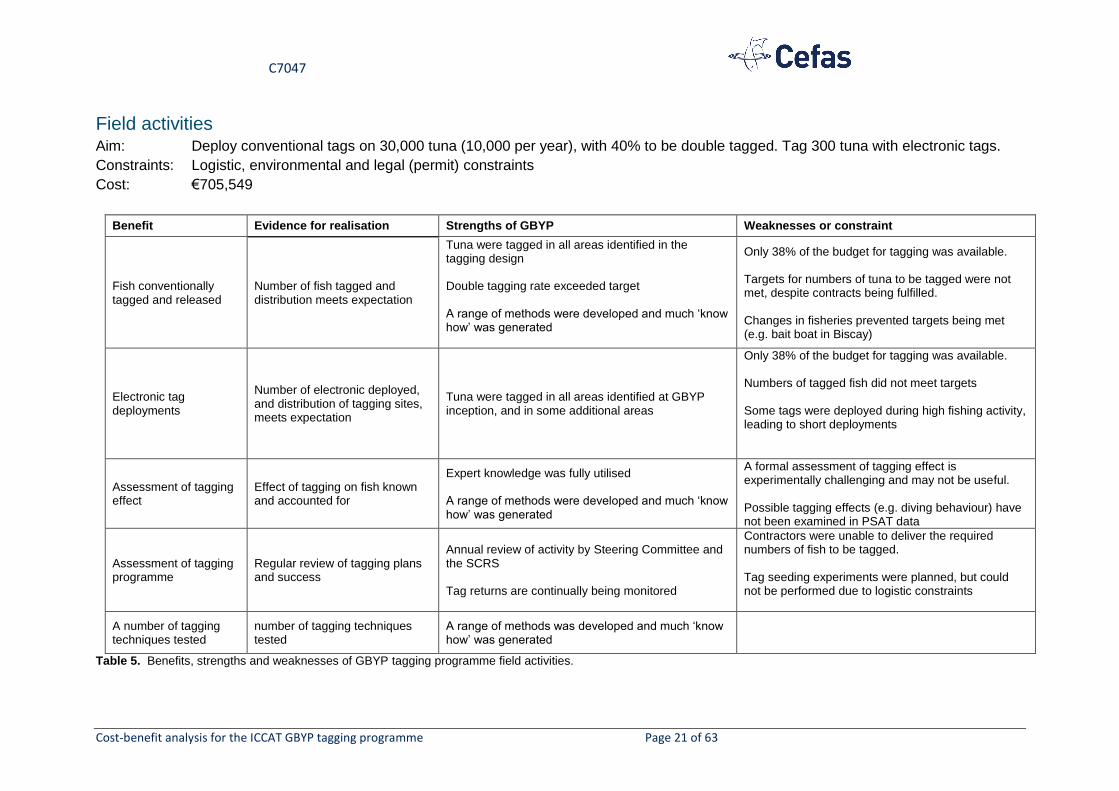
Field activities Aim: Deploy conventional tags on 30,000 tuna (10,000 per year), with 40% to be double tagged. Tag 300 tuna with electronic tags.
Constraints: Logistic, environmental and legal (permit) constraints
Cost: €705,549
Benefit Evidence for realisation Strengths of GBYP Weaknesses or constraint
Fish conventionally tagged and released
Number of fish tagged and distribution meets expectation
Tuna were tagged in all areas identified in the tagging design Double tagging rate exceeded target A range of methods were developed and much ‘know how’ was generated
Only 38% of the budget for tagging was available. Targets for numbers of tuna to be tagged were not met, despite contracts being fulfilled. Changes in fisheries prevented targets being met (e.g. bait boat in Biscay)
Electronic tag deployments
Number of electronic deployed, and distribution of tagging sites, meets expectation
Tuna were tagged in all areas identified at GBYP inception, and in some additional areas
Only 38% of the budget for tagging was available. Numbers of tagged fish did not meet targets Some tags were deployed during high fishing activity, leading to short deployments
Assessment of tagging effect
Effect of tagging on fish known and accounted for
Expert knowledge was fully utilised A range of methods were developed and much ‘know how’ was generated
A formal assessment of tagging effect is experimentally challenging and may not be useful. Possible tagging effects (e.g. diving behaviour) have not been examined in PSAT data
Assessment of tagging programme
Regular review of tagging plans and success
Annual review of activity by Steering Committee and the SCRS Tag returns are continually being monitored
Contractors were unable to deliver the required numbers of fish to be tagged. Tag seeding experiments were planned, but could not be performed due to logistic constraints
A number of tagging techniques tested
number of tagging techniques tested
A range of methods was developed and much ‘know how’ was generated
Table 5. Benefits, strengths and weaknesses of GBYP tagging programme field activities.

C7047
Cost-benefit analysis for the ICCAT GBYP tagging programme Page 22 of 63
Analyses
Analytical assessment of the data recovered from the tagging programme is not undertaken within the framework of the GBYP, and is instead taken forward in other ICCAT activities, such as the annual bluefin tuna data preparatory meetings (i.e. ICCAT BFT Data preparation meetings: Madrid, 2014; 2015) or as part of inter-sessional SCRS meeting or one off activities, such as the recent MSE workshop (January 2016). Analysis of data is therefore largely confined to maintaining an overview of tag returns and ensuring that the appropriate data relating to tag return or data transmission is captured and duly stored in the ICCAT tag data base. Tag returns are constantly under review as part of the day to day coordination of the GBYP programme. Performance of the tagging programme is reported at least annually to the Steering Committee, to SCRS meetings and in GBYP annual reports.
To date, 388 tags (~1.6% of the number released) have been recovered from the tagging programme including 31 electronic tags (21 PSAT, 9 archival, 1 acoustic). In total, 109 tags have been recovered from double-tagged tuna (i.e. 279 fish or 1.7% of those tagged and released have been recaptured). This represents a significant increase from the last formal review of the programme in 2014 (up from 0.36%; Fonteneau et al., 2014). Based on the likely growth rates of tuna tagged in phases 1-3, tag return rates are at their peak because all tagged tunas are now available to all fisheries (length >115cm; Figure 6). As the return rate is not increasing significantly, a decline in tag returns from 2016 would now be expected unless significant new tagging work is undertaken.
Figure 6. Estimated length frequency of tagged fish in 2015, based on extrapolated growth of all fish tagged.
The information that each returned tag provides can be variable and depends on the willingness and ability of the person who finds the tag to communicate the required data. Based on information from a summary of the GBYP tagging database (provided by GBYP coordination team as 31_12_Final_Tables_Tagging_Activities_Phases2-5.xls), which is a ‘live’ database kept continually up to date with GBYP tag returns, it is clear that 95% of tags provide information on the capture fishery and area of capture (GBYP). The majority of the tag recoveries have been made within the Mediterranean Sea, although some tags have been recovered from as far away as the east coast of the US. Most of the tags have been recovered from bait boats, typically of Spanish registration. Most of the electronic records are short, and report that tuna have covered only short distances but, as for conventional tags, some of the

C7047
Cost-benefit analysis for the ICCAT GBYP tagging programme Page 23 of 63
tags returns demonstrate significant and long-distance migrations into the Atlantic Ocean. The value of this information for GBYP tagging objectives 1, 4 and 5 is high (NB: a detailed assessment of electronic tag data is provided in Section D2).
Based on our own assessment of ICCAT ABFT tag return data during the period of the GBYP (the database was last updated on September 8th, 2015), some 71% of recovered conventional tags have an accurate release and recapture position, and 77% of the tags have a release and recapture date (Table 6). This in part reflects the fact that, for tags recovered early in the GBYP, a significant proportion were recaptures of tags released from previous tagging programmes (i.e. non-GBYP), for which some data are not available. It is expected that the proportions of tags with full or almost complete information will increase when the ICCAT ABFT tagging database is next updated by the (>100) tag returns collated since September 2015 by the GBYP programme.
Time at liberty of tags released and recaptured from the GBYP depends upon year of release, but based on recaptures from the first year of tagging (2011), the tagging programme will provide data on recaptures for multiple years after tagging, and therefore enable a rough approximation of natural mortality rates (GBYP tagging Objective 2). However, return rates are not sufficient to define mortality rates for stock assessment purposes, nor to explore mixing assumptions or other in-depth analyses (e.g. Kolody & Hoyle, 2015: CUSTARD: Comparison of Synchronous Tag Recovery Distributions). Only 41% have a release and a recapture length, providing data for estimation of growth rate (GBYP tagging Objective 3), although there are inconsistencies in the way that tuna have been measured, and the recording of this information. This is a common problem in tagging data (for bluefin tuna, see Justel-Rubio et al., 2014). There may be enough to decrease uncertainty in assumed growth rates for younger age classes, but given concerns with the quality of mark and recapture data this may not be advisable (see Ailloud et al., 2014).
It is important here to make it clear that the GBYP has succeeded by increasing the number of tag returns (i.e. the number of tags returned to ICCAT), the reporting rates by fishery (i.e. the proportion of tags that are reported, once found) are unknown or uncertain. Without this information, it is not currently possible to calculate recapture rates (the proportion of fish actually caught, which is the number of tags returned divided by the reporting rate). Thus, while there is an increase in knowledge about the fisheries that catch ABFT in the Mediterranean, and where, the data cannot currently be used to estimate fishing mortality.
The number of satellite communicating tags that have reported data back to the GBYP is 176. We were able to assess the quality of these datasets (provided by GBYP coordination team) but not to assess the quality of other electronic tag datasets (e.g. those from archival tags). On average, PSAT datasets were 56 days in length, with a maximum of 361 days. Each dataset contains information on the estimated location for each day of liberty, the proportional utilisation of depths and thermal habitat. In most cases, a depth and temperature time-series (at a 5 minute interval) is also provided. The value of this information for meeting Objective 5 is high because further analysis of these data will help to identify important behaviours and migration routes.
The strengths and weaknesses of the analysis of tag return data are shown in Table 7. Taking into account the costs of all the components of the GBYP tagging programme, the unit cost of each recovered tag is €9,481, and for each recovered fish €13,186. This compares favourably with the estimated cost of tag recovery in previous tagging programmes (STECF, 2008) of around €15,000 per fish (note that this has not been inflated to current prices). If physical recoveries of electronic tags are excluded from the calculation (i.e. the cost of deploying electronic tags is excluded), the unit cost per fish falls to €11,713. Electronic tags have cost €30,021 on average, taking into account deployment and procurerment costs, for each

C7047
Cost-benefit analysis for the ICCAT GBYP tagging programme Page 24 of 63
physical recovery, but this cost falls dramatically when the number of recovered tag datasets is included because PSAT tags do not have to be physically recovered in for their data to be received; each dataset costs €4,868. This compares favourably with previous indicators (€20,000; STECF, 2008), largely because the reliablity of tag data transmission has increased dramatically in the last decade, but also because the electronic tagging activity of the GBYP was often undertaken in collaboration with other organisations (e.g. WWF MEDPO, 2012; Di Natale & Idrissi, 2012), and was therefore delivered at lower cost than through sole deployment. Overall, although the GBYP coordination team has a very good understanding of tag return rates and the value of these data, the potential of the recovered tag data to contribute to wider GBYP goals has not yet been met.
It is worth noting, and repeating here, that the midterm review (Fonteneau et al., 2014) commented as follows on this aspect:
The number of recoveries of tags is increasing following the GBYP-supported enhanced tagging programme and the better publicity; this is good for scientific knowledge, but recovery rates appear still to be very low at just 0.36%: at the time of writing, there have been just 49 recoveries of dart tags since 2011 (and only three recoveries from farms), whereas some 13 000 BFT were tagged during phases 2 and 3 of the GBYP. The traditional problem of very low reporting rates of tagged tunas in the East Atlantic and the Mediterranean (and by many longliners working the open sea) has seemingly undermined previous BFT tagging programmes in the area, although the fundamental problem is seldom discussed within the GBYP. However, the attempts by the GBYP at wide-scale publicity to encourage the reporting of tag recoveries do need to be acknowledged, although penetration to all parties and the acceptance by those parties of their responsibility to report their tag recoveries are not yet fully evident. In theory, for instance, reporting rates by farms should be 100%, and the GBYP SC acknowledged this in their recent statement that “The SC noted that the situation with respect to tag recoveries for adult BFT has changed substantially in recent years. In the past, ensuring high return rates and having a method for estimating reporting rates from the fisheries harvesting adults were problematic. However, currently, a very high percentage of the adult catch is either caught in traps or placed in farm cages. In addition, there is now 100% observer coverage of these fish when they are harvested from the traps and cages. This means that both high return rates for recapture tagged fished and a 100% reporting rate for these fisheries should be achievable”.
Given the above perfectly fair statement by the SC and the low rates of tag return, however, the GBYP tagging programme is still confronted with the question as to whether its current rates of recovery are real or being biased downwards by non-returns and apparent refusals by some fishers and farm managers to support the overall programme. For instance, there are rumours that, at some farms, tags are sometimes being removed by divers before the fish are harvested. Conversely, though, are the low rates of recovery attributable to the low exploitation rates at the size of BFT being tagged/caught (most of the fish tagged during phases 2 and 3 of the GBYP were juveniles, a size seldom caught by fisheries), or to poor tagging practice and high tagging mortality? Perhaps, however, the programme is simply not recording or being sent the tag returns from farms; if so, why not? It is the review team’s belief that the answers to these questions might have been forthcoming already if a tagging coordinator had been appointed to oversee the work. The GBYP’s SC motivated and recommended to ICCAT several times in reports and meetings that such a post be established by the Secretariat, but to date such an appointment remains elusive.
As well as reconsidering the appointment mentioned above, the review team urges the GBYP to commission an immediate quantitative analysis of current recovery rates of dart tags (by gear and area): such an analysis should allow the overall tagging programme to be improved, based on recoveries by gear, by fishery, by fish size and by geographic area. This recommendation was given ‘Medium’ priority.

C7047
Cost-benefit analysis for the ICCAT GBYP tagging programme Page 25 of 63
Table 6. Summary metrics of the tag recapture database calculated from data retrieved from the ICCAT ABFT tagging by GBYP coordination
team (provided in files conventional tags.csv and electronic tags.csv). The database contains details of tags released under the GBYP and also
under the auspices of other tuna tagging programmes. These data are correct up to September 8th, 2015; an update of the ICCAT ABFT database
to include the most recent GBYP data was performed in late February 2016.

C7047
Cost-benefit analysis for the ICCAT GBYP tagging programme Page 26 of 63
Analyses Aim: Assessment of data returned from tagging activities
Constraints: No significant constraints
Cost: €4,674
Benefit Evidence for realisation Strengths of GBYP Weaknesses or constraint
Medium- and long-term tag returns
Good temporal spread of tag recoveries
Tag returns are higher than for many years and include returns from > 4y at liberty
Tag return rates are likely to peak in 2016 now that the tagged cohort has recruited to the fishery
Tag recoveries Number of tag recoveries
Tag returns from GBYP nearly total the number of returns from the previous 40 years Some genetic samples were taken in the later years of the tagging programme (Morocco, 2014 and 2015)
General lack of genetic sampling reduces power of data
Tag reporting Knowledge of reporting rates
Tag return rates are compiled from each fishery Anecdotal information about reporting rates
Some countries do not return tags The reporting rate of tags from within each fishery is not known because seeding experiments were not possible
Tagged fish found and reported
Number of tags reported meets expectation
Tag returns from GBYP nearly total the number of returns from the previous 40 years Very strong PSAT dataset Non-monetary benefits to fishers encountering tagged fish. Awareness is important.
The GBYP programme did not specify an expected return rate or a benchmark for success. Power analysis could have been undertaken in tagging design to assist this.
Tag recoveries (full information)
Proportion of tag recoveries that include information on key metrics meets expectation
All tags reported and returned provide useful data Good recovery rate of data from PSATs (reliable communications from satellites)
Many data can be collected from fishers when a tag is recovered; not all of these data can be, or are collected, reducing the power of the dataset Recapture lengths are sometimes provided without knowledge of measurement technique
Table 7. Benefits, strengths and weaknesses of GBYP tagging programme analysis activities

C7047
Cost-benefit analysis for the ICCAT GBYP tagging programme Page 27 of 63
Use of tagging data in assessment and operating models
Among the most important uncertainties in assessing the state and productivity of the Atlantic bluefin tuna stocks, outlined by the 2014 Commission meeting, were population structure and connectivity between east and west management units (Anon., 2014). The data required to consider these uncertainties could include conventional and electronic tagging data. A wealth of information can potentially be gleaned from both conventional and electronic tagging data, such as estimates of abundance, growth, mortality, migration/movement, and geographic/stock apportionment (Hilborn and Walters, 1992; Quinn and Deriso, 1999), and these could therefore be informative in assessment models. Apart from the VPA approach that is currently used for bluefin tuna assessments, a number of other assessment methods have been used, such as SCAL (Butterworth and Rademeyer, 2013, 2015), iScam (Etienne et al., 2014) and SS3 (see Maunder 2014 for application to Pacific Bluefin tuna), but the first serious attempt to make use of the available tagging data in an assessment model for Atlantic bluefin tuna was MAST (a multi-stock age structured tag integrated assessment model developed by Taylor et al., 2011). Given that spatio-temporal distribution and stock mixing are important considerations for bluefin tuna, MAST was a promising approach; it was a seasonally and spatially explicit model that was fitted to a variety of data, including conventional and electronic tagging data, and was used to reconstruct abundances for eastern and western populations from 1950 to 2008 and predict mixing that depended on season, ontogeny and location. However, among the weaknesses of MAST, noted by Carruthers et al., (2015a, 2015b), was the assumption of reporting rates that were constant over time, space and fleet, when it is now clear that this assumption is violated (Carruthers and McAllister, 2010), thus compromising results from the model (e.g. leading to large disparities between predicted catches and tag recapture probabilities, Caruthers et al., 2015a). Use of data from the GBYP tagging programme is coordinated through operational meetings of other GBYP activities (e.g. modelling), as recommended by the GBYP Steering Committee. At present, Carruthers et al., (2015a, 2015b, Anon. 2014) are in the process of developing a spatial, multi-stock statistical catch-at-length model (modifiable multi-stock model, or M3) that is flexible enough to accommodate the wide range of data now available for bluefin tuna (including new sources collected under the GBYP), incorporates enough complexity to allow some of the key uncertainties about bluefin tuna dynamics to be considered (including those on population structure and connectivity), and attempts to address some of the weaknesses in MAST. This flexibility and complexity means the model could form the basis of operating models as part of a management strategy evaluation (MSE) framework that seeks to evaluate the performance of alternative management procedures under prevailing uncertainties (Punt et al., in press). Carruthers et al., (2015b) also argue that, in a “slimmed down” form (e.g. for computational tractability), M3 could also form the basis of an assessment model within a management procedure that is testable in an MSE framework. Although conventional tagging data have been used to characterise possible movements between strata in M3, initial development and testing of the model has not included these data for estimating exploitation rates. This is because of concerns that variable and uncertain reporting rates linked to these data could lead to misleading estimates of movement and exploitation rates, and poor model performance. Furthermore, although it is possible to estimate fleet-specific reporting rates with the inclusion of conventional tagging data, it is unclear whether the data are then good enough to provide reliable estimates of movement and exploitation rates to warrant the substantial increase in computational intensity and time (Carruthers et al., 2015b). This does not mean that conventional tagging data should not be

C7047
Cost-benefit analysis for the ICCAT GBYP tagging programme Page 28 of 63
used in further applications of M3 to inform growth (e.g. accounting for shifts in growth rate attributable to the attrition of faster growing individuals caused by greater exploitation) and movement as well as exploitation, and at least this model has the capability of handling these data. For example, the use of observer tag recapture data, with the assumption of 100% reporting rate, could be a way around the problem of uncertain and variable reporting rates for other conventional tagging data (Caruthers et al. 2015a). Computational intensity should also be less of a concern if M3 is to be used as a basis for operating models, because setting up and conditioning operating models should be a “once-off” event, unlike the repeated application of assessment models in management procedures within an MSE simulation loop; in any case, computational speeds improve over time through advances in both hardware and software (e.g. compare ADMB with TMB, Kristensen et al. in press). Surgically implanted archival tags (SI tags) provide more detailed tag track information than conventional tags, but suffer from similar problems regarding variable and uncertain reporting rates, although these rates are higher for SI tags (because of the larger rewards for returns). On the other hand, pop-off satellite archival tags (PSAT tags) are used as a primary source of information on spatio-temporal movement within a model like M3, under the assumption that releases and recaptures are independent of fishing. One of the main concerns about PSAT tags, from a modelling point of view, is that the majority do not have a definite stock of origin (i.e. are not tagged in spatio-temporal strata specific to a single stock, Caruthers et al., 2015a). This leads to difficulties in how to weight these data so that information about movement is appropriately allocated to the different stocks, and may impact estimates of spatial distribution and movement. These uncertainties could be handled by considering a range of operating models with alternative hypotheses about movement (e.g. resulting from alternative allocation schemes for stock of origin), and discussions are ongoing within the GBYP modelling activities to reduce these uncertainties. Although PSAT tags are not strictly necessary to estimate spatio-temporal distributions (e.g. if simplified gravity models are used instead, as in Taylor et al., 2011), they do provide a rich source of information for evaluating movement at a more refined scale, and hence setting up these alternative hypotheses about movement.
Overall, the modelling and assessment frameworks that have been outside the GBYP tagging programme in readiness for use of the tagging data are effective. The uptake of tagging data into the assessments will help to identify the strengths and weaknesses of the tagging data, and to further refine the tagging programme. The strengths and weaknesses of the modelling work, and the use of the data, are identified in Table 8.

C7047
Cost-benefit analysis for the ICCAT GBYP tagging programme Page 29 of 63
Use of tagging data in assessment and operating models Aim: use of data generated from GBYP tagging programme
Constraints: No significant constraints
Cost: Not applicable- undertaken in other subdivisions of GBYP programme
Benefit Evidence for realisation Strengths of GBYP Weaknesses or constraint
Estimate stock assessment parameters
Stock assessment parameters (e.g. related to movement, growth and exploitation) can be estimated from tag recoveries
Conventional and electronic tags collected under the GBYP are both potentially valuable sources of information for estimating pertinent stock assessment parameters
Lack of information on reporting rates and the relatively low number of returns hampers model performance Tag data only used in very limited fashion to date
Validate current stock units
Current stock unit paradigm (E-W split at 45°W) tested
PSAT tags data collected under the GBYP are a valuable source of information on spatio-temporal movement and distributions
The high number of PSAT tags without a definite allocation of stock-of-origin hampers estimation of spatial distributions and movement; requires assumptions. The potential of the tag data to contribute to stock assessments is not fully realised.
Integration of new knowledge to stock assessments
Use of tagging data in assessments
Integrated modelling approaches (such as M3) allow for a wide range of data collected under the GBYP (including tagging data) to be included in stock assessments, and can also be used to parameterising alternative operating models for MSE testing
Lack of information on reporting rates, the relatively low number of returns, and the lack of definite stock-of-origin allocations all hamper model performance and required assumptions that increase uncertainty The potential of the tag data to contribute to stock assessments is not fully realised.
Table 8. Benefits, strengths and weaknesses of use of GBYP tagging data in stock assessment activities

C7047
Cost-benefit analysis for the ICCAT GBYP tagging programme Page 30 of 63

C7047
Cost-benefit analysis for the ICCAT GBYP tagging programme Page 31 of 63
D2: Improvement of knowledge of bluefin tuna:
distribution, growth and behaviour
Improvement of knowledge of distribution and migration
ABFT are endothermic teleosts with a unique cardiac physiology (Block et al., 2005). They grow at a rapid rate, up to 650kg and more than 4m in length. Their size and biology enables them to undertake rapid and long-distance migrations between feeding grounds and spawning areas, and to exploit environments ranging from sub-arctic to sub-tropical feeding grounds (Block et al., 2005). In consequence, ABFT are caught across the entire Atlantic Ocean, by more than 100 fleets registered with more than 50 countries (http://www.iccat.es/en/accesingdb.htm).
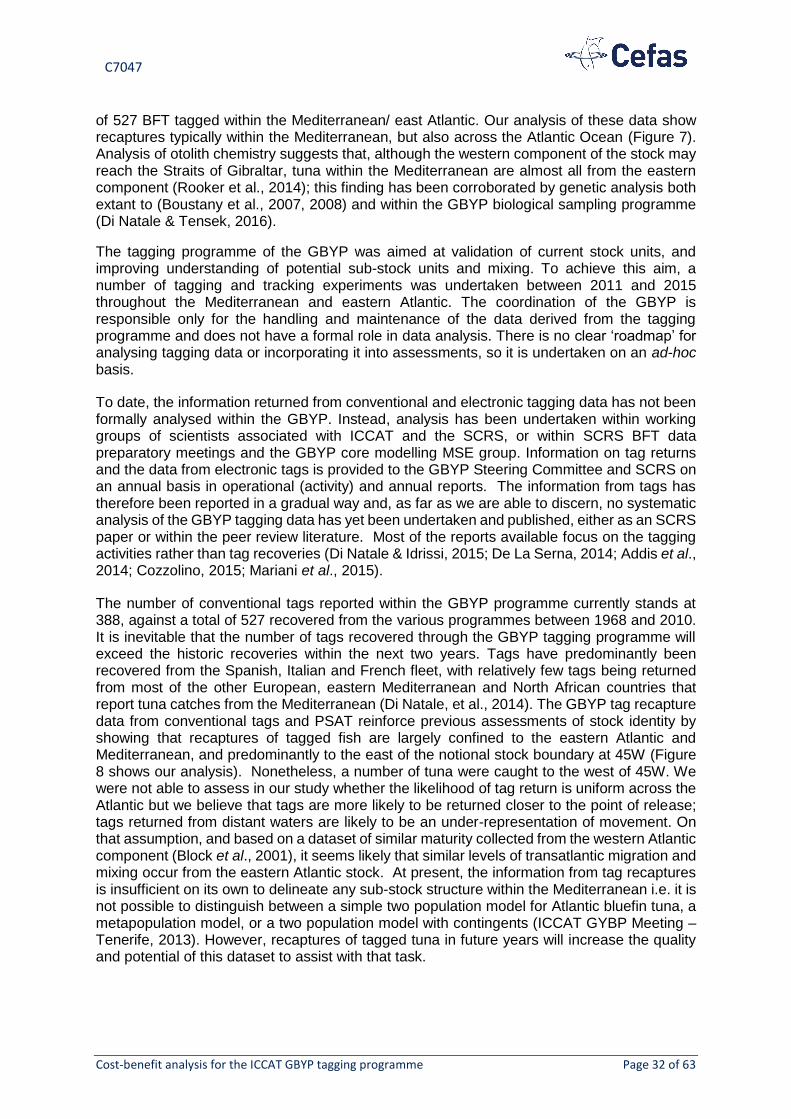
Figure 7. Release- recapture data of tuna tagged in the eastern Atlantic and Mediterranean (data from the
ICCAT tagging database)
ICCAT has assessed and managed ABFT as two distinct stocks since 1980 (Fromentin and Powers 2005). The division at the time was based on catch statistics, but a number of tagging studies have been undertaken, both before 1980 and since, that confirm this general hypothesis. For example, many bluefin tuna have been tagged on the eastern Atlantic coast and Mediterranean by traditional tags (Aloncle 1973; Arena and Li Greci, 1970; Brëthes, 1979 a & b; Brëthes and Mason, 1979; C.I.E.S.M., 1972; Cort,1990; Cort, et de la Serna, 1993; Hamre, 1963; Heldt, 1927; Lamboeuf, 1975; Mather, et al., 1973; Rey et Cort, 1986; Rodriguez-Roda, 1969-1980; Sella, 1929-1932; Vilela, 1960). More recent research has taken advantage of electronic tags to map the migrations and habitat use of ABFT from the time of release to the time of recapture or tag detachment (De Metrio et al., 2003). Block et al., (2005) provided a seminal assessment using data collected from 330 ABFT, and provided compelling evidence for the two-stock hypothesis, with separate spawning grounds for each population in the Gulf of Mexico (western stock) and the Mediterranean (eastern stock). Since then, efforts have focused on refining stock structure definitions and sub-stock structure. Historic tagging data (1980s to 2010) available from the ICCAT tagging database shows movements
C7047
Cost-benefit analysis for the ICCAT GBYP tagging programme Page 32 of 63
of 527 BFT tagged within the Mediterranean/ east Atlantic. Our analysis of these data show recaptures typically within the Mediterranean, but also across the Atlantic Ocean (Figure 7). Analysis of otolith chemistry suggests that, although the western component of the stock may reach the Straits of Gibraltar, tuna within the Mediterranean are almost all from the eastern component (Rooker et al., 2014); this finding has been corroborated by genetic analysis both extant to (Boustany et al., 2007, 2008) and within the GBYP biological sampling programme (Di Natale & Tensek, 2016).
The tagging programme of the GBYP was aimed at validation of current stock units, and improving understanding of potential sub-stock units and mixing. To achieve this aim, a number of tagging and tracking experiments was undertaken between 2011 and 2015 throughout the Mediterranean and eastern Atlantic. The coordination of the GBYP is responsible only for the handling and maintenance of the data derived from the tagging programme and does not have a formal role in data analysis. There is no clear ‘roadmap’ for analysing tagging data or incorporating it into assessments, so it is undertaken on an ad-hoc basis.
To date, the information returned from conventional and electronic tagging data has not been formally analysed within the GBYP. Instead, analysis has been undertaken within working groups of scientists associated with ICCAT and the SCRS, or within SCRS BFT data preparatory meetings and the GBYP core modelling MSE group. Information on tag returns and the data from electronic tags is provided to the GBYP Steering Committee and SCRS on an annual basis in operational (activity) and annual reports. The information from tags has therefore been reported in a gradual way and, as far as we are able to discern, no systematic analysis of the GBYP tagging data has yet been undertaken and published, either as an SCRS paper or within the peer review literature. Most of the reports available focus on the tagging activities rather than tag recoveries (Di Natale & Idrissi, 2015; De La Serna, 2014; Addis et al., 2014; Cozzolino, 2015; Mariani et al., 2015).
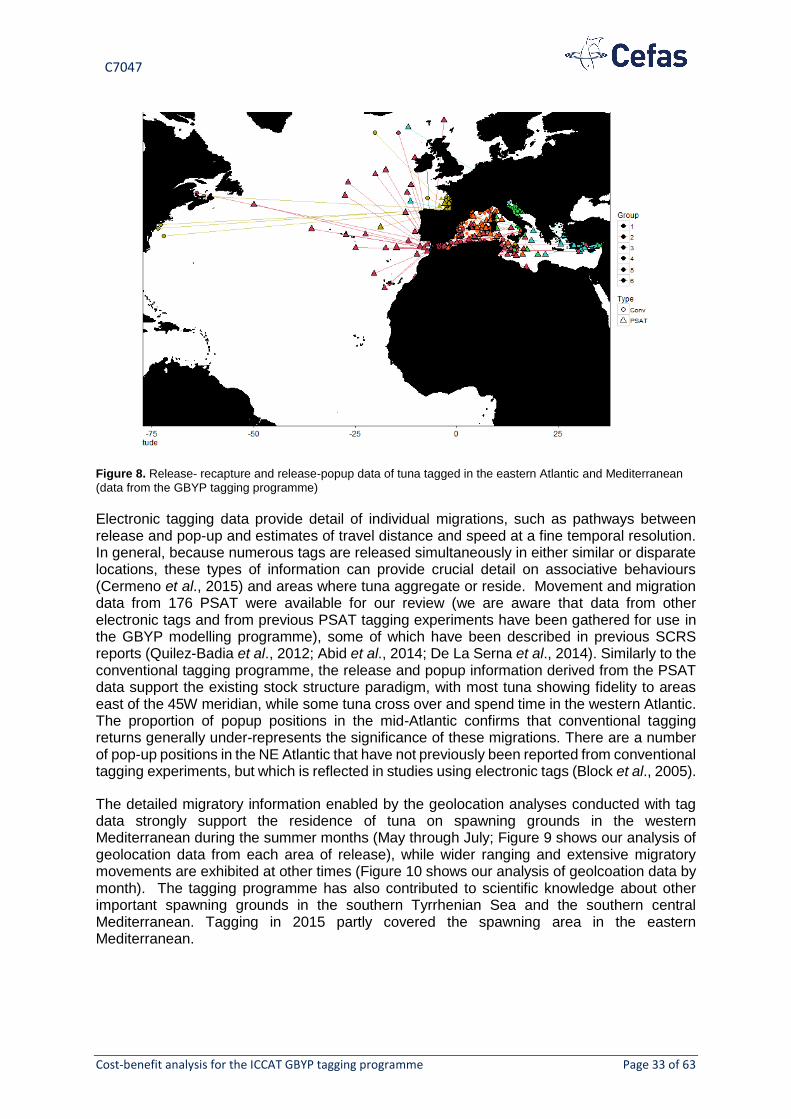
The number of conventional tags reported within the GBYP programme currently stands at 388, against a total of 527 recovered from the various programmes between 1968 and 2010. It is inevitable that the number of tags recovered through the GBYP tagging programme will exceed the historic recoveries within the next two years. Tags have predominantly been recovered from the Spanish, Italian and French fleet, with relatively few tags being returned from most of the other European, eastern Mediterranean and North African countries that report tuna catches from the Mediterranean (Di Natale, et al., 2014). The GBYP tag recapture data from conventional tags and PSAT reinforce previous assessments of stock identity by showing that recaptures of tagged fish are largely confined to the eastern Atlantic and Mediterranean, and predominantly to the east of the notional stock boundary at 45W (Figure 8 shows our analysis). Nonetheless, a number of tuna were caught to the west of 45W. We were not able to assess in our study whether the likelihood of tag return is uniform across the Atlantic but we believe that tags are more likely to be returned closer to the point of release; tags returned from distant waters are likely to be an under-representation of movement. On that assumption, and based on a dataset of similar maturity collected from the western Atlantic component (Block et al., 2001), it seems likely that similar levels of transatlantic migration and mixing occur from the eastern Atlantic stock. At present, the information from tag recaptures is insufficient on its own to delineate any sub-stock structure within the Mediterranean i.e. it is not possible to distinguish between a simple two population model for Atlantic bluefin tuna, a metapopulation model, or a two population model with contingents (ICCAT GYBP Meeting –Tenerife, 2013). However, recaptures of tagged tuna in future years will increase the quality and potential of this dataset to assist with that task.
C7047
Cost-benefit analysis for the ICCAT GBYP tagging programme Page 33 of 63
Figure 8. Release- recapture and release-popup data of tuna tagged in the eastern Atlantic and Mediterranean
(data from the GBYP tagging programme)
Electronic tagging data provide detail of individual migrations, such as pathways between release and pop-up and estimates of travel distance and speed at a fine temporal resolution. In general, because numerous tags are released simultaneously in either similar or disparate locations, these types of information can provide crucial detail on associative behaviours (Cermeno et al., 2015) and areas where tuna aggregate or reside. Movement and migration data from 176 PSAT were available for our review (we are aware that data from other electronic tags and from previous PSAT tagging experiments have been gathered for use in the GBYP modelling programme), some of which have been described in previous SCRS reports (Quilez-Badia et al., 2012; Abid et al., 2014; De La Serna et al., 2014). Similarly to the conventional tagging programme, the release and popup information derived from the PSAT data support the existing stock structure paradigm, with most tuna showing fidelity to areas east of the 45W meridian, while some tuna cross over and spend time in the western Atlantic. The proportion of popup positions in the mid-Atlantic confirms that conventional tagging returns generally under-represents the significance of these migrations. There are a number of pop-up positions in the NE Atlantic that have not previously been reported from conventional tagging experiments, but which is reflected in studies using electronic tags (Block et al., 2005).
The detailed migratory information enabled by the geolocation analyses conducted with tag data strongly support the residence of tuna on spawning grounds in the western Mediterranean during the summer months (May through July; Figure 9 shows our analysis of geolocation data from each area of release), while wider ranging and extensive migratory movements are exhibited at other times (Figure 10 shows our analysis of geolcoation data by month). The tagging programme has also contributed to scientific knowledge about other important spawning grounds in the southern Tyrrhenian Sea and the southern central Mediterranean. Tagging in 2015 partly covered the spawning area in the eastern Mediterranean.

C7047
Cost-benefit analysis for the ICCAT GBYP tagging programme Page 34 of 63
Figure 9. Migration paths of tuna tagged in the eastern Atlantic with electronic PSAT (data from the GBYP tagging
programme)

C7047
Cost-benefit analysis for the ICCAT GBYP tagging programme Page 35 of 63
Figure 10. Positions of PSAT tagged tuna returned from the GBYP tagging programme. Points are coloured by month, with warmer colours showing positions during the summer.

C7047
Cost-benefit analysis for the ICCAT GBYP tagging programme Page 36 of 63
A library of SCRS literature is growing that describes the migratory behaviour of tuna tagged in the Mediterrean. The data have been used to identify spawning areas (Quilez-Badia et al., 2012; Quilez-Badia et al., 2014), including some evidence that tuna may visit transient spawning areas in the Atlantic Ocean. These papers also provide evidence that there is mixing of the eastern and western components of the stock close to the Gibraltar Strait, suggesting that care needs to be taken when interpreting transatlantic movements; fish travelling to the west may have originated there. None of the analyses has shown that fish tagged in the Mediterranean spawning grounds travel to spawning grounds in the Gulf of Mexico (Abascal et al., 2016) although Arregi et al. (2015), show that tuna have an increased migratory range as they become older and larger. Future returns of implanted electronic tags are likely to yield further insights of this nature. Analyses of the data collected by tags attached to tuna in the eastern Mediterranean and Adriatic Sea have not yet been conducted within SCRS, although all data and maps were presented to SCRS in 2014 and 2015 (Di Natale and Idrissi, 2015; Di Natale and Tesek, 2016; Di Natale et al., 2016a).
At present, and despite the high quality of the database, there are no peer-reviewed analyses of the GBYP PSAT tagging programme that are associated with ICCAT. Some recent studies have been published independently of ICCAT that describe migrations and spawning stock structure (Cermeno et al., 2015; Aranda et al., 2013; Abascal et al., 2016) of tuna tagged in the Mediterranean, the Adriatic Sea and the straits of Gibraltar. In all these studies, the tagging evidence that the authors draw on is relatively limited compared with the data held by GBYP, with at most only a few tens of tags used in each analysis. Nonetheless, the conclusions drawn from these publications are helping to define the understanding of bluefin tuna spatial and spawning ecology (e.g. Fromentin & Loupozanski, 2013). While a formal and systematic analysis of all the GBYP tagging data remains elusive, there is a risk that the peer-reviewed studies and the understanding gleaned from them will transcend the analyses conducted within SCRS and the GBYP.
Overall, from our assessment of the conventional and electronic tagging data, the most significant aspects of the GBYP tagging data are validation of the movement of tuna between east and west Mediterranean, demonstrating stock mixing; tracking of the movement of pre-spawners from outside the Mediterranean to spawning area in the western Mediterranean, and beyond and transatlantic and northwards movements of tuna. However, to our knowledge, although a number of suggestions and recommendations have been made on the use of the GBYP tagging data (ICCAT GYBP Meeting –Tenerife, 2013; ICCAT BFT Data preparation meeting – Madrid 2015), these tagging data have yet to be formally incorporated in stock assessment, either to parameterise any population models, or to narrow the focus the assessment. In contrast, the tagging data are starting to be incorporated in the modelling MSE activity in the GBYP, which has been ongoing in parallel to the GBYP tagging programme. A recent SCRS paper (Galuardi et al., 2015) on using tagging data to develop transition matrices, which explicitly does not include data from the eastern stock, shows the potential for tagging data to make a significant contribution to assessment and management modelling. Based on work conducted in late 2015 (Carruthers et al., 2015a; 2015b), it would appear, that there will be significantly more use of the data in 2016, during the January 2016 MSE modelling process (ICCAT MSE modelling meeting, Monterey, January 2016 meeting presentations: Lauretta et al., 2015; Carruthers et al., 2016), and during the 2016 BFT data preparatory meeting in July 2016. We hope so and note here that more electronic tagging work will take place in 2016, and also that recaptures of conventionally tagged tuna are expected in future years to increase the quality and potential of this dataset. At present, the distributional knowledge gained from the tagging programme is only partially realising the benefits expected. Strengths and weaknesses are identified in Table 9.

C7047
Cost-benefit analysis for the ICCAT GBYP tagging programme Page 37 of 63
Knowledge of bluefin tuna distribution and movements Aim: Increase in knowledge
Constraints: Constrained by availability of data
Cost: Not applicable- undertaken in other subdivisions of GBYP programme
Benefit Evidence for realisation Strengths of GBYP Weaknesses or constraint
Validate current stock units
Current stock unit paradigm (E-W split at 45°W) tested
Database on E-W movements has been strengthened. Evidence that tuna move across Atlantic from Mediterrnean Scope for integrating data from other activities within GBYP (e.g. otolith microchemistry)
Tagged tuna partly not identified to stock of origin, so tagging data have less power than ideal. Electronic tagged tuna have been attributed by assumptions. Systematic analysis has not been undertaken
Improve knowledge on potential sub-stock units
Improved information on substock structure in Mediterranean available
Tagging programme has uncovered information about mixing in between east and west Mediterranean Fine-scale movement data from PSAT show range of migratory phenomena Scope for integrating data from other activities within GBYP (e.g. otolith microchemistry)
Not established if tuna stock contains resident and migratory components (i.e. stock shows partial migration) Simultaneous tagging experiments in different areas not undertaken Systematic analysis has not been undertaken
Identify movement patterns
Systematic analysis of movement of tunas undertaken
Fine-scale movement data from PSAT show range of migratory phenomena Experiments are reported on in a timely fashion on an annual basis to a wide SCRS and ICCAT audience
Systematic analysis has not been undertaken.
Identify spawning grounds
Spawning behaviour and periods identified within Mediterranean
PSAT data provide substantial information on the main spawning areas in in the Mediterranean. Some data on opportunistic spawning behaviour in other areas of the Mediterranean.
Dataset has not been assessed to address this topic
Data integration (conventional tag database)
Data is integrated and compared with historic records
Historic tagging work provides useful resource Dataset has not been assessed to address this topic
Table 9. Benefits, strengths and weaknesses of GBYP tagging data to increase knowledge of distribution

C7047
Cost-benefit analysis for the ICCAT GBYP tagging programme Page 38 of 63
Improvement of knowledge of bluefin tuna growth
Tagging studies can help to elucidate growth rate estimates because the size of a tagged and recaptured fish is known at two points in its life (Justel-Rubio et al., 2013). In conjunction with age data, estimates of growth at age can be derived. Turner and Restrepo, (1994) derived a growth rate curve for Atlantic bluefin tuna based on tagging data and size at age analysis that has been used ICCAT assessments, but recent advances in otolith analysis have superseded the use of tagging data for the purposes of estimating growth rate (see Ailloud et al., 2014). Nonetheless, the tagging data still have value in validating these more recent methods (Justel-Rubio & Ortiz, 2013; Justel et al., 2013). Most estimates of the growth of Atlantic bluefin tuna from tagging data have used the ICCAT historic tagging database, which contains records of tuna from both eastern and western stock components. The GBYP tagging data have the potential to allow an analysis of growth rate mostly the eastern component of the stock only.
The coordination team of the GBYP is responsible only for the handling and maintenance of the data derived from the tagging programme and does not have a formal role in data analysis. There is no clear ‘roadmap’ for analysing tagging data or incorporating it into assessments, so it is undertaken on an ad-hoc basis. Thus, to date, the length and weight information returned from conventional and electronic tagging data has not been formally analysed within the GBYP. The majority of effort to derive growth rates of tuna resides within the biological sampling programme of ICCAT, including within the GBYP. No systematic analysis of the growth information available from the GBYP tagging data has yet been undertaken and published, either as an SCRS paper or within the peer review literature.
Of 254 tag returns that we had available to analyse, only 118 contained information on release length, recapture length and time at liberty. Of these, 59 recaptured fish were from the target population (juvenile tunas < 1m in length at release). Both datasets suggest a growth rate of approximately 0.05cm per day, or ~18cm yr, which is consistent with estimates derived from age-length studies from similar aged fish in the GBYP biological sampling programme (Rodriguez-Marin et al., 2014).
Figure 9. Growth data from GBYP tag return data.
At present, we cannot find a published analysis of the growth data from the GBYP tagging programme, or any integration of the GBYP tagging programme data with historic tagging data. Recaptures of conventionally tagged tuna are expected in future years and will increase the quality and potential of this dataset. However, at present, the knowledge of growth gained from the tag programme is only partially realising the benefits hoped for from the programme. Strengths and weaknesses are identified in Table 10.
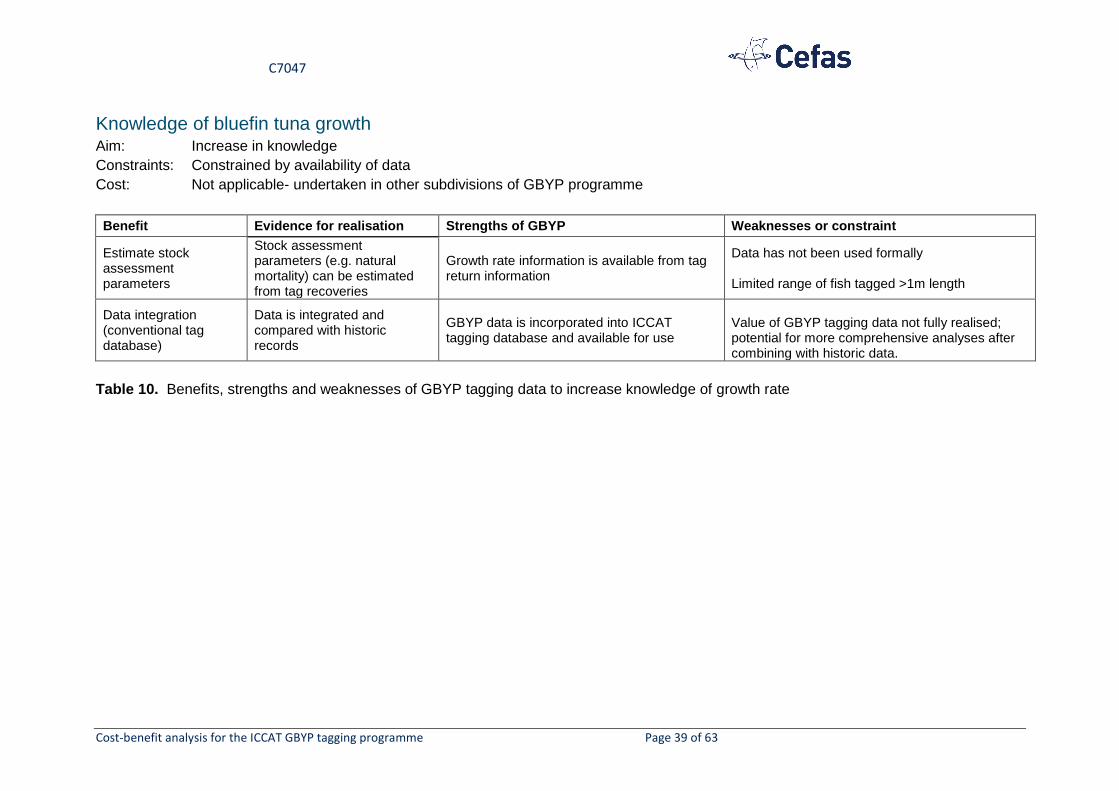
C7047
Cost-benefit analysis for the ICCAT GBYP tagging programme Page 39 of 63
Knowledge of bluefin tuna growth Aim: Increase in knowledge
Constraints: Constrained by availability of data
Cost: Not applicable- undertaken in other subdivisions of GBYP programme
Benefit Evidence for realisation Strengths of GBYP Weaknesses or constraint
Estimate stock assessment parameters
Stock assessment parameters (e.g. natural mortality) can be estimated from tag recoveries
Growth rate information is available from tag return information
Data has not been used formally Limited range of fish tagged >1m length
Data integration (conventional tag database)
Data is integrated and compared with historic records
GBYP data is incorporated into ICCAT tagging database and available for use
Value of GBYP tagging data not fully realised; potential for more comprehensive analyses after combining with historic data.
Table 10. Benefits, strengths and weaknesses of GBYP tagging data to increase knowledge of growth rate

C7047
Cost-benefit analysis for the ICCAT GBYP tagging programme Page 40 of 63
Improvement of knowledge of bluefin tuna habitat utilisation
Archived and transmitted time-series of depth and temperature from electronic tags can be used in many ways to determine the relationship between a tagged animal and its environment. One of the commonest uses for depth data from archival tags deployed on fish is the assessment of time at depth, which can then be used to assess accessibility to fishing or survey gears, or as indications of particular behaviours, such as spawning (Teo et al., 2007; Walli et al., 2009). In the case of ABFT, generating assessments of time spent visible at the surface during aerial surveys is a crucial component of developing a reliable index of abundance.
Electronic tagging data made available by ICCAT provide 176 datasets with an average length of 56d (range: 1 to 361d). For each dataset, an archived time-series of depth and temperature (at a five or 10 minute interval) is available from which to assess time at depth and diurnal patterns of behaviour. In addition, summary files providing assessment of time spent at depth* or temperature (*in a semi-logarithmic depth series) is available, assessed using near-continuous data measured, but not logged by the tag. These data can be used in conjunction with data from reconstructions of migration to map areas and times when tuna are close to the surface or when they experience particular environmental conditions.
To date, the information returned from GBYP electronic tags has not been formally analysed for stock assessment purposes. Instead, analysis has been undertaken within working groups of scientists associated with ICCAT and the SCRS, or within data preparatory meetings and the core modelling MSE group. Typically, analyses of a subset of the GBYP tagging data focus on a specific area of release. In general, these assessments tend to concentrate on the geographic movements of tuna, with relatively superficial examination of diving and time at depth data. The principal findings echo those of research on tuna of the western component ((Teo et al., 2007; Walli et al., 2009), in that tuna typically spend more time in surface waters at night, and that they are able to dive to great depths (>500m) during the day. However, this behaviour can be altered significantly during the spawning season. Quilez-Badia et al., (2014), SCRS/2014/184, report on areas of putative spawning based on the diving behaviour and thermal experience of tuna released in the central and western Mediterranean. Cermeno et al. (2015) report similar findings, showing that bounce diving and association with the thermocline appear to be key features of spawning, a finding also reported by others (Aranda et al., 2013, Abascal et al., 2016, Quilez-Badia et al., 2016). The results of these studies show that, for the purposes of tuning GBYP aerial survey estimates of spawning tuna abundance, time spent within surface waters (<10m) decreases signficantly after the spawning period in May and July, when surface orientation can reach up to 70% of the day. Our own preliminary analysis of the PSAT data provide similar findings for the full GBYP dataset, but also show surface orientation at locations not traditionally associated with spawning behaviour (Figure 11), primarily because the data collected from the eastern Mediterranean have not yet been analysed formally. The conceptual basis of aerial surveys, that spawning tuna aggregate near the water surface, is therefore in no doubt. However, the influence of diel diving behaviour on estimates of visibility to aerial survey will not be complete until the end of Phase 5. Our own preliminary analysis of the GBYP PSAT tagging data suggests that the variance of estimates is likely to increase (Figures 12 and 13) when the full dataset from PSAT tags is analysed in more detail.
In general, the data have great potential for further use in assessing the spawning areas and availability of tuna to assist with improving the aerial surveys. However, excepting Quilez-Badia et al., (2016), which is a preliminary work, the data have yet to be assessed formally for use in stock assessment. Further electronic tagging work will only improve the quality of this impressive dataset.

C7047
Cost-benefit analysis for the ICCAT GBYP tagging programme Page 41 of 63
Figure 11. Variation in the time spent at the surface by tuna tagged in the GBYP. Larger symbols indicate more time in the upper 10 m of the water column, and colours indicate
the month in which the observation was made.

C7047
Cost-benefit analysis for the ICCAT GBYP tagging programme Page 42 of 63
Figure 12. (left) The time spent by bluefin tuna within the upper 5m of the sea surface (left) and the upper 10m
(right) during the day plotted against time within those depth ranges over the full 24h period (i.e. includes night).
Data from the final 3d of the dataset, when the tag may be drifting before data communication takes place, have
been excluded. The grey line shows the 1:1 relationship.
Figure 13. Time spent by bluefin tuna within 5m of the sea surface by month. Numbers above each box indicate
the number of datasets used in the calculations.

C7047
Cost-benefit analysis for the ICCAT GBYP tagging programme Page 43 of 63
Knowledge of bluefin tuna habitat utilisation Aim: Increase in knowledge
Constraints: Constrained by availability of data
Cost: Not applicable- undertaken in other subdivisions of GBYP programme
Benefit Evidence for realisation Strengths of GBYP Weaknesses or constraint
Evaluate habitat-utilisation
Use of water column by tagged fish evaluated and described for use in aerial surveys
Initial analysis undertaken to provide method for tuning aerial surveys
More throrough analysis needed to take into account diurnal behaviours
Identify spawning grounds
Spawning behaviour and periods identified within Mediterranean
Data density during spawning period is high. Good potential for analysis.
Very limited analysis to date Methods used to identify spawning behaviour are assumption heavy. Few analyses have been undertaken to integrate larval survey data with behavioural data from tags.
Table 11. Benefits, strengths and weaknesses of GBYP tagging data to increase knowledge of habitat use

C7047
Cost-benefit analysis for the ICCAT GBYP tagging programme Page 44 of 63

C7047
Cost-benefit analysis for the ICCAT GBYP tagging programme Page 45 of 63
D3 Propose future strategies and improvements
As stated in the introduction, the GBYP tagging programme has the following operational objectives:
A Test and identify the most appropriate tagging approach for different areas and size of fish
B Test and identify the most resistant conventional tagging methodologies C Provide rewards and dedicated feedbacks for all tags reported D Improve tag recovery and reporting rates
To date, these objectives have been met, with significant achievements being:
A comprehensive Atlantic bluefin tagging programme that has succeeded in deploying nearly 25,000 tag on more than 16,000 tuna across a broad area of the Mediterranean and eastern Atlantic, despite significant logistic constraints; Development of an ABFT tuna tagging manual and incremental improvement of tagging techniques (both conventional tags and electronic tags) that provide confidence in the tag deployments and; Coordination of a tag awareness and return programme that has resulted in nearly 400 tags being returned over five years, representing a near doubling of the data available on eastern Atlantic and Mediterranean tuna.
The scientific objectives of the GBYP tagging programme were (Di Natale & Idrissi, 2015), with priorities (3 highest, 1 lowest) suggested by Fonteneau et al., 2014: :
1. Validation of current stock units, and improve knowledge on potential sub-stock units and mixing (Priority 3)
2. Estimate M and or Z by age/age-groups (Priority 2) 3. Estimate natural growth rates (Priority 2) 4. Estimate tag recovery rates by fishery, making use of the observer programmes in
the Mediterranean (Priority 2) 5. Evaluate habitat-utilisation, movement patterns, maturity-dependent distribution
and spawning-ground use of BFT from electronic tag data (Priority 1-3) We note that the objectives as currently stated are an evolution of those that were in place when the GBYP was originated. This evolution has occurred as a consequence of re-prioritisation of objectives as experience and know-how grew during the initial phases. Progress has been made against most of these objectives but, in our view, the data provided by the programme offer much greater potential for meeting the GBYP tagging programme objectives than is currently the case. Significant achievements are:
Recovery of nearly 400 tags from a wide range of fisheries within the Mediterranean that help to validate the current paradigm of eastern and western stock components; Recovery of ~180 datasets from electronic tags that provide evidence of the complexity and diversity of bluefin movements and behaviour within the Mediterranean and eastern Atlantic. Modelling and assessment frameworks that have been outside the GBYP tagging programme in readiness for use of the tagging data are effective. The uptake of tagging

C7047
Cost-benefit analysis for the ICCAT GBYP tagging programme Page 46 of 63
data into the assessments will help to identify the strengths and weaknesses of the tagging data, and to further refine the tagging programme.
Significant opportunities exist to:
Estimate, albeit with uncertainty, stock assessment parameters such as mortality and growth rates using data collected from conventional tags and test these against assumptions used in current stock assessment models; Interrogate the electronic tag data archive more thoroughly and systematically to ensure that the full value of these datasets is available to test the assumptions of stock assessments and stock assessment modelling frameworks; Bring the data collected through the GBYP tagging programme together more closely with data collected in the biological sampling of GBYP (e.g. otolith microconstituent analysis) so that a better understanding of growth and stock identify is achieved.
The GBYP is known globally as a significant scientific endeavour. The value of the programme in raising public awareness is very high. ICCAT should be applauded for embarking on the programme. The opportunity now is to build on what it has achieved already to ensure that maximum scientific value can be extracted from the existing data, and that maximum value is gained from future research endeavours. Based on our assessment of the achievements and benefits of the tagging programme so far, we can make a number of recommendations based on the long-term achievement of the high-level objectives. Fulfilment of these recommendations would help contribute towards the current SCRS strategic goals of communication (goal 4: improve communication of data to the scientific community), research (goal 2: acquire the necessary biological knowledge in tuna) and data collection (goal 3: other biological data)
R1: Undertake a comprehensive and systematic analysis of all tagging data returned to date There is now a significant database of ABFT movements available for the eastern component of the stock, but it has not been systematically analysed or published in either the SCRS or the formal peer-review literature. Some of the results from electronic tagging experiments have been published, but this has been done sporadically and often with no formal acknowledgement of ICCAT’s role in the research. Although the data are being worked with in relation to SCRS activities by Dr Lauretta of NOAA, wider analysis and publication of the data in the scientific literature would be of benefit to ICCAT and would raise the profile of ICCAT assessment science for ABFT. As a minimum, we suggest that:
GBYP conventional tagging data should be integrated with data collected from historic tagging programmes and an assessment undertaken of growth and mortality rates. The outcomes of this analysis should be cross-validated against assumptions of growth and mortality used in assessments, and against results derived from biological sampling programme. Comparison of GBYP tag (both conventional and electronic) recovery locations and rates should be compared to available knowledge on the distribution and effort of Mediterranean and Atlantic fisheries. The potential for adjusting the design approach in light of a fuller analysis of historical tag returns alongside covariate info (location,

C7047
Cost-benefit analysis for the ICCAT GBYP tagging programme Page 47 of 63
size, fishery etc.) should be examined. The outcomes of this analysis should be used to determine the relative power of tag returns from different locations and to identify areas where future conventional tagging effort might be worthwhile, and areas where fisheries independent methods are more suitable. Undertake a comprehensive analysis of the migration data available from electronic tags deployed on ABFT, ideally incorporating electronic tag data archives from previous ABFT tagging experiments in the eastern Atlantic and Mediterranean in the last 15 years. The outcome of this analysis would be the development of spatial/regional transition matrices (e.g. using TagSim, Galuardi et al., 2015), providing information on whether certain regions are associated with greater transience or residence, helping to guide future tagging efforts to examine any hypothetical substock mixing within the Mediterranean, or on long-distance migrations into the Atlantic. Ideally, this activity would be combined with a reanalysis of the estimated migration paths of ABFT tagged with electronic tags using a model ensemble approach to enable improved estimates of spatial uncertainty. The outcome of this analysis would provide a better dataset for use in ABFT MSE.
Undertake a comprehensive analysis of the time-series data available from electronic tags, ideally using electronic tag data archives from previous ABFT tagging experiments in the eastern Atlantic and Mediterranean. The outcome of this analysis would be a behavioural classification for vertical and habitat selection behaviour in relation to potential spawning events and aerial survey spotting (e.g. Scutt-Phillips et al., 2015).
Undertake an assessment of the effect of tagging based on time-series of depth from electronic tag data. The outcome of this analysis would help to guide future procurement activities and tagging strategies for tuna of varying sizes.
In general, analyses should be undertaken in the context of all the other biological
studies undertaken in GBYP, if possible, i.e. biological sampling, genetics and even
aerial surveys. Ideally, the data should also be brought together with scientific findings
from the US NOAA programme on ABFT either during or after the analysis to ensure
that a greater understanding of ABFT in its entirety is developed.
Note that the following activity was recommended in the GBYP mid-term review:
A comprehensive synthesis of all information on BFT movements/migrations in the Atlantic Ocean and the Mediterranean Sea, using all data available, would, in the opinion of the review team, be very useful in terms of GBYP communications on the topic and help to stimulate the further development of this or the establishment of other mixing models (this subject was discussed at the Tenerife 2013 WG meeting).
The estimated cost of undertaking the suggested analytical activities is difficult to assess, since the analyses could be achieved in different ways, over different time-scales and with different levels of integration. We suggest that a 12 to 18 month programme of work by a well qualified team of fisheries scientists could cost in the region of €300k.
R2: Long-term planning for the next stage of the GBYP The GBYP programme is due for consideration for renewal into a second stage for the period after the first stage 2010-2017) closes with a sixth phase in 2017 (ICCAT GBYP Steering Committee, (2015). Our assessment of the GBYP tagging programme is that a significant

C7047
Cost-benefit analysis for the ICCAT GBYP tagging programme Page 48 of 63
operational success has been achieved, but the scientific benefits from the programme are yet to be achieved in full. Although we have only looked at the use of tagging data collected by the GBYP programme, recommendations made in the mid-term review of GBYP suggest that this is not isolated to the tagging programme. ICCAT needs to be firmer in its determination to improve this situation. Without improving the use of the very valuable data collected in the GBYP, its value as an exemplary scientific programme in support of fisheries management is diminished. From our perspective, the value that tagging alone can have in raising understanding and awareness of the dynamics of (highly migratory) stocks such as tuna is high because of the natural interest in fish movements and migrations shown by stakeholders. A good, cost-effective tagging programme that addresses the current uncertainties in ABFT stock distributions and mixing will help to show that the assessment and modelling science undertaken within SCRS and ICCAT is of a high standard.
This, however, requires a better integration of data collection and data use. The coordination of the GBYP is responsible only for the handling and maintenance of the data derived from the tagging programme and GYBP coordination does not have a formal role in data analysis. Because the programme runs year to year, there is no clear ‘roadmap’ or requirement for analysing tagging data (or other data collected in the GBYP) or incorporating it into assessments, so it is undertaken on an ad-hoc or piecemeal basis. The GBYP coordination team needs to be given greater ability to ensure that the scientific aims of the GBYP are providing the back up to the management and assessment of ABFT that the programme was designed to achieve. Additional and fascinating biological knowledge gained as a consequence of the main goals of growth rate calculation, stock integrity/mixing, mortality calculations by age, etc. will also undoubtedly be achieved.
The estimated cost of undertaking the suggested coordination and management activities is difficult to assess, since the recommendation could be achieved in different ways. Based on increasing the current costs of the GBYP coordination activities by 20% to 30%, the cost of this activity might reach €40k to €80k per year.
R3: Modify the GBYP tagging and sampling design and move, largely, to fishery independent data retrieval The conventional tagging programme in GBYP cost close to €3million. To date, there are nearly 400 returns of tags (1.7%), and probably a similar number more can be expected in the coming years. In contrast, 234 electronic tags were deployed, and nearly 180 datasets (80%) have been recovered, with more datasets still being processed by CLS (the company that is contracted to process the satellite tag data). The cost of deploying electronic tags is higher, per unit, but with a much greater probability of retrieving the data. If the primary interest is in migrations and movements, there is no comparison between the two techniques; electronic tags provide better and more reliable data. In addition, there are doubts within the ICCAT assessment community that conventional tagging data can provide useful information within the context of an MSE, with the focus shifting to sole use of data from electronic tags. We note that the GBYP mid term review (Fonteneau et al., 2014) recommended:
Establishment of a large-scale electronic tagging programme for Atlantic BFT The EU has since 2000 supported and funded such programmes for at least cod (code-named CODYSSEY) and European eel (code-named EELIAD). Such a programme would be of clear interest for Atlantic BFT, because the research output is virtually totally independent of fisheries. A large-scale multi-year electronic tagging programme conducted at the scale of the whole BFT population can be planned best by the GBYP and the SCRS. Such a programme should, however, be conducted under the auspices of the GBYP and led by both

C7047
Cost-benefit analysis for the ICCAT GBYP tagging programme Page 49 of 63
ICCAT-associated and experienced independent scientists, but likely seeking alternative sources of funds (e.g. from the US, the EU, Japan and elsewhere).
The rationale, now that the electronic tagging programme of GBYP has begun and provided significant evidence of success, is even more compelling. Consider too that the GBYP conventional tagging programme, although fulfilling its operational objectives, will not provide the data richness or quality to provide precision estimates of growth and mortality, nor metier specific reporting rates. In the future then, we suggest that all GBYP future tagging activities within GBYP are focussed fully on electronic tagging. The outcome of R1 (comprehensive analysis of all GBYP tagging data) will identify the areas and techniques that are most likely to succeed in reducing uncertainty in assessment operating models, or in the stock assessments. For example, simultaneous releases of electronic tags in various parts of Mediterranean would be needed to assess residency and partial migration. Part of the work we suggest now would be to review alternative tagging technologies to ensure that the most cost-effective methods are used. New technologies are becoming available that provide different types of information, and lower cost technologies such as the mark-recapture PSAT are able to provide basic migration data at very low cost (€1000 per tag, including communication), as well as providing the opportunity to tag smaller tuna (<1m length). At the same time, advanced technologies are becoming available that allow data retrieval in different ways e.g. through boat-mounted receivers These technologies, i, might be particularly useful for retrieving data from short-deployment tags used during e.g. the spawning season. Additional effort could be spent exploring the potential for acoustic tagging and acoustic receiver arrays. The Straits of Gibraltar have long been a target for researchers interested in movement of animals into the Mediterranean, and collaboration between GBYP and the Ocean Tracking Network (OTN) will be necessary to make progress. Tagging studies often provide detailed data at a fine temporal scale, but the opportunity for long-term deployments is currently limited by the longevity of current technology. It is therefore necessary to adopt a multi-disciplinary approach. Other methods for fishery independent sampling and population assessment are genetic tagging and otolith/scale or spine microchemistry are now routinely available, or have recently become so. The potential offered by close-kin tagging is currently the subject of a GBYP scoping review due to report early in 2016. Additional techniques, such as the eDNA barcoding approach, may be viable tools for determining population mixing on spawning grounds, for example. In-situ or mobile sequencers are close to becoming commercially available (e.g. MBARI genetic sequencer) that could offer almost real-time population sequencing data. These techniques are powerful in their own right, but in combination with tagging and migration studies, their power is considerably increased. This recommendation does beg the question of the future of conventional tagging programmes within the eastern Atlantic and Mediterranean. This topic is beyond the scope of the review work we present here, but two possible avenues are suggested. First, that GBYP continue to engage effectively with the sport and recreational fishing industry to bring greater cohesion and effectiveness to ad-hoc tagging campaigns. Second, a programme of observer-led tagging (as currently operates within toothfish fisheries in the southern Atlantic, coordinated by CCAMLR) may be an effective route to success. The estimated cost of undertaking a wide-scale electronic tagging programme is considerable. We suggest that, as an example, 500 PSAT tags (€4,000 each) should be deployed in a five-year programme. This would enable recovery of data on a similar scale and quality to that of similar tagging programmes undertaken on the western component of the stock. In addition, we recommend deployment of 500 archival tags (€1000each) and, for areas where tagging return rates are known to be low, 500 mark-report tags (€1,000 each). Deployment costs are

C7047
Cost-benefit analysis for the ICCAT GBYP tagging programme Page 50 of 63
clearly variable, but a unit cost per deployment of €1000 to €2000 seems reasonable based on GBYP expenditure. A tagging programme could therefore be implemented for between €4.5 million to €6 million. This estimate does not take into account the costs of data analysis (€variable, depending on design) or integration with other sampling and assessment programmes, since these could be configured in different ways for different levels of expenditure. A lower cost programme could be achieved with a different configuration of tags or objectives.
R4: Improve awareness of tagging programme though coordinated campaign of peer-review, popular articles, social media One of the five pillars of the SCRS strategy is ‘Dialogue and communication’. The goals of this pillar provide a number of goals to improve communication between a wide range of stakeholders, from scientists to fishers and the general public. From our perspective, the value that tagging alone can have in raising understanding and awareness of the dynamics of (highly migratory) stocks such as tuna is valuable and relatively easily achievable. To date, the awareness programme of the GBYP has focussed only on tag returns, rather than the benefits achieved by the programme. However, the high quality of the work undertaken in the GBYP tagging programme is ideally suited to wider dissemination and is of wide interest to a number of audiences. By raising awareness of the importance of the research within the scientific community, CPCs, RFMOs and the general public/ fishers, the role of the GBYP in improving ABFT stock assessments and management advice will become more widely understood and so support for the programme will increase.
We have not estimated the cost of this recommendation.

C7047
Cost-benefit analysis for the ICCAT GBYP tagging programme Page 51 of 63
References
Abascal F.J., Medina A., De La Serna, J.M., Godoy D. and Aranda G. (2016). Tracking bluefin
tuna reproductive migration into the Mediterranean Sea with electronic pop-up satellite
archival tags using two tagging procedures. Fisheries Oceanography, 25: 54–66.
Abid N., Talbaoui M., Benchoucha S., El Arraf S., El Fanichi C., Quílez-Badia G., Tudela S.,
Rodríguez López N. A., Cermeño P., Shillinger G., Benmoussa K., Benbari S., (2014). Tagging
of Bluefin tuna in the Moroccan Atlantic trap "Essahel” in 2013: Methodology and preliminary
results. SCRS/2013/196, Collect. Vol. Sci. Pap. ICCAT, 70(2): 663-672.
Addis P., Secci M., Sabatini A., Palmas F., Culurgioni J., Pasquini V. and Cau A.,
(2014).Conventional tagging of bluefin tunas in the trap fishery of Sardinia (W Mediterranean):
A critical review. SCRS/2013/180, Collect. Vol. Sci. Pap. ICCAT, 70(2): 585-591 (2014).
Ailloud L.E., Lauretta M.V., Hoenig J.M., Walter J.F. and Fonteneau A., (2014). Growth of
Atlantic Bluefin tuna determined from the ICCAT tagging database: A reconsideration of
methods. SCRS/2013/093, Collect. Vol. Sci. Pap. ICCAT, 70(2): 380-393 (2014).
Anon., (2014). Report of the 1st Meeting of ICCAT GBYP Core Modelling Group, 1-14
December 2014. [Document “GBYP MSE COORD.MEETING REPORT 2014.pdf”
downloaded from http://www.iccat.int/GBYP/en/modelling.htm on 02/02/2016.]
Aranda G., Abascal F.J., Varela J.L., and Medina A., (2013). Spawning Behaviour and Post-
Spawning Migration Patterns of Atlantic Bluefin Tuna (Thunnus thynnus) Ascertained from
Satellite Archival Tags. PLoS ONE 8(10): e76445. doi:10.1371/journal.pone.0076445
Arregui I., Galuardi B., Goñi N., Arrizabalaga H., Lam C.H., Fraile I., Santiago J.and Lutcavage
M.E. (In prep). Movements and geographic distribution of juvenile bluefin tunas in the north
Atlantic, described through electronic tags. SCRS/2015/044. DO NOT CITE
Arena P. and Li Greci F., (1970). Marquage de thonidés en Mer Tyrrhénienne. Journées
ichotyol 115-119. Rome, CIESM.
Arena P., (1980). Observation aeriennes sur la distribution et le comportement du Thon rouge,
Thunnus thynnus (L.), de la Mer Tyrrhenienne. XXVII Congr. Assem. Plen. CIESM, Cagliari.

C7047
Cost-benefit analysis for the ICCAT GBYP tagging programme Page 52 of 63
Belda E., Estruch V., and Cort J.L., (2011). Tagging design for the Atlantic-wide research
programme for bluefin tuna (ICCAT -GBYP). ICCAT report:
http://www.iccat.int/GBYP/Documents/TAGGING/PHASE%201/Annex%201.%20Tag%20de
sign%20report_fin_rev.pdf
Block B.A., Dewar H., Blackwell S.B., Williams T.D., Prince E.D., Farwell C.J., Boustany A.,
Teo S.L.H., Seitz A., Walli A. and Fudge D., (2001). "Migratory movements, depth preferences,
and thermal biology of Atlantic bluefin tuna." Science 293(5533): 1310-1314.
Block B.A., Teo S.L.H., Walli A., Boustany A., Stokesbury M.J.W., Farwell C.J., Weng K.C,
Dewar H. and Williams T.D., (2005). Electronic tagging and population structure of Atlantic
bluefin tuna. Letters to Nature, Nature 434, 1121-1127.
Brëthes J.C. (1979a). Essai d’estimation d’une prise par unité d’effort pour la pêcherie de
surface au thon rouge à Casablanca. ICCAT, Colec. Doc. Cient. 8(2): 377-380.
Brëthes J.C. (1979b). On the first catches of tagged bluefin tuna in July 1977 in Moroccan
waters. Collect. Vol. Sci. Pap. ICCAT, 8(2): 367-369.
Brëthes J.C. and Mason J.M. Jr., (1979). Bluefin tuna tagging off the Atlantic coast of Morocco
in 1978. Collect. Vol. Sci. Pap. ICCAT, 8(2): 329-332.
Boustany A.M., Reeb C.A., Teo S.L.H., De Metrio G., and Block B.A., (2007). Genetic data
and electronic tagging indicate that the Gulf of Mexico and the Mediterranean Sea are
reproductively isolated stocks of Bluefin tuna (Thunnus thynnus). SCRS/2006/089, Col. Vol.
Sci. Pap. ICCAT, 60(4): 1154-1159.
Boustany A.M., Reeb C.A., and Block B.A., (2008). Mitochondrial DNA and electronic tracking
reveal population structure of Atlantic bluefin tuna (Thunnus thynnus). Mar. Biol. 156:13–24.
Butterworth D.S. and Rademeyer R.A., (2013). A comparison of initial statistical catch-at-age
and catch-at-length assessments of Eastern Atlantic Bluefin tuna. Collect. Vol. Sci. Pap.
ICCAT, 69(2): 710-741.

C7047
Cost-benefit analysis for the ICCAT GBYP tagging programme Page 53 of 63
Butterworth D.S. and Rademeyer R.A., (2015). An updated statistical catch-at-length
assessment for Eastern Atlantic Bluefin tuna. Collect. Vol. Sci. Pap. ICCAT, 71(4): 1639-1659.
Carruthers T.R. and McAllister M.K. (2010). Quantifying tag reporting rates for Atlantic tuna
fleets using coincidental tag returns. Aquat. Living Resour. 23: 343–352
Carruthers T., Power J.E., Lauretta M.V., Di Natale A. and Kell L., (2015a). A summary of data
to inform operating models in management strategy evaluation of Atlantic bluefin tuna.
SCRS/2015/180: 12pp.
Carruthers T., Kimoto A., Powers J.E., Kell L., Butterworth D.S., Lauretta M.V. and Kitakado
T., (2015b). Structure and estimation framework for Atlantic bluefin tuna operating models.
SCRS/2015/179: 13pp.
Carruthers T., et al., (2016). Towards a management strategy evaluation approach for Atlantic
bluefin tuna. Presentation at MSE meeting, January 2016.
Cermeño P., Quílez-Badia G., Ospina-Alvarez A., Sainz-Trápaga S., Boustany A.M., Seitz
AC., Tudela S., and Block, B.A. (2015). Electronic Tagging of Atlantic Bluefin Tuna (Thunnus
thynnus, L.) Reveals Habitat Use and Behaviors in the Mediterranean Sea. PLoS ONE 10 (2):
e0116638.doi:10.1371/journal.pone.0116638.
C.I.E.S.M. (1972): Raport d'activités.
COFREPECHE-OCEANIS, (2010-2011). Tag awareness programme:
http://www.cofrepeche.fr/reference.php?num_continent=5&action=rechercher&relation=and
&PHPSESSID=fcee91e08ce76e1fa933cc4fba2f7475#result.
COFREPECHE, (2014) Tag awareness programme –Final report, 15 September 2014: ICCAT
GBYP 01/2014, Field tag awareness activities. COFREPECHE on behalf of the Consortium:
124 p.
Cort J.L. (1990). Biología y pesca del atún rojo, Thunnus thynnus (L.) del Mar Cantábrico.

C7047
Cost-benefit analysis for the ICCAT GBYP tagging programme Page 54 of 63
Cort J.L. and De La Serna J.M., (1994). Revision of tag/recapture of bluefin tuna (Thunnus
thynnus, L.) in the East Atlantic and the Mediterranean. Collect. Vol. Sci. Pap. ICCAT, 42(1):
255-259.
Cort J.L., Abascal F., Belda E., Bello G., Deflorio M., De La Serna J.M., Estruch V., Godoy D.,
and Velasco M., (2011). ABFT Tagging manual for the Atlantic-wide research programme for
bluefin tuna (ICCAT-GBYP). SCRS/2011/153.
http://www.iccat.int/GBYP/Documents/TAGGING/PUBLICATIONS/SCRS-11-
153_GBYP_Tagging_Manual.pdf
Cozzolino G., Pignalosa P., and Lombardo F., (2015). Bluefin tuna (Thunnus thynnus)
experimental tagging activity by new applicator (SMAT) and biometric date survey by a
synchronized scuba-video taping system, Malta Channel- Portoscuso Sardinia.
SCRS/2014/139.
De La Serna J.M., Godoy D., Belda E., Sanchez R., Majuelos E., Sanchez R., and Mengual
J., Saber S., and Muñoz P., (2014). Campaña de marcado convencional y electrónico de atún
rojo realizada en el estrecho de Gibraltar segú el diseño adoptado por el programa de
investigación GBYP-ICCAT Y desarrollado en el “tagging GBYP-ICCAT 4ª fase, 2013”.
SCRS/2014/136.
De La Serna J.M., Godoy D., Belda E., Sanchez R., Majuelos E., (2014). ANÁLISIS DE LOS
Resultados de las campañas de marcado de atún rojo (Thunnus thynnus) del “TAGGING
GBYP-ICCAT 3ª fase, realizadas en el Golfo de León y Estrecho of Gibraltar durante 2011-
2012. SCRS/2013/172, Collect. Vol. Sci. Pap. ICCAT, 70(2): 537-542 (2014).
De Metrio G., Arnold G.P., De La Serna J.M., Megalofonou P., Sylos Labini G., Deflorio M.,
Buckley A., Cort J.L., Yannopoulos C. and Pappalepore M., (2003). Movements and
migrations of North Atlantic Bluefin tuna tagged with pop-up satellite tags. Spedicato, M.T.;
Lembo, G.; Marmulla, G. (eds.); Aquatic telemetry: advances and applications. Proceedings
of the Fifth Conference on Fish Telemetry held in Europe. Ustica, Italy, 9-13 June 2003. Rome,
FAO/COISPA. 2005. 295p.
Di Natale A., and Idrissi M., (2012). 2011 ICCAT Atlantic-wide research programme for Bluefin
Tuna (GBYP) - Coordination detailed activity report for Phase 2. Section 5.6, SCRS/2011/166,
Collect. Vol. Sci. Pap. ICCAT, 68(1): 176-207 (2012).

C7047
Cost-benefit analysis for the ICCAT GBYP tagging programme Page 55 of 63
Di Natale A., Idrissi M., and Justel-Rubio A., (2014). ICCAT-GBYP Tag recovery activities up
to September 2013. SCRS/2013/177 Collect. Vol. Sci. Pap. ICCAT, 70(2): 556-564.
Di Natale A., and Idrissi M., (2015). Review of the ICCAT GBYP tagging activities 2010-2014.
SCRS/2014/048, Collect. Vol. Sci. Pap. ICCAT, 71(3): 1125-1143. (NB: Errata in report; title
should be: ‘2010-2014’ not ‘2001-2014’).
Di Natale A., (2015). ICCAT Atlantic-wide programme for Bluefin Tuna (GBYP). Activity Report
for Phase 4 (2013-2014). SCRS/2014/051, Collect. Vol. Sci. Pap. ICCAT, 71(3): 1174-1214.
Di Natale A., and Tensek S., (2016). ICCAT Atlantic-wide research programme for Bluefin
Tuna - (GBYP) Activity report for the last part of phase 4 and the first part of phase 5 (2014-
2015). SCRS/2015/144, (Collect. Vol. Sci. Pap. ICCAT, ??(?): ???-??? (2016)).
Di Natale A., Tensek S., and Pagá García A., (2016a). Preliminary information about the
ICCAT GBYP tagging activities in Pahse 5. SCRS/2015/149, (Collect. Vol. Sci. Pap. ICCAT,
??(?): ???-??? (2016)).
Di Natale A., Tensek S., and Pagá García A., (2016b). 2015: is the Bluefin tuna facing another
2003?. SCRS/2015/154, (Collect. Vol. Sci. Pap. ICCAT, ??(?): ???-??? (2016)).
Etienne M.-P., Carruthers T. and McAllister M., (2014). Report for ICCAT-GBYP 04/2013:
36pp.
Fromentin J-M., and Lopuszanski D., (2013). Migration, residency, and homing of bluefin tuna
in the western Mediterranean Sea. ICES Journal of Marine Science,
doi:10.1093/icesjms/fst157.
Fonteneau A., Suzuki Z., and Payne A.I.L., (2014). Mid-term review of the ICCAT Atlantic-
wide research programme on Bluefin Tuna (ICCAT/GBYP Phase 4–2013). SCRS/2013/178,
Collect. Vol. Sci. Pap. ICCAT, 70(2): 565-584 (2014).
Galuardi B., Cadrin S.X., Kerr L., Miller T.J., and Lutcavage M., (2015). Using electronic tag
data to provide transition matrices for movement inclusive population models.
SCRS/2014/177.

C7047
Cost-benefit analysis for the ICCAT GBYP tagging programme Page 56 of 63
Hampton, J. (1997). Estimates of tag-reporting and tag-shedding rates in a large-scale tuna
tagging experiment in the western tropical Pacific Ocean. Oceanographic Literature
Review, 11(44), 1346.
Hamre J., and Tiews K., (1963). Second Report of the Bluefin Tuna Working Group. ICES,
C.M. 1963, Scombriform Fish Committee, N. 14, 29 p.
Heldt H., (1927). Le thon rouge Thunnus thynnus (L.), mise á jour de nos connaissances sur
ce sujet. Bulletin Station Océanographique de Salammbô, Tunisia 7: 1-24.
Hilborn R. and Walters C.J., (1992). Quantitative Fisheries Stock Assessment: Choice,
Dynamics and Uncertainty. Kluwer Academic Publishers: xv+570pp.
Justel A., Di Natale A., Idrissi M., Kell L.T., (2013). An exploratory data analysis of historical
growth data recovered under GBYP. SCRS/2012/038, Collect. Vol. Sci. Pap. ICCAT, 69(1):
210-220.
Justel-Rubio A., and Ortiz M., (2013). Review and preliminary analyses of size frequency
samples of bluefin tuna (Thunnus thynnus) 1952-2010. Collect. Vol. Sci. Pap. ICCAT, 69(2):
297-330.
Justel-Rubio A., Ortiz M., Parrilla A., Idrissi M., and Di Natale A. (2014). Preliminary review of
ICCAT bluefin tuna conventional tagging database. SCRS/2013/078, Collect. Vol. Sci. Pap.
ICCAT, 70(2): 299-320.
ICCAT BFT Data preparation meeting – Madrid 2014. Report of the 2014 ICCAT Bluefin Tuna
Data Preparatory meeting, (Madrid, Spain – 5-10 May, 2014)
https://www.iccat.int/Documents/Meetings/Docs/BFT_DATA_PREP_REP_2014_ENG.pdf
ICCAT BFT Data preparation meeting – Madrid 2015. Report of the 2015 ICCAT Bluefin Tuna
Data Preparatory meeting, (Madrid, Spain – 2-6 March, 2015)
https://www.iccat.int/Documents/Meetings/Docs/BFT_DATA_PREP_2015_eng.pdf
ICCAT GYBP Meeting –Tenerife. On modelling approaches, 14-16 May 2013 Tenerife
(Spain). Reports from the Ad-Hoc GBYP Drafting Group Tenerife May 2013.
C7047
Cost-benefit analysis for the ICCAT GBYP tagging programme Page 57 of 63
http://www.iccat.int/GBYP/Documents/MODELLING/PHASE%204/tenerife_Modelling.pdf
and http://www.iccat.int/GBYP/Documents/MODELLING/PHASE%204/Tenerife_gbyp-
modelling_draft_proposal.pdf)
ICCAT GBYP Steering Committee, (2010). Atlantic-wide research programme for Bluefin
Tuna (GBYP) - GBYP Steering Committee meeting, Madrid, 4‐5 September 2010.
http://www.iccat.int/GBYP/Documents/STEERING/GBYP_STEERING_COMMITTEE_MEETI
NG_REPORT.pdf
ICCAT GBYP Steering Committee, (2011). Atlantic-wide research programme for Bluefin
Tuna (GBYP). Report of the meeting of the GBYP Steering Committee, Madrid, June 27-29
and July 1, 2011.
http://www.iccat.int/GBYP/Documents/STEERING/GBYP_STEERING%20COM_REPORT_J
ULY_2011.pdf
ICCAT GBYP Steering Committee, (2015). Time to plan for the future of GBYP.
SCRS/2014/194, Collect. Vol. Sci. Pap. ICCAT, 71(4): 1843-1853 (2015).
ICCAT GBYP Annual Report (2011). Atlantic-wide research programme for Bluefin Tuna
(ICCAT/GBYP Phase 1) - Annual Report 2009‐2010.
http://www.iccat.int/GBYP/Documents/RESEARCH/GBYP-ANNUAL-REPORT-PHASE-1.pdf
ICCAT GBYP Annual Report (2012). Atlantic-wide research programme for Bluefin Tuna
(ICCAT/GBYP Phase 2) - Deliverable “All tasks.2” - GBYP Scientific and Technical Preliminary
Final Report for Phase 2 activities.
http://www.iccat.int/GBYP/Documents/RESEARCH/GBYP-ANNUAL-REPORT-PHASE-2.pdf
ICCAT GBYP Annual Report (2013). Atlantic-wide research programme for Bluefin Tuna
(ICCAT/GBYP Phase 3) - Annual Report. GBYP Scientific and technical preliminary final
report for Phase 3 activities. http://www.iccat.int/GBYP/Documents/RESEARCH/GBYP-
ANNUAL-REPORT-PHASE-3.pdf
ICCAT GBYP Annual Report (2015). Atlantic-wide research programme for Bluefin Tuna
(ICCAT/GBYP Phase 4) - GBYP Scientific and technical final report for Phase 4.
http://www.iccat.int/GBYP/Documents/RESEARCH/GBYP%20PHASE4%20FINAL%20REP
ORT.pdf

C7047
Cost-benefit analysis for the ICCAT GBYP tagging programme Page 58 of 63
Justel-Rubio A., Ortiz M., Parrilla A., Idrissi M., and Di Natale A., (2014). Preliminary review of
ICCAT bluefin tuna conventional tagging database. SCRS/2013/078, Collect. Vol. Sci. Pap.
ICCAT, 70(2): 299-320.
Kolody D., & Hoyle S., (2015). Evaluation of tag mixing assumptions in western Pacific Ocean
skipjack tuna stock assessment models. Fisheries Research, 163, 127-140.
Kristensen K., Nielsen A., Berg C.W., Skaug H.J. and Bell B., (In press). TMB: Automatic
Differentiation and Laplace Approximation. ArXiv e-print. Journal of Statistical Software.
[http://arxiv.org/abs/1509.00660.]
Lam C.H., Neilsen A. and Sibert J.R., (2010). Incorporating sea-surface temperature to the
light-based geolocation model TrackIt. Mar. Ecol. Prog. Ser. 419: 71–84, 2010.
Lamboeuf M., (1975). Contribution a la connaissance des migrations des jeunes thons rouges
a partir du Maroc. Collect. Vol. Sci. Pap. ICCAT, 4: 141-144.
Lauretta M., Goethel D., Walter J., Orbesen E., and Snodgrass D., (2015). Review of Available
Bluefin Tagging Information for Consideration in Upcoming Stock Assessments. PPT
Presentation 3 March 2015.
Leroy, B., Nicol, S., Lewis, A., Hampton, J., Kolody, D., Caillot, S., & Hoyle, S. (2015). Lessons
learned from implementing three, large-scale tuna tagging programmes in the western and
central Pacific Ocean. Fisheries Research, 163, 23-33.
Luton, W. (2013). Free-to-Play: Making Money From Games You Give Away. New Riders.
Mather F.J., III & Mason J.M. Jr., (1973). Recent information on tagging and tag returns for
tunas and billfishes in the Atlantic Ocean. ICCAT, Colc. Doc. Cient., 1:501-531.
Mariani A., Dell’Aquil M., Valastro M., A. Buzzi A. and Scardi M., (2015). Conventional tagging
of adult Atlantic bluefin tunas (Thunnus thynnus L.) by purse-seiners in the Mediterranean –
Methodological notes. SCRS/2014/189.

C7047
Cost-benefit analysis for the ICCAT GBYP tagging programme Page 59 of 63
Maunder M.N., (2014). Management strategy evaluation (MSE) implementation in stock
synthesis: Application to Pacific bluefin tuna. IATTC Stock Assessment Report 15: 100-117.
Patterson T.A., Basson M., Bravington M.V. and Gunn J.S., (2009). Classifying movement
behaviour in relation to environmental conditions using hidden Markov models. Journal of
Animal Ecology 2009, 78, 1113–1123.
Punt A.E., Butterworth D.S., de Moor C.L., De Oliveira J.A.A. and Haddon M., (In press).
Management Strategy Evaluation: Best Practices. Fish and Fisheries, doi: 10.1111/faf.12104.
Quílez Badía G., Cermeño P., Sainz Trápaga S., Tudela S., Di Natale A., Idrissi M., Abid N.,
(2012). 2012 ICCAT-GBYP pop-up tagging activity, in Larache (Morocco). SCRS/2012/143
Collect. Vol. Sci. Pap. ICCAT, ??(?): ???-??? (2012).
Quílez Badía G., Ospina-Alvarez A., Sainz-Trápaga S., Di Natale A., Abid N., Cermeño P.,
and Tudela S., (2014) THE WWF/GBYP Multi-annual Bluefin tuna electronic tagging
programme (2008-2013): Repercussions for management. SCRS/2014/184.
Quílez Badía G., Tenśek S., Di Natale A., Pagá García A., Cañadas A., Kitakado T., and Kell
L.T., (2016). A Consideration of Additional Variance In The Mediterranean Aerial Survey
Based On Electronic Satellite Tags. SCRS/2015/146, Collect. Vol. Sci. Pap. ICCAT, 72(x):xxx-
xxx (2016).
Quinn, T.J.II. and Deriso R.B., (1999). Quantitative Fish Dynamics. Oxford University Press:
xv+542pp.
Rey J.C and Cort J.L., (1978). Resultado de la campaña de marcado de atún rojo (Thunnus
thynnus) juvenil en la costa mediterráneo española. ICCAT, Colec. Doc. Cinet. 7(2):318-321.
Restrepo V.R.., Diaz G.A., Walter J.F., Neilson J., Campana S.E., Secor D., and Wingate R.L.
(2009). Updated estimate of the growth curve of western Atlantic Bluefin Tuna.
SCRS/2009/160.
Rodríguez-Marín E., Di Natale A., Quelle P., Ruiz M., Allman R. , Bellodi A., Busawon D.,
Farley J., Garibaldi F., Ishihara T., Koob E., Lanteri L., Luque P.L., Marcone A., Megalofonou
P., Milatou N., Pacicco A., Russo E., Sardenne F., Stagioni M., Tserpes G. and Vittori S.

C7047
Cost-benefit analysis for the ICCAT GBYP tagging programme Page 60 of 63
(2014). Report of the age calibration exchange within the Atlantic Wide Research Programme
for bluefin tuna (GBYP). SCRS/2014/150.
Rodrìguez Roda J., (1964). Biología del atún (Thunnus thynnus L.) de la costa sudatlántica
española. Inv. Pesq, 25:33-146.
Rodrìguez Roda J., (1973). Descripción de la pesquería de atún rojo Thunnus thynnus (l.) de
almadraba. ICCAT, Colec. Doc. Cient. 11:401-404.
Rooker J.R., Arrizabalaga H., Fraile I., Secor D.H., Dettman D.L., Abid N., Addis P., Deguara
S., Karakulak F.S., Kimoto A., Sakai O., Macías D., and Neves Santos M. (2014). Crossing
the line: migratory and homing behaviors of Atlantic bluefin tuna. Marine Ecology Progress
Series, Vol. 504: 265–276.
Scutt Phillips, J., Patterson, T. A., Leroy, B., Pilling, G. M., & Nicol, S. J. (2015). Objective
classification of latent behavioral states in bio‐logging data using multivariate‐normal hidden
Markov models. Ecological Applications, 25(5), 1244-1258.
Sella, M., (1929). Migrazioni e habitat del tonno studiati col metodo degli ami, con osservazioni
su l’acrescimento sul regime delle tonnare, ecc. Mem. R. Comit, Talass. Ital. 156: 24 pp.
STECF, (2008). Report of the Working Group on Research Needs (SGRN-08-02). 6. Bluefin
tuna and swordfish tagging activities in the period 2005-2007: summary of actions undertaken
by MS and evaluation. JRC Scientific and Technical reports, EUR 23631: 115-123.
Taylor N.G., McAllister M.K., Lawson G.L., Carruthers T. and Block B.A., (2011). Atlantic
Bluefin Tuna: A Novel Multistock Spatial Model for Assessing Population Biomass. PLoS ONE
6(12): e27693. doi:10.1371/journal.pone.0027693.
Teo S.L.H., Boustany A., Dewar H., Stokesbury M.J.W., Weng K.C., Beemer S., Seitz A.C.,
Farwell C.J., Prince E.D. and Block B.A., (2007). Annual migrations, diving behavior, and
thermal biology of Atlantic bluefin tuna, (Thunnus thynnus), on their Gulf of Mexico breeding
grounds. Mar Biol (2007) 151:1–18. DOI 10.1007/s00227-006-0447-5.

C7047
Cost-benefit analysis for the ICCAT GBYP tagging programme Page 61 of 63
Turner, S. C., and Restrepo, V. R., (1994). A review of the growth rate of West Atlantic bluefin
tuna, Thunnus thynnus, estimated from marked and recaptured fish. SCRS/1993/065, Col.
Vol. Sci. Pap. ICCAT 42: 170-172.
Ueyama, Y., Tamai, M., Arakawa, Y., & Yasumoto, K. (2014, March). Gamification-based
incentive mechanism for participatory sensing. In Pervasive Computing and Communications
Workshops (PERCOM Workshops), 2014 IEEE International Conference on (pp. 98-103).
IEEE.
Vilela H., (1960). Estudos sobre a biologia dos atuns do Algarve. Bol. De Pesca, 69:11-34.
Walli A., Teo S.L.H., Boustany A., Farwell C.J., Williams T., Dewar H., et al., (2009). Seasonal
Movements, Aggregations and Diving Behavior of Atlantic Bluefin Tuna (Thunnus thynnus)
Revealed with Archival Tags. PLoS ONE 4(7): e6151. doi:10.1371/journal.pone.0006151
WWF MEDPO, (2012). “On the Med Tuna Trail”. 2011 Bluefin tuna tagging expedition. Report
for ICCAT.
http://www.iccat.int/GBYP/Documents/TAGGING/PHASE%202/WWF_MEDPO_GBYP_%20
2011%20tagging%20expeditions.pdf
© Crown copyright 2015 Printed on paper made from a minimum 75% de-inked post-consumer waste
About us
The Centre for Environment, Fisheries and Aquaculture Science is the UK’s leading and most diverse centre for applied marine and freshwater science. We advise UK government and private sector customers on the environmental impact of their policies, programmes and activities through our scientific evidence and impartial expert advice. Our environmental monitoring and assessment programmes are fundamental to the sustainable development of marine and freshwater industries. Through the application of our science and technology, we play a major role in growing the marine and freshwater economy, creating jobs, and safeguarding public health and the health of our seas and aquatic resources Head office
Centre for Environment, Fisheries & Aquaculture Science Pakefield Road Lowestoft Suffolk NR33 0HT Tel: +44 (0) 1502 56 2244 Fax: +44 (0) 1502 51 3865 Weymouth office
Barrack Road The Nothe Weymouth DT4 8UB Tel: +44 (0) 1305 206600 Fax: +44 (0) 1305 206601
Customer focus
We offer a range of multidisciplinary bespoke scientific programmes covering a range of sectors, both public and private. Our broad capability covers shelf sea dynamics, climate effects on the aquatic environment, ecosystems and food security. We are growing our business in overseas markets, with a particular emphasis on Kuwait and the Middle East. Our customer base and partnerships are broad, spanning Government, public and private sectors, academia, non-governmental organisations (NGOs), at home and internationally. We work with:
a wide range of UK Government departments and agencies, including Department for the Environment Food and Rural Affairs (Defra) and Department for Energy and Climate and Change (DECC), Natural Resources Wales, Scotland, Northern Ireland and governments overseas.
industries across a range of sectors including offshore renewable energy, oil and gas emergency response, marine surveying, fishing and aquaculture.
other scientists from research councils, universities and EU research programmes.
NGOs interested in marine and freshwater.
local communities and voluntary groups, active in
protecting the coastal, marine and freshwater
environments.
www.cefas.co.uk