Embed Size (px)
Citation preview
COST-EFFECTIVE INCARCERATION OF WASHINGTON STATE ADULT PRISON OFFENDERS
FINAL REPORT October 1, 2012
Criminal Justice Planning Services with
KMB Design Groups, Inc., P.S.

TABLE OF CONTENTS
Page EXECUTIVE SUMMARY ..................................................................................................................... i
CHAPTER 1- INTRODUCTION 1.1- Background Information ......................................................................................... 1 1.2- Study Components .................................................................................................. 1 1.3- Study Approach ....................................................................................................... 2 1.4- The Difference between Security and Custody ...................................................... 4 1.5- DOC’s Staffing Standards ........................................................................................ 4
CHAPTER 2- CAPACITY 2.1- Capacity Definitions ................................................................................................ 5 2.2- Funded and Operational Capacity .......................................................................... 6 2.3- Additional Available Capacity ................................................................................. 7
CHAPTER 3- CAPACITY NEEDS 3.1- Inmate Forecast .................................................................................................... 10 3.2- Capacity Needs Assessment Model ...................................................................... 11 3.3- CNAM Results........................................................................................................ 12 3.4- Capacity Needs for Men........................................................................................ 13 3.4.1- Reception Needs ......................................................................................... 14
CHAPTER 4- ANALYZING COST-EFFECTIVENESS 4.1- Housing Unit Efficiency ......................................................................................... 22 4.2- DOC’s Most Efficient Housing Units ...................................................................... 28
CHAPTER 5- OPTIONS 5.1- Options for Solving Capacity Needs for Men Offenders ....................................... 29 5.1.1- The “No Action” Alternative ....................................................................... 30 5.1.2- Summary of Options ................................................................................... 35 5.1.3- Option 1 ...................................................................................................... 36 5.1.4- Option 2 ...................................................................................................... 41 5.1.5- Option 3 ...................................................................................................... 47 5.2- Options for Addressing Crowding of Women Offenders ...................................... 52 5.2.1- Create MI3 Capacity ................................................................................... 52 5.2.2- Develop a Gender-Responsive Classification Instrument .......................... 54 5.3- Stand Alone Options for Additional Cost-Effectiveness ...................................... 54 5.4- Other Alternatives Considered ............................................................................. 58

APPENDICES
A. Daily Variation in Population by Institution and Security Level
B. FY13 Funded Capacity
C. FY13 Rated Capacity
D. History of Emergency Beds
E. Cost per Offender
F. Facility Preservation Requests for Selected Prisons
G. Year-to-Year Male Population Fore by Security Level
H. Operating Cost Details
I. Facility Acronyms

CJPS FINAL REPORT Page i
EXECUTIVE SUMMARY
Overview The June 2012 caseload forecast for prisons predicts an additional 1,178 male inmates and 91 fewer female inmates over the next ten years. Fortunately, the Department of Corrections (DOC) has sufficient capacity for males at maximum and minimum security. However, there is currently a shortage of about 200 beds for males in reception (in-take) and another 200 in medium security. Even with the addition of new housing units at the Washington State Penitentiary in FY14, by 2022 the shortage is projected to increase to approximately 260 at reception, 70 at close security and nearly 900 at medium security. Since modern prison beds come in standard sized housing units based on staffing efficiency, shortfalls of this magnitude require between 1,360 and 1,536 net new beds. The difference depends on how existing facilities can be repurposed based on other aspects of proposed solutions.
It is important to note that even if the legislature funds prison construction in the next session, the earliest that new capacity can be brought on line is FY17. Even with quick action there will be increased crowding at reception, medium security and, soon, close security. In this case, crowding means mattresses on the floor and/or bunk beds in the dayroom. Delay will increase the magnitude and duration of the problem.
The consultants looked at several options for addressing the capacity needs. The report describes why these options were not feasible. The consultants found the Reception Center would play a central role in solving DOC’s capacity needs. This is due to two primary factors: the way the length of stay in reception affects the need for beds system-wide; and, the current Reception Center is cost-inefficient while occupying almost the exact number and security mix of beds DOC needs for close and medium security.
There appears to be a common perception that the reception center is already large enough, that there are hundreds of unused emergency beds, and that the need for a new facility has not been established. These are misconceptions. Some of the reasons for these misconceptions are discussed in this report and the analysis indicates there is an urgent need for action.
This report contains three feasible options for solving capacity needs for male offenders. The three options are:
Keep reception at the Washington Corrections Center using existing buildings and expand capacity elsewhere;
Keep reception at the Washington Corrections Center by demolishing three inefficient buildings, construct a new reception center in their place, and expand elsewhere;
Build a new reception center at Maple Lane and repurpose the Washington Corrections Center as a multi-custody prison for maximum, close, and medium/MI3 inmates.
All three options require reducing the average length of stay in reception from 53 to 40 days. This reduces capacity needs in reception from over 1,200 beds to approximately 1,000 beds. However, a

CJPS FINAL REPORT Page ii
shorter length of stay in reception simply means inmates transfer to other prisons sooner. Consequently the total number of beds needed remains the same and fewer reception beds means more beds are needed elsewhere.
Consistent with legislative direction, this report makes no recommendations. Instead, information is presented about each option. The key findings are summarized in the following table.
Sufficient total capacity for female offenders is projected through 2022. However, the female prison system is out of balance with crowding at higher security levels and available beds at lower security levels. Two options are presented to address this issue; one option is policy based, the other requires a modest capital investment.
Background Information As part of the 2011 Capital Budget Session Law, the Office of Financial Management (OFM) was directed to contract with a consultant to conduct an analysis of cost-effective options for the incarceration of adult prison offenders for the next ten years. 1 Criminal Justice Planning Services (CJPS) of Olympia was selected for the study.
The proviso language requires that options be identified and evaluated, including, but not limited to, construction of one or more new prisons; construction of new prison units at existing facilities; replacement, remodeling, or repurposing of existing, aged, or inefficient buildings; and management and use of emergency beds. The evaluation must include estimates of capital, operating and debt service costs, and a discussion of the advantages and disadvantages/risks of each option.
The study is based on the need to understand the current inmate capacity by security level and plan for anticipated changes in population. This involved developing definitions for various types of capacity; identifying capacity at each institution by security level; evaluating the best use of existing facilities; forecasting the future need for beds by security level; identifying options to create efficiencies and 1 Capital Budget Session Law, ESB-6047, Section 6011.
OPTION 1 OPTION 2 OPTION 3
10 Year Capital Outlay $249.1 $311.7 $231.4Beds Constructed 1,536 1,792 1,280Lost capacity due to demolition 0 (340) 0Beds Gained/(Lost) by repurposing (76) (60) 80System Capacity in FY22 17,886 17,818 17,786
Annual Cost at CompletionOperating (2012 dollars) $38.1 $29.9 $30.0Estimated Debt Service $17.7 $22.1 $16.4Total $55.8 $52.1 $46.4
Cumulative 10 year operating cost $160.5 $169.7 $156.0
SUMMARY OF KEY FINDINGS

CJPS FINAL REPORT Page iii
address capacity needs; and, evaluating the options based on cost, feasibility and their advantages and disadvantages.
Study Findings The June 2012 adult prison forecast indicates by 2022, DOC’s prison population will increase by 1,178 males and will decrease by 91 females.2
Capacity Needs for Female Offenders Can be Easily Addressed Overall capacity needs for women offenders were met with the recent expansion of the Mission Creek Corrections Center for Women, but the capacity is out of balance by security level. Like many states, Washington’s women offenders are generally over-classified. The first option addresses the issue of over-classification head-on by developing a gender-specific classification tool which more accurately predicts the risks presented by female offenders. The second option upgrades the fence around the Minimum Security Complex at the Washington Corrections Center for Women, so that women classified to MI3 (long-term minimum custody) can vacate the crowded housing units at higher security. The capital cost of this option is $1.9 million with no change in operating costs.
The remainder of the study focuses on options that address capacity needs for men.
Solving Capacity Needs for Male Offenders Will Require Years and Many Millions of Dollars An analysis of DOC’s capacity needs for males indicates that even if every available bed is funded – including crowding (which has been referred to as emergency beds in the past) – and DOC receives funds to operate the 512 medium security beds currently under construction at the Penitentiary, by 2022, there will be a need for 261 additional reception beds, 70 additional close security beds and nearly 900 medium security beds. Until new capacity is added, there will be substantial additional crowding to an already crowded system.
Opportunities to absorb crowding are more limited now than just a few years ago due to the closure of over 1,200 beds at McNeil Island (all originally constructed for medium security) and conversion of the old walled institution at the Penitentiary from medium security to minimum security. For various financial reasons described in the report, it would make little sense to reverse these decisions.
A review of additional available beds identified just two small and inefficient units at the Monroe Correctional complex and various minimum security beds, mainly at the Penitentiary. However, the need is for reception, medium and close security beds. The lack of available beds at the appropriate security level means DOC will be faced with decisions around how many mattresses to add to floors, whether to increase crowding at the Monroe Reformatory (a sensitive issue given the murder of a correctional officer there in 2011), and whether to add bunks to dayrooms or recreational spaces. All of these options come with risk to staff and inmate safety and to public property.
In the long run, doing nothing will make the Washington prison system look more and more like the broken California prisons – a violent system currently under court order to reduce crowding.
2 Washington State Caseload Forecast Council, June 2012, Adult Corrections Forecast.

CJPS FINAL REPORT Page iv
Options for Addressing Capacity Needs for Male Offenders All options considered in this study begin with the assumption that every available prison bed at medium security and higher is occupied before mattresses are put on the floor or bunk beds added to dayrooms.
Many options were evaluated and three emerged as the most feasible and cost-effective. While not originally expected by the consultants, all three include addressing the capacity needs of the reception center. The primary reason for this is the interplay between the system-wide need for beds by security level and length of stay in reception. The total number of inmates doesn’t change, but where and how they are housed changes according to the time they spend in reception.
Option 1 keeps the Reception Center at its present location, modifies the use of some housing units, and builds 1,536 medium beds at an undetermined location elsewhere. The projected deficit in reception is eliminated by shortening the average length of stay from 53 to 40 days. The projected deficit at close security is solved by converting an existing reception housing unit to long-term confinement of close custody inmates. These steps, in turn, increase the need for medium security beds from approximately 900 to nearly 1,500. There is no location, or combination of locations, where this many beds can be added to existing institutions. Therefore, this option requires construction of a new prison.
Since this option requires identifying, evaluating, and acquiring a new site, it takes longer than the other two options, thereby increasing the magnitude and duration of crowding. (The Maple Lane site is too small for a prison of this size.) This is the middle cost option in terms of capital expenditures and, in the long run, the most expensive option to operate.
Option 2 also keeps the reception center at its current location, but demolishes three small staff-inefficient housing units and builds a new reception center in their place. Demolishing buildings before additional capacity is added increases crowding in the system. At the Washington Corrections Center, all general population housing units must be converted to reception and a temporary “worker dorm” for MI3 (long-term minimum custody) inmates must be developed to keep enough inmate workers to operate the kitchen, laundry, maintenance, and other functions. (Short-term reception inmates are not there long enough to reliably perform these functions.)
Because existing housing units are demolished, this option requires building more beds than any other option. It therefore results in the largest capital outlay. Debt service on this larger amount offsets the slightly lower operating cost of this option and makes it the middle option in terms of operating costs.
Option 3 involves building a new reception center at Maple Lane and repurposing the Washington Corrections Center (WCC) to its original and best use of long-term confinement. The WCC is an institution with rich – and underutilized – physical resources for inmate programs. The WCC facility also provides the opportunity to convert an existing unit to close security thereby avoiding the high construction cost associated with this building type. Finally, there is land inside the fence at WCC where additional housing can be economically added.

CJPS FINAL REPORT Page v
Option 3 solves the capacity needs for ten years without temporarily displacing inmates and thereby temporarily increasing crowding. This option is the least expensive to build and, when debt service is included, the least expensive to operate. Because the pre-design and EIS for this option are essentially complete, Option 3 can be implemented relatively quickly.
Other Ways to Increase Cost-Effectiveness In addition to options addressing current and future capacity needs, there are other steps DOC can take to become more cost-effective. The following were identified in this study.
1. Move inmates classified to minimum security out of the reception center more quickly where costs are less and inmates have more opportunities for recreation and programming.
2. Move inmates from the Minimum Security Unit at the Penitentiary into the main facility. The old walled institution at the Penitentiary (“Old Main”) was recently repurposed to minimum security. Because there are vacant cell blocks in Old Main, it is now possible to move inmates from the more expensive Minimum Security Unit (MSU) to Old Main and close the MSU. Note however, this reduces the opportunity to implement number one, above, due to fewer surplus beds.
3. Expand Work Release. If all the inmates classified to work release could get to work release, it would be possible to close some surplus minimum security units. Numerous attempts to expand work release over the years have encountered the NIMBY (“not in my back yard”) reaction. A strategy used successfully by the Federal Bureau of Prisons eliminates the need for new facilities by allowing successful low risk work release inmates to transition to the community sooner using community corrections supervision with enhanced (GPS) electronic monitoring. A change in statute would be required to implement this strategy.
Other Options Considered The following alternatives were considered, but not included as cost-effective options for a variety of reasons that are described in the report.
1. Repurpose Reception Center Units R1, R2 and R3 as the DSHS Special Commitment Center (SCC). This idea presents many challenges, but based on previous work by the consultant, similar treatment facilities throughout the country are collocated with a prison and supported by prison security.3 Furthermore, nearly all residents at the SCC once lived at the Reception Center, a factor that might reduce the “NIMBY” effect sure to accompany any attempt to move the SCC off McNeil Island.
2. Repurpose WSP Old Main back to medium security. Since there is a significant need for medium security beds, the option of converting Old Main back to medium security was worth considering. However, using Old Main for minimum security saves $8 million per year. Additionally, this facility is cost-effectively meeting the needs of an aging minimum security population whose medical needs cannot be met at most minimum security facilities.
3 Involuntary Commitment of Sexually Violent Predators: Comparing State Laws, Roxanne Lieb and Kathy Gookin, Washington State Institute for Public Policy. March 2005 and 2007.

CJPS FINAL REPORT Page vi
3. Develop MI3 (long-term minimum) housing at the Airway Heights Corrections Center. Initially, it looked like the Airway Heights facility presented an opportunity to up-grade the fence around the 600-bed Minimum Security Unit for conversion to MI3. However, no cost-effective solutions were found.
4. Replace Minimum Security at WSP-Old Main with a new minimum security facility on property adjacent to the Penitentiary. This option was considered because there are substantial preservation costs to keep Old Main and the Minimum Security Building (MSU) operational. Building a replacement facility might actually cost less than keeping Old Main and the MSU going, plus cost less to operate. Despite these preliminary positive findings, further study is needed.

CJPS FINAL REPORT Page 1
CHAPTER 1- INTRODUCTION
1.1 Background Information The Washington State Legislature directed the Office of Financial Management (OFM) to contract with a consultant to conduct an analysis of cost-effective options for the incarceration of adult prison offenders for the next ten years.4 Criminal Justice Planning Services, an independent consulting firm with expertise in institutional operations and capacity planning, was selected to perform the study.
This study is based on the need to understand the current prison inmate capacity and plan for anticipated changes in population in the future. The legislation requires the consultant identify and evaluate options for the efficient and cost-effective incarceration of adult prison offenders over the next ten years. The evaluation must include, but not be limited to:
1. construction of one or more new prisons;
2. construction of new prison units at existing facilities;
3. replacement, remodeling, or repurposing of existing, aged, inefficient capacity; and,
4. management and use of emergency beds.
The study must also discuss the risks, advantages and disadvantages of each option. In addition, the contractor must identify all emergency beds, their current status, and the cost to bring on-line and operate any currently empty emergency beds and the projected need for them.
1.2 Study Components Although not specifically called a capacity study, this study incorporates the elements of a capacity study together with an analysis of cost-effective operations and alternative solutions to capacity needs.
In general, a capacity study evaluates the number and type of offenders that can be safely incarcerated at an agency’s facilities and compares that to the projected future needs of the agency by security level. It may also evaluate the potential of a facility or a portion of a facility to efficiently up-size, down-size or re-purpose for a different quantity or type of offender. For example, if land is available at a particular prison, can capacity be increased by simply adding a housing unit or is it also necessary to expand support services such as healthcare, dining and programming? Where there is significant surplus capacity, it may or may not make sense to close an entire facility. For example, if the population is declining, does it make financial sense to close an entire facility or to close one housing unit at multiple locations? The answer depends on whether the forecast predicts a long-term or short-term decline. It costs money to close and maintain a facility and may not make sense to do so when the beds will be needed again in just a few years.
4 Capital Budget Session Law, ESB-6074, Section 6011.

CJPS FINAL REPORT Page 2
In addition to the study elements above, the current economic conditions and the recent history of DOC make this study different from those in the past. There is currently an understandably strong emphasis on efficient and cost-effective operations during a time when DOC has already down-sized its operations due to budget reductions and stabilization of population levels. Therefore, the opportunities for further efficiency are fewer today than just a few years ago. Furthermore, although the capacity needs are expected to grow at a slower rate than previously forecast, there is a school of thought that believes that, as the economy recovers and tax revenues improve, counties and cities will be able to return law enforcement and prosecutorial staff to their former levels. This, in turn, should cause the prison population to grow at a rate more consistent with historic growth patterns.
The legislation directs that the study provide information on a variety of options, as opposed to making recommendations. The options all attempt to address current and future needs in a cost-effective and responsible way. Different options have different costs and advantage and disadvantages. The relative importance of those factors is a policy determination that this study leaves to others.
1.3 Study Approach This section identifies the general steps taken to determine needs, and develop and evaluate options. The results of each step are explained in greater detail in later chapters of this report.
Step 1 – Define capacity The first step in determining DOC’s capacity was developing definitions for various types of capacity. This was important due to confusion between the number of funded beds, operational capacity, total physical capacity and emergency beds. The consultants contacted the National Institute of Corrections to ask whether there are standard definitions for various types of capacity and were told each state defines its own.
The consultants generally worked with two sets of numbers: Funded beds and additional beds that could be funded according to operational capacity. Although this may seem like a simple task, it proved to be complex partially because capacity varies by security level. For example, a housing unit will have one capacity if it is used for medium custody inmates (usually fully double-bunked) and a reduced capacity if used for close custody inmates – some of whom must be housed in single cells because of the danger they present. DOC has historically double-bunked 50 percent of cells in close security units unless constraints dictate otherwise.
The operational capacity developed for this study is based on its current funded use. Then, when options are being considered, the operational capacity is adjusted according to that which matches the security levels within options. For example, one option proposes converting housing units from close security to medium. In this case, the capacity will increase by 25 percent because the unit can be fully double-bunked. To further explain the example, if a unit has 120 cells it can hold 180 close custody inmates or 240 medium custody inmates.

CJPS FINAL REPORT Page 3
The number of inmates per housing unit is important because more staff is required at higher security levels although fewer inmates are in each unit. This makes the cost per inmate significantly more at higher security levels.
Step 2 - Identify capacity needs This step was accomplished by disaggregating the June 2012 population forecast by security level and comparing it to existing DOC funded capacity by security level. (The population forecast is produced by the Washington State Caseload Forecast Council.) The end result was the identification of surpluses and deficits in DOC’s capacity by security level for each year from 2013 through 2022.
In addition, the consultants conducted a study of what is known as peaking factors for correctional facilities. DOC, like most correctional agencies, calculates usage and cost based on the average daily population. However, populations can vary greatly from day to day, particularly when there is a lot of turnover (such as at the reception center) and when the capacity of a particular security level is relatively small (such as the intensive management units.) Analysis of peaking factors is key in understanding how often and how much crowding occurs. Since the focus of the study is on cost-effectiveness, a peaking factor has not been added to the capacity needs because it would inflate costs. See the Appendix for more information on DOC’s peaking factors.
Step 3 - Evaluate the best use of existing facilities About three-quarters of any correctional budget consists of staffing and about three-quarters of staffing is custody staffing. Therefore, the consultants employed a method of evaluating the security staffing costs by housing unit as a way to determine the most efficient units. Next, options for repurposing existing units to meet the capacity deficits were developed. In addition to knowing what land might be available, this step required specific knowledge of factors such as empty beds, utility capacity, local community agreements, and capital preservation needs. Next, was identification of old and/or inefficient facilities for possible replacement, remodeling, or repurposing. Inefficiency was determined by calculating the housing security cost per inmate by security level for every housing unit in the system.
It should be noted that data gathering for the project began in early June and costs for FY12 were not available at the time of this report. Therefore, much of the cost data per offender reflects FY11. Since there has not been any funded inflation since FY11, costs per offender for FY12 should be similar to those of FY11 except where there has been a change in capacity. FY11 costs and preliminary costs for FY12 are included in the appendix.
Step 4 – Identify options to create efficiencies and address capacity needs There are three types of options discussed in this report: (1) options for addressing capacity needs, (2) stand-alone options not related to capacity, and (3) other options considered but not found to be cost effective.

CJPS FINAL REPORT Page 4
Step 5 - Evaluate options Once the options were developed they were analyzed for their operating, capital and debt service costs and/or savings. In addition, the evaluation includes the identification of advantages, disadvantages and risks of each option.
Step 6 – Produce report The documents produced in this study include this written report plus supporting backup material submitted to the OFM in electronic format.
1.4 The Difference between Security Levels and Custody Classifications It is easy to confuse security levels and custody classifications, and it is important to know the difference in order to understand the options. Security levels are designations for the security features of buildings such as a “maximum security housing unit”. Custody levels are classifications of inmates based on criminal history, sentence, and institutional behavior. Confusion occurs because the titles are similar. For example, maximum custody inmates live in maximum security housing units.
DOC has a Custody Staffing Model that establishes standards for security levels and staffing requirements for each level. It also has classification standards for the various inmate custody levels. An easy rule of thumb is:
Buildings have security levels
Inmates have custody classifications
1.5 Staffing Standards DOC has had staffing standards in place since the late 1980’s. These standards are applied to all prison facilities and also serve as a planning tool. The Custody Staffing Model allocates uniform staffing positions by security level including Correctional Captains, Lieutenants, Sergeants and Officers. The Non-Custody Staffing Standards serve as a guideline for allocating Classification Counselors (who work directly with inmates), business services, program and support staff such as food service and healthcare. Non-custody staffing tends to be ratio driven according to the number of inmates or size of facility. Staffing standards were applied when evaluating operating costs of options that involved a change in housing security level.
CJPS FINAL REPORT Page 5
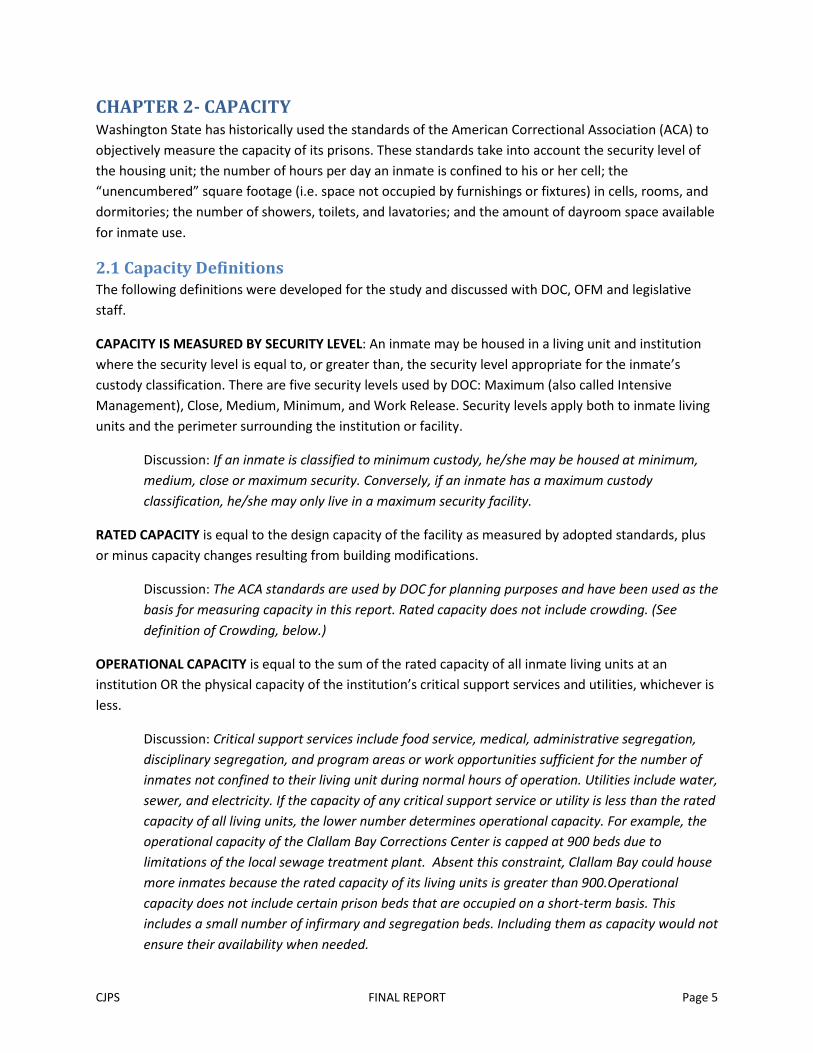
CHAPTER 2- CAPACITY Washington State has historically used the standards of the American Correctional Association (ACA) to objectively measure the capacity of its prisons. These standards take into account the security level of the housing unit; the number of hours per day an inmate is confined to his or her cell; the “unencumbered” square footage (i.e. space not occupied by furnishings or fixtures) in cells, rooms, and dormitories; the number of showers, toilets, and lavatories; and the amount of dayroom space available for inmate use.
2.1 Capacity Definitions The following definitions were developed for the study and discussed with DOC, OFM and legislative staff.
CAPACITY IS MEASURED BY SECURITY LEVEL: An inmate may be housed in a living unit and institution where the security level is equal to, or greater than, the security level appropriate for the inmate’s custody classification. There are five security levels used by DOC: Maximum (also called Intensive Management), Close, Medium, Minimum, and Work Release. Security levels apply both to inmate living units and the perimeter surrounding the institution or facility.
Discussion: If an inmate is classified to minimum custody, he/she may be housed at minimum, medium, close or maximum security. Conversely, if an inmate has a maximum custody classification, he/she may only live in a maximum security facility.
RATED CAPACITY is equal to the design capacity of the facility as measured by adopted standards, plus or minus capacity changes resulting from building modifications.
Discussion: The ACA standards are used by DOC for planning purposes and have been used as the basis for measuring capacity in this report. Rated capacity does not include crowding. (See definition of Crowding, below.)
OPERATIONAL CAPACITY is equal to the sum of the rated capacity of all inmate living units at an institution OR the physical capacity of the institution’s critical support services and utilities, whichever is less.
Discussion: Critical support services include food service, medical, administrative segregation, disciplinary segregation, and program areas or work opportunities sufficient for the number of inmates not confined to their living unit during normal hours of operation. Utilities include water, sewer, and electricity. If the capacity of any critical support service or utility is less than the rated capacity of all living units, the lower number determines operational capacity. For example, the operational capacity of the Clallam Bay Corrections Center is capped at 900 beds due to limitations of the local sewage treatment plant. Absent this constraint, Clallam Bay could house more inmates because the rated capacity of its living units is greater than 900.Operational capacity does not include certain prison beds that are occupied on a short-term basis. This includes a small number of infirmary and segregation beds. Including them as capacity would not ensure their availability when needed.

CJPS FINAL REPORT Page 6
FUNDED CAPACITY is the number of funded beds at an institution.
Discussion: Funded capacity is typically a blend of the full costs for occupied operational capacity and marginal costs for crowding. (Marginal costs are known as Direct Variable Costs in Washington State.) Marginal costs are typically applied when additional staffing is not necessary. For example, if the cost per inmate when all units are fully occupied is $100 per day, a small increase in additional population is funded at the marginal cost of about $15 per day. Like operational capacity, funded capacity does not include infirmary and segregation beds which are occupied on a short-term basis.
CROWDING occurs when the population at any security level within a facility exceeds the operational capacity of that security level.
Discussion: Crowding has sometimes been called “emergency beds” in Washington State. Because there appears to be no consistent definition of emergency beds used by the department, a definition of emergency beds is suggested below. Determining how much crowding is safe and acceptable is difficult because it is highly dependent on the population mix, operating policies and procedures, staffing levels, staff training, physical plant and available support services such as dining, recreation and healthcare. The results of a consult with the National Institute of Corrections confirmed this approach and did not offer any percentage levels for crowding. Therefore, crowding levels are an option rather than an absolute number.
EMERGENCY BEDS are temporary beds needed in response to a disruption of normal facility operations that results in a loss of funded capacity.
Discussion: Potential emergency beds may be identified in an institution’s disaster plan, but they are not part of capacity and are time limited until the lost use of capacity is restored or replaced. Emergencies such as major earthquakes, fires and disturbances may trigger implementation of a disaster plan. Emergency beds include such things as mattresses on the floor, tents in the recreation yard, and bunk beds in dayrooms, gymnasiums, or other large indoor spaces.
2.2 Funded and Operational Capacity As defined above, capacity planning begins with funded capacity. In security levels where deficits are identified and where funded capacity is less than operational capacity, the easiest way to increase capacity is to fully fund operational capacity, including what has historically been called emergency beds. DOC’s FY13 operational capacity was evaluated based on the current security level of each housing unit and then adjusted for any change of use required by proposed options.
The following table summarizes DOC’s funded capacity for males for FY13. More detailed depictions of DOC’s total funded and operational capacities are shown by housing unit in the appendix.
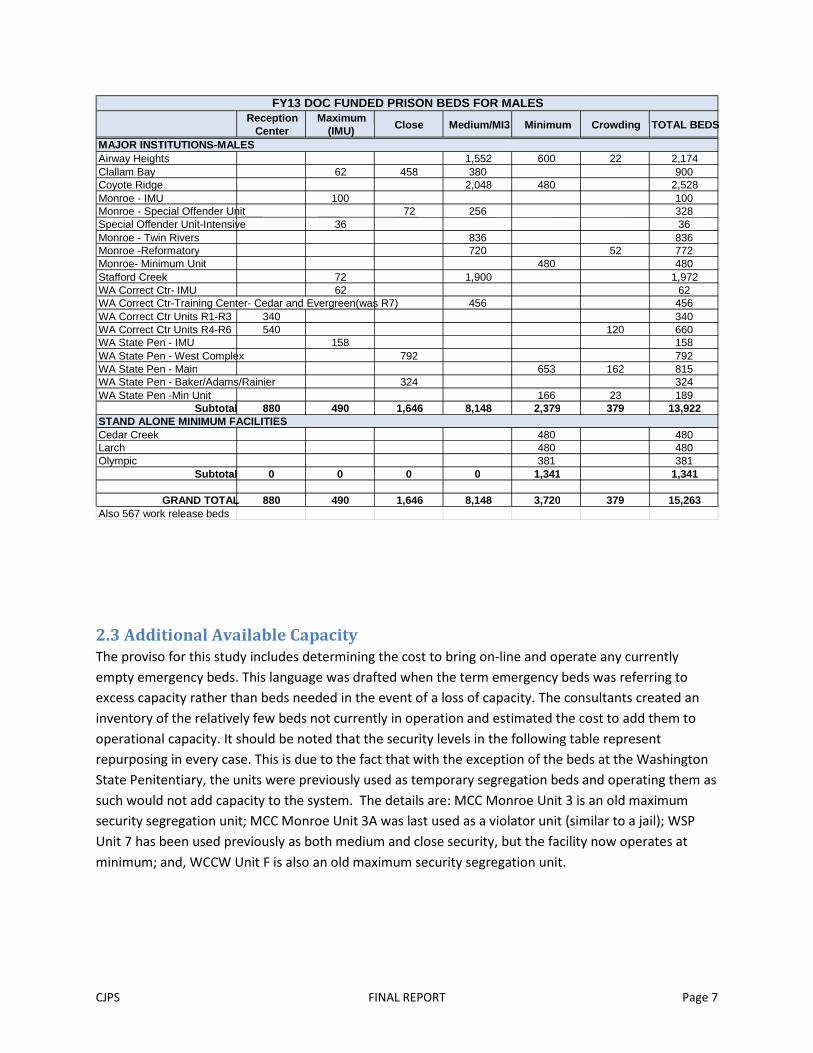
CJPS FINAL REPORT Page 7
2.3 Additional Available Capacity The proviso for this study includes determining the cost to bring on-line and operate any currently empty emergency beds. This language was drafted when the term emergency beds was referring to excess capacity rather than beds needed in the event of a loss of capacity. The consultants created an inventory of the relatively few beds not currently in operation and estimated the cost to add them to operational capacity. It should be noted that the security levels in the following table represent repurposing in every case. This is due to the fact that with the exception of the beds at the Washington State Penitentiary, the units were previously used as temporary segregation beds and operating them as such would not add capacity to the system. The details are: MCC Monroe Unit 3 is an old maximum security segregation unit; MCC Monroe Unit 3A was last used as a violator unit (similar to a jail); WSP Unit 7 has been used previously as both medium and close security, but the facility now operates at minimum; and, WCCW Unit F is also an old maximum security segregation unit.
Reception
Center Maximum
(IMU) Close Medium/MI3 Minimum Crowding TOTAL BEDS
Airway Heights 1,552 600 22 2,174 Clallam Bay 62 458 380 900 Coyote Ridge 2,048 480 2,528 Monroe - IMU 100 100 Monroe - Special Offender Unit 72 256 328 Special Offender Unit-Intensive 36 36 Monroe - Twin Rivers 836 836 Monroe -Reformatory 720 52 772 Monroe- Minimum Unit 480 480 Stafford Creek 72 1,900 1,972 WA Correct Ctr- IMU 62 62 WA Correct Ctr-Training Center- Cedar and Evergreen(was R7) 456 456 WA Correct Ctr Units R1-R3 340 340 WA Correct Ctr Units R4-R6 540 120 660 WA State Pen - IMU 158 158 WA State Pen - West Complex 792 792 WA State Pen - Main 653 162 815 WA State Pen - Baker/Adams/Rainier 324 324 WA State Pen -Min Unit 166 23 189
Subtotal 880 490 1,646 8,148 2,379 379 13,922
Cedar Creek 480 480 Larch 480 480 Olympic 381 381
Subtotal 0 0 0 0 1,341 1,341
GRAND TOTAL 880 490 1,646 8,148 3,720 379 15,263 Also 567 work release beds
MAJOR INSTITUTIONS-MALES
STAND ALONE MINIMUM FACILITIES
FY13 DOC FUNDED PRISON BEDS FOR MALES
CJPS FINAL REPORT Page 8
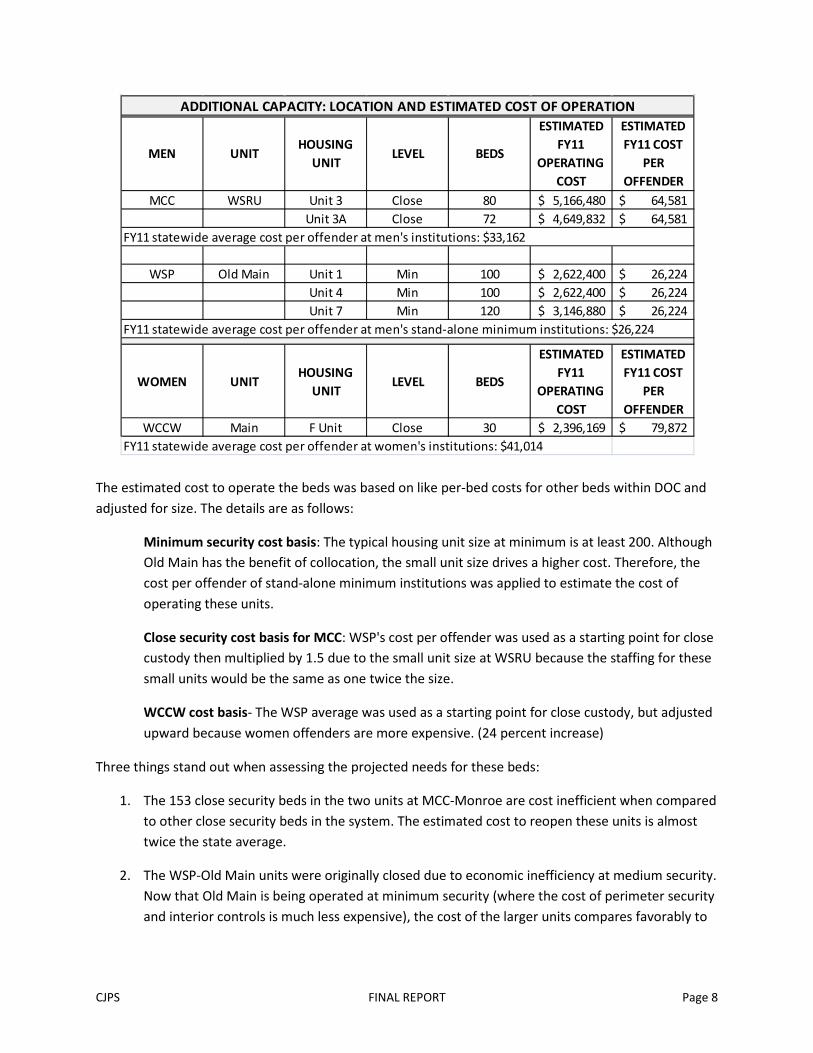
The estimated cost to operate the beds was based on like per-bed costs for other beds within DOC and adjusted for size. The details are as follows:
Minimum security cost basis: The typical housing unit size at minimum is at least 200. Although Old Main has the benefit of collocation, the small unit size drives a higher cost. Therefore, the cost per offender of stand-alone minimum institutions was applied to estimate the cost of operating these units.
Close security cost basis for MCC: WSP's cost per offender was used as a starting point for close custody then multiplied by 1.5 due to the small unit size at WSRU because the staffing for these small units would be the same as one twice the size.
WCCW cost basis- The WSP average was used as a starting point for close custody, but adjusted upward because women offenders are more expensive. (24 percent increase)
Three things stand out when assessing the projected needs for these beds:
1. The 153 close security beds in the two units at MCC-Monroe are cost inefficient when compared to other close security beds in the system. The estimated cost to reopen these units is almost twice the state average.
2. The WSP-Old Main units were originally closed due to economic inefficiency at medium security. Now that Old Main is being operated at minimum security (where the cost of perimeter security and interior controls is much less expensive), the cost of the larger units compares favorably to
MEN UNITHOUSING
UNITLEVEL BEDS
ESTIMATED FY11
OPERATING COST
ESTIMATED FY11 COST
PER OFFENDER
MCC WSRU Unit 3 Close 80 5,166,480$ 64,581$ Unit 3A Close 72 4,649,832$ 64,581$
WSP Old Main Unit 1 Min 100 2,622,400$ 26,224$ Unit 4 Min 100 2,622,400$ 26,224$ Unit 7 Min 120 3,146,880$ 26,224$
FY11 statewide average cost per offender at men's stand-alone minimum institutions: $26,224
WOMEN UNITHOUSING
UNITLEVEL BEDS
ESTIMATED FY11
OPERATING COST
ESTIMATED FY11 COST
PER OFFENDER
WCCW Main F Unit Close 30 2,396,169$ 79,872$ FY11 statewide average cost per offender at women's institutions: $41,014
ADDITIONAL CAPACITY: LOCATION AND ESTIMATED COST OF OPERATION
FY11 statewide average cost per offender at men's institutions: $33,162

CJPS FINAL REPORT Page 9
other minimum security units in the system. However, Units 1 and 4 are smaller than the other minimum security units and DOC does not need additional minimum security capacity.
3. WCCW is not projected to need additional close custody beds through 2022. There should be no reason to open this very expensive unit (almost double the statewide average annual operating cost).
In summary, DOC closed these units due to the cost inefficiency to operate them.

CJPS FINAL REPORT Page 10
CHAPTER 3- CAPACITY NEEDS
3.1 Inmate Forecast An inmate population forecast is prepared by the Caseload Forecast Council (CFC) and is updated three times per year. The Caseload Forecast Council also produced a projection of annual admissions to DOC for this study. This report uses the June 2012 inmate population and admissions forecasts.
As illustrated in the following graphs, there is projected to be an increase of 1,178 male inmates and a
decrease of 91 female inmates by 2022.5
5 Washington State Caseload Forecast Council, June 2012 Adult Corrections Forecast.
15600
15800
16000
16200
16400
16600
16800
17000
17200
17400
17600
17800
2012 2013 2014 2015 2016 2017 2018 2019 2020 2021 2022
INM
ATE
S
TEN YEAR FORECAST FOR MALE INMATES
Source: Washington State Caseload Forecast Council-June 2012
1200
1220
1240
1260
1280
1300
1320
1340
1360
2012 2013 2014 2015 2016 2017 2018 2019 2020 2021 2022
INM
ATE
S
TEN YEAR FORECAST FOR FEMALE INMATES
Source: Washington State Caseload Forecast Council-June 2012
CJPS FINAL REPORT Page 11
Important Driver of Population Forecast: Violators Violators are offenders who have violated a condition of supervision in the community and are sanctioned to serving a short period of time in either a prison or jail facility (usually less than 30 days).
The number of violators occupying prison and jail beds has dropped dramatically from about 1,400 a year ago to 600 at the time of this report. This sharp decline can be attributed to new legislation (described below) and the discontinuation of a practice known as “tolling” of community supervision days. In the past, the time offenders spent in jail did not count as time under supervision. Now it does.
Important Driver of Population Forecast: New Legislation Two bills were passed last session that are predicted to impact the inmate forecast. Legislation known as “swift and certain” processing of violators is predicted to drop the number of violators to 422 when fully
implemented.6 About 90 percent of these offenders are in rented county jail beds with the remaining 10 percent in prison.
Another law increases penalties for Vehicular Homicide/Assault DUI. It goes into effect in 2014 and is
expected to add 41 inmates when fully implemented.7
It should be noted that the timing of the impacts of new legislation can be difficult to predict. If the assumptions are wrong, the forecast will be revised up or down by the Caseload Forecast Council as indicated by the actual pace of implementation.
Limitations of the Forecast in Capacity Planning by Security Level Although the CFC’s forecast is calculated according to gender and crime type, it does not predict the security needs of the population. Furthermore, for the most part, there is little correlation between crime type and security needs. For example, not all property offenders are low risk and suitable for minimum security. Similarly some offenders convicted of violent crimes – like assault – will qualify for minimum security toward the end of their stay in prison if they have been well behaved while incarcerated and have no history of escape. In order to plan for capacity needs by security level, DOC has an internal planning tool called the Capacity Needs Assessment Model.
3.2 Capacity Needs Assessment Model (CNAM) The Capacity Needs Assessment Model is a multi-step process for disaggregating the current inmate population by crime type and custody classification, and then distributing the caseload forecast accordingly. For example, if ten percent of the drug offenders in prison are classified to maximum custody, ten percent of the drug offenders in the forecast will be allocated to maximum custody. CNAM then compares each year of the forecast to DOC’s available capacity and determines how many additional or surplus beds are in the system by security level. This model is the best tool available for assessing capacity needs. However, DOC staff expressed a need for refining the model to address special
6 2E2SSB 6204, 2012 Session Laws, Washington State Legislature. 7 2SHB 2216, 2012 Session Laws, Washington State Legislature.
CJPS FINAL REPORT Page 12
needs populations such as the medically fragile and those with traumatic brain injury. This request was outside the scope of the study.
3.3 CNAM Results The calculation of how many beds are needed at each security level in the future is dependent on a number of factors:
• Current funded capacity
• Length of stay at the Reception Center
• The population forecast
• Available surplus capacity
• Tolerance for crowding at each security level
Current funded capacity: Consistent with inmate classification and facility security levels, a deficit at a security level may be offset by a surplus at a higher security level, but not at a lower security level. For example, a surplus of minimum security beds is of no value to solve a need for additional close or medium security beds but may be used to offset a deficit in work release beds.
Length of stay at the Reception Center (RC): The length of stay at the RC drives how many beds are needed for reception and how many are needed at the out-lying facilities. This is because the RC is a temporary stop, not a permanent assignment. Since DOC’s average daily inmate population is the total number of inmates throughout the state, shortening the length of stay in reception will reduce the number of reception inmates, but increase the number of inmates in other facilities. For example, at the time of this writing, there are about 16,000 inmates statewide with 1,200 of them at the RC. If a shortened length of stay at the RC reduces the 1,200 inmates to 1,000, there will need to be 200 additional beds in the outlying facilities.
The population forecast: The population forecast is a combination of admissions and length of stay by crime type. If sentence lengths remain the same and admissions go down, so will the average daily population (ADP). As shown in the graphs earlier in the report, the forecast for the next ten years shows an increase of 1,178 males ADP, or 7.2 percent.
Available surplus capacity: DOC has rarely had any surplus capacity. As shown in the previous chapter, there are a few housing units that are closed due to economic inefficiency (e.g. the close security units at WSRU discussed above).
Some people have asked whether McNeil Island Corrections Center (MICC) can be re-opened since it has enough medium beds to solve the capacity problem. The answer is, no - not without a huge capital investment that would best be spent constructing more efficient beds. By way of explanation, the current status of MICC is what is known as a cold closure. There is no budget for maintaining the buildings. Furthermore, by ceasing to use the buildings, any re-occupancy would require that all buildings be brought up to current building code standards. Of course, the McNeil Island facility was closed due to its high operating costs. This would not change if the institution could be reopened. In summary, re-opening MICC is not a cost-effective option from either a capital or operating perspective.

CJPS FINAL REPORT Page 13
Tolerance for crowding at each security level: With regard to crowding, sound correctional practice would suggest a higher tolerance for crowding at lower security levels than at higher security levels. For example, at minimum security, where inmates have significant freedom of movement and are out of their cell/room for most or all of their waking hours, adding more bunks to a dormitory or another bed to a room can – up to a point – be easily accomplished. Conversely, putting two maximum custody inmates in an IMU cell can lead to disaster.
At close and medium security there is a qualitative difference between crowding that requires a mattress on the floor versus crowding that violates space standards but utilizes existing empty bunks or beds. For example, the 54 sq ft cells at the old Washington State Reformatory have bunk beds and, historically, some of them have been used to house two men. (This is despite being too small by ACA standards for one person.) In the 1980’s, when the reformatory was used for close custody inmates and many or most of the cells were double bunked, there were numerous disturbances resulting in injuries, destruction of state property and a court order mandating one person per cell. (These units are now operated at medium security and the consent decree has been lifted. Approximately 22 percent of the cells are currently double bunked.)
3.4 Capacity Needs for Men The greatest need for beds, by far, is at medium security. In the recent past, DOC’s capacity shortages have usually been a function of a growing forecast. This time, the problem is primarily a function of two coinciding forces: The closure of 1,200 medium security beds at McNeil Island and the repurposing a section of the Washington State Penitentiary at Walla Walla known as Old Main from medium to minimum security. The repurposing of Old Main saves $8 million annually. It also provides cost-efficient housing for over 300 minimum security inmates who were occupying medium security housing due to medical needs that cannot be met at a minimum security camp. Also, over the past decade, the Reception Center (RC) has gradually consumed the majority of medium security housing units at the collocated Training Center (TC).
The Training Center was built at the same time as the Reception Center, but for a completely different purpose. Its 1,200 bed design capacity (five units of 240 beds each) placed an emphasis on education, vocational training and work programs. Its support buildings include a 10,000 square foot education building and a 143,000 square foot multi-purpose building designed for inmate vocational training, recreation, programs, correctional industries, dining, kitchen, laundry and maintenance. Additionally, each housing unit was built with a day-room where medium security inmates spend time out of their cells, but still in the building. Today, the education and vocational buildings are largely underutilized and the day rooms sit empty.
Since the economic downturn began in 2008, admissions have declined to the point that DOC has been able to convert two of the TC units back to general population medium security housing for short-term inmates (0 to 9 months remaining on sentence) and inmate workers. The inmate workers help with food service, laundry and maintenance. Although the Cedar unit is referred to as medium security, the consultants observed it operated as close security. Staff reported once the TC fully became a reception center, the staff adopted a culture of close security operations which has not successfully transitioned
CJPS FINAL REPORT Page 14
back to medium security in this unit. It could be argued that the TC is still fully operating at close security which further underutilizes its resources.
One logical solution to address the deficit at medium security and to take advantage of the underutilized state assets of the Washington Corrections Center is to provide sufficient RC capacity so the TC can be returned to its highest and best use. This is based on the following:
• The forecasted need for medium security beds.
• The value of the underutilized support buildings at the TC (Estimated at upwards of $30 million.)
• The value of five medium security housing units with day rooms at the TC.
• The value of an underutilized medium security perimeter with tower and mobile patrol staffing. Unlike other prison facilities, reception centers can be based on a jail design concept whereby the building is the security perimeter, not a fence with towers and/or patrols. This is because the inmates are in reception for a short-time and do not leave the building. With a jail-like design, perimeter staffing is not required. (Estimated at $2 million annually for WCC.)
• Inefficient staffing of the RC. The WCC has buildings spread out among 93 fenced acres. Thus, inmates receiving education testing must be escorted a long distance from one building to another. Additionally, officers must be posted at each building as opposed a jail-like facility under a single roof. (Estimated at $1.9 million annually.)
3.4.1 Reception Needs There are three types of offenders who occupy beds at the reception center. The largest group is made up of offenders recently sentenced to DOC. For male offenders, the RC is the place where they are assessed and subsequently assigned to another prison. The RC also holds a small number of offenders who violated their conditions of release following completion of a prison sentence. Lastly, the RC serves as the western Washington prison transportation hub and provides short-term housing for inmates who are in the process of transferring from one prison to another. Unlike all other prisons, none of the inmates at the RC are assigned to it permanently. These three groups of inmates can be further defined as follows:
1. Admissions: Inmates who have recently been sentenced to DOC and are arriving from county jails. There are two types of Admissions: New and Readmits. (Readmits are offenders who have previously served time in prison and committed a new felony.) The number of new and readmits
are about equal.8 Inmates arrive unclassified and go through a classification process to determine security and program needs (including special needs such as health or mental health care).
2. Intransits: These inmates are between stops in the statewide prison transportation system. They are already classified and stay less than a week before moving to their final destination.
3. Others: This is a small group of offenders who also do not go through the classification process. They are violators of community supervision, county boarders, returned escapees, inmates awaiting transport to court, etc.
8 DOC Quarterly Fact Card, March 2012.
CJPS FINAL REPORT Page 15
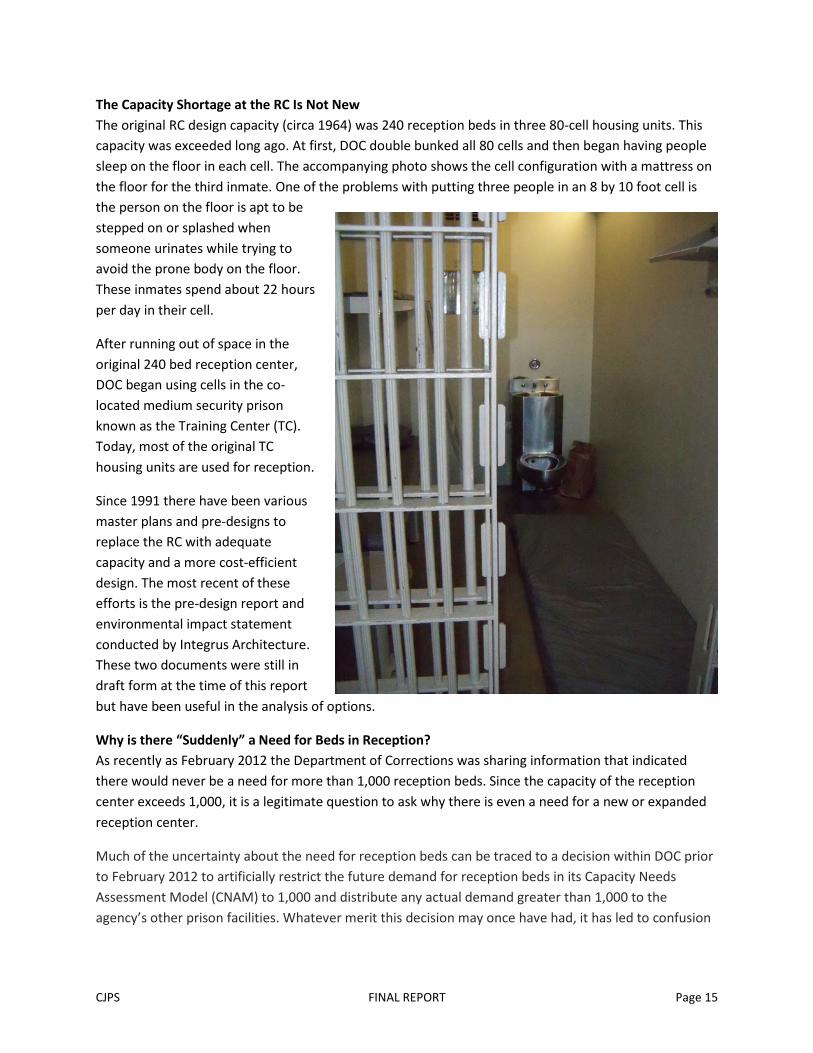
The Capacity Shortage at the RC Is Not New The original RC design capacity (circa 1964) was 240 reception beds in three 80-cell housing units. This capacity was exceeded long ago. At first, DOC double bunked all 80 cells and then began having people sleep on the floor in each cell. The accompanying photo shows the cell configuration with a mattress on the floor for the third inmate. One of the problems with putting three people in an 8 by 10 foot cell is the person on the floor is apt to be stepped on or splashed when someone urinates while trying to avoid the prone body on the floor. These inmates spend about 22 hours per day in their cell.
After running out of space in the original 240 bed reception center, DOC began using cells in the co-located medium security prison known as the Training Center (TC). Today, most of the original TC housing units are used for reception.
Since 1991 there have been various master plans and pre-designs to replace the RC with adequate capacity and a more cost-efficient design. The most recent of these efforts is the pre-design report and environmental impact statement conducted by Integrus Architecture. These two documents were still in draft form at the time of this report but have been useful in the analysis of options.
Why is there “Suddenly” a Need for Beds in Reception? As recently as February 2012 the Department of Corrections was sharing information that indicated there would never be a need for more than 1,000 reception beds. Since the capacity of the reception center exceeds 1,000, it is a legitimate question to ask why there is even a need for a new or expanded reception center.
Much of the uncertainty about the need for reception beds can be traced to a decision within DOC prior to February 2012 to artificially restrict the future demand for reception beds in its Capacity Needs Assessment Model (CNAM) to 1,000 and distribute any actual demand greater than 1,000 to the agency’s other prison facilities. Whatever merit this decision may once have had, it has led to confusion
CJPS FINAL REPORT Page 16
and misconceptions by the legislature, the Office of Financial Management, and even within the Department of Corrections itself.
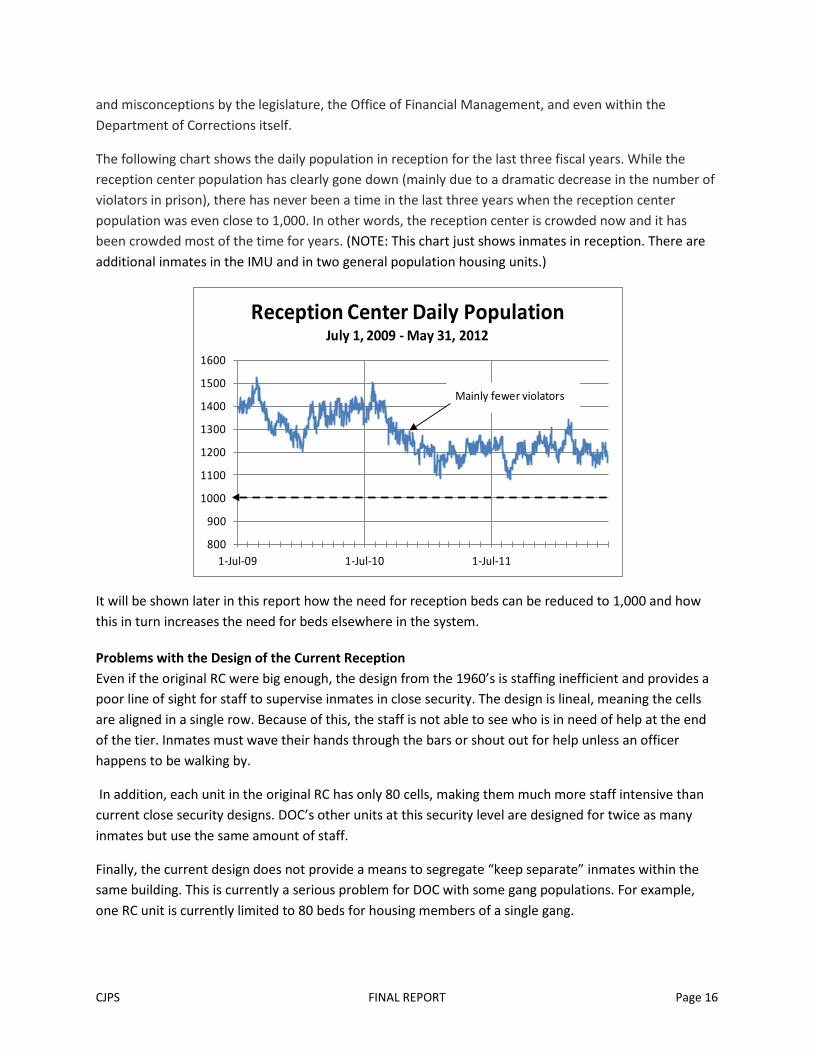
The following chart shows the daily population in reception for the last three fiscal years. While the reception center population has clearly gone down (mainly due to a dramatic decrease in the number of violators in prison), there has never been a time in the last three years when the reception center population was even close to 1,000. In other words, the reception center is crowded now and it has been crowded most of the time for years. (NOTE: This chart just shows inmates in reception. There are additional inmates in the IMU and in two general population housing units.)
It will be shown later in this report how the need for reception beds can be reduced to 1,000 and how this in turn increases the need for beds elsewhere in the system.
Problems with the Design of the Current Reception Even if the original RC were big enough, the design from the 1960’s is staffing inefficient and provides a poor line of sight for staff to supervise inmates in close security. The design is lineal, meaning the cells are aligned in a single row. Because of this, the staff is not able to see who is in need of help at the end of the tier. Inmates must wave their hands through the bars or shout out for help unless an officer happens to be walking by.
In addition, each unit in the original RC has only 80 cells, making them much more staff intensive than current close security designs. DOC’s other units at this security level are designed for twice as many inmates but use the same amount of staff.
Finally, the current design does not provide a means to segregate “keep separate” inmates within the same building. This is currently a serious problem for DOC with some gang populations. For example, one RC unit is currently limited to 80 beds for housing members of a single gang.
800
900
1000
1100
1200
1300
1400
1500
1600
1-Jul-09 1-Jul-10 1-Jul-11
Reception Center Daily PopulationJuly 1, 2009 - May 31, 2012
Mainly fewer violators
CJPS FINAL REPORT Page 17
With a more modern design a unit would be divided into secure pods where an officer can see all cell fronts at the same time, where keep separate issues can be easily addressed, and where there is a much more efficient use of staff.
Capacity Needs for Reception Although reception is not a security level per se, it has separate and distinct capacity needs from DOC’s five security levels. The separate admissions forecast produced by the Caseload Forecast Council also needs to be taken into account. Therefore, reception has its own column in the CNAM worksheets.
Reception Length of Stay Impacts Like a jail, the number of beds needed at the RC is a function of how many inmates are admitted and how long they stay. For example, if 100 inmates stay an average of a month, the RC can process 12 times that many in a year, or 1200. However, if 100 inmates stay an average of two months, the RC can only process only half that many, or 600 inmates per year. The current admissions forecast calls for about
6,700 admissions in 2012 and about 7,000 by 2022.9 There has been some confusion about the average length of stay for admissions inmates at the RC, but calculations by the consultant indicate that it is currently about 53 days.
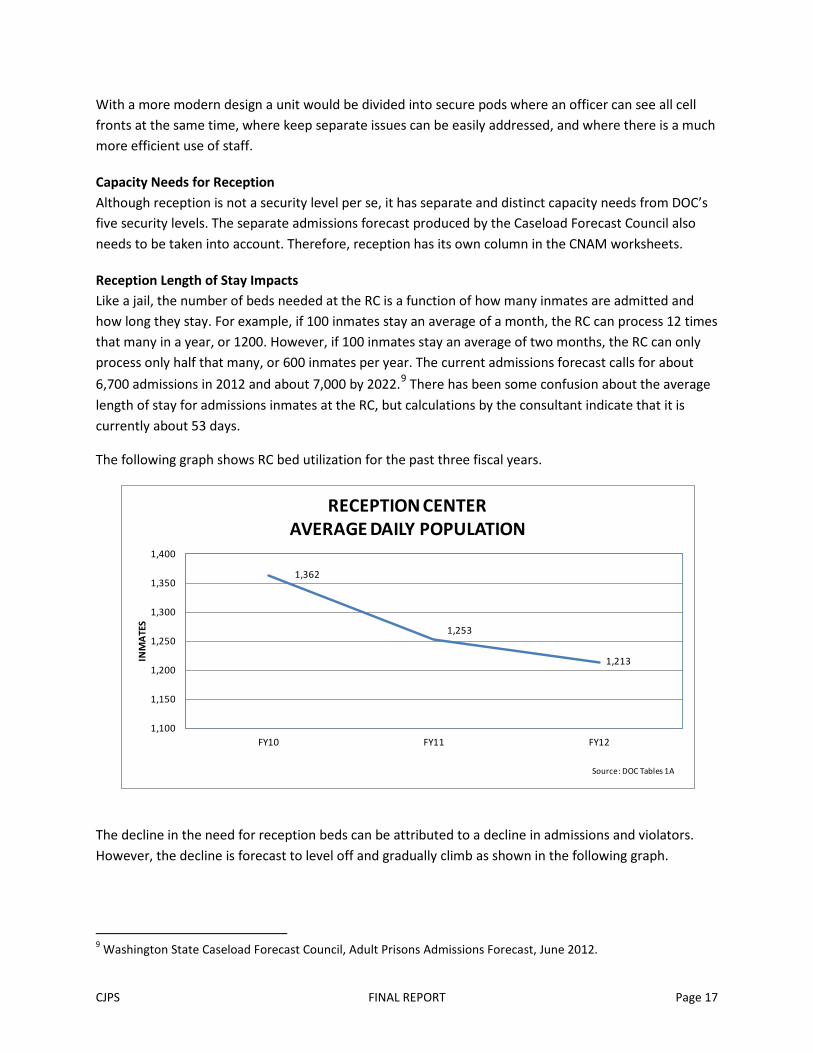
The following graph shows RC bed utilization for the past three fiscal years.
The decline in the need for reception beds can be attributed to a decline in admissions and violators. However, the decline is forecast to level off and gradually climb as shown in the following graph.
9 Washington State Caseload Forecast Council, Adult Prisons Admissions Forecast, June 2012.
1,362
1,253
1,213
1,100
1,150
1,200
1,250
1,300
1,350
1,400
FY10 FY11 FY12
INM
ATE
S
RECEPTION CENTERAVERAGE DAILY POPULATION
Source: DOC Tables 1A

CJPS FINAL REPORT Page 18
The following graph illustrates the effect of reducing the length of stay in reception using the same admissions forecast.
Keeping the current length of stay of 53 days will require 1,261 reception beds for men by 2022. Reducing the length of stay to 40 days reduces this number by 251 beds for a total of 1,010 beds needed. However, this also causes the need for 251 other beds within the system because the total number of inmates in the system does not change. Using a 40 day length of stay makes the 1,024-bed reception center pre-design work. DOC should be able to accomplish this reduction without much difficulty because a study conducted by DOC’s Planning & Research Office in 2010 showed classification
1,362
1,253
1,213 1,217 1,221 1,224 1,228 1,232 1,237 1,241 1,2461,253
1,261
1,100
1,150
1,200
1,250
1,300
1,350
1,400
2010 2011 2012 2013 2014 2015 2016 2017 2018 2019 2020 2021 2022
INM
ATE
S
RECEPTION CENTER ADP AT 53 DAY LENGTH OF STAY
974 977 980 983 985 989 992 995 999 1,004 1,010
1,213 1,217 1,221 1,224 1,228 1,232 1,237 1,241 1,246 1,253 1,261
900
950
1,000
1,050
1,100
1,150
1,200
1,250
1,300
2012 2013 2014 2015 2016 2017 2018 2019 2020 2021 2022
INM
ATE
S
RECEPTION CENTER ADPBASED ON AVERAGE LENGTH OF STAY
40 Days
53 days

CJPS FINAL REPORT Page 19
occurring around day 40 with the remainder of the time spent waiting for a bed to open at any outlying facility. However, DOC staff are considering adding front-end assessments for special needs populations such as medical and mental health which could increase the length of stay. This is in the early phases of development and since DOC is not able to specify impacts, the 40 day length of stay continues to be the planning standard used in this report.
System Capacity Needs By Length of Stay in Reception The following table shows capacity needs by security level in 2022 according to 53 and 40 day lengths of stay in reception.
The calculation of need in the table has four steps:
1. Baseline prison system capacity for FY13,
2. A funding assumption in FY14 for opening 512 medium security beds at the Penitentiary and fully double-celling all WCC Training Center housing units,
3. Projected population for 2022, and
4. Projected deficit.
CJPS FINAL REPORT Page 20
Projected ADP and Capacity surpluses/Deficits in 2022 by Security Level
Based on Different Average Lengths of Stay in Reception
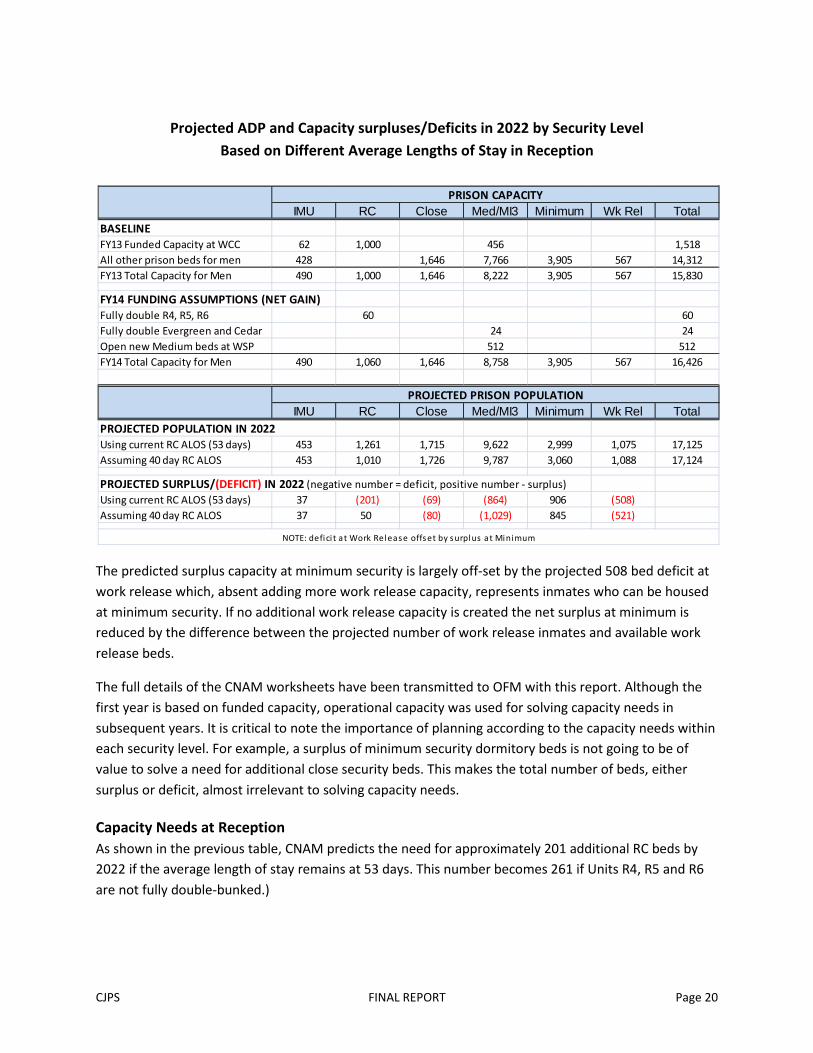
The predicted surplus capacity at minimum security is largely off-set by the projected 508 bed deficit at work release which, absent adding more work release capacity, represents inmates who can be housed at minimum security. If no additional work release capacity is created the net surplus at minimum is reduced by the difference between the projected number of work release inmates and available work release beds.
The full details of the CNAM worksheets have been transmitted to OFM with this report. Although the first year is based on funded capacity, operational capacity was used for solving capacity needs in subsequent years. It is critical to note the importance of planning according to the capacity needs within each security level. For example, a surplus of minimum security dormitory beds is not going to be of value to solve a need for additional close security beds. This makes the total number of beds, either surplus or deficit, almost irrelevant to solving capacity needs.
Capacity Needs at Reception As shown in the previous table, CNAM predicts the need for approximately 201 additional RC beds by 2022 if the average length of stay remains at 53 days. This number becomes 261 if Units R4, R5 and R6 are not fully double-bunked.)
IMU RC Close Med/MI3 Minimum Wk Rel TotalBASELINEFY13 Funded Capacity at WCC 62 1,000 456 1,518All other prison beds for men 428 1,646 7,766 3,905 567 14,312FY13 Total Capacity for Men 490 1,000 1,646 8,222 3,905 567 15,830
FY14 FUNDING ASSUMPTIONS (NET GAIN)Fully double R4, R5, R6 60 60Fully double Evergreen and Cedar 24 24Open new Medium beds at WSP 512 512FY14 Total Capacity for Men 490 1,060 1,646 8,758 3,905 567 16,426
IMU RC Close Med/MI3 Minimum Wk Rel TotalPROJECTED POPULATION IN 2022Using current RC ALOS (53 days) 453 1,261 1,715 9,622 2,999 1,075 17,125Assuming 40 day RC ALOS 453 1,010 1,726 9,787 3,060 1,088 17,124
PROJECTED SURPLUS/(DEFICIT) IN 2022 (negative number = deficit, positive number - surplus)Using current RC ALOS (53 days) 37 (201) (69) (864) 906 (508)Assuming 40 day RC ALOS 37 50 (80) (1,029) 845 (521)
PRISON CAPACITY
PROJECTED PRISON POPULATION
NOTE: defici t at Work Release offset by surplus at Minimum

CJPS FINAL REPORT Page 21
Capacity Needs for Close Security Regardless of the length of stay in reception, there is projected to be a need for one additional housing unit at close security by 2022. Since these buildings are more expensive to construct than medium housing, a cost-effective way to achieve the capacity is by converting an existing medium security housing unit to close and build a medium security unit instead. All of the options discussed below use this strategy.
Capacity Needs for Medium Security Absent changes to the average length of stay in reception, CNAM predicts the need for nearly 900 additional medium security beds by 2022.
Capacity Needs for Women Offenders The caseload forecast predicts there will be 91 fewer women in prison in 2022. However, the security mix of beds is out of sync with the security needs of the population. Options to address this problem are discussed in the next chapter.

CJPS FINAL REPORT Page 22
CHAPTER 4 - ANALYZING COST-EFFECTIVENESS Since additional capacity is needed for male offenders, this chapter focuses on determining cost-effectiveness of prison beds for males. It sets the stage for planning and evaluating options in the next chapter.
4.1 Housing Unit Efficiency Roughly three-quarters of any corrections budget is related to staffing and most staffing is uniformed custody staffing. Since no two institutions are exactly alike and many positions are shared throughout a particular compound among all security levels, comparing one institution to another is not necessarily informative when it comes to determining cost efficiency. Narrowing the focus to comparing custody staffing costs by housing unit illuminates which units are most cost-efficient. This analysis played a key role in forming and evaluating options. In most cases, the more expensive units are those with the fewest inmates, special populations (e.g. mental health) and/or inefficient design.
The results of the analysis are illustrated in the following graphs. Note that the horizontal scale is the same in each graph to facilitate visual comparison between security levels.
Reception Housing
Units R-1, R-2 and R-3 are the original reception units and are all the same size, but each has a different operational capacity based on operational need. As mentioned, Unit R-3 is what is known as a “keep
$1,317,118
$1,053,694
$658,559
$585,386
$585,386
$585,386
$718,428
WCC R-3
WCC R-1
WCC R-2
WCC R-4
WCC R-5
WCC R-6
Average
Reception Housing UnitsCustody Cost per 100 Beds
Based on FY13 Salaries and Benefits

CJPS FINAL REPORT Page 23
separate” unit for gang members. It is single celled because these are among the most violent offenders in the system.
Units R-4, 5, and 6 are all located in the former Training Center and have an operational capacity at Close security of 180 beds. This is a prime example of how a larger unit size equals cost efficiency. It is due to the custody staffing standards being applied by security level, not staff to inmate ratio. Reducing officers in the smaller R-3 unit would be dangerous to staff, inmates and state property.
Maximum Security
The high cost of the Stafford Creek Corrections Center F-Unit is related to its unit size. It has 72 beds while the unit at the Monroe Correctional Complex has 100 beds with the same staffing. The Monroe Correctional Complex Unit A-ITU (Intensive Treatment Unit) is located at the Special Offender Unit for inmates with severe mental health issues. This special needs population has always been among the most expensive in the system.
$2,588,401
$2,519,117
$2,187,943
$1,991,346
$1,991,346
$1,748,039
$1,693,891
$2,036,278
MCC Unit A-ITU
SCCC F Unit
WSP IMU-N
MCC IMU
WCC IMU
WSP IMU-S
CBCC F Unit
Average
Maximum Security (IMU) Housing Units Custody Cost per 100 Beds

CJPS FINAL REPORT Page 24
Close Security
Because of design, size and special needs (severely mentally ill) population, the C and D Units at the Special Offender Unit in Monroe have by far the highest costs. Otherwise, the Close security units throughout the state all cost about the same to operate.
$2,588,401
$2,588,401
$972,891
$972,891
$972,891
$972,891
$926,118
$866,669
$866,669
$866,669
$816,239
$816,239
$816,239
$986,003
SOU - C Unit
SOU - D Unit
WSP Delta
WSP Echo
WSP Fox
WSP Golf
CBCC D Unit
WSP Baker
WSP Adams
WSP Rainier
CBCC A Unit
CBCC B Unit
CBCC C Unit
Average
Close Security Housing UnitsCustody Cost per 100 Beds
Based on FY13 Salaries and Benefits
CJPS FINAL REPORT Page 25
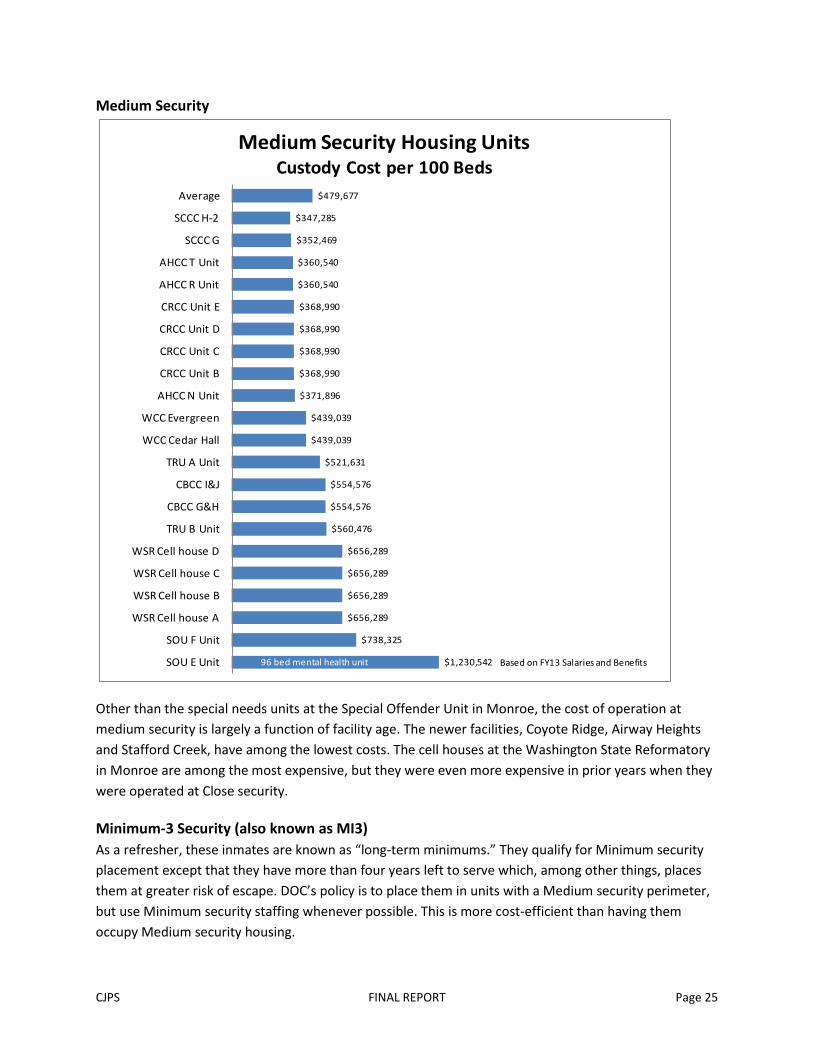
Medium Security
Other than the special needs units at the Special Offender Unit in Monroe, the cost of operation at medium security is largely a function of facility age. The newer facilities, Coyote Ridge, Airway Heights and Stafford Creek, have among the lowest costs. The cell houses at the Washington State Reformatory in Monroe are among the most expensive, but they were even more expensive in prior years when they were operated at Close security.
Minimum-3 Security (also known as MI3) As a refresher, these inmates are known as “long-term minimums.” They qualify for Minimum security placement except that they have more than four years left to serve which, among other things, places them at greater risk of escape. DOC’s policy is to place them in units with a Medium security perimeter, but use Minimum security staffing whenever possible. This is more cost-efficient than having them occupy Medium security housing.
$1,230,542
$738,325
$656,289
$656,289
$656,289
$656,289
$560,476
$554,576
$554,576
$521,631
$439,039
$439,039
$371,896
$368,990
$368,990
$368,990
$368,990
$360,540
$360,540
$352,469
$347,285
$479,677
SOU E Unit
SOU F Unit
WSR Cell house A
WSR Cell house B
WSR Cell house C
WSR Cell house D
TRU B Unit
CBCC G&H
CBCC I&J
TRU A Unit
WCC Cedar Hall
WCC Evergreen
AHCC N Unit
CRCC Unit B
CRCC Unit C
CRCC Unit D
CRCC Unit E
AHCC R Unit
AHCC T Unit
SCCC G
SCCC H-2
Average
Medium Security Housing UnitsCustody Cost per 100 Beds
96 bed mental health unit Based on FY13 Salaries and Benefits

CJPS FINAL REPORT Page 26
This is an example of how having a uniform housing unit size produces consistent costs. All of these units range between 223 and 272 beds.
Minimum Security This security level warranted two separate analyses because compounds that are collocated at a major institution benefit from consolidated services such as healthcare, administration and transportation.
$288,762
$288,762
$288,762
$291,018
$291,018
$286,005
$286,005
$285,169
$285,169
$273,899
$273,899
$273,899
$273,899
$273,899
$282,637
AHCC K Unit
AHCC L Unit
AHCC M Unit
CRCC Unit G
CRCC Unit H
CRCC Unit F
CRCC Unit I
TRU C Unit
TRU D Unit
SCCC H-1
SCCC H-3
SCCC H-4
SCCC H-5
SCCC H-6
Average
MI3 Housing UnitsCustody Cost per 100 Beds
96 bed mental health unit Based on FY13 Salaries and Benefits

CJPS FINAL REPORT Page 27
Collocated Minimum Security
The units at the Monroe Correctional Complex are designated for offenders with special medical needs which require wheelchair access and lower capacity per unit. The Washington State Penitentiary MSU unit is a small old unit which only has capacity for 189 inmates. Now that Units 6, 8 and 10 in the Old Main portion of the facility have been converted to minimum security it makes sense to move the MSU inmates into Unit 7 at Old Main. A full analysis of this option is contained later in the report.
Stand-Alone Minimum Security Prisons These three camp-style prisons do not have the advantages of collocated prisons, but do share some services with the nearest major prison. Although services vary by institution, examples include shared banking, pharmacy support, clinical oversight, and purchasing.
$926,118
$816,239
$816,239
$816,239
$649,627
$419,971
$418,668
$418,668
$393,128
$284,695
$284,695
$275,928
$465,836
MCC/MSU D Unit
MCC/MSU A Unit
MCC/MSU B Unit
MCC/MSU C Unit
WSP MSU
CRCC Sage
WSP Unit 6
WSP Unit 8
WSP Unit 10
AHCC C-4
AHCC C-5
CRCC Camas
Average
Collocated Minimum Housing UnitsCustody Cost per 100 Beds
Based on FY13 Salaries and Benefits

CJPS FINAL REPORT Page 28
4.2 DOC’s Most Efficient Housing Units When reviewing the data in the Housing Unit Efficiency Study, the most efficient units became obvious. Notice how the unit costs in the chart below do not vary by much, but the security cost per offender varies greatly. Again, this is a function of unit size. It should be noted that claiming one unit to be more efficient than another at close security is particularly difficult due to the specialized missions of the units, particularly gang management.
The cost analyses in this chapter served as a planning tool for the options in the next chapter.
$466,137
$443,763
$404,893
$345,263
$322,025
$322,025
$313,027
$357,224
OCC Hoh
OCC Clearwater
OCC Ozette
CCCC Cascade
LCC Elkhorn
LCC Silverstar
CCCC Olympic
Average
Stand Alone Minimum Housing UnitsCustody Cost per 100 Beds
FTEs IMU CLOSE MED MI3 MINSgt 2.6 1.3 2.6 1.3 1.3CO 13.6 13.6 11.9 10.2 11.9
FY13 COSTSgt $181,064 $90,532 $181,064 $90,532 $90,532CO $872,630 $872,630 $763,552 $654,473 $763,552
Total $1,053,694 $963,162 $944,616 $745,005 $854,084
Inmates 62 118 256 256 240Annual per Offender $16,995.07 $8,162.39 $3,689.90 $2,910.18 $3,558.68
Daily per Offender $46.56 $22.36 $10.11 $7.97 $9.75
DOC's MOST EFFICIENT HOUSING UNIT SECURITY COSTS
CJPS FINAL REPORT Page 29
CHAPTER 5 - OPTIONS This chapter includes three major options that solve capacity needs for men, presents options for addressing crowding of women offenders and discusses additional cost-effective options not related to capacity needs. In addition, this chapter discusses other options considered, but found less cost efficient than the three major options.
5.1 Options for Solving Capacity Needs for Male Offenders
Capacity Needs by Security Level The Department of Corrections faces a current and growing need for additional prison capacity for male offenders. As discussed in Chapter 3, that need is not simply a single number, but rather, the sum of a combination of needs based on the security level profile of the inmate population.
Based on the Department’s funded capacity by security level, and the June 2012 population forecast, there is no need for additional beds for females, or for IMU and minimum security beds for males, thru 2022. A current and projected deficit at work release is economically offset by a projected surplus at minimum security for both males and females. Therefore, the capacity related options in this report focus on reception, close and medium security beds for males. As a reminder, these estimates are based on the current caseload forecast and current law. A change in either one will impact capacity needs.
Although not originally expected when the study began, because of the way the length of stay in reception affects the distribution of need for beds throughout the prison system, all of the options involve the reception center. If the length of stay in reception is shorter, fewer beds are needed in reception and more beds are needed elsewhere; if the length of stay is longer, more reception beds are needed and fewer elsewhere. Regardless of the length of stay in reception, the total average daily population, and need for beds in the prison system, remains the same. However, while the total ADP remains the same, the future distribution of need for beds by security level changes not only with different assumptions about the average length of stay in reception, but also with projected future increases in the prison population.
The following funding assumptions were made beginning with FY14:
1. Continued funding of all FY13 beds including crowding (sometimes referred to as emergency beds)
2. The opening of 512 new medium security beds at the Penitentiary
3. Additional crowding of 60 reception beds in Units R4, R5 and R6
4. Additional crowding of 24 beds at WCC units Cedar and Evergreen
Under these funding assumptions, the June 2012 population forecast results in the following surpluses and deficits in prison capacity for male offenders in 2022.

CJPS FINAL REPORT Page 30
14,000
14,500
15,000
15,500
16,000
16,500
17,000
17,500
18,000
Jun-
12
Jun-
13
Jun-
14
Jun-
15
Jun-
16
Jun-
17
Jun-
18
Jun-
19
Jun-
20
Jun-
21
Jun-
22
Jun-
23
June 2012 Caseload Forecast Men
-2
159
198 195172
128
84 95 8859 49
-50
0
50
100
150
200
250
Jun-
13
Jun-
14
Jun-
15
Jun-
16
Jun-
17
Jun-
18
Jun-
19
Jun-
20
Jun-
21
Jun-
22
Jun -
23
Year to Year Change in Male Prison PopulationJune 2012 Caseload Forecast
5.1.1 The “No Action” Alternative
The “No Action” Alternative – What Happens If Nothing Is Done? Before discussing ways to address current and projected future needs, it is worth examining the consequences of taking no action. Assuming the population forecast is reasonably accurate, there are no changes in laws affecting prison admissions and length of stay, and no capacity is added to DOC prisons for men, what will happen in the near term and over the next decade?
While the June 2012 population forecast predicts a gradual increase in male prison population over the next ten years, it actually predicts essentially no change in prison population during FY13. The accompanying charts show the overall forecast and the year-to-year change in predicted male prison population. As mentioned previously, total growth equals 1,178.
If this were the end of the story, it might be concluded that decisions can safely be postponed for at least a year without adverse consequence. That would be an incorrect conclusion. The reason why the forecast is flat for the next year is because of projected changes in the population of violators sent to prison due to recent law and policy changes. The primary
IMU RC Close Med/MI3 Minimum Wk Rel Min + WkRel
53 days (2012 actual) 37 (201) (69) (864) 906 (508) 39840 days 37 50 (80) (1,029) 845 (521) 324
NOTE: deficit at Work Release offset by surplus at Minimum
Assumed Average Length of Stay
Projected Surplus/(Deficit)
PROJECTED SURPLUS/(DEFICIT) IN 2022 BASED ON RC AVERAGE LENGTH OF STAY(Negative number = deficit; Positive number = surplus)

CJPS FINAL REPORT Page 31
23 28 27 34 33 28 20 23 26 22
124142
165 164146
11691 93 79 65
-148
-11
6
-3 -7 -16 -27 -21 -17 -28
-200
-150
-100
-50
0
50
100
150
200
FY14 FY15 FY16 FY17 FY18 FY19 FY20 FY21 FY22 FY23
Year-to-Year Change in Population by Security Level
Reception/Max/Close Medium/MI3 Min/WkRel/Jail
impact of those law and policy changes is expected to take place this fiscal year. When projected year-to-year changes in prison population are examined by security level, a different picture emerges.
Unfortunately, as this chart illustrates, the primary increase in population during this and subsequent fiscal years is in medium security - precisely where DOC is rapidly running out of room.
The charts on the next two pages illustrate the projected surpluses and deficits in prison beds by security level over the next ten years if no capacity is added. The data are shown two ways: 1) assuming no change in the current 53-day average length of stay in reception, and 2) with a 40-day average length of stay. Among other things, these charts illustrate how a shorter length of stay in reception requires additional capacity elsewhere in the prison system. (Note that the scale for each security level is the same under both lengths of stay. This allows for easy visual comparison of the effects of changes in the average length of stay.)

CJPS FINAL REPORT Page 32
106 91
72 53
28
5
(14)(27)
(42)(57)
(69)-100
-80-60-40-20
020406080
100120
FY13 FY14 FY15 FY16 FY17 FY18 FY19 FY20 FY21 FY22 FY23
Projected Surplus/(Deficit)Close Security
(215)
173 31
(134)
(298)(444)
(560)(651)
(744)(823)
(888)
-1,200
-1,000
-800
-600
-400
-200
0
200
400
FY13 FY14 FY15 FY16 FY17 FY18 FY19 FY20 FY21 FY22 FY23
Projected Surplus/(Deficit)Medium Security
512 medium beds added at WSP in FY14
78 7470
6559
5450 47 43 40 37
0
10
20
30
40
50
60
70
80
90
100
FY13 FY14 FY15 FY16 FY17 FY18 FY19 FY20 FY21 FY22 FY23
Projected Surplus/(Deficit)Maximum Security (IMU)
(213) (217) (221) (224) (228) (232) (237) (241) (246) (253) (261)-300
-250
-200
-150
-100
-50
0
50
100
FY13 FY14 FY15 FY16 FY17 FY18 FY19 FY20 FY21 FY22 FY23
Projected Surplus/(Deficit)Reception
All bunks are full and ther e are mattresses on the floor 26 23 20 17 15 11 8 5 1
(4) (10)
-300
-250
-200
-150
-100
-50
0
50
100
FY13 FY14 FY15 FY16 FY17 FY18 FY19 FY20 FY21 FY22 FY23
Projected Surplus/(Deficit) Reception
78 7470
6559
5450 47 43 40 37
0
10
20
30
40
50
60
70
80
90
100
FY13 FY14 FY15 FY16 FY17 FY18 FY19 FY20 FY21 FY22 FY23
Projected Surplus/(Deficit) Maximum Security (IMU)
95 80
61 42
17
(6)(25)
(38)(53)
(68)(80)-100
-80-60-40-20
020406080
100120
FY13 FY14 FY15 FY16 FY17 FY18 FY19 FY20 FY21 FY22 FY23
Projected Surplus/(Deficit) Close Security
(372)
15
(127)
(293)
(458)(605)
(721)(813)
(906)(987)
(1,053)-1,200
-1,000
-800
-600
-400
-200
0
200
400
FY13 FY14 FY15 FY16 FY17 FY18 FY19 FY20 FY21 FY22 FY23
Projected Surplus/(Deficit) Medium Security
512 medium beds added at WSP in FY14
THE “NO ACTION” ALTERNATIVE – PROJECTED SURPLUS/(DEFICIT) BY SECURITY LEVEL
53 DAY ALOS IN RECEPTION 40 DAY ALOS IN RECEPTION

CJPS FINAL REPORT Page 33
143179 189 188 194 205
224254
276295
323
0
50
100
150
200
250
300
350
400
450
FY13 FY14 FY15 FY16 FY17 FY18 FY19 FY20 FY21 FY22 FY23
Projected Surplus/(Deficit) Minimum Security + Work Release
214250 261 260 266 277
296327
350369
398
0
50
100
150
200
250
300
350
400
450
FY13 FY14 FY15 FY16 FY17 FY18 FY19 FY20 FY21 FY22 FY23
Projected Surplus/(Deficit)Minimum Security + Work Release
The above charts show there is expected to be sufficient capacity at maximum security and minimum security/work release throughout the ten year horizon of this plan. (While it’s not illustrated here, there is also no problem in jail capacity for violators because jail capacity is an elastic quantity.) Close security has at least a few more years before there is no more room. The serious and immediate problems are in reception (assuming no change in the current 53 day average length of stay) and in medium security.
What Does It Mean to be Out of Capacity? Out of capacity means every available bed is assigned to an inmate. However, this does not necessarily mean every bed is occupied. It is standard (and good) correctional practice to hold an inmate’s assigned bed while he/she is temporarily elsewhere, for example in the prison infirmary, a local hospital, out to court, or in segregation. The inmate is returning and will need a place to stay. Holding a cell for someone who is temporarily elsewhere is logistically easier than juggling cell assignments, inmate property, and maintaining cellmate compatibility (an important issue for both staff and inmate safety).
Once the number of inmates exceeds total capacity, there are only a few choices:
• hold inmates at a higher security level than necessary (assuming there is capacity at higher security levels),
• use beds in substandard cells in exception to agency space standards (e.g. cellblocks at the Washington State Reformatory Unit at Monroe),
• backfill an assigned but unoccupied bed and solve the problem of where to put the returning inmate later,
• put a mattress on the floor of a cell, or
• put bunk beds in the day room or other open space.
DOC has routinely done all of these things except putting bunk beds in day rooms or other open spaces.
It is important to note that even if DOC is fully funded in FY14, and steps are taken as quickly as possible to increase capacity, use of these strategies will increase in the short run. It is expected that, before new capacity can added, there will be times when crowding is in the range of 500 to 700 inmates. This crowding will occur in reception, medium, and possibly close security. Of course, if implementation is delayed for any reason, the duration and extent of crowding will increase.

CJPS FINAL REPORT Page 34
Can Surplus Capacity at Higher Security Levels Offset Capacity Needs at Lower Levels? The charts on the previous page show there is expected to be surplus capacity in IMUs at least for the next ten years and at close security until FY17 or 18. Can this surplus capacity be used to offset needs at medium security? While it is clear from the size of projected future deficits at medium security that, even if all available beds at higher security could be used for medium security inmates, the number of available beds falls far short of long-term needs.
With regard to IMU beds, it is unlikely that DOC could use them to offset needs at lower security levels. In addition to relatively large swings in population levels in the IMUs – including times when units are essentially full – there could be significant legal liabilities for holding inmates under IMU conditions without cause.
The potential legal liabilities associated with IMUs probably wouldn’t pertain to close security. However, by FY16, the potential surplus capacity at close security is never more than a fraction of the projected deficit at medium security. That said, it may be possible to offset a small amount of crowding at medium security by using some close security beds for inmates on the cusp of reclassification to or from close security.
Can More Cells at the Washington State Reformatory be Double Bunked? DOC is currently double bunking 22 percent of the 632 cells at the Reformatory. While all 632 cells have bunk beds, by the standards of the American Correctional Association, these 54 square foot cells are actually too small for one person. Increasing double bunking under these conditions is certainly possible but not desirable. Given the murder of a staff person at the Reformatory in 2011, DOC is understandably reluctant to significantly increase the number of inmates at the institution.
Despite DOC’s reluctance, there may come a time when some increased double bunking at the Reformatory is preferable to other crowding options. The following table shows how many beds are gained (or lost) by changing the percentage of cells that are double bunked. The current practice of double bunking 22 percent of the cells is labeled “baseline” in the following table.
The Reformatory has been significantly double bunked in the past. In the 1980’s, when the institution was considered close security, it sometimes had 100 percent of its cells double bunked. However, this
Percent Change overDouble Cells Doubles Singles Beds Baseline
0% 0 632 632 -14010% 64 568 696 -7620% 127 505 759 -1322% 140 492 772 Baseline30% 190 442 822 50
40% 253 379 885 11350% 316 316 948 176
Cells
WSRU CROWDING

CJPS FINAL REPORT Page 35
period coincided with riots that saw the destruction of millions of dollars of state property and a consent decree requiring single cells throughout the institution. The consent decree was lifted years ago and DOC now uses the facility for medium security inmates. Given past history and more recent experience, deciding how many cells should be double bunked at the Reformatory is a difficult decision.
5.1.2 Summary of Options The existing reception center at the Washington Corrections Center (WCC) will be unable to process the expected number of offenders in 2022 unless the average length of stay in reception is reduced. For several reasons, this report assumes the average length of stay in reception will be reduced to 40 days, either when a new reception center is built, or sufficient capacity is added elsewhere in the system. This number was chosen because 40 days was the assumption used in the department’s draft pre-design report for a new reception center and because DOC’s Planning & Research office reports the reception process is currently completed by about day 40 under inefficient space constraints. (Additional days are now spent waiting for beds to open at out-lying facilities of the appropriate security level.)
While other options were evaluated, three options emerged as the most viable and cost effective ways to address future needs. Consistent with legislative direction, this report makes no recommendations. Instead, it presents capital and operating cost estimates and advantages and disadvantages for each option. The three options are:
1. Keep reception at WCC using its current complement of buildings and add capacity elsewhere.
2. Keep reception at WCC, but tear down R1, R2 and R3 and re-build the reception center on the vacated land; reclaim the former Training Center as a collocated long-term multi-custody institution, and add a medium security unit to WCC.
3. Build a new reception center at Maple Lane and convert all of WCC to a long-term multi-custody institution. Add one new medium security unit to WCC.
Each of these options is more complicated than simply addressing reception. Shortening the length of stay decreases the number of reception center beds needed by about 250 but increases the need elsewhere by the same number. Even with a 40-day average length of stay, keeping reception at WCC without new construction requires converting one of the existing 240 bed general population medium security units to reception, thereby further increasing the need for medium security beds. Add the effect of a shorter length of stay in reception (250 beds) to the loss of beds converted from general population to reception (240) to the increased capacity needed due to population growth (about 900 medium security beds and an additional 180-bed close security unit), and the total quickly equals that of another medium size prison (250 + 240 + 900 + 180 = 1,570 beds).
The following pages describe each option, including year-by-year impacts on prison capacity. They provide a summary of capital and operating costs, the number of new beds constructed, and the net impact of each option on prison capacity by security level. Finally, they summarize advantages and disadvantages/risks of each option.

CJPS FINAL REPORT Page 36
(153) (157) (161) (164) (168) (172)
52 49 45 40 34
-200
-150
-100
-50
0
50
100
FY13 FY14 FY15 FY16 FY17 FY18 FY19 FY20 FY21 FY22 FY23
Surplus/(Deficit) Reception
78 74
70 65
59 54
50 47 43 40 37
0
10
20
30
40
50
60
70
80
90
FY13 FY14 FY15 FY16 FY17 FY18 FY19 FY20 FY21 FY22 FY23
Surplus/(Deficit) Maximum Security (IMU)
106 91
72
53
28
5
155 142
127 112
100
0
20
40
60
80
100
120
140
160
180
FY13 FY14 FY15 FY16 FY17 FY18 FY19 FY20 FY21 FY22 FY23
Surplus/(Deficit) Close Security
(191)
197
55
(110)
(274)
(420)
87
251
158 77
267
-500
-400
-300
-200
-100
0
100
200
300
400
FY13 FY14 FY15 FY16 FY17 FY18 FY19 FY20 FY21 FY22 FY23
Surplus/(Deficit) Medium Security
5.1.3 Option 1: Keep the Old Reception Center at the Washington Corrections Center and Expand Capacity Elsewhere Maintaining operation of the current reception center at the Washington Corrections Center requires adding capacity elsewhere in the prison system. If the average length of stay in reception is reduced to 40 days, it will be necessary to build six new 256 bed medium security units. The only institution master planned for additional medium security housing is the Washington State Penitentiary, where only two additional 256-bed units can be added. There is no other institution, or combination of institutions, where four 256-bed units can be added. The only alternative is to build a new medium security institution on a new site. This could either be done by completing the 512 beds master planned for the Penitentiary and constructing a new 1,024 bed institution elsewhere, or by building a new 1,536 bed medium security institution. Capital costs are less for the second alternative, and per capita operating costs are less for a 1,536 bed institution than for a 1,024 bed institution. Consequently, this option assumes construction of a new 1,536 bed institution.
When the new institution is completed, one unit at WCC would be repurposed to a 180-bed general population close security unit and one 240-bed general population unit would be repurposed to a 240 bed medium security reception unit.
Together these steps address the need for capacity at reception, close, and medium security.
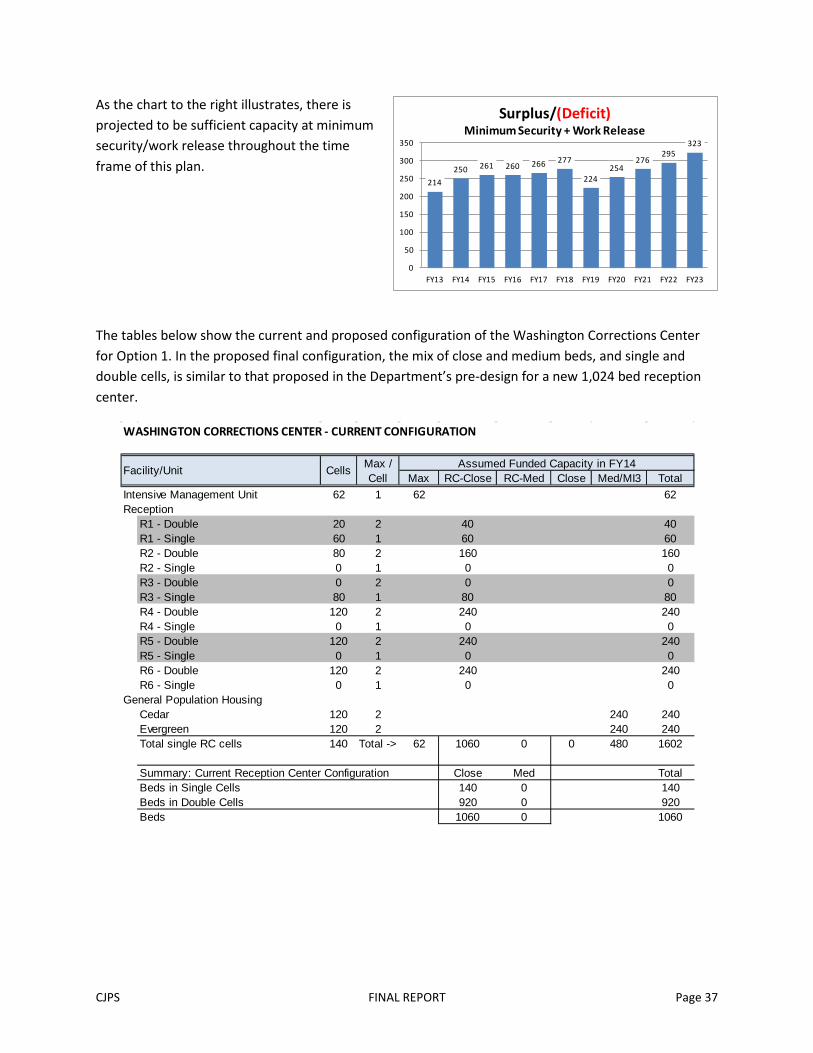
CJPS FINAL REPORT Page 37
214
250 261 260 266 277
224 254
276 295
323
0
50
100
150
200
250
300
350
FY13 FY14 FY15 FY16 FY17 FY18 FY19 FY20 FY21 FY22 FY23
Surplus/(Deficit) Minimum Security + Work Release
As the chart to the right illustrates, there is projected to be sufficient capacity at minimum security/work release throughout the time frame of this plan.
The tables below show the current and proposed configuration of the Washington Corrections Center for Option 1. In the proposed final configuration, the mix of close and medium beds, and single and double cells, is similar to that proposed in the Department’s pre-design for a new 1,024 bed reception center.
WASHINGTON CORRECTIONS CENTER - CURRENT CONFIGURATION
Max /Cell Max RC-Close RC-Med Close Med/MI3 Total
Intensive Management Unit 62 1 62 62Reception
R1 - Double 20 2 40 40R1 - Single 60 1 60 60R2 - Double 80 2 160 160R2 - Single 0 1 0 0R3 - Double 0 2 0 0R3 - Single 80 1 80 80R4 - Double 120 2 240 240R4 - Single 0 1 0 0R5 - Double 120 2 240 240R5 - Single 0 1 0 0R6 - Double 120 2 240 240R6 - Single 0 1 0 0
General Population HousingCedar 120 2 240 240Evergreen 120 2 240 240Total single RC cells 140 Total -> 62 1060 0 0 480 1602
Summary: Current Reception Center Configuration Close Med TotalBeds in Single Cells 140 0 140Beds in Double Cells 920 0 920Beds 1060 0 1060
Facility/Unit Cells Assumed Funded Capacity in FY14
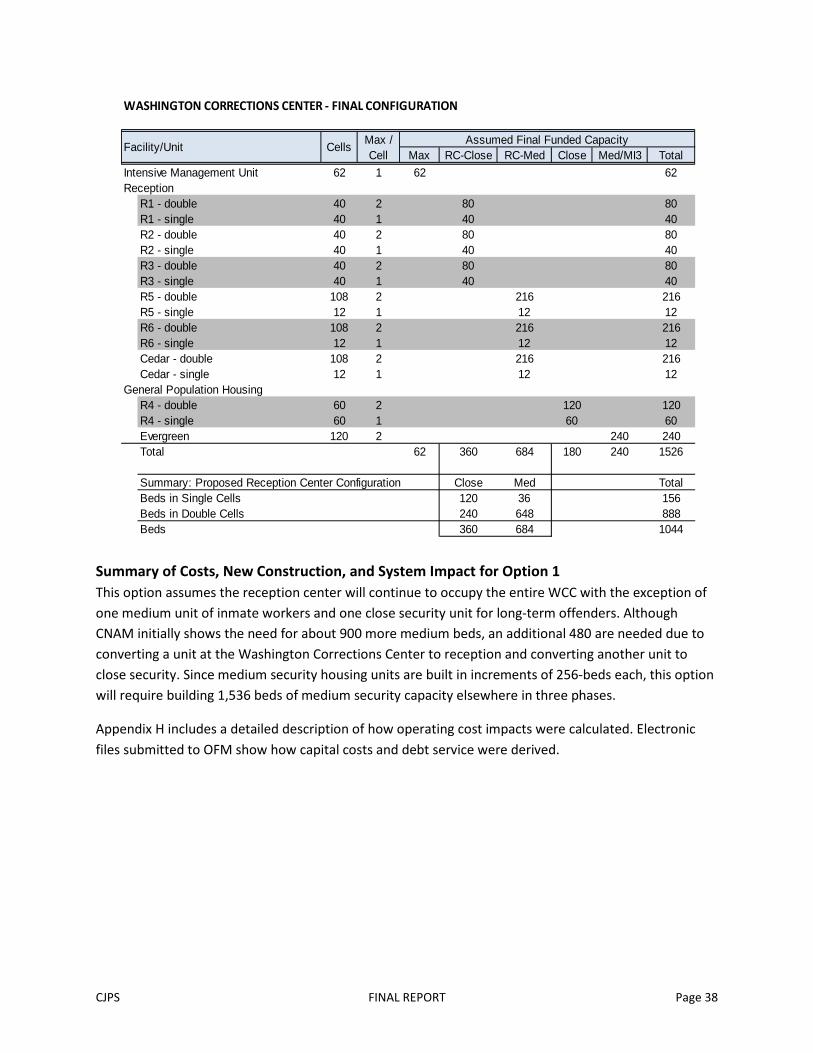
CJPS FINAL REPORT Page 38
Summary of Costs, New Construction, and System Impact for Option 1 This option assumes the reception center will continue to occupy the entire WCC with the exception of one medium unit of inmate workers and one close security unit for long-term offenders. Although CNAM initially shows the need for about 900 more medium beds, an additional 480 are needed due to converting a unit at the Washington Corrections Center to reception and converting another unit to close security. Since medium security housing units are built in increments of 256-beds each, this option will require building 1,536 beds of medium security capacity elsewhere in three phases.
Appendix H includes a detailed description of how operating cost impacts were calculated. Electronic files submitted to OFM show how capital costs and debt service were derived.
WASHINGTON CORRECTIONS CENTER - FINAL CONFIGURATION
Max /Cell Max RC-Close RC-Med Close Med/MI3 Total
Intensive Management Unit 62 1 62 62Reception
R1 - double 40 2 80 80R1 - single 40 1 40 40R2 - double 40 2 80 80R2 - single 40 1 40 40R3 - double 40 2 80 80R3 - single 40 1 40 40R5 - double 108 2 216 216R5 - single 12 1 12 12R6 - double 108 2 216 216R6 - single 12 1 12 12Cedar - double 108 2 216 216Cedar - single 12 1 12 12
General Population HousingR4 - double 60 2 120 120R4 - single 60 1 60 60Evergreen 120 2 240 240Total 62 360 684 180 240 1526
Summary: Proposed Reception Center Configuration Close Med TotalBeds in Single Cells 120 36 156Beds in Double Cells 240 648 888Beds 360 684 1044
Facility/Unit Cells Assumed Final Funded Capacity
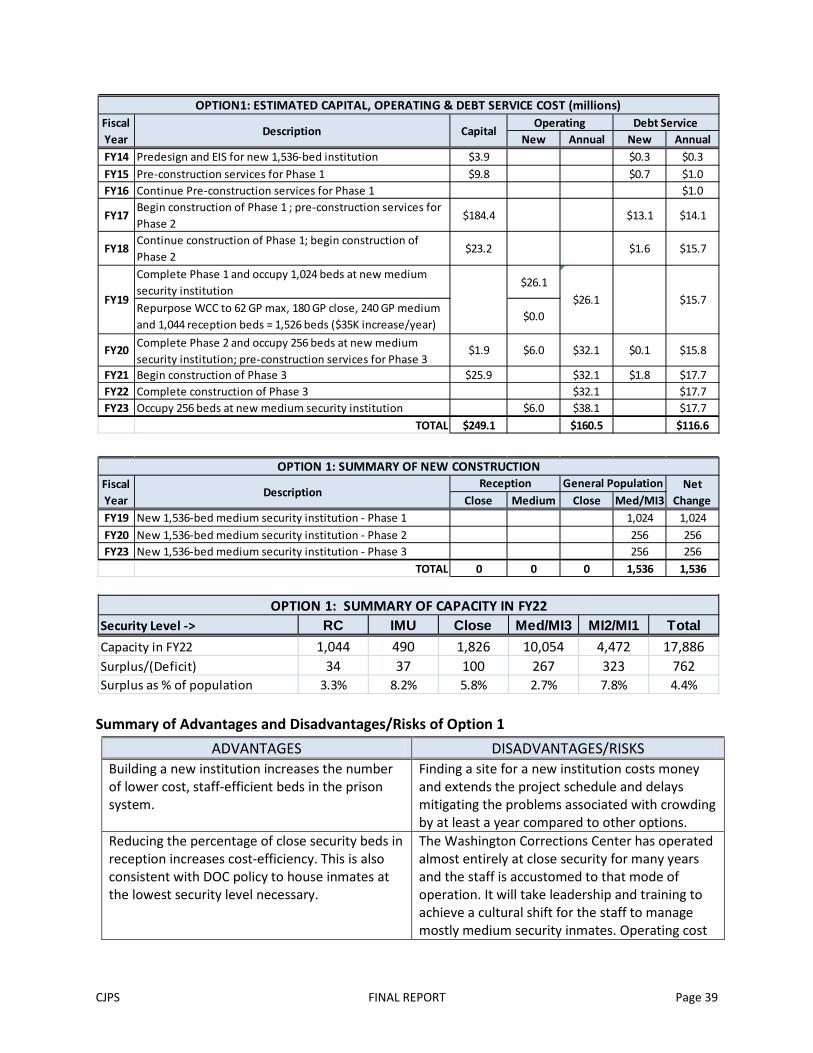
CJPS FINAL REPORT Page 39
Summary of Advantages and Disadvantages/Risks of Option 1
ADVANTAGES DISADVANTAGES/RISKS Building a new institution increases the number of lower cost, staff-efficient beds in the prison system.
Finding a site for a new institution costs money and extends the project schedule and delays mitigating the problems associated with crowding by at least a year compared to other options.
Reducing the percentage of close security beds in reception increases cost-efficiency. This is also consistent with DOC policy to house inmates at the lowest security level necessary.
The Washington Corrections Center has operated almost entirely at close security for many years and the staff is accustomed to that mode of operation. It will take leadership and training to achieve a cultural shift for the staff to manage mostly medium security inmates. Operating cost
New Annual New AnnualFY14 $3.9 $0.3 $0.3FY15 $9.8 $0.7 $1.0FY16 $1.0
FY17Begin construction of Phase 1 ; pre-construction services for Phase 2
$184.4 $13.1 $14.1
FY18 $23.2 $1.6 $15.7
$26.1
Repurpose WCC to 62 GP max, 180 GP close, 240 GP medium and 1,044 reception beds = 1,526 beds ($35K increase/year)
$0.0
FY20 $1.9 $6.0 $32.1 $0.1 $15.8
FY21 $25.9 $32.1 $1.8 $17.7FY22 Complete construction of Phase 3 $32.1 $17.7FY23 $6.0 $38.1 $17.7
TOTAL $249.1 $160.5 $116.6
FY19 $15.7
Begin construction of Phase 3
Occupy 256 beds at new medium security institution
Predesign and EIS for new 1,536-bed institutionPre-construction services for Phase 1Continue Pre-construction services for Phase 1
Continue construction of Phase 1; begin construction of Phase 2Complete Phase 1 and occupy 1,024 beds at new medium security institution
Complete Phase 2 and occupy 256 beds at new medium security institution; pre-construction services for Phase 3
$26.1
OPTION1: ESTIMATED CAPITAL, OPERATING & DEBT SERVICE COST (millions)Fiscal Year
Description CapitalOperating Debt Service
Close Medium Close Med/MI3FY19 New 1,536-bed medium security institution - Phase 1 1,024 1,024FY20 New 1,536-bed medium security institution - Phase 2 256 256FY23 New 1,536-bed medium security institution - Phase 3 256 256
TOTAL 0 0 0 1,536 1,536
General Population Net Change
OPTION 1: SUMMARY OF NEW CONSTRUCTIONFiscal Year
DescriptionReception
Security Level -> RC IMU Close Med/MI3 MI2/MI1 TotalCapacity in FY22 1,044 490 1,826 10,054 4,472 17,886Surplus/(Deficit) 34 37 100 267 323 762Surplus as % of population 3.3% 8.2% 5.8% 2.7% 7.8% 4.4%
OPTION 1: SUMMARY OF CAPACITY IN FY22
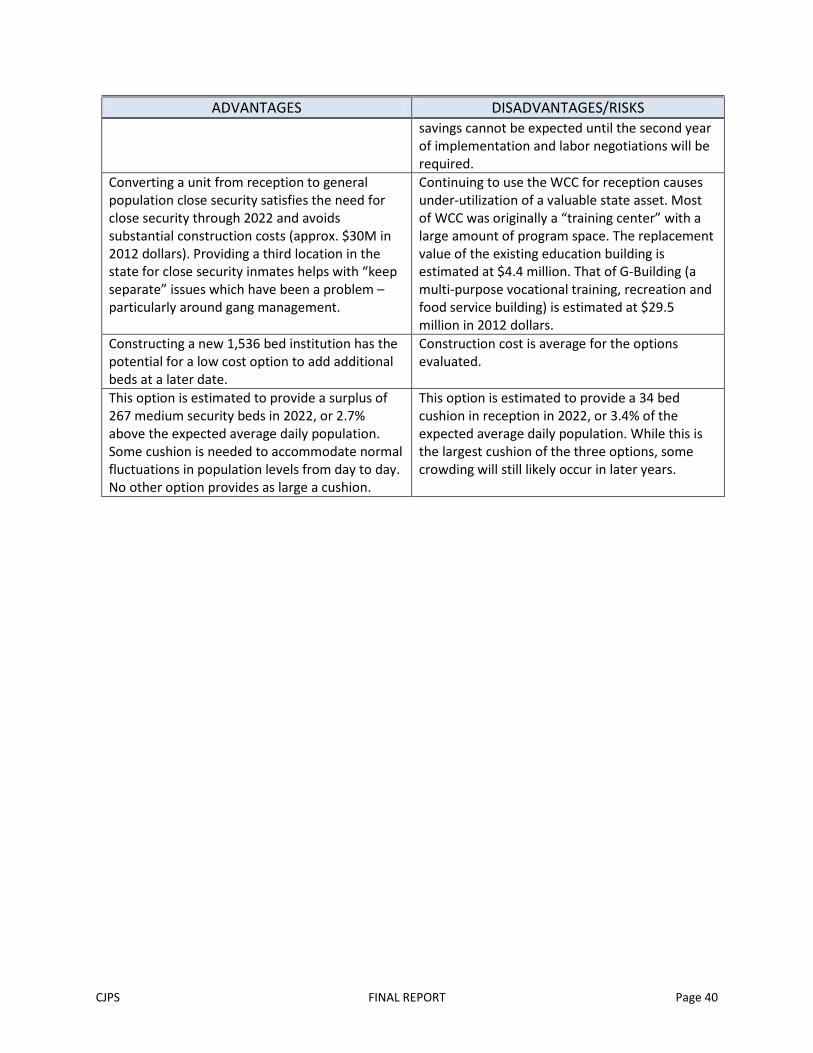
CJPS FINAL REPORT Page 40
ADVANTAGES DISADVANTAGES/RISKS savings cannot be expected until the second year of implementation and labor negotiations will be required.
Converting a unit from reception to general population close security satisfies the need for close security through 2022 and avoids substantial construction costs (approx. $30M in 2012 dollars). Providing a third location in the state for close security inmates helps with “keep separate” issues which have been a problem – particularly around gang management.
Continuing to use the WCC for reception causes under-utilization of a valuable state asset. Most of WCC was originally a “training center” with a large amount of program space. The replacement value of the existing education building is estimated at $4.4 million. That of G-Building (a multi-purpose vocational training, recreation and food service building) is estimated at $29.5 million in 2012 dollars.
Constructing a new 1,536 bed institution has the potential for a low cost option to add additional beds at a later date.
Construction cost is average for the options evaluated.
This option is estimated to provide a surplus of 267 medium security beds in 2022, or 2.7% above the expected average daily population. Some cushion is needed to accommodate normal fluctuations in population levels from day to day. No other option provides as large a cushion.
This option is estimated to provide a 34 bed cushion in reception in 2022, or 3.4% of the expected average daily population. While this is the largest cushion of the three options, some crowding will still likely occur in later years.

CJPS FINAL REPORT Page 41
78 7470
6559
5450 47 43 40 37
0
10
20
30
40
50
60
70
80
90
100
FY13 FY14 FY15 FY16 FY17 FY18 FY19 FY20 FY21 FY22 FY23
Surplus/(Deficit) Maximum Security (IMU)
10691
7253
28
174155
142127
112100
0
20
40
60
80
100
120
140
160
180
200
FY13 FY14 FY15 FY16 FY17 FY18 FY19 FY20 FY21 FY22 FY23
Surplus/(Deficit) Close Security
(191)
197
(325)
(490)
(142)
411
295 203
110 29
219
-600-500-400-300-200-100
0100200300400500
FY13 FY14 FY15 FY16 FY17 FY18 FY19 FY20 FY21 FY22 FY23
Surplus/(Deficit) Medium Security
512 medium beds added at WSP in FY14 & FY17.
R1, R2, R3 at WCC demolished in FY15
(153) (157)(171) (174) (178)
35 32 29 25 20 14
-250
-200
-150
-100
-50
0
50
100
FY13 FY14 FY15 FY16 FY17 FY18 FY19 FY20 FY21 FY22 FY23
Surplus/(Deficit) Reception
5.1.4 Option 2: Build a New Reception Center at the Washington Corrections Center Constructing a new 1,024 bed reception center at the Washington Corrections Center requires demolition of units R1, R2, R3 to create a suitable building site. With the loss of these units, all reception must take place in the former Training Center (R4, R5, R6, Evergreen and Cedar) until the new reception center is completed. Since Evergreen and Cedar are general population housing, converting them to reception causes a 480 bed increase in the deficit in medium security at other DOC institutions. In addition, Cedar currently houses inmate workers at WCC. To maintain a minimum complement of inmate kitchen, laundry, and other workers, it will be necessary to create a temporary 100-bed worker’s dormitory in Building G. This partially offsets the loss of medium security capacity caused by repurposing Evergreen and Cedar.
Demolition of R1, R2, R3 would take place in FY15 just before starting construction of the new reception center. The loss of medium security beds described in the preceding paragraph means that additional medium security housing must be added as quickly as possible. The fastest way to do this is to complete the build-out of medium security housing and associated support space at the Washington State Penitentiary.
Following completion of the new reception center, the former Training Center will revert to a long-term multi-custody facility comprised of one 180 bed close unit and four 240 bed medium units. This addresses the Department’s capacity needs for close security throughout the time period of this plan and until FY22 for medium security.
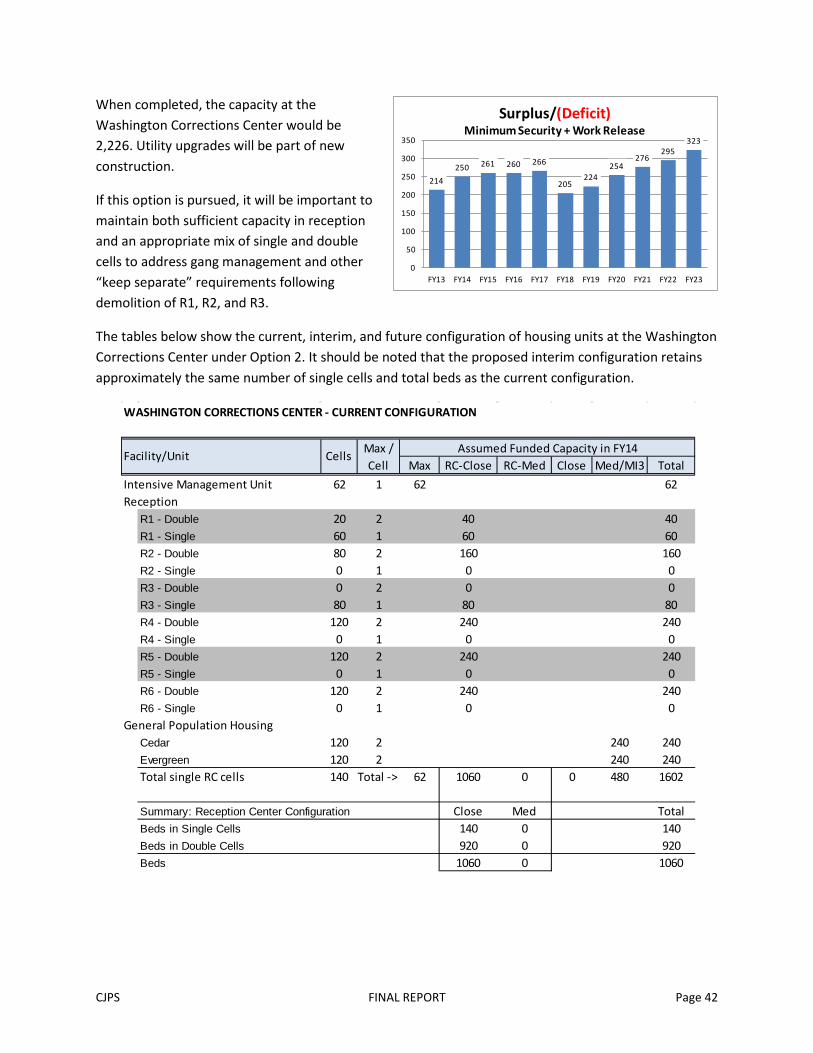
CJPS FINAL REPORT Page 42
214
250 261 260 266
205224
254276
295323
0
50
100
150
200
250
300
350
FY13 FY14 FY15 FY16 FY17 FY18 FY19 FY20 FY21 FY22 FY23
Surplus/(Deficit) Minimum Security + Work Release
When completed, the capacity at the Washington Corrections Center would be 2,226. Utility upgrades will be part of new construction.
If this option is pursued, it will be important to maintain both sufficient capacity in reception and an appropriate mix of single and double cells to address gang management and other “keep separate” requirements following demolition of R1, R2, and R3.
The tables below show the current, interim, and future configuration of housing units at the Washington Corrections Center under Option 2. It should be noted that the proposed interim configuration retains approximately the same number of single cells and total beds as the current configuration.
WASHINGTON CORRECTIONS CENTER - CURRENT CONFIGURATION
Max /Cell Max RC-Close RC-Med Close Med/MI3 Total
Intensive Management Unit 62 1 62 62Reception
R1 - Double 20 2 40 40R1 - Single 60 1 60 60R2 - Double 80 2 160 160R2 - Single 0 1 0 0R3 - Double 0 2 0 0R3 - Single 80 1 80 80R4 - Double 120 2 240 240R4 - Single 0 1 0 0R5 - Double 120 2 240 240R5 - Single 0 1 0 0R6 - Double 120 2 240 240R6 - Single 0 1 0 0
General Population HousingCedar 120 2 240 240Evergreen 120 2 240 240Total single RC cells 140 Total -> 62 1060 0 0 480 1602
Summary: Reception Center Configuration Close Med TotalBeds in Single Cells 140 0 140Beds in Double Cells 920 0 920Beds 1060 0 1060
Facility/Unit CellsAssumed Funded Capacity in FY14

CJPS FINAL REPORT Page 43
WASHINGTON CORRECTIONS CENTER - INTERIM CONFIGURATION
Max /Cell Max RC-Close RC-Med Close Med/MI3 Total
Intensive Management Unit 62 1 62 62Reception
Demolish R1 -80Demolish R2 -80Demolish R3 -80R4 - double 0 2 0 0R4 - single 120 1 120 120R5 - double 90 2 180 180R5 - single 30 1 30 30R6 - double 120 2 240 240R6 - single 0 1 0 0Convert Cedar to reception 120 2 240 240Convert Evergreen to reception 120 2 240 240
General Population HousingTemporary worker dorm in G Building 100 100Total 62 330 720 0 100 1212
Summary: Interim Reception Center Configuration Close Med TotalBeds in Single Cells 150 0 150Beds in Double Cells 180 720 900Beds 330 720 1050
WASHINGTON CORRECTIONS CENTER - FINAL CONFIGURATION
Max /Cell Max RC-Close RC-Med Close Med/MI3 Total
Intensive Management Unit 62 1 62 62Reception
New Reception Center 288 736 1024General Population Housing
R4 - double Close 60 2 120 120R4 - single Close 60 1 60 60R5 - double 120 2 240 240R5 - single 0 1 0 0R6 - double 120 2 240 240R6 - single 0 1 0 0Cedar 120 2 240 240Evergreen 120 2 240 240Total 62 288 736 180 960 2226
Summary: New Reception Center Configuration Close Med TotalBeds in Single Cells 96 32 128Beds in Double Cells 192 704 896Beds 288 736 1024
Assumed Interim Funded Capacity
Facility/Unit CellsAssumed Final Funded Capacity
Facility/Unit Cells
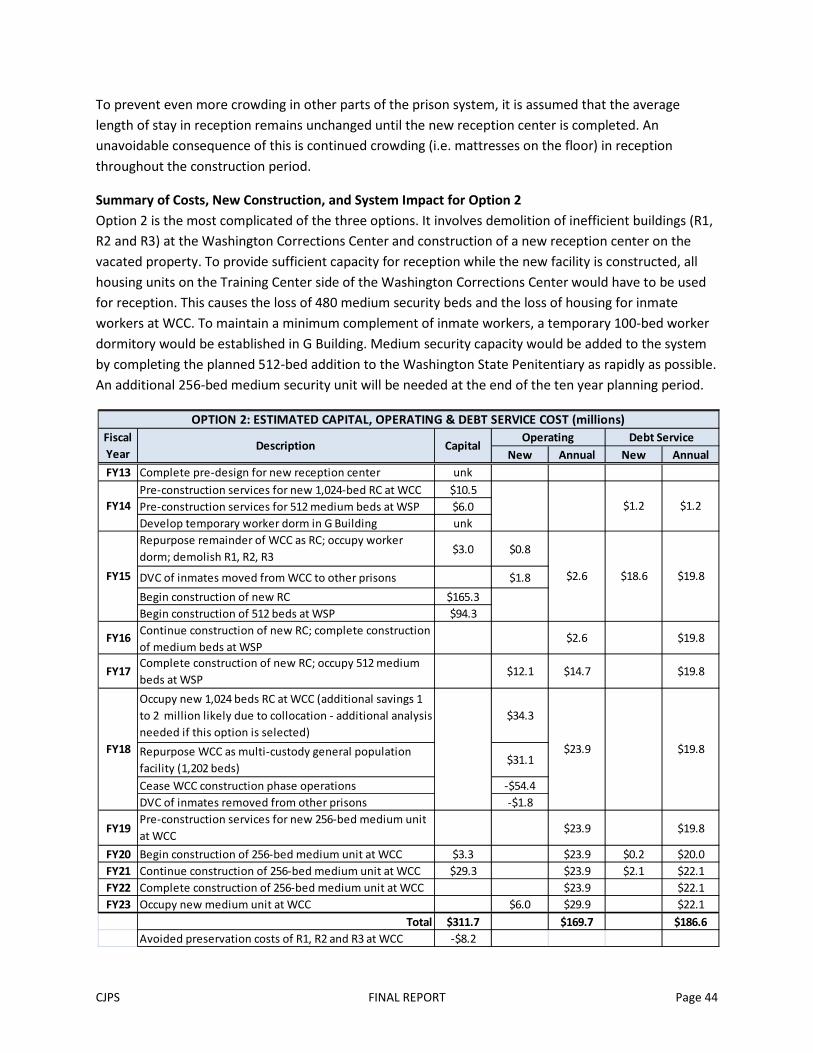
CJPS FINAL REPORT Page 44
To prevent even more crowding in other parts of the prison system, it is assumed that the average length of stay in reception remains unchanged until the new reception center is completed. An unavoidable consequence of this is continued crowding (i.e. mattresses on the floor) in reception throughout the construction period.
Summary of Costs, New Construction, and System Impact for Option 2 Option 2 is the most complicated of the three options. It involves demolition of inefficient buildings (R1, R2 and R3) at the Washington Corrections Center and construction of a new reception center on the vacated property. To provide sufficient capacity for reception while the new facility is constructed, all housing units on the Training Center side of the Washington Corrections Center would have to be used for reception. This causes the loss of 480 medium security beds and the loss of housing for inmate workers at WCC. To maintain a minimum complement of inmate workers, a temporary 100-bed worker dormitory would be established in G Building. Medium security capacity would be added to the system by completing the planned 512-bed addition to the Washington State Penitentiary as rapidly as possible. An additional 256-bed medium security unit will be needed at the end of the ten year planning period.
New Annual New AnnualFY13 unk
$10.5$6.0unk
$3.0 $0.8
DVC of inmates moved from WCC to other prisons $1.8
$165.3$94.3
FY16 $2.6 $19.8
FY17Complete construction of new RC; occupy 512 medium beds at WSP
$12.1 $14.7 $19.8
$34.3
$31.1
Cease WCC construction phase operations -$54.4-$1.8
FY19 $23.9 $19.8
FY20 $3.3 $23.9 $0.2 $20.0FY21 $29.3 $23.9 $2.1 $22.1FY22 $23.9 $22.1FY23 $6.0 $29.9 $22.1
Total $311.7 $169.7 $186.6-$8.2
$23.9
$1.2
$19.8
$19.8
$2.6 $18.6
$1.2
Avoided preservation costs of R1, R2 and R3 at WCC
Debt ServiceOPTION 2: ESTIMATED CAPITAL, OPERATING & DEBT SERVICE COST (millions)
Fiscal Year
Description CapitalOperating
FY18
Develop temporary worker dorm in G Building
Pre-construction services for new 1,024-bed RC at WCC
Begin construction of new RC
Continue construction of new RC; complete construction of medium beds at WSP
Occupy new 1,024 beds RC at WCC (additional savings 1 to 2 million likely due to collocation - additional analysis needed if this option is selected)
Complete pre-design for new reception center
Repurpose WCC as multi-custody general population facility (1,202 beds)
DVC of inmates removed from other prisons
FY14 Pre-construction services for 512 medium beds at WSP
Repurpose remainder of WCC as RC; occupy worker dorm; demolish R1, R2, R3
Begin construction of 512 beds at WSP
FY15
Begin construction of 256-bed medium unit at WCCContinue construction of 256-bed medium unit at WCC
Occupy new medium unit at WCC
Pre-construction services for new 256-bed medium unit at WCC
Complete construction of 256-bed medium unit at WCC
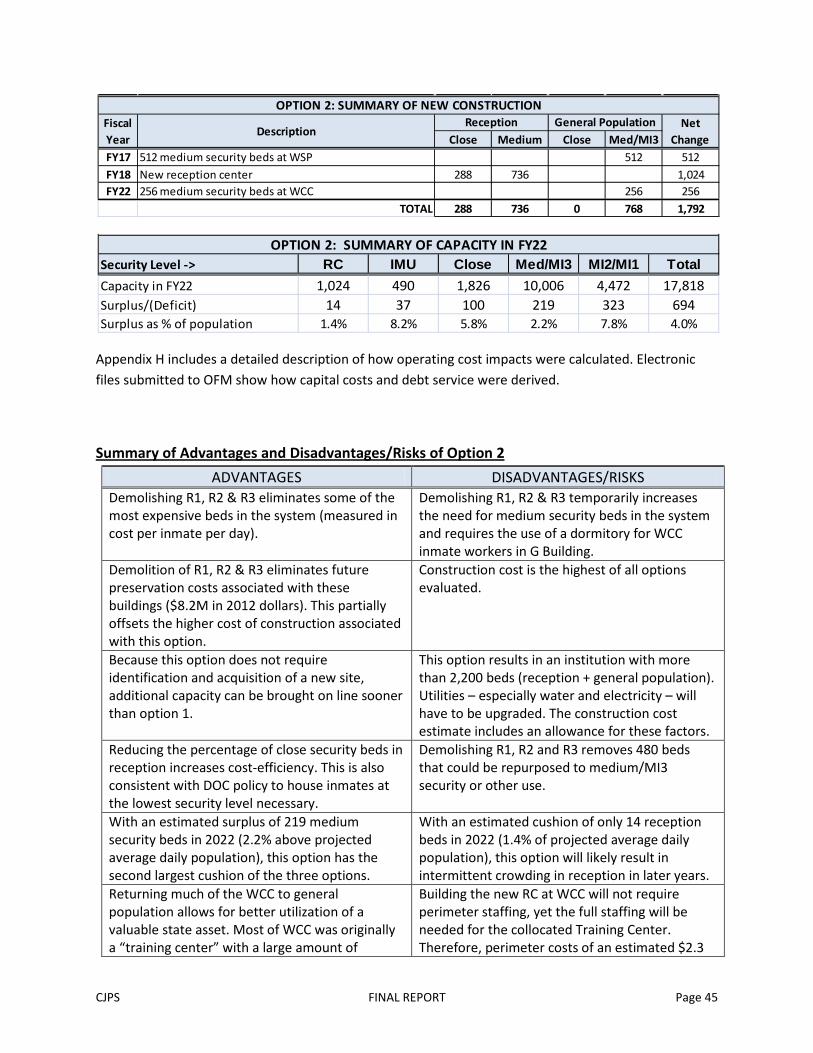
CJPS FINAL REPORT Page 45
Appendix H includes a detailed description of how operating cost impacts were calculated. Electronic files submitted to OFM show how capital costs and debt service were derived.
Summary of Advantages and Disadvantages/Risks of Option 2
ADVANTAGES DISADVANTAGES/RISKS Demolishing R1, R2 & R3 eliminates some of the most expensive beds in the system (measured in cost per inmate per day).
Demolishing R1, R2 & R3 temporarily increases the need for medium security beds in the system and requires the use of a dormitory for WCC inmate workers in G Building.
Demolition of R1, R2 & R3 eliminates future preservation costs associated with these buildings ($8.2M in 2012 dollars). This partially offsets the higher cost of construction associated with this option.
Construction cost is the highest of all options evaluated.
Because this option does not require identification and acquisition of a new site, additional capacity can be brought on line sooner than option 1.
This option results in an institution with more than 2,200 beds (reception + general population). Utilities – especially water and electricity – will have to be upgraded. The construction cost estimate includes an allowance for these factors.
Reducing the percentage of close security beds in reception increases cost-efficiency. This is also consistent with DOC policy to house inmates at the lowest security level necessary.
Demolishing R1, R2 and R3 removes 480 beds that could be repurposed to medium/MI3 security or other use.
With an estimated surplus of 219 medium security beds in 2022 (2.2% above projected average daily population), this option has the second largest cushion of the three options.
With an estimated cushion of only 14 reception beds in 2022 (1.4% of projected average daily population), this option will likely result in intermittent crowding in reception in later years.
Returning much of the WCC to general population allows for better utilization of a valuable state asset. Most of WCC was originally a “training center” with a large amount of
Building the new RC at WCC will not require perimeter staffing, yet the full staffing will be needed for the collocated Training Center. Therefore, perimeter costs of an estimated $2.3
Close Medium Close Med/MI3FY17 512 medium security beds at WSP 512 512FY18 New reception center 288 736 1,024FY22 256 medium security beds at WCC 256 256
TOTAL 288 736 0 768 1,792
OPTION 2: SUMMARY OF NEW CONSTRUCTIONFiscal Year
DescriptionReception General Population Net
Change
Security Level -> RC IMU Close Med/MI3 MI2/MI1 TotalCapacity in FY22 1,024 490 1,826 10,006 4,472 17,818Surplus/(Deficit) 14 37 100 219 323 694Surplus as % of population 1.4% 8.2% 5.8% 2.2% 7.8% 4.0%
OPTION 2: SUMMARY OF CAPACITY IN FY22
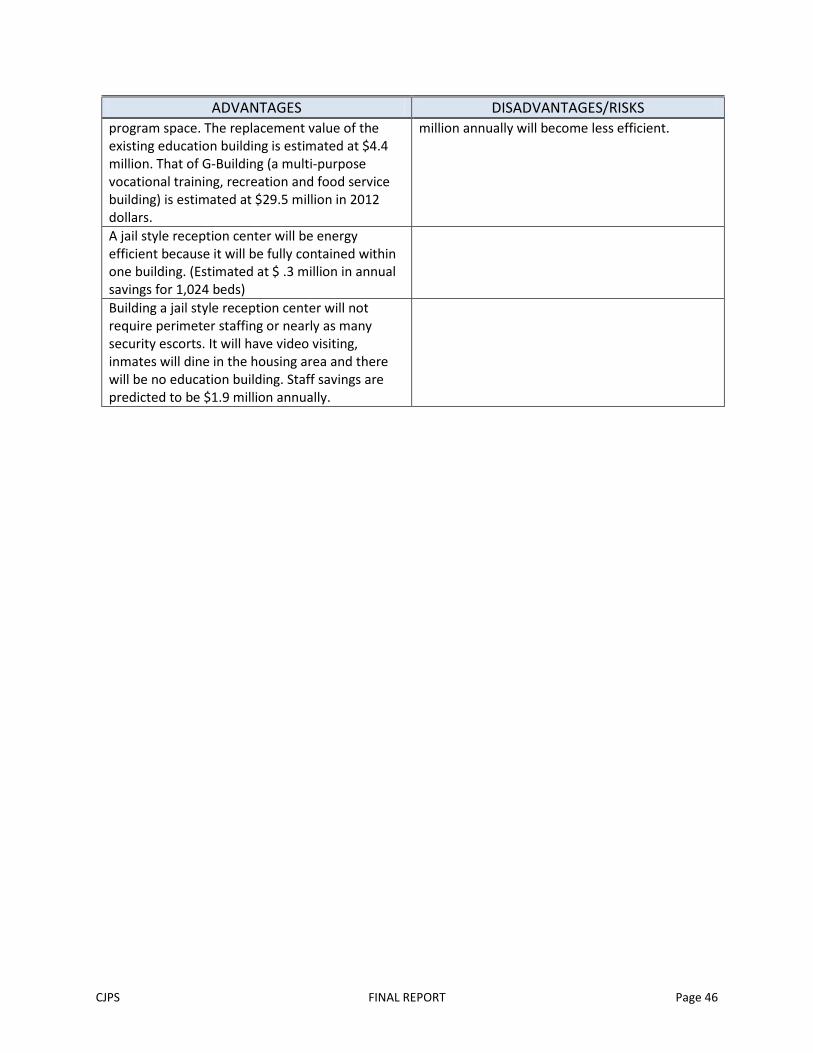
CJPS FINAL REPORT Page 46
ADVANTAGES DISADVANTAGES/RISKS program space. The replacement value of the existing education building is estimated at $4.4 million. That of G-Building (a multi-purpose vocational training, recreation and food service building) is estimated at $29.5 million in 2012 dollars.
million annually will become less efficient.
A jail style reception center will be energy efficient because it will be fully contained within one building. (Estimated at $ .3 million in annual savings for 1,024 beds)
Building a jail style reception center will not require perimeter staffing or nearly as many security escorts. It will have video visiting, inmates will dine in the housing area and there will be no education building. Staff savings are predicted to be $1.9 million annually.

CJPS FINAL REPORT Page 47
(153) (157) (161) (164) (168)
35 32 29 25 20 14
-200
-150
-100
-50
0
50
100
FY13 FY14 FY15 FY16 FY17 FY18 FY19 FY20 FY21 FY22 FY23
Surplus/(Deficit) Reception
7874
7065
5954
50 47 43 40 37
0
10
20
30
40
50
60
70
80
90
FY13 FY14 FY15 FY16 FY17 FY18 FY19 FY20 FY21 FY22 FY23
Surplus/(Deficit) Maximum Security (IMU)
10691
7253
28
174155
142127
112100
0
20
40
60
80
100
120
140
160
180
200
FY13 FY14 FY15 FY16 FY17 FY18 FY19 FY20 FY21 FY22 FY23
Surplus/(Deficit) Close Security
(191)
197
55
(110)
(274)
379
263
171
78
253 187
-400
-300
-200
-100
0
100
200
300
400
500
FY13 FY14 FY15 FY16 FY17 FY18 FY19 FY20 FY21 FY22 FY23
Surplus/(Deficit) Medium Security
5.1.5 Option 3: Build New Reception Center at Maple Lane Constructing a new 1,024 bed reception center at Maple Lane allows for continued operation of the existing reception center at the Washington Corrections Center without change until the new facility is completed. Following completion of the new reception center, all of WCC, including R1, R2 and R3, would become a long-term multi-custody facility for maximum, close, medium, and MI3 inmates. Because of their small size and the supervision challenges they present, it is proposed that R1, R2, and R3 be converted to less staff-intensive MI3 living units. One unit on the Training Center side would become a 180-bed close security unit. The IMU would remain unchanged. All other housing units would be double celled medium security units. The final capacity of the Washington Corrections Center would be 1,682, 80 more than its assumed funded capacity in FY14.
For the cost of constructing 1,024 beds at Maple Lane, and repurposing the Washington Corrections Center, there is a net gain of 1,104 male prison beds, essentially providing 80 “free” beds. The math is shown below.
Beds New reception center 1,024 Revised WCC capacity 1,682 Total for two facilities 2,706 Less former WCC capacity 1,602 Total increase 1,104 Less new reception center 1,024 Total “free” beds 80
The repurposing of WCC addresses the capacity needs of the Department of Corrections for close security throughout the time period of this plan. It also meets the capacity needs at

CJPS FINAL REPORT Page 48
214
250 261 260 266
205224
254276
295323
0
50
100
150
200
250
300
350
FY13 FY14 FY15 FY16 FY17 FY18 FY19 FY20 FY21 FY22 FY23
Surplus/(Deficit) Minimum Security + Work Release
medium security through FY21, after which it is likely that a new 256 bed medium security unit will be needed. This unit could be constructed at the Washington State Penitentiary or at the Washington Corrections Center. Because of support service needs associated with expansion at the Penitentiary, adding a unit at the Washington Corrections Center is the less expensive alternative. It also adds prison capacity to Western Washington where most offenders originate.
Summary of Costs, New Construction, and System Impact for Option 3 Constructing a new 1,024-bed reception center at Maple Lane is the fastest, least expensive, and least complicated of the three options. Construction would take place on a site where inmates are not present, thereby simplifying and speeding access to the site by construction workers. Once the new facility is completed, the entire Washington Corrections Center would become a multi-custody institution with maximum, close, medium, and MI3 housing units. An additional 256-bed medium security housing unit is projected to be needed late in the ten year plan.
Appendix H includes a detailed description of how operating cost impacts were calculated. Electronic files submitted to OFM show how capital costs and debt service were derived.
New Annual New Annual
FY14 $12.1 $0.9 $0.9
FY15 $187.1 $13.3 $14.1FY16 $0.4 $0.0 $14.2
FY17 Complete construction of new RC; ML preservation costs $0.3 $0.0 $14.2
$34.3
$43.3
-$53.6
FY19 $3.2 $24.0 $0.2 $14.4
FY20 $28.4 $24.0 $2.0 $16.4FY21 $24.0 $16.4FY22 $6.0 $30.0 $16.4FY23 $30.0 $16.4
TOTAL $231.4 $156.0 $137.6
$5.2 $6.1 Annual from FY17 -> $0.4
Pre-construction services for new 1,024-bed RC at Maple Lane; ML preservation costs
Fiscal Year
OPTION 3: ESTIMATED CAPITAL, OPERATING & DEBT SERVICE COST (millions)
Description
Optional: Open 200 minimum beds at Maple Lane in FY18
Debt ServiceOperating
Continue construction of new RC; ML preservation costs
Occupy new medium unit at WCC
Begin construction of new RC at Maple Lane
Capital
Occupy new RC at Maple Lane
Pre-construction services for new 256-bed medium unit at WCCBegin construction of new medium unit at WCCComplete construction of new medium unit at WCC
Cease operating WCC as a combined RC/GP institution
FY18 $14.2$24.0Repurpose WCC as multi-custody general population institution
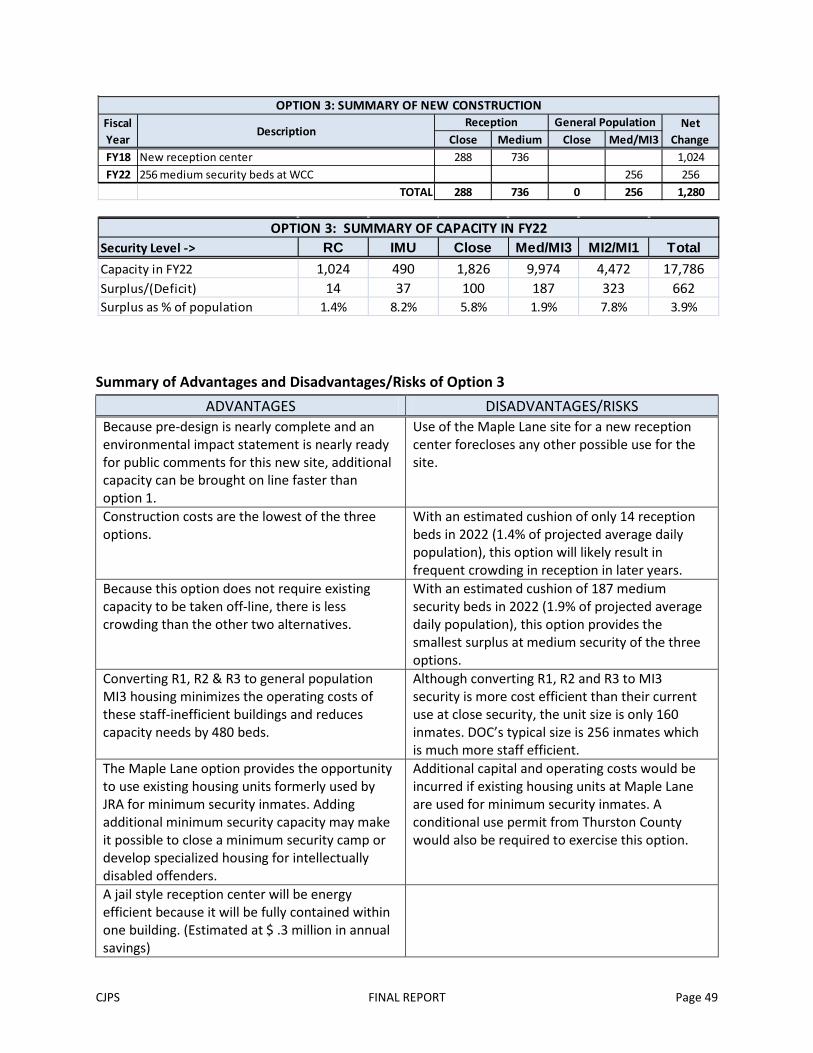
CJPS FINAL REPORT Page 49
Summary of Advantages and Disadvantages/Risks of Option 3
ADVANTAGES DISADVANTAGES/RISKS Because pre-design is nearly complete and an environmental impact statement is nearly ready for public comments for this new site, additional capacity can be brought on line faster than option 1.
Use of the Maple Lane site for a new reception center forecloses any other possible use for the site.
Construction costs are the lowest of the three options.
With an estimated cushion of only 14 reception beds in 2022 (1.4% of projected average daily population), this option will likely result in frequent crowding in reception in later years.
Because this option does not require existing capacity to be taken off-line, there is less crowding than the other two alternatives.
With an estimated cushion of 187 medium security beds in 2022 (1.9% of projected average daily population), this option provides the smallest surplus at medium security of the three options.
Converting R1, R2 & R3 to general population MI3 housing minimizes the operating costs of these staff-inefficient buildings and reduces capacity needs by 480 beds.
Although converting R1, R2 and R3 to MI3 security is more cost efficient than their current use at close security, the unit size is only 160 inmates. DOC’s typical size is 256 inmates which is much more staff efficient.
The Maple Lane option provides the opportunity to use existing housing units formerly used by JRA for minimum security inmates. Adding additional minimum security capacity may make it possible to close a minimum security camp or develop specialized housing for intellectually disabled offenders.
Additional capital and operating costs would be incurred if existing housing units at Maple Lane are used for minimum security inmates. A conditional use permit from Thurston County would also be required to exercise this option.
A jail style reception center will be energy efficient because it will be fully contained within one building. (Estimated at $ .3 million in annual savings)
Close Medium Close Med/MI3FY18 New reception center 288 736 1,024FY22 256 medium security beds at WCC 256 256
TOTAL 288 736 0 256 1,280
OPTION 3: SUMMARY OF NEW CONSTRUCTIONFiscal Year
DescriptionReception General Population Net
Change
Security Level -> RC IMU Close Med/MI3 MI2/MI1 TotalCapacity in FY22 1,024 490 1,826 9,974 4,472 17,786Surplus/(Deficit) 14 37 100 187 323 662Surplus as % of population 1.4% 8.2% 5.8% 1.9% 7.8% 3.9%
OPTION 3: SUMMARY OF CAPACITY IN FY22
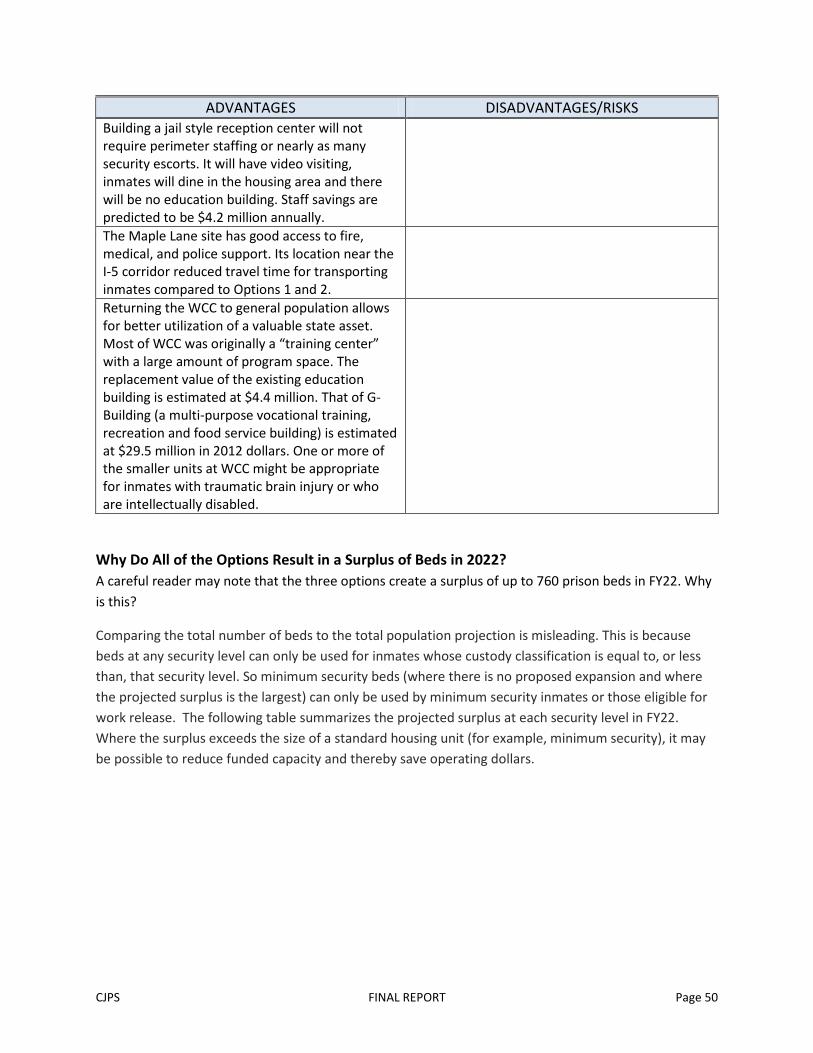
CJPS FINAL REPORT Page 50
ADVANTAGES DISADVANTAGES/RISKS Building a jail style reception center will not require perimeter staffing or nearly as many security escorts. It will have video visiting, inmates will dine in the housing area and there will be no education building. Staff savings are predicted to be $4.2 million annually.
The Maple Lane site has good access to fire, medical, and police support. Its location near the I-5 corridor reduced travel time for transporting inmates compared to Options 1 and 2.
Returning the WCC to general population allows for better utilization of a valuable state asset. Most of WCC was originally a “training center” with a large amount of program space. The replacement value of the existing education building is estimated at $4.4 million. That of G-Building (a multi-purpose vocational training, recreation and food service building) is estimated at $29.5 million in 2012 dollars. One or more of the smaller units at WCC might be appropriate for inmates with traumatic brain injury or who are intellectually disabled.
Why Do All of the Options Result in a Surplus of Beds in 2022? A careful reader may note that the three options create a surplus of up to 760 prison beds in FY22. Why is this?
Comparing the total number of beds to the total population projection is misleading. This is because beds at any security level can only be used for inmates whose custody classification is equal to, or less than, that security level. So minimum security beds (where there is no proposed expansion and where the projected surplus is the largest) can only be used by minimum security inmates or those eligible for work release. The following table summarizes the projected surplus at each security level in FY22. Where the surplus exceeds the size of a standard housing unit (for example, minimum security), it may be possible to reduce funded capacity and thereby save operating dollars.

CJPS FINAL REPORT Page 51
PROJECTED FY22 BED SURPLUS BY SECURITY LEVEL
So the overall surplus of beds is not particularly relevant, but why is there any surplus at any security level? There are two answers to this question. First, housing units are built in standard sizes which are based on staffing efficiency. Building less than an entire unit might, in the short run, save capital dollars, but it would increase the operating cost per offender. Second, the population forecast is for the expected average population over the course of a year. Typical day-to-day variation in population levels means that, where the number of surplus beds is a small compared to the projected population for that security level, there will be times when facilities are crowded. A small surplus helps reduce the number of times when this happens.
Summary of Estimated Daily Cost per Offender A useful tool in evaluating options is to compare the cost per day per offender of the components of each option. Where costs are similar it is important to consider the advantages and disadvantages of each option including crowding, timing and capital investment.
RC IMU Close Med/MI3 Min/Wk RelPOPULATION FORECAST FY22 1,010 453 1,726 9,787 4,149 17,124Capacity in FY22Option 1 1,044 490 1,826 10,054 4,472 17,886Option 2 1,024 490 1,826 10,006 4,472 17,818Option 3 1,024 490 1,826 9,974 4,472 17,786Surplus Beds (Number and % of projected population)Maximum 34 / 3.3% 37 / 8.2% 100 / 5.8% 267 / 2.7% 323 / 7.8% 762 / 4.4%Minimum 14 / 1.4% 37 / 8.2% 100 / 5.8% 187 / 2.2% 323 / 7.8% 662 / 4.0%
SECURITY LEVEL Total
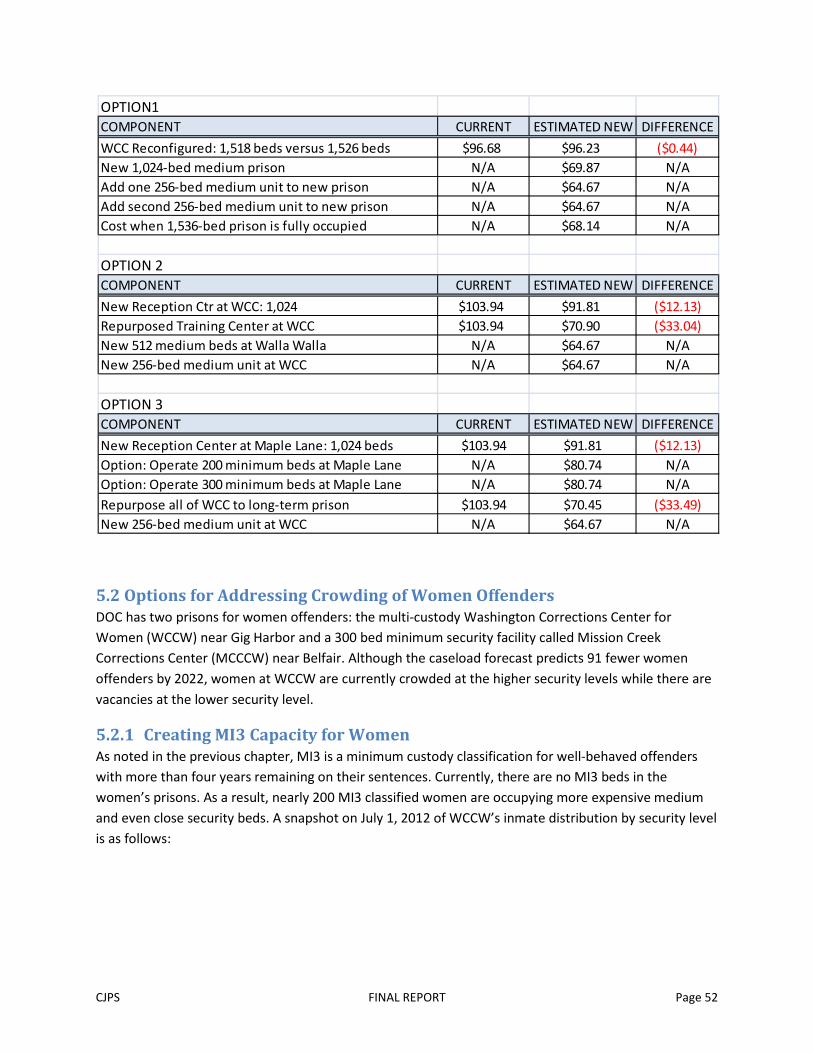
CJPS FINAL REPORT Page 52
5.2 Options for Addressing Crowding of Women Offenders DOC has two prisons for women offenders: the multi-custody Washington Corrections Center for Women (WCCW) near Gig Harbor and a 300 bed minimum security facility called Mission Creek Corrections Center (MCCCW) near Belfair. Although the caseload forecast predicts 91 fewer women offenders by 2022, women at WCCW are currently crowded at the higher security levels while there are vacancies at the lower security level.
5.2.1 Creating MI3 Capacity for Women As noted in the previous chapter, MI3 is a minimum custody classification for well-behaved offenders with more than four years remaining on their sentences. Currently, there are no MI3 beds in the women’s prisons. As a result, nearly 200 MI3 classified women are occupying more expensive medium and even close security beds. A snapshot on July 1, 2012 of WCCW’s inmate distribution by security level is as follows:
OPTION1COMPONENT CURRENT ESTIMATED NEW DIFFERENCE
WCC Reconfigured: 1,518 beds versus 1,526 beds $96.68 $96.23 ($0.44)New 1,024-bed medium prison N/A $69.87 N/AAdd one 256-bed medium unit to new prison N/A $64.67 N/AAdd second 256-bed medium unit to new prison N/A $64.67 N/ACost when 1,536-bed prison is fully occupied N/A $68.14 N/A
OPTION 2COMPONENT CURRENT ESTIMATED NEW DIFFERENCE
New Reception Ctr at WCC: 1,024 $103.94 $91.81 ($12.13)Repurposed Training Center at WCC $103.94 $70.90 ($33.04)New 512 medium beds at Walla Walla N/A $64.67 N/ANew 256-bed medium unit at WCC N/A $64.67 N/A
OPTION 3COMPONENT CURRENT ESTIMATED NEW DIFFERENCE
New Reception Center at Maple Lane: 1,024 beds $103.94 $91.81 ($12.13)Option: Operate 200 minimum beds at Maple Lane N/A $80.74 N/AOption: Operate 300 minimum beds at Maple Lane N/A $80.74 N/ARepurpose all of WCC to long-term prison $103.94 $70.45 ($33.49)New 256-bed medium unit at WCC N/A $64.67 N/A
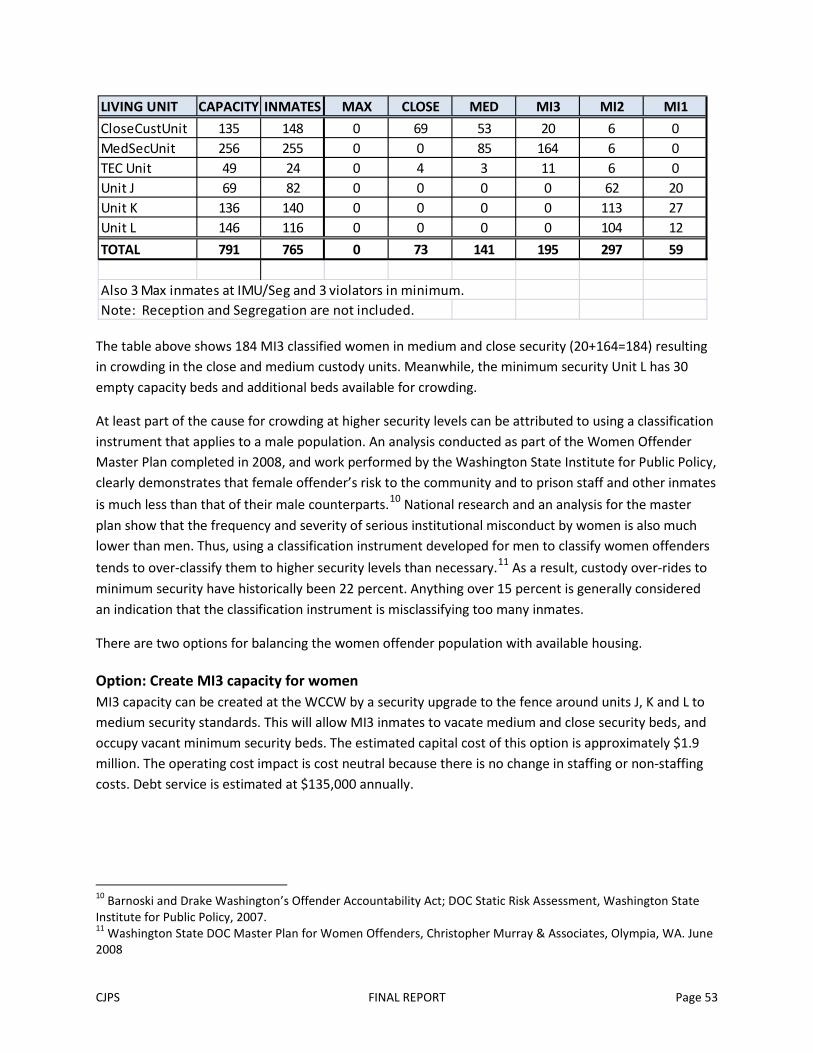
CJPS FINAL REPORT Page 53
The table above shows 184 MI3 classified women in medium and close security (20+164=184) resulting in crowding in the close and medium custody units. Meanwhile, the minimum security Unit L has 30 empty capacity beds and additional beds available for crowding.
At least part of the cause for crowding at higher security levels can be attributed to using a classification instrument that applies to a male population. An analysis conducted as part of the Women Offender Master Plan completed in 2008, and work performed by the Washington State Institute for Public Policy, clearly demonstrates that female offender’s risk to the community and to prison staff and other inmates
is much less than that of their male counterparts.10 National research and an analysis for the master plan show that the frequency and severity of serious institutional misconduct by women is also much lower than men. Thus, using a classification instrument developed for men to classify women offenders
tends to over-classify them to higher security levels than necessary.11 As a result, custody over-rides to minimum security have historically been 22 percent. Anything over 15 percent is generally considered an indication that the classification instrument is misclassifying too many inmates.
There are two options for balancing the women offender population with available housing.
Option: Create MI3 capacity for women MI3 capacity can be created at the WCCW by a security upgrade to the fence around units J, K and L to medium security standards. This will allow MI3 inmates to vacate medium and close security beds, and occupy vacant minimum security beds. The estimated capital cost of this option is approximately $1.9 million. The operating cost impact is cost neutral because there is no change in staffing or non-staffing costs. Debt service is estimated at $135,000 annually.
10 Barnoski and Drake Washington’s Offender Accountability Act; DOC Static Risk Assessment, Washington State Institute for Public Policy, 2007. 11 Washington State DOC Master Plan for Women Offenders, Christopher Murray & Associates, Olympia, WA. June 2008
LIVING UNIT CAPACITY INMATES MAX CLOSE MED MI3 MI2 MI1
CloseCustUnit 135 148 0 69 53 20 6 0MedSecUnit 256 255 0 0 85 164 6 0TEC Unit 49 24 0 4 3 11 6 0Unit J 69 82 0 0 0 0 62 20Unit K 136 140 0 0 0 0 113 27Unit L 146 116 0 0 0 0 104 12
TOTAL 791 765 0 73 141 195 297 59
Also 3 Max inmates at IMU/Seg and 3 violators in minimum.Note: Reception and Segregation are not included.
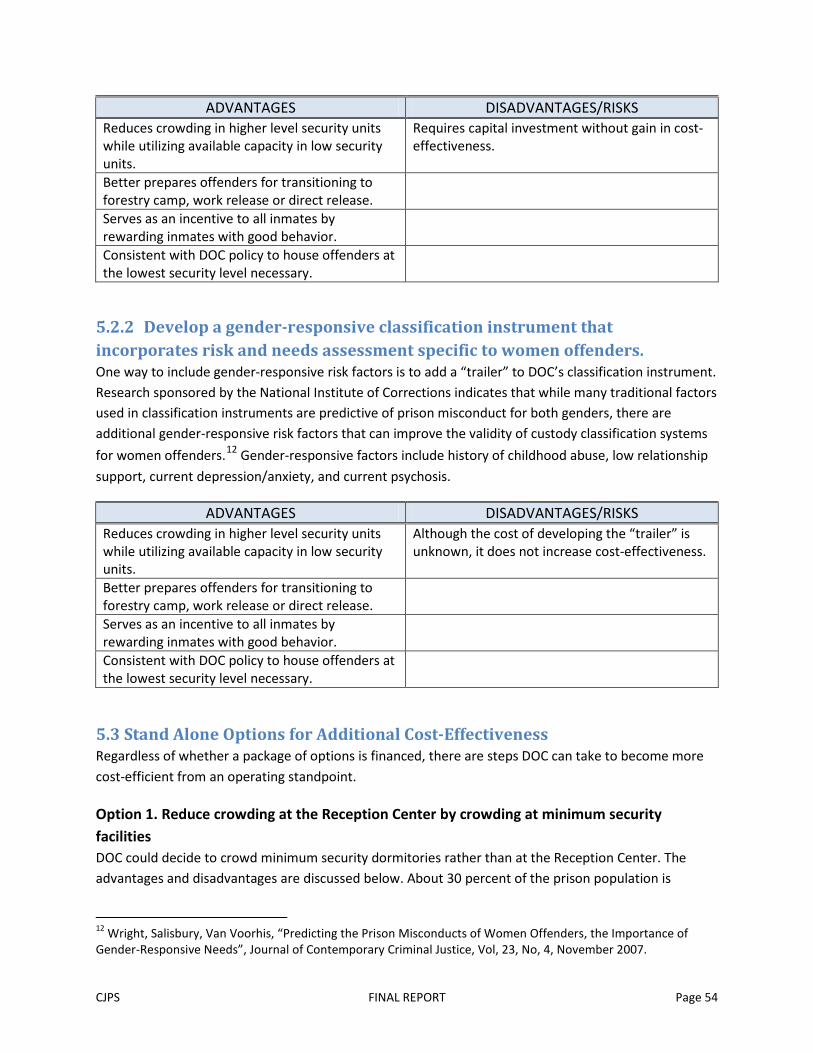
CJPS FINAL REPORT Page 54
ADVANTAGES DISADVANTAGES/RISKS Reduces crowding in higher level security units while utilizing available capacity in low security units.
Requires capital investment without gain in cost-effectiveness.
Better prepares offenders for transitioning to forestry camp, work release or direct release.
Serves as an incentive to all inmates by rewarding inmates with good behavior.
Consistent with DOC policy to house offenders at the lowest security level necessary.
5.2.2 Develop a gender-responsive classification instrument that incorporates risk and needs assessment specific to women offenders. One way to include gender-responsive risk factors is to add a “trailer” to DOC’s classification instrument. Research sponsored by the National Institute of Corrections indicates that while many traditional factors used in classification instruments are predictive of prison misconduct for both genders, there are additional gender-responsive risk factors that can improve the validity of custody classification systems
for women offenders.12 Gender-responsive factors include history of childhood abuse, low relationship
support, current depression/anxiety, and current psychosis.
ADVANTAGES DISADVANTAGES/RISKS Reduces crowding in higher level security units while utilizing available capacity in low security units.
Although the cost of developing the “trailer” is unknown, it does not increase cost-effectiveness.
Better prepares offenders for transitioning to forestry camp, work release or direct release.
Serves as an incentive to all inmates by rewarding inmates with good behavior.
Consistent with DOC policy to house offenders at the lowest security level necessary.
5.3 Stand Alone Options for Additional Cost-Effectiveness Regardless of whether a package of options is financed, there are steps DOC can take to become more cost-efficient from an operating standpoint.
Option 1. Reduce crowding at the Reception Center by crowding at minimum security facilities DOC could decide to crowd minimum security dormitories rather than at the Reception Center. The advantages and disadvantages are discussed below. About 30 percent of the prison population is
12 Wright, Salisbury, Van Voorhis, “Predicting the Prison Misconducts of Women Offenders, the Importance of Gender-Responsive Needs”, Journal of Contemporary Criminal Justice, Vol, 23, No, 4, November 2007.
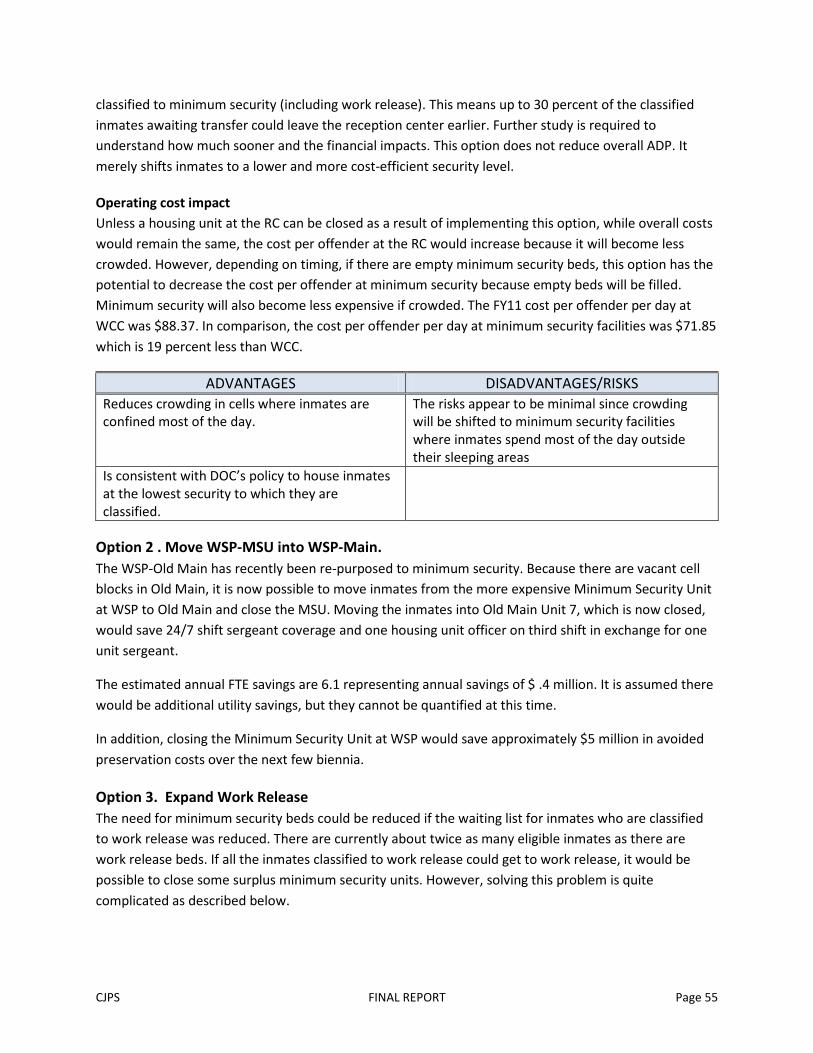
CJPS FINAL REPORT Page 55
classified to minimum security (including work release). This means up to 30 percent of the classified inmates awaiting transfer could leave the reception center earlier. Further study is required to understand how much sooner and the financial impacts. This option does not reduce overall ADP. It merely shifts inmates to a lower and more cost-efficient security level.
Operating cost impact Unless a housing unit at the RC can be closed as a result of implementing this option, while overall costs would remain the same, the cost per offender at the RC would increase because it will become less crowded. However, depending on timing, if there are empty minimum security beds, this option has the potential to decrease the cost per offender at minimum security because empty beds will be filled. Minimum security will also become less expensive if crowded. The FY11 cost per offender per day at WCC was $88.37. In comparison, the cost per offender per day at minimum security facilities was $71.85 which is 19 percent less than WCC.
ADVANTAGES DISADVANTAGES/RISKS Reduces crowding in cells where inmates are confined most of the day.
The risks appear to be minimal since crowding will be shifted to minimum security facilities where inmates spend most of the day outside their sleeping areas
Is consistent with DOC’s policy to house inmates at the lowest security to which they are classified.
Option 2 . Move WSP-MSU into WSP-Main. The WSP-Old Main has recently been re-purposed to minimum security. Because there are vacant cell blocks in Old Main, it is now possible to move inmates from the more expensive Minimum Security Unit at WSP to Old Main and close the MSU. Moving the inmates into Old Main Unit 7, which is now closed, would save 24/7 shift sergeant coverage and one housing unit officer on third shift in exchange for one unit sergeant.
The estimated annual FTE savings are 6.1 representing annual savings of $ .4 million. It is assumed there would be additional utility savings, but they cannot be quantified at this time.
In addition, closing the Minimum Security Unit at WSP would save approximately $5 million in avoided preservation costs over the next few biennia.
Option 3. Expand Work Release The need for minimum security beds could be reduced if the waiting list for inmates who are classified to work release was reduced. There are currently about twice as many eligible inmates as there are work release beds. If all the inmates classified to work release could get to work release, it would be possible to close some surplus minimum security units. However, solving this problem is quite complicated as described below.

CJPS FINAL REPORT Page 56
Background Information Work release facilities are community based half-way houses that serve as a bridge between prisons and the community. Washington currently has 16 facilities serving about 700 offenders at a time. Work release is considered partial confinement and is authorized in statute for DOC approved offenders for up
to six months of the offender’s term of confinement. 13.
Offenders apply for work release while in prison and if approved, the application is forwarded to the work release facility for screening. Offenders who transfer to a work release facility agree to:
• Find and maintain employment.
• Financially contribute to their cost of incarceration on an ability to pay basis.
• Be confined unless they work or are on a supervised outing to visit family members.
• Undergo frequent tests for substance abuse.
• Be monitored on their trips back and forth to work to ensure their movements allow enough time to get to work without any pre-arranged stops.
• Continue therapy, parenting classes, stress and anger management training, and substance abuse group participation such as Alcoholics and Narcotics Anonymous.
• Be monitored for behavior appropriate to the work place and other locations.
DOC has a three step policy for providing and monitoring graduated community access for work release
offenders.14 This access is based on time in the facility, progress in meeting individual plan objectives
including following all rules, and risk to the public.
Capacity Needs for Work Release Additional capacity is needed for work release for both men and women offenders. As a result, many inmates who are classified to work release finish their sentences at minimum security and are discharged straight to the community.
Past efforts by DOC to expand its work release capacity have met resistance due to the NIMBY (“not in my back yard”) effect. In 2008, the legislature authorized a Statewide Work Release Siting Advisory
Committee. 15 The committee’s task, among other things, was to develop a plan to ensure equitable distribution of work release offenders throughout the state. The legislation was partially in response to DOC’s goal to double its operational capacity of work release facilities to 1,200 beds statewide. The committee concluded that the most equitable method throughout the state would be to base the distribution on county population. The challenge with this recommendation is that a different statute
requires offenders be released in the county in which they received their first felony conviction.16 Therefore, under this plan, offenders may not be able to go where there are open beds. Additionally, if an offender goes to a work release “out-of-county” because that is where a bed is open, the offender
13 RCW 9.94A.728, Section 5. 14 DOC 300.550: Monitoring Graduated Community Access 15 ESSB6157, Section 301, 4,c, of 2007 Session Laws 16 Washington State Legislature,2007 Session laws, ESSB6157

CJPS FINAL REPORT Page 57
may have to quit his or her job in order to be released to the county of origin. DOC’s current policy is to
place offenders in work release beds in their county of origin.17
Unfortunately, 2008 was also the beginning of the economic downturn and there has been almost no growth in work release beds in recent years. A different approach to expanding the number of available work release beds is to use the existing beds more efficiently by decreasing the length of stay for offenders experiencing success. This will create early vacancies for additional offenders to follow behind.
Expanding DOC’s work release policy of graduated community access.
The proposed option is to develop a fourth step to DOC’s policy of graduated community access.18 Creating this fourth step would likely require a change in the statute which requires work release
offenders to be confined in a supervised facility when not actively participating in planned activities.19 This fourth step would allow offenders who are demonstrating success at a work release facility to finish work release on GPS based electronic home detention (EHD) and a high level of community supervision. The level of supervision would be the same as what is provided to civilly committed sexually violent predators who are on Less Restrictive Alternative status. Qualifications for this fourth step would likely include no misconduct in work release, steady employment and financial stability. This would result in emptying work release beds faster with potential cost avoidance to DOC in both avoided capital and operating costs.
The federal Bureau of Prisons has this program in place. 20 In 2010 nearly 40 percent of federal inmates who transferred to community corrections locations completed their sentences under a combination of half-way houses and home detention.
Estimate of cost impacts It is difficult to estimate the potential savings in capital and operating costs because the level of utilization is difficult to predict for several reasons. First, the current unemployment rate is high which means offenders are often passed up for employment over their non-offender competitors. A recent
snapshot of employed work release offenders showed only 38 percent with jobs.21 Although it is likely more offenders in this snapshot will become employed, the exact number is unknown. Second, DOC
reports 27 percent of work release offenders are sent back to prison prior to completing the program.22 Third, although many more offenders are classified for work release, until an application is screened at the facility, it is unknown how many would be accepted.
17 DOC Policy 300.500, Work Release Screening 18 DOC Policy 300.550, Monitoring Graduated Community Access 19RCW 72.65.020- Places of confinement-Extension of limits authorized, conditions. 20 United States Government Accountability Office, Publication GAO-12-230: Bureau of Prisons, Eligibility and Capacity Impact Use of Flexibilities to Reduce Inmates’ Time in Prison, February 2012. 21 DOC Planning and Research email, August 3, 2012 22 DOC Planning and Research email, July 31, 2012
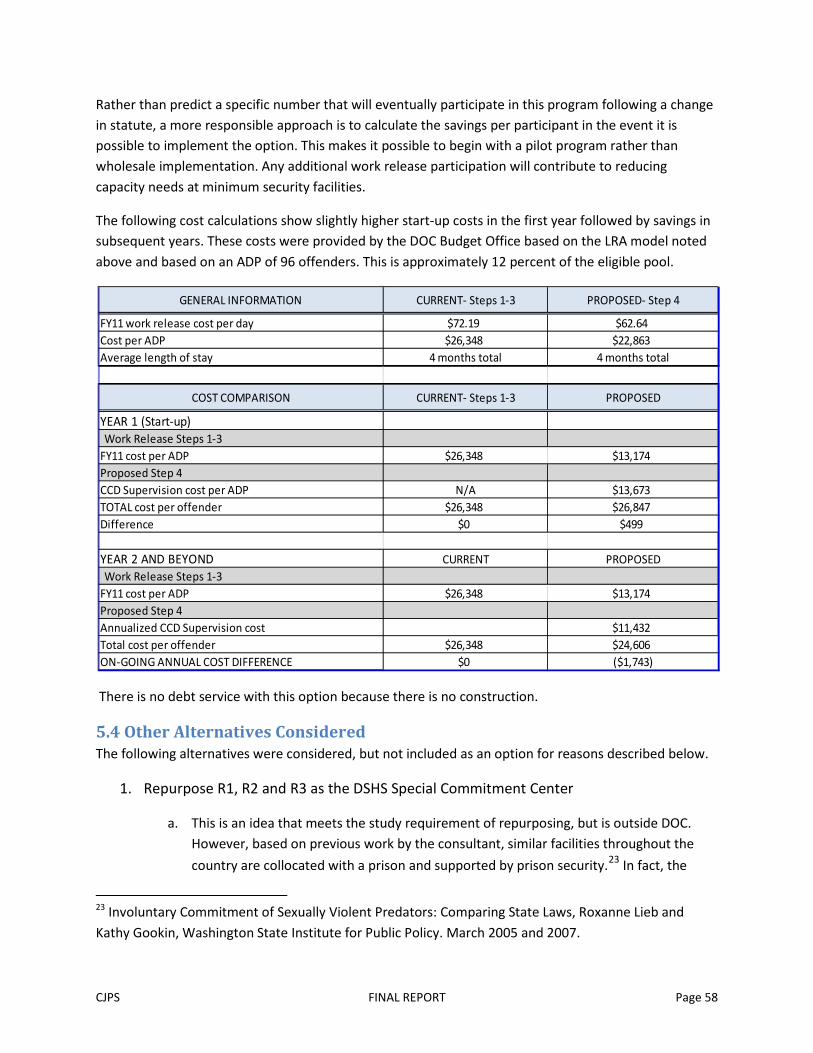
CJPS FINAL REPORT Page 58
Rather than predict a specific number that will eventually participate in this program following a change in statute, a more responsible approach is to calculate the savings per participant in the event it is possible to implement the option. This makes it possible to begin with a pilot program rather than wholesale implementation. Any additional work release participation will contribute to reducing capacity needs at minimum security facilities.
The following cost calculations show slightly higher start-up costs in the first year followed by savings in subsequent years. These costs were provided by the DOC Budget Office based on the LRA model noted above and based on an ADP of 96 offenders. This is approximately 12 percent of the eligible pool.
There is no debt service with this option because there is no construction.
5.4 Other Alternatives Considered The following alternatives were considered, but not included as an option for reasons described below.
1. Repurpose R1, R2 and R3 as the DSHS Special Commitment Center
a. This is an idea that meets the study requirement of repurposing, but is outside DOC. However, based on previous work by the consultant, similar facilities throughout the
country are collocated with a prison and supported by prison security.23 In fact, the
23 Involuntary Commitment of Sexually Violent Predators: Comparing State Laws, Roxanne Lieb and Kathy Gookin, Washington State Institute for Public Policy. March 2005 and 2007.
GENERAL INFORMATION CURRENT- Steps 1-3 PROPOSED- Step 4
FY11 work release cost per day $72.19 $62.64Cost per ADP $26,348 $22,863Average length of stay 4 months total 4 months total
COST COMPARISON CURRENT- Steps 1-3 PROPOSED
YEAR 1 (Start-up)Work Release Steps 1-3
FY11 cost per ADP $26,348 $13,174Proposed Step 4CCD Supervision cost per ADP N/A $13,673TOTAL cost per offender $26,348 $26,847Difference $0 $499
YEAR 2 AND BEYOND CURRENT PROPOSEDWork Release Steps 1-3
FY11 cost per ADP $26,348 $13,174Proposed Step 4Annualized CCD Supervision cost $11,432Total cost per offender $26,348 $24,606ON-GOING ANNUAL COST DIFFERENCE $0 ($1,743)

CJPS FINAL REPORT Page 59
current SCC facility on McNeil Island is a former state prison facility and received support from DOC while it operated a corrections center there. Units R1, R2, and R3 at WCC were originally constructed, and can still be operated, independently of the training center component of WCC.
b. Most, if not all, SCC residents lived at the Reception Center as DOC inmates before being civilly committed at the end of their prison sentence. This may provide an advantage to the feasibility of re-locating the SCC as a collocated facility by possibly reducing the NIMBY affect surely to accompany any attempt to move SCC off McNeil Island.
c. Requires significant capital investment for DSHS’s purpose. However, the investment is likely to cost much less than siting and constructing a comparable secure facility.
d. Further study is required to determine the feasibility of this option.
2. Repurpose WSP Old Main back to medium security.
Since there is a significant need for medium security beds, the option of converting Old Main back to medium security was worth considering. Unfortunately, there were many draw-backs that proved the option cost-ineffective from an operating cost standpoint.
a. Cost in-effective: The operational savings when converting Old Main from medium to minimum security was $8 million annually. This is primarily due to the physical configuration (prior to 1890) requiring many tower officers and many staffed control points inside the penitentiary walls. This staffing is not required with a minimum security population. Old Main’s most efficient use is minimum security.
b. Potential displacement of a special needs population: When Old Main was re-purposed to minimum security, it provided an opportunity for DOC to place older minimum custody inmates who could not be placed in minimum security camps due to medical needs that could only be met at a larger facility. DOC reports 38 percent, or 337 of the 884 offenders, currently at Old Main would not be able to move. Thus, the net gain in medium security beds would only be 546 at an additional annual operating cost of $8 million or an additional $9,050 per inmate.
c. The option of closing the MSU and moving the inmates into Old Main would no longer be possible. Moving MSU as noted earlier in the report, saves $402,000 and 6.1 FTEs annually as well as approximately $5 million in capital preservation costs.
3. Develop MI3 Housing at Airway Heights Corrections Center
The consultants looked for opportunities to upgrade fences around collocated minimum security facilities which would repurpose them to MI3 housing. Airway Heights at first looked like the best candidate in terms of proximity to other services and available land. However, AHCC would lose its minimum security workers needed for exterior maintenance and there is not enough
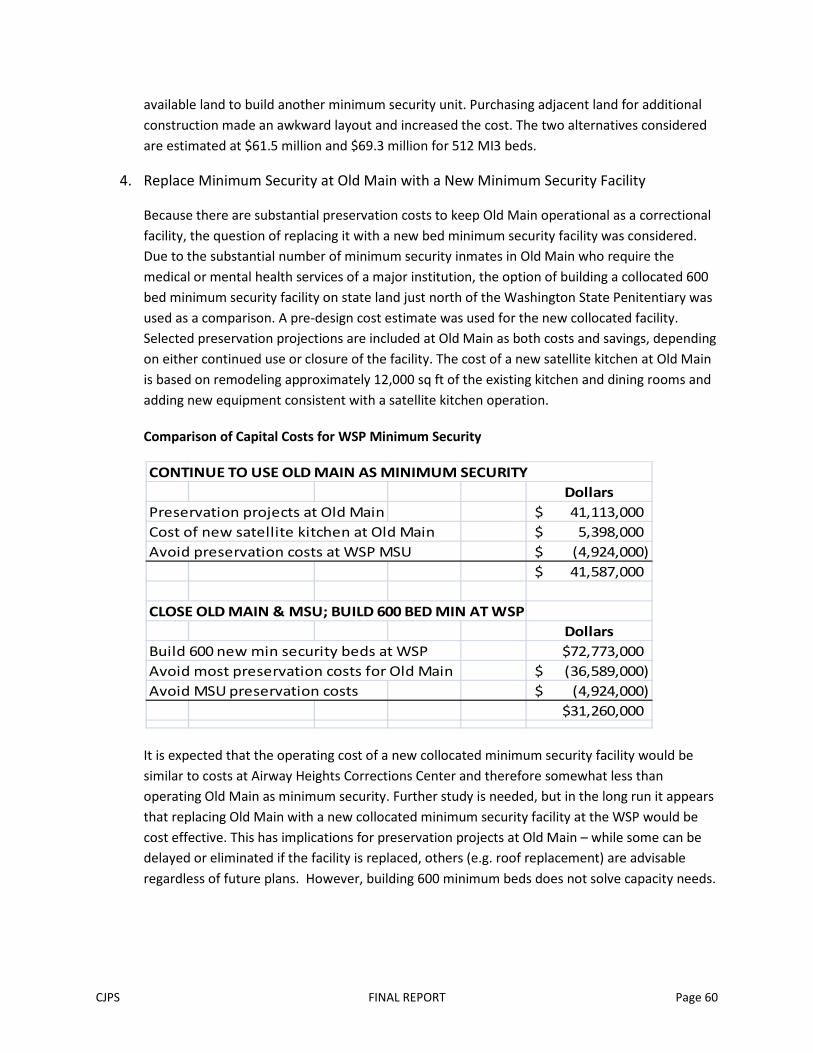
CJPS FINAL REPORT Page 60
available land to build another minimum security unit. Purchasing adjacent land for additional construction made an awkward layout and increased the cost. The two alternatives considered are estimated at $61.5 million and $69.3 million for 512 MI3 beds.
4. Replace Minimum Security at Old Main with a New Minimum Security Facility
Because there are substantial preservation costs to keep Old Main operational as a correctional facility, the question of replacing it with a new bed minimum security facility was considered. Due to the substantial number of minimum security inmates in Old Main who require the medical or mental health services of a major institution, the option of building a collocated 600 bed minimum security facility on state land just north of the Washington State Penitentiary was used as a comparison. A pre-design cost estimate was used for the new collocated facility. Selected preservation projections are included at Old Main as both costs and savings, depending on either continued use or closure of the facility. The cost of a new satellite kitchen at Old Main is based on remodeling approximately 12,000 sq ft of the existing kitchen and dining rooms and adding new equipment consistent with a satellite kitchen operation.
Comparison of Capital Costs for WSP Minimum Security
It is expected that the operating cost of a new collocated minimum security facility would be similar to costs at Airway Heights Corrections Center and therefore somewhat less than operating Old Main as minimum security. Further study is needed, but in the long run it appears that replacing Old Main with a new collocated minimum security facility at the WSP would be cost effective. This has implications for preservation projects at Old Main – while some can be delayed or eliminated if the facility is replaced, others (e.g. roof replacement) are advisable regardless of future plans. However, building 600 minimum beds does not solve capacity needs.
CONTINUE TO USE OLD MAIN AS MINIMUM SECURITYDollars
Preservation projects at Old Main 41,113,000$ Cost of new satellite kitchen at Old Main 5,398,000$ Avoid preservation costs at WSP MSU (4,924,000)$
41,587,000$
CLOSE OLD MAIN & MSU; BUILD 600 BED MIN AT WSPDollars
Build 600 new min security beds at WSP $72,773,000Avoid most preservation costs for Old Main (36,589,000)$ Avoid MSU preservation costs (4,924,000)$
$31,260,000