Embed Size (px)
Citation preview

Cost-effectiveness Analysis:
A practical primer
Eran Bendavid
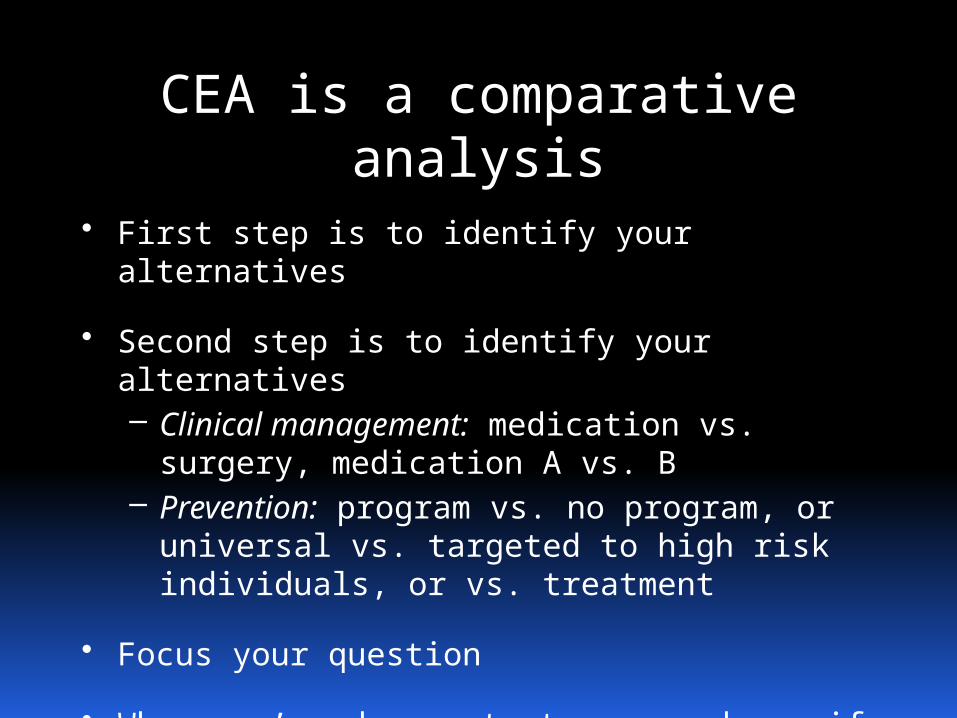
CEA is a comparative analysis
• First step is to identify your alternatives
• Second step is to identify your alternatives– Clinical management: medication vs.
surgery, medication A vs. B– Prevention: program vs. no program, or
universal vs. targeted to high risk individuals, or vs. treatment
• Focus your question
• When you’re done, start over and see if more alternatives popped up while you were completing your analysis

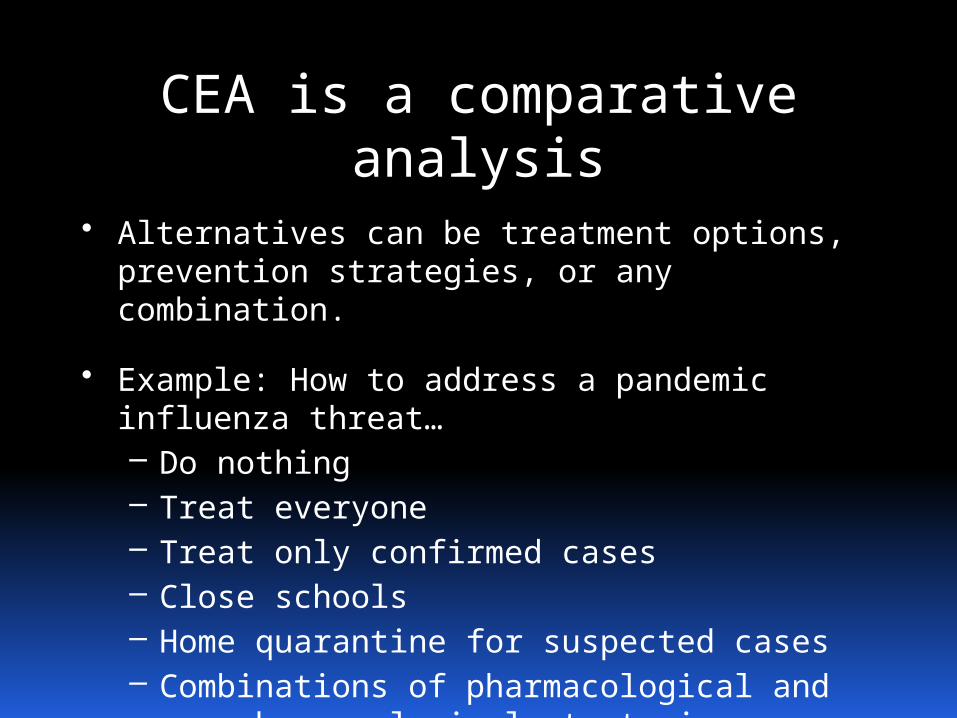
CEA is a comparative analysis
• Alternatives can be treatment options, prevention strategies, or any combination.
• Example: How to address a pandemic influenza threat…– Do nothing– Treat everyone– Treat only confirmed cases– Close schools– Home quarantine for suspected cases– Combinations of pharmacological and non-
pharmacological strategies
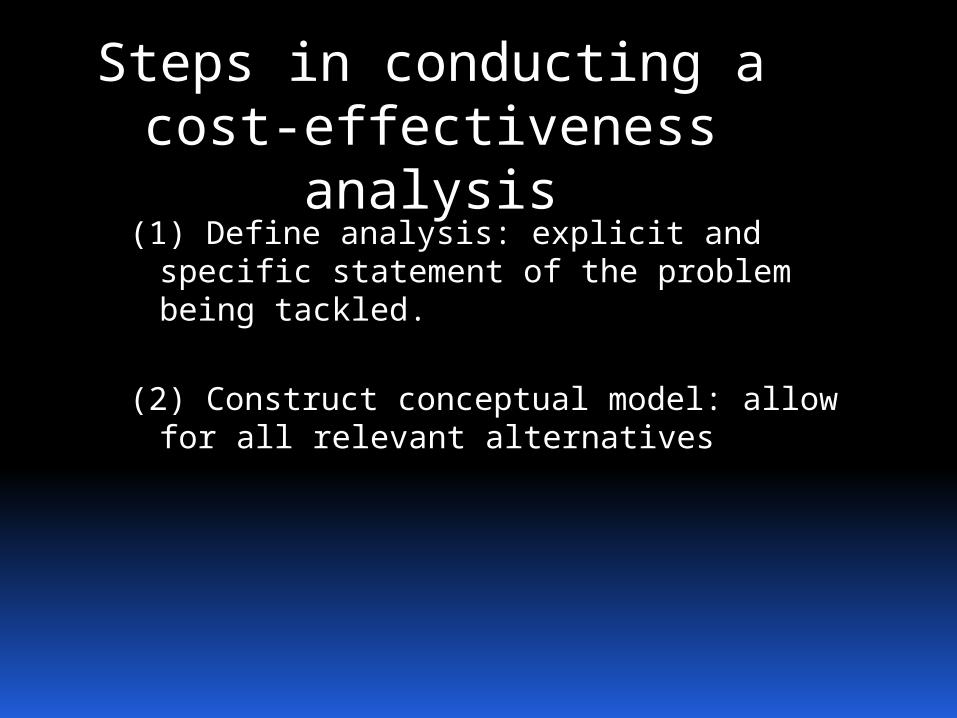
Steps in conducting a cost-effectiveness
analysis(1) Define analysis: explicit and specific
statement of the problem being tackled.
(2) Construct conceptual model: allow for all relevant alternatives
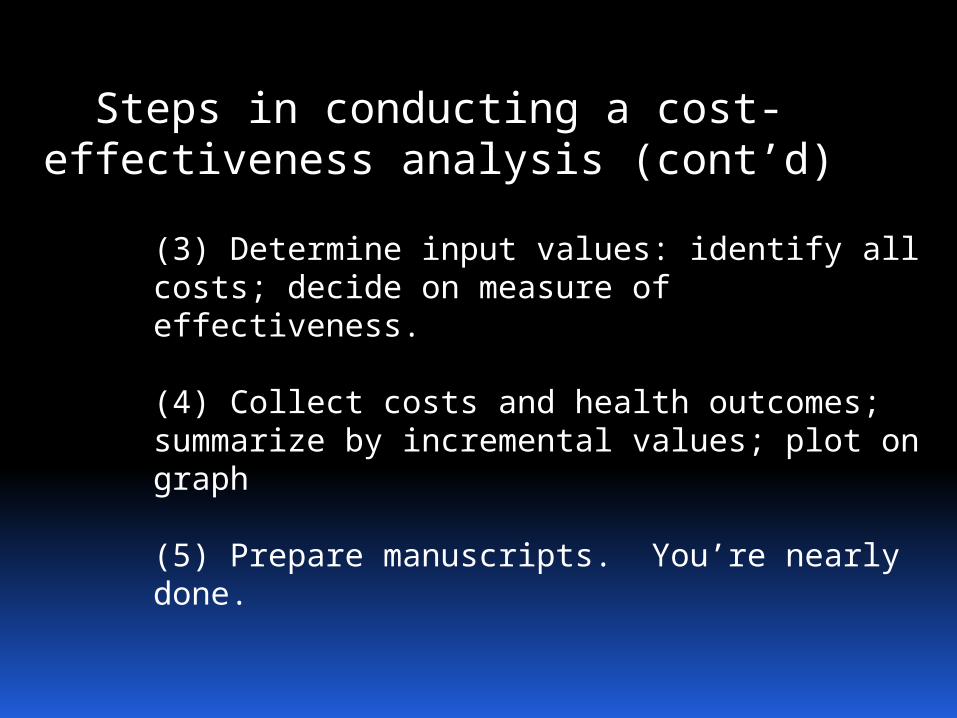
Steps in conducting a cost-effectiveness analysis
(cont’d)(3) Determine input values: identify all costs; decide on measure of effectiveness.
(4) Collect costs and health outcomes; summarize by incremental values; plot on graph
(5) Prepare manuscripts. You’re nearly done.


Construct conceptual model
• How do alternatives affect your model?
• “Make things as simple as possible, but not simpler”…AE
• How will you model be affected if you are considering mass treatment versus treatment of confirmed cases only?
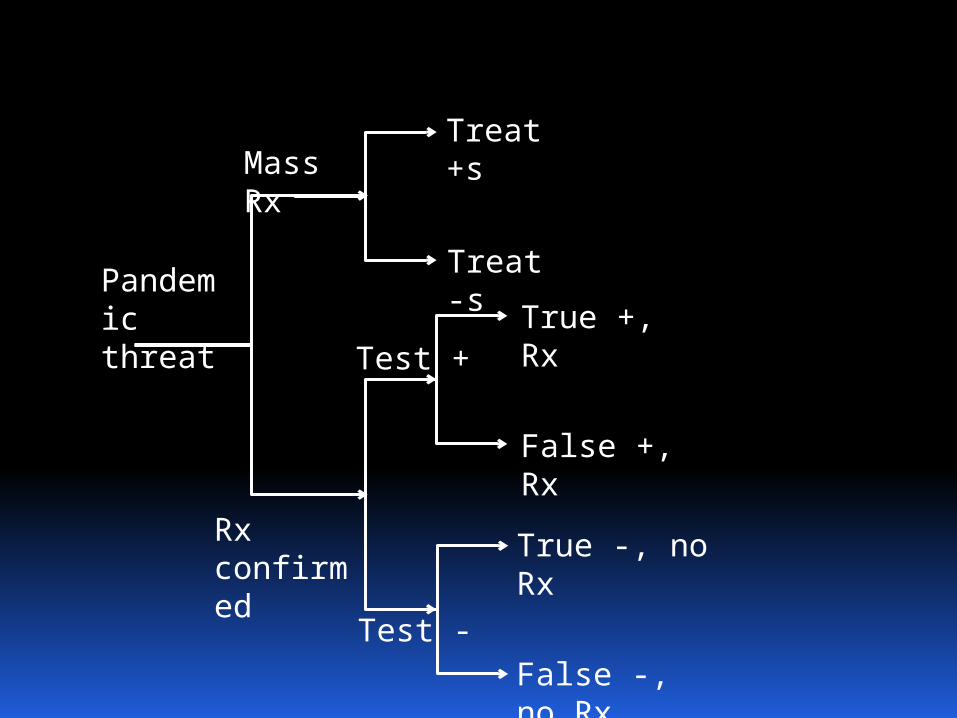
Pandemic threat
Mass RxTreat +s
Treat -s
Test +
Test -
Rx confirmed
True -, no Rx
False -, no Rx
True +, Rx
False +, Rx
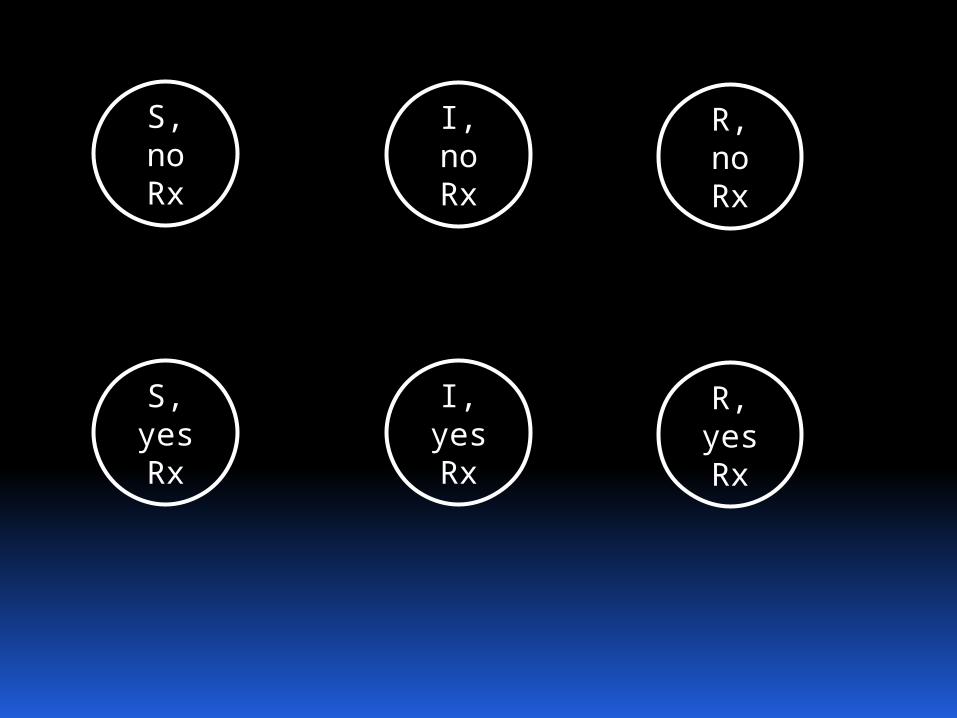
S, yes Rx
S, no Rx
I, yes Rx
I, no Rx
R, yes Rx
R, no Rx
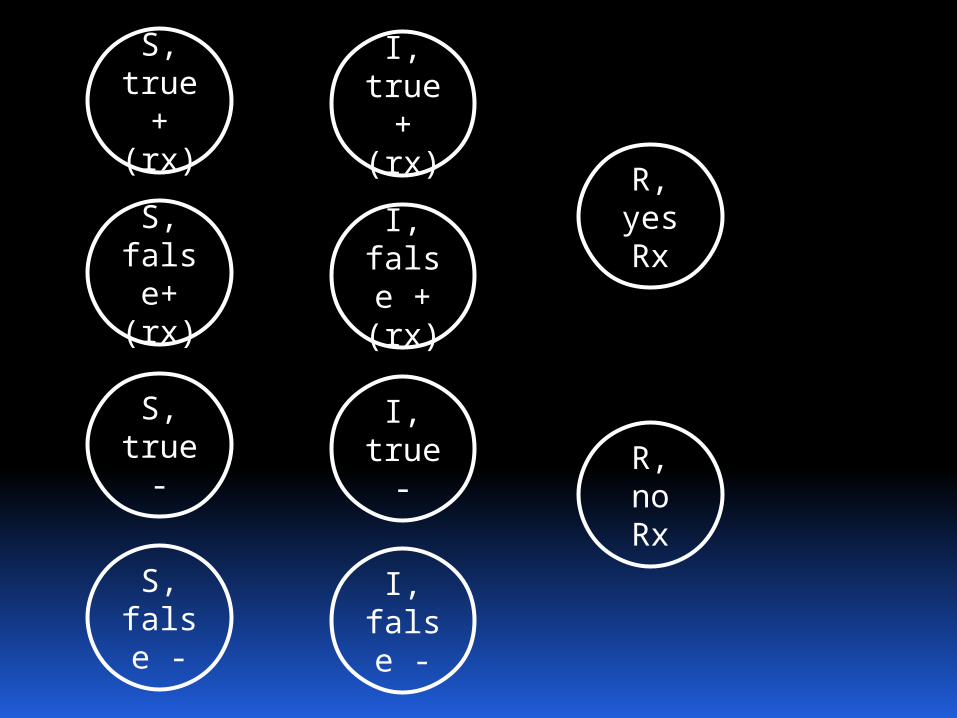
S, true -
S, true + (rx)
S, false -
S, false+ (rx)
I, true -
I, true + (rx)
I, false -
I, false + (rx)
R, no Rx
R, yes Rx
Costs
• Which costs do you count?– All direct costs:
• Hospitalizations• Medications• Vaccinations• Diagnostics
Costs
• Which costs do you count?– Indirect costs:
• Time costs• Cost of lost productivity• Opportunity cost
– Careful of double counting:• Double counting indirect costs• Indirect costs and quality of life
adjustments
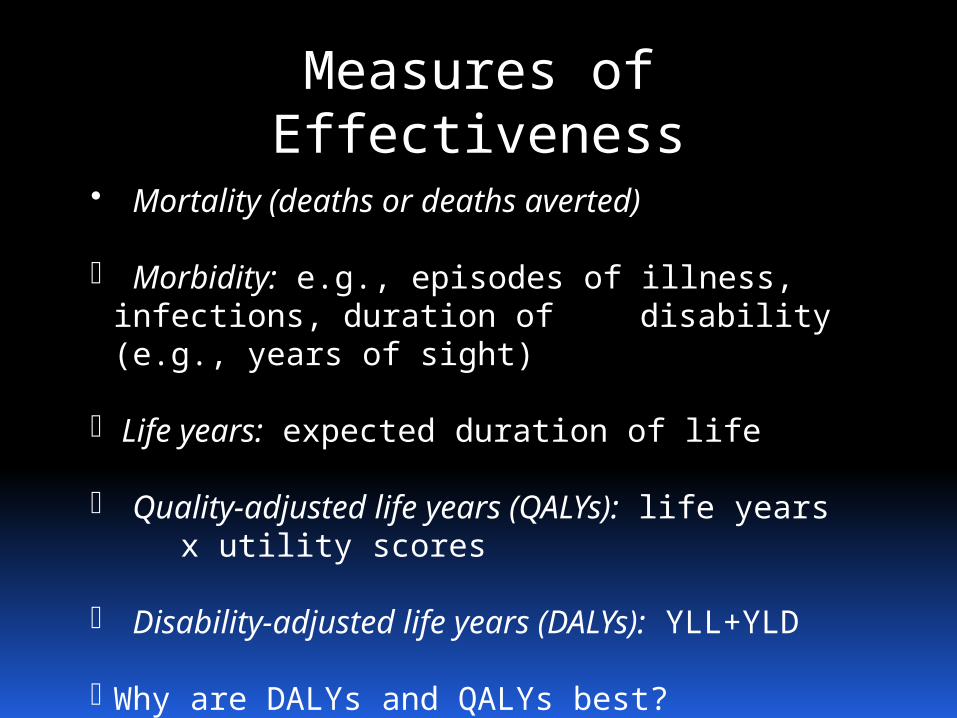
Measures of Effectiveness
• Mortality (deaths or deaths averted)
· Morbidity: e.g., episodes of illness, infections, duration of disability (e.g., years of sight)
· Life years: expected duration of life
· Quality-adjusted life years (QALYs): life years x utility scores
· Disability-adjusted life years (DALYs): YLL+YLD
· Why are DALYs and QALYs best?
Here’s an example
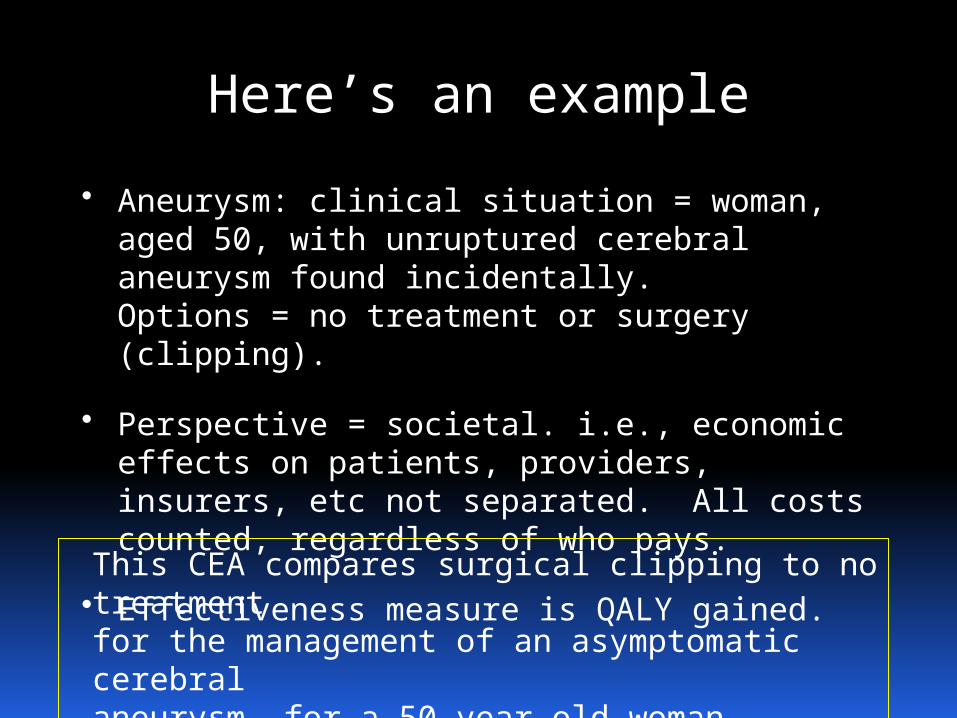
• Aneurysm: clinical situation = woman, aged 50, with unruptured cerebral aneurysm found incidentally. Options = no treatment or surgery (clipping).
• Perspective = societal. i.e., economic effects on patients, providers, insurers, etc not separated. All costs counted, regardless of who pays.
• Effectiveness measure is QALY gained. This CEA compares surgical clipping to no treatment for the management of an asymptomatic cerebral aneurysm, for a 50 year old woman, estimating the societalcost per QALY gained.
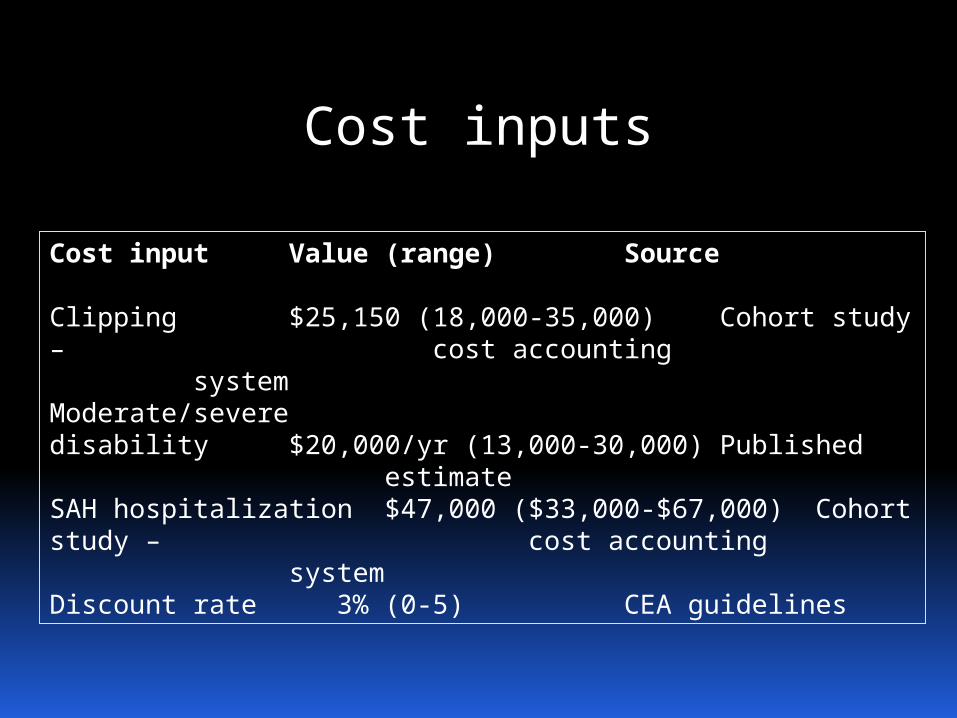
Cost inputs
Cost input Value (range) Source
Clipping $25,150 (18,000-35,000) Cohort study – cost accounting system
Moderate/severe disability $20,000/yr (13,000-30,000) Published
estimateSAH hospitalization $47,000 ($33,000-$67,000) Cohort study –
cost accounting system
Discount rate 3% (0-5) CEA guidelines
Tally costs and effectiveness
• Each health state in the model is associated with unique costs and effectiveness
• Sum up the costs and benefits of strategies
• Put it in a table and on a graph
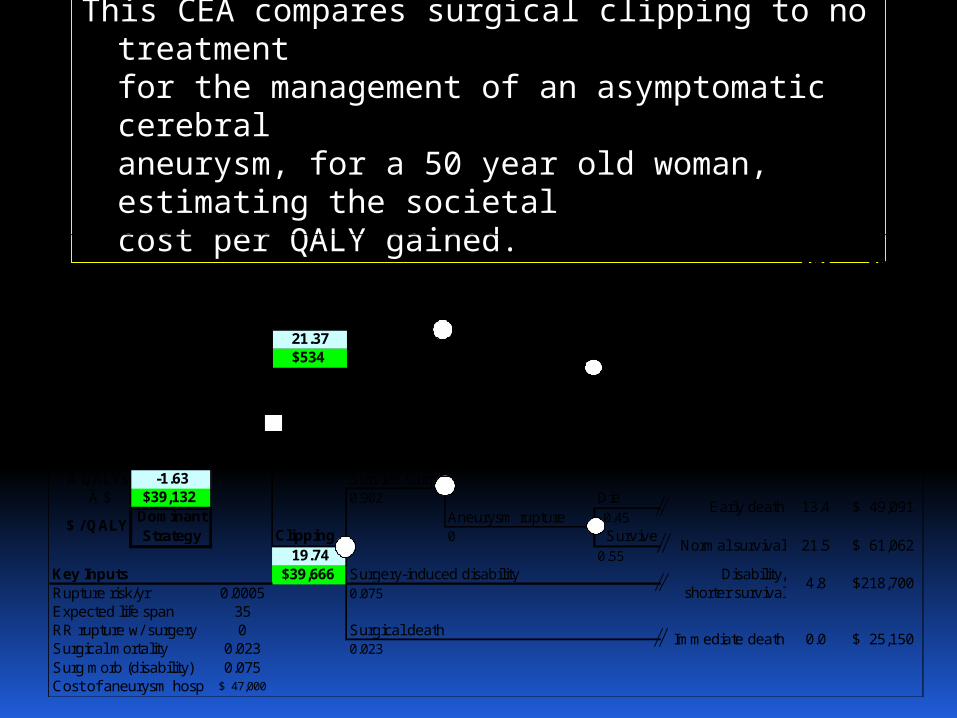
This CEA compares surgical clipping to no treatment for the management of an asymptomatic cerebral aneurysm, for a 50 year old woman, estimating the societalcost per QALY gained.
QALYsdisc
Costdisc
No aneurysm rupture0.9825
No surgery21.37 Die$534 Aneurysm rupture 0.45
0.0175 Survive0.55
No aneurysm ruptureDifferences 1
Ä QALYs -1.63 Survive surg.Ä $ $39,132 0.902 Die
Aneurysm rupture 0.45Clipping 0 Survive
19.74 0.55Key Inputs $39,666 Surgery-induced disabilityRupture risk/yr 0.0005 0.075Expected life span 35RR rupture w/ surgery 0 Surgical deathSurgical mortality 0.023 0.023
Surg morb (disability) 0.075Cost of aneurysm hosp 47,000$
21.5
4.8
Immediate death
Normal survival,worry
21.4
Normal survival
Normal survival
Early death,worry
Early death
21.5
13.4
Ms. Brooks
13.3
21.4Normal survival,
worry
-$
23,941$
35,912$
25,150$
Dominant Strategy
$ / QALY49,091$
61,062$
218,700$
25,150$ 0.0
Disability, shorter survival
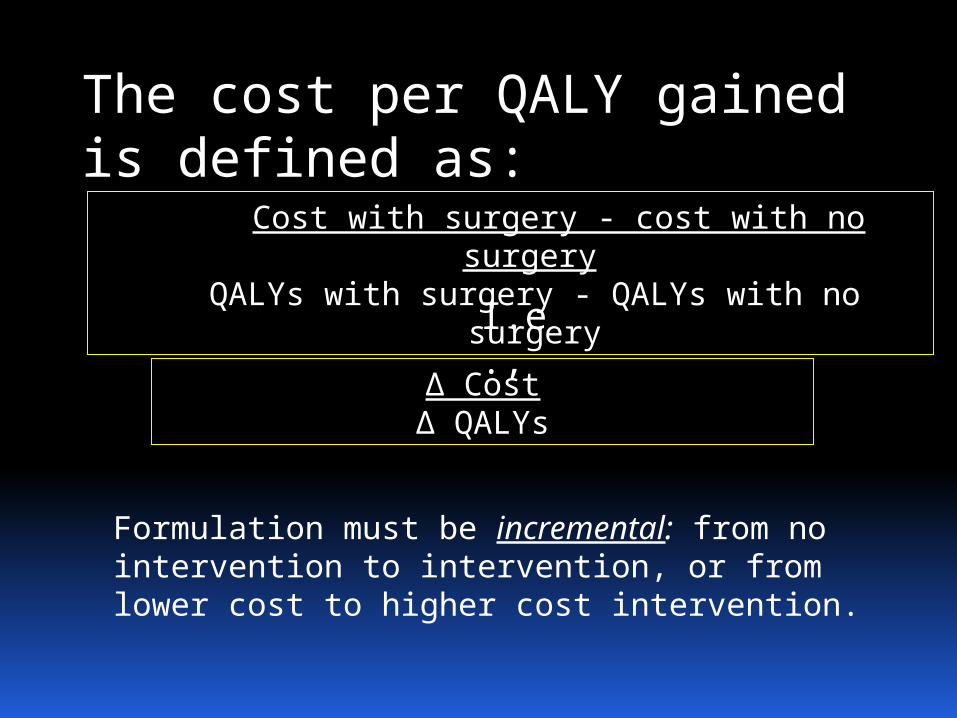
The cost per QALY gained is defined as:
Cost with surgery - cost with no surgeryQALYs with surgery - QALYs with no surgery
Δ CostΔ QALYs
Formulation must be incremental: from no intervention to intervention, or from lower cost to higher cost intervention.
I.e.,
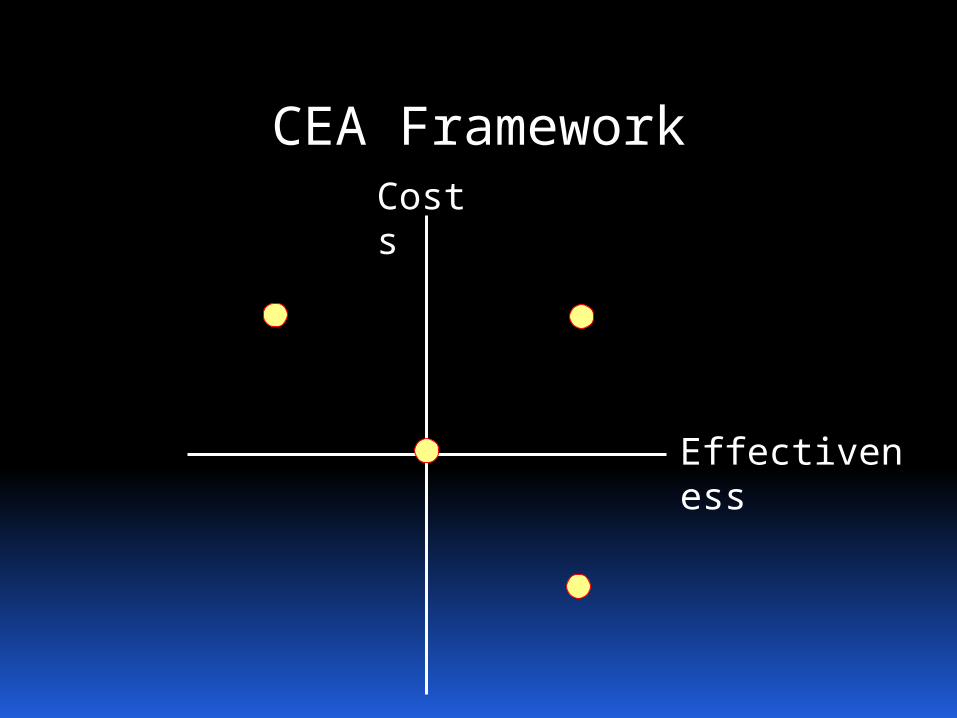
CEA FrameworkCosts
Effectiveness
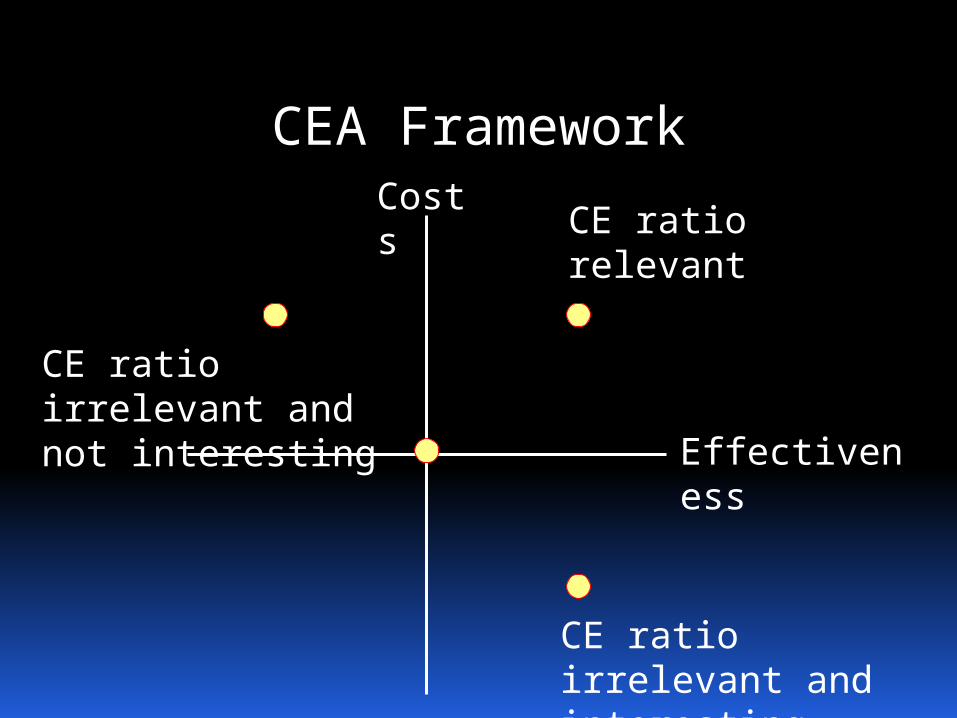
CEA FrameworkCosts
Effectiveness
CE ratio irrelevant and interesting
CE ratio irrelevant and not interesting
CE ratio relevant
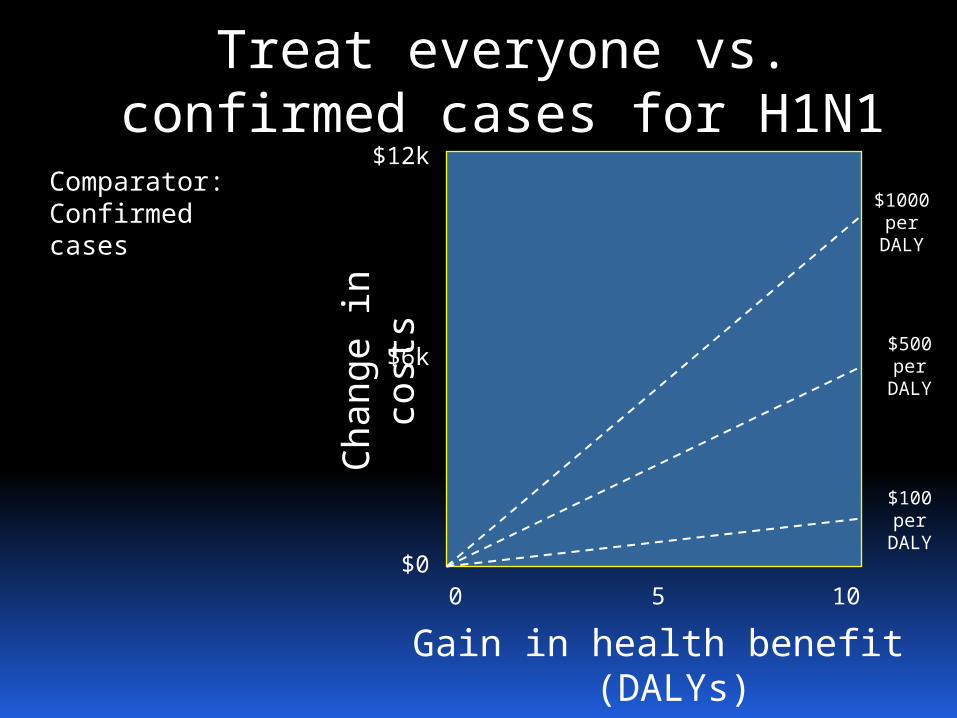
Treat everyone vs. confirmed cases for H1N1
Ch
ang
e in c
ost
s
Gain in health benefit (DALYs)
Comparator: Confirmed cases
0 105
$12k
$6k
$0
$1000 per
DALY
$100 per
DALY
$500 per
DALY
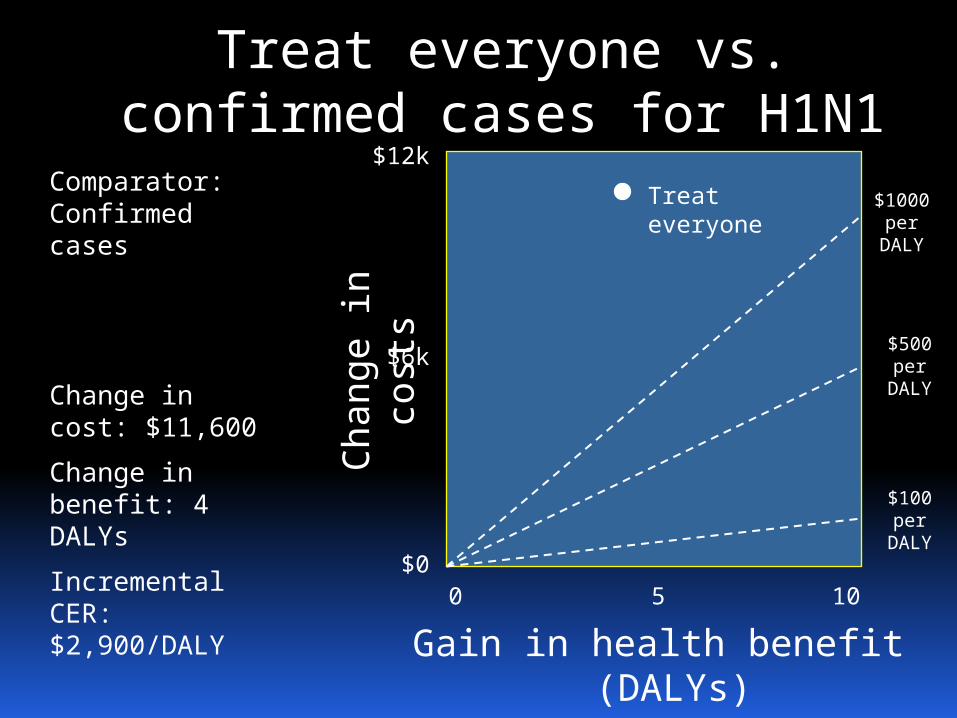
Treat everyone vs. confirmed cases for H1N1
Ch
ang
e in c
ost
s
Gain in health benefit (DALYs)
Comparator: Confirmed cases
0 105
$12k
$6k
$0
$1000 per
DALY
$100 per
DALY
$500 per
DALY
Treat everyone
Change in cost: $11,600
Change in benefit: 4 DALYs
Incremental CER: $2,900/DALY
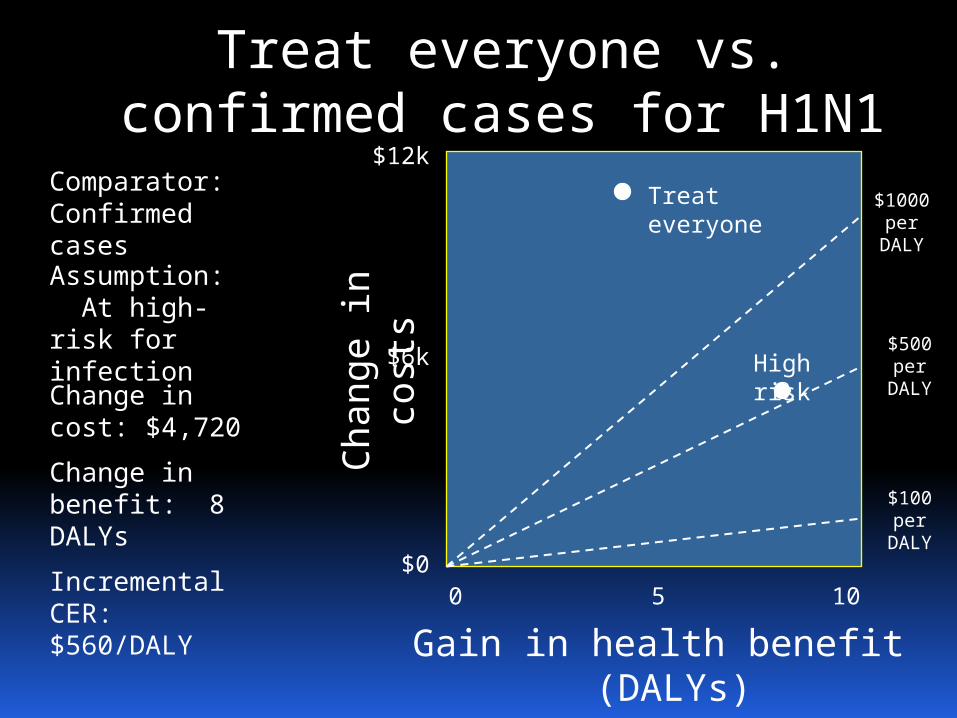
Treat everyone vs. confirmed cases for H1N1
Ch
ang
e in c
ost
s
Gain in health benefit (DALYs)
Comparator: Confirmed cases
0 105
$12k
$6k
$0
$1000 per
DALY
$100 per
DALY
$500 per
DALY
Treat everyone
High risk
Assumption: At high-risk for infection
Change in cost: $4,720
Change in benefit: 8 DALYs
Incremental CER: $560/DALY
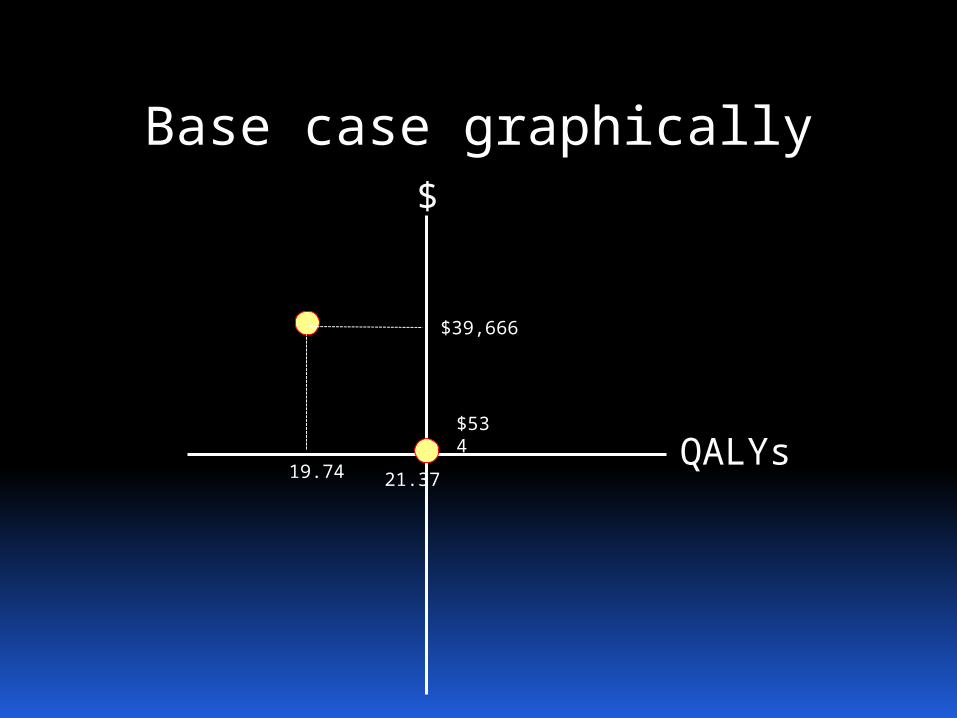
Base case graphically$
QALYs21.37
$534
$39,666
19.74
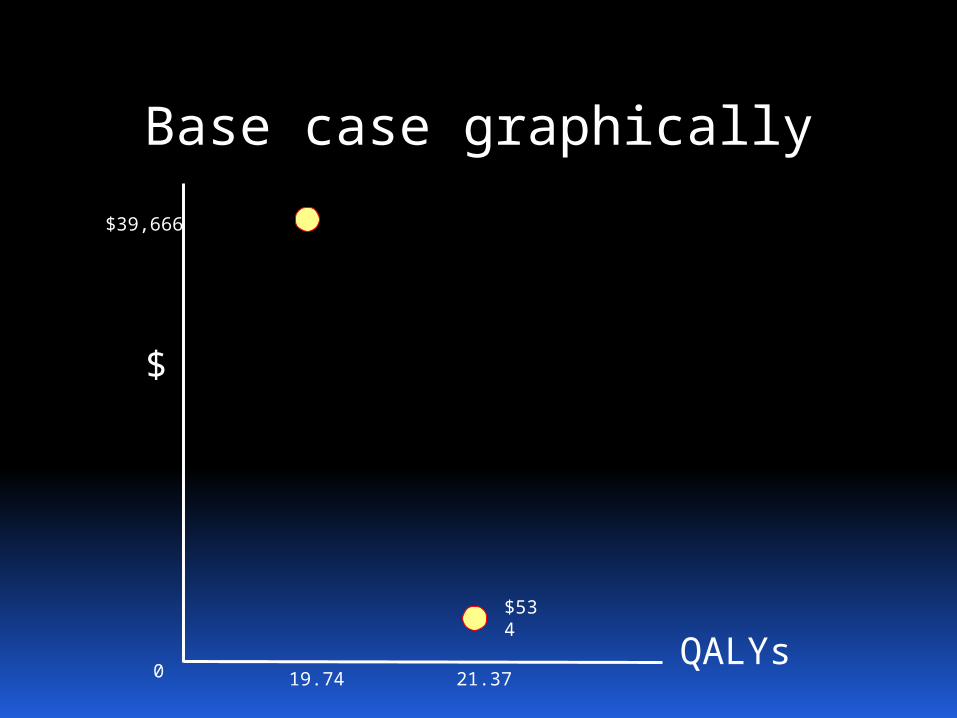
Base case graphically
$
QALYs21.37
$534
$39,666
19.740
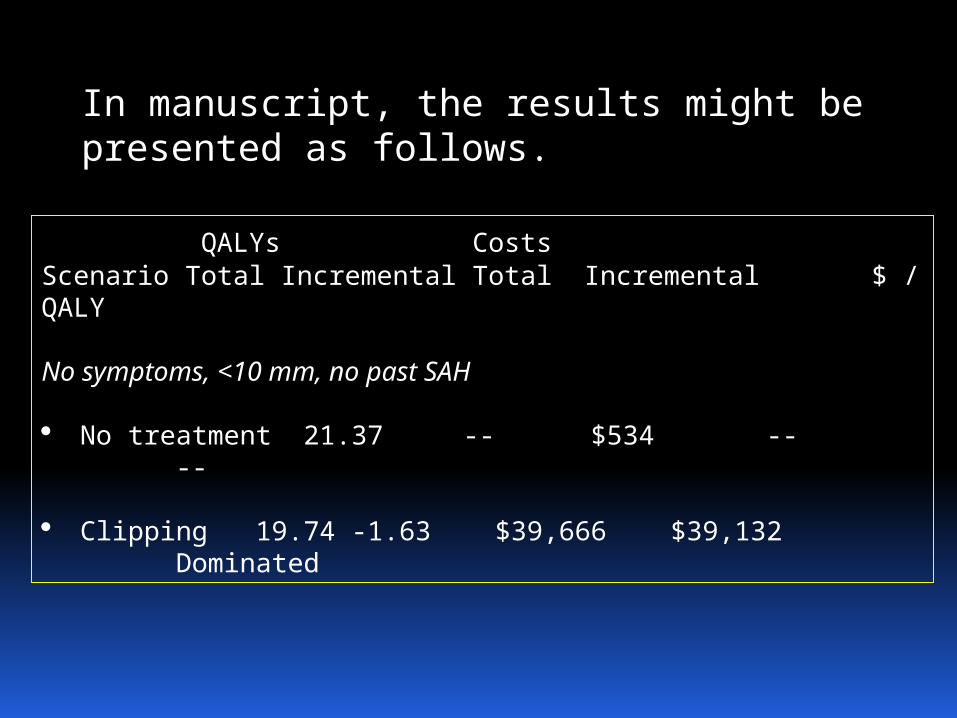
In manuscript, the results might be presented as follows.
QALYs CostsScenario Total Incremental Total Incremental $ / QALY
No symptoms, <10 mm, no past SAH
· No treatment 21.37 -- $534 -- --
· Clipping 19.74 -1.63 $39,666 $39,132 Dominated
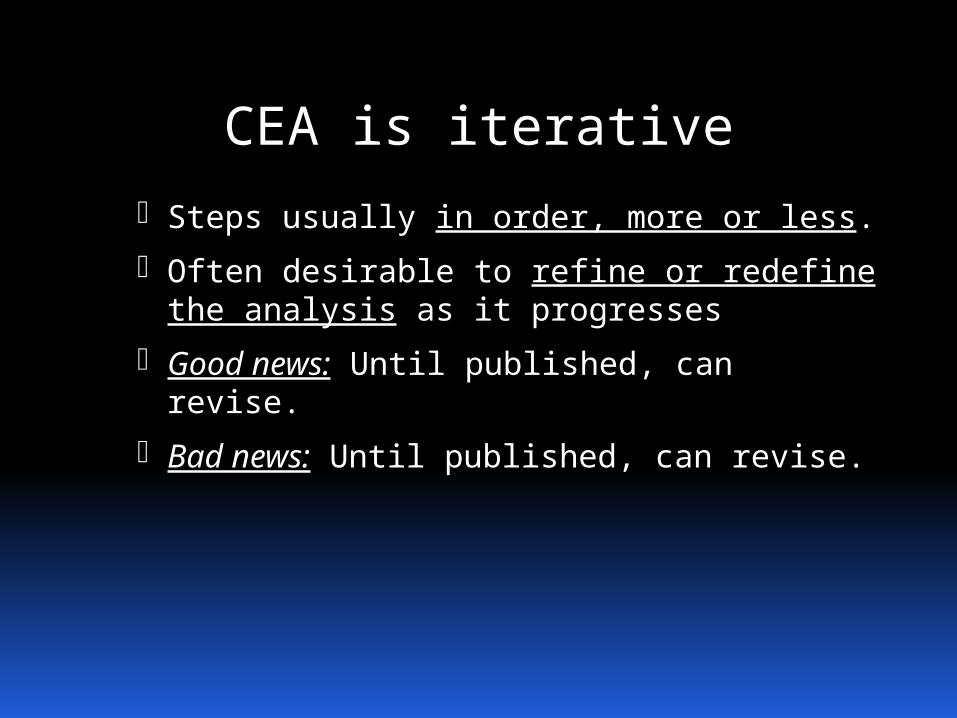
CEA is iterative
· Steps usually in order, more or less.
· Often desirable to refine or redefine the analysis as it progresses
· Good news: Until published, can revise.
· Bad news: Until published, can revise.
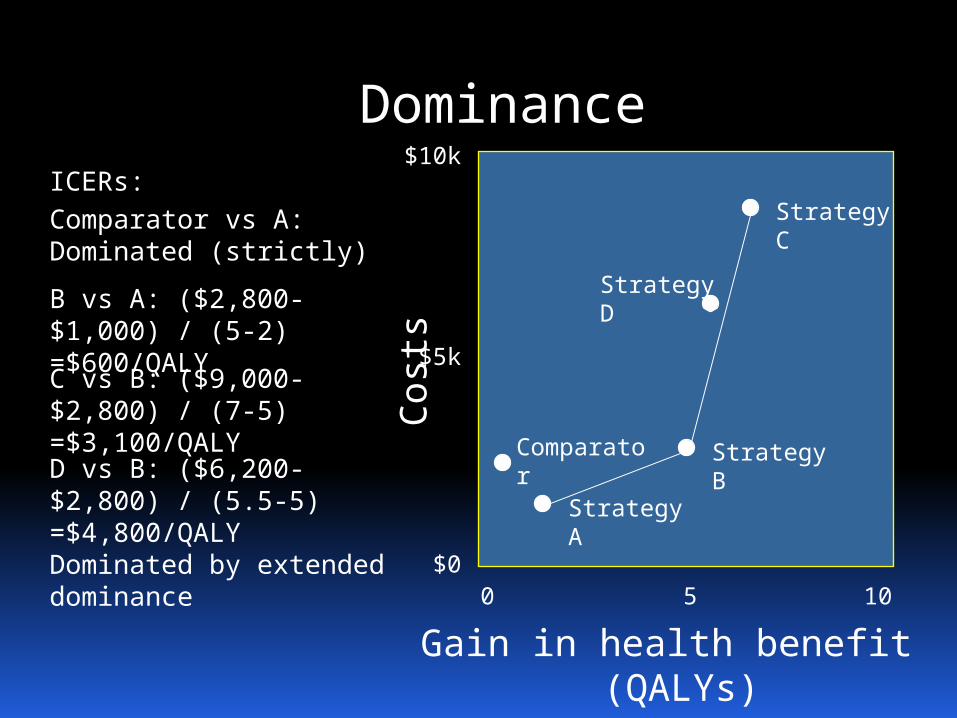
Dominance
Cost
s
Gain in health benefit (QALYs)
0 105
$10k
$5k
$0
Comparator
Strategy A
Strategy B
Strategy C
Strategy D
ICERs:Comparator vs A: Dominated (strictly)
B vs A: ($2,800-$1,000) / (5-2)=$600/QALYC vs B: ($9,000-$2,800) / (7-5)=$3,100/QALYD vs B: ($6,200-$2,800) / (5.5-5)=$4,800/QALYDominated by extended dominance
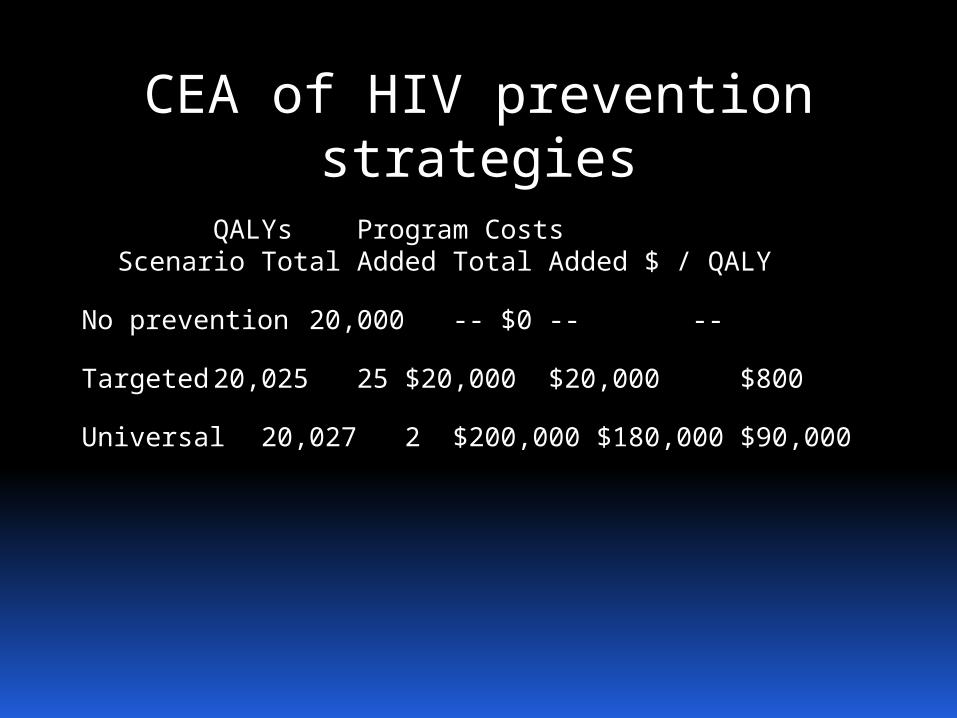
CEA of HIV prevention strategies
QALYs Program Costs
Scenario Total Added Total Added $ / QALY
No prevention 20,000-- $0 -- --
Targeted 20,02525 $20,000 $20,000$800
Universal 20,0272 $200,000 $180,000 $90,000
0
2000
4000
6000
8000
10000
12000
19.5 20 20.5 21 21.5
Cos
t
Years of life
WRONG!!!

0
2000
4000
6000
8000
10000
12000
19.5 20 20.5 21 21.5
Cos
t
Years of life
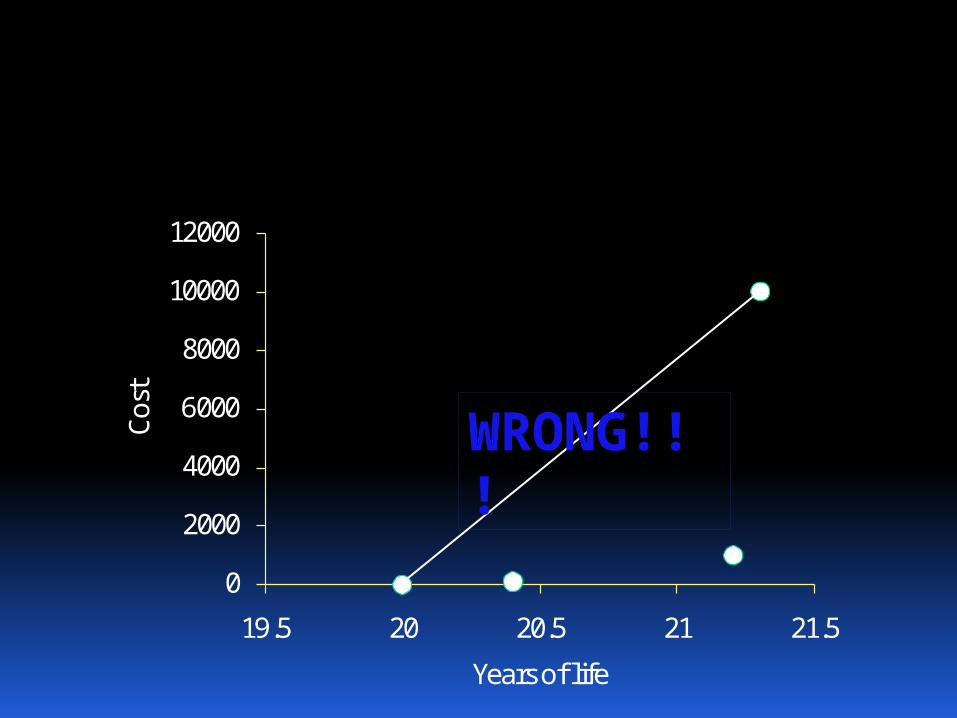
Drugs
Absolute Difference Absolute Difference Incremental Versus No RxNo treatment $0 -- 20 -- (correct) (misleading)Drug A - old generic $100 $100 20.4 0.4 $250 $250Drug B - old brand name $1,000 $900 21.2 0.8 $1,125 $833Drug C - new brand name $10,000 $9,000 21.3 0.1 $90,000 $7,692
Cost Years of Life Cost per Year of Life Gained
In this Workbook, there are 4 examples of the imporance of incremental CE analyses. The first two sheets are examples of non-embedded treatment options, the third is another embedded example, and the fourth is a sequential algorithm.
In the example in this sheet, each more expensive drug adds some years of life compared with less expensive alternatives. What drug would you use based on cost-effectiveness?
Assume that all drugs will work at the level indicated, i.e., that patients have not failed treatment with any of the drugs. (A sequential drug algorithm is considered later.) The incremental cost-effectiveness of the generic drug is very attractive, and the incremental CE of the old brand name drug is also attractive. The incremental CE of the new brand name drug is quite a bit less attractive ($90,000 per year of life gained).
If the CE is calculated for each drug against "No treatment", the new drug looks much more reasonable ($7,692 per year of life gained). But this is misleading, since Drug C doesn't really add much vs. Drug B or A. It must be compared against them if they are viable choices.
WRONG!!!

Dominated
0
2000
4000
6000
8000
10000
12000
19.5 20 20.5 21 21.5
Cos
t
Years of life
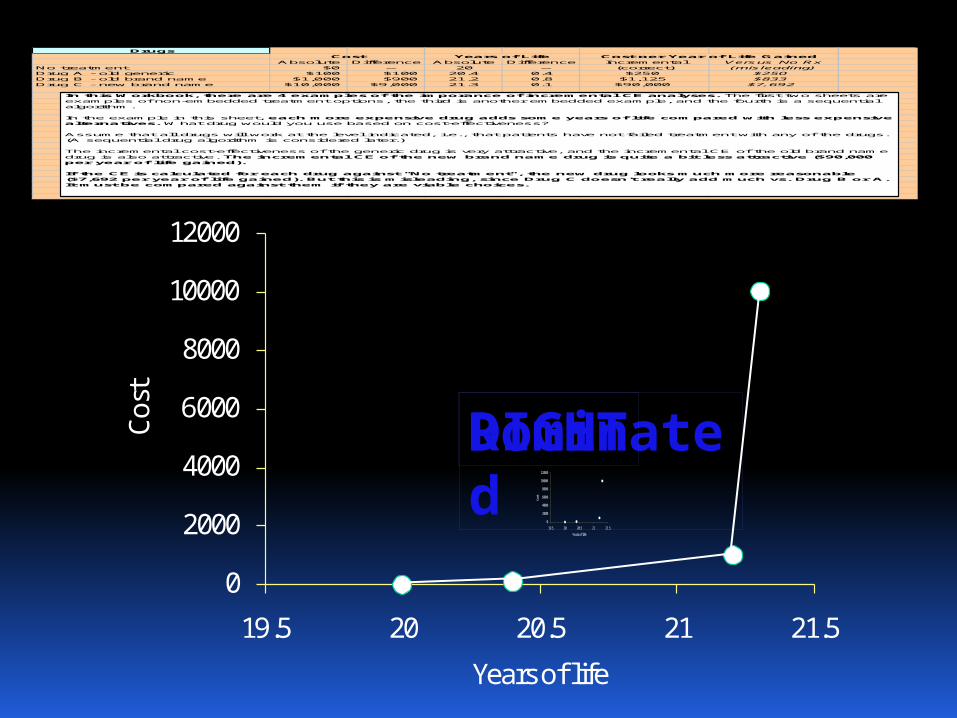
Drugs
Absolute Difference Absolute Difference Incremental Versus No RxNo treatment $0 -- 20 -- (correct) (misleading)Drug A - old generic $100 $100 20.4 0.4 $250 $250Drug B - old brand name $1,000 $900 21.2 0.8 $1,125 $833Drug C - new brand name $10,000 $9,000 21.3 0.1 $90,000 $7,692
Cost Years of Life Cost per Year of Life Gained
In this Workbook, there are 4 examples of the imporance of incremental CE analyses. The first two sheets are examples of non-embedded treatment options, the third is another embedded example, and the fourth is a sequential algorithm.
In the example in this sheet, each more expensive drug adds some years of life compared with less expensive alternatives. What drug would you use based on cost-effectiveness?
Assume that all drugs will work at the level indicated, i.e., that patients have not failed treatment with any of the drugs. (A sequential drug algorithm is considered later.) The incremental cost-effectiveness of the generic drug is very attractive, and the incremental CE of the old brand name drug is also attractive. The incremental CE of the new brand name drug is quite a bit less attractive ($90,000 per year of life gained).
If the CE is calculated for each drug against "No treatment", the new drug looks much more reasonable ($7,692 per year of life gained). But this is misleading, since Drug C doesn't really add much vs. Drug B or A. It must be compared against them if they are viable choices.
RIGHT
0
2000
4000
6000
8000
10000
12000
19.5 20 20.5 21 21.5
Cost
Years of life
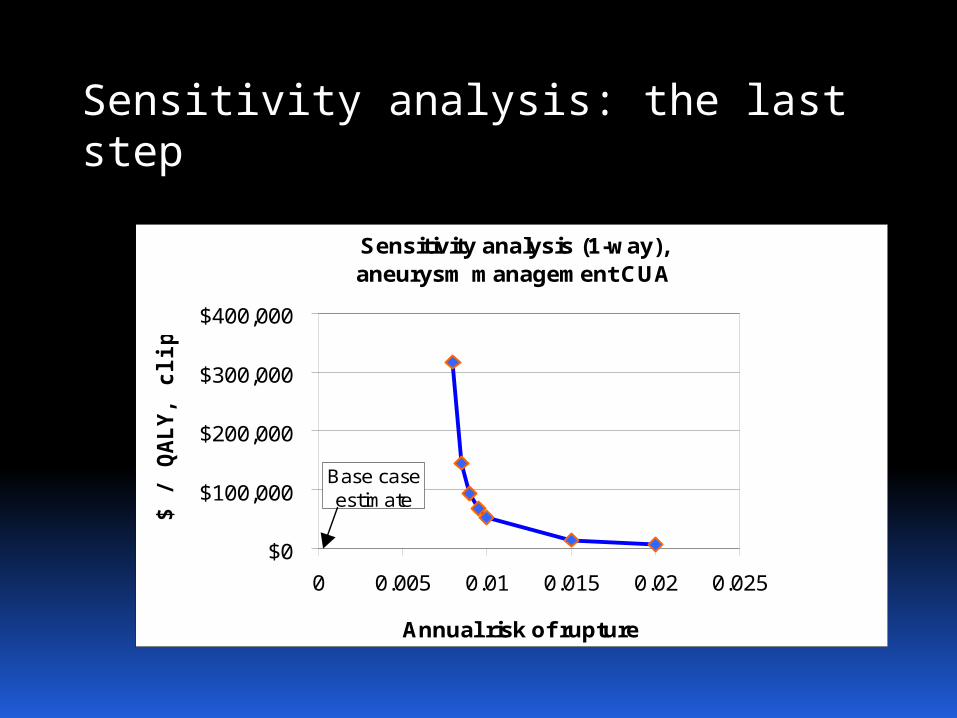
Sensitivity analysis: the last step
Sensitivity analysis (1-way),aneurysm management CUA
$0
$100,000
$200,000
$300,000
$400,000
0 0.005 0.01 0.015 0.02 0.025
Annual risk of rupture
$ / Q
ALY, clip
pin
g
Base case estimate

Putting it all together
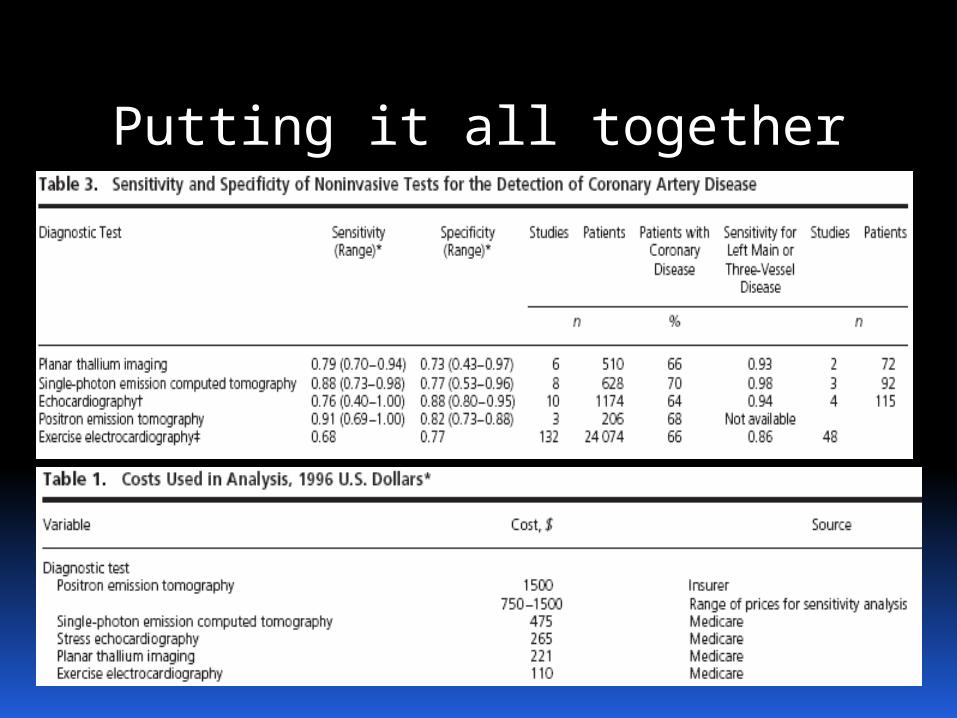
Putting it all together

Putting it all together
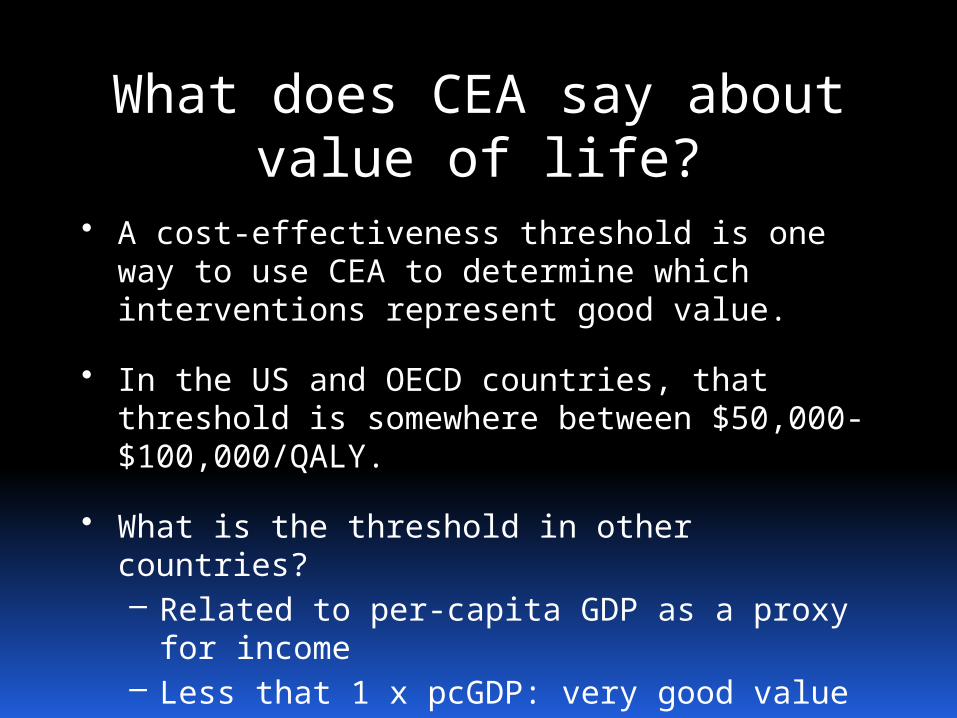
What does CEA say about value of life?
• A cost-effectiveness threshold is one way to use CEA to determine which interventions represent good value.
• In the US and OECD countries, that threshold is somewhere between $50,000-$100,000/QALY.
• What is the threshold in other countries?– Related to per-capita GDP as a proxy for
income– Less that 1 x pcGDP: very good value– 1-3 x pcGDP: acceptable


CEA can be misused
· Defend policies deemed unacceptable for other reasons (depriving of rights, unfair, cruel, etc)
· Methods correct, interpretation skewed
· Methods incorrect or strategies not considered