Embed Size (px)
Citation preview

Cost-Effectiveness Analysis of Raltegravir in Treatment-
Experienced HIV Patients in Spain
Mohammad A. Chaudhary, Santiago Moreno, Ritesh N. Kumar, Gonzalo Nocea & Elamin Elbasha
International AIDS Economics Network Symposium Cuernavava, Mexico, August 1-2, 2008
2
Background
Raltegravir (ISENTRESS®), the first approved integrase inhibitor for managing treatment-experienced HIV patients
Superior efficacy observed at 16, 24, and 48 weeks in combination with optimized background therapy (OBT) versus OBT alone*
Safety profile comparable to placebo*
* N Engl J Med 2008;359:339-54.
3
Objective
In light of proven efficacy and safety, the current study evaluates the economic benefits of raltegravir through a cost-effectiveness model
Cost-effectiveness is determined by dividing the incremental costs with the drug by the quality-adjusted life years (QALYs) gained by using the drug.

4
Model Overview
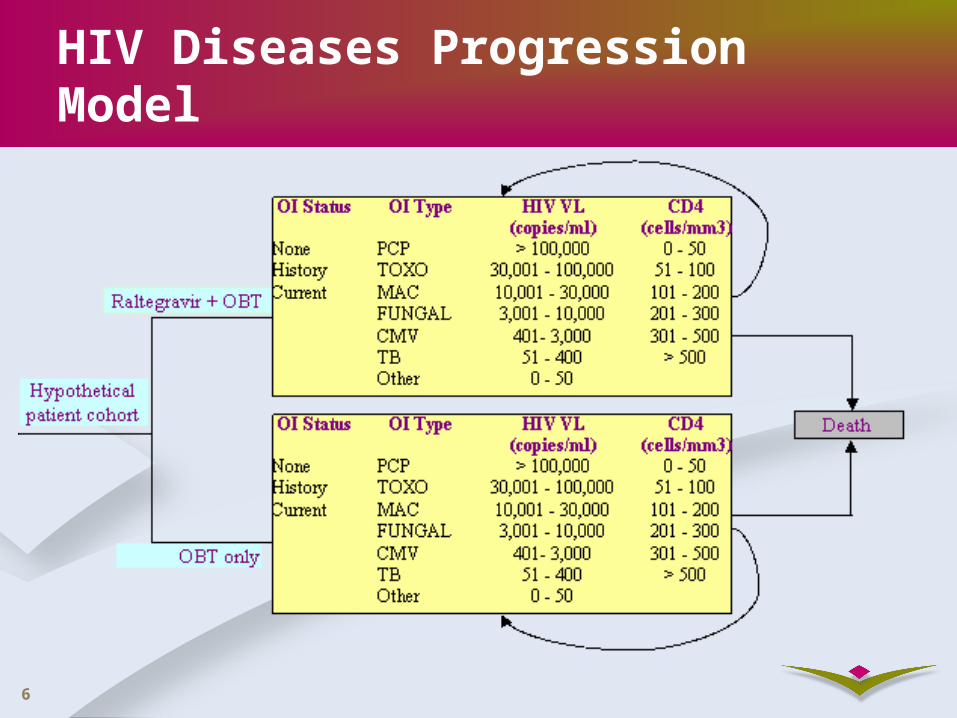
Continuous-time state-transition cohort model developed in Mathematica version 6– Markov process with limited history
Two treatment strategies A. Placebo + OBT
B. Raltegravir + OBT
Three sets of differential equations corresponding to opportunistic infection (OI) status:
– No OI
– History of OI
– Current OI
5
Model Overview
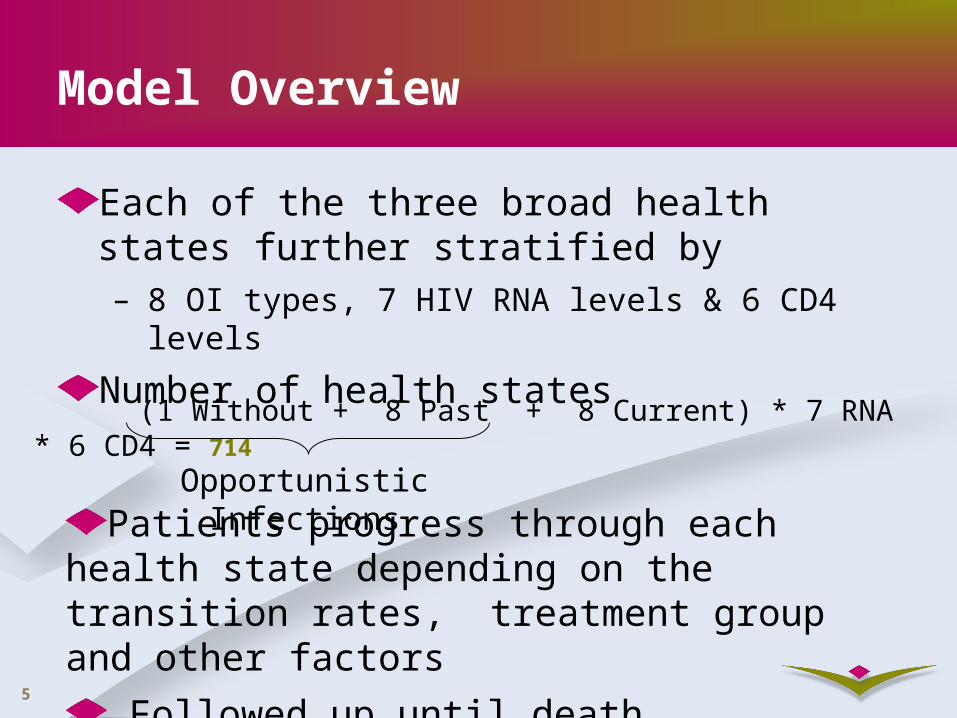
Each of the three broad health states further stratified by– 8 OI types, 7 HIV RNA levels & 6 CD4 levels
Number of health states
(1 Without + 8 Past + 8 Current) * 7 RNA * 6 CD4 = 714
Opportunistic Infections
Patients progress through each health state depending on the transition rates, treatment group and other factors
Followed up until death.
6
HIV Diseases Progression Model
7
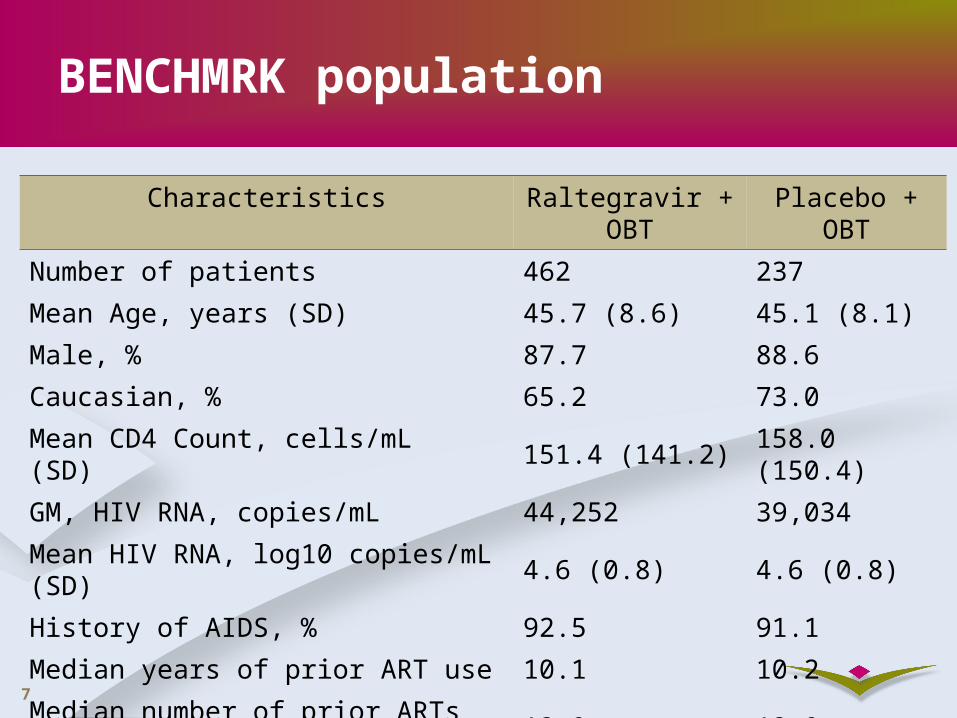
BENCHMRK population
Characteristics Raltegravir + OBT
Placebo + OBT
Number of patients 462 237
Mean Age, years (SD) 45.7 (8.6) 45.1 (8.1)
Male, % 87.7 88.6
Caucasian, % 65.2 73.0
Mean CD4 Count, cells/mL (SD) 151.4 (141.2) 158.0 (150.4)
GM, HIV RNA, copies/mL 44,252 39,034
Mean HIV RNA, log10 copies/mL (SD) 4.6 (0.8) 4.6 (0.8)
History of AIDS, % 92.5 91.1
Median years of prior ART use 10.1 10.2
Median number of prior ARTs used 12.0 12.0
8
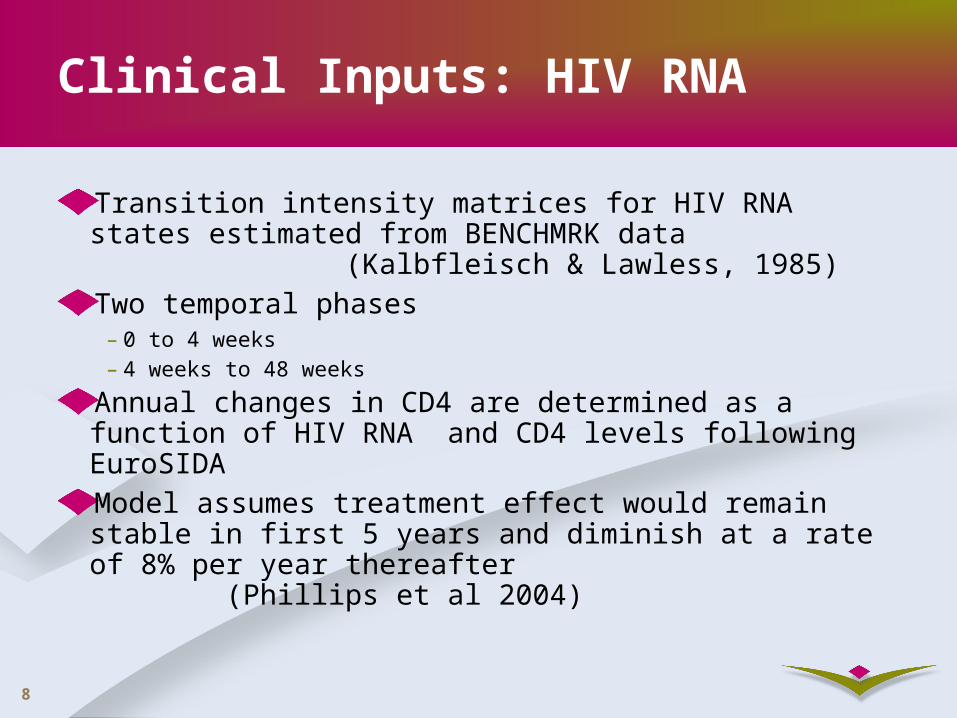
Clinical Inputs: HIV RNA
Transition intensity matrices for HIV RNA states estimated from BENCHMRK data
(Kalbfleisch & Lawless, 1985)Two temporal phases– 0 to 4 weeks– 4 weeks to 48 weeks
Annual changes in CD4 are determined as a function of HIV RNA and CD4 levels following EuroSIDAModel assumes treatment effect would remain stable in first 5 years and diminish at a rate of 8% per year thereafter (Phillips et al 2004)
9
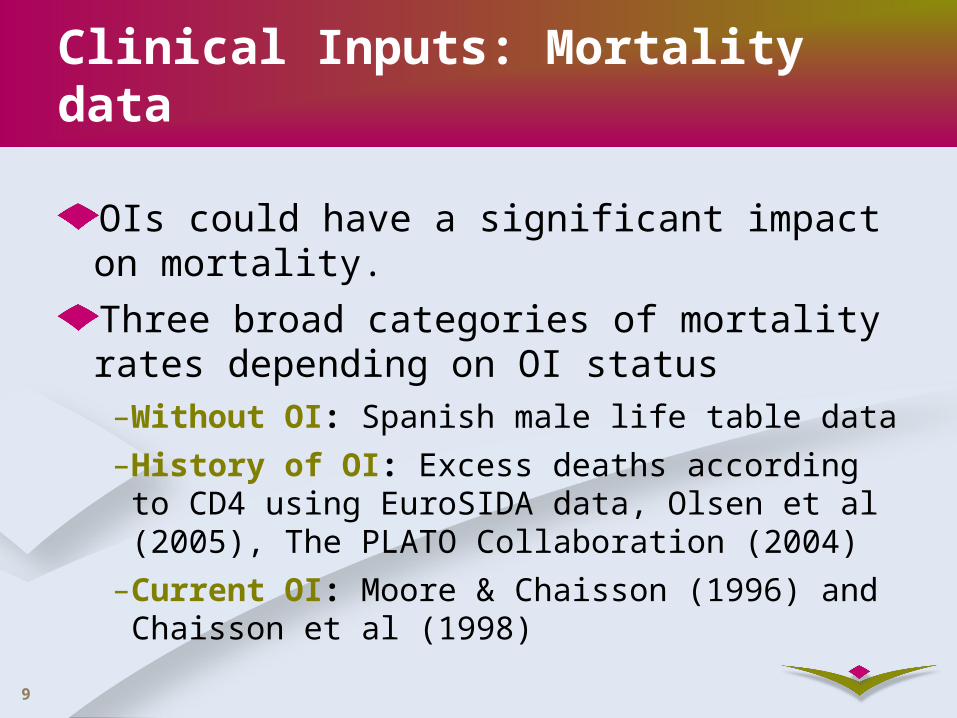
Clinical Inputs: Mortality data
OIs could have a significant impact on mortality.
Three broad categories of mortality rates depending on OI status
–Without OI: Spanish male life table data
–History of OI: Excess deaths according to CD4 using EuroSIDA data, Olsen et al (2005), The PLATO Collaboration (2004)
–Current OI: Moore & Chaisson (1996) and Chaisson et al (1998)
10
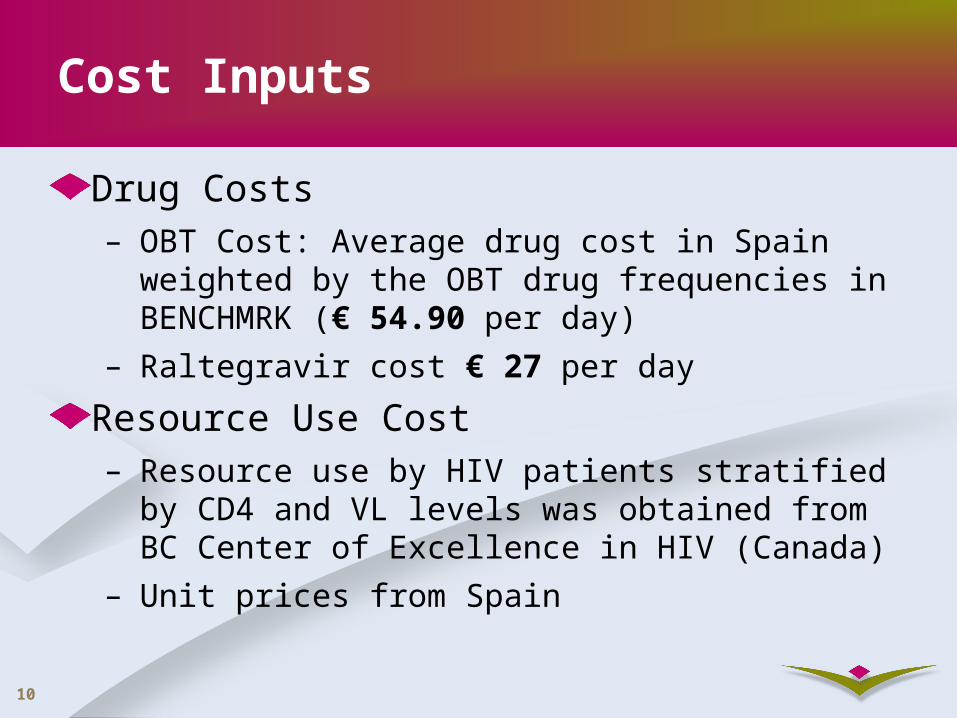
Cost Inputs
Drug Costs– OBT Cost: Average drug cost in Spain weighted by
the OBT drug frequencies in BENCHMRK (€ 54.90 per day)
– Raltegravir cost € 27 per day
Resource Use Cost– Resource use by HIV patients stratified by CD4 and
VL levels was obtained from BC Center of Excellence in HIV (Canada)
– Unit prices from Spain
11
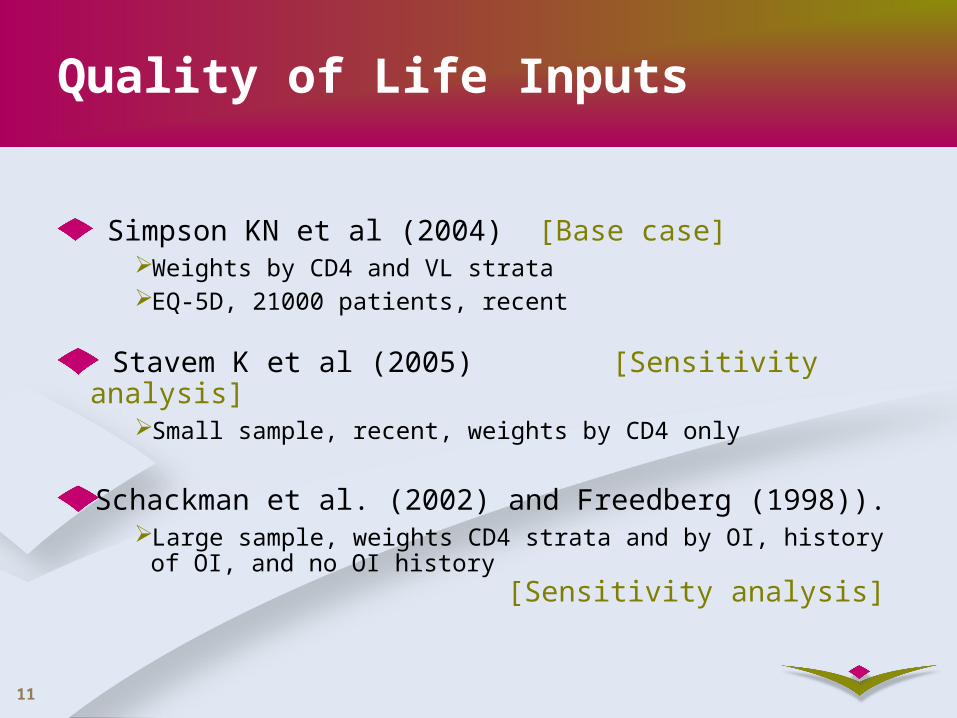
Quality of Life Inputs
Simpson KN et al (2004) [Base case] Weights by CD4 and VL strataEQ-5D, 21000 patients, recent
Stavem K et al (2005) [Sensitivity analysis]Small sample, recent, weights by CD4 only
Schackman et al. (2002) and Freedberg (1998)). Large sample, weights CD4 strata and by OI, history of OI,
and no OI history
[Sensitivity analysis]
12
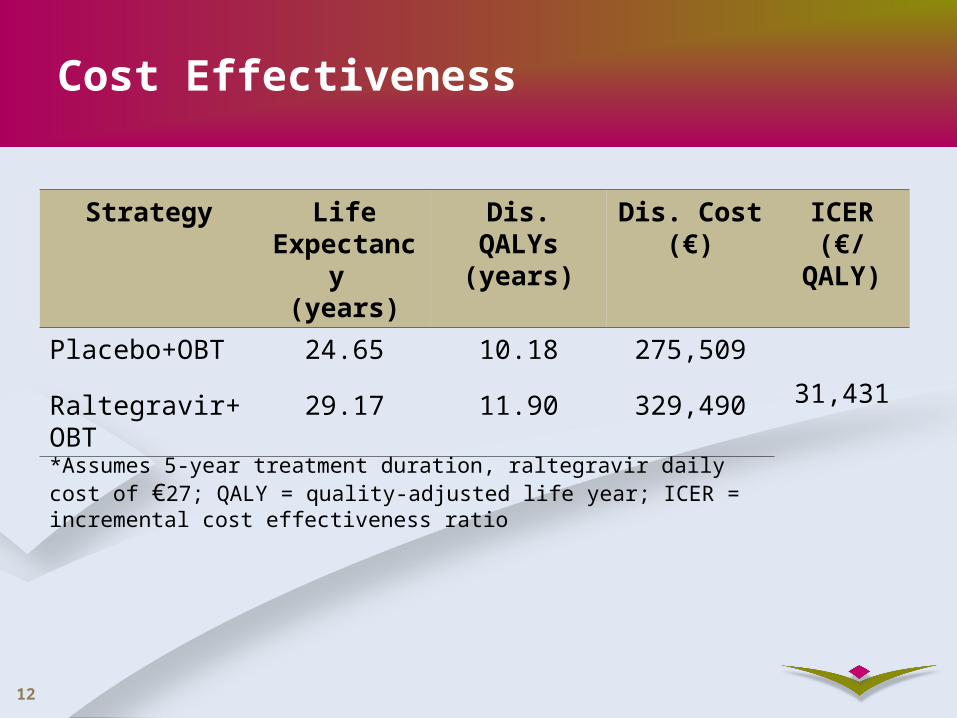
Cost Effectiveness
*Assumes 5-year treatment duration, raltegravir daily cost of €27; QALY = quality-adjusted life year; ICER = incremental cost effectiveness ratio
Strategy Life Expectancy
(years)
Dis. QALYs(years)
Dis. Cost (€)
ICER(€/QALY)
Placebo+OBT 24.65 10.18 275,50931,431Raltegravir+OB
T29.17 11.90 329,490
13
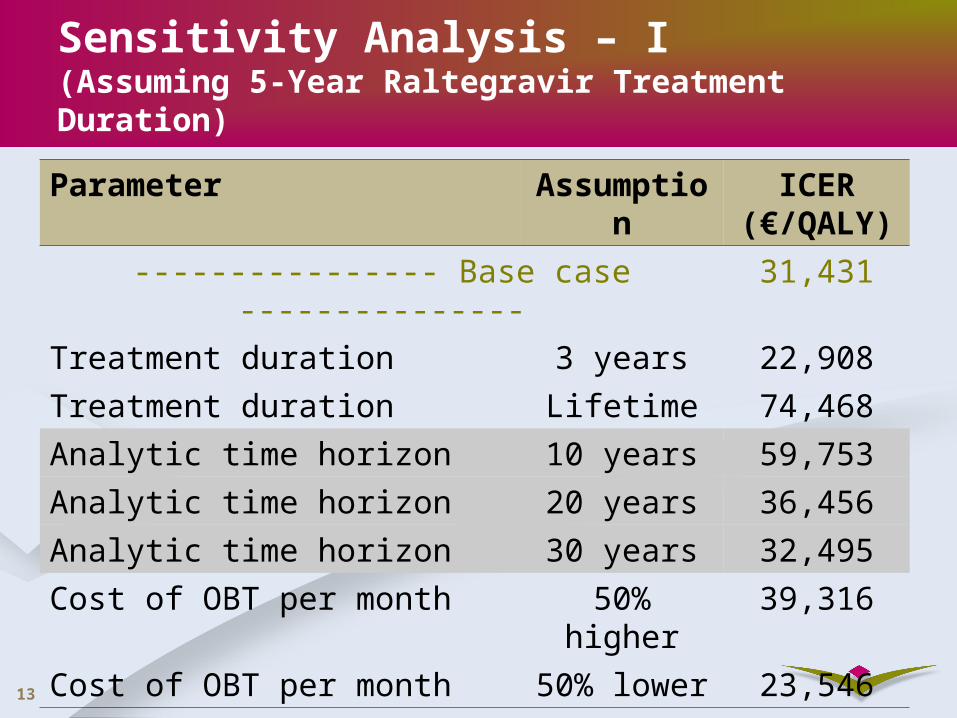
Sensitivity Analysis – I(Assuming 5-Year Raltegravir Treatment Duration)
Parameter Assumption ICER (€/QALY)
---------------- Base case --------------- 31,431
Treatment duration 3 years 22,908
Treatment duration Lifetime 74,468
Analytic time horizon 10 years 59,753
Analytic time horizon 20 years 36,456
Analytic time horizon 30 years 32,495
Cost of OBT per month 50% higher 39,316
Cost of OBT per month 50% lower 23,546
14
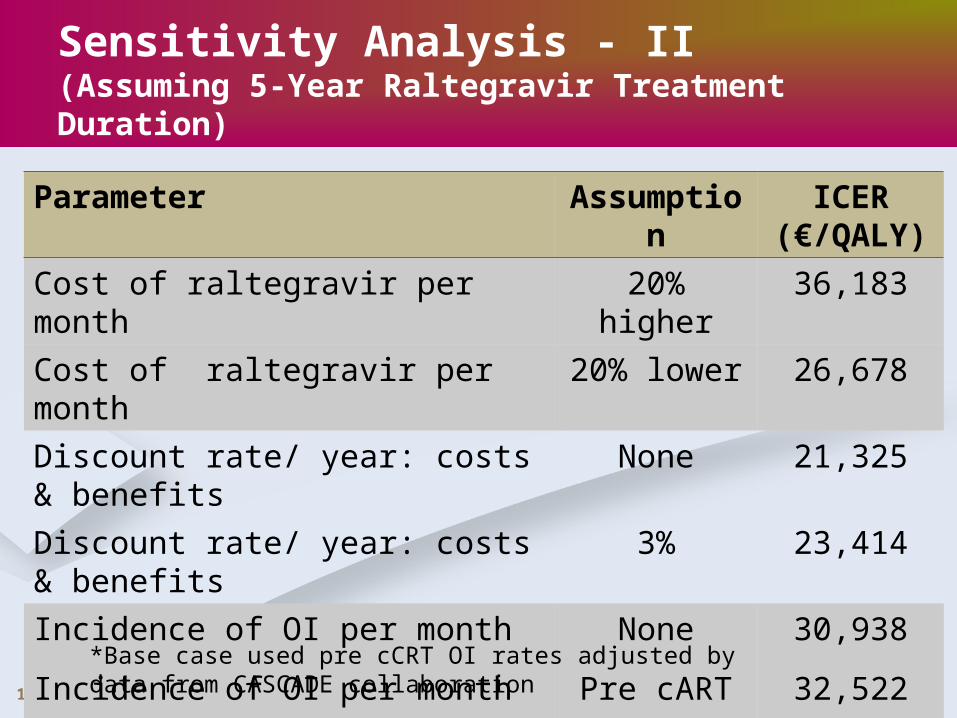
Sensitivity Analysis - II(Assuming 5-Year Raltegravir Treatment Duration)
Parameter Assumption ICER (€/QALY)
Cost of raltegravir per month 20% higher 36,183
Cost of raltegravir per month 20% lower 26,678
Discount rate/ year: costs & benefits None 21,325
Discount rate/ year: costs & benefits 3% 23,414
Incidence of OI per month None 30,938
Incidence of OI per month Pre cART 32,522
*Base case used pre cCRT OI rates adjusted by data from CASCADE collaboration
15
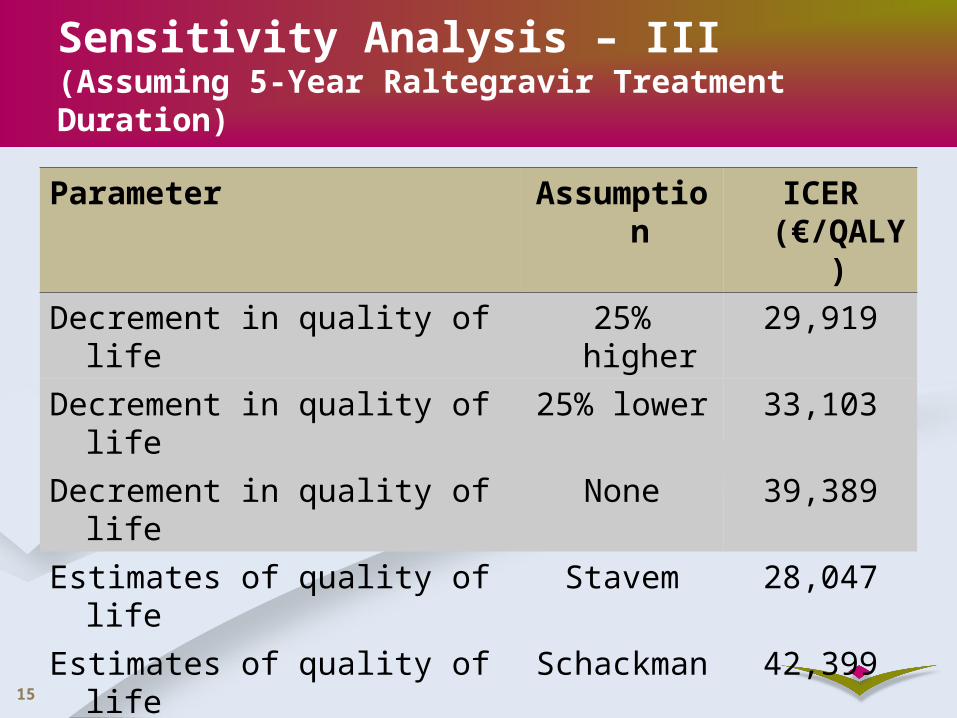
Parameter Assumption ICER (€/QALY)
Decrement in quality of life 25% higher 29,919
Decrement in quality of life 25% lower 33,103
Decrement in quality of life None 39,389
Estimates of quality of life Stavem 28,047
Estimates of quality of life Schackman 42,399
Failure rate after treatment 1% 31,462
Failure rate after treatment 16% 31,396
Sensitivity Analysis – III(Assuming 5-Year Raltegravir Treatment Duration)
16
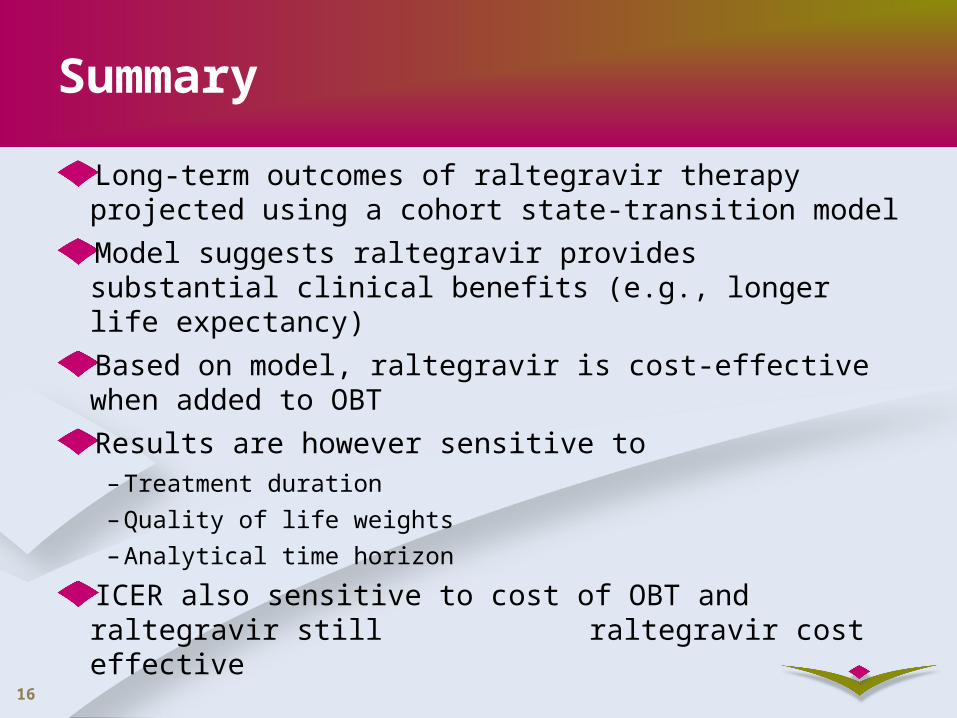
Summary
Long-term outcomes of raltegravir therapy projected using a cohort state-transition model
Model suggests raltegravir provides substantial clinical benefits (e.g., longer life expectancy)
Based on model, raltegravir is cost-effective when added to OBT
Results are however sensitive to– Treatment duration
– Quality of life weights
– Analytical time horizon
ICER also sensitive to cost of OBT and raltegravir still raltegravir cost effective
17
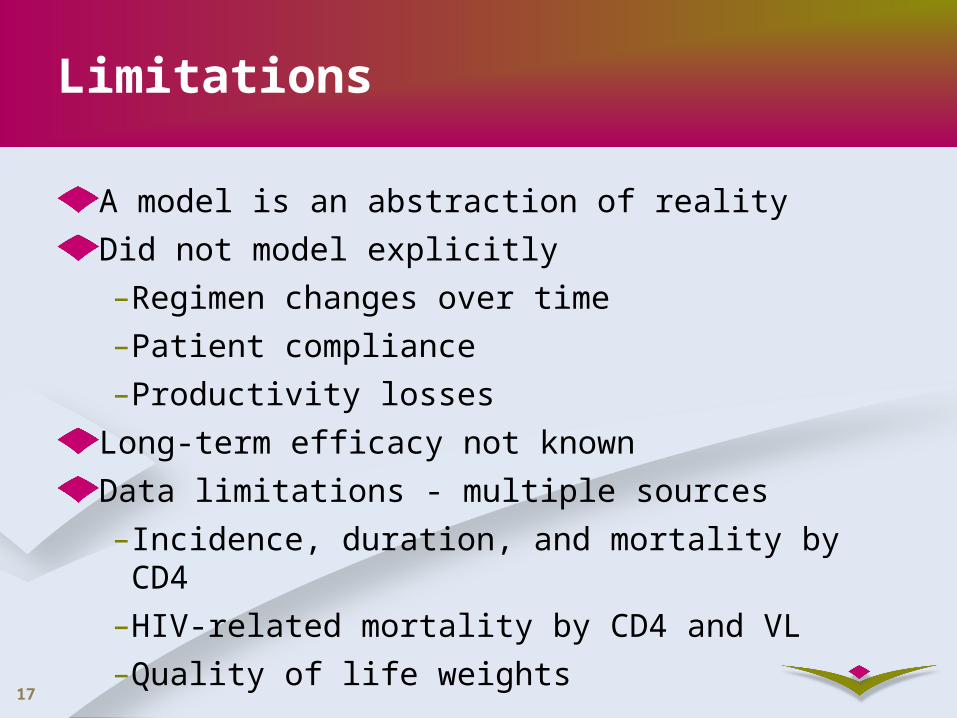
Limitations
A model is an abstraction of reality
Did not model explicitly
–Regimen changes over time
–Patient compliance
–Productivity losses
Long-term efficacy not known
Data limitations - multiple sources
–Incidence, duration, and mortality by CD4
–HIV-related mortality by CD4 and VL
–Quality of life weights
18
References
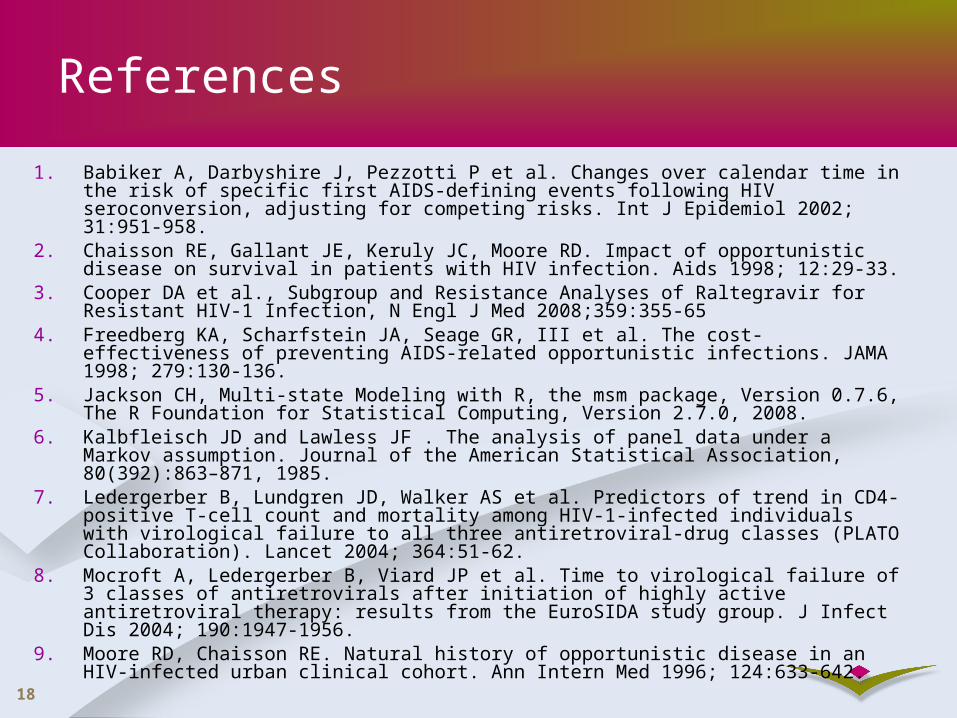
1. Babiker A, Darbyshire J, Pezzotti P et al. Changes over calendar time in the risk of specific first AIDS-defining events following HIV seroconversion, adjusting for competing risks. Int J Epidemiol 2002; 31:951-958.
2. Chaisson RE, Gallant JE, Keruly JC, Moore RD. Impact of opportunistic disease on survival in patients with HIV infection. Aids 1998; 12:29-33.
3. Cooper DA et al., Subgroup and Resistance Analyses of Raltegravir for Resistant HIV-1 Infection, N Engl J Med 2008;359:355-65
4. Freedberg KA, Scharfstein JA, Seage GR, III et al. The cost-effectiveness of preventing AIDS-related opportunistic infections. JAMA 1998; 279:130-136.
5. Jackson CH, Multi-state Modeling with R, the msm package, Version 0.7.6, The R Foundation for Statistical Computing, Version 2.7.0, 2008.
6. Kalbfleisch JD and Lawless JF . The analysis of panel data under a Markov assumption. Journal of the American Statistical Association, 80(392):863–871, 1985.
7. Ledergerber B, Lundgren JD, Walker AS et al. Predictors of trend in CD4-positive T-cell count and mortality among HIV-1-infected individuals with virological failure to all three antiretroviral-drug classes (PLATO Collaboration). Lancet 2004; 364:51-62.
8. Mocroft A, Ledergerber B, Viard JP et al. Time to virological failure of 3 classes of antiretrovirals after initiation of highly active antiretroviral therapy: results from the EuroSIDA study group. J Infect Dis 2004; 190:1947-1956.
9. Moore RD, Chaisson RE. Natural history of opportunistic disease in an HIV-infected urban clinical cohort. Ann Intern Med 1996; 124:633-642.
19
References (Contd.)
10. Olsen CH, Gatell J, Ledergerber B et al. Risk of AIDS and death at given HIV-RNA and CD4 cell counts, in relation to specific antiretroviral drugs in the regimen. Aids 2005; 19:319-330.
11. Phillips AN, Ledergerber B, Horban A et al. Rate of viral rebound according to specific drugs in the regimen in 2120 patients with HIV suppression. Aids 2004; 18:1795-1804.
12. Schackman BR, Goldie SJ, Freedberg KA, Losina E, Brazier J, Weinstein MC. Comparison of health state utilities using community and patient preference weights derived from a survey of patients with HIV/AIDS. Medical Decision Making 2002; 22:27-38.
13. Simpson KN, Luo MP, Chumney E, Sun E, Brun S, Ashraf T. Cost-effectiveness of lopinavir/ritonavir versus nelfinavir as the first-line highly active antiretroviral therapy regimen for HIV infection. HIV Clin Trials 2004; 5:294-304.
14. Stavem K, Froland SS, Hellum KB. Comparison of preference-based utilities of the 15D, EQ-5D and SF-6D in patients with HIV/AIDS. Quality of Life Research 2005; 14:971-980.
15. Steigbigel RT et al., Raltegravir with optimized background therapy for resistant HIV-1 Infection, N Engl J Med 2008;359:339-54.
16. Weinstein MC, Goldie SJ, Losina E et al. Use of genotypic resistance testing to guide HIV therapy: Clinical impact and cost-effectiveness. Annals of Internal Medicine 2001; 134:440-450.