Embed Size (px)
Citation preview
Date: ________________ Approved: _________________________ Randall Kramer, Advisor
Masters project submitted in partial fulfillment of the requirements for the Master of Environmental Management degree in
the Nicholas School of the Environment and Earth Sciences of Duke University
2007
COST EFFECTIVENESS OF AN ELECTRONIC WASTE RECYCLING
PROGRAM FOR HARNETT COUNTY, NORTH CAROLINA
by
Dastan Kusmanov
2
ABSTRACT
Widespread use of electronics in business and residential settings has created a
problem of electronic waste disposal, when the electronics are discarded at the end of
their useful life. Recognized as hazardous waste for the heavy metals contained in them,
electronic discards are managed as such only if generated by businesses. In the absence
of federal regulations for household electronic waste in the United States and state
regulations in North Carolina, the electronic waste problem could be addressed at the
county level. One of the options a policy-maker faces is to establish an e-waste collection
and recycling program at the local landfill, thus offering residents the means to recycle
their e-waste. In this master’s project I estimate the costs of establishing an e-waste
recycling program in Harnett County, North Carolina. The results allow a policy maker to
compare the costs of a local electronic waste recycling program to the costs of current
recycling programs offered by major electronics producers, or the benefits from diverting
electronic waste from local landfills. The information on costs of the program also
provides estimates of the amount of funds that the county would need to run the program,
or the amount of tax or purchase fee that could be imposed to provide funds for the
program
3
CONTENTS:
1. OVERVIEW OF E-WASTE PROBLEM 4
1.1 APPROACHES TO THE ELECTRONIC WASTE PROBLEM 11
1.2 ELECTRONIC WASTE POLICY IN NORTH CAROLINA 15
2. OBJECTIVES 19
3. METHODS 21
3.1 INTRODUCTION 21
3.2 ESTIMATION OF E-WASTE VOLUMES 22
3.3 ESTIMATION OF COSTS 35
4. SENSITIVITY ANALYSIS 44
5. CONCLUSIONS AND POLICY RECOMMENDATIONS 48
BIBLIOGRAPHY 50
APPENDIX 1 56
APPENDIX 2 57
APPENDIX 3 58
APPENDIX 4 59
APPENDIX 5 60
4
1. OVERVIEW OF E-WASTE PROBLEM
With the development of electronic equipment and its penetration into many aspects
of our lives, the number of electronic devices we discard is growing dramatically. This
trend is exacerbated by growing consumer demand for electronic products. Further, the
short in-service period for many electronics is decreasing with the rapid appearance of
newer products. It was estimated by the National Safety Council in 1999 that “nearly 250
million computers will become obsolete in the next five years and mobile phones will be
discarded at a rate of 130 million per year by 2005.” The NSC study also showed that of
approximately 20.6 million computers that became obsolete in the United States in 1998,
only 11 percent were recycled.1
In the absence of recycling options, most people keep obsolete electronics in storage,
preventing electronic waste from entering the municipal solid waste (MSW) stream and
filling valuable landfill space. However, these stockpiles of obsolete electronics could
create serious problems once they are discarded. A survey of California residents
conducted in 2001 showed that 18.5 percent of respondents store from 1 to 3 television
monitors; 19.4 percent of respondents stockpiled from 1 to 3 computer monitors.2 The
lag between the moment when an electronic product is not used any more and the
moment when it is actually discarded provides an opportunity to rethink e-waste strategy
and create recycling systems to divert electronic waste from the landfills.
Because electronics contain heavy metals, discarded electronics are usually classified
as hazardous waste. Electronic waste in the United States (US) includes televisions,
1 United States Environmental Protection Agency, eCycling
http://www.epa.gov/epaoswer/hazwaste/recycle/ecycling/index.htm (accessed on September 25, 2006) 2 California Environmental Protection Agency, Integrated Waste Management Board. “Selected E-Waste
Diversion in California: A Baseline Study.” November 2001 http://www.ciwmb.ca.gov/Publications/HHW/61001008.doc (accessed on February 5, 2006)
5
computer monitors and peripherals, entertainment electronics, and telephones. In the
European Union (EU) the definition of electronic waste is much broader and includes
other electrical appliances, such as refrigerators, electric tools, toasters and vacuum
cleaners.3 The Waste Electrical and Electronic Equipment Directive (WEEE) and the
Restriction of Hazardous Substances Directive (RoHS) also impose restrictions on
substances that could be used in electronic and electrical equipment.4,5
Computer and television monitors are of most concern because of large quantities of
lead in the glass contained in these items. Lead is also used in soldering of printed circuit
boards. Besides lead, television and computer cathode ray tubes contain chromium,
cadmium, mercury, and beryllium.6 Mercury is found in thermostats, position sensors,
relays and switches, discharge lamps, medical equipment, data transmission and
telecommunication equipment, and mobile phones. Chromium is used to protect against
corrosion of untreated and galvanized steel plates. Brominated flame retardants (BFR)
can be a component of printed circuit boards, plastic covers and cables.7,8 Also,
electronics contain plastics that create dioxins when burned.9 Most of these substances
3 Environment Directorate-General of the European Commission, Waste Electrical and Electronic Equipment
Directive http://ec.europa.eu/environment/waste/weee_index.htm (accessed on February 2, 2007) 4 Directive 2002/95/EC of the European Parliament and of the Council of 27 January 2003 on the restriction of
the use of certain hazardous substances in electrical and electronic equipment http://europa.eu/eur-lex/pri/en/oj/dat/2003/l_037/l_03720030213en00190023.pdf (accessed on February 12, 2007) 5 Selin, H, Stacy D VanDeveer. “Raising global standards - Hazardous substances and E-waste management in the European Union.” Environment, Washington: Dec 2006.Vol.48, Iss. 10; pg. 6, 14 pgs 6 US Environmental Protection Agency, eCycling http://www.epa.gov/epaoswer/hazwaste/recycle/ecycling/faq.htm#concern (accessed on September 25, 2006) 7 McPherson Alexandra, Thorpe Beverley, Blake Ann. “Brominated Flame Retardants in Dust on Computers: the
case for safer chemicals and better computer design”, June 2004 http://www.computertakeback.com/docUploads/bfr_report.pdf?CFID=6511728&CFTOKEN=31059718 (accessed on February 17, 2007) 8 Kellyn S Betts. “PBDEs and PCBs in computers, cars, and homes”. Environmental Science & Technology,
12/15/2006, Vol. 40 Issue 24, p7452-7452 9 Widmer Rolf, Oswald-Krapf Heidi Sinha-Khetriwal Deepali, Schnellmann Max, Boni Heinz. 2005. “Global perspectives on e-waste.” Environmental Impact Assessment Review, 25 (2005) 436– 458.
6
are considered hazardous and pose threats to human and environmental health.10 To date
a series of experiments with primary emphasis on lead leachability from electronics were
performed. These experiments confirmed the classification of electronic equipment as
hazardous waste.
Research performed at University of Florida, Gainesville showed that television
cathode ray tubes and computer monitors exceed the 5 mg/l11 of lead in the leaching
solution regulatory limit for characterization as a hazardous waste. In order to determine
the potential of electronics to leach toxic substances into groundwater in landfill
conditions, the study group used the standard toxicity characteristic leaching procedure
(TCLP) developed by EPA. The use of TCLP showed average CRT lead concentration
of 18.5 mg/l in TCLP extracts, with a 99% confidence interval from 9.1mg/l to 28.0
mg/l.12
Tests of laptop computers, LCD monitors, plasma and LCD televisions were also
performed in the Hazardous Material Laboratory of the California Department of Toxic
Substances Control in 2004. Devices were dismantled into components; and the weights
of components were recorded. After millable components were ground and mixed well,
they were digested using EPA Method 3050, and were extracted using the Toxicity
Characteristic Leaching Procedure (TCLP) or the California Waste Extraction Test
(WET). Results indicated that taken separately, components of electronics exceed the
10 Charles W. Schmidt. 2002. “e-Junk Explosion.” Environmental Health Perspectives, Apr 2002, Vol. 110 Issue 4, pA188 11 40 CFR Ch. I , § 261.24 Toxicity characteristic. http://a257.g.akamaitech.net/7/257/2422/20oct20031500/edocket.access.gpo.gov/cfr_2003/julqtr/pdf/40cfr261.24.pdf (accessed February 2, 2007) 12
Stephen E Musson, Yong-Chul Jang, Timothy G Townsend, Il-Hyun Chung. “Characterization of lead leachability from cathode ray tubes using the toxicity characteristic leaching procedure.” Environmental Science
& Technology, Easton: Oct 15, 2000.Vol.34, Iss. 20; pg. 4376 (Florida Center for Solid and Hazardous Waste Management, Report #99-5, State University System of Florida. http://www.hinkleycenter.com/publications/lead_leachability_99-5.pdf (accessed on December 12, 2006))
7
total threshold limit concentration (TTLC) and the toxicity characteristic (TC) limit for
lead in leaching solution. The report concludes that the cold cathode fluorescence lamps
(CCFLs) have high mercury content, which exceeds TTLC if taken separately. However,
if CCFLs are disposed of in conjunction with the entire device, the mercury content of the
device is below TTLC. The inner panels of the plasma televisions exceed TTLC, the TC
limit and the STLC for lead. The copper content of printed circuit boards exceeded TTLC
in all tested devices.13
Some researchers have criticized this approach because the TCLP procedure required
crushing CRTs in order to perform the test and discarded electronics are not always
crushed in the landfills. Research by Christian et al. suggested that electronics would tend
to leach smaller concentrations of hazardous substances if kept intact.14 In another study,
researchers at the University of Florida developed modified large scale versions of TCLP
for testing bulky electronic devices. The concern they addressed in their study was that
electronic devices are large and difficult to size reduce. Since toxic chemicals
concentrations vary in different parts of a device, the samples taken for the standard
TCLP procedure could show different leaching concentrations from the leaching
concentration attributable to the whole device. The researchers tested different types of
electronic equipment without crushing for size reduction by measuring the leaching of
intact devices and holding other conditions of the standard TCLP constant. The results of
the large-scale modified TCLP showed that most electronics leach lead at concentrations
13
California Department of Toxic Substances Control, Hazardous Material Laboratory. “SB20 Report. Determination of regulated elements in discarded laptop computers, LCD monitors, Plasma TVs and LCD TVs.” 2004 http://www.dtsc.ca.gov/HazardousWaste/EWaste/upload/HWMP_REP_SB20_LCD.pdf (accessed on December 15, 2006) 14
Christian B., Turner David, Romanov Alexandre. “Leaching of Lead and Other Elements from Portable Electronics”, 2006 http://www.rohsusa.com/papers/Leachingpaper1.pdf#search=%22electronics%20leaching%22 (accessed on December 15, 2006)
8
that exceed the Resource Conservation and Recovery Act (RCRA) toxicity characteristic
standard. Moreover, the modified large-scale TCLP resulted in greater lead
concentrations than the standard TCLP. This difference was attributed to greater
concentrations of ferrous metals in the samples used for standard TCLP (where they used
crushed CPUs) than in modified TCLP without size reduction. Greater concentrations of
ferrous metals in the samples used in previous studies with the standard TCLP (when
CPUs were thought to be representative of the whole device and the sample components
were crushed) were creating electrochemical conditions inhibiting lead leaching in
solution.15
Despite different levels of leachability depending on test conditions, the evidence
shows that electronics contain heavy metals and very often exhibit characteristics of
hazardous waste. Therefore, it is appropriate that electronic waste generated by
businesses is regulated by hazardous waste regulations (RCRA).16 However, the
difficulty with electronic waste recycling emerges with the relatively small but variable
quantities of e-waste generated at certain points in times. The costs of disposal are
generally higher for generators producing e-waste in such quantities. Large businesses
that generate greater volumes of e-waste composed of the same type of electronic
equipment have greater ability and resources to arrange for cheaper collection and
15
Stephen E Musson, Kevin N Vann, Yong-Chul Jang, Sarvesh Mutha, et al. 2006. “RCRA Toxicity Characterization of Discarded Electronic Devices.” Environmental Science & Technology, Easton: Apr 15, 2006.Vol.40, Iss. 8; pg. 2721 (Department of Environmental Engineering Sciences, University of Florida, Gainesville, Florida. http://www.epa.gov/reg5rcra/wptdiv/solidwaste/ecycling/UF-EWaste-Final.pdf#search=%22electronics%20leaching%22 (accessed on December 15, 2006)) 16
To promote recycling some states added e-waste to universal waste list allowing for less stringent regulations in managing it. On the federal level, a proposed rule to add e-waste to universal waste list failed. United States Environmental Protection Agency, Proposed Rule on Discarded Cathode Ray Tubes and Mercury-Containing Equipment, June 12, 2002 http://www.epa.gov/epaoswer/hazwaste/recycle/electron/crt2.htm (accessed on February 15, 2007)
9
recycling. Also, large businesses have incentives to manage their waste because they are
more likely to be the subject to media concern.
Small businesses usually generate smaller quantities of e-waste composed of different
types of electronics, with disposal occurring at a variety of times and locations. Also,
small generators may have little knowledge of available options or the financial resources
for electronic waste recycling. To reduce recycling costs to small quantity generators and
promote e-waste recycling, some states have expanded the application of universal waste
regulations to include electronic waste. 17, 18, 19, 20
Even though in the US, electronic waste generated by businesses is regulated by
hazardous waste regulations (RCRA), the electronic waste generated by households is
exempt from RCRA regulations.21 As a result, household electronic waste has become a
special issue because household electronics can be discarded with household waste and
sent to municipal landfills.22 Lack of opportunities to recycle residential electronic waste
was reflected in the results of a 2001 survey of residents of California. The survey results
showed that 20.1 percent of respondents who did not store old television monitors had
thrown them away in trash. While 43.4 percent of respondents were able to give old
17
State of Oregon Department of Environmental Quality, CRT Interim Policy 2002-PO-001, 2002 http://www.deq.state.or.us/lq/pubs/docs/hw/Policy/2002-PO-001.pdf (accessed on November 25, 2006) 18
Texas Commission on Environmental Quality, Regulations That Apply to Recyclers and Other Handlers of Used Electronics http://www.tceq.state.tx.us/assistance/P2Recycle/electronics/RecyclerRegs.html (accessed on November 25, 2006) 19
Utah Department of Environmental Quality, eNewsletter, 2004 http://www.deq.utah.gov/News/newsletter/EC_Summer_2004.pdf (accessed on November 25, 2006) 20
Washington State Department of Ecology, Interim Enforcement Policy Conditional Exclusion for Cathode Ray Tubes and Related Electronic Wastes, 2002 http://www.ecy.wa.gov/pubs/0204017.pdf (accessed on November 25, 2006) 21
Resource Conservation and Recovery Act, Section III, Subtitle C, Chapter 1: Hazardous Waste Identification, http://www.epa.gov/epaoswer/general/orientat/rom31.pdf (accessed on November 25, 2006) 22 Richard Dahl. 2002. “Who Pays for e-Junk?” Environmental Health Perspectives, 110 (4): A196-A199 Apr 2002.
10
television away to friends, relatives, or charity, only 1.2 percent took their televisions to
recycling centers.23
Once obsolete electronics enter the municipal solid waste stream, they may go to
either waste-to-energy facilities or the landfills. While landfill space is very valuable,
burning electronics releases toxic substances over a large area and contributes to air
pollution. Water pollution from leachate from electronics in landfills could be prevented
by containing them, or by taking preventive actions, i.e. switching to other sources of
drinking water. While harm from burning occurs almost immediately after disposal, harm
from leachate from landfills is likely to occur over a long period of time. Health benefits
occurring from preventing e-waste leachate from landfills in the future after discounting
to the time of disposal would yield smaller present values compared to the health benefits
from preventing of e-waste incineration, thus shifting e-waste disposal from incineration
to landfills. Despite lower present costs of disposal, landfill operators should be
concerned with potential future liabilities under the Comprehensive Environmental
Response, Compensation, and Liability Act (CERCLA) regulations. To reduce the
amount of hazardous substances added to landfills and prevent potential leakage of heavy
metals from e-waste in landfills and contamination of groundwater, residential electronic
waste should be collected and recycled, or treated separately in order to remove it from
waste stream.
23
California Environmental Protection Agency, Integrated Waste Management Board. “Selected E-Waste Diversion in California: A Baseline Study.” November 2001 http://www.ciwmb.ca.gov/Publications/HHW/61001008.doc (accessed on February 5, 2006)
11
1.1 APPROACHES TO THE ELECTRONIC WASTE PROBLEM
The lack of federal policy to deal with the growing amount of household electronic
waste has created opportunities to exercise different approaches to the electronic waste
problem in the US. Initial approaches to the electronic waste problem were exemplified
by occasional collection events conducted by state departments of environmental
protection, donation programs, or voluntary producer collection.24 But even today
collection events do not occur frequently and are not available to all citizens at the time
when they are ready to discard electronics.
One of the options suggested to prolong the life of electronic equipment is to reuse
it.25 A number of organizations collect outdated electronic equipment, upgrade it and
resell it. Old equipment can also be donated to charity organizations. These approaches
prolong the life of electronic equipment, but do not solve the e-waste problem totally.
Besides the fact that not all outdated electronics can be sold or donated, even reused
electronics finally break or become so obsolete that they are discarded. This approach
also represents a disguised way for businesses to get rid of their hazardous waste by
selling it at cheaper prices or donating it, thus escaping responsibility for proper disposal.
In the long run innocent purchasers of old and cheap equipment have to dispose of it.
In the long run, neither reuse through charity donation or reselling, nor collection
events are capable of absorbing all the e-waste that eventually ends up in the landfills.
Recognizing the potential harm from electronic waste, a number of states have
implemented a ban on disposal of cathode ray tubes in the landfills. This was done in
24
United Sates Environmental Protection Agency, “Electronics: A New Opportunity for Waste Prevention, Reuse, and Recycling.” June 2001. http://www.epa.gov/epaoswer/osw/elec_fs.pdf (accessed on September 30, 2006) 25
United Sates Environmental Protection Agency, “Electronics: A New Opportunity for Waste Prevention, Reuse, and Recycling.” June 2001. http://www.epa.gov/epaoswer/osw/elec_fs.pdf (accessed on September 30, 2006)
12
Massachusetts (2000)26, California (2002), Maine (2006)27, and Minnesota (2006).28 In
2006, a New Hampshire act prohibited disposal of video display devices in solid waste
landfills or incinerators. The ban will take effect after July 1, 2007.29 Rhode Island
passed the Electronic Waste Prevention, Reuse and Recycling Act in 2006. It bans
electronics from landfill disposal beginning in July 2008.30 The reasons for the ban were
diminishing landfill space, contamination of incinerator ash, potential health risks and
liability issues faced by landfills. Further, an opportunity was perceived for recycling lead
and other precious metals which could eventually reduce the need for strip and acid
mining.
Another restriction for dealing with electronic waste was set by the Basel Convention
on the Control of Transboundary Movements of Hazardous Wastes and Their Disposal.
The Basel Convention is an international treaty that intends to prevent exports of
hazardous waste from developed to developing countries.31 The Basel Ban Amendment
proposed under the Basel Convention in 1995, though not in force,32 is considered
binding in practice by many countries and has led to a number of trade bans in some parts
of the world. In the EU the Basel Ban was fully implemented in the Waste Shipment
Regulation (EWSR), which is applicable to EU member states. A number of cases when
26
The Massachusetts Department of Environmental Protection. 310 CMR 19.017: Waste Disposal Ban Regulation. http://www.mass.gov/dep/recycle/laws/bansreg.htm (accessed on October 5, 2006) 27
Maine State Planning Office, Electronics Recycling Resources http://www.state.me.us/spo/recycle/hhw/electronics (accessed on October 5, 2006) 28
Minnesota Office of Environmental Assistance, http://www.moea.state.mn.us/stewardship/crt-ban.cfm (accessed on October 5, 2006) 29
State of New Hampshire. “An act relative to the disposal of video display devices,” approved May 24, 2006. http://www.gencourt.state.nh.us/legislation/2006/HB1455.html (accessed on February 12, 2007) 30 General Assembly of Rhode Island. “An Act Relating to Health and Safety - Electronic Waste Producer
Responsibility,” enacted 07/07/2006. http://www.rilin.state.ri.us/publiclaws/law06/law06365.htm (accessed on February 12, 2007) 31
Basel Convention on the Control of Transboundary Movements of Hazardous Wastes and Their Disposal http://www.basel.int/text/con-e-rev.pdf (accessed on October 5, 2006) 32
Secretariat of Basel Convention. Status of ratification. http://www.basel.int/ratif/frsetmain.php?refer=ban-alpha.htm (accessed on February 5, 2007)
13
hazardous waste was exported to developing countries under pretext of recycling have
increased environmental concerns over e-waste exporting.33, 34 In 2005 activists from the
Basel Action Network (BAN) and the Silicon Valley Toxics Coalition (SVTC) conducted
investigations into recycling of electronics exported to China, India and Pakistan.35 The
investigation uncovered use of local workers uninformed of the health and environmental
hazards related to the work, use of child labor, and enormous pollution resulting from
improper recycling techniques: open burning of plastics and wires, riverbank acid works
to extract gold, melting and burning of toxic soldered circuit boards, cracking and
dumping of cathode ray tubes along rivers, in open fields and irrigation canals. The
evidence shows the negative impact that can be created by improper disposal of e-waste
when exported.36
Most advanced approaches adopted in California and some Northeast US states aim
to establish systems for collection and recycling of electronic waste and provide funding
to cover costs of the program while requiring recyclers to follow environmentally sound
management practices.37 Establishing e-waste collection and recycling systems allows
states to deal with the growing amount of discarded electronics, and to conserve valuable
33 Deng, WJ, Louie, PKK, Liu, WK, Bi, XH, Fu, JM, Wong, MH. 2006. “Atmospheric levels and cytotoxicity of PAHs and heavy metals in TSP and PM2.5 at an electronic waste recycling site in southeast China.” Atmospheric Environment, 40 (36): 6945-6955 Nov 2006. 34 Yu, XZ, Gao, Y, Wu, SC, Zhang, HB, Cheung, KC, Wong, MH. 2006. “Distribution of polycyclic aromatic hydrocarbons in soils at Guiyu area of China, affected by recycling of electronic waste using primitive technologies.” Chemosphere, 65 (9): 1500-1509 Nov 2006 35
The Basel Action Network (BAN) and Silicon Valley Toxics Coalition (SVTC). “Exporting Harm The High-Tech Trashing of Asia.” 2002. http://www.ban.org/E-waste/technotrashfinalcomp.pdf (accessed on October 5, 2006) 36 Charles W. Schmidt. 2004. “Environmental Crimes: Profiting at the Earth's Expense.” Environmental
Health Perspectives, Vol. 112, No. 2 2004-02 pp. A96-A103 37 Konoval, George J. 2006. “Electronic waste control legislation: observations on a new dimension in state environmental regulation.” Air Force Law Review, 2006, Vol. 58, p147-173
14
resources and landfill space. They also ensure that environmentally sound recycling
practices are used.
In 2005 California imposed an Electronic Waste Recycling Fee on electronic
equipment purchases in the state to create a fund for recycling electronics. Retailers are
required to collect the fee from consumers and send it to the California Board of
Equalization (BOE). The fees are accumulated in the Integrated Waste Management Fund
(IWMF) and later used to pay recycling costs.38 In addition, California has imposed
technology based requirements similar to the EU regulations to limit the concentrations
of hazardous substances in electronic devices.39
An approach taken in EU countries and some US states (Maine, Maryland) puts the
responsibility on manufacturers to take back electronic equipment or pay recycling costs
when it becomes obsolete. Thus, the producer becomes responsible for recycling or
reusing outdated electronics40. In the Act to Protect Public Health amended 2001, Maine
required producers of electronics to assume responsibility for electronic waste or
establish take back programs in order to continue selling their products in the state.41 In
practice this implies that the producer pays the costs of electronics recycling, but the
consumer still bears some part of the costs. Finally, a shared responsibility agreement in
Maine requires active participation of municipalities in managing e-waste.
38
Korenstein S. J. 2005 “Managing electronic waste: the California approach”. (accessed on October 15, 2006) Journal of Environmental Health, 67 (6): 36-37 Jan-Feb 2005 39
California Department of Toxic Substances Control, “California’s Restriction on the Use of Certain Hazardous Substances in Some Electronic Devices (RoHS)”, effective January 1, 2007 http://www.dtsc.ca.gov/HazardousWaste/EWaste/upload/Restrictions_on_Electronic_Devices_01-05-06.pdf (accessed on November 25, 2006) 40
The University of Tennessee. National Electronics Product Stewardship Initiative. http://eerc.ra.utk.edu/clean/nepsi/ (accessed on September 30, 2006) 41
Maine Public Law 661. “An Act to Protect Public Health and the Environment by Providing for a System of Shared Responsibility for the Safe Collection and Recycling of Electronic Waste,” enacted 2004 http://janus.state.me.us/legis/ros/lom/LOM121st/15Pub651-700/Pub651-700-19.htm (accessed on October 5, 2006)
15
1.2 ELECTRONIC WASTE POLICY IN NORTH CAROLINA
According to the assessments prepared by NC Division of Pollution Prevention and
Environmental Assistance (DPPEA), North Carolina generates approximately 50,000
tons of electronics scrap per year.42 The DPPEA 2003 fact sheet showed that if in
addition to televisions, computers and phones, the definition of e-waste expands to
products such as radios, stereos, and microwaves, than the estimate of e-waste generation
in North Carolina is between 90,775 and 107,997 tons.43 The DPPEA 2003 fact sheet
also highlights that steady widespread purchase of electronic products over time builds a
larger pool of potential discards. To deal with the growing e-waste stream DPPEA
recommended to develop policy exemptions for cathode ray tubes from hazardous waste
regulations, provide grants for establishing electronics collection programs, and develop
state purchasing guidelines to support electronics recycling among others.
Growing concern over electronic waste in North Carolina and increasing recycling
costs prompted interest in new legislation to the General Assembly in 2005 to address
there issues. The two proposed bills aimed to establish a recycling program for electronic
devices. In order to fund the program and to provide local governments with funds to
enable them to recycle electronic devices, the senate bill proposed to impose a tax on
electronic device retailers on a percentage basis of the sales price of each new electronic
device.44 The house bill required manufacturers of electronic devices to either (1) develop
and implement product management plans for the proper reuse or recycling of discarded
42
North Carolina Department of Natural Resource, Division of Pollution Prevention and Environmental Assistance, Recycling Business Assistance Center. “North Carolina markets assessment of the recycling industry and recyclable materials,” 1998. http://www.p2pays.org/ref/02/01622/01622.pdf (accessed on February 5, 2007) 43
North Carolina Department of Natural Resource, Division of Pollution Prevention and Environmental Assistance. “2003 fact sheet: Generation Estimate for Electronic Discards in North Carolina,” July 2003 http://www.p2pays.org/ref/26/25964.pdf (accessed on February 5, 2007) 44
General Assembly of North Carolina. Session 2005. Senate Bill 1030. Electronics Recycling and Job Creation. http://www.ncga.state.nc.us/Sessions/2005/Bills/Senate/HTML/S1030v1.html (accessed on February 5, 2007)
16
electronic devices and to pay an annual program fee or (2) to pay a tax on the sale of
electronic devices sold in the state in order to fund the program, and to provide local
governments with funds to enable them to recycle electronic devices.45 However, no
legislation has yet been passed by the legislature to address the e-waste problem in North
Carolina.
While e-waste legislation is being considered in North Carolina, different counties
have begun to address the e-waste problem at the local level. Different e-waste collection
and recycling programs have been established in Orange46, Lee47, Wake48, and Chatham49
counties, allowing for collection of various electronics for recycling purposes. As a rule,
the counties that have e-waste programs perform collection and sorting of e-waste, but
contract other companies to perform recycling. Many other counties in North Carolina do
not support ongoing e-waste recycling programs, but, rather, organize collection events
several times a year. Collection events are usually less convenient than the option to
discard old electronics by taking trash to the landfill and result in lower collection rates
than permanent e-waste collection programs. Also, permanent e-waste collection
programs have the advantage of economy of scale, lower expenditures on advertising,
and ensure a steady supply of e-waste that reduces costs of recycling. The difference in
the e-waste collection rates and costs constitutes the opportunity to reduce costs of
recycling.
45
General Assembly of North Carolina. Session 2005. House Bill 1765. Electronics Recycling and Job Creation. http://www.ncga.state.nc.us/Sessions/2005/Bills/House/HTML/H1765v1.html (accessed on February 5, 2007) 46
The Orange County Solid Waste Management Department http://www.co.orange.nc.us/recycling/index.asp (accessed on October 5, 2006) 47
Lee County Solid Waste Division, Recyclables http://www.leecountync.gov/departments/general-services/recycling.html (accessed on October 5, 2006) 48
Wake County Government, Electronics Recycling, 2003 http://www.wakegov.com/news/archive/2003/111303elecrecyc.htm (accessed on October 5, 2006) 49
Chatham County Waste Management, Electronics (Computer) Recycling http://www.chathamrecycles.com/about.shtml#electronics (accessed on October 5, 2006)
17
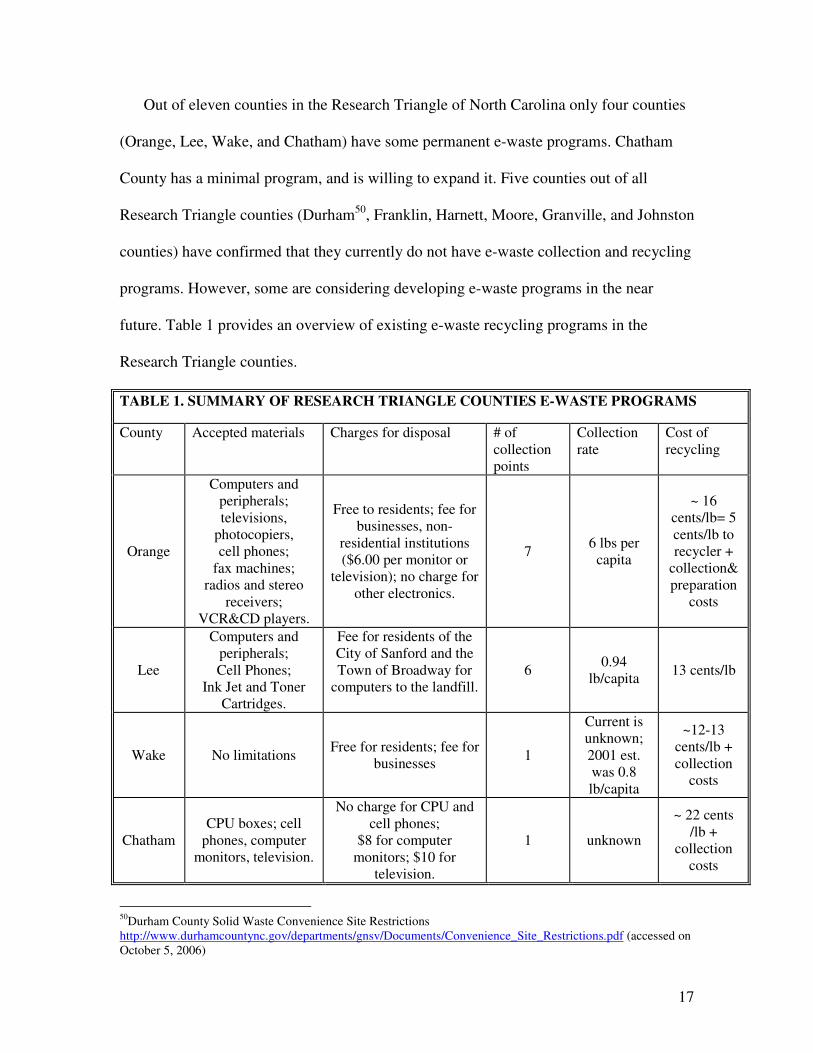
Out of eleven counties in the Research Triangle of North Carolina only four counties
(Orange, Lee, Wake, and Chatham) have some permanent e-waste programs. Chatham
County has a minimal program, and is willing to expand it. Five counties out of all
Research Triangle counties (Durham50, Franklin, Harnett, Moore, Granville, and Johnston
counties) have confirmed that they currently do not have e-waste collection and recycling
programs. However, some are considering developing e-waste programs in the near
future. Table 1 provides an overview of existing e-waste recycling programs in the
Research Triangle counties.
TABLE 1. SUMMARY OF RESEARCH TRIANGLE COUNTIES E-WASTE PROGRAMS
County Accepted materials Charges for disposal # of collection points
Collection rate
Cost of recycling
Orange
Computers and peripherals; televisions,
photocopiers, cell phones;
fax machines; radios and stereo
receivers; VCR&CD players.
Free to residents; fee for businesses, non-
residential institutions ($6.00 per monitor or
television); no charge for other electronics.
7 6 lbs per
capita
~ 16 cents/lb= 5 cents/lb to recycler +
collection& preparation
costs
Lee
Computers and peripherals; Cell Phones;
Ink Jet and Toner Cartridges.
Fee for residents of the City of Sanford and the Town of Broadway for
computers to the landfill.
6 0.94
lb/capita 13 cents/lb
Wake No limitations Free for residents; fee for
businesses 1
Current is unknown; 2001 est. was 0.8 lb/capita
~12-13 cents/lb + collection
costs
Chatham CPU boxes; cell
phones, computer monitors, television.
No charge for CPU and cell phones;
$8 for computer monitors; $10 for
television.
1 unknown
~ 22 cents /lb +
collection costs
50
Durham County Solid Waste Convenience Site Restrictions http://www.durhamcountync.gov/departments/gnsv/Documents/Convenience_Site_Restrictions.pdf (accessed on October 5, 2006)
18
The Orange County e-waste recycling program creates multiple opportunities for its
residents to get rid of unwanted electronics. A list of electronics accepted by the Orange
County recycling facility includes all computers and computer peripherals (monitors,
mice, keyboards, printers, speakers), televisions, photocopiers (toner cartridges also
accepted), cell phones, telephones and telephone systems, fax machines, radios and stereo
receivers, CD players, cassette players, VCRs, and laser disc players. Electronics can be
brought by residents to the Orange County landfill or to any of 6 collection centers
located throughout the county during operation hours. Though businesses are charged for
disposed electronics, e-waste disposal is free for Orange County residents. 51
According to Scott Mouw, Chief of Community and Business Assistance of North
Carolina Division of Pollution Prevention and Environmental Assistance, Orange County
has the best e-waste collection rate of 6 pounds per capita and cheapest recycling costs of
16 cents per pound out of all NC counties. 52 The costs per pound are comprised of 5
cents per pound paid on average to the recycler for handling e-waste, and the remaining
11 cents is the cost of county landfill work to collect, separate, package and transport
electronics. Certainly, confounding factors such as population density and the e-waste
generation rate may affect these parameters; however, they provide an initial estimate of
achievable recycling rates and costs.
Lee County offers recycling of computers (monitors, CPUs, printers, keyboards and
other attachments), cell phones, ink jet and toner cartridges. Collection is organized at the
6 collection points in the county, and the total annual collection is about 23 tons of e-
51
Orange County, North Carolina Solid Waste Management Department http://www.co.orange.nc.us/recycling/a-z-recyclery.asp#electronic (accessed on October 5, 2006) 52
Scott Mouw, section chief, NC Division of Pollution Prevention and Environmental Assistance, (personal communication, September 27, 2007).
19
waste. The per capita e-waste collection is equal to 0.94 pounds per capita, and the
recycling cost is 13 cents per pound.53
Wake County has one collection point, where all types of electronics are accepted
from residents of the county at no charge. According to the DPPEA facts sheet for 2003,
the average collection rate for the county was about 0.8 per capita when the program had
just started, although no data on the current collection rate is available. The county only
performs collection of electronics without sorting them and separating by type and value.
The cost of e-waste recycling were 12 to 13 cents per pound paid to the recycler as well
as an unknown portion of the county costs for storage and transporting of electronics.54
Chatham County e-waste collection is limited to cell phones, CPUs, television and
computer monitors. While there is no charge for CPU boxes and cell phones, a fee is
charged for disposal of television and computer monitors. The costs of the program are
22 cents per pound paid to the recycler and the county costs. There is only one location
for collection of electronics in the county, although expansion of the program is expected.
The amount of e-waste collected in Chatham County in 2005 was very low, which could
be explained by fees for disposal, limitations on accepted types of electronics, fewer
collection points and availability of disposal in neighborhood counties. Greater volumes
of collected electronics allow for cost saving, and lower rates paid to the recycler.
2. OBJECTIVES
In the absence of federal or state regulations on household electronic waste, the
electronic waste problem could be addressed at the county level. One of the options a
53
Joseph Cherry, Solid Waste Superintendent, Lee County, North Carolina (personal communication, April 9, 2007). 54
Craig Witting, Wake County Solid Waste Division (personal communication, February 20, 2007)
20
policy-maker faces is the establishment of a permanent e-waste recycling programs at the
local landfill by offering residents the means to recycle their e-waste. In my master’s
project, I estimate the costs of establishing an e-waste recycling program (similar to
Orange County’s program) in Harnett County, of North Carolina. Currently, Harnett
County does not have an e-waste recycling program.
To evaluate cost-effectiveness of the county e-waste recycling program, the costs of
program establishment at the county level will be compared to the recycling costs of a
major electronics producer. Among the benefits of establishing a permanent e-waste
recycling program in Harnett County, I would expect a higher rate of electronics retrieval
from the waste stream than through a program based on occasional collection events. A
permanent e-waste program should also reduce the costs of collection. I evaluate the
cost-effectiveness of the local e-waste program for different scenarios depending on
different levels of supply of discarded electronics, variability in prices for e-waste
recycling, and landfill disposal costs.
The purpose of this study is to evaluate the costs of e-waste recycling program in the
targeted county. The information on costs of the program would allow a policy maker to
be aware of the level of funding that the county would need to run the program or the
amount of taxes or purchase fees that would be needed to fund the program. However, I
do not plan to address the problem of choosing the best fundraising system for the e-
waste recycling program. I also do not address the estimation of potential benefits from
recycling e-waste. The inherent difficulties in estimation of future damages to public
health from groundwater contamination would lead to serious uncertainty over potential
benefits of e-waste recycling. Moreover, health risks from leaching landfills are expected
21
to occur decades from now. Even if estimated correctly, potential benefits from e-waste
removal from landfills after discounting to present value may not give us a proper
measure of e-waste recycling benefits. Also, in this report I will not address directly the
problem of e-waste exporting to developing countries and the overseas consequences of
improper recycling.
3. METHODS
3.1. INTRODUCTION
To perform an evaluation of the costs of the e-waste program in Harnett County I
estimate (1) the e-waste volumes generation from the county, and (2) the costs of running
the e-waste program. To estimate future volumes of residential e-waste, I use the average
US per capita amounts of e-waste to extrapolate to the population of the county. Per
capita estimates also grow over time as income grows, and, thus, consumers buy more
electronics, newer products appear on the market, and the lifespan of electronics
decreases. I assume that the per capita generation rate is mainly related to income. Costs
of collection and recycling will be based on the data from active e-waste programs in
North Carolina and will be comprised of the initial investment in equipment, costs of
labor to collect, sort and package electronics, annual supplies for the program,
transportation costs, equipment maintenance costs, and fees that the county will pay to
the recycling companies for collected electronics. I also will account for the uncertainty
over the e-waste volumes estimates and proportion of e-waste that is actually collected, as
well as the uncertainty over the amount of the payments the recycling companies will
charge for their services.
22
3.2. ESTIMATION OF E-WASTE VOLUMES
Estimation methods of e-waste generation differ from study to study. Some studies
use sales data from previous years to estimate future e-waste volumes. In one of the first
studies on e-waste generation estimation, Matthews et al used assumptions on electronics
sales growth, lifespan and disposal rates to predict the number of discarded personal
computers. Later they reevaluated their model to include updated parameters and
increased reuse, recycling and storage options.55 Such studies assume certain lifespan
periods for the electronic equipment and the weight of equipment, and consider
alternatives to disposal such as reuse or storage that extend lifespan before disposal, to
predict the amount of e-waste in each year.56,57
Other studies introduce survey data on proportions of the population having
televisions and computers into their estimates of the total number of electronics.58 Based
on the assumption of the current lifespan periods for computers and televisions, they
estimate the number of electronic devices discarded each year. The total number of
discarded televisions and computers is then converted to total weight and per capita
estimates. Estimates of e-waste discards could also be estimated by sampling landfills for
waste composition.59 The results of studies on e-waste volumes could be biased because
55
Matthews H, McMichael F, Hendrickson C, Hart D., 1997. “Disposition and end-of-life options for personal computers.” Design Initiative Technical Report #97-10. Carnegie Mellon University http://www.ce.cmu.edu/GreenDesign/comprec/NEWREPORT.PDF (accessed on February 15, 2007) 56
Peralta Genandrialine L., Fontanos Psyche M. 2006. “E-waste issues and measures in the Philippines.” Journal
of Material Cycles and Waste Management, Volume 8, Number 1 / March, 2006. http://www.springerlink.com/content/q7488720534033qj/fulltext.pdf (accessed on February 15, 2007) 57 Liu, XB, Tanaka, M, Matsui, Y. 2006. “Generation amount prediction and material flow analysis of electronic waste: a case study in Beijing, China.” Waste Management & Research, 24 (5): 434-445 Oct 2006. 58
Cascadia Consulting Group, Inc. and Sound Resolutions. “E-Waste Generation in Northwest Washington,” 2003 http://www.productstewardship.net/PDFs/productsElectronicsSeattleEwasteRpt.pdf (accessed on February 15, 2007) 59
North Carolina Department of Natural Resource, Division of Pollution Prevention and Environmental Assistance, “2003 fact sheet: Generation Estimate for Electronic Discards in North Carolina,” July 2003 http://www.p2pays.org/ref/26/25964.pdf (accessed on February 5, 2007)
23
assumed life spans of the equipment, percentages of electronics reused, stockpiled or sent
to landfills could change over time, but they provide important information necessary for
decision making. Sometimes a simpler approach is used to assess per capita generation by
deriving e-waste generation estimates from previous studies and applying them to similar
case.60
In 2000 the Municipal Solid Waste (MSW) characterization report from EPA
introduced for the first time volumes of consumer electronics as a separate part of MSW.
The estimation methodology of the study relied on electronics shipments data available
from the Consumer Electronics Association and US Department of Commerce trade data
for the period from 1984 to the 1999. The shipments data were combined with average
weight, lifespan of devices and secondary use option. The study of MSW notes that
products included into the estimates were limited to the products for which sales and
trade data were available. EPA estimated the share of consumer electronics as 0.8 percent
of MSW by weight in 1999, and 0.9 percent in 2000.61 Thus, e-waste generation per
average US citizen totaled 7.65 kg in 2000. 62 This estimate included commercial
electronic waste as well. In the consequent studies by EPA, the per capita generation rate
increased to 8.87 kg per capita in 200563.
A summary of the 2005 EPA Municipal Solid Waste Report is provided in Table 2
below. The report shows an increasing share of electronics in MSW which grows from
60
North Carolina Department of Natural Resource, Division of Pollution Prevention and Environmental Assistance. “2003 fact sheet: Generation Estimate for Electronic Discards in North Carolina,” July 2003 http://www.p2pays.org/ref/26/25964.pdf (accessed on February 5, 2007) 61
United States Environmental Protection Agency. “Characterization of Municipal Solid Waste in the United States: 2000 Update.” http://www.epa.gov/epaoswer/non-hw/muncpl/pubs/report-00.pdf (accessed on February 5, 2007) 62
The estimate is based on data from EPA MSW report 2000 and population estimate from US Census Bureau http://www.census.gov/population/projections/nation/summary/np-t1.pdf 63
The estimate is based on the total e-waste generation from EPA MSW report 2005 http://www.epa.gov/garbage/pubs/mswchar05.pdf and population estimates from US Census Bureau http://www.census.gov/popest/states/tables/NST-EST2006-01.xls
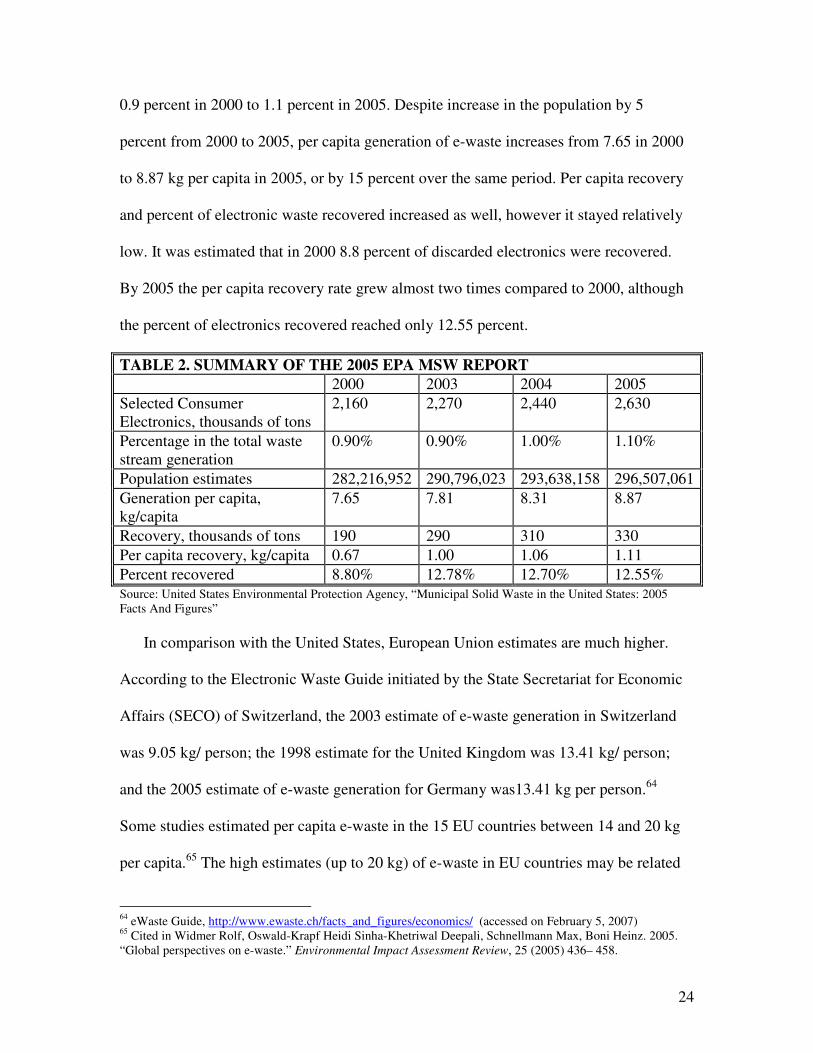
24
0.9 percent in 2000 to 1.1 percent in 2005. Despite increase in the population by 5
percent from 2000 to 2005, per capita generation of e-waste increases from 7.65 in 2000
to 8.87 kg per capita in 2005, or by 15 percent over the same period. Per capita recovery
and percent of electronic waste recovered increased as well, however it stayed relatively
low. It was estimated that in 2000 8.8 percent of discarded electronics were recovered.
By 2005 the per capita recovery rate grew almost two times compared to 2000, although
the percent of electronics recovered reached only 12.55 percent.
TABLE 2. SUMMARY OF THE 2005 EPA MSW REPORT
2000 2003 2004 2005
Selected Consumer Electronics, thousands of tons
2,160 2,270 2,440 2,630
Percentage in the total waste stream generation
0.90% 0.90% 1.00% 1.10%
Population estimates 282,216,952 290,796,023 293,638,158 296,507,061
Generation per capita, kg/capita
7.65 7.81 8.31 8.87
Recovery, thousands of tons 190 290 310 330
Per capita recovery, kg/capita 0.67 1.00 1.06 1.11
Percent recovered 8.80% 12.78% 12.70% 12.55% Source: United States Environmental Protection Agency, “Municipal Solid Waste in the United States: 2005 Facts And Figures”
In comparison with the United States, European Union estimates are much higher.
According to the Electronic Waste Guide initiated by the State Secretariat for Economic
Affairs (SECO) of Switzerland, the 2003 estimate of e-waste generation in Switzerland
was 9.05 kg/ person; the 1998 estimate for the United Kingdom was 13.41 kg/ person;
and the 2005 estimate of e-waste generation for Germany was13.41 kg per person.64
Some studies estimated per capita e-waste in the 15 EU countries between 14 and 20 kg
per capita.65 The high estimates (up to 20 kg) of e-waste in EU countries may be related
64
eWaste Guide, http://www.ewaste.ch/facts_and_figures/economics/ (accessed on February 5, 2007) 65
Cited in Widmer Rolf, Oswald-Krapf Heidi Sinha-Khetriwal Deepali, Schnellmann Max, Boni Heinz. 2005. “Global perspectives on e-waste.” Environmental Impact Assessment Review, 25 (2005) 436– 458.

25
to a different definition of e-waste that includes refrigerators and electrical equipment.66
The WEEE definition of electronic waste used in the countries of the European Union
includes large and small household appliances, such as refrigerators, vacuum cleaners,
toasters, ovens, microwaves, and air conditioners; as well as electric tools, such as
drilling machines and electric lawnmowers.67 In the United States most large household
appliances fall into the category of white goods, and are accounted separately. So, this
results in lower estimates of e-waste generation. Table 3 provides a summary of results of
different studies’ e-waste generation.
TABLE 3. SUMMARY OF PER CAPITA E-WASTE GENERATION ESTIMATES
Study
Year E-waste generation Per capita
estimate
Matthews et al 1997 Restricted to PCs
EPA MSW report 2000 Limited to available sales data
7.65 kg/capita
EPA MSW report 2003 Limited to available sales data
7.81 kg/capita
EPA MSW report 2004 Limited to available sales data
8.31 kg/capita
EPA MSW report 2005 Limited to available sales data
8.87 kg/capita
EMPA St.Gallen Switzerland 2003 Includes large household appliances
9.05 kg/person
UK Status Report 1998 Includes large household appliances, electrical tools
13.41 kg/person
German Electrical and Electronic Manufacturers'
Association
2005 Includes large household appliances, electrical tools
13.41 kg/person
http://www.sciencedirect.com/science?_ob=MImg&_imagekey=B6V9G-4GC1R45-1-T&_cdi=5898&_user=38557&_orig=browse&_coverDate=07%2F31%2F2005&_sk=999749994&view=c&wchp=dGLbVlz-zSkWA&md5=3dcd83235fdaae86a25d90bd2c8f4e5d&ie=/sdarticle.pdf (accessed on February 5, 2007) 66 Hilty, Lorenz M. "Electronic Waste--an Emerging Risk?" Environmental Impact Assessment Review, 25.5 (2005): 431-35. http://www.sciencedirect.com/science/article/B6V9G-4G9R1BN-3/2/cefced5cb07fdc7a623752402e27365e (accessed on March 2, 2007) 67
Environment Directorate-General of the European Commission, Waste Electrical and Electronic Equipment Directive http://ec.europa.eu/environment/waste/weee_index.htm (accessed on February 2, 2007)
26
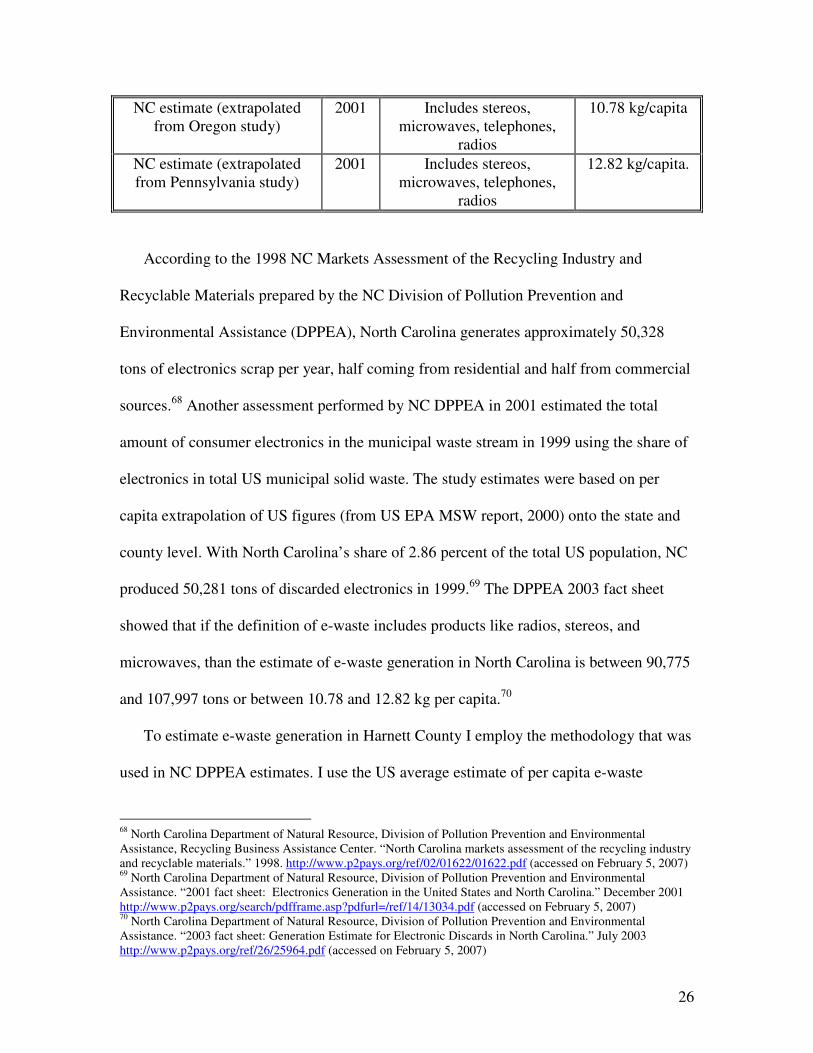
NC estimate (extrapolated from Oregon study)
2001 Includes stereos, microwaves, telephones,
radios
10.78 kg/capita
NC estimate (extrapolated from Pennsylvania study)
2001 Includes stereos, microwaves, telephones,
radios
12.82 kg/capita.
According to the 1998 NC Markets Assessment of the Recycling Industry and
Recyclable Materials prepared by the NC Division of Pollution Prevention and
Environmental Assistance (DPPEA), North Carolina generates approximately 50,328
tons of electronics scrap per year, half coming from residential and half from commercial
sources.68 Another assessment performed by NC DPPEA in 2001 estimated the total
amount of consumer electronics in the municipal waste stream in 1999 using the share of
electronics in total US municipal solid waste. The study estimates were based on per
capita extrapolation of US figures (from US EPA MSW report, 2000) onto the state and
county level. With North Carolina’s share of 2.86 percent of the total US population, NC
produced 50,281 tons of discarded electronics in 1999.69 The DPPEA 2003 fact sheet
showed that if the definition of e-waste includes products like radios, stereos, and
microwaves, than the estimate of e-waste generation in North Carolina is between 90,775
and 107,997 tons or between 10.78 and 12.82 kg per capita.70
To estimate e-waste generation in Harnett County I employ the methodology that was
used in NC DPPEA estimates. I use the US average estimate of per capita e-waste
68
North Carolina Department of Natural Resource, Division of Pollution Prevention and Environmental Assistance, Recycling Business Assistance Center. “North Carolina markets assessment of the recycling industry and recyclable materials.” 1998. http://www.p2pays.org/ref/02/01622/01622.pdf (accessed on February 5, 2007) 69
North Carolina Department of Natural Resource, Division of Pollution Prevention and Environmental Assistance. “2001 fact sheet: Electronics Generation in the United States and North Carolina.” December 2001 http://www.p2pays.org/search/pdfframe.asp?pdfurl=/ref/14/13034.pdf (accessed on February 5, 2007) 70
North Carolina Department of Natural Resource, Division of Pollution Prevention and Environmental Assistance. “2003 fact sheet: Generation Estimate for Electronic Discards in North Carolina.” July 2003 http://www.p2pays.org/ref/26/25964.pdf (accessed on February 5, 2007)
27
generation for the base year, with further extrapolation to the county population. I also
assume that even though such variables as population density, education level or other
unobservable factors may affect per capita e-waste generation across the United States,
their influence will be balanced across the counties. Thus, I use the average per capita e-
waste generation estimate for Harnett County in the base year. This estimation strategy
provides a conservative per capita generation estimate for my analysis.
From the summary of per capita e-waste generation estimates for European Union
countries and the United States, we see that the estimates range from 7.65 kg per capita in
the United States in 2000 to 13.41 kg per person in Germany in 2005 (see Table 3). As
mentioned before, the EU estimates include electrical tools and large household
appliances that are not considered e-waste in the US. Therefore, it is reasonable to leave
those numbers out of my estimates of e-waste volumes. It is worth mentioning that EPA
estimates are more conservative and limited to available sales data, while the estimates
derived from Oregon and Pennsylvania landfill sampling studies (cited by NC DPPEA,
2007) provide higher numbers and have broader scope. The use of the lower, more
conservative estimate for a rural county like Harnett seems to be a better choice.
As Table 3 shows, the annual estimates of per capita generation from the EPA MSW
report grew from 7.65 in 2000 to 8.87 kg per capita in 2005. This indicates that certain
factors affect the generation of e-waste over time. I assume that technological innovation
is expected to decrease the lifespan of electronics thus increasing per capita generation
estimates over the years of the project. However, the consumers’ ability to buy newer
products is determined by income. I further assume that the electronics market is well
saturated and discards of electronics are very much related to the purchase of newer
28
products. This means that older electronic devices are discarded when new ones are
bought. Of course, it could be the case that older devices can be donated or given away,
but eventually old electronics will be discarded. The underlying assumption that the
electronics market is well saturated implies that those who receive donated electronics
already possess older electronics, and will dispose of them. Thus, the volume of
discarded electronics is proportional to the volume of purchased electronics. Therefore,
the assumption of a direct relationship of electronics discards to income can hold. To
predict e-waste generation in the following years, I consider income effect on the
purchasing power of the population. Since electronics are normal goods, I will use
income elasticity equal to 1.0 in my estimating strategy.
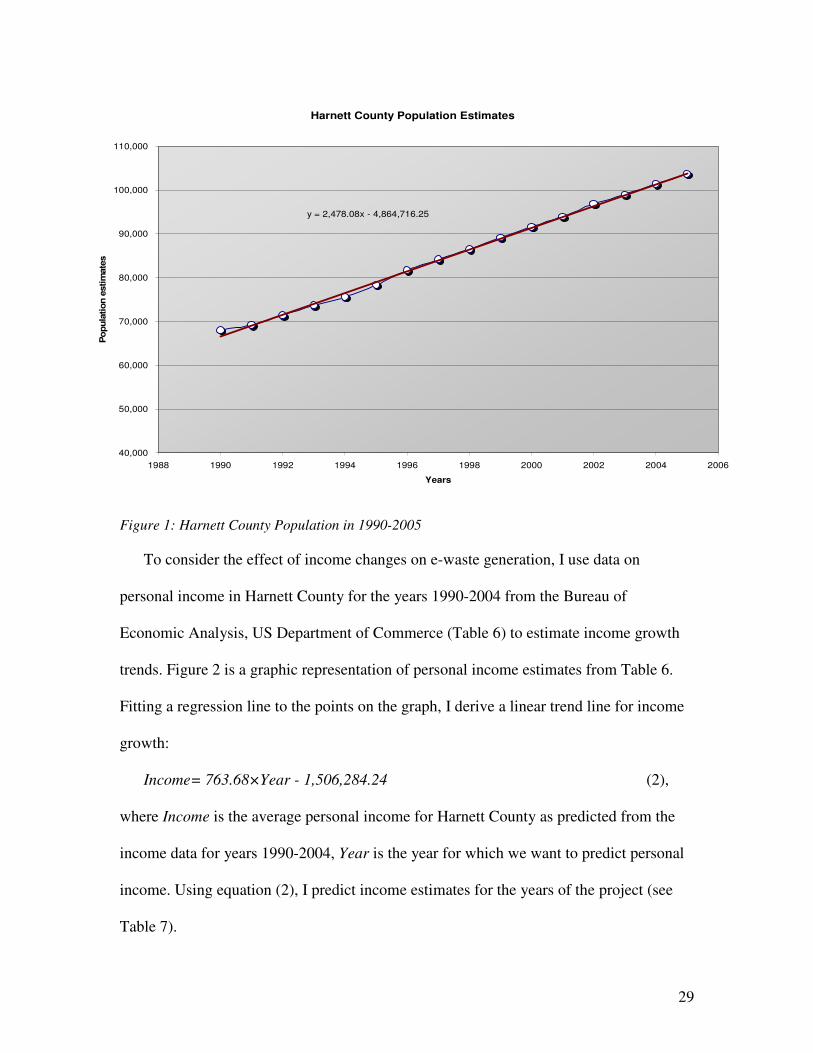
The proposed project will run for 10 years from 2007 to 2017. Thus, I estimate
population growth in Harnett County for this period. I use the county’s population
estimates in the years 1990-2005 from the US Census Bureau (Table 4) to derive a
population growth rate (Figure 1). Then I use population growth rate for 2000-2005 to
predict the future population of Harnett County for the years 2006-2017 (see Table 5).
Figure 1 is a graphic representation of population estimates from Table 4. Fitting a
regression line to the points on the graph, I derive a linear trend line for population
growth:
Population = 2,478.08×Year - 4,864,716.25 (1),
where Population is the population of Harnett County as predicted from the population
data for years 1990-2005, Year is the year for which we want to predict population. Using
equation (1) I predict population estimates for the years of the project (see Table 5).
29
Harnett County Population Estimates
y = 2,478.08x - 4,864,716.25
40,000
50,000
60,000
70,000
80,000
90,000
100,000
110,000
1988 1990 1992 1994 1996 1998 2000 2002 2004 2006
Years
Po
pula
tion e
stim
ate
s
Figure 1: Harnett County Population in 1990-2005
To consider the effect of income changes on e-waste generation, I use data on
personal income in Harnett County for the years 1990-2004 from the Bureau of
Economic Analysis, US Department of Commerce (Table 6) to estimate income growth
trends. Figure 2 is a graphic representation of personal income estimates from Table 6.
Fitting a regression line to the points on the graph, I derive a linear trend line for income
growth:
Income= 763.68×Year - 1,506,284.24 (2),
where Income is the average personal income for Harnett County as predicted from the
income data for years 1990-2004, Year is the year for which we want to predict personal
income. Using equation (2), I predict income estimates for the years of the project (see
Table 7).
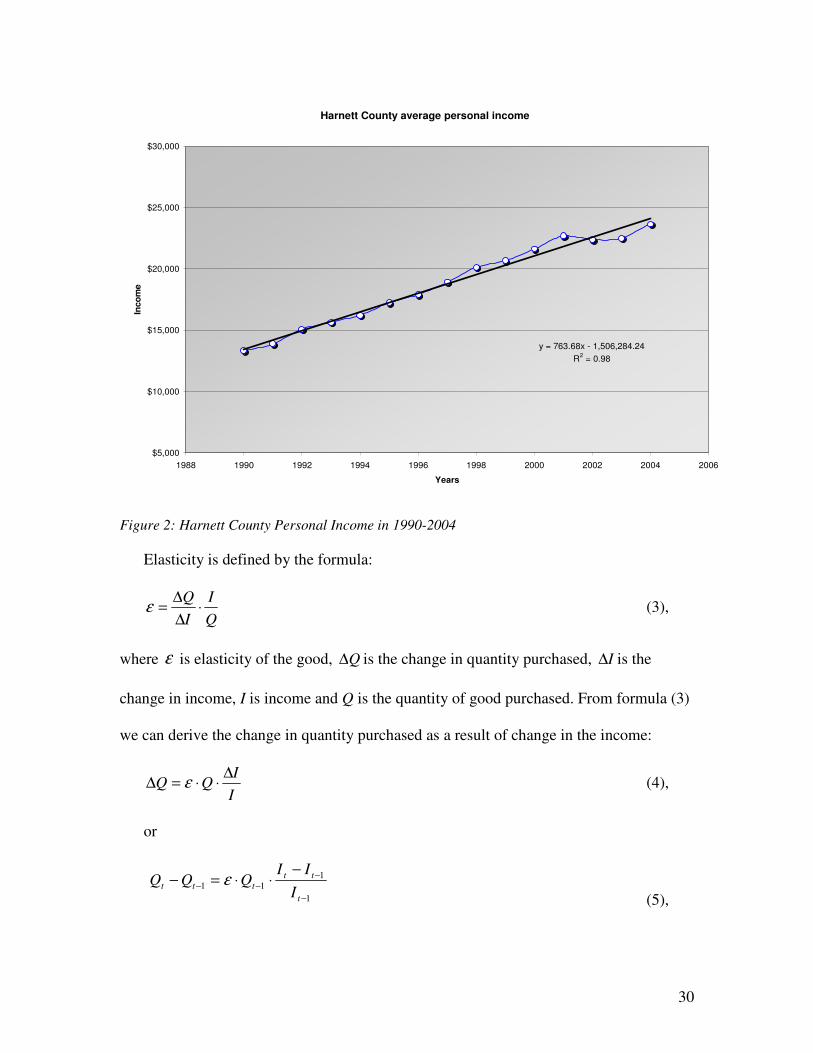
30
Harnett County average personal income
y = 763.68x - 1,506,284.24
R2 = 0.98
$5,000
$10,000
$15,000
$20,000
$25,000
$30,000
1988 1990 1992 1994 1996 1998 2000 2002 2004 2006
Years
Inco
me
Figure 2: Harnett County Personal Income in 1990-2004
Elasticity is defined by the formula:
Q
I
I
Q⋅
∆
∆=ε (3),
where ε is elasticity of the good, Q∆ is the change in quantity purchased, I∆ is the
change in income, I is income and Q is the quantity of good purchased. From formula (3)
we can derive the change in quantity purchased as a result of change in the income:
I
IQQ
∆⋅⋅=∆ ε (4),
or
1
111
−
−
−−
−⋅⋅=−
t
tt
tttI
IIQQQ ε
(5),
31
where 1−−=∆ tt III is the change in income between year t and the year before, and
1−−=∆ tt QQQ is the change in quantity of a good purchased between year t and the year
before. Since I assume the electronics market is saturated, and discards of electronics are
related to new purchases, I could use this formula to predict changes in e-waste
generation in relationship to changes in income.
Since I have an e-waste generation rate for the base year of 2005, applying formula
(5) I can calculate changes in e-waste generation rates in their relationship to changes in
income. Table 8 provides predicted per capita e-waste generation for Harnett County for
the years 2006 to 2018 based on the per capita e-waste generation from the EPA MSW
report for 2005 and predicted personal income for Harnett County (Table 7). According
to the methodology I use, the per capita e-waste generation in Harnett County will grow
from 8.87 kg per capita in 2005 to 12.41 kg per capita in 2018. It is worth noting that the
methodology provides very conservative estimates for per capita generation. Predicted e-
waste generation in Harnett County in 2018, despite obvious growth in income, stays
bellow e-waste generation estimates from studies in the UK in 1998 and Germany in
2005, where the estimate of e-waste generation was about 13.41 kg per person, and lower
than e-waste generation estimate from Pennsylvania landfill sampling study, which was
equal to 12.82 kg per capita.
32
TABLE 4: HARNETT COUNTY POPULATION FIGURES FOR 1990-2005 71
Years 1990 1991 1992 1993 1994 1995 1996 1997 1998 1999 2000 2001 2002 2003 2004 2005
Population 68,030 69,189 71,373 73,671 75,590 78,353 81,651 84,169 86,513 89,127 91,591 93,935 96,858 98,987 101,370 103,692
TABLE 5. HARNETT COUNTY POPULATION PROJECTIONS FOR YEARS OF THE PROJECT
Year 2006 2007 2008 2009 2010 2011 2012 2013 2014 2015 2016 2017 2018
Population 106,312 108,790 111,268 113,746 116,225 118,703 121,181 123,659 126,137 128,615 131,093 133,571 136,049
TABLE 6. HARNETT COUNTY PERSONAL INCOME FOR 1990-200472
Years 1990 1991 1992 1993 1994 1995 1996 1997 1998 1999 2000 2001 2002 2003 2004
Personal Income, $
13,341 13,883 15,081 15,646 16,220 17,222 17,891 18,925 20,137 20,664 21,615 22,676 22,377 22,498 23,659
TABLE 7. HARNETT COUNTY PERSONAL INCOME PROJECTIONS FOR 2005-2018
Years 2005 2006 2007 2008 2009 2010 2011 2012 2013 2014 2015 2016 2017 2018
Personal Income, $
24,894 25,658 26,422 27,185 27,949 28,713 29,476 30,240 31,004 31,767 32,531 33,295 34,058 34,822
TABLE 8. HARNETT COUNTY PER CAPITA E-WASTE ESTIAMTES FOR 2005-2018
Years 2005 2006 2007 2008 2009 2010 2011 2012 2013 2014 2015 2016 2017 2018
Per capita e-waste, kg/capita 8.87 9.14 9.41 9.69 9.96 10.23 10.50 10.77 11.05 11.32 11.59 11.86 12.14 12.41
TABLE 9. HARNETT COUNTY E-WASTE PROJECTIONS FOR YEARS OF THE PROJECT BASED ON 8.87 KG/CAPITA ESTIMATE AND INCOME EFFECT
Years 2007 2008 2009 2010 2011 2012 2013 2014 2015 2016 2017 2018
E-waste estimate, tons 1,024 1,078 1,133 1,189 1,247 1,306 1,366 1,428 1,491 1,555 1,621 1,688
71
United States Census Bureau, Population Division http://www.census.gov/popest/datasets.html (accessed on February 18, 2007) 72
United States Department of Commerce, Regional Economic Information System, Bureau of Economic Analysis, 2006 http://www.bea.gov/regional/reis/CA1-3fn.cfm (accessed on March 3, 2007)
33
Combining per capita e-waste generation rates from Table 8 and population
projections from Table 5, I derive estimates of household e-waste from Harnett County
that will enter MSW in the years from 2007 to 2018 in the absence of the e-waste
program (see Table 9). Based on the assumed e-waste generation estimates, I predict
amounts of electronics available for disposal every year. My estimates show that each
year Harnett County will have more than 1,000 tons of electronics ready for recycling or
disposal. However, only part of this stream will be collected. E-waste generation seldom
equates with the e-waste collected, which is usually much lower even with good efforts to
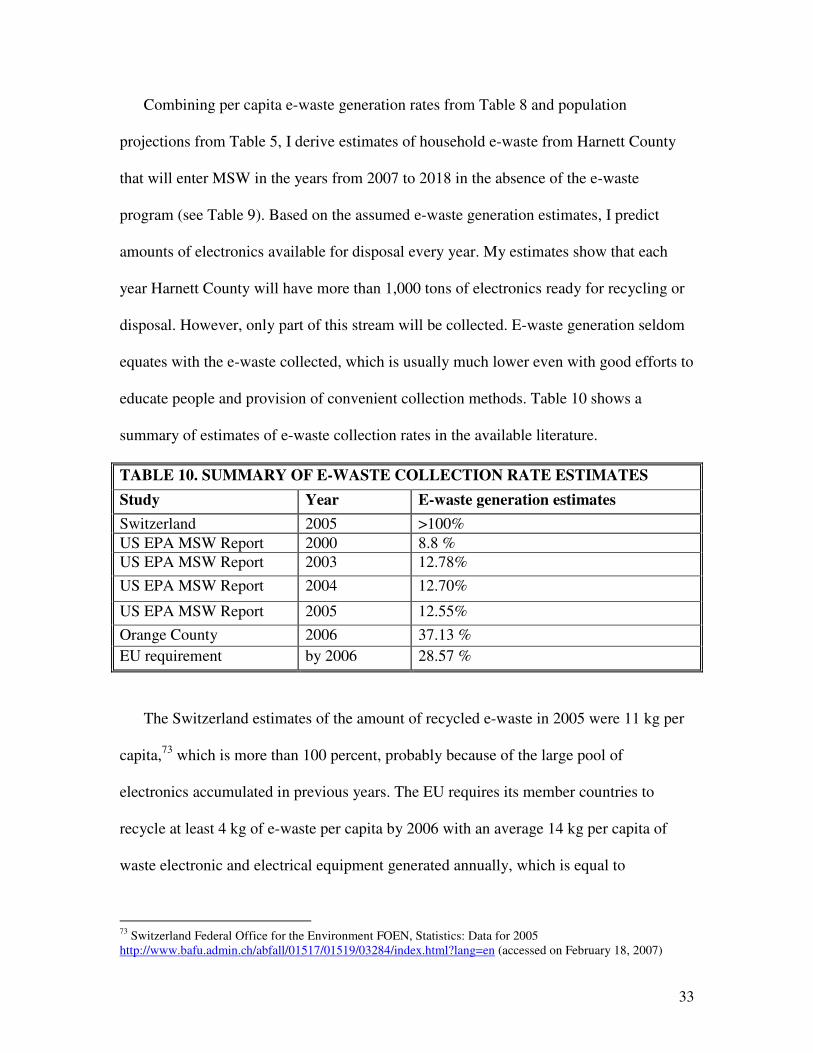
educate people and provision of convenient collection methods. Table 10 shows a
summary of estimates of e-waste collection rates in the available literature.
TABLE 10. SUMMARY OF E-WASTE COLLECTION RATE ESTIMATES
Study Year E-waste generation estimates
Switzerland 2005 >100%
US EPA MSW Report 2000 8.8 %
US EPA MSW Report 2003 12.78%
US EPA MSW Report 2004 12.70%
US EPA MSW Report 2005 12.55%
Orange County 2006 37.13 %
EU requirement by 2006 28.57 %
The Switzerland estimates of the amount of recycled e-waste in 2005 were 11 kg per
capita,73 which is more than 100 percent, probably because of the large pool of
electronics accumulated in previous years. The EU requires its member countries to
recycle at least 4 kg of e-waste per capita by 2006 with an average 14 kg per capita of
waste electronic and electrical equipment generated annually, which is equal to
73
Switzerland Federal Office for the Environment FOEN, Statistics: Data for 2005 http://www.bafu.admin.ch/abfall/01517/01519/03284/index.html?lang=en (accessed on February 18, 2007)
34
approximately 28.57% percent.74 In the US in 2005 only 333,000 tons of consumer
electronics were recovered out of 2,630,000 tons of total e-waste generation, what
comprises 12.55 percent.75 The collection rate of e-waste in Orange County constitutes 6
lb per capita (which is equal to 0.453×6= 2.718 kg per capita or 37.13 percent of
residential e-waste), but the percentage is not reliable because it could also include
commercial e-waste and e-waste from neighboring counties. When Wake County started
electronics collection in 2003, the electronics recovery rate in the county was reported to
be 0.8 pounds per capita per year (0.3624 kg per capita, or 4.95 percent).76 Although this
number does not represent the collection rate in Wake County today, it could be the
estimate of the lowest collection rate at the start of the program.
The overview of the available data on e-waste recovery rates demonstrates that
current electronics recovery rates in the US are very low. Throughout the United States
only 12 percent out of the total amount of all electronics discards were recovered in 2005,
with some local programs capable of achieving almost 40 percent recovery. The
overview of possible collection rates also shows that well established programs can
achieve very high collection rates, as in the example of Switzerland.77
74
EUROPA Press Release, Commission welcomes agreement on Waste Electrical and Electronic Equipment and the Restriction of Hazardous Substances, 2002 http://europa.eu/rapid/pressReleasesAction.do?reference=IP/02/1463&format=HTML&aged=0&language=EN&guiLanguage=en (accessed on February 18, 2007) 75
United States Environmental Protection Agency. 2001. “Characterization of Municipal Solid Waste in the United States: 2000 Update.” http://www.epa.gov/epaoswer/non-hw/muncpl/pubs/report-00.pdf (accessed on February 5, 2007) 76
North Carolina Department of Natural Resource, Division of Pollution Prevention and Environmental Assistance. “2003 fact sheet: Generation Estimate for Electronic Discards in North Carolina.” July 2003 http://www.p2pays.org/ref/26/25964.pdf (accessed on February 5, 2007) 77 Hischier, R., P. Wager, and J. Gauglhofer. "Does WEEE Recycling Make Sense from an Environmental Perspective?: The Environmental Impacts of the Swiss Take-Back and Recycling Systems for Waste Electrical and Electronic Equipment (WEEE)." Environmental Impact Assessment Review, 25.5 (2005): 525-39.
35
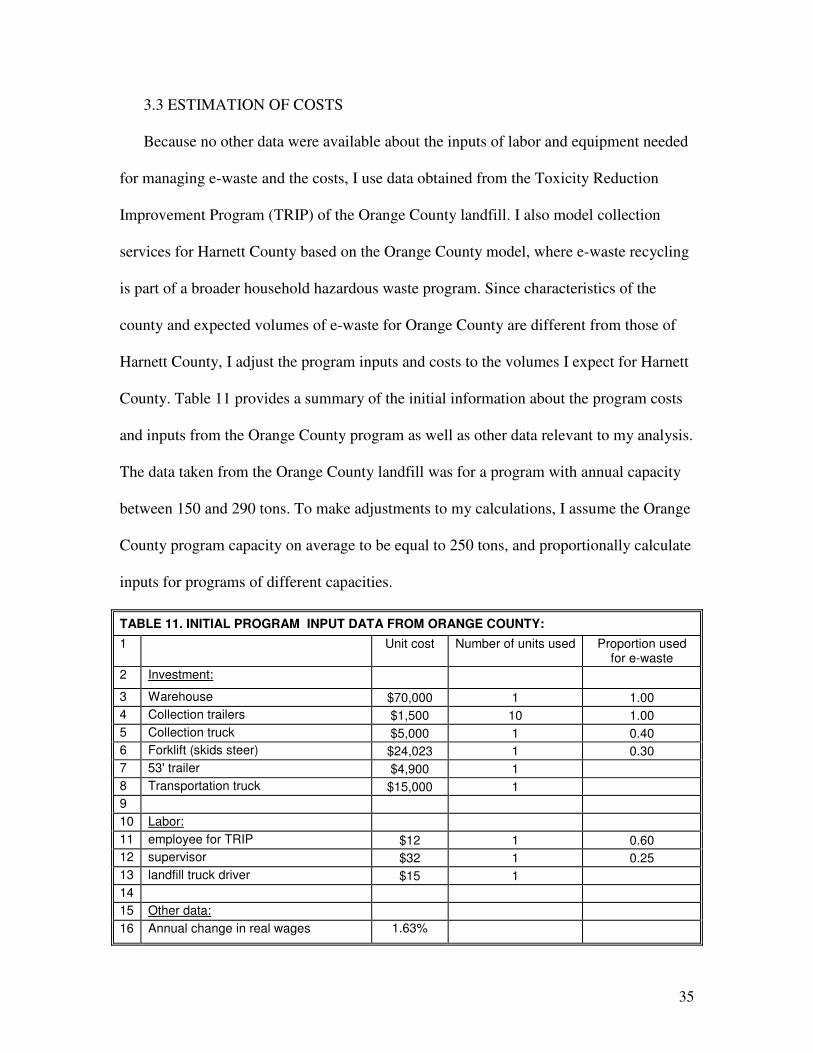
3.3 ESTIMATION OF COSTS
Because no other data were available about the inputs of labor and equipment needed
for managing e-waste and the costs, I use data obtained from the Toxicity Reduction
Improvement Program (TRIP) of the Orange County landfill. I also model collection
services for Harnett County based on the Orange County model, where e-waste recycling
is part of a broader household hazardous waste program. Since characteristics of the
county and expected volumes of e-waste for Orange County are different from those of
Harnett County, I adjust the program inputs and costs to the volumes I expect for Harnett
County. Table 11 provides a summary of the initial information about the program costs
and inputs from the Orange County program as well as other data relevant to my analysis.
The data taken from the Orange County landfill was for a program with annual capacity
between 150 and 290 tons. To make adjustments to my calculations, I assume the Orange
County program capacity on average to be equal to 250 tons, and proportionally calculate
inputs for programs of different capacities.
TABLE 11. INITIAL PROGRAM INPUT DATA FROM ORANGE COUNTY:
1
Unit cost Number of units used Proportion used for e-waste
2 Investment:
3 Warehouse $70,000 1 1.00
4 Collection trailers $1,500 10 1.00
5 Collection truck $5,000 1 0.40
6 Forklift (skids steer) $24,023 1 0.30
7 53' trailer $4,900 1
8 Transportation truck $15,000 1
9
10 Labor:
11 employee for TRIP $12 1 0.60
12 supervisor $32 1 0.25
13 landfill truck driver $15 1
14
15 Other data:
16 Annual change in real wages 1.63%
36
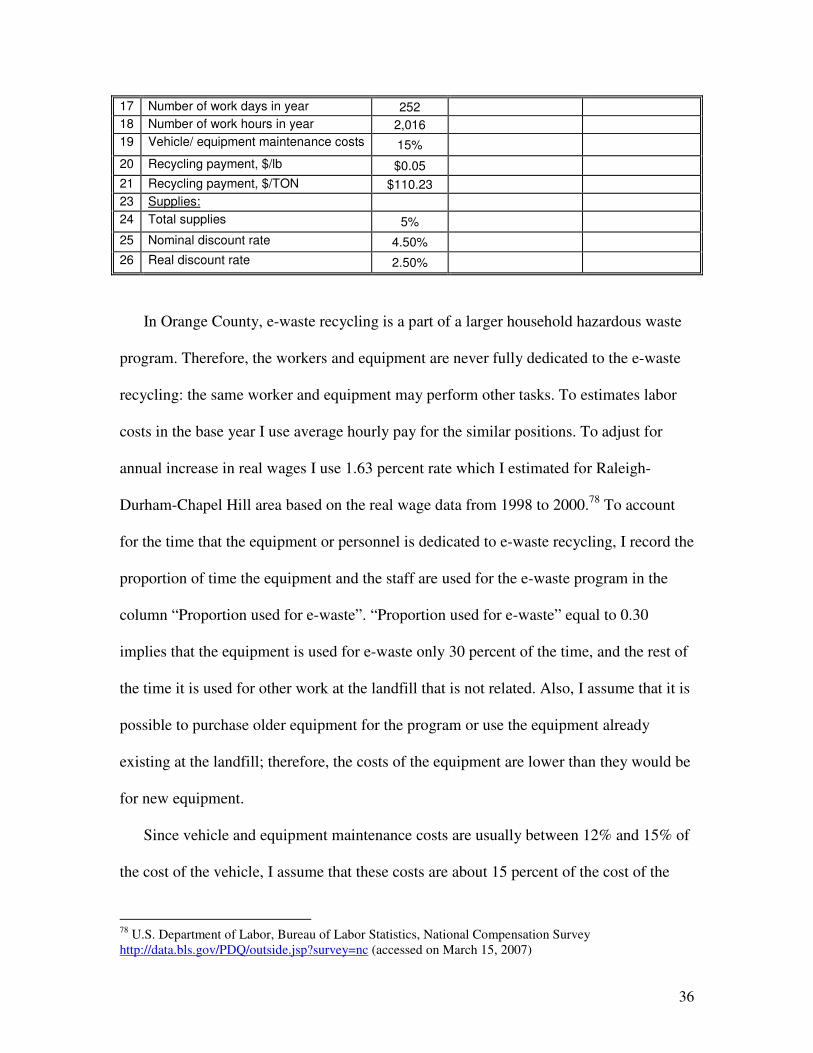
17 Number of work days in year 252
18 Number of work hours in year 2,016
19 Vehicle/ equipment maintenance costs 15%
20 Recycling payment, $/lb $0.05
21 Recycling payment, $/TON $110.23
23 Supplies:
24 Total supplies 5%
25 Nominal discount rate 4.50%
26 Real discount rate 2.50%
In Orange County, e-waste recycling is a part of a larger household hazardous waste
program. Therefore, the workers and equipment are never fully dedicated to the e-waste
recycling: the same worker and equipment may perform other tasks. To estimates labor
costs in the base year I use average hourly pay for the similar positions. To adjust for
annual increase in real wages I use 1.63 percent rate which I estimated for Raleigh-
Durham-Chapel Hill area based on the real wage data from 1998 to 2000.78 To account
for the time that the equipment or personnel is dedicated to e-waste recycling, I record the
proportion of time the equipment and the staff are used for the e-waste program in the
column “Proportion used for e-waste”. “Proportion used for e-waste” equal to 0.30
implies that the equipment is used for e-waste only 30 percent of the time, and the rest of
the time it is used for other work at the landfill that is not related. Also, I assume that it is
possible to purchase older equipment for the program or use the equipment already
existing at the landfill; therefore, the costs of the equipment are lower than they would be
for new equipment.
Since vehicle and equipment maintenance costs are usually between 12% and 15% of
the cost of the vehicle, I assume that these costs are about 15 percent of the cost of the
78 U.S. Department of Labor, Bureau of Labor Statistics, National Compensation Survey http://data.bls.gov/PDQ/outside.jsp?survey=nc (accessed on March 15, 2007)
37
equipment. Various supplies will be needed for the program such as pallets, wrapping
tape, signs, and personal protective equipment. For simplicity, those will be aggregated
under the definition of annual supplies and will be proportional to the amount of e-waste
handled. Usually they range between 5% and 10% of other costs. I use an assumption
that they total to 5 percent of other costs, which are the labor costs and payments to the
recycler. Payments to the recycler currently range between $0.05 and $0.22 per pound;
initially I will assume that the payment to the recycler will be $0.05 per pound, or
$110.23 per ton. For a discount rate I use the interest rate on municipal bonds for Harnett
County from Mergent's Municipal & Government Manual, which ranges from 4 to 5
percent for 10 year bonds.79 After taking into account two percent for expected inflation,
I have a 2.50 percent real discount rate.
For the purposes of this project, the program will run for ten years starting in 2007.
The costs will be measured as a sum of the initial investment in equipment and
warehouse, as well as the costs of labor, equipment maintenance and operation, supplies
and the costs of recycling services provided by the outside contractor. The warehouse
will be needed as a storage place for electronics until a sufficient amount is accumulated
to load a full trailer. The warehouse will also facilitate sorting of electronics and
preparation for shipping (cutting wires or other preparation desired by the vendor).
The program will require a number of small 6×10 feet trailers that will be placed at
each collection point. Such trailers are convenient for citizens to place electronics in, and
can be replaced when filled. The use of trailers instead of collection containers reduces
the need to move electronics from the container to a truck, making it necessary only to
unload electronics from the trailer at the warehouse. The number of trailers will be more
79
Mergent Inc., Municipal & Government Manual, Volume 3, 2006
38
than the number of collection points. This will allow at least one trailer to be located at
the collection point, ready to accept e-waste from the residents when the full trailers are
taken to the warehouse. I further assume that one truck, or up to three if the program
expands, will be enough to service all collection points. At the same time, the trucks can
be used for purposes other than the e-waste program; therefore, the costs of this truck
should be shared with other programs.
Harnett County is two times bigger in geographic area than Orange County. Since
Orange County has 7 collection points, I assume Harnett County could have 15 collection
points. Moreover, if the program expands significantly, managers may choose to place
trailers at malls or other public places.
When a full load of electronics is accumulated at the warehouse, they will be
transported to the recycler. It is more efficient to accumulate a full load, and then
transport it, rather than ship an incomplete load. A 53 foot trailer for transporting
electronics and a truck to haul this trailer to the vendor will be used partially for the e-
waste program: the truck and trailer will be needed infrequently. A forklift will be used
occasionally for loading pallets with electronics, and used for other tasks at the landfill.
For these reasons, the initial investment in the truck, the trailer and the forklift, as well as
their operation and maintenance costs, should be shared proportionally to the time the
equipment is used for the e-waste recycling program. I model the proportion of time that
the equipment is used for the e-waste program as a function of the amount of electronics
generated and their collection rate.
Another estimation I need in my calculations is the load per trip in order to find the
annual number of trips needed to transport collected e-waste to the recycler. This will
39
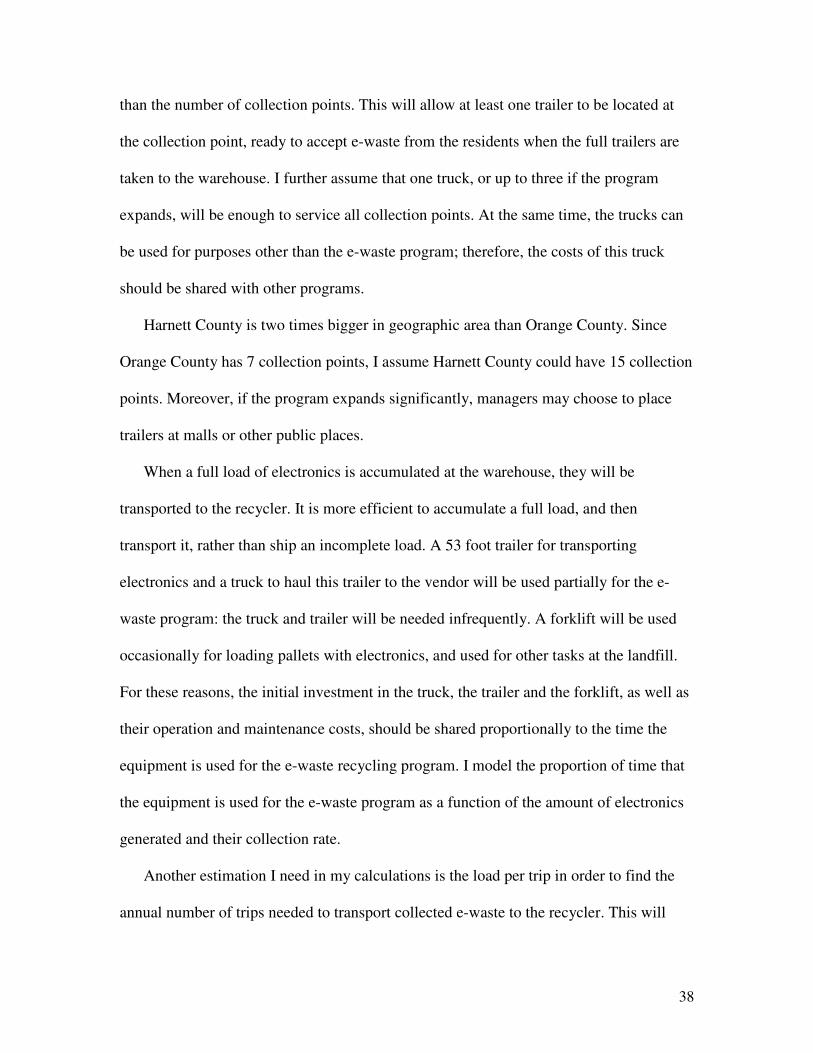
also allow me to estimate the level of use of the truck, trailer and driver’s work time. In
Table 12, I summarize Orange County data pertaining to the amount of e-waste
transported to the recycler and the number of trips made. Initial collection of e-waste in
the 2002-2003 fiscal year was very small, and the load per trip was lower than in the
following years. Over all years of the program the average load per trip was about 9.59
tons. This is the number I will use in my calculations to estimate the number of trips the
truck will need to make to transport e-waste to the vendor and proportion of the driver’s
involvement with e-waste program. However, if I assume that the first year is not
representative of the up and running program, I could alternatively use 10.15 tons per trip
estimate, which is the average per trip load for the years of the program excluding the
2002-2003 fiscal year.
TABLE 12. E-WASTE SHIPMENT DATA
2002-03 2003-04 2004-05 2005-06 2006-07 Average Average excluding 02
1 E-waste collection in Orange County, tons
29.52 169.65 187.28 290.07 197.68 174.84 211.17
2 Average tons per trip 7.38 9.43 9.86 10.91 10.40 9.59 10.15
In Table 13 (Appendix 1) I model different volumes of e-waste for five different
collection scenarios – from 20 to 100 percent. Based on the data about predicted amounts
of e-waste and average load per trip, I calculate the number of trips needed to transport
the e-waste to the vendor in each scenario (Table 14, Appendix 1). Based on the fact that
one trip from Orange County to the vendor requires 5 hours of a driver’s work time, I
predict the proportion of the driver’s work time dedicated to the program. The results are
provided in Table 15 and 16 (see Appendix 2 and 3). In this case, I predict that at a 20
percent collection rate in 2007, the driver will devote 5 percent of his time to e-waste
transporting. At a 100 percent collection rate in 2018, the driver will spend 44 percent of
40
his work time on e-waste transporting. However, this assumption may not hold in the
case if the county chooses to send its e-waste to longer distances, or shift these costs to a
contractor, thus increasing the amount of payment to the recycler.
In Table 15 (see Appendix 2) I calculate the equipment use proportions for different
collection rate scenarios. To calculate the number of 6×10 collection trailers needed for
the program, I assume that 10 trailers are enough to service 250 tons of e-waste
collection. Based on this assumption, I predict that with a 20 percent collection rate in
Harnett County in 2007, I will need at least 8 trailers. The program will require up to 68
trailers for a 100 percent collection rate in 2018.
I predict that at a 20 percent collection rate in Harnett County, the program will need
one truck to be dedicated to e-waste collection for 33 percent of its work time in 2007. At
an 80 percent collection rate in 2007, the program will need full use of one truck and
partial use of an additional one. At a 100 percent collection rate in 2018, the program will
require the full use of 2 trucks and partial (70 percent of work time) involvement of an
additional truck.
Based on the assumption that one forklift could service 250 tons of e-waste collection
with 30 percent time involvement, one forklift is needed for 25 percent of its work time at
a 20 percent collection rate in 2007. Almost two forklifts will be needed at higher
collection rates. Proportion of use of truck and trailer for transportation of e-waste to the
vendor is the same as the proportion of driver’s time devoted to this task in Table 16 (see
Appendix 3).
I also predict the proportion of involvement of the supervisor and the worker. The
program will require one employee partially dedicated to the e-waste program (or more -
41
if the e-waste volumes become very high). These workers will be responsible for
transporting e-waste from collection points to the warehouse, sorting it, packaging and
loading it to the trailer for shipment to the recycler. The assumption I use is that a worker
spends 60 percent his time on e-waste in the case of 250 tons collection. Thus, at a 20
percent collection rate in 2007, the program will need one worker partially dedicated to
the program. At a 60 percent collection rate in 2007, the program will require more than
one worker to handle the volume of e-waste. At a 100 percent collection rate in 2018 the
program needs 4 employees to collect, sort and package e-waste. I further assume that the
supervisor’s involvement level does not change greatly with the amount of e-waste. If a
250 tons e-waste program required 25 percent involvement of a supervisor, I assume that
the Harnett County program for the total generation volumes between 972 and 1,688 tons
will require involvement of a supervisor in the range between 25 and 35 percent of his or
her time.
The payments to the vendor for recycling electronics are proportional to the weight of
e-waste. The amount of per pound payment to the recycler depends on the e-waste
volumes, stability of supply, e-waste quality and composition. The payments to the
recycler are not the same for different types of e-waste, because their value differs for
recovery purposes. I use an average payment amount after taking into account the costs
and rebates from various products taken together. The average amount of the payment to
the recycler depends on how uniform the e-waste stream is and whether it becomes easier
and cheaper to recycle. Well separated e-waste will be accepted at a lower price, or will
receive a greater rebate, than non-separated, because certain electronics have greater
recovery value to the recycler than others. Also, it may be the case that the costs of

42
recycling could decline in future years, and so will the costs of the program. In my
calculations, I use the observed prices from the current e-waste programs in North
Carolina.
I also assume that the costs to the residents will be minimal, since they can discard
their electronics when they take other waste to the solid waste convenience center.
Additional costs could occur if the local government decides to impose recycling fees at
the disposal point. I do not consider this scenario, because I believe this reduces
collection rates.
Based on the initial information I model the costs of recycling all household e-waste
that is expected to be generated in Harnett County. The net present value of the 10 year
project is $3,339,048 discounted at 2.50% discount rate, as shown in Table 17 (see
Appendix 4). The main share of the costs occurs from the payments to the recycler, while
initial investment costs are comparatively low. Thus, fluctuations in recycling costs will
be the main factor affecting the costs of the program. The information on the cost of the
program can be used to estimate the fee that could be charged per unit of electronic
equipment sold in the county or the fee on per capita basis. The annual per capita cost is
shown in the Table 18 (see Appendix 4), and it is between $2.21 and $3.90.
However, the cash flow presented in Table 17 does not account for benefits resulting
from this project. The first reason for this is the difficulty of estimating health risk
reduction benefits from the elimination of potential hazards from disposed e-waste and
leaching effects in periods long after the project is over. One of the potential benefits
from waste reduction, which could be easily observed and measured, is the savings of
landfill space. The methodology I use in estimating landfill space savings benefits is
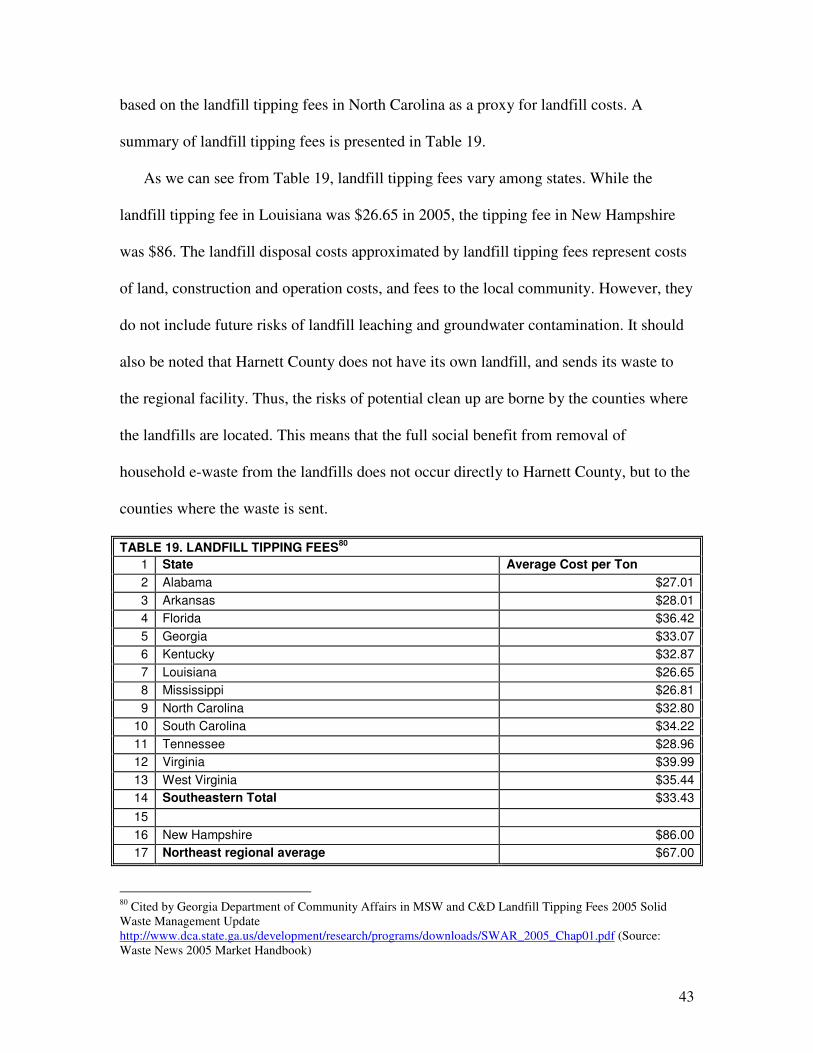
43
based on the landfill tipping fees in North Carolina as a proxy for landfill costs. A
summary of landfill tipping fees is presented in Table 19.
As we can see from Table 19, landfill tipping fees vary among states. While the
landfill tipping fee in Louisiana was $26.65 in 2005, the tipping fee in New Hampshire
was $86. The landfill disposal costs approximated by landfill tipping fees represent costs
of land, construction and operation costs, and fees to the local community. However, they
do not include future risks of landfill leaching and groundwater contamination. It should
also be noted that Harnett County does not have its own landfill, and sends its waste to
the regional facility. Thus, the risks of potential clean up are borne by the counties where
the landfills are located. This means that the full social benefit from removal of
household e-waste from the landfills does not occur directly to Harnett County, but to the
counties where the waste is sent.
TABLE 19. LANDFILL TIPPING FEES80
1 State Average Cost per Ton
2 Alabama $27.01
3 Arkansas $28.01
4 Florida $36.42
5 Georgia $33.07
6 Kentucky $32.87
7 Louisiana $26.65
8 Mississippi $26.81
9 North Carolina $32.80
10 South Carolina $34.22
11 Tennessee $28.96
12 Virginia $39.99
13 West Virginia $35.44
14 Southeastern Total $33.43
15
16 New Hampshire $86.00
17 Northeast regional average $67.00
80
Cited by Georgia Department of Community Affairs in MSW and C&D Landfill Tipping Fees 2005 Solid Waste Management Update http://www.dca.state.ga.us/development/research/programs/downloads/SWAR_2005_Chap01.pdf (Source: Waste News 2005 Market Handbook)
44
The average landfill tipping fee in North Carolina is about $33.80 per ton. If I use
landfill tipping fee as benefit from e-waste recycling, there is a reduction in the total net
present value costs of the program from -$3,339,048 to -$2,881,748. The results are
presented in Table 20 and 21 (Appendix 5). After I include saved landfill space costs
into the cash flow calculation, annual per capita costs are reduced to a range between
$1.81 and $3.60. A fully implemented project will allow the county to recycle 16,125
tons of e-waste over 10 years. The costs of the project in this scenario are about $178.72
per ton, or $0.08 per pound.
Although presently landfill space in North Carolina and neighboring states is readily
available, landfill disposal prices are much higher in other states. Available land scarcity
or local opposition may lead to changes in future tipping fees, which will lead to a higher
net present value of the project, making recycling more desirable. The other factors
influencing net present value of the project are the collection rate for e-waste and
recycling costs charged by the recycling companies. Lower collection rates do not allow
for using benefits of economies of scale. Recycling payments may change over time if
the costs to the recycler are changing. The next section addresses the effects of changes in
inputs costs on the project net present value.
4. SENSITIVITY ANALYSIS
The capacity of the e-waste collection and recycling program should be planned in
accordance with the projected volumes of e-waste discards. Uncertainty over e-waste
generation and recovery rates should be accounted for in project planning and will
45
influence the effectiveness of the program. As shown in the previous section, a different
collection rate implies lower labor or other input costs, but also fewer benefits such as
saved landfill space.
The first source of uncertainty could be that in the beginning of the program the
residents may be unaware of e-waste recycling opportunities, and thus the county
program may not achieve high collection rates. As I have already shown in the previous
section (see Table 10), e-waste collection rates in the United States are very low at the
moment: this could be attributed to the lack of recycling opportunities. However, the
evidence from Europe shows that much higher collection rates are possible. For these
reasons, I estimate program costs for collection scenarios in the range between 20 and
100 percent.
Because only part of discarded electronics is collected and recycled, I make
assumptions about the fate of electronics that are not recycled. I assume that in the
absence of a landfill disposal ban for electronics in North Carolina, the residents will
send discarded electronics to the landfill. Then, the amount of recycled e-waste is equal
to the amount of collected e-waste in each year, and the landfill space saved is equal to
the amount of recycled electronics. Based on this assumption I calculate the costs of the
program for various scenarios of recycling costs and collection rates. The results are
presented in summary Table 22. As we can see from the table, the change in the amount
of the recycling payment has the most direct effect on the cost of the program. The
percent of e-waste collection also impacts the per pound cost of the program. Higher
collection rates allow the county to achieve lower program costs. By varying the e-waste
collection rate, I estimate program costs in different scenarios.
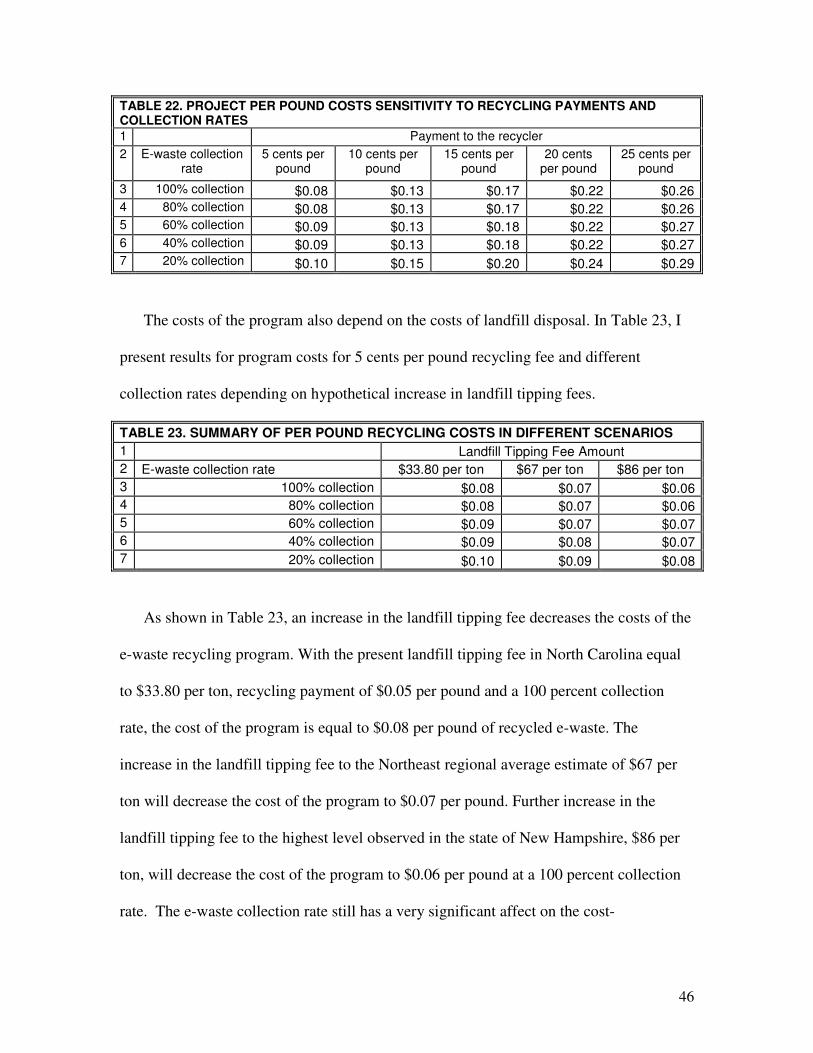
46
TABLE 22. PROJECT PER POUND COSTS SENSITIVITY TO RECYCLING PAYMENTS AND COLLECTION RATES
1 Payment to the recycler
2 E-waste collection rate
5 cents per pound
10 cents per pound
15 cents per pound
20 cents per pound
25 cents per pound
3 100% collection $0.08 $0.13 $0.17 $0.22 $0.26 4 80% collection $0.08 $0.13 $0.17 $0.22 $0.26 5 60% collection $0.09 $0.13 $0.18 $0.22 $0.27 6 40% collection $0.09 $0.13 $0.18 $0.22 $0.27 7 20% collection $0.10 $0.15 $0.20 $0.24 $0.29
The costs of the program also depend on the costs of landfill disposal. In Table 23, I
present results for program costs for 5 cents per pound recycling fee and different
collection rates depending on hypothetical increase in landfill tipping fees.
TABLE 23. SUMMARY OF PER POUND RECYCLING COSTS IN DIFFERENT SCENARIOS
1 Landfill Tipping Fee Amount
2 E-waste collection rate $33.80 per ton $67 per ton $86 per ton
3 100% collection $0.08 $0.07 $0.06 4 80% collection $0.08 $0.07 $0.06 5 60% collection $0.09 $0.07 $0.07 6 40% collection $0.09 $0.08 $0.07 7 20% collection $0.10 $0.09 $0.08
As shown in Table 23, an increase in the landfill tipping fee decreases the costs of the
e-waste recycling program. With the present landfill tipping fee in North Carolina equal
to $33.80 per ton, recycling payment of $0.05 per pound and a 100 percent collection
rate, the cost of the program is equal to $0.08 per pound of recycled e-waste. The
increase in the landfill tipping fee to the Northeast regional average estimate of $67 per
ton will decrease the cost of the program to $0.07 per pound. Further increase in the
landfill tipping fee to the highest level observed in the state of New Hampshire, $86 per
ton, will decrease the cost of the program to $0.06 per pound at a 100 percent collection
rate. The e-waste collection rate still has a very significant affect on the cost-
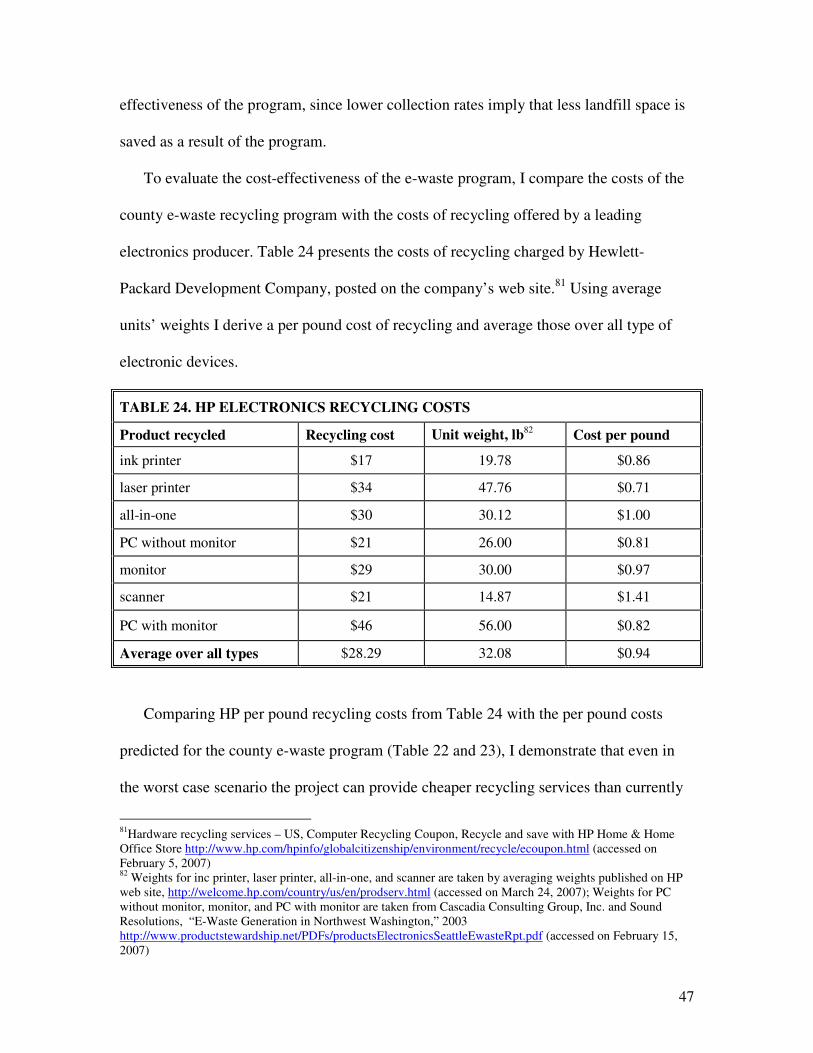
47
effectiveness of the program, since lower collection rates imply that less landfill space is
saved as a result of the program.
To evaluate the cost-effectiveness of the e-waste program, I compare the costs of the
county e-waste recycling program with the costs of recycling offered by a leading
electronics producer. Table 24 presents the costs of recycling charged by Hewlett-
Packard Development Company, posted on the company’s web site.81 Using average
units’ weights I derive a per pound cost of recycling and average those over all type of
electronic devices.
TABLE 24. HP ELECTRONICS RECYCLING COSTS
Product recycled Recycling cost Unit weight, lb82 Cost per pound
ink printer $17 19.78 $0.86
laser printer $34 47.76 $0.71
all-in-one $30 30.12 $1.00
PC without monitor $21 26.00 $0.81
monitor $29 30.00 $0.97
scanner $21 14.87 $1.41
PC with monitor $46 56.00 $0.82
Average over all types $28.29 32.08 $0.94
Comparing HP per pound recycling costs from Table 24 with the per pound costs
predicted for the county e-waste program (Table 22 and 23), I demonstrate that even in
the worst case scenario the project can provide cheaper recycling services than currently
81
Hardware recycling services – US, Computer Recycling Coupon, Recycle and save with HP Home & Home Office Store http://www.hp.com/hpinfo/globalcitizenship/environment/recycle/ecoupon.html (accessed on February 5, 2007) 82
Weights for inc printer, laser printer, all-in-one, and scanner are taken by averaging weights published on HP web site, http://welcome.hp.com/country/us/en/prodserv.html (accessed on March 24, 2007); Weights for PC without monitor, monitor, and PC with monitor are taken from Cascadia Consulting Group, Inc. and Sound Resolutions, “E-Waste Generation in Northwest Washington,” 2003 http://www.productstewardship.net/PDFs/productsElectronicsSeattleEwasteRpt.pdf (accessed on February 15, 2007)
48
offered by an electronics producer. In the worst case scenario with only 20 percent
collection rate and the highest recycling payment to the contractor of 25 cent per pound,
the program can achieve $0.29 per pound cost, which is 3 times less than the recycling
costs charged by HP. In the usual case scenario, the program cost is $0.08 per pound
which is one tenth the HP recycling costs.
5. CONCLUSIONS AND POLICY RECOMMENDATIONS
I conclude that the project is desirable since it allows the state to cost-effectively
reduce the amounts of hazardous waste added to municipal landfills. This will reduce
risks of future damages from leaching landfills. This program will not only simply offer
the means of recycling, but will also increase awareness of the risks of e-waste.
The net present value of the e-waste project for Harnett County under assumptions of
100 percent collection rate, and discount rate of 2.50%, will be -$2,881,748. The average
annual cost to average citizen will be in the range of $1.81 to $3.60. The program will
allow the county to recycle 16,125 tons of e-waste over the 10 year period. The costs of
the program will be about $178.72 per ton, or $0.08 per pound. The amount of funds
needed for the project in the initial year is $392,009; and the annual amounts in the
subsequent years range from $210,369 to $324,507.
My analysis demonstrated that the program has a potential to reduce costs if landfill
disposal fees are increased. However, this is not feasible for one county unless it is
implemented on the regional level. Increasing fees in the county do not make recycling
cheaper for the county, because cheap landfill space is still available in the neighboring
counties, or even states. Existence of cheap landfill space makes recycling more

49
expensive than landfill disposal. Increasing fees in the county or even in the state will
lead to spillovers of waste to areas with lower landfill disposal costs. For these reasons, if
landfill disposal costs can be increased they should be increased on the regional level.
The costs of the program are also lower with higher collection rates. Also the costs of
e-waste program are significantly reduced with lower payments to the recyclers. The
payments to the recyclers could be decreased by sorting and preparing e-waste in the
county to increase its value for recovery, and by ensuring a stable supply and high
volumes of recycled e-waste. Program implementation will create conditions to achieve
higher collection rates and ensure a stable supply to reduce payments to the recycler that
in turn will reduce the program costs.
Funds to finance the program can be obtained through the imposition of an
electronics recycling fee or tax. However, the imposition of a disposal fee at the county
level may decrease collection rate, which in turn may increase the cost of the program.
The better approach would be to impose a purchase fee, but imposing the electronics
purchase fee in the county may increase transboundary movement of electronic
equipment. These shortcomings can be reduced if the fee or tax is imposed on the state
level. Thus, I conclude that the program should be expanded onto the state level. In the
meanwhile the county should ask the state government for grant money for developing a
local e-waste program.
50
BIBLIOGRAPHY
1. 40 CFR Ch. I , § 261.24 Toxicity characteristic.
http://a257.g.akamaitech.net/7/257/2422/20oct20031500/edocket.access.gpo.gov/cfr_2003/julqtr/pdf/40cfr261.24.pdf (accessed February 2, 2007)
2. Basel Convention on the Control of Transboundary Movements of Hazardous Wastes and Their Disposal. http://www.basel.int/text/con-e-rev.pdf (accessed on October 5, 2006)
3. California Department of Toxic Substances Control. 2007. “California’s Restriction on the Use of Certain Hazardous Substances in Some Electronic Devices (RoHS),” effective January 1, 2007 http://www.dtsc.ca.gov/HazardousWaste/EWaste/upload/Restrictions_on_Electronic_Devices_01-05-06.pdf (accessed on November 25, 2006)
4. California Department of Toxic Substances Control, Hazardous Material Laboratory. 2004. “SB20 Report. Determination of regulated elements in discarded laptop computers, LCD monitors, Plasma TVs and LCD TVs.” http://www.dtsc.ca.gov/HazardousWaste/EWaste/upload/HWMP_REP_SB20_LCD.pdf (accessed on December 15, 2006)
5. California Environmental Protection Agency, Integrated Waste Management Board. “Selected E-Waste Diversion in California: A Baseline Study.” November 2001 http://www.ciwmb.ca.gov/Publications/HHW/61001008.doc (accessed on February 5, 2006)
6. Cascadia Consulting Group, Inc. and Sound Resolutions. 2003. “E-Waste Generation in Northwest Washington.” http://www.productstewardship.net/PDFs/productsElectronicsSeattleEwasteRpt.pdf (accessed on February 15, 2007)
7. Charles W. Schmidt. 2002. “e-Junk Explosion”. Environmental Health Perspectives, Vol. 110, No. 4 2002-04 pp. A188-A194.
8. Charles W. Schmidt. 2004. “Environmental Crimes: Profiting at the Earth's Expense”. Environmental Health Perspectives, Vol. 112, No. 2 2004-02 pp. A96-A103
9. Chatham County Solid Waste Management, Electronics (Computer) Recycling http://www.chathamrecycles.com/about.shtml#electronics (accessed on October 5, 2006)
10. Christian B., Turner David, Romanov Alexandre. 2006. “Leaching of Lead and Other Elements from Portable Electronics.” http://www.rohsusa.com/papers/Leachingpaper1.pdf#search=%22electronics%20leaching%22 (accessed on December 15, 2006)
11. Deng, WJ, Louie, PKK, Liu, WK, Bi, XH, Fu, JM, Wong, MH. 2006. “Atmospheric levels and cytotoxicity of PAHs and heavy metals in TSP and PM2.5 at an electronic waste recycling site in southeast China”. Atmospheric Environment, 40 (36): 6945-6955 Nov 2006.
12. Directive 2002/95/Ec of the European Parliament and of the Council of 27 January 2003 on the restriction of the use of certain hazardous substances in electrical and electronic equipment http://europa.eu/eur-
51
lex/pri/en/oj/dat/2003/l_037/l_03720030213en00190023.pdf (accessed on February 12, 2007)
13. Durham County Solid Waste Convenience Site Restrictions. http://www.durhamcountync.gov/departments/gnsv/Documents/Convenience_Site_Restrictions.pdf (accessed on October 5, 2006)
14. Environment Directorate-General of the European Commission. Waste Electrical and Electronic Equipment Directive. http://ec.europa.eu/environment/waste/weee_index.htm (accessed on February 2, 2007)
15. eWaste Guide http://www.ewaste.ch/facts_and_figures/economics (accessed on February 5, 2007)
16. General Assembly of North Carolina. Session 2005. House Bill 1765. “Electronics Waste/Mgmt. Plans/Manf. Tax.” http://www.ncga.state.nc.us/Sessions/2005/Bills/House/HTML/H1765v1.html (accessed on February 5, 2007)
17. General Assembly of North Carolina. Session 2005. Senate Bill 1030. “Electronics Recycling and Job Creation.” http://www.ncga.state.nc.us/Sessions/2005/Bills/Senate/HTML/S1030v1.html (accessed on February 5, 2007)
18. General Assembly of Rhode Island. “An Act Relating To Health And Safety - Electronic Waste Producer Responsibility,” enacted 07/07/2006. http://www.rilin.state.ri.us/publiclaws/law06/law06365.htm (accessed on February 12, 2007)
19. Hewlett-Packard Development Company, L.P., Hardware recycling services – US, Computer Recycling Coupon, Recycle and save with HP Home & Home Office Store http://www.hp.com/hpinfo/globalcitizenship/environment/recycle/ecoupon.html (accessed on February 5, 2007)
20. Hilty, Lorenz M. 2005. "Electronic Waste--an Emerging Risk?" Environmental
Impact Assessment Review, 25.5 (2005): 431-35. http://www.sciencedirect.com/science/article/B6V9G-4G9R1BN-3/2/cefced5cb07fdc7a623752402e27365e (accessed on March 2, 2007)
21. Hischier, R., Wager, P., and Gauglhofer, J. 2005. "Does WEEE Recycling Make Sense from an Environmental Perspective?: The Environmental Impacts of the Swiss Take-Back and Recycling Systems for Waste Electrical and Electronic Equipment (WEEE)." Environmental Impact Assessment Review, 25.5 (2005): 525-39.
22. Kellyn S Betts. 2006. “PBDEs and PCBs in computers, cars, and homes”. Environmental Science & Technology, 12/15/2006, Vol. 40 Issue 24, p7452-7452
23. Konoval, George J.. 2006. “Electronic waste control legislation: observations on a new dimension in state environmental regulation”. Air Force Law Review, 2006, Vol. 58, p147-173
24. Korenstein Steven J. 2005. “Managing electronic waste: the California approach”. Journal of Environmental Health, Vol. 67, 2005. (accessed on October 15, 2006)
25. Lee County Solid Waste Division, Recyclables. http://www.leecountync.gov/departments/general-services/recycling.html (accessed on October 5, 2006)
52
26. Liu, XB, Tanaka, M, Matsui, Y. 2006. “Generation amount prediction and material flow analysis of electronic waste: a case study in Beijing, China”. Waste Management
& Research, 24 (5): 434-445 Oct 2006. 27. Maine Public Law 661. “An Act to Protect Public Health and the Environment by
Providing for a System of Shared Responsibility for the Safe Collection and Recycling of Electronic Waste,” enacted 2004 http://janus.state.me.us/legis/ros/lom/LOM121st/15Pub651-700/Pub651-700-19.htm (accessed on October 5, 2006)
28. Maine State Planning Office, Electronics Recycling Resources http://www.state.me.us/spo/recycle/hhw/electronics (accessed on October 5, 2006)
29. Matthews H, McMichael F, Hendrickson C, Hart D. 1997. “Disposition and end-of-life options for personal computers.” Design Initiative Technical Report #97-10. Carnegie Mellon University http://www.ce.cmu.edu/GreenDesign/comprec/NEWREPORT.PDF (accessed on February 15, 2007)
30. McPherson Alexandra, Thorpe Beverley, Blake Ann. “Brominated Flame Retardants in Dust on Computers: the case for safer chemicals and better computer design.” June 2004 http://www.computertakeback.com/docUploads/bfr_report.pdf?CFID=6511728&CFTOKEN=31059718 (accessed on February 17, 2007)
31. Mergent Inc. Municipal & Government Manual. Volume 3, 2006 32. Minnesota Office of Environmental Assistance.
http://www.moea.state.mn.us/stewardship/crt-ban.cfm (accessed on October 5, 2006) 33. North Carolina Department of Natural Resource, Division of Pollution Prevention
and Environmental Assistance. “Generation Estimate for Electronic Discards in North Carolina.” July 2003. http://www.p2pays.org/ref/26/25964.pdf (accessed on February 5, 2007)
34. North Carolina Department of Natural Resource, Division of Pollution Prevention and Environmental Assistance. “2001 fact sheet: Electronics Generation in the United States and North Carolina.” December 2001 http://www.p2pays.org/search/pdfframe.asp?pdfurl=/ref/14/13034.pdf (accessed on February 5, 2007)
35. North Carolina Department of Natural Resource, Division of Pollution Prevention and Environmental Assistance. “2003 fact sheet: Generation Estimate for Electronic Discards in North Carolina.” July 2003 http://www.p2pays.org/ref/26/25964.pdf (accessed on February 5, 2007)
36. North Carolina Department of Natural Resource, Division of Pollution Prevention and Environmental Assistance, Recycling Business Assistance Center. “North Carolina markets assessment of the recycling industry and recyclable materials.” 1998. http://www.p2pays.org/ref/02/01622/01622.pdf (accessed on February 5, 2007)
37. Orange County Department of Solid Waste, North Carolina Solid Waste Management Department. http://www.co.orange.nc.us/recycling/a-z-recyclery.asp#electronic (accessed on October 5, 2006)
38. Orange County Solid Waste Management Department http://www.co.orange.nc.us/recycling/index.asp (accessed on October 5, 2006)
53
39. Peralta Genandrialine L., Fontanos Psyche M. 2006. “E-waste issues and measures in the Philippines.” Journal of Material Cycles and Waste Management, Volume 8, Number 1 / March, 2006. http://www.springerlink.com/content/q7488720534033qj/fulltext.pdf (accessed on February 15, 2007)
40. Resource Conservation and Recovery Act, Section III, Subtitle C, Chapter 1: Hazardous Waste Identification, http://www.epa.gov/epaoswer/general/orientat/rom31.pdf (accessed on November 25, 2006)
41. Richard Dahl. 2002. “Who Pays for e-Junk?” Environmental Health Perspectives, Vol. 110, No. 4 2002-04 pp. A196-A199.
42. Scott Mouw, section chief, NC Division of Pollution Prevention and Environmental Assistance, (personal communication, September 27, 2007).
43. Secretariat of Basel Convention. Status of ratification. http://www.basel.int/ratif/frsetmain.php?refer=ban-alpha.htm (accessed on February 5, 2007)
44. Selin, H, Stacy D VanDeveer. 2006. “Raising global standards - Hazardous substances and E-waste management in the European Union”. Environment. Washington: Dec 2006.Vol.48, Iss. 10; pg. 6, 14 pgs
45. State of New Hampshire. “An Act relative to the disposal of video display devices,” approved May 24, 2006. http://www.gencourt.state.nh.us/legislation/2006/HB1455.html (accessed on February 12, 2007)
46. State of Oregon Department of Environmental Quality. 2002. CRT Interim Policy 2002-PO-001. http://www.deq.state.or.us/lq/pubs/docs/hw/Policy/2002-PO-001.pdf (accessed on November 25, 2006)
47. Stephen E. Musson, Kevin N. Vann, Yong-Chul Jang, Sarvesh Mutha, Aaron Jordan, Brian Pearson, and Timothy G. Townsend. 2006. “RCRA Toxicity Characterization of Discarded Electronic Devices.” Environmental Science & Technology, Easton: Apr 15, 2006.Vol.40, Iss. 8; pg. 2721
48. Switzerland Federal Office for the Environment FOEN. Statistics: Data for 2005. http://www.bafu.admin.ch/abfall/01517/01519/03284/index.html?lang=en (accessed on February 18, 2007)
49. Texas Commission on Environmental Quality. “Regulations That Apply to Recyclers and Other Handlers of Used Electronics" http://www.tceq.state.tx.us/assistance/P2Recycle/electronics/RecyclerRegs.html (accessed on November 25, 2006)
50. The Basel Action Network (BAN) and Silicon Valley Toxics Coalition (SVTC). 2002. “Exporting Harm The High-Tech Trashing of Asia.” http://www.ban.org/E-waste/technotrashfinalcomp.pdf (accessed on October 5, 2006)
51. The Massachusetts Department of Environmental Protection. 310 CMR 19.017: Waste Disposal Ban Regulation. http://www.mass.gov/dep/recycle/laws/bansreg.htm (accessed on October 5, 2006)
52. The University of Tennessee. National Electronics Product Stewardship Initiative. http://eerc.ra.utk.edu/clean/nepsi/ (accessed on September 30, 2006)
54
53. Townsend Timothy G., Musson Stephen, Jang Yong-Chul, Chung Il-Hyun. 1999. “Characterization of lead leachability from cathode ray tubes using the toxicity characteristic leaching procedure.” Environmental Science & Technology, Easton: Oct 15, 2000.Vol.34, Iss. 20; pg. 4376
54. United Sates Environmental Protection Agency. “Electronics: A New Opportunity for Waste Prevention, Reuse, and Recycling.” June 2001. http://www.epa.gov/epaoswer/osw/elec_fs.pdf (accessed on September 30, 2006)
55. United States Census Bureau. Population Division. http://www.census.gov/population/projections/nation/summary/np-t1.pdf
56. United States Census Bureau. Population Division. http://www.census.gov/popest/states/tables/NST-EST2006-01.xls
57. United States Census Bureau. Population Division. http://www.census.gov/popest/datasets.html (accessed on February 18, 2007)
58. United States Department of Commerce. Regional Economic Information System. Bureau of Economic Analysis. 2006. http://www.bea.gov/regional/reis/CA1-3fn.cfm (accessed on March 3, 2007)
59. United States Environmental Protection Agency. 2002. “Characterization of Municipal Solid Waste in the United States: 2000 Update”. http://www.epa.gov/epaoswer/non-hw/muncpl/pubs/report-00.pdf (accessed on February 5, 2007)
60. United States Environmental Protection Agency. 2006. “Municipal Solid Waste In The United States: 2005 Facts And Figures” http://www.epa.gov/garbage/pubs/mswchar05.pdf
61. United States Environmental Protection Agency. eCycling. http://www.epa.gov/epaoswer/hazwaste/recycle/ecycling/index.htm (accessed on September 25, 2006)
62. United States Environmental Protection Agency. Proposed Rule on Discarded Cathode Ray Tubes and Mercury-Containing Equipment. June 12, 2002. http://www.epa.gov/epaoswer/hazwaste/recycle/electron/crt2.htm (accessed on February 15, 2007)
63. Utah Department of Environmental Quality. eNewsletter. 2004. http://www.deq.utah.gov/News/newsletter/EC_Summer_2004.pdf (accessed on November 25, 2006)
64. Wake County Government. Electronics Recycling. 2003. http://www.wakegov.com/news/archive/2003/111303elecrecyc.htm (accessed on October 5, 2006)
65. Washington State Department of Ecology. Interim Enforcement Policy Conditional Exclusion for Cathode Ray Tubes and Related Electronic Wastes. 2002. http://www.ecy.wa.gov/pubs/0204017.pdf (accessed on November 25, 2006)
66. Widmer Rolf , Oswald-Krapf Heidi Sinha-Khetriwal Deepali, Schnellmann Max, Boni Heinz. 2005. “Global perspectives on e-waste”. Environmental Impact
Assessment Review, 25 (2005) 436– 458. http://www.sciencedirect.com/science?_ob=MImg&_imagekey=B6V9G-4GC1R45-1-T&_cdi=5898&_user=38557&_orig=browse&_coverDate=07%2F31%2F2005&_sk=999749994&view=c&wchp=dGLbVlz-
55
zSkWA&md5=3dcd83235fdaae86a25d90bd2c8f4e5d&ie=/sdarticle.pdf (accessed on February 5, 2007)
67. Wong, CSC, Wu, SC, Duzgoren-Aydin, NS, Aydin, A, Wong, MH. 2007. ”Trace metal contamination of sediments in an e-waste processing village in China.” Environmental Pollution, 145 (2): 434-442 Jan 2007.
68. Yu, XZ, Gao, Y, Wu, SC, Zhang, HB, Cheung, KC, Wong, MH. 2006. “Distribution of polycyclic aromatic hydrocarbons in soils at Guiyu area of China, affected by recycling of electronic waste using primitive technologies”. Chemosphere, 65 (9): 1500-1509 Nov 2006
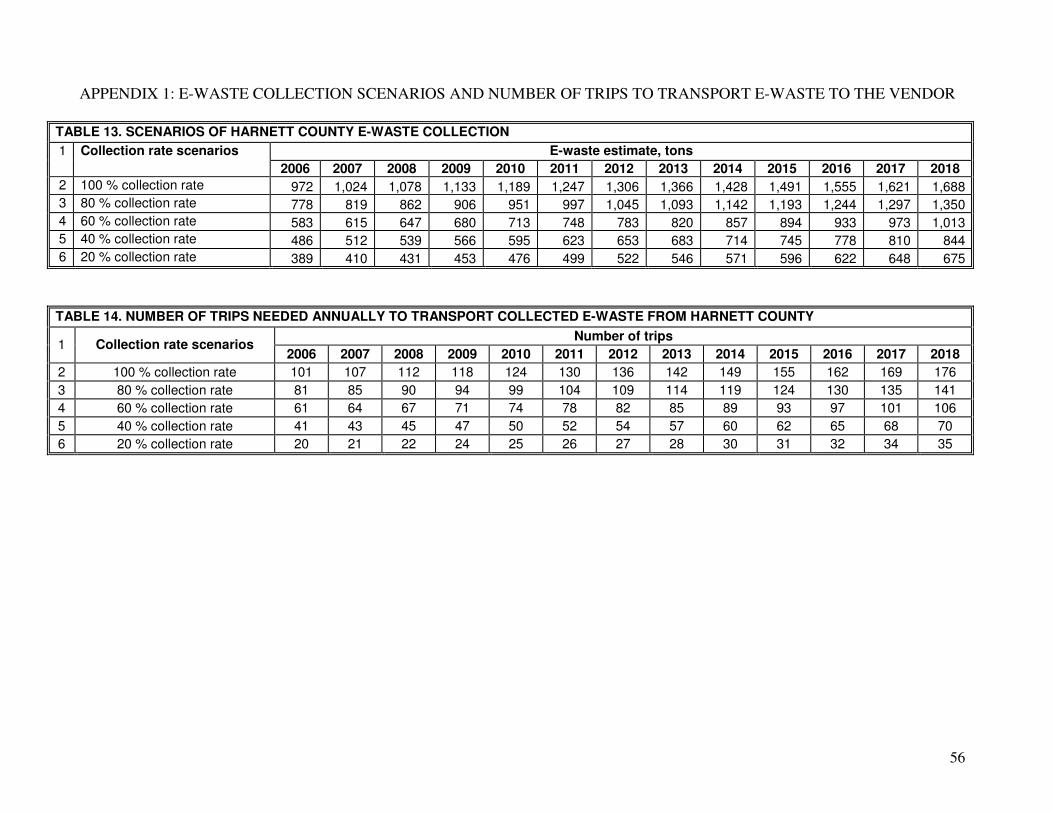
56
APPENDIX 1: E-WASTE COLLECTION SCENARIOS AND NUMBER OF TRIPS TO TRANSPORT E-WASTE TO THE VENDOR
TABLE 13. SCENARIOS OF HARNETT COUNTY E-WASTE COLLECTION
E-waste estimate, tons 1 Collection rate scenarios
2006 2007 2008 2009 2010 2011 2012 2013 2014 2015 2016 2017 2018
2 100 % collection rate 972 1,024 1,078 1,133 1,189 1,247 1,306 1,366 1,428 1,491 1,555 1,621 1,688 3 80 % collection rate 778 819 862 906 951 997 1,045 1,093 1,142 1,193 1,244 1,297 1,350 4 60 % collection rate 583 615 647 680 713 748 783 820 857 894 933 973 1,013 5 40 % collection rate 486 512 539 566 595 623 653 683 714 745 778 810 844 6 20 % collection rate 389 410 431 453 476 499 522 546 571 596 622 648 675
TABLE 14. NUMBER OF TRIPS NEEDED ANNUALLY TO TRANSPORT COLLECTED E-WASTE FROM HARNETT COUNTY
Number of trips 1 Collection rate scenarios
2006 2007 2008 2009 2010 2011 2012 2013 2014 2015 2016 2017 2018
2 100 % collection rate 101 107 112 118 124 130 136 142 149 155 162 169 176
3 80 % collection rate 81 85 90 94 99 104 109 114 119 124 130 135 141
4 60 % collection rate 61 64 67 71 74 78 82 85 89 93 97 101 106
5 40 % collection rate 41 43 45 47 50 52 54 57 60 62 65 68 70
6 20 % collection rate 20 21 22 24 25 26 27 28 30 31 32 34 35
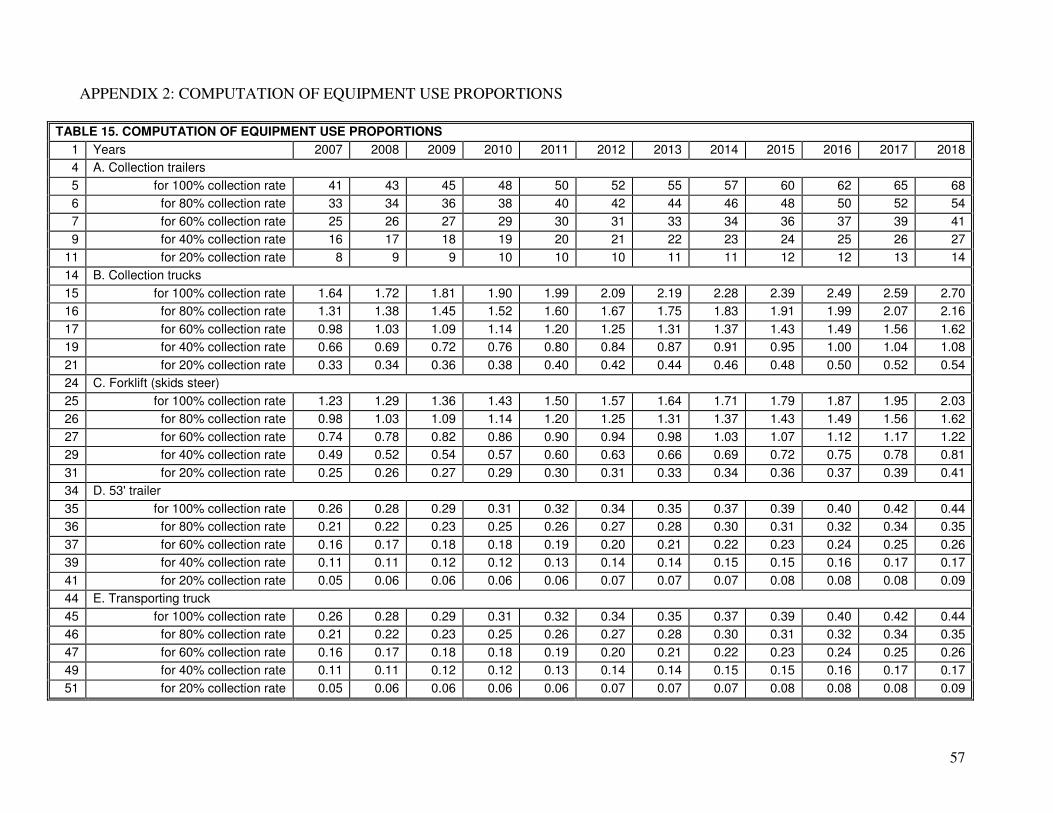
57
APPENDIX 2: COMPUTATION OF EQUIPMENT USE PROPORTIONS
TABLE 15. COMPUTATION OF EQUIPMENT USE PROPORTIONS
1 Years 2007 2008 2009 2010 2011 2012 2013 2014 2015 2016 2017 2018
4 A. Collection trailers
5 for 100% collection rate 41 43 45 48 50 52 55 57 60 62 65 68
6 for 80% collection rate 33 34 36 38 40 42 44 46 48 50 52 54
7 for 60% collection rate 25 26 27 29 30 31 33 34 36 37 39 41
9 for 40% collection rate 16 17 18 19 20 21 22 23 24 25 26 27
11 for 20% collection rate 8 9 9 10 10 10 11 11 12 12 13 14
14 B. Collection trucks
15 for 100% collection rate 1.64 1.72 1.81 1.90 1.99 2.09 2.19 2.28 2.39 2.49 2.59 2.70
16 for 80% collection rate 1.31 1.38 1.45 1.52 1.60 1.67 1.75 1.83 1.91 1.99 2.07 2.16
17 for 60% collection rate 0.98 1.03 1.09 1.14 1.20 1.25 1.31 1.37 1.43 1.49 1.56 1.62
19 for 40% collection rate 0.66 0.69 0.72 0.76 0.80 0.84 0.87 0.91 0.95 1.00 1.04 1.08
21 for 20% collection rate 0.33 0.34 0.36 0.38 0.40 0.42 0.44 0.46 0.48 0.50 0.52 0.54
24 C. Forklift (skids steer)
25 for 100% collection rate 1.23 1.29 1.36 1.43 1.50 1.57 1.64 1.71 1.79 1.87 1.95 2.03
26 for 80% collection rate 0.98 1.03 1.09 1.14 1.20 1.25 1.31 1.37 1.43 1.49 1.56 1.62
27 for 60% collection rate 0.74 0.78 0.82 0.86 0.90 0.94 0.98 1.03 1.07 1.12 1.17 1.22
29 for 40% collection rate 0.49 0.52 0.54 0.57 0.60 0.63 0.66 0.69 0.72 0.75 0.78 0.81
31 for 20% collection rate 0.25 0.26 0.27 0.29 0.30 0.31 0.33 0.34 0.36 0.37 0.39 0.41
34 D. 53' trailer
35 for 100% collection rate 0.26 0.28 0.29 0.31 0.32 0.34 0.35 0.37 0.39 0.40 0.42 0.44
36 for 80% collection rate 0.21 0.22 0.23 0.25 0.26 0.27 0.28 0.30 0.31 0.32 0.34 0.35
37 for 60% collection rate 0.16 0.17 0.18 0.18 0.19 0.20 0.21 0.22 0.23 0.24 0.25 0.26
39 for 40% collection rate 0.11 0.11 0.12 0.12 0.13 0.14 0.14 0.15 0.15 0.16 0.17 0.17
41 for 20% collection rate 0.05 0.06 0.06 0.06 0.06 0.07 0.07 0.07 0.08 0.08 0.08 0.09
44 E. Transporting truck
45 for 100% collection rate 0.26 0.28 0.29 0.31 0.32 0.34 0.35 0.37 0.39 0.40 0.42 0.44
46 for 80% collection rate 0.21 0.22 0.23 0.25 0.26 0.27 0.28 0.30 0.31 0.32 0.34 0.35
47 for 60% collection rate 0.16 0.17 0.18 0.18 0.19 0.20 0.21 0.22 0.23 0.24 0.25 0.26
49 for 40% collection rate 0.11 0.11 0.12 0.12 0.13 0.14 0.14 0.15 0.15 0.16 0.17 0.17
51 for 20% collection rate 0.05 0.06 0.06 0.06 0.06 0.07 0.07 0.07 0.08 0.08 0.08 0.09
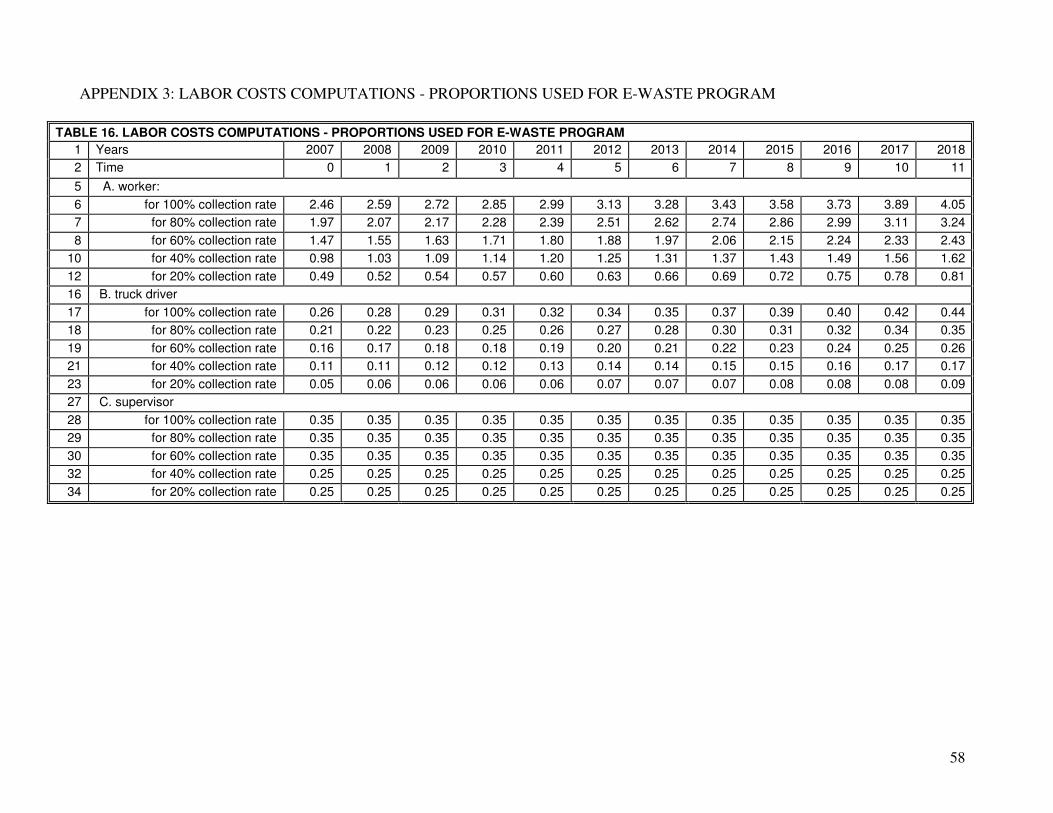
58
APPENDIX 3: LABOR COSTS COMPUTATIONS - PROPORTIONS USED FOR E-WASTE PROGRAM
TABLE 16. LABOR COSTS COMPUTATIONS - PROPORTIONS USED FOR E-WASTE PROGRAM
1 Years 2007 2008 2009 2010 2011 2012 2013 2014 2015 2016 2017 2018
2 Time 0 1 2 3 4 5 6 7 8 9 10 11
5 A. worker:
6 for 100% collection rate 2.46 2.59 2.72 2.85 2.99 3.13 3.28 3.43 3.58 3.73 3.89 4.05
7 for 80% collection rate 1.97 2.07 2.17 2.28 2.39 2.51 2.62 2.74 2.86 2.99 3.11 3.24
8 for 60% collection rate 1.47 1.55 1.63 1.71 1.80 1.88 1.97 2.06 2.15 2.24 2.33 2.43
10 for 40% collection rate 0.98 1.03 1.09 1.14 1.20 1.25 1.31 1.37 1.43 1.49 1.56 1.62
12 for 20% collection rate 0.49 0.52 0.54 0.57 0.60 0.63 0.66 0.69 0.72 0.75 0.78 0.81
16 B. truck driver
17 for 100% collection rate 0.26 0.28 0.29 0.31 0.32 0.34 0.35 0.37 0.39 0.40 0.42 0.44
18 for 80% collection rate 0.21 0.22 0.23 0.25 0.26 0.27 0.28 0.30 0.31 0.32 0.34 0.35
19 for 60% collection rate 0.16 0.17 0.18 0.18 0.19 0.20 0.21 0.22 0.23 0.24 0.25 0.26
21 for 40% collection rate 0.11 0.11 0.12 0.12 0.13 0.14 0.14 0.15 0.15 0.16 0.17 0.17
23 for 20% collection rate 0.05 0.06 0.06 0.06 0.06 0.07 0.07 0.07 0.08 0.08 0.08 0.09
27 C. supervisor
28 for 100% collection rate 0.35 0.35 0.35 0.35 0.35 0.35 0.35 0.35 0.35 0.35 0.35 0.35
29 for 80% collection rate 0.35 0.35 0.35 0.35 0.35 0.35 0.35 0.35 0.35 0.35 0.35 0.35
30 for 60% collection rate 0.35 0.35 0.35 0.35 0.35 0.35 0.35 0.35 0.35 0.35 0.35 0.35
32 for 40% collection rate 0.25 0.25 0.25 0.25 0.25 0.25 0.25 0.25 0.25 0.25 0.25 0.25
34 for 20% collection rate 0.25 0.25 0.25 0.25 0.25 0.25 0.25 0.25 0.25 0.25 0.25 0.25
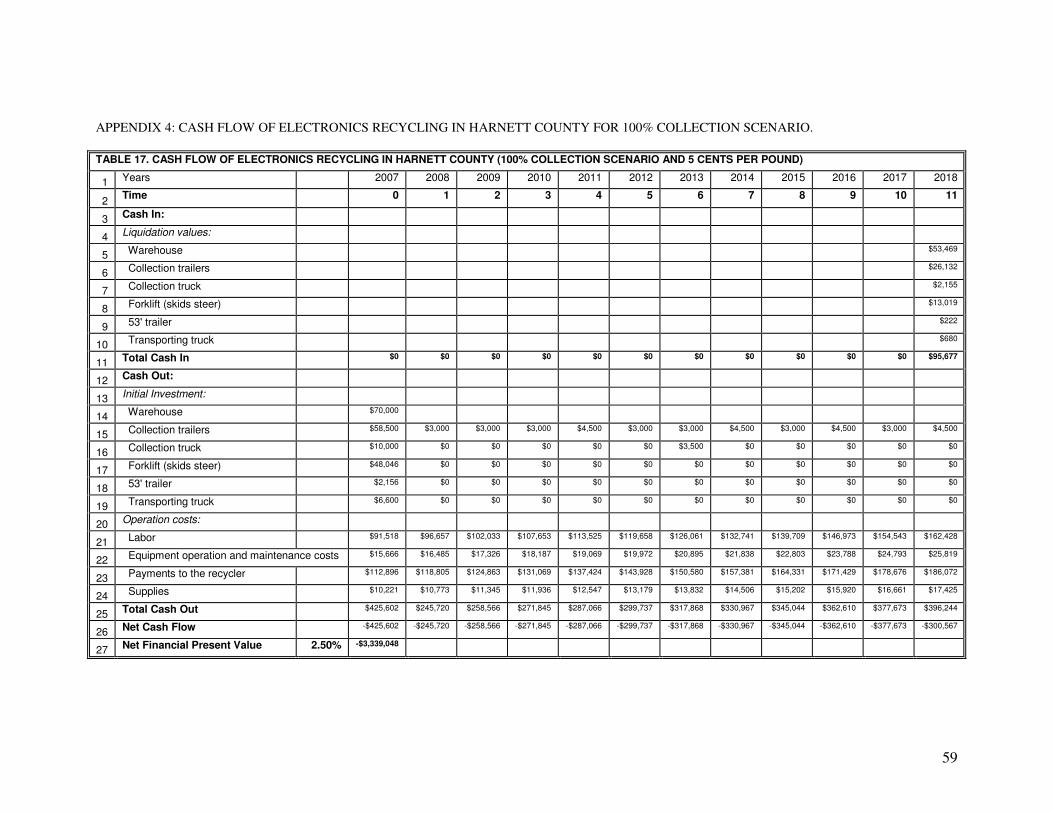
59
APPENDIX 4: CASH FLOW OF ELECTRONICS RECYCLING IN HARNETT COUNTY FOR 100% COLLECTION SCENARIO.
TABLE 17. CASH FLOW OF ELECTRONICS RECYCLING IN HARNETT COUNTY (100% COLLECTION SCENARIO AND 5 CENTS PER POUND)
1 Years 2007 2008 2009 2010 2011 2012 2013 2014 2015 2016 2017 2018
2 Time 0 1 2 3 4 5 6 7 8 9 10 11
3 Cash In:
4 Liquidation values:
5 Warehouse $53,469
6 Collection trailers $26,132
7 Collection truck $2,155
8 Forklift (skids steer) $13,019
9 53' trailer $222
10 Transporting truck $680
11 Total Cash In $0 $0 $0 $0 $0 $0 $0 $0 $0 $0 $0 $95,677
12 Cash Out:
13 Initial Investment:
14 Warehouse $70,000
15 Collection trailers $58,500 $3,000 $3,000 $3,000 $4,500 $3,000 $3,000 $4,500 $3,000 $4,500 $3,000 $4,500
16 Collection truck $10,000 $0 $0 $0 $0 $0 $3,500 $0 $0 $0 $0 $0
17 Forklift (skids steer) $48,046 $0 $0 $0 $0 $0 $0 $0 $0 $0 $0 $0
18 53' trailer $2,156 $0 $0 $0 $0 $0 $0 $0 $0 $0 $0 $0
19 Transporting truck $6,600 $0 $0 $0 $0 $0 $0 $0 $0 $0 $0 $0
20 Operation costs:
21 Labor $91,518 $96,657 $102,033 $107,653 $113,525 $119,658 $126,061 $132,741 $139,709 $146,973 $154,543 $162,428
22 Equipment operation and maintenance costs $15,666 $16,485 $17,326 $18,187 $19,069 $19,972 $20,895 $21,838 $22,803 $23,788 $24,793 $25,819
23 Payments to the recycler $112,896 $118,805 $124,863 $131,069 $137,424 $143,928 $150,580 $157,381 $164,331 $171,429 $178,676 $186,072
24 Supplies $10,221 $10,773 $11,345 $11,936 $12,547 $13,179 $13,832 $14,506 $15,202 $15,920 $16,661 $17,425
25 Total Cash Out $425,602 $245,720 $258,566 $271,845 $287,066 $299,737 $317,868 $330,967 $345,044 $362,610 $377,673 $396,244
26 Net Cash Flow -$425,602 -$245,720 -$258,566 -$271,845 -$287,066 -$299,737 -$317,868 -$330,967 -$345,044 -$362,610 -$377,673 -$300,567
27 Net Financial Present Value 2.50% -$3,339,048
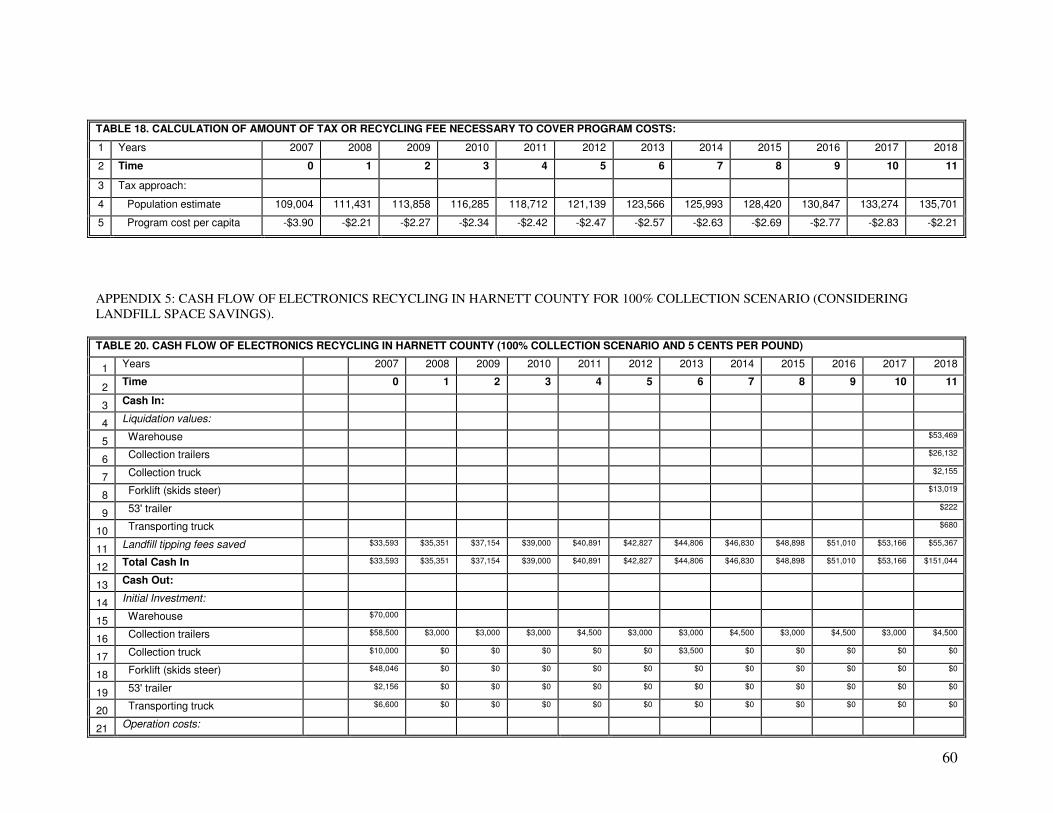
60
TABLE 18. CALCULATION OF AMOUNT OF TAX OR RECYCLING FEE NECESSARY TO COVER PROGRAM COSTS:
1 Years 2007 2008 2009 2010 2011 2012 2013 2014 2015 2016 2017 2018
2 Time 0 1 2 3 4 5 6 7 8 9 10 11
3 Tax approach:
4 Population estimate 109,004 111,431 113,858 116,285 118,712 121,139 123,566 125,993 128,420 130,847 133,274 135,701
5 Program cost per capita -$3.90 -$2.21 -$2.27 -$2.34 -$2.42 -$2.47 -$2.57 -$2.63 -$2.69 -$2.77 -$2.83 -$2.21
APPENDIX 5: CASH FLOW OF ELECTRONICS RECYCLING IN HARNETT COUNTY FOR 100% COLLECTION SCENARIO (CONSIDERING LANDFILL SPACE SAVINGS).
TABLE 20. CASH FLOW OF ELECTRONICS RECYCLING IN HARNETT COUNTY (100% COLLECTION SCENARIO AND 5 CENTS PER POUND)
1 Years 2007 2008 2009 2010 2011 2012 2013 2014 2015 2016 2017 2018
2 Time 0 1 2 3 4 5 6 7 8 9 10 11
3 Cash In:
4 Liquidation values:
5 Warehouse $53,469
6 Collection trailers $26,132
7 Collection truck $2,155
8 Forklift (skids steer) $13,019
9 53' trailer $222
10 Transporting truck $680
11 Landfill tipping fees saved $33,593 $35,351 $37,154 $39,000 $40,891 $42,827 $44,806 $46,830 $48,898 $51,010 $53,166 $55,367
12 Total Cash In $33,593 $35,351 $37,154 $39,000 $40,891 $42,827 $44,806 $46,830 $48,898 $51,010 $53,166 $151,044
13 Cash Out:
14 Initial Investment:
15 Warehouse $70,000
16 Collection trailers $58,500 $3,000 $3,000 $3,000 $4,500 $3,000 $3,000 $4,500 $3,000 $4,500 $3,000 $4,500
17 Collection truck $10,000 $0 $0 $0 $0 $0 $3,500 $0 $0 $0 $0 $0
18 Forklift (skids steer) $48,046 $0 $0 $0 $0 $0 $0 $0 $0 $0 $0 $0
19 53' trailer $2,156 $0 $0 $0 $0 $0 $0 $0 $0 $0 $0 $0
20 Transporting truck $6,600 $0 $0 $0 $0 $0 $0 $0 $0 $0 $0 $0
21 Operation costs:
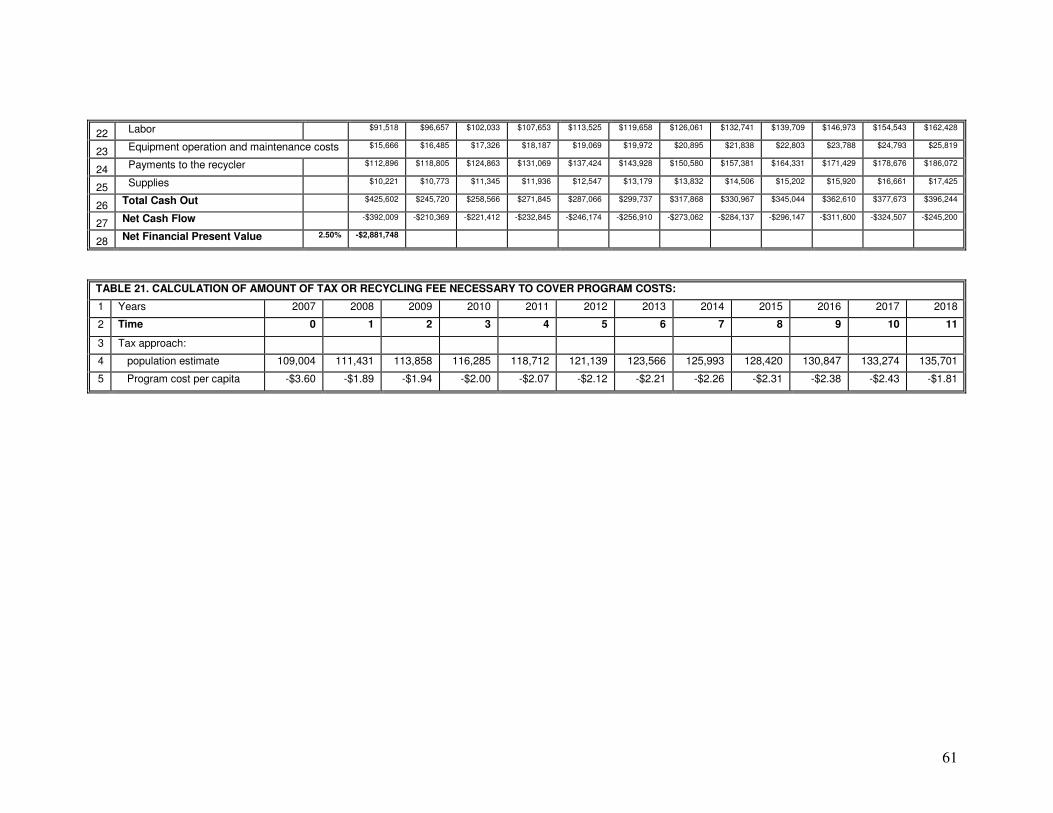
61
22 Labor $91,518 $96,657 $102,033 $107,653 $113,525 $119,658 $126,061 $132,741 $139,709 $146,973 $154,543 $162,428
23 Equipment operation and maintenance costs $15,666 $16,485 $17,326 $18,187 $19,069 $19,972 $20,895 $21,838 $22,803 $23,788 $24,793 $25,819
24 Payments to the recycler $112,896 $118,805 $124,863 $131,069 $137,424 $143,928 $150,580 $157,381 $164,331 $171,429 $178,676 $186,072
25 Supplies $10,221 $10,773 $11,345 $11,936 $12,547 $13,179 $13,832 $14,506 $15,202 $15,920 $16,661 $17,425
26 Total Cash Out $425,602 $245,720 $258,566 $271,845 $287,066 $299,737 $317,868 $330,967 $345,044 $362,610 $377,673 $396,244
27 Net Cash Flow -$392,009 -$210,369 -$221,412 -$232,845 -$246,174 -$256,910 -$273,062 -$284,137 -$296,147 -$311,600 -$324,507 -$245,200
28 Net Financial Present Value 2.50% -$2,881,748
TABLE 21. CALCULATION OF AMOUNT OF TAX OR RECYCLING FEE NECESSARY TO COVER PROGRAM COSTS:
1 Years 2007 2008 2009 2010 2011 2012 2013 2014 2015 2016 2017 2018
2 Time 0 1 2 3 4 5 6 7 8 9 10 11
3 Tax approach:
4 population estimate 109,004 111,431 113,858 116,285 118,712 121,139 123,566 125,993 128,420 130,847 133,274 135,701
5 Program cost per capita -$3.60 -$1.89 -$1.94 -$2.00 -$2.07 -$2.12 -$2.21 -$2.26 -$2.31 -$2.38 -$2.43 -$1.81