Embed Size (px)
Citation preview

1
Atrial fibrillation (AF) is the most common type of cardiac arrhythmia. In 2010, the prevalence of AF was 5.2 mil-
lion, and the incidence of AF was 1.2 million.1 Chronic AF leads to a 5-fold increase in stroke risk.2 Strokes are associated with significant morbidity and mortality, with 5-year survival rates of 50%.3 The annual cost of stroke in the United States in 2010 was estimated to be $36.5 billion.4
Guidelines for the management of AF recommend anti-coagulation for stroke prevention in patients with moderate to high stroke risk.5 Although warfarin has been the standard therapy, it has a narrow therapeutic window and requires dietary control.6 The limitations of warfarin have complicated the management of AF and encouraged the development of newer oral anticoagulants (NOACs). Since 2010, the US Food and Drug Administration has approved dabigatran (Pradaxa), apixaban (Eliquis), rivaroxaban (Xarelto), and edoxaban (Savysa) for stroke prophylaxis among patients with AF.7 In their respective clinical trials, all the NOACs have shown at
least comparable efficacy and safety with warfarin.8–11 All the NOACs have substantially higher acquisition costs than war-farin. At present, there have been several cost effectiveness studies comparing dabigatran, apixaban, rivaroxaban, and edoxaban with warfarin individually.12–26 Fewer studies have compared dabigatran, apixaban, rivaroxaban, and warfarin with each other.27–32 To the best of our knowledge, no study has compared all the alternatives from a US payer perspec-tive to each other, and none have developed models that are reflective of the US commercial population. To address these knowledge gaps, this study sought to assess the cost effective-ness of all the 5 oral anticoagulants (OACs) available in the US market for stroke prophylaxis adopting a private payer’s perspective and a lifetime horizon.
MethodsWe developed a Markov model to evaluate the cost effectiveness of dabigatran (150 mg BID), rivaroxaban (20 mg QD), apixaban (5 mg
Background and Purpose—The objective of the study is to compare the cost effectiveness of oral anticoagulants among atrial fibrillation patients at an increased stroke risk.
Methods—A Markov model was constructed to project the lifetime costs and quality-adjusted survival (QALYs) of oral anticoagulants using a private payer’s perspective. The distribution of stroke risk (CHADS
2 score: congestive heart failure,
hypertension, advanced age, diabetes mellitus, stroke) and age of the modeled population was derived from a cohort of commercially insured patients with new-onset atrial fibrillation. Probabilities of treatment specific events were derived from published clinical trials. Event and downstream costs were determined from the cost of illness studies. Drug costs were obtained from 2015 National Average Drug Acquisition Cost data.
Results—In the base case analysis, warfarin was the least costly ($46 241; 95% CI, 44 499–47 874) and apixaban had the highest QALYs (9.38; 95% CI, 9.24–9.48 QALYs). Apixaban was found to be a cost-effective strategy over warfarin (incremental cost effectiveness ratio=$25 816) and dominated other anticoagulants. Probabilistic sensitivity analysis showed that apixaban had at least a 61% chance of being the most cost effective strategy at willingness to pay value of $100 000 per QALY. Among patients with CHADS
2 ≥3, dabigatran was the dominant strategy. The model was sensitive
to efficacy estimates of apixaban, dabigatran, and edoxaban and the cost of these drugs.Conclusions—All the newer oral anticoagulants compared were more effective than adjusted dosed warfarin. Our model
showed that apixaban was the most effective anticoagulant in a general atrial fibrillation population and has an incremental cost effectiveness ratio <$50 000/QALY. For those with higher stroke risk (CHADS
2≥3), dabigatran was the most cost-
effective treatment option. (Stroke. 2016;47:00-00. DOI: 10.1161/STROKEAHA.115.012325.)
Key Words: anticoagulants ◼ atrial fibrillation ◼ cost effectiveness ◼ quality-adjusted life years ◼ stroke
Cost Effectiveness of Oral Anticoagulants for Ischemic Stroke Prophylaxis Among Nonvalvular
Atrial Fibrillation PatientsAnuj Shah, BPharm; Anand Shewale, MS; Corey J. Hayes, PharmD, MPH;
Bradley C. Martin, PharmD, PhD
Received December 4, 2015; final revision received March 9, 2016; accepted March 15, 2016.From the Division of Pharmaceutical Evaluation and Policy, University of Arkansas for Medical Sciences, Little Rock.The online-only Data Supplement is available with this article at http://stroke.ahajournals.org/lookup/suppl/doi:10.1161/STROKEAHA.
115.012325/-/DC1.Correspondence to Bradley C. Martin, PharmD, PhD, Division of Pharmaceutical Evaluation and Policy, University of Arkansas for Medical Sciences,
4301 W Markham St, Slot 522, Little Rock, AR 72205. E-mail [email protected]© 2016 American Heart Association, Inc.
Stroke is available at http://stroke.ahajournals.org DOI: 10.1161/STROKEAHA.115.012325
Original Contribution
by guest on July 4, 2018http://stroke.ahajournals.org/
Dow
nloaded from
by guest on July 4, 2018http://stroke.ahajournals.org/
Dow
nloaded from
by guest on July 4, 2018http://stroke.ahajournals.org/
Dow
nloaded from
by guest on July 4, 2018http://stroke.ahajournals.org/
Dow
nloaded from
by guest on July 4, 2018http://stroke.ahajournals.org/
Dow
nloaded from
by guest on July 4, 2018http://stroke.ahajournals.org/
Dow
nloaded from
by guest on July 4, 2018http://stroke.ahajournals.org/
Dow
nloaded from
by guest on July 4, 2018http://stroke.ahajournals.org/
Dow
nloaded from
by guest on July 4, 2018http://stroke.ahajournals.org/
Dow
nloaded from
by guest on July 4, 2018http://stroke.ahajournals.org/
Dow
nloaded from
by guest on July 4, 2018http://stroke.ahajournals.org/
Dow
nloaded from
by guest on July 4, 2018http://stroke.ahajournals.org/
Dow
nloaded from
by guest on July 4, 2018http://stroke.ahajournals.org/
Dow
nloaded from
by guest on July 4, 2018http://stroke.ahajournals.org/
Dow
nloaded from
by guest on July 4, 2018http://stroke.ahajournals.org/
Dow
nloaded from
by guest on July 4, 2018http://stroke.ahajournals.org/
Dow
nloaded from
by guest on July 4, 2018http://stroke.ahajournals.org/
Dow
nloaded from
by guest on July 4, 2018http://stroke.ahajournals.org/
Dow
nloaded from
by guest on July 4, 2018http://stroke.ahajournals.org/
Dow
nloaded from
by guest on July 4, 2018http://stroke.ahajournals.org/
Dow
nloaded from
by guest on July 4, 2018http://stroke.ahajournals.org/
Dow
nloaded from
by guest on July 4, 2018http://stroke.ahajournals.org/
Dow
nloaded from

2 Stroke June 2016
BID), edoxaban (60 mg QD), and adjusted dose warfarin. The cycle length for the model was 30 days with a lifetime horizon. The base-line model population consisted of persons with a CHADS
2 score
(congestive heart failure [1 point], hypertension [1 point], age ≥75 years [1 point], diabetes mellitus [1 point], stroke [2 points]) of ≥1. The distribution of CHADS
2 scores and their respective ages for the
baseline model population was derived from a nationally represen-tative sample of commercially insured patients with AF who were eligible to receive anticoagulant therapy.33
The model structure was adapted from the studies published by Lee et al14–16 (Figure 1). All the patients entered the model in the Well with atrial fibrillation state on an OAC and then transitioned to the other health states. We assumed that 28% of all the ischemic strokes were transient ischemic attacks, and the remaining could be 1 of 4 types: reversible, major, minor, or fatal. Intracranial hemorrhage (ICH) could be of 3 types: major, minor, and fatal. After a patient experienced an ICH or extracranial hemorrhage (ECH), anticoagu-lation was assumed to be discontinued and the patient switched to aspirin for the remainder of their lifetime. Consistent with Lee et al, we assumed that after 2 minor neurological events, patients would proceed to a major event health state and 2 major events would lead to death.14–16 To estimate net monetary benefits, we used a willing-ness to pay (WTP) threshold of $100 000 per quality-adjusted life year (QALY) based on the World Health Organization cost effective-ness guidances.34 Costs and utilities were discounted at a rate of 3% (range, 0%–5%).
Model Input ParametersKey model input parameters are provided in Table 1, and a complete list of all input parameters, their distributions, and sources are pro-vided Table I in the online-only Data Supplement.
CostsAll the costs were considered from a payer’s perspective, and we included only direct medical costs. The event costs of ICH, myo-cardial infarction (MI), stroke, and ECH and the follow-up costs of stroke, MI, and ICH were derived from AF-specific event and follow-up cost estimates.35 All event and follow-up costs were inflated using the medical component of the consumer price index to USD 2015.36 An alternate costing strategy was also used in which all the event and follow-up costs from the article of Lee et al15 were inflated to 2015 dollars.
Drug costs were estimated using the National Average Drug Acquisition cost as of April 2015 compiled by the US Medicaid program.37 To more accurately reflect a payers’ perspective in which
negotiated rebates are common when there are multiple branded products in a therapeutic category, we applied an average rebate of 23% to our National Average Drug Acquisition drug cost estimates.38 The variance estimates for drug costs were derived from the phar-macy claims of a commercial insurance database.
Health-Related Quality of Life and UtilitiesWe awarded utilities to each simulated patient to estimate QALY. Major or minor neurological events (major or minor, stroke, or ICH) were associated with a permanent disutility. ECH, MI, and minor bleed were assigned temporary disutilities. MI, ECH, and minor bleed were assigned a disutility of 30 days, 2 weeks, and 2 days, respectively.
ProbabilitiesThe stroke rates for patients on warfarin at each CHADS
2 score
were derived from the Anticoagulation and Risk Factors in Atrial Fibrillation cohort.39 Relative risks for an increase in ICH and stroke risk with every decade were based on systematic reviews and pooled analysis from clinical trials.40,41 The hazard ratios (HRs) with respect to warfarin for each of the events for the NOACs were derived from their respective clinical trials.8–11 The relative risk for each of the out-comes for aspirin in comparison with warfarin was based on a net-work meta-analysis.42
AnalysisModel development, implementation, and analysis were performed using TreeAge Pro 2015. Technical verification of the model was performed by 2 of the authors (Anuj Shah and Anand Shewale) inde-pendently constructing the initial model in TreeAge and replicating findings. For the base case analysis, we simulated a hypothetical cohort of 10 000 patients. A gamma distribution was used for all the costs, log-normal distribution for relative risk and HR, β distribution for utilities and probabilities, and a normal distribution for age.
Sensitivity AnalysesWe performed a 1-way sensitivity analysis on the influential model input parameters that were identified by visual inspection of tornado diagrams (Figures I–VIII in the online-only Data Supplement). We performed 2 probabilistic sensitivity analyses by generating 100 cohorts of 10 000 patients, 1 with the trial-based variances (base case) for NOAC efficacy and 1 with variance estimates inflated by 50% to account for potential patient heterogeneity of the NOACs pivotal trials. We also conducted a structural sensitivity analysis by making
Figure 1. Schematic representation of Mar-kov model. All patients with atrial fibrillation (AF) and increased stroke risk (CHADS2 score ≥1; congestive heart failure [1 point], hypertension [1 point], age ≥75 years [1 point], diabetes mellitus [1 point], stroke [2 points]) enter the model at varying ages depending on the age distribution of a com-mercially insured incident AF population. The cycle length is 30 d, and the model is ter-minated when 99% of the cohort dies. The transition probabilities into various health states depends on the prescribed therapy. *All patients start on an anticoagulant in well state but switch to aspirin in well state after an extracranial hemorrhage (ECH). †Myocardial infarction and ECH are tempo-rary health states. ICH indicates intracranial hemorrhage; and RIND, reversible ischemic neurological damage.
by guest on July 4, 2018http://stroke.ahajournals.org/
Dow
nloaded from

Shah et al Cost Effectiveness of Oral Anticoagulants 3
the assumption that all patients who developed an MI after an ECH or ECH after MI would stay on aspirin but acquire the monthly fol-low-up cost of MI patients. We performed a sensitivity analysis by altering the costing strategy and inflating the costs used by Lee et al.15 To test the sensitivity of our model to cost estimates of NOACs, we assigned National Average Drug Acquisition cost (without rebate) and Medispan Average Wholesale Price as the mean cost estimates in 2 separate scenarios. In addition, we performed subgroup analy-ses among patients aged <65 and ≥65 years and among patients with CHADS
2 scores of 1, 2, and ≥3.
ResultsBase CaseIn the base case analysis, apixaban had the highest QALY (9.38; 95% CI, 9.24–9.48 QALYs) followed by dabiga-tran and was lowest for warfarin (9.02; 95% CI, 8.90–9.12 QALYs; Table 2). The costs were the lowest for warfarin ($46 241; 95% CI, $44 499–$47 874) and highest for rivaroxa-ban ($58 889; 95% CI, $57 467–$60 444). After eliminating edoxaban, rivaroxaban, and dabigatran (dominated strategies), the incremental cost effectiveness ratio (ICER) for apixaban relative to warfarin was $25 816/QALY. All the NOACs had an ICER <$100 000/QALY relative to the common compara-tor warfarin.
Sensitivity AnalysisThe 1-way sensitivity analysis showed dabigatran had the highest net monetary benefit using a threshold of 100 000/QALY under the following conditions: (1) when the HRs of ICH, MI, and stroke for apixaban were above 0.46, 1.05, and 0.99, respectively; (2) when the HRs of ICH, MI, ECH, and stroke for dabigatran were below 0.36, 1.17, 0.82, and 0.70, respectively; (3) when the annual stroke rate on warfa-rin was >0.02. Edoxaban had the highest net monetary benefit when the HRs of ICH and stroke for edoxaban were below 0.38 and 0.89. To become the preferred strategies at a WTP threshold of $100 000/QALY, monthly drug costs would have to be reduced by $63 and $30 for edoxaban and dabigatran, respectively. The probabilistic sensitivity analyses for the base case scenario and the scenario with the SDs of the efficacy estimates showed that apixaban was cost-effective in 98% and 61% of the iterations, respectively, at a WTP of $100 000/QALY(Figure 2).
The structural sensitivity analysis resulted in edoxaban being extendedly dominated and dabigatran and rivaroxaban absolutely dominated. Apixaban had an ICER of $24 566 per QALY (Table 3) relative to warfarin. The alternate costing strategy based on Lee et al showed apixaban and dabigatran having an ICER <$100,000 per QALY and edoxaban and riva-roxaban were absolutely dominated (Table 3). When National Average Drug Acquisition cost and Average Wholesale Price based cost were used, apixaban dominated all other NOACs with an ICER <100 000 per QALY (Table 3).
Subgroup AnalysesIn the 2 cohorts of patients with incident AF above and below 65 years of age, all of the NOACs were absolutely or extend-edly dominated by apixaban (Table 3). For those with a CHADS
2 score of 1 or 2, apixaban was found to be cost effec-
tive at a WTP threshold of $50 000 per QALY dominating the other NOAC strategies (Table 3). For patients with a CHADS
2
score of ≥3, dabigatran dominated the other NOACs (Table 3).
DiscussionThe objective of this study was to compare and contrast the cost effectiveness of all the OACs available for stroke pro-phylaxis among patients diagnosed with atrial fibrillation in the United States. Our reference therapy was adjusted
Table 1. Key Model Input Parameters
Variable Base Case Range
Cost in 2015 monthly (US$)
Warfarin and international normalized ratio monitoring
39.00 6.00–61.00
Rivaroxaban 238.11 90.48–385.74
Dabigatran 234.28 127.59–340.98
Apixaban 234.87 124.01–345.74
Edoxaban 205.64 69.26–341.97
Rate of ischemic stroke on warfarin for different CHADS2 scores
CHADS2 score 1 0.72 NA
CHADS2 score 2 1.27 NA
CHADS2 score 3 2.00 NA
CHADS2 score 4 2.35 NA
CHADS2 score 5 and 6 4.60 NA
Efficacy of NOACs
Hazard ratios for ischemic stroke, NOACs vs warfarin
Rivaroxaban 0.94 0.75–1.17
Dabigatran 0.76 0.60–0.98
Apixaban 0.92 0.74–1.13
Edoxaban 1.00 0.75–1.19
Hazard ratios for intracranial hemorrhage, NOACs vs warfarin
Rivaroxaban 0.67 0.47–0.93
Dabigatran 0.40 0.27–0.60
Apixaban 0.42 0.30–0.58
Edoxaban 0.47 0.34–0.63
Hazard ratios for extracranial hemorrhage, NOACs vs warfarin
Rivaroxaban 1.04 0.90–1.20
Dabigatran 1.07 0.78–1.25
Apixaban 0.79 0.68–0.93
Edoxaban 0.91 0.79–1.04
Hazard ratios for myocardial infarction, NOACs vs warfarin
Rivaroxaban 0.81 0.63–1.06
Dabigatran 1.31 0.89–1.91
Apixaban 0.88 0.66–1.17
Edoxaban 0.94 0.74–1.19
CHADS2 indicates congestive heart failure (1 point), hypertension (1 point),
age ≥75 years (1 point), diabetes mellitus (1 point), stroke (2 points); NA, not applicable; and NOAC indicates newer oral anticoagulant.
by guest on July 4, 2018http://stroke.ahajournals.org/
Dow
nloaded from

4 Stroke June 2016
dose warfarin that has been identified as the standard ther-apy in AF management guidelines. Our model shows that all the NOACs are more effective than warfarin; however, the QALY difference between apixaban (most effective NOAC) and rivaroxaban (least effective NOAC) is a mod-est 50 days. In our base case scenario and across most of our sensitivity analyses, apixaban was determined to be the most cost effective strategy dominating all other strategies except warfarin. This finding was relatively robust in our base case probabilistic sensitivity analyses; however, the probabilistic sensitivity analyses that used inflated variance estimates from the pivotal trials showed considerably more uncertainty.
There are a few scenarios in which apixaban would not be the preferred anticoagulant, however. When the effective-ness of dabigatran increased or the effectiveness of apixaban decreased or the baseline rate of stroke increased, dabigatran became the most cost-effective. Similarly, the cost effec-tiveness of apixaban was also sensitive to the effectiveness estimates of edoxaban. Given the relatively modest QALY differences between NOACs and, in particular, between dabigatran, apixaban, and edoxaban, the preferred NOAC may change as more clinical data become available for the NOACs.
The prices of dabigatran and edoxaban also had a meaning-ful impact on the cost effectiveness results. If the monthly costs
Table 2. Base Case Costs, Quality-Adjusted Survival, NMB, and ICERs
Strategy
Therapies in the Order of CostWarfarin as the
Common Reference
Cost (95% CI) QALY (95% CI) ICER NMB (95% CI) ICER
Adjusted dose warfarin
$46 241 (44 499–47 874) 9.02 (8.90–9.12) 0 $856 092 (844 556–866 594) 0
Edoxaban $54 159 (52 670–55 702) 9.31 (9.16–9.40) Ext dom $876 817 (863 807–886 194) $27 643
Apixaban $55 455 (54 138–56 493) 9.38 (9.24–9.48) $25 816 $882 567 (870 327–892 217) $25 816
Dabigatran $56 425 (55 203–57 749) 9.35 (9.23–9.45) Abs dom $878 304 (867 159–887 641) $31 435
Rivaroxaban $58 889 (57 467–60 444) 9.24 (9.11–9.35) Abs dom $865 465 (853 044–875 853) $57 434
Abs dom indicates absolutely dominated; Ext dom, extendedly dominated; ICER, incremental cost effectiveness ratio; NMB, net monetary benefits; and QALY, quality-adjusted life years.
Figure 2. Cost effectiveness (CE) acceptability curve (probability that a treatment will be cost-effective at varying willingness-to-pay thresholds). The percentage of iterations that showed the particular therapy to be CE are plotted on the y-axis vs varying willingness to pay thresholds (plotted in terms of dollars a payer is willing to pay to achieve an additional quality-adjusted life-year for a patient) on the x-axis. A, Depicts the cost effectiveness acceptability curve for the base case scenario. B, The CE acceptability curve after inflating the standard deviations of the efficacy measures for the newer oral anticoagulants by 50%.
by guest on July 4, 2018http://stroke.ahajournals.org/
Dow
nloaded from
Shah et al Cost Effectiveness of Oral Anticoagulants 5
of dabigatran and edoxaban was lowered by ≈13% and 30%, respectively, the ICER for apixaban exceeds $100 000/QALY. This finding is particularly relevant for those managing formu-laries in which rebates and discounts are often negotiated.
This is the first study from a US payer perspective to com-pare all 5 OACs available in the market. There is only 1 study from the UK perspective that compares all 5 OACs simulta-neously and our findings are similar to their findings, where they also found apixaban to be the preferred therapy.43 Our base case estimates show that apixaban and edoxaban are cost effective at a WTP of $50 000/QALY, but all NOACs are con-sidered rational choices at a WTP of $100 000/QALY when compared individually with warfarin. This is in contrast with other models from the US perspective that determined NOACs to be cost effective at a WTP of $50 000/QALY.14–16,18,19,21–23,31 This could possibly be because the fact that all the other mod-els look only at patients who are aged ≥65 years, who would have higher stroke risk.
Our model improves on the previous models by mirror-ing the AF population in the United States. Other models assumed all patients start at a common age and CHADS
2
score,12,14–16,18,19,21–24,31 and we believe that our findings better represent the broad AF population that would be candidates for anticoagulation than previous studies. Another difference between our work and previous modeling studies is our cost-ing approach. The majority of previous studies have used HCUPnet and the study of Holloway et al44,45 to derive event costs of the cerebrovascular accidents (CVAs), MI, and ECH, and used the study of Leibson et al44 to derive the follow-up costs for the CVAs. These studies only consider national aver-ages and are not specific to the AF population; in addition, the studies by Leibson et al44 and Holloway et al45 were con-ducted in 1996, and the estimates based on these data are ≈20 years old and may not be reflective of current clinical care of a CVA. We used the estimates by Forrester et al35 to derive our cost estimates that report the incremental costs of CVAs
among an AF population. Forrester et al35 have used 2007 to 2011 Marketscan data that reflect the cost to private payers and would resemble more contemporary CVA management.
The results of this model should be interpreted while con-sidering the following limitations. First, the effectiveness esti-mates (probabilities and HRs) used in this model are based on clinical trials without head-to-head comparisons with durations much shorter than the lifetime horizon we modeled. To partially account for the indirect evidence from the piv-otal clinical trials, we ran a simulation with inflated variance estimates. Like previous modeling studies, we did not directly model changes in adherence for NOACs or time in therapeu-tic range for warfarin that may overestimate the QALY of all anticoagulants. The model also does not account for incident diabetes mellitus, congestive heart failure, and hypertension, which increases the CHADS
2 score over time and in turn
increases stroke risk. This may overstate QALY of all the anticoagulants, however, may differentially underestimate survival gains of anticoagulants that confer the greatest stroke risk reduction such as dabigatran. Finally, we did not make temporary states to model transitory increased risk of recur-rent events immediately after an event.
ConclusionsAll the NOACs we compared were more effective than adjusted dosed warfarin; however, the QALY among all NOACs was similar. Our model showed that apixaban had the highest QALY in a general AF population and has an ICER <$50 000/QALY. For those with higher stroke risk (CHADS
2≥3), dabi-
gatran had the highest QALY and an ICER <$50 000/QALY. Given the similarity of the QALY of most NOACs, the cost effectiveness of several strategies was sensitive to drug prices and efficacy estimates.
DisclosuresNone.
Table 3. Incremental Cost Effectiveness Ratios by Age, CHADS2 Scores, and Cost and Structural Sensitivity Analyses*
ScenarioPatients ≥
65 yPatients <65 y CHADS
2=1 CHADS
2=2 CHADS
2≥3
Alternate Costing
Scenario†AWP
Costs‡NADAC Costs§
Structural Sensitivity Analysis║
Strategies Incremental cost effectiveness ratios
Adjusted dose warfarin
… … … … … … … … …
Edoxaban Ext dom Ext dom Ext dom Ext dom Ext dom Abs dom Ext dom Ext dom Ext dom
Apixaban $13 662 $34 191 $31 580 $24 691 Abs dom $67 892 $65 332 $45 393 $24 566
Dabigatran Abs dom Abs dom Abs dom Abs dom $16 645 $1832 Abs dom Abs dom Abs dom
Rivaroxaban Abs dom Abs dom Abs dom Abs dom Abs dom Abs dom Abs dom Abs dom Abs dom
Abs dom indicates absolutely dominated; AWP, average wholesale price; CHADS2, congestive heart failure (1 point), hypertension (1 point), age ≥75
years (1 point), diabetes mellitus (1 point), stroke (2 points); Ext dom, extendedly dominated; MI, myocardial infarction; and NADAC, National Average Drug Acquisition Cost.
*For all scenarios in this table, except CHADS2 ≥3 and cost sensitivity analyses 1 therapies are in presented in increasing order of cost. For complete
cost, quality-adjusted survival and net monetary benefit information on all the scenarios please refer to the Table II in the online-only Data Supplement.†Deriving event costs by inflating costs of Lee et al.15
‡Using the Medispan AWP as mean drug cost estimates.§Using the NADAC as mean drug cost estimates.║Assigning MI follow-up costs to patients who get an MI in the post–extracranial hemorrhage phase as well.
by guest on July 4, 2018http://stroke.ahajournals.org/
Dow
nloaded from

6 Stroke June 2016
References 1. Colilla S, Crow A, Petkun W, Singer DE, Simon T, Liu X. Estimates
of current and future incidence and prevalence of atrial fibrillation in the U.S. adult population. Am J Cardiol. 2013;112:1142–1147. doi: 10.1016/j.amjcard.2013.05.063.
2. Wolf PA, Dawber TR, Thomas HE Jr, Kannel WB. Epidemiologic assess-ment of chronic atrial fibrillation and risk of stroke: the Framingham study. Neurology. 1978;28:973–977.
3. Ingall T. Stroke–incidence, mortality, morbidity and risk. J Insur Med. 2004;36:143–152.
4. Go AS, Mozaffarian D, Roger VL, Benjamin EJ, Berry JD, Blaha MJ, et al; American Heart Association Statistics Committee and Stroke Statistics Subcommittee. Heart disease and stroke statistics–2014 update: a report from the American Heart Association. Circulation. 2014;129:e28–e292. doi: 10.1161/01.cir.0000441139.02102.80.
5. January CT, Wann LS, Alpert JS, Calkins H, Cigarroa JE, Cleveland JC Jr, et al; American College of Cardiology/American Heart Association Task Force on Practice Guidelines. 2014 AHA/ACC/HRS guideline for the management of patients with atrial fibrillation: a report of the American College of Cardiology/American Heart Association Task Force on Practice Guidelines and the Heart Rhythm Society. J Am Coll Cardiol. 2014;64:e1–e76. doi: 10.1016/j.jacc.2014.03.022.
6. Gage BF, Eby C, Johnson JA, Deych E, Rieder MJ, Ridker PM, et al. Use of pharmacogenetic and clinical factors to predict the therapeutic dose of warfarin. Clin Pharmacol Ther. 2008;84:326–331. doi: 10.1038/clpt.2008.10.
7. Husten L. FDA approves new oral anticoagulant from Daiichi Sankyo. Forbes. January 8, 2015. http://www.forbes.com/sites/larry-husten/2015/01/08/fda-approves-new-oral-anticoagulant-from-daiichi-sankyo/. Accessed May 5, 2015.
8. Giugliano RP, Ruff CT, Braunwald E, Murphy SA, Wiviott SD, Halperin JL, et al; ENGAGE AF-TIMI 48 Investigators. Edoxaban versus warfarin in patients with atrial fibrillation. N Engl J Med. 2013;369:2093–2104. doi: 10.1056/NEJMoa1310907.
9. Patel MR, Mahaffey KW, Garg J, Pan G, Singer DE, Hacke W, et al; ROCKET AF Investigators. Rivaroxaban versus warfarin in nonvalvu-lar atrial fibrillation. N Engl J Med. 2011;365:883–891. doi: 10.1056/NEJMoa1009638.
10. Granger CB, Alexander JH, McMurray JJ, Lopes RD, Hylek EM, Hanna M, et al; ARISTOTLE Committees and Investigators. Apixaban versus warfarin in patients with atrial fibrillation. N Engl J Med. 2011;365:981–992. doi: 10.1056/NEJMoa1107039.
11. Connolly SJ, Ezekowitz MD, Yusuf S, Eikelboom J, Oldgren J, Parekh A, et al; RE-LY Steering Committee and Investigators. Dabigatran versus warfarin in patients with atrial fibrillation. N Engl J Med. 2009;361:1139–1151. doi: 10.1056/NEJMoa0905561.
12. Krejczy M, Harenberg J, Marx S, Obermann K, Frölich L, Wehling M. Comparison of cost-effectiveness of anticoagulation with dabigatran, rivaroxaban and apixaban in patients with non-valvular atrial fibrilla-tion across countries. J Thromb Thrombolysis. 2014;37:507–523. doi: 10.1007/s11239-013-0989-6.
13. Rognoni C, Marchetti M, Quaglini S, Liberato NL. Edoxaban versus warfarin for stroke prevention in non-valvular atrial fibrillation: a cost-effectiveness analysis. J Thromb Thrombolysis. 2015;39:149–154. doi: 10.1007/s11239-014-1104-3.
14. Lee S, Anglade MW, Meng J, Hagstrom K, Kluger J, Coleman CI. Cost-effectiveness of apixaban compared with aspirin for stroke pre-vention in atrial fibrillation among patients unsuitable for warfarin. Circ Cardiovasc Qual Outcomes. 2012;5:472–479. doi: 10.1161/CIRCOUTCOMES.112.965251.
15. Lee S, Anglade MW, Pham D, Pisacane R, Kluger J, Coleman CI. Cost-effectiveness of rivaroxaban compared to warfarin for stroke prevention in atrial fibrillation. Am J Cardiol. 2012;110:845–851. doi: 10.1016/j.amjcard.2012.05.011.
16. Lee S, Mullin R, Blazawski J, Coleman CI. Cost-effectiveness of apixa-ban compared with warfarin for stroke prevention in atrial fibrillation. PLoS One. 2012;7:e47473. doi: 10.1371/journal.pone.0047473.
17. Pink J, Lane S, Pirmohamed M, Hughes DA. Dabigatran etexilate versus warfarin in management of non-valvular atrial fibrillation in UK context: quantitative benefit-harm and economic analyses. BMJ. 2011;343:d6333.
18. Kamel H, Johnston SC, Easton JD, Kim AS. Cost-effectiveness of dabi-gatran compared with warfarin for stroke prevention in patients with atrial fibrillation and prior stroke or transient ischemic attack. Stroke. 2012;43:881–883. doi: 10.1161/STROKEAHA.111.641027.
19. Kamel H, Easton JD, Johnston SC, Kim AS. Cost-effectiveness of apix-aban vs warfarin for secondary stroke prevention in atrial fibrillation. Neurology. 2012;79:1428–1434. doi: 10.1212/WNL.0b013e31826d5fe8.
20. Sorensen SV, Kansal AR, Connolly S, Peng S, Linnehan J, Bradley-Kennedy C, et al. Cost-effectiveness of dabigatran etexilate for the pre-vention of stroke and systemic embolism in atrial fibrillation: a Canadian payer perspective. Thromb Haemost. 2011;105:908–919. doi: 10.1160/TH11-02-0089.
21. Freeman JV, Zhu RP, Owens DK, Garber AM, Hutton DW, Go AS, et al. Cost-effectiveness of dabigatran compared with warfarin for stroke prevention in atrial fibrillation. Ann Intern Med. 2011;154:1–11. doi: 10.7326/0003-4819-154-1-201101040-00289.
22. Shah SV, Gage BF. Cost-effectiveness of dabigatran for stroke pro-phylaxis in atrial fibrillation. Circulation. 2011;123:2562–2570. doi: 10.1161/CIRCULATIONAHA.110.985655.
23. You JH, Tsui KK, Wong RS, Cheng G. Cost-effectiveness of dabiga-tran versus genotype-guided management of warfarin therapy for stroke prevention in patients with atrial fibrillation. PLoS One. 2012;7:e39640. doi: 10.1371/journal.pone.0039640.
24. Mensch A, Stock S, Stollenwerk B, Müller D. Cost effectiveness of riva-roxaban for stroke prevention in German patients with atrial fibrillation. Pharmacoeconomics. 2015;33:271–283. doi: 10.1007/s40273-014-0236-9.
25. Morais J, Aguiar C, McLeod E, Chatzitheofilou I, Fonseca Santos I, Pereira S. Cost-effectiveness of rivaroxaban for stroke prevention in atrial fibrillation in the Portuguese setting. Rev Port Cardiol. 2014;33:535–544. doi: 10.1016/j.repc.2014.02.020.
26. Kleintjens J, Li X, Simoens S, Thijs V, Goethals M, Rietzschel ER, et al. Cost-effectiveness of rivaroxaban versus warfarin for stroke prevention in atrial fibrillation in the Belgian healthcare setting. Pharmacoeconomics. 2013;31:909–918. doi: 10.1007/s40273-013-0087-9.
27. Lip GY, Kongnakorn T, Phatak H, Kuznik A, Lanitis T, Liu LZ, et al. Cost-effectiveness of apixaban versus other new oral anticoagulants for stroke prevention in atrial fibrillation. Clin Ther. 2014;36:192–210.e20. doi: 10.1016/j.clinthera.2013.12.011.
28. Zheng Y, Sorensen SV, Gonschior AK, Noack H, Heinrich-Nols J, Sunderland T, et al. Comparison of the cost-effectiveness of new oral anticoagulants for the prevention of stroke and systemic embolism in atrial fibrillation in a UK setting. Clin Ther. 2014;36:2015–2028.e2. doi: 10.1016/j.clinthera.2014.09.015.
29. Lanitis T, Cotté FE, Gaudin AF, Kachaner I, Kongnakorn T, Durand-Zaleski I. Stroke prevention in patients with atrial fibrillation in France: comparative cost-effectiveness of new oral anticoagulants (apixa-ban, dabigatran, and rivaroxaban), warfarin, and aspirin. J Med Econ. 2014;17:587–598. doi: 10.3111/13696998.2014.923891.
30. Rognoni C, Marchetti M, Quaglini S, Liberato NL. Apixaban, dabiga-tran, and rivaroxaban versus warfarin for stroke prevention in non-val-vular atrial fibrillation: a cost-effectiveness analysis. Clin Drug Investig. 2014;34:9–17. doi: 10.1007/s40261-013-0144-3.
31. Harrington AR, Armstrong EP, Nolan PE Jr, Malone DC. Cost-effectiveness of apixaban, dabigatran, rivaroxaban, and warfarin for stroke prevention in atrial fibrillation. Stroke. 2013;44:1676–1681. doi: 10.1161/STROKEAHA.111.000402.
32. Wisløff T, Hagen G, Klemp M. Economic evaluation of warfarin, dabiga-tran, rivaroxaban, and apixaban for stroke prevention in atrial fibrillation. Pharmacoeconomics. 2014;32:601–612. doi: 10.1007/s40273-014-0152-z.
33. Shewale A, Johnson J, Li C, Nelsen D, Martin B. Variation in antico-agulant recommendations by the guidelines and decision tools among patients with atrial fibrillation. Healthcare. 2015;3:130–145.
34. Anderson JL, Heidenreich PA, Barnett PG, Creager MA, Fonarow GC, Gibbons RJ, et al; ACC/AHA Task Force on Performance Measures; ACC/AHA Task Force on Practice Guidelines. ACC/AHA statement on cost/value methodology in clinical practice guidelines and performance measures: a report of the American College of Cardiology/American Heart Association Task Force on Performance Measures and Task Force on Practice Guidelines. Circulation. 2014;129:2329–2345. doi: 10.1161/CIR.0000000000000042.
35. Forrester SH. Estimating the inpatient and outpatient costs of atrial fibril-lation and associated adverse events. Value Heal. 2014;17:A109.
36. CPI detailed report data for August 2015. CPI medical care component inflation rates. Beureau of Labor Statistics Web site. http://www.bls.gov/cpi/cpid1508.pdf. Accessed December 3, 2015.
37. Pharmacy drug pricing. National Average Drug Acquisition Costs. Medicaid Web site. http://www.medicaid.gov/Medicaid-CHIP-Program-Information/By-Topics/Benefits/Prescription-Drugs/Pharmacy-Pricing.html. Accessed August 10, 2015.
by guest on July 4, 2018http://stroke.ahajournals.org/
Dow
nloaded from

Shah et al Cost Effectiveness of Oral Anticoagulants 7
38. Medicaid drug rebate program. Medicaid Web site. http://www.med-icaid.gov/Medicaid-CHIP-Program-Information/By-Topics/Benefits/Prescription-Drugs/Medicaid-Drug-Rebate-Program.html. Accessed May 10, 2015.
39. Go AS, Hylek EM, Chang Y, Phillips KA, Henault LE, Capra AM, et al. Anticoagulation therapy for stroke prevention in atrial fibrillation: how well do randomized trials translate into clinical practice? JAMA. 2003;290:2685–2692. doi: 10.1001/jama.290.20.2685.
40. Risk factors for stroke and efficacy of antithrombotic therapy in atrial fibrillation. Arch Intern Med. 1994;154:1449–1457.
41. Ariesen MJ, Claus SP, Rinkel GJ, Algra A. Risk factors for intrace-rebral hemorrhage in the general population: a systematic review. Stroke. 2003;34:2060–2065. doi: 10.1161/01.STR.0000080678. 09344.8D.
42. Roskell NS, Lip GY, Noack H, Clemens A, Plumb JM. Treatments for stroke prevention in atrial fibrillation: a network meta-analysis and indirect comparisons versus dabigatran etexilate. Thromb Haemost. 2010;104:1106–1115. doi: 10.1160/TH10-10-0642.
43. Janzic A, Kos M. Cost effectiveness of novel oral anticoagulants for stroke prevention in atrial fibrillation depending on the quality of warfa-rin anticoagulation control. Pharmacoeconomics. 2015;33:395–408. doi: 10.1007/s40273-014-0246-7.
44. Leibson CL, Hu T, Brown RD, Hass SL, O’Fallon WM, Whisnant JP. Utilization of acute care services in the year before and after first stroke: A population-based study. Neurology. 1996;46:861–869.
45. Holloway RG, Witter DM Jr, Lawton KB, Lipscomb J, Samsa G. Inpatient costs of specific cerebrovascular events at five academic medi-cal centers. Neurology. 1996;46:854–860.
by guest on July 4, 2018http://stroke.ahajournals.org/
Dow
nloaded from

Anuj Shah, Anand Shewale, Corey J. Hayes and Bradley C. MartinNonvalvular Atrial Fibrillation Patients
Cost Effectiveness of Oral Anticoagulants for Ischemic Stroke Prophylaxis Among
Print ISSN: 0039-2499. Online ISSN: 1524-4628 Copyright © 2016 American Heart Association, Inc. All rights reserved.
is published by the American Heart Association, 7272 Greenville Avenue, Dallas, TX 75231Stroke published online April 21, 2016;Stroke.
http://stroke.ahajournals.org/content/early/2016/04/21/STROKEAHA.115.012325World Wide Web at:
The online version of this article, along with updated information and services, is located on the
http://stroke.ahajournals.org/content/suppl/2017/07/10/STROKEAHA.115.012325.DC2 http://stroke.ahajournals.org/content/suppl/2016/04/20/STROKEAHA.115.012325.DC1
Data Supplement (unedited) at:
http://stroke.ahajournals.org//subscriptions/
is online at: Stroke Information about subscribing to Subscriptions:
http://www.lww.com/reprints Information about reprints can be found online at: Reprints:
document. Permissions and Rights Question and Answer process is available in the
Request Permissions in the middle column of the Web page under Services. Further information about thisOnce the online version of the published article for which permission is being requested is located, click
can be obtained via RightsLink, a service of the Copyright Clearance Center, not the Editorial Office.Strokein Requests for permissions to reproduce figures, tables, or portions of articles originally publishedPermissions:
by guest on July 4, 2018http://stroke.ahajournals.org/
Dow
nloaded from

SUPPLEMENTAL MATERIAL
Title: Supplemental Data Tables for Cost effectiveness of Oral Anticoagulants for ischemic
stroke prophylaxis among patients with Nonvalvular Atrial Fibrillation.
Authors: Anuj Shah, B.Pharm*
Anand Shewale, MS*
Corey J. Hayes, PharmD, MPH*
Bradley C. Martin, PharmD, PhD*
Cover Title: Cost Effectiveness of Oral Anticoagulants
Indexing Terms: Cost-Effectiveness Atrial Fibrilation Stroke Anticoagulants Markov
model
Subject terms: Cost-Effectiveness Ischemic Stroke Anticoagulants
*Division of Pharmaceutical Evaluation and Policy, University of Arkansas for Medical Sciences

Supplemental Table I. Model parameters and ranges used in base model.
Variable Base Case Range Distributions Sources
Cost in 2015 (US$)
Total cost of warfarin and international normalized
ratio monitoring, monthly
39 6.00–61.00 Gamma 1
Rivaroxaban, monthly 238.11 90.48–385.74 Gamma 2,3
Dabigatran, monthly 234.28 127.59–340.98 Gamma 2,3
Apixaban, monthly 234.87 124.01–345.74 Gamma 2,3
Aspirin, monthly 0.60 0.15–6.00 Gamma 1
Edoxaban, monthly 205.64 69.26–341.97 Gamma 2,3
Event cost of minor stroke 19,007 16,891–21,124 Gamma 4
Monthly cost of minor stroke 813 212–1,414 Gamma 4
Event cost of moderate to severe stroke 30,046 26,700–33,392 Gamma 4
Monthly cost of moderate to severe stroke 1,285 334–2,235 Gamma 4
Event cost of reversible ischemic neurologic event 11,422 10,151–12,695 Gamma 4
Event cost of intracranial hemorrhage 46,252 33,150–59,356 Gamma 4
Monthly cost of intracranial hemorrhage 3,000 157–5,842 Gamma 4
Monthly cost of stroke and intracranial hemorrhage 3,809 200–7,419 Gamma 4
Event cost of extracranial hemorrhage 15,154 12,872–17,435 Gamma 4
Event cost of clinically relevant nonmajor bleeding 43 0–210 Gamma 1
Event cost of myocardial infarction 33,262 29,839–36,686 Gamma 4
Monthly cost of myocardial infarction 568 534–1,868 Gamma 4
Event cost of nonevent death 6,261 3,674–7,873 Gamma 1
Annual discount rate (%) 3 0–5 Beta Assumed
Utility
Healthy on warfarin (Annual) 0.987 0.940–1.000 Beta 5
Healthy on rivaroxaban, dabigatran, apixaban or
edoxaban (Annual)
0.994 0.975–1.000 Beta 6
Healthy on aspirin (Annual) 0.998 0.994–1.000 Beta 5
Major neurologic event (Annual) 0.390 0–1.000 Beta 5
Minor neurologic event (Annual) 0.760 0–1.000 Beta 5
Disutility of Non-ICH bleed event (Annual) -0.160 -0.300 to 0 Beta 7
Myocardial infarction (Annual) 0.840 0.500–1 Beta 8
Probabilities
Baseline rate of stroke on warfarin (%/year)
(CHADS2 score 1)
0.72 N/A* 9
Baseline rate of stroke on warfarin (%/year)
(CHADS2 score 2)
1.27 N/A* 9
Baseline rate of stroke on warfarin (%/year)
(CHADS2 score 3)
2.00 N/A* 9
Baseline rate of stroke on warfarin (%/year)
(CHADS2 score 4)
2.35 N/A* 9

Baseline rate of stroke on warfarin (%/year)
(CHADS2 score 5 & 6)
4.60 N/A* 9
Hazard ratio of stroke on rivaroxaban 0.94 0.75–1.17 Log-Normal 10
Hazard ratio of stroke on dabigatran 0.76 0.60–0.98 Log-Normal 11
Hazard ratio of stroke on apixaban 0.92 0.74–1.13 Log-Normal 12
Hazard ratio of stroke on Edoxaban 1.00 0.75–1.19 Log-Normal 13
Proportions of ischemic strokes with warfarin,
dabigatran, Apixaban, Edoxaban or rivaroxaban (%)
1,14–17
Fatal 8.20 8.20–10.10 Beta
Major 40.20 40.20–41.70 Beta
Minor 42.50 34.80–42.50 Beta
No residual deficit 9.10 9.10–13.30 Beta
Relative risk of stroke per 10 years of life 1.40 N/A 18
Relative risk of stroke for aspirin 2.08 1.59–2.70 Log-Normal 19
Proportions of ischemic strokes with aspirin (%) 1,14–16
Fatal 17.90 10.10–17.90 Beta
Major 30.00 30.00–41.10 Beta
Minor 41.00 34.80–41.00 Beta
No residual deficit 11.00 11.00–13.30 Beta
Baseline rate of intracranial hemorrhage on warfarin
(%/year)
0.70 0.59–0.90 Beta 10
Relative risk of intracranial hemorrhage per 10 years
of life
1.97 N/A* 20
Hazard ratio of intracranial hemorrhage on
Rivaroxaban
0.67 0.47–0.93 Log-Normal 10
Hazard ratio of intracranial hemorrhage on
Dabigatran
0.40 0.27 – 0.60 Log-Normal 11
Hazard ratio of intracranial hemorrhage on Apixaban 0.42 0.30–0.58 Log-Normal 12
Hazard ratio of intracranial hemorrhage on Edoxaban 0.47 0.34-0.63 Log-Normal 13
Relative risk of intracranial hemorrhage on aspirin 0.51 0.16–1.60 Log-Normal 21
Proportions of intracranial hemorrhage with
warfarin, rivaroxaban, dabigatran, apixaban,
Edoxaban and aspirin (%)
22
Fatal 36.40 28.30–45.20 Beta
Major 14.10 9.00–21.40 Beta
Minor 49.50 N/A*
Baseline rate of extracranial hemorrhage on warfarin
(%/year)
2.70 2.35–2.93 Beta 10
Hazard ratio of extracranial hemorrhage on
Rivaroxaban
1.04 0.90–1.20 Log-Normal 10
Hazard ratio of extracranial hemorrhage on
Dabigatran
1.07 0.78–1.25 Log-Normal 11
Hazard ratio of extracranial hemorrhage on Apixaban 0.79 0.68–0.93 Log-Normal 12
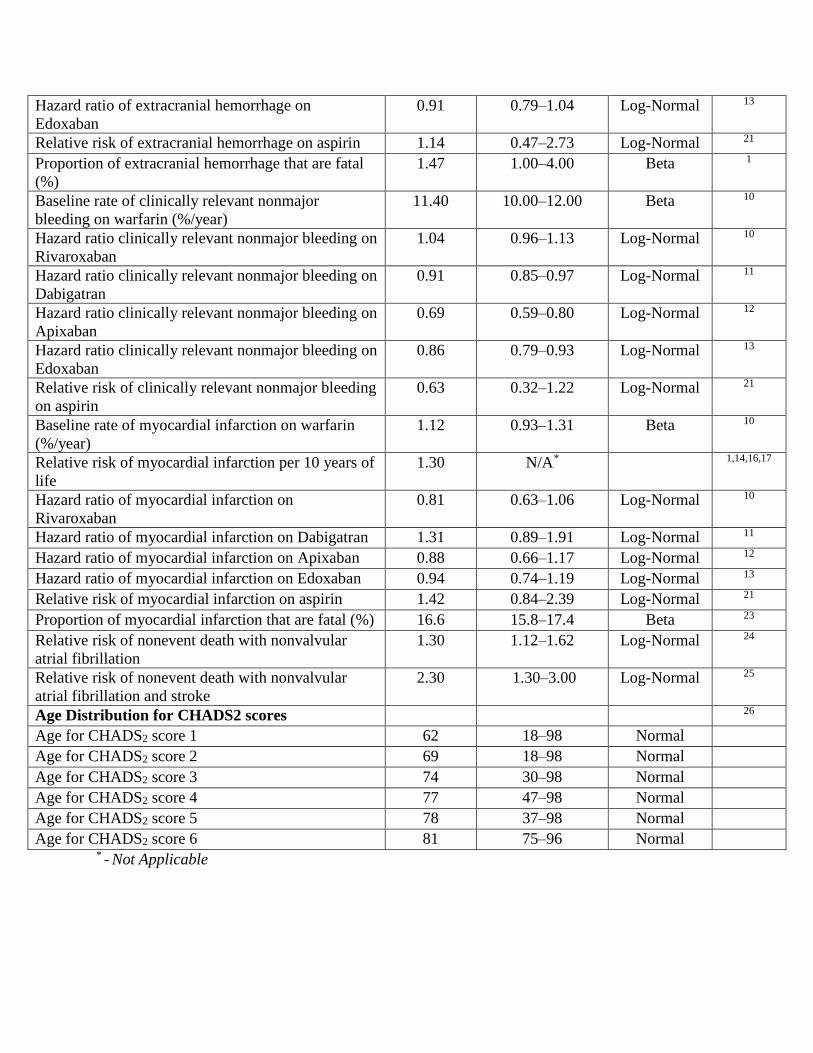
Hazard ratio of extracranial hemorrhage on
Edoxaban
0.91 0.79–1.04 Log-Normal 13
Relative risk of extracranial hemorrhage on aspirin 1.14 0.47–2.73 Log-Normal 21
Proportion of extracranial hemorrhage that are fatal
(%)
1.47 1.00–4.00 Beta 1
Baseline rate of clinically relevant nonmajor
bleeding on warfarin (%/year)
11.40 10.00–12.00 Beta 10
Hazard ratio clinically relevant nonmajor bleeding on
Rivaroxaban
1.04 0.96–1.13 Log-Normal 10
Hazard ratio clinically relevant nonmajor bleeding on
Dabigatran
0.91 0.85–0.97 Log-Normal 11
Hazard ratio clinically relevant nonmajor bleeding on
Apixaban
0.69 0.59–0.80 Log-Normal 12
Hazard ratio clinically relevant nonmajor bleeding on
Edoxaban
0.86 0.79–0.93 Log-Normal 13
Relative risk of clinically relevant nonmajor bleeding
on aspirin
0.63 0.32–1.22 Log-Normal 21
Baseline rate of myocardial infarction on warfarin
(%/year)
1.12 0.93–1.31 Beta 10
Relative risk of myocardial infarction per 10 years of
life
1.30 N/A* 1,14,16,17
Hazard ratio of myocardial infarction on
Rivaroxaban
0.81 0.63–1.06 Log-Normal 10
Hazard ratio of myocardial infarction on Dabigatran 1.31 0.89–1.91 Log-Normal 11
Hazard ratio of myocardial infarction on Apixaban 0.88 0.66–1.17 Log-Normal 12
Hazard ratio of myocardial infarction on Edoxaban 0.94 0.74–1.19 Log-Normal 13
Relative risk of myocardial infarction on aspirin 1.42 0.84–2.39 Log-Normal 21
Proportion of myocardial infarction that are fatal (%) 16.6 15.8–17.4 Beta 23
Relative risk of nonevent death with nonvalvular
atrial fibrillation
1.30 1.12–1.62 Log-Normal 24
Relative risk of nonevent death with nonvalvular
atrial fibrillation and stroke
2.30 1.30–3.00 Log-Normal 25
Age Distribution for CHADS2 scores 26
Age for CHADS2 score 1 62 18–98 Normal
Age for CHADS2 score 2 69 18–98 Normal
Age for CHADS2 score 3 74 30–98 Normal
Age for CHADS2 score 4 77 47–98 Normal
Age for CHADS2 score 5 78 37–98 Normal
Age for CHADS2 score 6 81 75–96 Normal * - Not Applicable

References
1. Lee S, Anglade MW, Pham D, Pisacane R, Kluger J, Coleman CI. Cost-effectiveness of
rivaroxaban compared to warfarin for stroke prevention in atrial fibrillation. Am J Cardiol.
2012;110:845–51.
2. Pharmacy Drug Pricing | Medicaid.gov. Available at: http://www.medicaid.gov/Medicaid-
CHIP-Program-Information/By-Topics/Benefits/Prescription-Drugs/Pharmacy-
Pricing.html. Accessed August 10, 2015.
3. Medicaid Drug Rebate Program | Medicaid.gov. Available at:
http://www.medicaid.gov/Medicaid-CHIP-Program-Information/By-
Topics/Benefits/Prescription-Drugs/Medicaid-Drug-Rebate-Program.html. Accessed May
10, 2015.
4. Forrester SH, Devine EB, Sullivan SD. Estimating The Inpatient And Outpatient Costs Of
Atrial Fibrillation And Associated Adverse Events. Value Heal. 2014;17:A109.
("Abstract")
5. Gage BF, Cardinalli AB, Owens DK. The effect of stroke and stroke prophylaxis with
aspirin or warfarin on quality of life. Arch Intern Med. 1996;156:1829–36.
6. Krejczy M, Harenberg J, Marx S, Obermann K, Frölich L, Wehling M. Comparison of
cost-effectiveness of anticoagulation with dabigatran, rivaroxaban and apixaban in
patients with non-valvular atrial fibrillation across countries. J Thromb Thrombolysis.
2014;37:507–23.
7. Thomson R, Parkin D, Eccles M, Sudlow M, Robinson A. Decision analysis and
guidelines for anticoagulant therapy to prevent stroke in patients with atrial fibrillation.
Lancet (London, England). 2000;355:956–62.
8. Sullivan PW, Ghushchyan V. Preference-Based EQ-5D index scores for chronic
conditions in the United States. Med Decis Making. 26:410–20.
9. Go AS, Hylek EM, Chang Y, Phillips KA, Henault LE, Capra AM, et al. Anticoagulation
therapy for stroke prevention in atrial fibrillation: how well do randomized trials translate
into clinical practice? JAMA. 2003;290:2685–92.
10. Patel MR, Mahaffey KW, Garg J, Pan G, Singer DE, Hacke W, et al. Rivaroxaban versus
warfarin in nonvalvular atrial fibrillation. N Engl J Med. 2011;365:883–91.
11. Connolly SJ, Ezekowitz MD, Yusuf S, Eikelboom J, Oldgren J, Parekh A, et al.
Dabigatran versus warfarin in patients with atrial fibrillation. N Engl J Med.
2009;361:1139–51.
12. Granger CB, Alexander JH, McMurray JJ V, Lopes RD, Hylek EM, Hanna M,et al.
Apixaban versus warfarin in patients with atrial fibrillation. N Engl J Med. 2011;365:981–
92.
13. Giugliano RP, Ruff CT, Braunwald E, Murphy SA, Wiviott SD, Halperin JL, et al.
Edoxaban versus warfarin in patients with atrial fibrillation. N Engl J Med.
2013;369:2093–104.

14. Lee S, Mullin R, Blazawski J, Coleman CI. Cost-effectiveness of apixaban compared with
warfarin for stroke prevention in atrial fibrillation. PLoS One. 2012;7:e47473.
15. O’Brien CL. Costs and Effectiveness of Ximelagatran for Stroke Prophylaxis in Chronic
Atrial Fibrillation. JAMA. 2005;293:699.
16. Lee S, Anglade MW, Meng J, Hagstrom K, Kluger J, Coleman CI. Cost-effectiveness of
apixaban compared with aspirin for stroke prevention in atrial fibrillation among patients
unsuitable for warfarin. Circ Cardiovasc Qual Outcomes. 2012;5:472–9.
17. Freeman J V., Zhu RP, Owens DK, Garber AM, Hutton DW, Go AS, et al. Cost-
Effectiveness of Dabigatran Compared With Warfarin for Stroke Prevention in Atrial
Fibrillation. Ann Intern Med. 2011;154:1.
18. Risk Factors for Stroke and Efficacy of Antithrombotic Therapy in Atrial Fibrillation.
Arch Intern Med. 1994;154:1449.
19. van Walraven C, Hart RG, Singer DE, Laupacis A., Connolly S., Petersen P.,et al. Oral
anticoagulants vs aspirin in nonvalvular atrial fibrillation: an individual patient meta-
analysis. JAMA. 2002;288:2441–8.
20. Ariesen MJ, Claus SP, Rinkel GJE, Algra A. Risk factors for intracerebral hemorrhage in
the general population: a systematic review. Stroke. 2003;34:2060–5.
21. Roskell NS, Lip GYH, Noack H, Clemens A, Plumb JM. Treatments for stroke prevention
in atrial fibrillation: a network meta-analysis and indirect comparisons versus dabigatran
etexilate. Thromb Haemost. 2010;104:1106–15.
22. Hylek EM. Risk Factors for Intracranial Hemorrhage in Outpatients Taking Warfarin. Ann
Intern Med. 1994;120:897.
23. Krumholz HM, Merrill AR, Schone EM, Schreiner GC, Chen J., Bradley E.H.,
et al. Patterns of hospital performance in acute myocardial infarction and heart failure 30-
day mortality and readmission. Circ Cardiovasc Qual Outcomes. 2009;2:407–13.
24. Dries DL, Exner D V, Gersh BJ, Domanski MJ, Waclawiw MA, Stevenson LW. Atrial
fibrillation is associated with an increased risk for mortality and heart failure progression
in patients with asymptomatic and symptomatic left ventricular systolic dysfunction: a
retrospective analysis of the SOLVD trials. Studies of Left Ventric. J Am Coll Cardiol.
1998;32:695–703.
25. Dennis MS, Burn JP, Sandercock PA, Bamford JM, Wade DT, Warlow CP. Long-term
survival after first-ever stroke: the Oxfordshire Community Stroke Project. Stroke.
1993;24:796–800.
26. Shewale A, Johnson J, Li C, Nelsen D, Martin B. Variation in Anticoagulant
Recommendations by the Guidelines and Decision Tools among Patients with Atrial
Fibrillation. Healthcare. 2015;3:130–145.
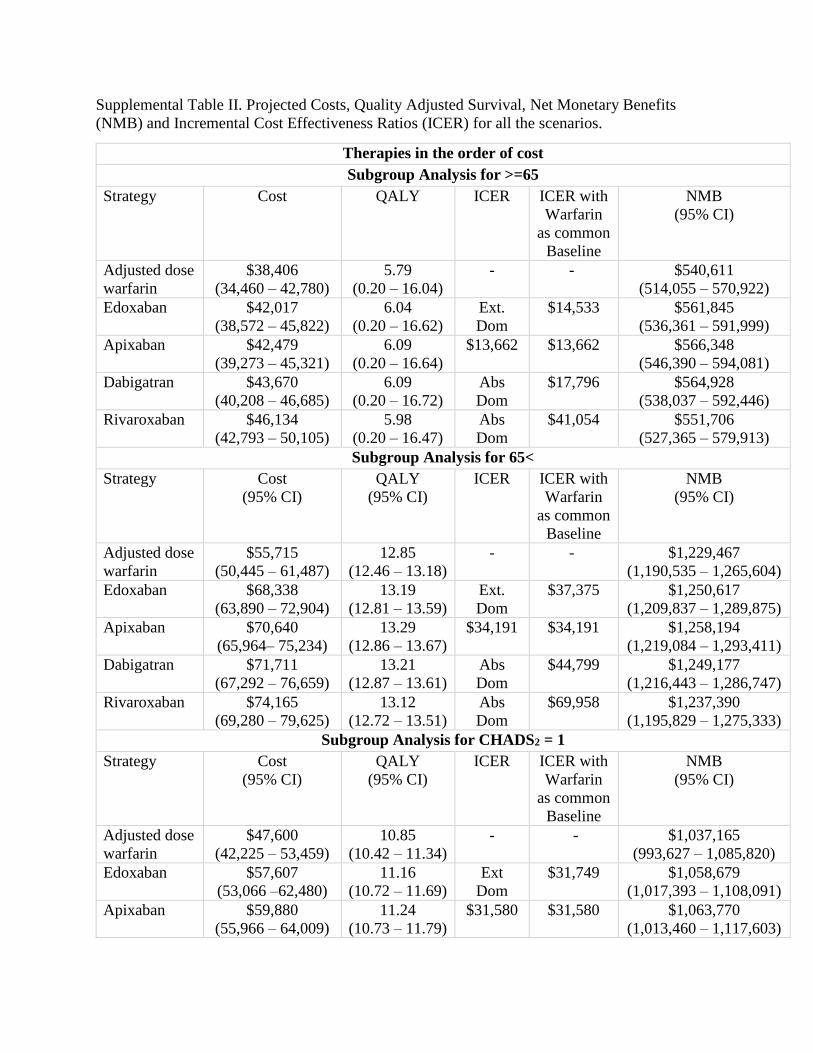
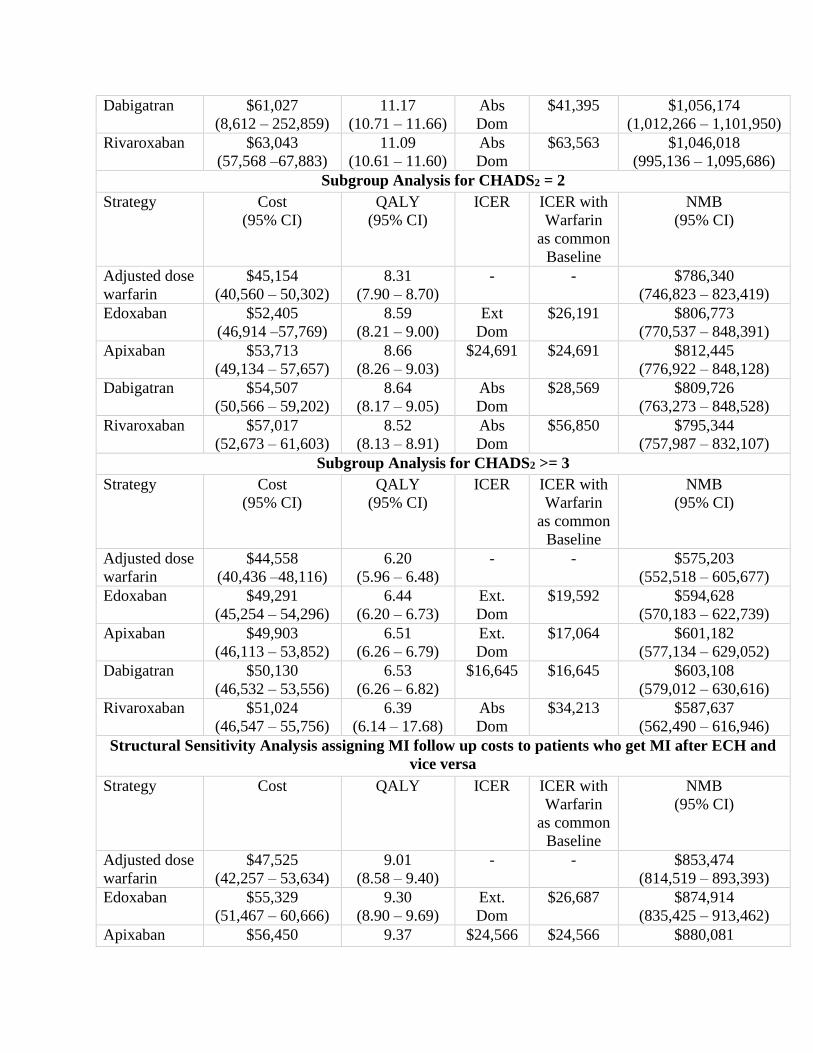
Supplemental Table II. Projected Costs, Quality Adjusted Survival, Net Monetary Benefits
(NMB) and Incremental Cost Effectiveness Ratios (ICER) for all the scenarios.
Therapies in the order of cost
Subgroup Analysis for >=65
Strategy Cost QALY ICER ICER with
Warfarin
as common
Baseline
NMB
(95% CI)
Adjusted dose
warfarin
$38,406
(34,460 – 42,780)
5.79
(0.20 – 16.04)
- - $540,611
(514,055 – 570,922)
Edoxaban $42,017
(38,572 – 45,822)
6.04
(0.20 – 16.62)
Ext.
Dom
$14,533 $561,845
(536,361 – 591,999)
Apixaban $42,479
(39,273 – 45,321)
6.09
(0.20 – 16.64)
$13,662 $13,662 $566,348
(546,390 – 594,081)
Dabigatran $43,670
(40,208 – 46,685)
6.09
(0.20 – 16.72)
Abs
Dom
$17,796 $564,928
(538,037 – 592,446)
Rivaroxaban $46,134
(42,793 – 50,105)
5.98
(0.20 – 16.47)
Abs
Dom
$41,054 $551,706
(527,365 – 579,913)
Subgroup Analysis for 65<
Strategy Cost
(95% CI)
QALY
(95% CI)
ICER ICER with
Warfarin
as common
Baseline
NMB
(95% CI)
Adjusted dose
warfarin
$55,715
(50,445 – 61,487)
12.85
(12.46 – 13.18)
- - $1,229,467
(1,190,535 – 1,265,604)
Edoxaban $68,338
(63,890 – 72,904)
13.19
(12.81 – 13.59)
Ext.
Dom
$37,375 $1,250,617
(1,209,837 – 1,289,875)
Apixaban $70,640
(65,964– 75,234)
13.29
(12.86 – 13.67)
$34,191 $34,191 $1,258,194
(1,219,084 – 1,293,411)
Dabigatran $71,711
(67,292 – 76,659)
13.21
(12.87 – 13.61)
Abs
Dom
$44,799 $1,249,177
(1,216,443 – 1,286,747)
Rivaroxaban $74,165
(69,280 – 79,625)
13.12
(12.72 – 13.51)
Abs
Dom
$69,958 $1,237,390
(1,195,829 – 1,275,333)
Subgroup Analysis for CHADS2 = 1
Strategy Cost
(95% CI)
QALY
(95% CI)
ICER ICER with
Warfarin
as common
Baseline
NMB
(95% CI)
Adjusted dose
warfarin
$47,600
(42,225 – 53,459)
10.85
(10.42 – 11.34)
- - $1,037,165
(993,627 – 1,085,820)
Edoxaban $57,607
(53,066 –62,480)
11.16
(10.72 – 11.69)
Ext
Dom
$31,749 $1,058,679
(1,017,393 – 1,108,091)
Apixaban $59,880
(55,966 – 64,009)
11.24
(10.73 – 11.79)
$31,580 $31,580 $1,063,770
(1,013,460 – 1,117,603)
Dabigatran $61,027
(8,612 – 252,859)
11.17
(10.71 – 11.66)
Abs
Dom
$41,395 $1,056,174
(1,012,266 – 1,101,950)
Rivaroxaban $63,043
(57,568 –67,883)
11.09
(10.61 – 11.60)
Abs
Dom
$63,563 $1,046,018
(995,136 – 1,095,686)
Subgroup Analysis for CHADS2 = 2
Strategy Cost
(95% CI)
QALY
(95% CI)
ICER ICER with
Warfarin
as common
Baseline
NMB
(95% CI)
Adjusted dose
warfarin
$45,154
(40,560 – 50,302)
8.31
(7.90 – 8.70)
- - $786,340
(746,823 – 823,419)
Edoxaban $52,405
(46,914 –57,769)
8.59
(8.21 – 9.00)
Ext
Dom
$26,191 $806,773
(770,537 – 848,391)
Apixaban $53,713
(49,134 – 57,657)
8.66
(8.26 – 9.03)
$24,691 $24,691 $812,445
(776,922 – 848,128)
Dabigatran $54,507
(50,566 – 59,202)
8.64
(8.17 – 9.05)
Abs
Dom
$28,569 $809,726
(763,273 – 848,528)
Rivaroxaban $57,017
(52,673 – 61,603)
8.52
(8.13 – 8.91)
Abs
Dom
$56,850 $795,344
(757,987 – 832,107)
Subgroup Analysis for CHADS2 >= 3
Strategy Cost
(95% CI)
QALY
(95% CI)
ICER ICER with
Warfarin
as common
Baseline
NMB
(95% CI)
Adjusted dose
warfarin
$44,558
(40,436 –48,116)
6.20
(5.96 – 6.48)
- - $575,203
(552,518 – 605,677)
Edoxaban $49,291
(45,254 – 54,296)
6.44
(6.20 – 6.73)
Ext.
Dom
$19,592 $594,628
(570,183 – 622,739)
Apixaban $49,903
(46,113 – 53,852)
6.51
(6.26 – 6.79)
Ext.
Dom
$17,064 $601,182
(577,134 – 629,052)
Dabigatran $50,130
(46,532 – 53,556)
6.53
(6.26 – 6.82)
$16,645 $16,645 $603,108
(579,012 – 630,616)
Rivaroxaban $51,024
(46,547 – 55,756)
6.39
(6.14 – 17.68)
Abs
Dom
$34,213 $587,637
(562,490 – 616,946)
Structural Sensitivity Analysis assigning MI follow up costs to patients who get MI after ECH and
vice versa
Strategy Cost QALY ICER ICER with
Warfarin
as common
Baseline
NMB
(95% CI)
Adjusted dose
warfarin
$47,525
(42,257 – 53,634)
9.01
(8.58 – 9.40)
- - $853,474
(814,519 – 893,393)
Edoxaban $55,329
(51,467 – 60,666)
9.30
(8.90 – 9.69)
Ext.
Dom
$26,687 $874,914
(835,425 – 913,462)
Apixaban $56,450 9.37 $24,566 $24,566 $880,081

(52,394 –61,827) (8.98 – 9.77) (841,019 – 920,551)
Dabigatran $58,261
(54,309 – 62,114)
9.34
(8.89 – 9.74)
Abs
Dom
$32,785 $875,485
(832,600 – 913,308)
Rivaroxaban $60,365
(55,415 – 66,130)
9.23
(8.84 – 9.61)
Abs
Dom
$57,512 $862,960
(824,471 – 902,205)
Alternate Costing Scenario 1 - Using Inflated Costs of Lee et al
Strategy Cost
(95% CI)
QALY ICER ICER with
Warfarin
as common
Baseline
NMB
(95% CI)
Adjusted dose
warfarin
$71,195
(59,713 – 82,260)
9.04
(8.71 – 9.35)
- - $833,126
(795,355 –862,584)
Dabigatran $71,775
(62,760 – 80,065)
9.36
(8.98 – 9.65)
$1,832 $1,832 $864,195
(826,276 –893,543)
Apixaban $74,234
(65,190 – 85,677)
9.40
(9.03 – 9.76)
$67,892 $8,617 $865,358
(828,164 –906,741)
Edoxaban $79,696
(7,865 – 91,392)
9.33
(8.97 – 9.67)
Abs
Dom
$29,884 $853,071
(818,076 - 890,758)
Rivaroxaban $80,474
(71,504 – 91,183)
9.26
(8.90 – 9.58)
Abs
Dom
$42,746 $845,554
(812,315 – 875,000)
Alternate Costing Scenario 2 – Using NADAC costs for NOACs
Strategy Cost
(95% CI)
QALY
(95% CI)
ICER ICER with
Warfarin
as common
Baseline
NMB
(95% CI)
Adjusted dose
warfarin
$46,196
(41,460 –50,799)
9.05
(8.58 – 9.48)
-
- $859,092
(818,302 – 901,625)
Edoxaban $59,757
(53,083 – 63,670)
9.34
(8.91 – 9.74)
Ext.
Dom
$46,912 $874,438
(832,651 – 912,631)
Apixaban $62,452
(57,401 – 66,818)
9.41
(8.92 – 9.81)
$45,393 $45,393 $878,647
(836,725 – 917,308)
Dabigatran $62,774
(58,493 – 66,553)
9.37
(8.94 – 9.80)
Abs
Dom
$51,570 $874,660
(833,873 – 915,034)
Rivaroxaban $65,416
(60,053 – 69,672)
9.28
(8.84 – 9.74)
Abs
Dom
$85,999 $862,221
(821,171 – 906,534)
Alternate Costing Scenario 3 – Using AWP costs for NOACs
Strategy Cost
(95% CI)
QALY
(95% CI)
ICER ICER with
Warfarin
as common
Baseline
NMB
(95% CI)
Adjusted dose
warfarin
$46,196
(41,460 – 50,799)
9.05
(8.58 – 9.48)
-
- $859,092
(818,302 – 901,625)
Edoxaban $65,977
(60,547 – 69,583)
9.34
(8.92 – 9.74)
Ext
Dom
$68,384 $868,237
(827,662 – 906,881)
Dabigatran $69,544 9.37 Ext $72,630 $867,890

(64,989 – 73,509) (8.94 – 9.80) Dom (827,331 – 907,890)
Apixaban $69,592
(64,269 – 74,186)
9.41
(8.92 – 9.81)
$65,332 $65,332 $871,507
(829,754 – 909,648)
Rivaroxaban $71,685
(66,033 – 75,883)
9.28
(8.84 – 9.74)
Abs
Dom
$114,049 $855,952
(815,197 – 900,082)
Ext Dom – Extendedly Dominated
Abs Dom – Absolutely Dominated
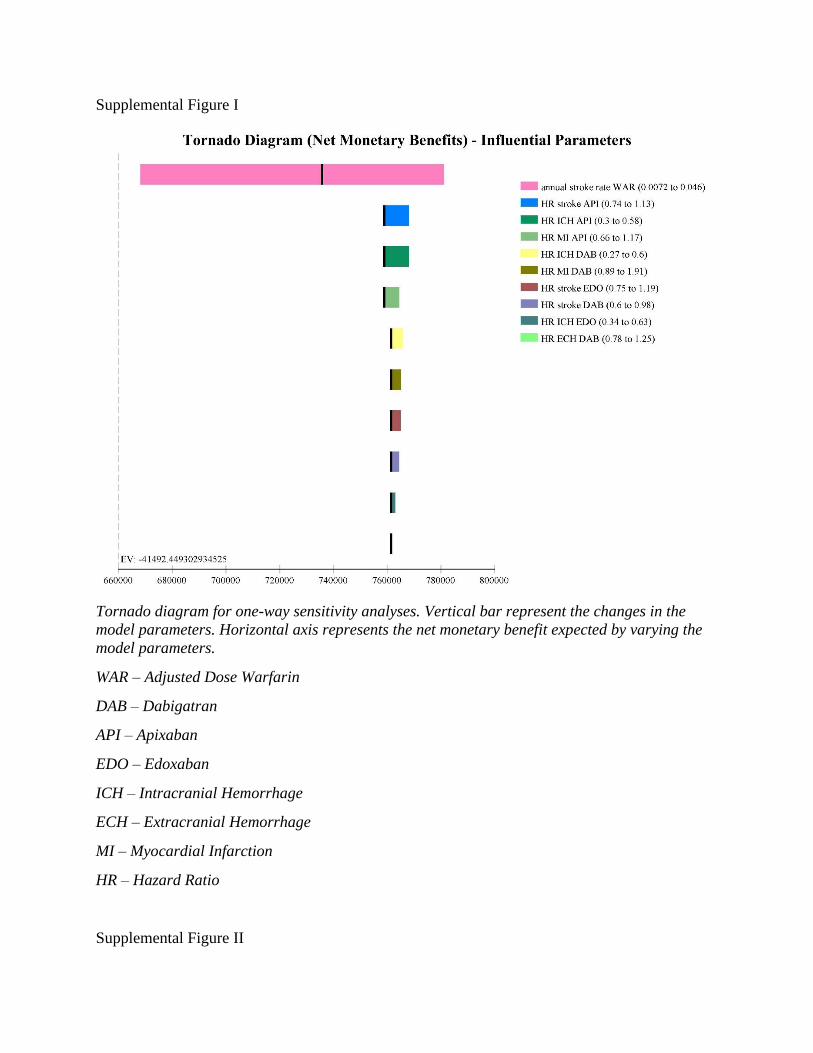
Supplemental Figure I
Tornado diagram for one-way sensitivity analyses. Vertical bar represent the changes in the
model parameters. Horizontal axis represents the net monetary benefit expected by varying the
model parameters.
WAR – Adjusted Dose Warfarin
DAB – Dabigatran
API – Apixaban
EDO – Edoxaban
ICH – Intracranial Hemorrhage
ECH – Extracranial Hemorrhage
MI – Myocardial Infarction
HR – Hazard Ratio
Supplemental Figure II

Tornado diagram for one-way sensitivity analyses of all utility parameters. We had programmed
some of the utility parameters as disutilities (Bleed event other than ICH, MI, minor and major
neurologic events) derived as 1-utility. Hence for these parameters our tornado diagram
represents disutilities and not utilities.
WAR – Adjusted Dose Warfarin
ICH – Intracranial Hemorrhage
MI – Myocardial Infarction
NOACs – Newer Oral Anticoagulants

Supplemental Figure III
Tornado diagram for one-way sensitivity analyses of all the cost inputs.
WAR – Adjusted Dose Warfarin
DAB – Dabigatran
API – Apixaban
EDO – Edoxaban
ICH – Intracranial Hemorrhage
ECH – Extracranial Hemorrhage
MI – Myocardial Infarction
RIND – Reversible Ischemic Neurologic Damage

Supplemental Figure IV
Tornado diagram for one-way sensitivity analyses for all probabilities related to Extracranial
Hemorrhage.
WAR – Adjusted Dose Warfarin
DAB – Dabigatran
API – Apixaban
EDO – Edoxaban
ECH – Extracranial Hemorrhage
HR – Hazard Ratio
RR – Relative Risk

Supplemental Figure V
Tornado diagram for one-way sensitivity analyses for all probabilities related to Intracranial
Hemorrhage.
WAR – Adjusted Dose Warfarin
DAB – Dabigatran
API – Apixaban
EDO – Edoxaban
ICH – Intracranial Hemorrhage
HR – Hazard Ratio
RR – Relative Risk

Supplemental Figure VI
Tornado diagram for one-way sensitivity analyses for all probabilities related to Myocardial
Infarction.
WAR – Adjusted Dose Warfarin
DAB – Dabigatran
API – Apixaban
EDO – Edoxaban
MI – Myocardial Infarction
HR – Hazard Ratio
RR – Relative Risk

Supplemental Figure VII
Tornado diagram for one-way sensitivity analyses for all probabilities related to clinically
relevant non-major bleeding (minor bleed).
WAR – Adjusted Dose Warfarin
DAB – Dabigatran
API – Apixaban
EDO – Edoxaban
HR – Hazard Ratio
RR – Relative Risk

Supplemental Figure VIII
Tornado diagram for one-way sensitivity analyses for all probabilities related to ischemic stroke.
WAR – Adjusted Dose Warfarin
DAB – Dabigatran
API – Apixaban
EDO – Edoxaban
HR – Hazard Ratio
RR – Relative Risk
OAC – Oral Anticoagulants (Warfarin, Dabigatran, Apixaban, Rivaroxaban and Edoxaban)
RIND – Reversible Ischemic Neurologic Damage

Abstract 25
非弁膜症性心房細動患者の虚血性脳卒中予防における経口抗凝固薬の費用対効果
Cost-Effectiveness of Oral Anticoagulants for Ischemic Stroke Prophylaxis Among Nonvalvular Atrial Fibrillation Patients
Anuj Shah, BPharm; Anand Shewale, MS; Corey J. Hayes, PharmD, MPH, et al.Division of Pharmaceutical Evaluation and Policy, University of Arkansas for Medical Sciences, Little Rock
背景および目的:本研究の目的は,脳卒中リスクが高い心房細動患者において経口抗凝固薬の費用対効果を比較することである。方法:Markov モデルを構築し,民間保険業者の観点から経口抗凝固薬の生涯費用および質調整生存年(QALY)を推定した。営利保険に加入する新規発症心房細動患者のコホートから脳卒中リスク(CHADS2 スコア:うっ血性心不全,高血圧症,高齢,糖尿病,脳卒中)およびモデル化した集団における年齢の分布を求めた。公表された臨床試験から治療特異的イベントの発生率を求めた。疾病費用に関する研究からイベントおよび発症後の費用を求めた。薬剤費は 2015 年の National Average Drug Acquisition Costデータから得た。結果:ベースケース分析で費用が最も低い薬剤はワルファリンであり($46,241,95% CI:44,499 ~ 47,874),QALYが最も高い薬剤はアピキサバンであった(9.38,95% CI:9.24 ~ 9.48 QALY)。アピキサバンは,ワルファ
リンよりも費用対効果に優れた治療法であることが明らかになり(増分費用対効果比= $25,816),また,他の抗凝固薬よりも優位であった。確率的感度分析から,支払意思額をQALYあたり $100,000 とした場合,アピキサバンは少なくとも 61%の確率で最も費用対効果に優れた治療法であることが明らかになった。CHADS2 ≧ 3 の患者では,ダビガトランが優位な治療法であった。本モデルはアピキサバン,ダビガトラン,エドキサバンの有効性およびこれらの薬剤の費用の影響を受けた。結論:比較したすべての新しい経口抗凝固薬は用量で調節後のワルファリンよりも有効であった。本モデルから,アピキサバンは一般的な心房細動集団において最も効果的な抗凝固薬であり,増分費用対効果比は $50,000/QALY未満であることが明らかになった。脳卒中リスクが高い集団(CHADS2 ≧ 3)では,ダビガトランが最も費用対効果に優れた治療選択肢であった。
Stroke. 2016; 47: 1555-1561. DOI: 10.1161/STROKEAHA.115.012325.
Abstract
表2 ベースケースの費用,質調整生存年,NMB,ICER
治療法(費用順)ワルファリン
(共通の基準群)
治療法 費用(95% CI) QALY(95% CI) ICER NMB(95% CI) ICER
ワルファリン(用量調節後)
$46,241 (44,499‒47,874) 9.02 (8.90‒9.12) 0 $856,092 (844,556‒866,594) 0
エドキサバン $54,159 (52,670‒55,702) 9.31 (9.16‒9.40) Ext dom $876,817 (863,807‒886,194) $27,643
アピキサバン $55,455 (54,138‒56,493) 9.38 (9.24‒9.48) $25,816 $882,567 (870,327‒892,217) $25,816
ダビガトラン $56,425 (55,203‒57,749) 9.35 (9.23‒9.45) Abs dom $878,304 (867,159‒887,641) $31,435
リバーロキサバン $58,889 (57,467‒60,444) 9.24 (9.11‒9.35) Abs dom $865,465 (853,044‒875,853) $57,434
Abs dom:絶対的に優位,Ext dom:広く優位,ICER:増分費用対効果比,NMB:純金銭便益,QALY:質調整生存年。
表3 年齢,CHADS2 スコア,費用別の増分費用対効果比および構造的感度分析 *
シナリオ 65歳以上の患者 65歳未満の患者 CHADS2= 1 CHADS2= 2 CHADS2≧ 3 別の費用シナリオ† AWP費用‡ NADAC費用§ 構造的感度分析‖
治療法 増分費用対効果比
ワルファリン(用量調節後)
… … … … … … … … …
エドキサバン Ext dom Ext dom Ext dom Ext dom Ext dom Abs dom Ext dom Ext dom Ext dom
アピキサバン $13,662 $34,191 $31,580 $24,691 Abs dom $67,892 $65,332 $45,393 $24,566
ダビガトラン Abs dom Abs dom Abs dom Abs dom $16,645 $1,832 Abs dom Abs dom Abs dom
リバーロキサバン Abs dom Abs dom Abs dom Abs dom Abs dom Abs dom Abs dom Abs dom Abs dom
Abs dom:絶対的に優位,AWP:平均卸売価格,CHADS2:うっ血性心不全(1点),高血圧症(1点),年齢 75歳以上(1点),糖尿病(1点),脳卒中(2点),Ext dom:広く優位,MI:心筋梗塞,NADAC:National Average Drug Acquisition Cost。*CHADS2≧ 3 および費用感度分析を除く本表のすべてのシナリオの治療法は費用の昇順で提示した。すべてのシナリオの完全な費用,質調整生存年,純金銭便益に関する情報については,オンラインデータ補遺の表 II を参照のこと。†Lee ら(文献 15)の増大費用別にイベント費用を算出。‡Medispan AWPを平均薬剤費の推定値として使用。§NADACを平均薬剤費の推定値として使用。‖MI の経過観察費用を頭蓋外出血期のMI を発症した患者にも割り当てる。
STR-J_11-3_Ab10_main.indd 25STR-J_11-3_Ab10_main.indd 25 10/26/2016 7:24:10 PM10/26/2016 7:24:10 PM