Embed Size (px)
Citation preview
PR
IFY
SG
OL
BA
NG
OR
/ B
AN
GO
R U
NIV
ER
SIT
Y
Cost-effectiveness of panel tests for multiple pharmacogenes associatedwith adverse drug reactionsPlumpton, Catrin; Pirmohamed, Munir; Hughes, Dyfrig
Clinical Pharmacology and Therapeutics
DOI:10.1002/cpt.1312
Published: 01/06/2019
Peer reviewed version
Cyswllt i'r cyhoeddiad / Link to publication
Dyfyniad o'r fersiwn a gyhoeddwyd / Citation for published version (APA):Plumpton, C., Pirmohamed, M., & Hughes, D. (2019). Cost-effectiveness of panel tests formultiple pharmacogenes associated with adverse drug reactions: An evaluation framework.Clinical Pharmacology and Therapeutics, 105(6), 1429-1438. https://doi.org/10.1002/cpt.1312
Hawliau Cyffredinol / General rightsCopyright and moral rights for the publications made accessible in the public portal are retained by the authors and/orother copyright owners and it is a condition of accessing publications that users recognise and abide by the legalrequirements associated with these rights.
• Users may download and print one copy of any publication from the public portal for the purpose of privatestudy or research. • You may not further distribute the material or use it for any profit-making activity or commercial gain • You may freely distribute the URL identifying the publication in the public portal ?
Take down policyIf you believe that this document breaches copyright please contact us providing details, and we will remove access tothe work immediately and investigate your claim.
22. Dec. 2021
1
Title: Cost-effectiveness of panel tests for multiple pharmacogenes associated with adverse drug
reactions: An evaluation framework
Running head: Cost effectiveness of a pharmacogenetic panel
Authors: Catrin O Plumpton1, Munir Pirmohamed2, Dyfrig A Hughes1,2*
Affiliations:
1 Centre for Health Economics and Medicines Evaluation, Bangor University, Wales, UK
2 Department of Molecular and Clinical Pharmacology, University of Liverpool, Liverpool, UK
Corresponding author:
*Professor Dyfrig Hughes, Centre for Health Economics and Medicines Evaluation, Bangor University,
Ardudwy, Normal Site, Holyhead Road, Bangor, Wales, UK, LL57 2PZ. E-mail:
[email protected] Telephone: +44(0)1248 382950
Key words: Pharmacogenetics, Cost-effectiveness analysis, Panel test, HLA.
Conflict of interest: The authors declare no conflict of interest.
Funding: Funded by the National Institute for Health Research Invention for Innovation Programme
(A biomarker panel to predict, diagnose and prevent HLA-mediated adverse drug reactions;
reference number II-LB-0313-20008). The views expressed in this presentation are those of the
authors and not necessarily those of the NHS, the National Institute for Health Research or the
Department of Health.
2
ABSTRACT
The cost-effectiveness of testing for multiple genes implicated in adverse drug reactions requires the
simultaneous assessment of all actionable information, including future prescribing decisions based
on incidental findings. We developed methodology for determining the value of pharmacogenetic
panel tests, illustrated with a multi-gene panel including HLA-A*31:01, HLA-B*15:02, HLA-B*57:01,
HLA-B*58:01, HLA-B (158T) and HLA-DQB1 (126Q). If the findings for all alleles are acted upon,
regardless of their individual cost-effectiveness, the HLA panel resulted in cost savings of £378
(US$491), and a QALY gain of 0.0069. Based on a stratified analysis and compared with no testing,
initial use of the panel was cost-effective in patients eligible for abacavir (HLA-B*57:01),
carbamazepine (HLA-A*31:01) and clozapine (HLA-B (158T) and HLA-DQB1 (126Q)) but not for
carbamazepine (HLA-B*15:02) or allopurinol (HLA-B*58:01). The methods presented allow for the
assessment of the cost-effectiveness of multiple-gene panels.
3
INTRODUCTION
Pharmacogenomic-based personalised medicine holds the promise of optimising prescribing
decisions by improving the targeting of treatment or reducing the likelihood of adverse drug
reactions (ADRs), which are among the leading causes of iatrogenic morbidity and mortality [1]. In
this context, genotyping can be used predictively in order to prevent ADRs by taking precautionary
action such as excluding certain drugs, reducing the dose, or by providing increased monitoring to
high-risk groups [2]. Pharmacogenetic information may also be used pre-emptively, that is, to inform
a current prescribing decision based on stored data from previous genetic testing [3]; to inform
practice for monitoring, and to assist with clinical diagnosis following a suspected ADR [2].
More than 10% of drug labels in the USA and EU contain information on genetic factors determining
drug response, although only a minority of these have been implemented in current practice. This is
mainly because of a lack of evidence on the clinical effectiveness and utility of testing, but also
because of potential concerns about their cost-effectiveness [4]. As few as one in ten drugs with FDA
labels which include genetic information have associated economic data [5], and of these only a
minority are considered to be cost effective [6, 7]. The need for economic evidence will become
more pressing, given the risk of the rapid pace of knowledge and technological advancements in
genomics resulting in untested innovations being adopted as routine without evidence of cost-
effectiveness [8].
It is acknowledged that the health technology assessment of diagnostic and prognostic tests is
complex, but analytical frameworks have been developed [9]. Methods for assessing the cost-
effectiveness of single-gene pharmacogenetic tests are well described [7, 10, 11], as are the
challenges, which often include a lack of robust data, uncertainties around downstream costs and
benefits, and the sensitivity of the results to key modelling assumptions [12, 13]. The advent of
multi-gene panel testing and whole genome sequencing will require that multiple genes are
assessed simultaneously, greatly enhancing the usefulness of testing, but also further increasing the
complexity of assessing value.
Conceptually, a cost-effectiveness analysis of a multi-gene panel would necessitate a separate
economic analysis of every informative result, each weighted to determine the overall cost-
effectiveness. However, this poses significant challenges in terms of data requirements, modelling
complexity and analytical approach. Assessing the value of a panel of pharmacogenes linked to ADRs
to treatments for HIV, diabetes, hypertension and asthma, for instance, would become infeasible
given the requirement to model the costs and outcomes for each disease. Some commentators have
proposed a welfarist approach to the economic evaluation of genetic testing [14], given that
4
difficult-to-quantify benefits may be derived from predictive, diagnostic or prognostic information as
well as potential improvements in health.
Many applications of next-generation sequencing panels consider a single disease such as a
particular cancer, focus on diagnosis and risk to family members [15, 16], or guided treatment [15,
17], where models and outcomes focus on a single decision at a single point in time. Newborn
screening panels consider a wider range conditions, but economic analyses often focus on the most
prevalent or life-limiting outcome [18]. A review of cost-effectiveness of whole genome sequencing
and whole exome sequencing noted that there were very few full economic evaluations, and indeed
there was a paucity of robust evidence to inform economic evaluations [19]. A single study has been
identified which considers the cost-effectiveness of pharmacogenetic panel testing, using a discrete
event simulation model [20]. While this approach offers a flexible solution to assessing the cost-
effectiveness of a small genetic panel test, it is not readily extensible to larger panels due to
computational complexity and extensive data requirements.
The present study aims to formalise an alternative framework for assessing the cost-effectiveness of
pharmacogenetic tests used in different clinical contexts of ADR management; and to introduce
methodology for the efficient determination of the cost-effectiveness of a panel of multiple genes
associated with ADRs.
RESULTS
Cost-effectiveness of a pre-specified 2-gene panel
A scenario of sequential testing, where a patient with epilepsy and eligible for carbamazepine is
tested for HLA-A*31:01 and who later develops gout and is eligible for allopurinol (and tested for
HLA-B*58:01) is presented in Figure 1a. Compared with the standard practice of not testing, the
reported incremental, total cost of genotyping for HLA-A*31:01 alone is £300, inclusive of a test cost
of £54 [21]. The incremental cost excluding the cost of testing (δCost) is £268 once inflated to 2017
GBP [22], and the incremental quality-adjusted life year (QALY) is 0.0234 [21]. Following the same
approach for HLA-B*58:01, the incremental cost, excluding that of the test, is £49, and incremental
QALYs 0.0023 [23]. Gout has an estimated incidence of 1.77 per 1000 person-years, with 27.3% of
patients receiving urate lowering therapy within 12 months of diagnosis [24]. Of these, 89% are
anticipated to receive allopurinol [25], resulting in 0.43 incident prescriptions of allopurinol per 1000
person-years.
5
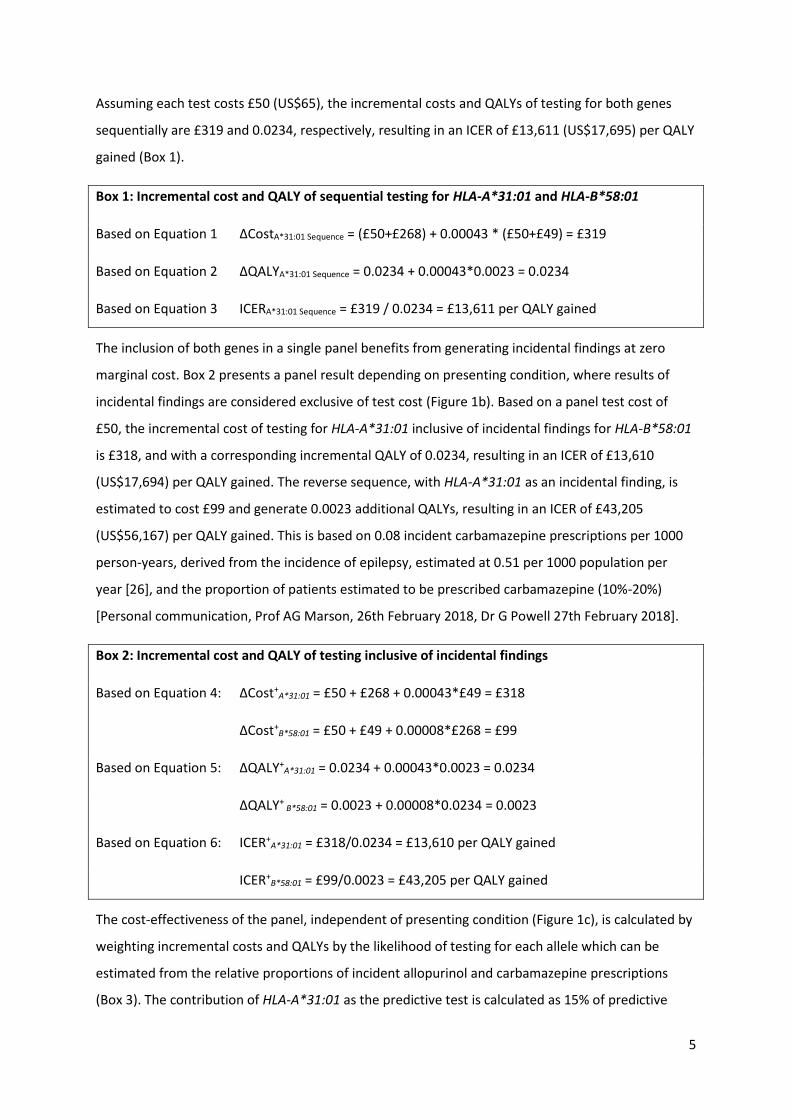
Assuming each test costs £50 (US$65), the incremental costs and QALYs of testing for both genes
sequentially are £319 and 0.0234, respectively, resulting in an ICER of £13,611 (US$17,695) per QALY
gained (Box 1).
Box 1: Incremental cost and QALY of sequential testing for HLA-A*31:01 and HLA-B*58:01
Based on Equation 1 ΔCostA*31:01 Sequence = (£50+£268) + 0.00043 * (£50+£49) = £319
Based on Equation 2 ΔQALYA*31:01 Sequence = 0.0234 + 0.00043*0.0023 = 0.0234
Based on Equation 3 ICERA*31:01 Sequence = £319 / 0.0234 = £13,611 per QALY gained
The inclusion of both genes in a single panel benefits from generating incidental findings at zero
marginal cost. Box 2 presents a panel result depending on presenting condition, where results of
incidental findings are considered exclusive of test cost (Figure 1b). Based on a panel test cost of
£50, the incremental cost of testing for HLA-A*31:01 inclusive of incidental findings for HLA-B*58:01
is £318, and with a corresponding incremental QALY of 0.0234, resulting in an ICER of £13,610
(US$17,694) per QALY gained. The reverse sequence, with HLA-A*31:01 as an incidental finding, is
estimated to cost £99 and generate 0.0023 additional QALYs, resulting in an ICER of £43,205
(US$56,167) per QALY gained. This is based on 0.08 incident carbamazepine prescriptions per 1000
person-years, derived from the incidence of epilepsy, estimated at 0.51 per 1000 population per
year [26], and the proportion of patients estimated to be prescribed carbamazepine (10%-20%)
[Personal communication, Prof AG Marson, 26th February 2018, Dr G Powell 27th February 2018].
Box 2: Incremental cost and QALY of testing inclusive of incidental findings
Based on Equation 4: ΔCost+A*31:01 = £50 + £268 + 0.00043*£49 = £318
ΔCost+B*58:01 = £50 + £49 + 0.00008*£268 = £99
Based on Equation 5: ΔQALY+A*31:01 = 0.0234 + 0.00043*0.0023 = 0.0234
ΔQALY+ B*58:01 = 0.0023 + 0.00008*0.0234 = 0.0023
Based on Equation 6: ICER+A*31:01 = £318/0.0234 = £13,610 per QALY gained
ICER+B*58:01 = £99/0.0023 = £43,205 per QALY gained
The cost-effectiveness of the panel, independent of presenting condition (Figure 1c), is calculated by
weighting incremental costs and QALYs by the likelihood of testing for each allele which can be
estimated from the relative proportions of incident allopurinol and carbamazepine prescriptions
(Box 3). The contribution of HLA-A*31:01 as the predictive test is calculated as 15% of predictive
6
tests, and the contribution of HLA-B*58:01 is 85% of predictive tests. Overall costs and QALYs of the
panel, compared with standard care of no testing are £133 and 0.0055, respectively, resulting in a
panel ICER of £24,148 (US$31,393) per QALY gained.
Box 3: Incremental cost and QALY of panel testing
Based on Equation 7: Weightcarbamazepine = 0.00008/(0.00008+0.00043) = 0.15
Weightallopurinol = 0.00043/(0.00008+0.00043) = 0.85
Based on Equation 8: ΔCostPanel = 0.15*£318 + 0.85*£99 = £133
Based on Equation 9: ΔQALYPanel = 0.15*0.0023 + 0.85*0.0234 = 0.0055
Based on Equation 10: ICERPanel = £133/0.0055 = £24,148 per QALY gained
Whilst on average, the overall panel cost effectiveness of £24,148 per QALY gained is acceptable at a
threshold of £30,000 per QALY, testing predictively when a patient presents with gout is not cost-
effective. However, acting on information on HLA-B*58:01 is cost-effective as an incidental finding of
a panel ordered for patients eligible for carbamazepine (δCost/ΔQALY = £21,491 (US$27,938) per
QALY gained). The optimised use of the panel costs £13,610 (US$17,694) per QALY gained, equal to
that of testing for HLA-A*31:01, inclusive of incidental findings. The improvement in cost-effective
compared with sequential testing is enhanced when considering multiple genes.
Cost-effectiveness of a specified multi-gene HLA panel
The cost effectiveness of a £50 multi-gene panel for HLA-A*31:01, HLA-B*15:02, HLA-B*57:01, HLA-
B*58:01, HLA-B (158T) and HLA-DQB1 (126Q), dependent on the initial predictive test, is presented
in Table 1. For a patient with epilepsy and eligible for carbamazepine or phenytoin (with the
incidental findings for all other HLA-alleles), the panel had an ICER of £15,638 (US$20,330) per QALY
gained and would be considered cost-effective with a probability of 0.75 at a threshold of £30,000
per QALY. The panel would also be considered to be cost-effective for a patient with HIV eligible for
abacavir, or a patient with treatment-resistant schizophrenia eligible for clozapine, both at a
probability of 1.0. However, based on a patient presenting with gout, an initial panel test request for
HLA-B*58:01 (with incidental findings for all other HLA-alleles) had an ICER of £43,038 (US$55,950)
per QALY gained, and a probability of 0.26 of being cost-effective at £30,000 per QALY.
In the case that the panel was to be implemented such that all findings are acted upon (where
applicable) regardless of cost-effectiveness, the panel resulted in a cost saving of £378 (US$491) and
0.0069 QALYs gained, therefore dominating standard care (Table 2). The probability of cost-
7
effectiveness at the £30,000 per QALY threshold was 1.0 indicating that this panel configuration is
cost-effective, and should be adopted into routine practice.
Cost-effectiveness of an optimized multi-gene panel
In the context of designing an optimal panel to maximise cost-effectiveness for the National Health
Service (NHS) in the UK, testing for HLA-B*15:02 is not cost-effective, even as an incidental find
(incremental net monetary benefit, INMB -£36; -US$47) and is consequently removed from the
panel. Testing for HLA-B*58:01 is only cost-effective as an incidental find, and is therefore not
included as a predictive test within the overall panel result (INMB -£30; -US$40). In this
configuration, the panel results in a cost saving of £1,388 (US$1,805) and a QALY gain of 0.0163.
Both the pre-specified and optimised panels are viable, (i.e. the probability of the panel being cost-
effective for initial use in at least two conditions was 1.0) which in a policy context suggests multi-
gene testing to be more appropriate than single-gene testing.
8
DISCUSSION
This study introduces methods for determining the economic value of panel-based genotyping to
diagnose, predict, exclude, monitor and pre-empt adverse drug reactions. The case study illustrated
how the cost-effectiveness of a panel depends critically on the cost-effectiveness of incidental
findings, the likelihood of future exposure to other pharmacogenetic drugs, the context of the initial
request for the test, as well as the effectiveness and downstream costs of testing. In the case of
acting on the main or incidental findings of a £50 multi-gene panel test for HLA-A*31:01, HLA-
B*15:02, HLA-B*57:01, HLA-B*58:01, HLA-B (158T) and HLA-DQB1 (126Q), the panel is both cost
saving and more effective, than standard care. However, cost-effectiveness can be further improved
by removing HLA-B*15:02, and not using the panel as a predictive test in patients presenting with
gout who are eligible for allopurinol.
The analysis is novel in that it allows for the assessment of cost utility of multi-gene testing in
different contexts, across a variety of conditions, through all incidental findings. Veenstra, (2016)
[27] proposed generalised estimates of incremental clinical benefit, derived by improving drug
effectiveness or avoiding harm, and incremental costs saved (or spent) as a result of modifying drug
therapy and avoiding adverse outcomes, in the context of warfarin pharmacogenetic screening. The
analysis is limited by having no derivation of how these can be calculated more specifically – e.g.
relating to positive predictive value (PPV), negative predictive value (NPV), cost or benefit of
avoiding specific ADR; restricted to a 2-gene panel (CYP2C9 and VKOR variants); considered
immediately relevant information (and so no weighting for incidental findings); and defined
incremental cost in terms of an overall screening panel, rather than on presentation of condition. A
discrete event simulation model applied previously in the context of a multigene panel, is limited by
computational requirements, which can restrict their applicability to a small number of risk genes
[20]. Moreover, they do not overcome the problem of needing to model each and every disease
impacted by the use of testing. Our frameworks for estimating the cost-effectiveness of single-gene
tests, whilst simplified from a full model, have the strength of using lifetime data reflecting
downstream costs and consequences.
There are a number of key assumptions, however, which also limit our analysis. We assume
independence of conditions and allele prevalence and we assume that drug prescriptions are
independent and that there is no cross-reactivity between drugs. These factors could conceivably be
incorporated into the analysis, provided the necessary information is available for simulation. The
case study may be limited by heterogeneity, in that the ICERs for each single gene test are
conducted on disparate populations.

9
In conclusion, this study has presented methodology which can be used to assess the potential
future costs and benefits of multi-gene panels. Whilst the specific context is prevention of adverse
drug reactions, this framework may be adapted for economic evaluation of multi-gene panels for
other applications.
10
METHODS
A framework for assessing the economic value of multi-gene panel testing was developed to
estimate the cost-effectiveness of a pre-specified panel, assuming action upon test results for all
future relevant prescription decisions; and to design a cost-effective panel through selection of
appropriate genes for action predictively and within incidental findings (this is equivalent to
specifying how best to utilise an existing panel). Both approaches are presented in the context of
diagnosing, predicting, excluding, monitoring and pre-empting adverse drug reactions [2]. The
methods are introduced by describing each step in relation to a 2-gene panel. A case study of a
multi-gene panel test is then developed to illustrate the practical application of the methods.
To improve modelling efficiency, two analytic approaches are proposed: One based on evidence
available from existing economic evaluations of single gene tests, and the other, for situations where
such evidence does not exist, based on economic evaluations of the drugs causing the ADRs in
question.
Estimating the cost-effectiveness of a pre-specified 2-gene panel
In the context of a single gene test, the incremental cost (ΔCost) is the sum of the test cost (CostPGx)
and the cost of acting upon the results (such as in relation to prescribing alternative doses or
medicines), (δCost). The incremental cost-effectiveness ratio is ΔCost divided by the incremental
QALY (ΔQALY). If two single gene tests are used in sequence, the overall cost-effectiveness (versus a
strategy of not testing) is a function of CostPGx, δCost and ΔQALYs associated with each test, and the
likelihood of patients requiring the second test. Figure 1a presents a schematic representation of
testing for HLA-A*31:01 and HLA-B*58:01 in sequence for predicting severe ADRs to carbamazepine
and allopurinol, with calculations for cost-effectiveness of this scenario presented below.
Equation 1 ΔCostA*31:01 Sequence = (CostPGx + δCostA*31:01)+ Incidenceallopurinol Rx* (CostPGx + δCostB*58:01)
Equation 2 ΔQALYA*31:01 Sequence = ΔQALYA*31:01+ Incidenceallopurinol Rx* ΔQALYB*58:01
Equation 3 ICERA*31:01 Sequence = ΔCostA*31:01 Sequence / ΔQALYA*31:01 Sequence
If both genes were included in a single panel, information on the second allele is incidental to the
principal findings (Figure 1b). Assuming the panel unit cost includes all aspects of testing (including
for instance, quality control, relevant aspects of clinical decision support systems and electronic
health records), incidental findings are available at zero marginal cost. In this context, the
incremental costs (ΔCost+A*31:01) and QALYs (ΔQALY+
A*31:01) of testing for HLA-A*31:01 predictively,
inclusive of incidental findings (denoted by +) can be modelled according to:
11
Equation 4 ΔCost+A*31:01 = CostPanel + δCostA*31:01+ Incidenceallopurinol Rx*δCostB*58:01
Equation 5 ΔQALY+A*31:01 = ΔQALYA*31:01+ Incidenceallopurinol Rx*ΔQALYB*58:01
Equation 6 ICER+A*31:01 = ΔCost+
A*31:01 / ΔQALY+A*31:01
For a patient who presents initially with gout, who later has a possibility of developing epilepsy, an
ICER can similarly be derived for testing for HLA-B*58:01 inclusive of incidental findings for HLA-
A*31:01 by substituting HLA-A*31:01 for HLA-B*58:01 in the above equations.
Costs and QALYs for the panel, independent of presenting condition, are a composite of both
possible predictive tests, where the contribution of each starting point is based on the relative
likelihood of testing for HLA-A*31:01 before HLA-B*58:01 (or vice versa):
Equation 7 Weight carbamazepine = Incidencecarbamazepine Rx / (Incidencecarbamazepine Rx + Incidenceallopurinol Rx)
Equation 8 ΔCostPanel = Weight A*31:01 * ΔCost+A*31:01 + Weight B*58:01 * ΔCost+
B*58:01
Equation 9 ΔQALYPanel = Weight A*31:01 * ΔQALY+A*31:01 + Weight B*58:01 * ΔQALY+
B*58:01
Equation 10 ICERPanel = ΔCostPanel / ΔQALYPanel
Estimating the cost-effectiveness of a multi-gene HLA panel
The methods for extending and generalizing beyond a 2-gene panel, to a multi-gene panel, are
presented in the Supplementary Appendix. These are illustrated with a more comprehensive HLA
gene panel for preventing ADRs. Additional cost-utility analyses for HLA-B*15:02 [28], HLA-B*57:01
[29], and HLA-B (158T) and HLA-DQB1 (126Q) [30] were identified from a purposive search of the
literature. In this illustrative example, we relaxed assumptions of cost perspective and healthcare
setting.
The incremental cost (exclusive of the test cost, δCosts) associated with a strategy of testing
compared with standard care, and associated differences in ΔQALYs were extracted for analysis.
Costs were converted to GBP [31], and then inflated to 2017 values using the hospital and
community health services index [22]. The main results are presented also in US dollars, using a
currency exchange rate of $1.30 to the pound.
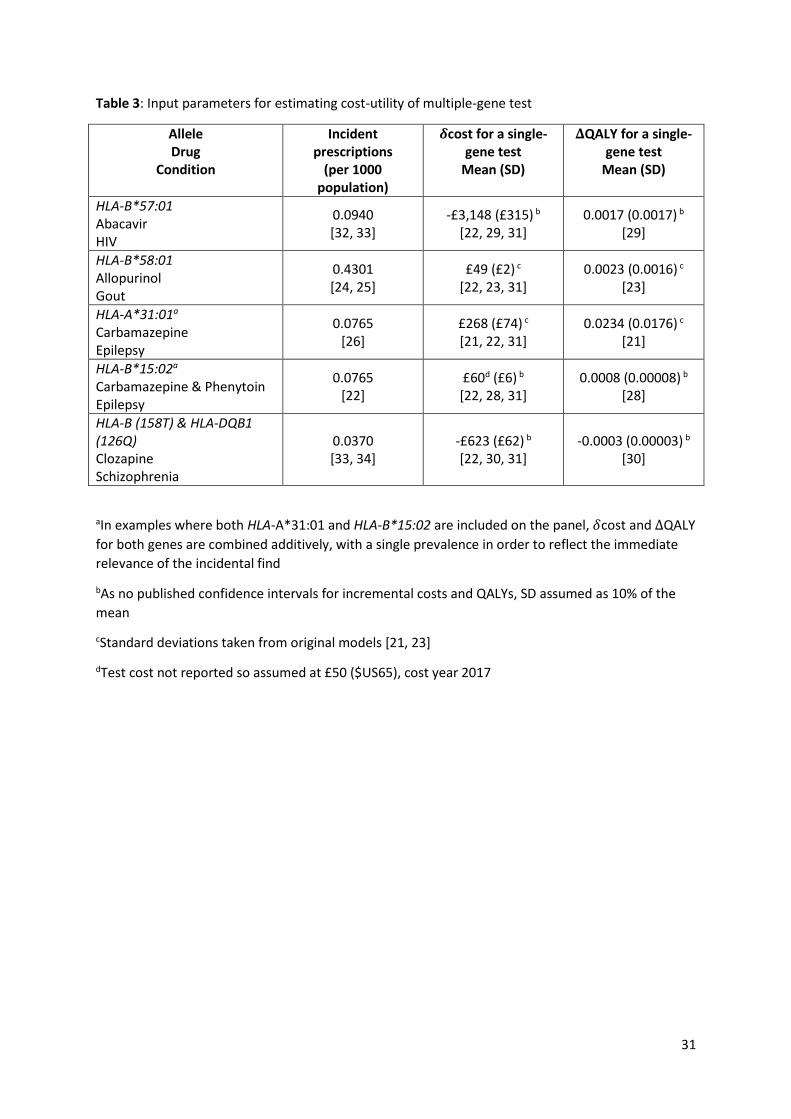
All inputs into the economic model of the multi-gene panel are summarised in Table 3. Analyses
were conducted based on a panel costing £50 to estimate the ICER of the panel by assuming all
results are acted upon, where applicable; and in the context of designing a cost-effective panel,
based on a cost-effectiveness threshold of £30,000 per QALY (λ) [35]. Parameter uncertainty was
considered using Monte-Carlo simulation, drawing from the distributions of the input parameters, to
12
generate 95% central ranges (CR) for the incremental costs and QALYs, and to calculate the
likelihood of each single gene test being included as a predictive test, or within the incidental
findings.
Designing an optimized multi-gene panel
An efficient panel test can be designed by including tests for genes which are cost-effective
individually (within incidental findings), or in combination (as a predictive test inclusive of incidental
findings). This is achieved by imposing the following conditions:
i) In order to exclude tests which are not cost-effective within the incidental findings, a
threshold is applied on the INMB for incidental findings. Genes are only included on the
panel if IMNB = λ*ΔQALY – δCost ≥ 0
ii) In order to exclude tests which are not cost-effective predictively (inclusive of incidental
findings), in the final panel calculations (Equations 5 and 6), only predictive tests where
iii) A multi-gene test is then defined as being viable, over and above a single gene test,
when there are at least two combinations of drug-allele and indication, for which
INMB+ ≥ 0. Based on simulation, using a series of Monte Carlo replications, the
likelihood of a test being viable is defined as the proportion of replications in which
multiple INMB+ ≥ 0
Methods for approximating incremental costs and QALYs for single gene tests
Where published single gene economic evaluations cannot be identified, or cannot be practicably
performed (e.g. because of the number and complexity of considering multiple genes or drugs), then
approximation of cost-effectiveness is required. This concept has been discussed previously in terms
of the costs saved and benefits gained through pharmacogenetic testing [27]. Here, we propose
further methods to estimate values of ΔCost, δCost, and ΔQALY using existing evidence on the costs
and QALYs of both treatment, and the ADR avoided. These are dependent on the context of testing
[2].
Predicting adverse drug reactions
Genotyping can be used predictively to inform a specific prescribing decision (pre-prescription
genotyping). This might determine whether a patient is at an increased risk of experiencing an ADR,
and provide information on whether an alternative drug is indicated or whether a dose reduction is
warranted. Patients with the HLA-B*57:01 allele, for instance, must avoid abacavir and be prescribed
an alternative anti-retroviral drug for their HIV infection as they would otherwise be at 15-fold
higher risk of experiencing a hypersensitivity reaction compared with the general population [36].
13
Information on variant CYP2C9 or VKORC1 alleles can be used to guide warfarin dose, to reduce the
risk of haemorrhagic events, and maintain effective anticoagulation [37].
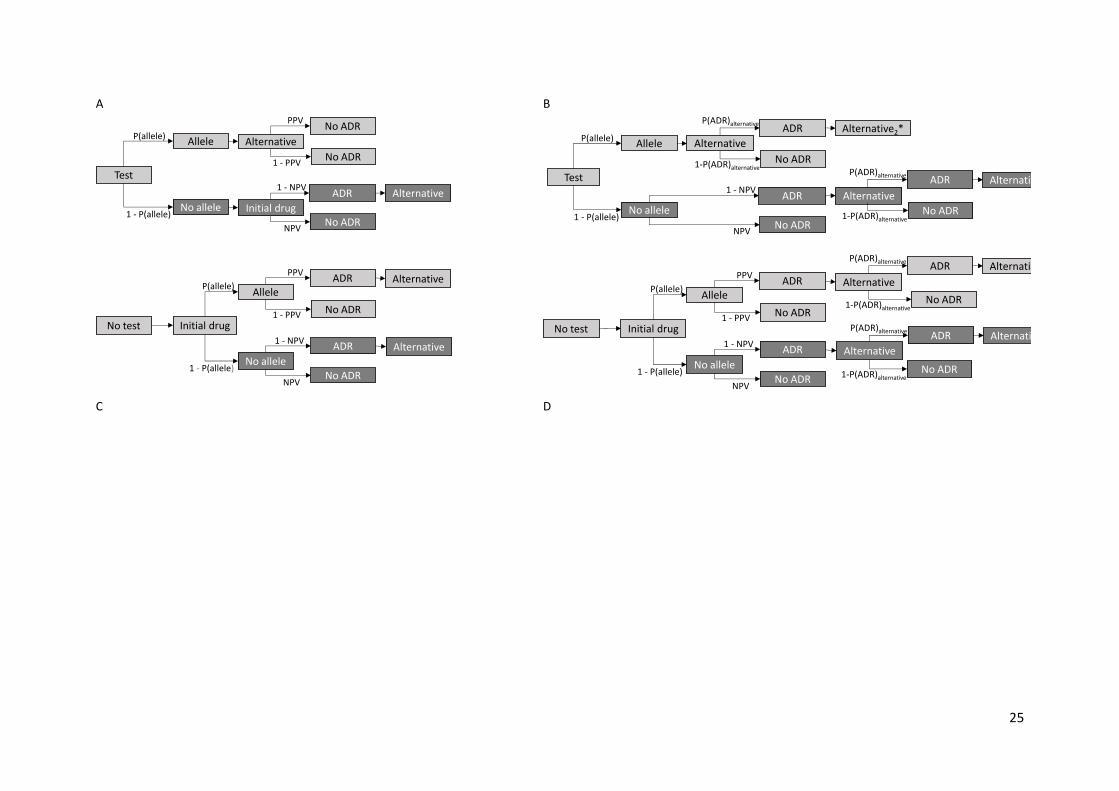
Assuming that there is an appropriate alternative treatment (or dose) that is associated with no risk
of the same ADR, the incremental costs and QALYs of genotyping may be readily estimated. Most
ADRs occur soon after treatment commencement, and so the consequences of their avoidance are
captured by the short term cost savings and QALYs gained. As cost-effectiveness relies on
incremental costs and QALYs, only differences between strategies, highlighted in Figure 2, are
considered in the final derivation (see Supplementary Appendix).
For chronic treatments (Figure 2a), the long term costs and consequences (including harms) are
captured in the incremental costs (ΔCostalternative) and QALYs (ΔQALYalternative), relative to the
alternative drug (or dose) indicated by the test result or prescribed for patients who experience an
ADR. These can be derived from relevant published economic evaluations.
Based on these, the incremental costs of a single-gene test can be approximated by sum of the cost
of testing; the incremental cost of the alternative weighted by the probability of being prescribed
the alternative; less the cost of ADR avoided (weighted by the likelihood of ADR)
Equation 11:
ΔCost
= CostPGx
+ 𝑃(allele) ∗ (1 − PPV) ∗ ΔCostalternative
− 𝑃(allele) ∗ PPV ∗ CostADR
and the corresponding incremental QALY, by the sum of the incremental QALY of the alternative
weighted by the probability of being prescribed the alternative, and the QALYs gained through
avoiding the ADR
Equation 12:
ΔQALY
= 𝑃(allele) ∗ (1 − PPV) ∗ ΔQALYalternative
− 𝑃(allele) ∗ PPV ∗ QALYADR
where, P(allele) is the probability of the presence of the risk allele, and PPV is the positive predictive
value of the test, that is, the probability of a patient experiencing the ADR if they test positive for the
allele. CostADR is the cost of treating the ADR, and QALYADR is a QALY decrement associated with
the ADR.
14
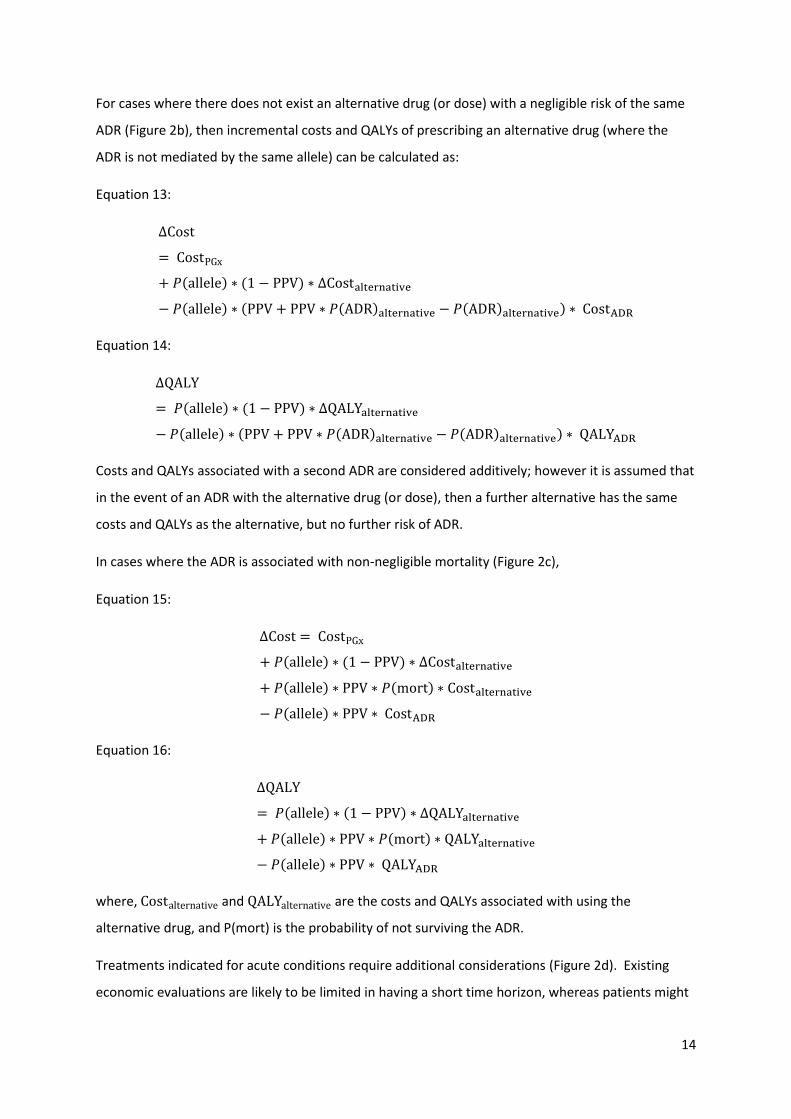
For cases where there does not exist an alternative drug (or dose) with a negligible risk of the same
ADR (Figure 2b), then incremental costs and QALYs of prescribing an alternative drug (where the
ADR is not mediated by the same allele) can be calculated as:
Equation 13:
ΔCost
= CostPGx
+ 𝑃(allele) ∗ (1 − PPV) ∗ ΔCostalternative
− 𝑃(allele) ∗ (PPV + PPV ∗ 𝑃(ADR)alternative − 𝑃(ADR)alternative) ∗ CostADR
Equation 14:
ΔQALY
= 𝑃(allele) ∗ (1 − PPV) ∗ ΔQALYalternative
− 𝑃(allele) ∗ (PPV + PPV ∗ 𝑃(ADR)alternative − 𝑃(ADR)alternative) ∗ QALYADR
Costs and QALYs associated with a second ADR are considered additively; however it is assumed that
in the event of an ADR with the alternative drug (or dose), then a further alternative has the same
costs and QALYs as the alternative, but no further risk of ADR.
In cases where the ADR is associated with non-negligible mortality (Figure 2c),
Equation 15:
ΔCost = CostPGx
+ 𝑃(allele) ∗ (1 − PPV) ∗ ΔCostalternative
+ 𝑃(allele) ∗ PPV ∗ 𝑃(mort) ∗ Costalternative
− 𝑃(allele) ∗ PPV ∗ CostADR
Equation 16:
ΔQALY
= 𝑃(allele) ∗ (1 − PPV) ∗ ΔQALYalternative
+ 𝑃(allele) ∗ PPV ∗ 𝑃(mort) ∗ QALYalternative
− 𝑃(allele) ∗ PPV ∗ QALYADR
where, Costalternative and QALYalternative are the costs and QALYs associated with using the
alternative drug, and P(mort) is the probability of not surviving the ADR.
Treatments indicated for acute conditions require additional considerations (Figure 2d). Existing
economic evaluations are likely to be limited in having a short time horizon, whereas patients might
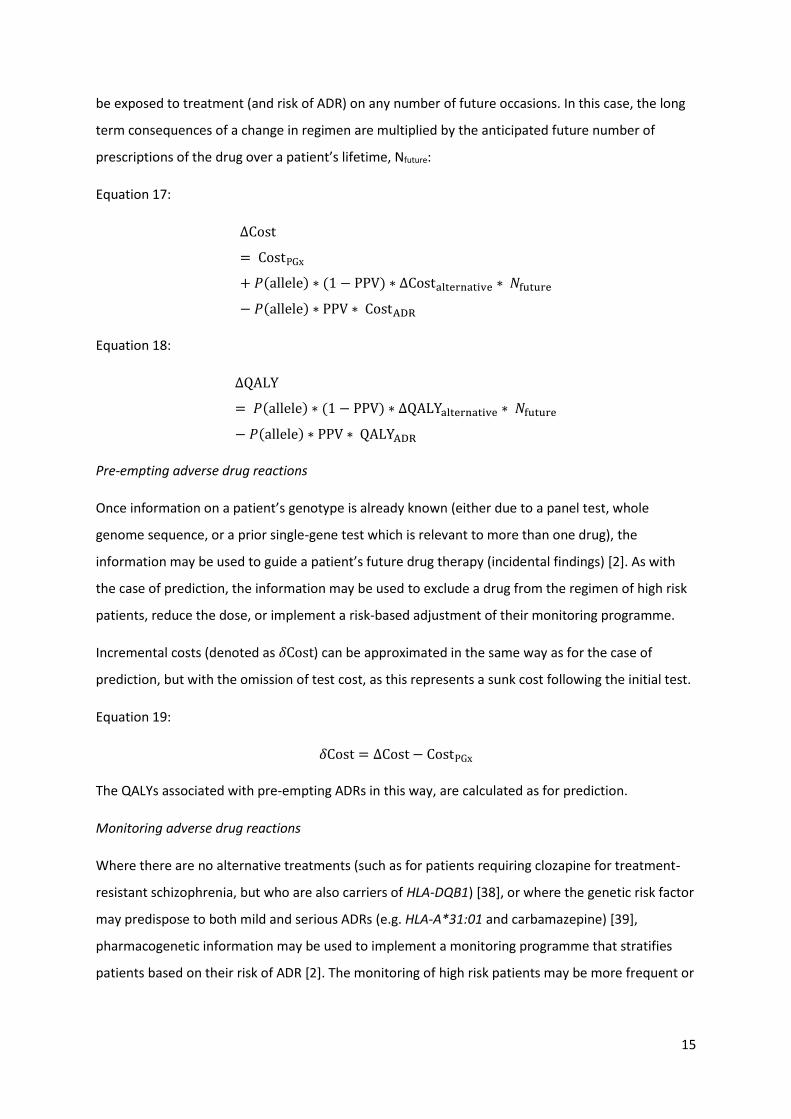
15
be exposed to treatment (and risk of ADR) on any number of future occasions. In this case, the long
term consequences of a change in regimen are multiplied by the anticipated future number of
prescriptions of the drug over a patient’s lifetime, Nfuture:
Equation 17:
ΔCost
= CostPGx
+ 𝑃(allele) ∗ (1 − PPV) ∗ ΔCostalternative ∗ 𝑁future
− 𝑃(allele) ∗ PPV ∗ CostADR
Equation 18:
ΔQALY
= 𝑃(allele) ∗ (1 − PPV) ∗ ΔQALYalternative ∗ 𝑁future
− 𝑃(allele) ∗ PPV ∗ QALYADR
Pre-empting adverse drug reactions
Once information on a patient’s genotype is already known (either due to a panel test, whole
genome sequence, or a prior single-gene test which is relevant to more than one drug), the
information may be used to guide a patient’s future drug therapy (incidental findings) [2]. As with
the case of prediction, the information may be used to exclude a drug from the regimen of high risk
patients, reduce the dose, or implement a risk-based adjustment of their monitoring programme.
Incremental costs (denoted as 𝛿Cost) can be approximated in the same way as for the case of
prediction, but with the omission of test cost, as this represents a sunk cost following the initial test.
Equation 19:
𝛿Cost = ΔCost − CostPGx
The QALYs associated with pre-empting ADRs in this way, are calculated as for prediction.
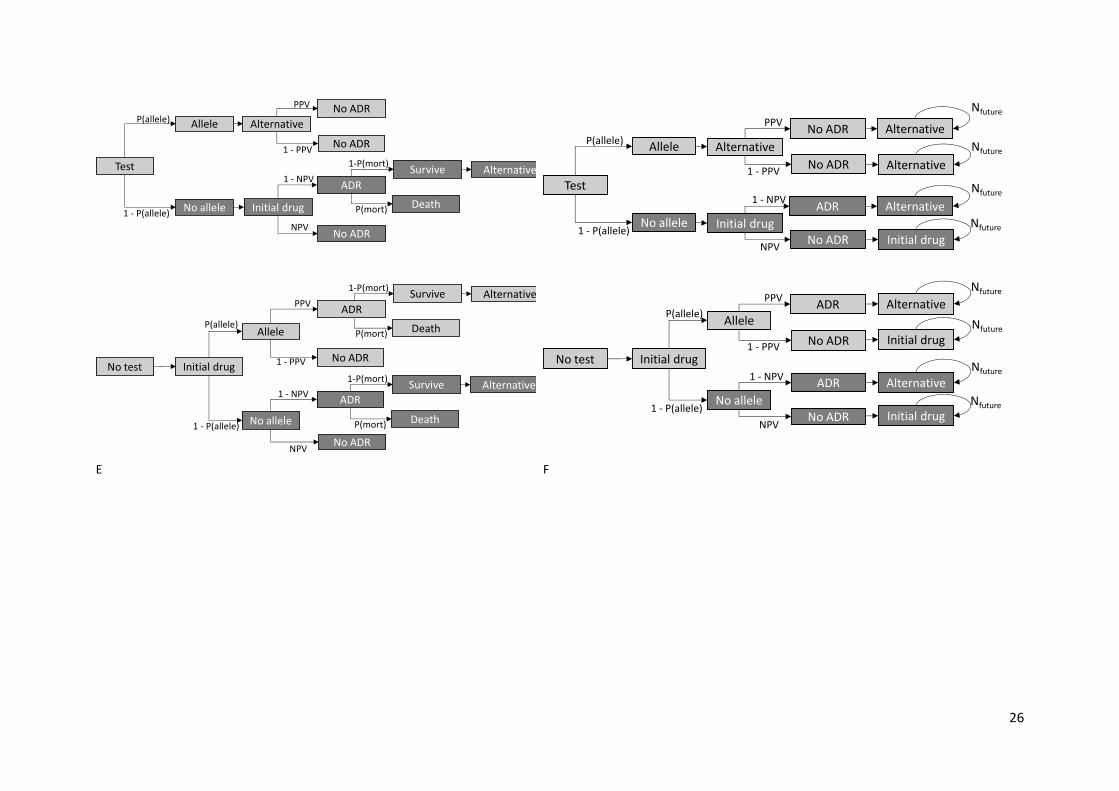
Monitoring adverse drug reactions
Where there are no alternative treatments (such as for patients requiring clozapine for treatment-
resistant schizophrenia, but who are also carriers of HLA-DQB1) [38], or where the genetic risk factor
may predispose to both mild and serious ADRs (e.g. HLA-A*31:01 and carbamazepine) [39],
pharmacogenetic information may be used to implement a monitoring programme that stratifies
patients based on their risk of ADR [2]. The monitoring of high risk patients may be more frequent or
16
intensive compared with that of low-risk patients, who may receive less monitoring and experience
no increased risk of ADR.
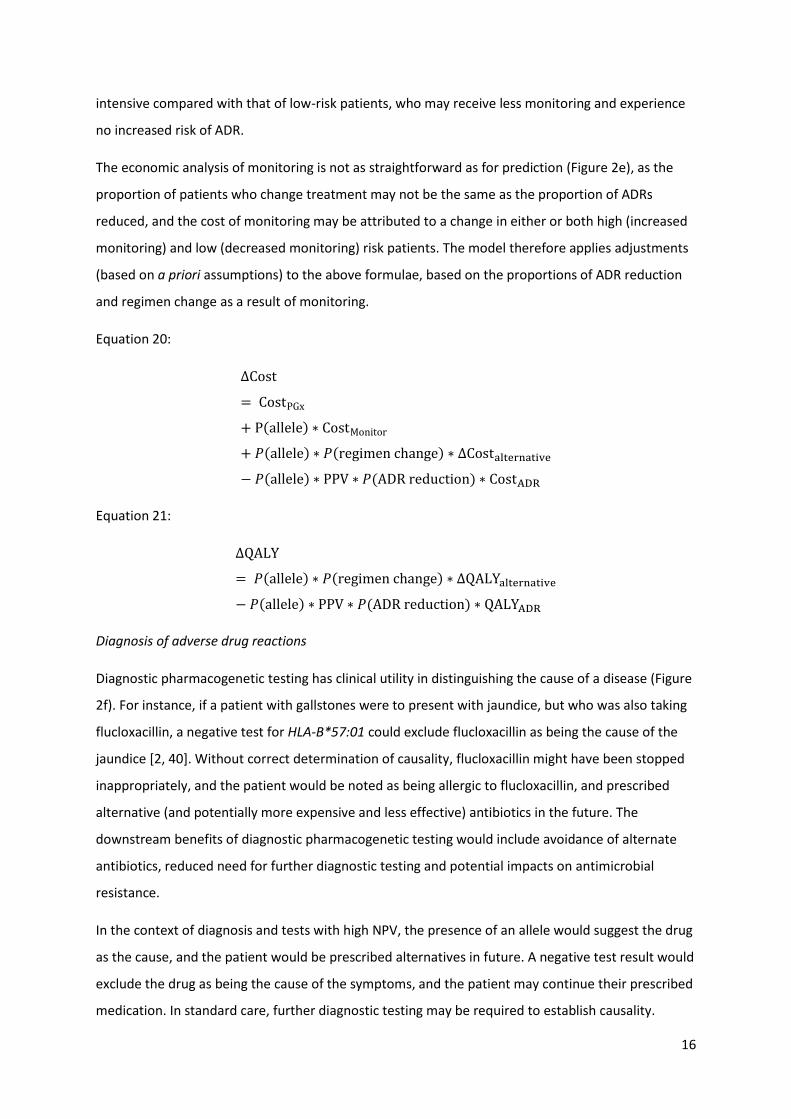
The economic analysis of monitoring is not as straightforward as for prediction (Figure 2e), as the
proportion of patients who change treatment may not be the same as the proportion of ADRs
reduced, and the cost of monitoring may be attributed to a change in either or both high (increased
monitoring) and low (decreased monitoring) risk patients. The model therefore applies adjustments
(based on a priori assumptions) to the above formulae, based on the proportions of ADR reduction
and regimen change as a result of monitoring.
Equation 20:
ΔCost
= CostPGx
+ P(allele) ∗ CostMonitor
+ 𝑃(allele) ∗ 𝑃(regimen change) ∗ ΔCostalternative
− 𝑃(allele) ∗ PPV ∗ 𝑃(ADR reduction) ∗ CostADR
Equation 21:
ΔQALY
= 𝑃(allele) ∗ 𝑃(regimen change) ∗ ΔQALYalternative
− 𝑃(allele) ∗ PPV ∗ 𝑃(ADR reduction) ∗ QALYADR
Diagnosis of adverse drug reactions
Diagnostic pharmacogenetic testing has clinical utility in distinguishing the cause of a disease (Figure
2f). For instance, if a patient with gallstones were to present with jaundice, but who was also taking
flucloxacillin, a negative test for HLA-B*57:01 could exclude flucloxacillin as being the cause of the
jaundice [2, 40]. Without correct determination of causality, flucloxacillin might have been stopped
inappropriately, and the patient would be noted as being allergic to flucloxacillin, and prescribed
alternative (and potentially more expensive and less effective) antibiotics in the future. The
downstream benefits of diagnostic pharmacogenetic testing would include avoidance of alternate
antibiotics, reduced need for further diagnostic testing and potential impacts on antimicrobial
resistance.
In the context of diagnosis and tests with high NPV, the presence of an allele would suggest the drug
as the cause, and the patient would be prescribed alternatives in future. A negative test result would
exclude the drug as being the cause of the symptoms, and the patient may continue their prescribed
medication. In standard care, further diagnostic testing may be required to establish causality.
17
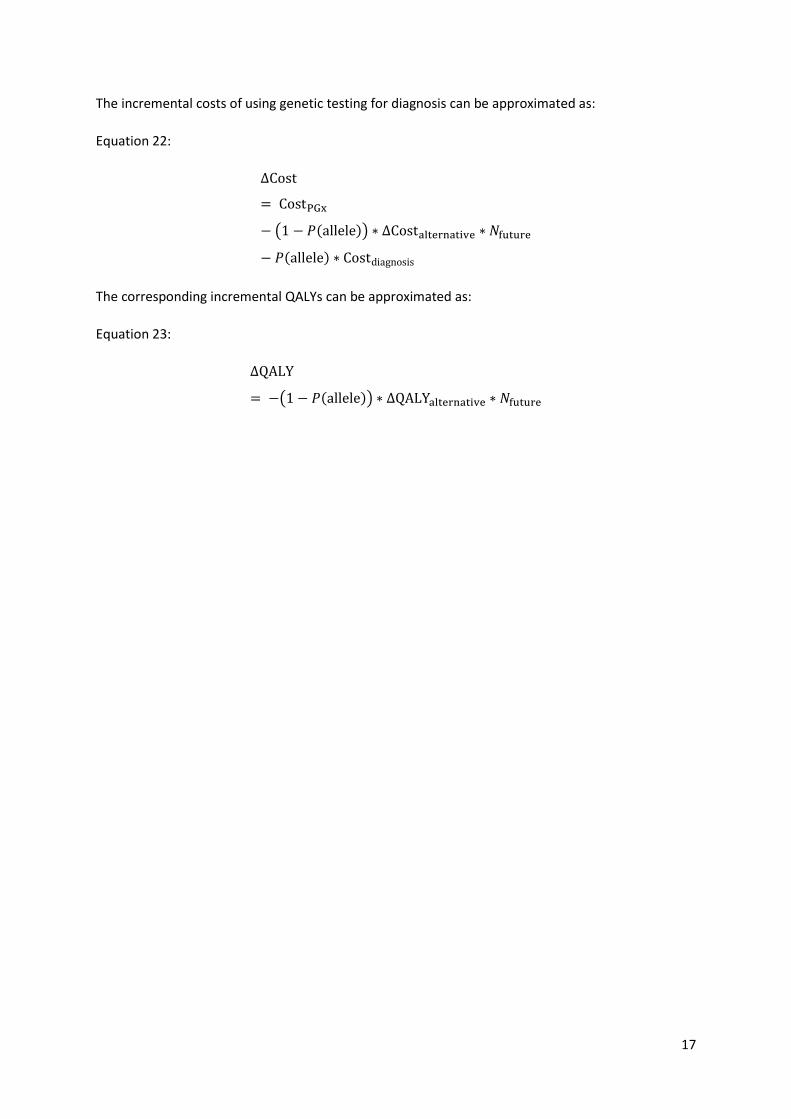
The incremental costs of using genetic testing for diagnosis can be approximated as:
Equation 22:
ΔCost
= CostPGx
− (1 − 𝑃(allele)) ∗ ΔCostalternative ∗ 𝑁future
− 𝑃(allele) ∗ Costdiagnosis
The corresponding incremental QALYs can be approximated as:
Equation 23:
ΔQALY
= −(1 − 𝑃(allele)) ∗ ΔQALYalternative ∗ 𝑁future
18
STUDY HIGHLIGHTS
What is the current knowledge on the topic?
Demonstration of cost-effectiveness is a barrier to the broader adoption and implementation of
pharmacogenetic testing in routine practice.
What question did the study address?
How can the cost-effectiveness of multi-gene panels for avoiding adverse drug reactions be
assessed, and how can a cost-effective panel be designed?
What does this study add to our knowledge?
Methods are developed which allow for the cost-effectiveness assessment of multi-gene panels, and
which consider the multitude of affected drugs, clinical indications and prescribing decisions. This is
illustrated with a case study of a multi-gene HLA panel.
How might this change clinical pharmacology or translational science?
As multi-gene panel testing and whole genome sequencing become credible alternatives to single
gene tests, assessment of their cost-effectiveness is particularly relevant given that the availability of
additional genetic information could impact on any number of future prescribing decisions.

19
AUTHOR CONTRIBUTIONS
MP, DH conceived the study and acquired funding. All authors were involved in the study design. CP
& DH collected the data, developed the methods of analysis and, together with MP, interpreted the
findings. CP drafted the manuscript, and all authors revised it for intellectual content and approved
it for publication.
20
REFERENCES
1. Laatikainen O, Miettunen J, Sneck S, Lehtiniemi H, Tenhunen O, Turpeinen M. The prevalence of
medication-related adverse events in inpatients-a systematic review and meta-analysis. Eur J
Clin Pharmacol. 2017;73(12):1539-1549.
2. Alfirevic A, Pirmohamed M. Genomics of Adverse Drug Reactions. Trends Pharmacol Sci.
2017;38(1):100-109.
3. Roden DM, Van Driest SL, Mosley JD, Wells QS, Robinson JR, Denny JC, Peterson JF. Benefit of
preemptive pharmacogenetic information on clinical outcome. Clin Pharmacol Ther.
2018;103(5):787-794.
4. Relling MV, Evans WE. Pharmacogenomics in the clinic. Nature. 2015;526(7573):343-50.
5. Phillips KA, Sakowski JA, Trosman J, Douglas MP, Liang SY, Neumann P. The economic value of
personalized medicine tests: what we know and what we need to know. Genet Med.
2014;16(3):251-257.
6. Hughes DA. Economics of pharmacogenetic guided treatments: Underwhelming or overstated?
Clin Pharmacol Ther. 2018;103(5):749-751.
7. Plumpton CO, Roberts D, Pirmohamed M, Hughes DA. A Systematic Review of Economic
Evaluations of Pharmacogenetic Testing for Prevention of Adverse Drug Reactions.
Pharmacoeconomics. 2016;34(8):771-793.
8. Payne K, Gavan SP, Wright SJ, Thompson AJ. Cost-effectiveness analyses of genetic and genomic
diagnostic tests. Nat Rev Genet. 2018;19(4):235-246.
9. Soares MO, Walker S, Palmer SJ, Sculpher. Establishing the value of diagnostic and prognostic
tests in health technology assessment. Medical Decision Making. 2018;38(4):495-508.
10. Flowers CR, Veenstra D. The role of cost-effectiveness analysis in the era of pharmacogenomics.
Pharmacoeconomics. 2004;22(8):481-93.
11. Wu AC, Fuhlbrigge AL. Economic evaluation of pharmacogenetic tests. Clin Pharmacol Ther.
2008;84(2):272-4.
12. Shabaruddin FH, Fleeman ND, Payne K. Economic evaluations of personalized medicine: existing
challenges and current developments. Pharmgenomics Pers Med. 2015;8:115-26.
13. Buchanan J, Wordsworth S, Schuh A. Issues surrounding the health economic evaluation of
genomic technologies. Pharmacogenomics. 2013;14(15):1833-1847.
14. Payne K, McAllister M, Davies LM. Valuing the economic benefits of complex interventions:
when maximising health is not sufficient. Health Econ. 2013;22(3):258-271.
15. Gallego CJ, Shirts BH, Bennette CS, Guzauskas G, Amendola LM, Horike-Pyne M, Hisama FM,
Pritchard CC, Grady WM, Burke W, Jarvik GP, Veenstra DL. Next-Generation Sequencing Panels
21
for the Diagnosis of Colorectal Cancer and Polyposis Syndromes: A Cost-effectiveness Analysis. J
Clin Oncol. 2015;33(18):2084-91.
16. Li Y, Bare LA, Bender RA, Sninsky JJ, Wilson LS, Devlin JJ, Waldman FM. Cost effectiveness of
sequencing 34 cancer-associated genes as an aid for treatment selection in patients with
metastatic melanoma. Mol Diag Ther. 2015;19:169-177.
17. Hamblin A, Wordsworth S, Fermont JM, Page S, Kaur K, Camps C, Kaisaki P, Gupta A, Talbot D,
Middleton M, Henderson S, Cutts C, Vavoulis DV, Housby N, Tomlinson T, Taylor JC, Schuh A.
Clinical applicability and cost of a 46-gene panel for genomic analysis of solid tumours:
Retrospective validation and prospective audit in the UK National Health Service. PLoS Med.
2017;14(2):e1002230.
18. Insigna RP, Laessig R, Hoffman GL. Newborn screening with tandem mass spectrometry:
Examining its cost-effectiveness in the Wisconsin Newborn Screening Panel. J Pediatr.
2002;141(4):524-31.
19. Schwarze K, Buchanan J, Taylor JC, Wordsworth S. Are whole-exome and whole-genome
sequencing approaches cost-effective? A systematic review of the literature. Genet Med. 2018
Feb 15. doi:10.1038/gim.2017.247.
20. Graves JA, Zhou Z, Garbett S, Peterson JF. The value of pharmacogenomics information. In
Economic Dimensions of Personalized and Precision Medicine (eds. Berndt E, Goldman D, & Rowe
J.) (University of Chicago Press, Chicago, Forthcoming). Available from
https://www.nber.org/chapters/c13989 (accessed 10 October 2018)
21. Plumpton CO, Yip VLM, Alfirevic A, Marson AG, Pirmohamed M, Hughes DA. Cost-effectiveness
of screening for HLA-A*31:01 prior to initiation of carbamazepine in epilepsy. Epilepsia
2015;56(4):556-563.
22. Curtis L, Burns A. Unit Costs of Health and Social Care 2017 PSSRU. University of Kent,
Canterbury, 2017. https://www.pssru.ac.uk/project-pages/unit-costs/unit-costs-2017/ [Accessed
1 October 2018]
23. Plumpton CO, Pirmohamed M, Hughes DA. Cost effectiveness analysis of HLA-B*58:01
genotyping prior to initiation of allopurinol for gout. Rheumatology. 2017;56(10):1729-1739.
24. Kuo Chang-Fu, Grainge MJ, Mallen C, Zhang W, Doherty M. Rising burden of gout in the UK but
continuing suboptimal management: a nationwide population study. Ann Rheum Dis.
2015;74:661-667.
25. Annemans L, Spaepen E, Gaskin M, Bonnemaire M, Malier V, Gilbert T, Nuki G. Gout in the UK
and Germany: prevalence, comorbidities and management in general practice 2000-2005. Ann
Rheum Dis. 2008;67:960-966.
22
26. Joint Epilepsy Council of the UK and Ireland. Epilepsy prevalence, incidence and other statistics.
2011. http://www.jointepilepsycouncil.org.uk/ [Accessed 4 July 2018]
27. Veenstra DL. The value of routine pharmacogenomics screening – are we there yet? A
perspective on the costs and benefits of routine screening – shouldn’t everyone have this done?
Clin Pharmacol Ther. 2016;99(2):164-6
28. Chen Z, Liew D, Kwan P. Real-world cost-effectiveness of pharmacogenetic screening for epilepsy
treatment. Neurology 2016; 86(12):1086-1094
29. Kauf TL, Farkouh RA, Earnshaw SR, Watson ME, Maroudas P, Chambers MH. Economic efficiency
of genetic screening to inform the use of abacavir sulfate in the treatment of HIV.
Pharmacoeconomics 2010; 28(11): 1025-1039
30. Girardin FR, Poncet A, Perrier A, Vernaz N, Pletscher M, F Samer C, Liberman JA, Villard J. Cost-
effectiveness of HLA-DQB1/HLA-B (126Q) pharmacogenetic-guided treatment and blood
monitoring in US patients taking clozapine. Pharmacogenomics J 2018; doi: 10.1038/s41397-
017-0004-2
31. Currency exchange tables available from https://www.xe.com/currencytables/ [accessed 1
October 2018]
32. Skingsley A, Yin Z, Kirwan P, Croxford S, Chau C, Conti S, Presanis A, Nardone A, Were J, Ogaz D,
Furegeto M, Hibbert M, Aghaizu A, Murphy G, Tosswill J, Hughes G, Anderson J, Gill ON, Delpech
VC, and contributors. HIV in the UK - Situation Report 2015: data to end 2014. Public Health
England, London, 2015.
33. UK population estimate, available from
https://www.ons.gov.uk/peoplepopulationandcommunity/populationandmigration/populatione
stimates [accessed 1 October 2018]
34. Kudva GK, Gupta DK. Strategies in clozapine-resistant schizophrenia: A literature review. Journal
of Mental Health and Human Behaviour 2016; 21(1): 6-15.
35. National Institute for Health and Care Excellence. Guide to the methods of technology appraisal
2013. https://www.nice.org.uk/process/pmg9/ [Accessed 4 July 2018]
36. Waters L, Ahmed N, Angus B, et al. BHIVA guidelines for the treatment of HIV-1-positive adults
with antiretroviral therapy 2015 (2016 update). British HIV Association, 2016.
http://www.bhiva.org/documents/Guidelines/Monitoring/2016-BHIVA-Monitoring-
Guidelines.pdf [Accessed 4 July 2018]
37. Pirmohamed M, Burnside G, Eriksson N, Jorgensen AL, Toh CH, Nicolson T, Kesteven P,
Christersson C, Wahlstrom B, Stafberg C, Zhang E, Leathart JB, for the EU-PACT Group. A
randomized trial of genotype-guided dosing of warfarin. N Engl J Med. 2013;369:2294-2303.
23
38. Legge SE, Hamshere ML, Ripke S, Pardinas AF, Goldstein JI, Rees E, Richards AL, Leonenko G,
Jorskog LF, Chambert KD, Collier DA, Genovese G, Giegling I, Holmans P, Jonasdottir A, Kirov G,
McCarroll SA, MacCabe JH, Mantripragada K, Moran JL, Neale BM, Stefansson H, Rujescu D, Daly
MJ, Sullivan PF, Owen MJ, O'Donovan MC, Walters JTR; Clozapine-Induced Agranulocytosis
Consortium. Genome-wide common and rare variant analysis provides novel insights into
clozapine-associated neutropenia. Mol Psychiatry. 2017;22(10):1502-1508.
39. McCormack M, Alfirevic A, Bourgeois S, Farrell JJ, Kasperavičiūtė D, Carrington M, Sills GJ,
Marson T, Jia X, de Bakker PI, Chinthapalli K, Molokhia M, Johnson MR, O'Connor GD, Chaila E,
Alhusaini S, Shianna KV, Radtke RA, Heinzen EL, Walley N, Pandolfo M, Pichler W, Park BK,
Depondt C, Sisodiya SM, Goldstein DB, Deloukas P, Delanty N, Cavalleri GL, Pirmohamed M. HLA-
A*3101 and carbamazepine-induced hypersensitivity reactions in Europeans. N Engl J Med.
2011;364(12):1134-43.
40. Daly AK, Donaldson PT, Bhatnagar P, Shen Y, Pe'er I, Floratos A, Daly MJ, Goldstein DB, John S,
Nelson MR, Graham J, Park BK, Dillon JF, Bernal W, Cordell HJ, Pirmohamed M, Aithal GP, Day
CP; DILIGEN Study; International SAE Consortium. HLA-B*5701 genotype is a major determinant
of drug-induced liver injury due to flucloxacillin. Nat Genet. 2009;41(7):816-9.
24
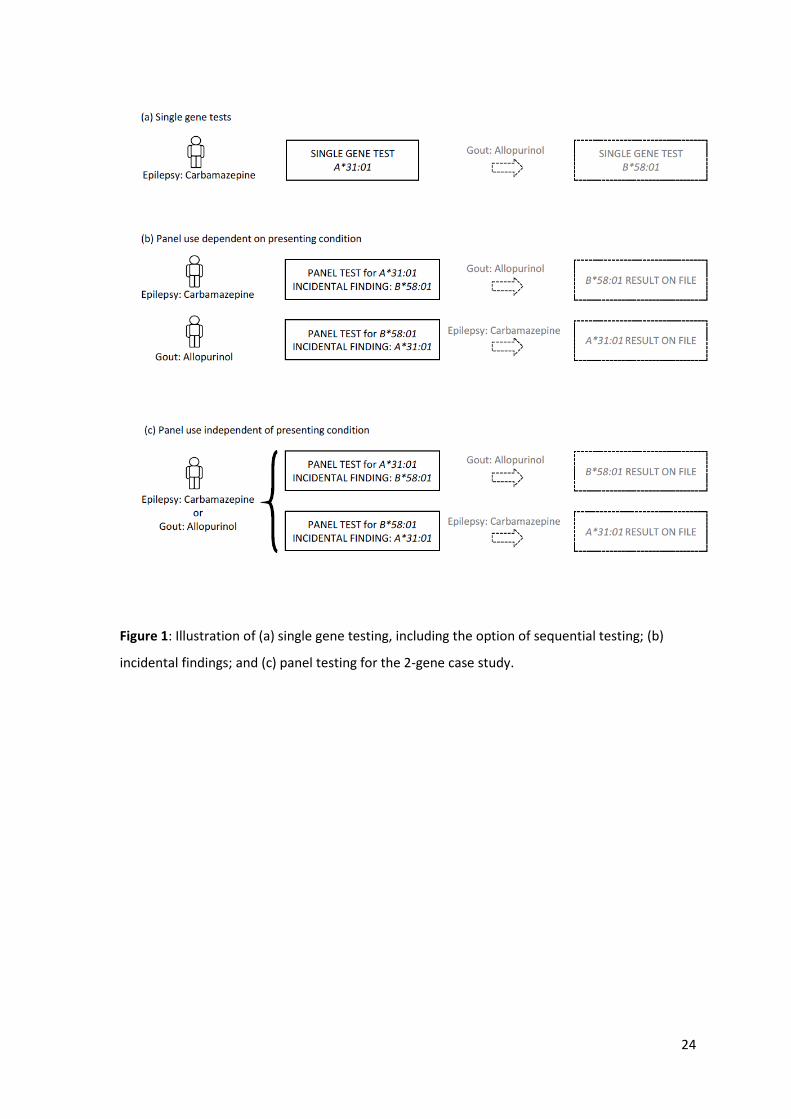
Figure 1: Illustration of (a) single gene testing, including the option of sequential testing; (b)
incidental findings; and (c) panel testing for the 2-gene case study.
25
A
B
C D
Initial drug
AlleleADR
No ADR
No allele
ADR
No ADR
PPV
1 - NPV
NPV
1 - PPV
Test
Allele
No alleleADR
No ADR
1 - NPV
NPV
P(allele)
P(allele)
1 - P(allele)
1 - P(allele)
No ADR
No ADR
PPV
1 - PPV
Alternative
Alternative
Alternative
Alternative
Initial drug
No test
Test
Allele
No alleleADR
No ADR
1 - NPV
NPV
P(allele)
1 - P(allele)
ADR
No ADR
Alternative
Alternative
Alternative
P(ADR)alternative
1-P(ADR)alternative
Alternative2*
ADR
No ADR
P(ADR)alternative
1-P(ADR)alternative
Alternative2*
ADR
No ADR
P(ADR)alternative
1-P(ADR)alternative
Alternative2*
Alternative
ADR
No ADR
P(ADR)alternative
1-P(ADR)alternative
Alternative2*
Initial drug
AlleleADR
No ADR
No allele
ADR
No ADR
PPV
1 - NPV
NPV
1 - PPV
P(allele)
1 - P(allele)
No test
26
E F
Initial drug
Allele
ADR
No ADR
No allele
ADR
No ADR
PPV
1 - NPV
NPV
1 - PPV
P(allele)
1 - P(allele)
No test
Survive
Death
1-P(mort)
P(mort)
Alternative
Survive
Death
1-P(mort)
P(mort)
Alternative
Test
Allele
No allele
ADR
No ADR
1 - NPV
NPV
P(allele)
1 - P(allele)
No ADR
No ADR
PPV
1 - PPV
Alternative
Initial drug
Survive
Death
1-P(mort)
P(mort)
Alternative
Initial drug
AlleleADR
No ADR
No allele
ADR
No ADR
PPV
1 - NPV
NPV
1 - PPV
Test
Allele
No alleleADR
No ADR
1 - NPV
NPV
P(allele)
P(allele)
1 - P(allele)
1 - P(allele)
No ADR
No ADR
PPV
1 - PPV
Alternative
Alternative
Alternative
Alternative
Initial drug
No test
Alternative
Alternative
Nfuture
Nfuture
Nfuture
Nfuture
Nfuture
Initial drug
Initial drugNfuture
Nfuture
Initial drug
Nfuture
27
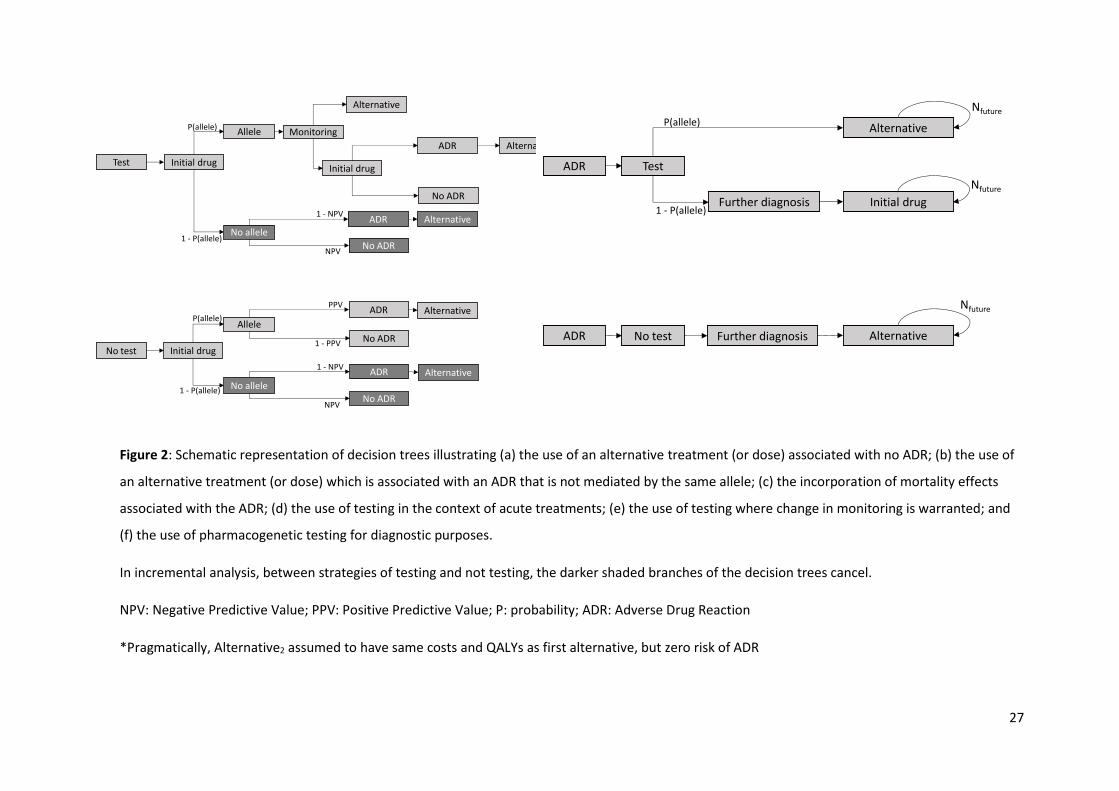
Figure 2: Schematic representation of decision trees illustrating (a) the use of an alternative treatment (or dose) associated with no ADR; (b) the use of
an alternative treatment (or dose) which is associated with an ADR that is not mediated by the same allele; (c) the incorporation of mortality effects
associated with the ADR; (d) the use of testing in the context of acute treatments; (e) the use of testing where change in monitoring is warranted; and
(f) the use of pharmacogenetic testing for diagnostic purposes.
In incremental analysis, between strategies of testing and not testing, the darker shaded branches of the decision trees cancel.
NPV: Negative Predictive Value; PPV: Positive Predictive Value; P: probability; ADR: Adverse Drug Reaction
*Pragmatically, Alternative2 assumed to have same costs and QALYs as first alternative, but zero risk of ADR
Initial drug
Allele
ADR
No ADR
No allele
ADR
No ADR
PPV
1 - NPV
NPV
1 - PPV
Initial drug
Allele
No alleleADR
No ADR
1 - NPV
NPV
P(allele)
P(allele)
1 - P(allele)
1 - P(allele)
Alternative
Initial drug
Monitoring
Alternative
Alternative
Alternative
No test
Test
ADR
No ADR
Alternative
Further diagnosis
Test
P(allele)
1 - P(allele)
No testADR
ADR
Alternative
Nfuture
Further diagnosis
Alternative
Nfuture
Initial drug
Nfuture
28
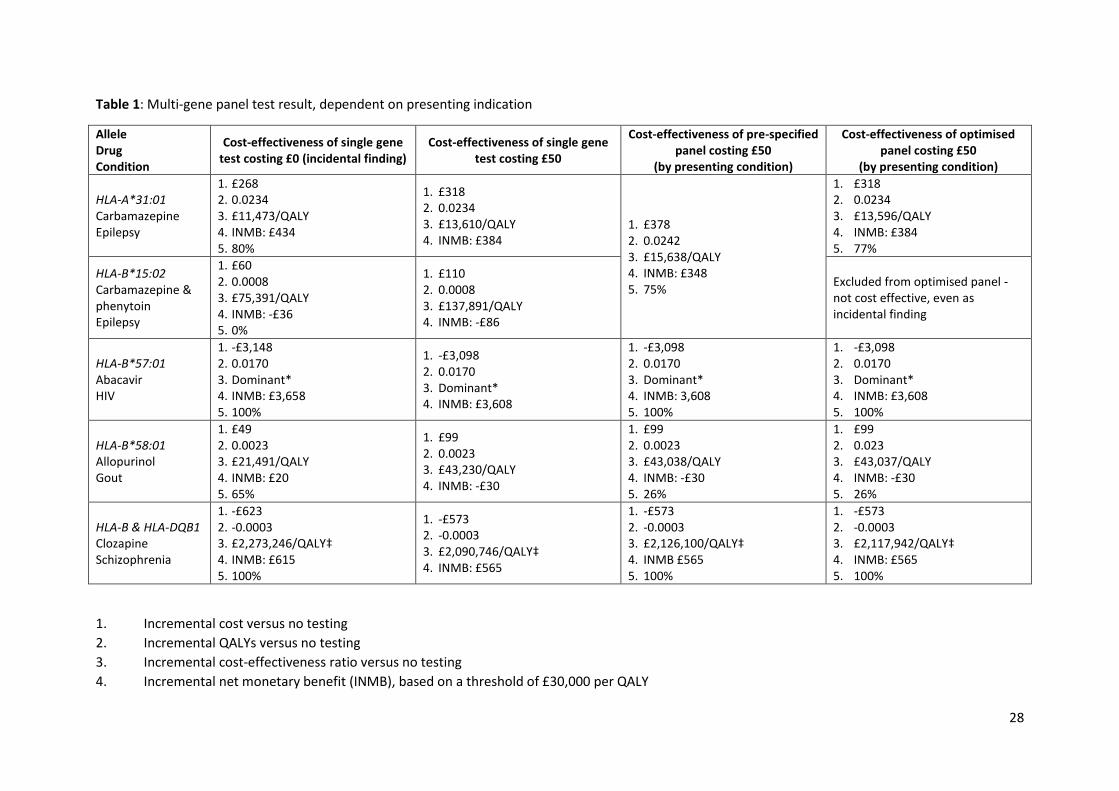
Table 1: Multi-gene panel test result, dependent on presenting indication
Allele Drug Condition
Cost-effectiveness of single gene test costing £0 (incidental finding)
Cost-effectiveness of single gene test costing £50
Cost-effectiveness of pre-specified panel costing £50
(by presenting condition)
Cost-effectiveness of optimised panel costing £50
(by presenting condition)
HLA-A*31:01 Carbamazepine Epilepsy
1. £268 2. 0.0234 3. £11,473/QALY 4. INMB: £434 5. 80%
1. £318 2. 0.0234 3. £13,610/QALY 4. INMB: £384
1. £378 2. 0.0242 3. £15,638/QALY 4. INMB: £348 5. 75%
1. £318 2. 0.0234 3. £13,596/QALY 4. INMB: £384 5. 77%
HLA-B*15:02 Carbamazepine & phenytoin Epilepsy
1. £60 2. 0.0008 3. £75,391/QALY 4. INMB: -£36 5. 0%
1. £110 2. 0.0008 3. £137,891/QALY 4. INMB: -£86
Excluded from optimised panel - not cost effective, even as incidental finding
HLA-B*57:01 Abacavir HIV
1. -£3,148 2. 0.0170 3. Dominant* 4. INMB: £3,658 5. 100%
1. -£3,098 2. 0.0170 3. Dominant* 4. INMB: £3,608
1. -£3,098 2. 0.0170 3. Dominant* 4. INMB: 3,608 5. 100%
1. -£3,098 2. 0.0170 3. Dominant* 4. INMB: £3,608 5. 100%
HLA-B*58:01 Allopurinol Gout
1. £49 2. 0.0023 3. £21,491/QALY 4. INMB: £20 5. 65%
1. £99 2. 0.0023 3. £43,230/QALY 4. INMB: -£30
1. £99 2. 0.0023 3. £43,038/QALY 4. INMB: -£30 5. 26%
1. £99 2. 0.023 3. £43,037/QALY 4. INMB: -£30 5. 26%
HLA-B & HLA-DQB1 Clozapine Schizophrenia
1. -£623 2. -0.0003 3. £2,273,246/QALY‡ 4. INMB: £615 5. 100%
1. -£573 2. -0.0003 3. £2,090,746/QALY‡ 4. INMB: £565
1. -£573 2. -0.0003 3. £2,126,100/QALY‡ 4. INMB £565 5. 100%
1. -£573 2. -0.0003 3. £2,117,942/QALY‡ 4. INMB: £565 5. 100%
1. Incremental cost versus no testing
2. Incremental QALYs versus no testing
3. Incremental cost-effectiveness ratio versus no testing
4. Incremental net monetary benefit (INMB), based on a threshold of £30,000 per QALY
29
5. Likelihood of cost-effectiveness at a threshold of £30,000 per QALY
*South-east quadrant of the cost-effectiveness plane – dominant means less costly and more effective than not testing
‡South-west quadrant of the cost-effectiveness plane – less costly and less effective than not testing (cost-effective if >£30,000 per QALY)
30
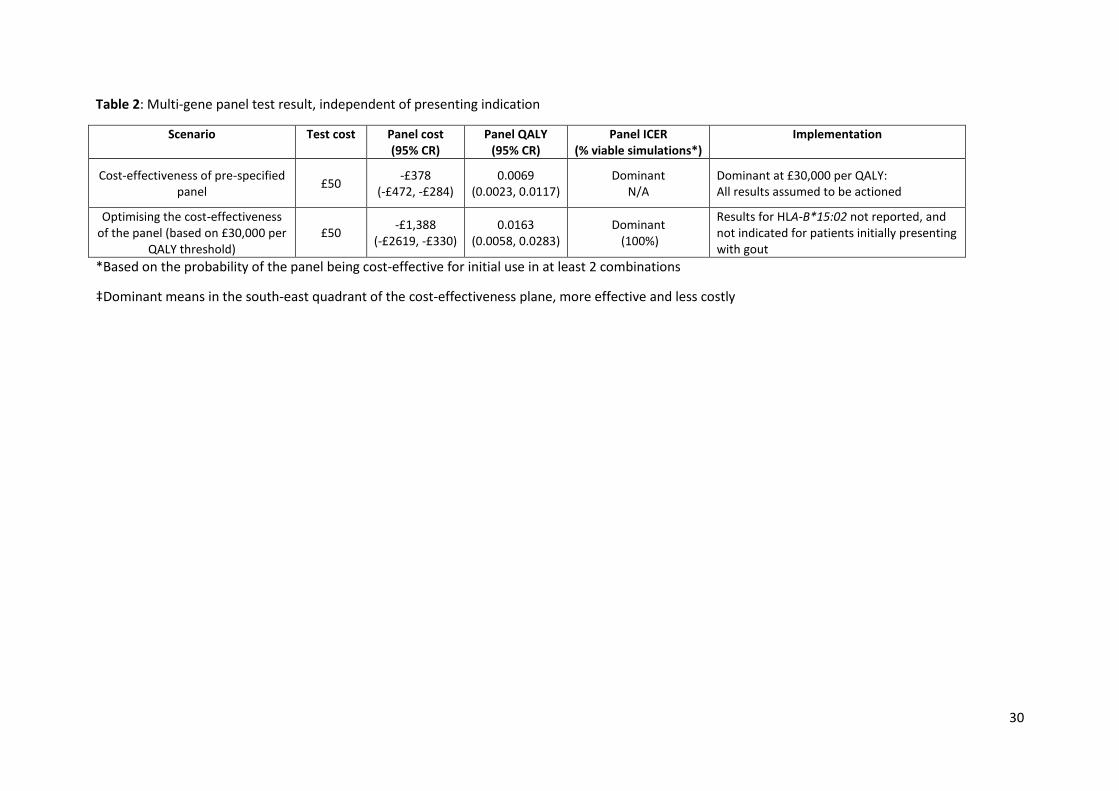
Table 2: Multi-gene panel test result, independent of presenting indication
Scenario Test cost Panel cost
(95% CR) Panel QALY
(95% CR) Panel ICER
(% viable simulations*) Implementation
Cost-effectiveness of pre-specified panel
£50 -£378
(-£472, -£284) 0.0069
(0.0023, 0.0117) Dominant
N/A Dominant at £30,000 per QALY: All results assumed to be actioned
Optimising the cost-effectiveness of the panel (based on £30,000 per
QALY threshold) £50
-£1,388 (-£2619, -£330)
0.0163 (0.0058, 0.0283)
Dominant (100%)
Results for HLA-B*15:02 not reported, and not indicated for patients initially presenting with gout
*Based on the probability of the panel being cost-effective for initial use in at least 2 combinations
‡Dominant means in the south-east quadrant of the cost-effectiveness plane, more effective and less costly
31
Table 3: Input parameters for estimating cost-utility of multiple-gene test
Allele Drug
Condition
Incident prescriptions
(per 1000 population)
𝜹cost for a single-gene test
Mean (SD)
𝚫QALY for a single-gene test
Mean (SD)
HLA-B*57:01 Abacavir HIV
0.0940 [32, 33]
-£3,148 (£315) b [22, 29, 31]
0.0017 (0.0017) b [29]
HLA-B*58:01 Allopurinol Gout
0.4301 [24, 25]
£49 (£2) c [22, 23, 31]
0.0023 (0.0016) c [23]
HLA-A*31:01a Carbamazepine Epilepsy
0.0765 [26]
£268 (£74) c [21, 22, 31]
0.0234 (0.0176) c
[21]
HLA-B*15:02a Carbamazepine & Phenytoin Epilepsy
0.0765 [22]
£60d (£6) b [22, 28, 31]
0.0008 (0.00008) b [28]
HLA-B (158T) & HLA-DQB1 (126Q) Clozapine Schizophrenia
0.0370 [33, 34]
-£623 (£62) b [22, 30, 31]
-0.0003 (0.00003) b [30]
aIn examples where both HLA-A*31:01 and HLA-B*15:02 are included on the panel, 𝛿cost and ΔQALY
for both genes are combined additively, with a single prevalence in order to reflect the immediate
relevance of the incidental find
bAs no published confidence intervals for incremental costs and QALYs, SD assumed as 10% of the
mean
cStandard deviations taken from original models [21, 23]
dTest cost not reported so assumed at £50 ($US65), cost year 2017