Embed Size (px)
Citation preview

Western University Western University
Scholarship@Western Scholarship@Western
Electronic Thesis and Dissertation Repository
10-20-2016 12:00 AM
Cost-Effectiveness of Selective Laser Trabeculoplasty (SLT) Cost-Effectiveness of Selective Laser Trabeculoplasty (SLT)
versus Argon Laser Trabeculoplasty (ALT) in Uncontrolled Open versus Argon Laser Trabeculoplasty (ALT) in Uncontrolled Open
Angle Glaucoma Patients having at least One Full Previous SLT: Angle Glaucoma Patients having at least One Full Previous SLT:
An Economic Evaluation Alongside an Ongoing Randomized An Economic Evaluation Alongside an Ongoing Randomized
Controlled Clinical Trial Controlled Clinical Trial
Muhammad Rakibuz-Zaman, The University of Western Ontario
Supervisor: Dr. William Hodge, The University of Western Ontario
A thesis submitted in partial fulfillment of the requirements for the Master of Science degree in
Epidemiology and Biostatistics
© Muhammad Rakibuz-Zaman 2016
Follow this and additional works at: https://ir.lib.uwo.ca/etd
Part of the Epidemiology Commons, Eye Diseases Commons, and the Ophthalmology Commons
Recommended Citation Recommended Citation Rakibuz-Zaman, Muhammad, "Cost-Effectiveness of Selective Laser Trabeculoplasty (SLT) versus Argon Laser Trabeculoplasty (ALT) in Uncontrolled Open Angle Glaucoma Patients having at least One Full Previous SLT: An Economic Evaluation Alongside an Ongoing Randomized Controlled Clinical Trial" (2016). Electronic Thesis and Dissertation Repository. 4228. https://ir.lib.uwo.ca/etd/4228
This Dissertation/Thesis is brought to you for free and open access by Scholarship@Western. It has been accepted for inclusion in Electronic Thesis and Dissertation Repository by an authorized administrator of Scholarship@Western. For more information, please contact [email protected].

ii
Abstract
Background and objective: ALT and SLT are both safe and effective for
glaucoma treatment. We performed a cost-effectiveness analysis (CEA) of SLT
versus ALT for a six-month follow-up period in uncontrolled open angle
glaucoma patients having at least one full previous SLT from an ongoing RCT.
Methods: Trial based treatment costing and IOP reduction at 6-month follow-up
from baseline for both intervention arms were calculated. A decision tree model
was developed considering possible clinical pathways of patients undergoing
repeat laser trabeculoplasty. CEA among ALT and SLT was done, and ICERs
were calculated from both societal and ministry perspective. One way sensitivity
analysis was done for cost and effectiveness parameters. Results: From Societal
perspective, expected cost/effectiveness for ALT and SLT was $458/0.143 mmHg
vs $448/0.123 mmHg respectively and from ministry perspective, $467/0.154
mmHg vs $446/0.122 mmHg, respectively. To switch from SLT to ALT, it would
cost $ 356.49 for each extra unit IOP reduction from societal perspective and from
ministry perspective, the same would cost $ 649.71. This ICERs were much higher
in comparison to ICERS of other IOP lowering medications in similar situations.
Conclusion: Neither ALT nor SLT strategies were clearly dominated by any
other. ALT is slightly more effective and slightly costly over SLT. Sensitivity
analysis with effectiveness variables showed dominance of SLT over ALT for
some instances. SLT has the theoretical plausibility of repeatability and is also
easier to perform than ALT. All these factors should be considered when opting
between ALT and SLT strategies.
KEYWORDS:
Argon laser trabeculoplasty, cost-effectiveness analysis, decision model tree,
economic evaluation, glaucoma, incremental cost effectiveness ratio, intra-ocular
pressure, selective laser trabeculoplasty.

iii
Acknowledgement
I would like to take this opportunity to thank all the faculty members and my
classmates of the department of Epidemiology and Biostatistics at University of
Western Ontario for offering me a friendly and successful academic environment.
My deep and sincere thanks and gratitude to my supervisor, Dr. William Hodge,
for his guidance, patience and encouragements throughout my entire courses. I am
grateful to my supervisory committee member Dr. Monali Malvankar for her very
effective advice and supervision for this project. My research would not be
possible without their active assistance. I feel very fortunate to have Dr. Hodge
and Dr. Malvankar who are not only great advisors, but also wonderful people to
remember forever.
I want to thank all the members and participants of the clinical trial team,
especially to Dr. Francie and Derek for helping me with data and clinical trial
protocol issues. My sincere gratitude to trial participants, without whom, it would
not be a reality.
I would like to thank my parents for the continuous and unconditional love and
support for me. My sincere appreciation and gratefulness to my beloved wife
Hamida Akter Mili and my only daughter Shaptarshi Zaman Momo for their
patience and care throughout this endeavor and for making every moment of my
life meaningful and happy.

iv
TABLE OF CONTENTS
ABSTRACT ........................................................................................................... II
KEYWORDS: ........................................................................................................ II
ACKNOWLEDGEMENT ...................................................................................III
LIST OF TABLES ............................................................................................. VIII
LIST OF FIGURES ............................................................................................... X
LIST OF ABBREVIATIONS .............................................................................. XI
CHAPTER 1 - INTRODUCTION ........................................................................ 1
CHAPTER 2 - BACKGROUND AND LITERATURE REVIEW .................... 6
2.1- GLAUCOMA: AN OVERVIEW .......................................................................................6
2.1.1 The sneak thief of vision ........................................................................... 6
2.1.2 Historical Background ............................................................................. 6
2.1.3 Classification ............................................................................................ 7
2.1.4 Pathophysiology ..................................................................................... 13
2.1.5 Natural History of Glaucoma ................................................................. 16
2.1.6 Descriptive Epidemiology ....................................................................... 18
2.1.7 Risk factors ............................................................................................. 19
2.2 MANAGEMENT OF GLAUCOMA ..................................................................................20
2.2.1 Diagnosis of Glaucoma .......................................................................... 20
2.2.2 Planning of Treatment ............................................................................ 24
2.2.3 Treatment Options for Glaucoma ........................................................... 25
2.3 ECONOMIC EVALUATION OF HEALTHCARE: AN OVERVIEW ......................................38
2.4 TRIAL BASED ECONOMIC EVALUATION ....................................................................42
2.5 MARKOV MODELLING ...............................................................................................43
2.6 ECONOMIC EVALUATION OF GLAUCOMA ..................................................................44

v
CHAPTER 3 – METHODS ................................................................................. 47
3.1 - TRIAL SECTION ........................................................................................................47
3.1.1 - Ethics statement .................................................................................... 47
3.1.2 The Hypothesis and the Design of the Trial ........................................... 47
3.1.3 Trial Interventions .................................................................................. 48
3.1.4 Study Center ............................................................................................ 49
3.1.5 Randomization and Allocation ............................................................... 49
3.1.6 Treatment Masking ................................................................................. 49
3.1.7 Inclusion and Exclusion Criteria ............................................................ 49
3.1.8 Starting medication status of patients .................................................... 51
3.1.9 Duration of Intervention ......................................................................... 51
3.1.10 Baseline data, Frequency and Duration of Follow-Up ........................ 51
3.1.11 Primary and Secondary Outcomes ....................................................... 51
3.1.12 Sample size: .......................................................................................... 52
3.1.13 Trial Management ................................................................................ 54
3.2 DECISION TREE MODEL .............................................................................................55
3.2.1 Structuring the decision tree model ........................................................ 56
3.2.2 Societal and Ministry perspective of the decision model tree ................ 56
3.2.3 Calculation of success and failure ratio of each intervention for the
decision tree model .......................................................................................... 57
3.2.4 Determining effectiveness of each intervention ...................................... 57
3.2.5 Calculation of expected values of costs and effectiveness ...................... 61
3.2.6 Calculation of incremental cost-effectiveness ratios (ICERS) ............... 61
3.2.7 Willingness to pay (WTP) ....................................................................... 61
3.2.8 Sensitivity analysis .................................................................................. 61
3.3 CALCULATION OF INTERVENTION COSTS ...................................................................62
3.3.1 Calculation of direct costs ...................................................................... 62
3.3.2 Costs not included: ................................................................................. 65
3.4 FINAL ANALYSES AND MEASURES .............................................................................65

vi
CHAPTER 4 - RESULTS .................................................................................... 66
4.1 DESCRIPTIVE STATISTICS ..........................................................................................66
4.2 NUMBER OF IOP LOWERING MEDICATIONS AT BASELINE: ........................................66
4.3 BASELINE AND FOLLOW-UP MEAN IOP AT DIFFERENT TIME POINT: ..........................67
4.4 MEAN IOP REDUCTION FROM BASELINE AT DIFFERENT TIME POINTS: ......................67
4.5 EYES ACHIEVING 20% IOP REDUCTION FROM BASELINE TO DIFFERENT TIME
POINTS: ............................................................................................................................68
4.6 OUTCOME OF TREATMENT (SUCCESS OR FAILURE) AT 6-MONTH FOLLOW-UP ............68
4.7: OBTAINING RATIO OF TREATMENT OUTCOME FOR THE DECISION MODEL TREE ......70
4.7.1 Societal perspective ................................................................................ 70
4.7.2 Ministry Perspective ............................................................................... 72
4.8 COST OF THE INTERVENTION ARMS ............................................................................74
4.9 MEAN IOP REDUCTION AT 6-MONTH FOLLOW-UP ....................................................75
4.9.1 Societal perspective: ............................................................................... 75
4.9.2 Ministry Perspective: .............................................................................. 75
4.10 DETERMINATION OF EFFECTIVENESS FOR INTERVENTION ARMS .............................76
4.10.1 Societal perspective .............................................................................. 76
4.10.2 Ministry Perspective ............................................................................. 76
4.11 EXPECTED VALUES (COST/EFFECTIVENESS) FROM THE DECISION MODEL TREE ....77
4.11.1 Societal perspective .............................................................................. 77
4.11.2 Ministry Perspective ............................................................................. 79
4.12: INCREMENTAL COST-EFFECTIVENESS RATIO (ICER) .............................................80
4.12.1 Societal perspective .............................................................................. 80
4.12.2 Ministry Perspective ............................................................................. 81
4.13 SENSITIVITY ANALYSIS ...........................................................................................82
4.13.1 One-Way Sensitivity analysis of Effectiveness: Societal perspective ... 82
4.13.2 One-Way Sensitivity analysis of Capital Cost: Societal perspective.... 83
4.13.3 One-Way Sensitivity analysis of Effectiveness: Ministry Perspective .. 84
4.13.4 One-Way Sensitivity analysis of Capital Cost: Ministry Perspective .. 86

vii
CHAPTER 5: DISCUSSION .............................................................................. 87
5.1 RESULTS ....................................................................................................................87
5.1.1 Clinical Trial Cohort .............................................................................. 88
5.1.2 Use of IOP lowering medications at baseline: ....................................... 89
5.1.3 Costing Aspects ....................................................................................... 89
5.1.4 Effectiveness Aspects and IOP reduction at 6-month follow-up ............ 89
5.1.5 Cost-Effectiveness Analysis (CEA) and Incremental Cost Effectiveness
Ratio (ICER): Societal perspective .................................................................. 90
5.1.6 Cost-Effectiveness Analysis (CEA) and Incremental Cost Effectiveness
Ratio (ICER): Ministry Perspective ................................................................ 91
5.1.7 Sensitivity Analysis: Societal perspective ............................................... 91
5.1.8 Sensitivity Analysis: Ministry Perspective .............................................. 91
5.2 STRENGTHS OF THE STUDY ........................................................................................92
5.3 LIMITATIONS OF THE STUDY ......................................................................................93
5.4 CONCLUSION .............................................................................................................93
5.5 IMPLICATION OF STUDY RESULTS AND FUTURE DIRECTION ......................................94
REFERENCES: .................................................................................................... 95
APPENDIX ......................................................................................................... 116
APPENDIX A: ONE-WAY SENSITIVITY ANALYSIS TABLE ...............................................116
APPENDIX B: DIFFERENT FORMS USED IN THE RCT .....................................................128
APPENDIX C: RECALCULATION OF POWER OF THE STUDY FOR REDUCED SAMPLE
SIZE ...............................................................................................................................141
CURRICULUM VITAE .................................................................................... 142

viii
LIST OF TABLES
Table 1: Capital cost calculation ............................................................................ 64
Table 2: Descriptive statistics of participants......................................................... 66
Table 3: Number of IOP lowering medications at baseline ................................... 67
Table 4: Mean IOP (in mmHg) at baseline and different time points .................... 67
Table 5: Mean IOP reduction (in mmHg) from baseline at different time points .. 68
Table 6: Eyes with 20% IOP reduction from baseline at different time points ..... 68
Table 7: Outcome of treatment at 6-month follow-up ........................................... 68
Table 8: Previous SLT history and outcome at 6-month follow-up ....................... 69
Table 9: Outcome among race/ethnicity at 6-month follow-up ............................. 69
Table 10: IOP Spike at 1-hour post-laser ............................................................... 69
Table 11: Further treatment plan for failure cases at 6-month follow-up .............. 70
Table 12: One-hour post-laser IOP spike for ALT and SLT group: Societal
perspective .............................................................................................................. 70
Table 13: IOP Spike at 1-hour post-laser and treatment outcome at 6-month for
ALT: Societal perspective ...................................................................................... 71
Table 14: IOP Spike at 1-hour post-laser and treatment outcome at 6-month for
SLT group: Societal perspective ............................................................................ 71
Table 15: Treatment (Rx) plan for failure cases (at 6-month follow-up) of ALT
group: Societal perspective..................................................................................... 71
Table 16: Treatment (Rx) plan for failure cases (at 6-month follow-up) of SLT
group: Societal perspective..................................................................................... 72
Table 17: One hour post-laser IOP spike for ALT and SLT group: Ministry
perspective .............................................................................................................. 72

ix
Table 18: IOP Spike at 1-hour post-laser and treatment outcome at 6-month for
ALT group: Ministry perspective ........................................................................... 73
Table 19: IOP spike at 1-hour post-laser and treatment outcome at 6-month for
SLT group: Ministry perspective ........................................................................... 73
Table 20: Treatment plan for failure cases (at 6-month follow-up) of ALT group:
Ministry perspective ............................................................................................... 73
Table 21: Treatment plan for failure cases (at 6-month follow-up) of SLT group:
Ministry perspective ............................................................................................... 74
Table 22: Cost-Calculations of the interventions ................................................... 74
Table 23: Baseline IOP and IOP reduction at 6-month: Societal perspective ....... 75
Table 24: Baseline IOP and IOP reduction at 6-month: Ministry perspective ...... 75
Table 25: IOP lowering effectiveness at 6-month follow-up for ALT and SLT:
Societal perspective ................................................................................................ 76
Table 26: IOP lowering effectiveness at 6-month follow-up (v6) for ALT and SLT
group: Ministry perspective .................................................................................... 76
Table 27: CEA of ALT vs SLT, base case: Societal perspective ........................... 80
Table 28: CEA of ALT vs SLT, base case: Ministry perspective .......................... 81
Table 29: Sensitivity analysis of effectiveness value: Societal perspective .......... 82
Table 30: Sensitivity analysis of capital cost value from societal perspective ...... 83
Table 31: Sensitivity analysis of effectiveness value: Ministry perspective .......... 84
Table 32: Sensitivity analysis of capital cost value: Ministry perspective ............ 86
Table 33: Cost-effectiveness analysis of prostaglandin analogues for ophthalmic
use ........................................................................................................................... 92

x
LIST OF FIGURES
Figure 1: Different parts of eye ................................................................................ 9
Figure 2: Outflow of aqueous humor ..................................................................... 14
Figure 3: Optic nerve anatomy ............................................................................... 15
Figure 4: Normal boundary of field of vision ........................................................ 16
Figure 5: Decision Tree Model of ALT and SLT intervention: Societal perspective
................................................................................................................................ 59
Figure 6: Decision Tree Model of ALT and SLT intervention: Ministry
Perspective .............................................................................................................. 60
Figure 7: Expected Values of Cost/Effectiveness from Decision Model Tree:
Societal perspective ................................................................................................ 78
Figure 8: Expected Values of Cost/Effectiveness from Decision Model Tree:
Ministry Perspective ............................................................................................... 79
Figure 9: Cost-Effectiveness graph from the societal perspective ......................... 80
Figure 10: Cost-Effectiveness graph from ministry perspective ............................ 81
Figure 11: One-Way Sensitivity analysis of Effectiveness: Societal perspective .. 83
Figure 12: One-Way Sensitivity analysis of Capital Cost: Societal perspective ... 84
Figure 13: One-Way Sensitivity analysis of Effectiveness: Ministry perspective . 85
Figure 14: One-Way Sensitivity analysis of Capital Cost: Ministry Perspective .. 86

xi
LIST OF ABBREVIATIONS
ACG: Angle Closure Glaucoma
ALT: Argon Laser Trabeculoplasty
C/E: Cost-Effectiveness Ratio
CAD: Canadian Dollar
CAIs: Carbonic Anhydrase Inhibitors
CBA: Cost-Benefit Analysis
CCT: Central Corneal Thickness
CDR: Cup:Disc Ratio
CEA: Cost-Effectiveness Analysis
CMA: Cost-Minimization Analysis
CSF: Cerebrospinal Fluid
CUA: Cost-Utility Analysis
DSMC: Data Safety and Monitoring Committee
GAT: Goldmann Applanation Tonometry
HMMS: Healthcare Materials Management Services
ICER: Incremental Cost-Effectiveness Ratio
ICG: Indocyanine Green
IOP: Intra Ocular Pressure
LTP: Laser Trabeculoplasty
OAG: Open Angle Glaucoma
OCT: Optical Coherence Tomography

xii
OH: Ocular Hypertension
OHIP: Ontario Health Insurance Plan
PACG: Primary Angle Closure Glaucoma
PDS: Pigment Dispersion Syndrome
PG: Pigmentary Glaucoma
PGAs: Prostaglandin Analogues
POAG: Primary Open Angle Glaucoma
PXFG: Pseudoexfoliative Glaucoma
PXFS: Pseudoexfoliation Syndrome
QALY: Quality-Adjusted Life Year
QAYV: Quality Adjusted Year of Vision
RCT: Randomized Controlled Trial
RNFL: Retinal Nerve Fiber Layer
SJHC: St. Joseph’s Health Care, London, ON
SLT: Selective Laser Trabeculoplasty
TM: Trabecular Meshwork

1
Chapter 1 - Introduction
Glaucoma, a progressive degeneration of the retinal ganglion cells, results in
characteristic visual field defects (initially peripheral, then central loss of field of
vision) (Gemenetzi et al. 2011). It may remain asymptomatic until becoming
severe because of redundancy in the sensory system and the binocular nature of
vision; one eye may compensate for early losses in the other (Weinreb et al. 2014).
It is the second-leading cause of blindness and leading cause of irreversible
blindness worldwide, having an estimation of 79.6 million glaucoma patients by
2020, and 74% of these will have open angle glaucoma (OAG) (Quigley et al.
2006). By 2040, an estimated 111.8 million people will suffer from glaucoma
worldwide (Tham et al. 2014). Primary OAG (POAG) is the most common type;
others include pigmentary OAG and pseudoexfoliative OAG (Musch et al. 2012).
Increased intra ocular pressure (IOP) is considered as the most important
modifiable factor for development and prognosis of POAG (Anderson et al. 1989).
But the disease may occur in normal IOP also (Bahrami et al. 2006). Other
important risk factors are thinner central corneal measurement, older age, and
family history for glaucoma (Coleman et al. 2008, Friedman et al. 2004).
Along with age-related macular degeneration and diabetic retinopathy, glaucoma
is the most important ocular public health problem in Canada with an annual
economic burden close to $500 million (Hodge et al. 2004). It affects 1-2% of
individuals over age 50. An estimated 400,000 Canadians are affected with over
10,000 blind (Hodge et al. 2004, Tielsh et al. 1991). ). In 2008-2009, Statistics
Canada reported that, more than 450,000 Canadians aged 45 years and above have
been diagnosed with glaucoma by health professionals (Statistics Canada, 2010).
The quick accrual of medical information and rapidly evolving newer medical
technologies results in several different management options even for a single
medical condition. Thus, selection of treatment modalities becomes difficult at

2
both individual and policy level, warranting the development of guidelines for
clinical practice and to set pragmatic funding priorities for policy on medical
intervention directing what action should be done and paid for (Petitti. 2000).
Expensive health care, globally, includes a large and increasing share of private
and public expenditure (CIHI 2013). Economic considerations for treatment
options are getting more importance day by day as health systems are under
enormous pressure to maximize the value for money. Consequently, clinical
effectiveness alone is not the only criteria for adoption of an intervention
nowadays. The value for money has to be considered equally along with the
clinical effectiveness (Health Council of Canada. 2009). Economic evaluation
measures and values explicitly to compare alternative courses of action in terms of
both their costs and good or bad consequences. (Drummond et al. 2015; Hurley.
2010). Cost-Effectiveness Analysis (CEA), a method for economic evaluation,
compares decision options in terms of their monetary costs and offers a framework
where clinical effectiveness data along with costs are examined together and
relevant issues on costs and clinical effectiveness of comparative alternative
medical interventions can be addressed. A decision analytic model, especially in
medical applications, is the usual conceptual basis for analysis of the effectiveness
of the decision options. CEA, in addition, involves cost identification of the
decision options and their valuation. In many instances, CEA also explores
preferences of society or individuals of the decision option for the health outcomes
(Petitti, 2000), termed utilities. The Incremental Cost-Effectiveness Ratio or
ICER, which is the difference in cost divided by the difference in effectiveness of
two or more competitive or alternative programs or interventions, represents the
cost per additional unit of health effect (Petitti, 2000). Considering local context
and decision rules, decision makers may use the ICER to determine whether or not
a technology represents a good value for money.

3
Open angle glaucoma has a life-long progressive course. Once started, it is non-
curable, only treatable. Its management requires careful selection of different
combination of treatment modalities (mainly medications, laser therapy and
surgery) on an individual patient at different time point and situation to achieve
and maintain the target IOP to either halt or delay the disease progression.
Otherwise, it may result in negative health consequences like increased blindness,
falls, depression, and decrease in quality of life (Schmier et al. 2007). The
mainstay of treating glaucoma is to halt or delay the deterioration of glaucomatous
visual field defects, typically by reducing intraocular pressure.
Pharmacological treatment to lower increased IOP started nearly 150 years ago
(Realini, et al. 2011). Currently, there are five major classes of drugs for the
treatment of glaucoma: (i) Prostaglandin analogues (PGAs) ; (ii) Beta-
adrenoceptor antagonists; (iii) Adrenoceptor agonists; (iv) Carbonic anhydrase
inhibitors (CAIs); and (v) Cholinergics (acetylcholine receptor agonists) (Marquis
and Whitson.2005), with at least 56,000 possible options for medication types,
doses and schedules of glaucoma (Realini and Fetchner, 2002). They act by either
decreasing aqueous humor production or by increasing aqueous outflow.
Additional treatment modalities include stents, non-incisional surgery and
incipient neuro-protective treatment (Wentz et al. 2014). A new emerging future
treatment option for glaucoma is Rho kinase inhibitor (RKI), which inhibits the
Rho-associated protein kinase (ROCK) signaling pathway (Bagnis et al.2011;
Wang and Chang. 2014). Unfortunately, not all patients reach intra ocular pressure
goals, despite efforts to treat with either medical monotherapy or combination of
medical therapies. Use of anti-glaucomatous medications also carries the risk of
ocular and systemic adverse effects. Non- compliance with instilling ocular
medications on a regular basis is also a great barrier to the success of
pharmacological therapy (Rotchford et al. 1998). Despite the government’s
funding for glaucoma medications for those aged 65 and over in Canada, the non-

4
adherence and non-compliance issues related to glaucoma medications remain a
great challenge for optimal successful outcome of medical treatment (Kholdebarin
et al. 2008).
Surgical therapy may be effective but carries the risk of sight threatening
hemorrhage, infection, or hypotony (Vijaya et al. 2011).
Laser treatment of glaucoma guarantees patient compliance without any disastrous
post-procedural complications. The results of Glaucoma Laser Trial (GLT)
demonstrated that, laser trabeculoplasty (LTP) was at least as efficacious as anti-
glaucomatous medications as the first-line treatment for POAG patients (The
Glaucoma Laser Trial Research Group, 1990; The Glaucoma Laser Trial Research
Group, 1995). Argon laser trabeculoplasty (ALT), introduced by Wise and Witter
in 1979, is an effective way of lowering increased IOP by facilitating aqueous
outflow through trabecular meshwork (TM) (Wise et al. 1979), but its
effectiveness decreases with retreatment due to detrimental disruption to the
microstructure of the TM, and this excessive TM damage often determines
treatment failure (Hodge et al. 2005; Fink et al. 1988). In 1995, Latina introduced
selective laser trabeculoplasty (SLT), an alternative laser treatment, by using a
frequency doubled, Q switched Nd: YAG laser (532 nm) in lieu of an argon wave
length (488 nm to 514 nm) (Latina et al. 1995, Latina et al. 1998). SLT targets
the pigmented TM keeping the TM architecture more preserved, especially the
long spacing collagen (Cvenkel et al.2003). This has the theoretical advantage of
successful repeatability of SLT over ALT. The efficacy and safety of SLT are
similar to ALT for first laser treatments (Damji et al. 1999; Hodge et al. 2005,
Damji et al. 2006).
The outcome of glaucoma treatments, especially in terms of IOP lowering effects,
varies widely from patient to patient. Medications have non-compliance issues and
surgical options are tagged with complications, often sight and even life
threatening. Laser treatments, are devoid of these drawbacks and are now used

5
widely with increasing popularity among patients and ophthalmologists. Laser
treatments, especially SLT, are even considered by many ophthalmologists as a
good choice for first-line treatment as studies support this claim (Waisbourd and
Katz, 2014). SLT has the theoretical advantage for repeat treatment of glaucoma
over ALT.
The aim of this thesis is to perform a cost-effectiveness analysis of SLT versus
ALT in uncontrolled open angle glaucoma patients (including ocular hypertension,
pigmentary dispersion syndrome and pseudoexfoliation syndrome) and at least one
previous full SLT by examining the relevant data from an ongoing randomized
clinical trial entitled ‘A randomized clinical trial of selective laser trabeculoplasty
(SLT) in open angle glaucoma who had been previously treated with complete
SLT’ on a short horizon (6-month) of follow-up. It will provide us important
information and direction about the cost-effectiveness of ALT and SLT treatment
for above-mentioned group of patients. We will also have a general impression of
both cost and effectiveness (in term of IOP lowering effect) of ALT and SLT in a
usual setting of such health care practice.

6
Chapter 2 - Background and Literature Review
2.1- Glaucoma: An overview
2.1.1 The sneak thief of vision
Glaucoma, a collective term for heterogeneous group of conditions having, in
common, an irreversible, progressive optic neuropathy with distinctive patterns of
structural changes in the optic nerve head (cupping) resulting in visual field loss
(Rouland et al, 2005). The diversities of clinico-histopathological manifestations
are not commonly appreciated by the general people (Allingham et al. 2011). The
initial slow impairment of vision of the affected eye, starting usually in the
peripheral field of vision and encroaches centrally in advance stage, is well
compensated by the fellow healthy eye (Weinreb et al. 2014). As a result, when
patient recognizes the visual field defect, progression of glaucoma usually causes
severe and irreversible damage to the retinal ganglionic cell and visual field in the
affected eye (Pan and Varma, 2011).
2.1.2 Historical Background
The description of glaucomatous condition can be found during the era of
Hippocrates (Sorsby. 1932). The term ‘Glaucoma’ coined from the early Greek
‘glaukos’, a term to describe blue, green or light gray and possibly also used to
indicate the color of the pupil in affected eyes (Leffler et al. 2015; Mark, 2010).
Until 17th century, glaucoma was nearly indistinguishable from cataract and
inflammatory condition of the eye (Frezzotti, 2000). After introduction of
ophthalmoscope in 1851 by Hermann Vonn Helmholtz (Keeler, 2002),
ophthalmologists could observe that excavated optic neuropathy was characteristic
of patients having co-morbidity with mydriasis, an anteriorly prominent lens and a
green pupil (glaucoma), albeit some patient with normal pupil (amaurosis) also
had excavated optic neuropathy (Leffler et al. 2015). In the middle of the 19th
century, Graefe thought ocular hypertension as a form of glaucoma. Donders
called it “glaucoma simplex” shortly thereafter. Mackenzie, Jaeger, Weber and

7
Graefe emphasized that, the cupping viewed during ophthalmoscopic examination
was due to the swelling of optic disc resulted from elevated aqueous pressure
(Nathan, 2000; Frezzotti, 2000). The ciliary body as a source of aqueous humor
secretion was discovered by Leber (Barnshaw, 1979). Graefe developed a
transpalpebral tonometer in 1862, and Maklakoff and Fick developed applanation
tonometers in 1880 (Kniestedt et al. 2008), both intended to measure intraocular
pressure, a cornerstone diagnostic aspect of the disease.
2.1.3 Classification
Glaucoma is usually classified based on:
Etiological*
Primary (No identifiable ocular or systemic disorders)
Secondary (Identifiable ocular or systemic disorders)
Mechanism of IOP elevation*
Open angle (No clinically visible anatomical obstruction to aqueous
outflow in the iridocorneal drainage angle) with IOP elevation or
without IOP elevation (Normal tension).
Angle closure (Clinically visible anatomical obstruction to aqueous
outflow in the iridocorneal drainage angle)
Based on severity*
Early glaucoma
Moderate glaucoma
Advanced glaucoma
Developmental**
Primary congenital glaucoma (from birth to 9 years)
Primary juvenile glaucoma (from 9 years to 35 years)
Axenfeld and Rieger anomaly (AXRA)

8
Peters anomaly
Anirida
*(Barton and Hitchings, 2013a); **(Auw-Haedrich et al. 2015).
2.1.3.1 Ocular Hypertension (OH)
In 1970, the term ‘Ocular Hypertension’ was introduced to separate persons
having IOP greater than 21 mm Hg, who are at increased risk of developing
POAG than persons with normal IOP (i.e., <21 mm Hg) (Allingham et al. 2011).
Despite the similar flow pattern of aqueous humor of a person with normal IOP,
patients with ocular hypertension exhibit higher IOP and resistance to aqueous
outflow (Ziai et al. 1993).
2.1.3.2 Primary Open Angle Glaucoma (POAG)
It is the most prevalent form of glaucoma (aka Chronic Open-Angle Glaucoma).
Damage of the optic nerve head is the ultimate result of the disease pathway due to
all potential etiologies. As stated earlier, it has no warning signs until the
development of advanced visual field loss. Elevated IOP (usually>21mm Hg
before the start of treatment), due to aqueous outflow obstruction, is the most
important modifiable risk factor (Allingham et al. 2011). When the pathway of
aqueous humor is blocked, pressure inside eyeball raises due to excess
accumulation of aqueous humor. This increased pressure causes slow and
irreversible damage of optic nerve head leading to irreversible blindness.

9
Figure 1: Different parts of eye
[Source:
https://commons.wikimedia.org/wiki/File:Three_Main_Layers_of_the_Eye.png]
Transforming growth factor - β2 (TGF- β2), the predominant isoform of
transforming growth factor - β in ocular tissue, is elevated in POAG patients than
normal individuals. It may decrease the cellularity of the trabecular meshwork
resulting in excessive amounts of extracellular matrix materials and formation of
plaque from the thickened sheath of elastic fibers with eventual increased
resistance to the aqueous outflow (Tamm and Fuchshofer, 2007; Agarwal et al.
2015). Narrowing of Schlemm’s canal with collapse also results in increased
resistance to the aqueous outflow (Johnson 2010). Attenuation of intrascleral

10
channels may also contribute to increased aqueous outflow resistance (Grieshaber
et al. 2010). Many patients with POAG are unusually sensitive to corticosteroids
that may also aggravate the situation (Allingham et al. 2011). Along with elevated
IOP, additional factors like induction of fibrosis and capillary loss (with increased
connective tissue in the septa and surrounding the central retinal vessels, including
increased amounts of type IV and VI collagen) are involved in glaucomatous optic
neuropathy (Gottanka et al. 2005). Low cerebrospinal fluid (CSF) pressure is often
observed in POAG (Berdahl et al. 2008). The critical balance between
neuroprotective and neurodegenerative roles of the immune system in glaucoma
determines the ultimate fate of retinal ganglionic cells in response to various
stressors (Allingham et al. 2011). In experimental glaucoma, apoptotic death of
retinal ganglionic cells occurrs (Quigley, 1999). The Canadian Glaucoma Study
reported an association of elevated anticardiolipin antibody (one of the
antiphospholipid antibodies), with progression of POAG (Chauhan et al. 2008). In
treatment of a patient with POAG, the target IOP range for both eyes in which
there will presumably be no further optic nerve damage, has to be determined and
would need to be reevaluated at each follow-up visit. Usually, target IOP is
achieved with topical anti-glaucomatous medications. If not achieved despite
maximum tolerated medical therapy, laser trabeculoplasty (argon or selective) is
indicated followed by glaucoma filtration surgery or other appropriate incisional
surgical therapeutic maneuvers (Allingham et al. 2011).
2.1.3.3 Pseudoexfoliation Syndrome (PXFS) and Pseudoexfoliative Glaucoma
(PXFG)
A systemic disorder with important eye manifestations, pseudoexfoliation
syndrome (aka exfoliation syndrome) is globally the most common identifiable
cause (secondary) of open angle glaucoma; it is also associated with angle closure
glaucoma and cataract with zonular instability (Ritch, 1994). When glaucoma is
present with PXFS, it is called pseudoexfoliative glaucoma (aka exfoliative

11
glaucoma, capsular glaucoma). Due to rarity of true lens capsule delamination, the
term ‘pseudo’ is most often used (Allingham et al. 2011). PXFS is more common
in older age groups (Aström et al. 2007). Most eyes with PXFG follow an open
angle mechanism, (a small number present with acute angle closure glaucoma),
and control of IOP is difficult in open angle PXFG compared to similar IOP level
of POAG (Allingham et al. 2011). When PXFS is fully developed, exfoliation
material is seen on the anterior lens surface, and increased and uneven trabecular
meshwork pigmentation due to excessive pigment dispersion is observed. In
PXFG, elevated IOP and typical glaucomatous neuroretinal rim loss are present
along with exfoliation material in the anterior lens surface and on the corneal
endothelium and also on the pupillary margin of the iris (Allingham et al. 2011;
Ritch and Schlötzer-Schrehardt, 2001). In PXFG, there is greater diurnal IOP
fluctuation and treatment is challenging. Regarded as an inherited
microfibrilopathy, development of PXFS and PXFG are strongly associated with
polymorphism of lysyl oxidase-like protein 1 (LOXL1) gene, a member of a gene
family that plays an important role in elastin metabolism (Allingham et al. 2011).
2.1.3.4 Pigment Dispersion Syndrome (PDS) and Pigmentary Glaucoma (PG)
These are two consecutive stages of the same disease process marked by
disruption of the iris pigment epithelium and deposition of the dispersed pigment
granules throughout the anterior segment. A concave iris contour allowing
apposition of its posterior surface to the zonular bundles is responsible for PDS.
Disruption of the iris pigment epithelium also releases pigment granules into the
aqueous humor. The classic diagnostic triad are corneal endothelial pigmentation
(Krukenberg spindle), slit-like, radial, mid-peripheral iris transillumination
defects, and dense homogeneous pigmentation of the trabecular meshwork.
Patients with PDS are usually myopic, so incidental diagnosis of PDS is often
made at an early stage. Young males are at greater risk of developing PDS. It may

12
take years to develop PG from PDS and once established, PG is difficult to
control. PXFS may be more common in PG (Tello et al. 2010).
2.1.3.5 Angle Closure Glaucoma (ACG)
Angle closure results from apposition of the peripheral iris to the trabecular
meshwork leading to obstruction of aqueous outflow (Allingham et al. 2011). This
results in a sudden (acute) or gradual (chronic) increase in intraocular pressure
(Cyrlin, 2010). Two mechanisms of ACG are described as follows (Allingham et
al. 2011):
The Anterior Mechanism: The peripheral iris is pulled into the iridocorneal
angle by contraction of an abnormal tissue (i.e., fibrovascular membrane,
endothelial layer with a Descemet-like membrane, inflammatory
precipitates) that bridges the anterior chamber angle.
The Posterior Mechanism: Peripheral iris is pushed into the anterior
chamber angle due to pressure behind the iris, lens, or vitreous, with or
without pupillary block (see below). Posterior mechanism with pupillary
block causes pupillary block glaucoma.
Primary angle closure glaucoma (PACG), most common variety of ACG, will
have an estimated 21 million cases globally by 2020 (Quigley and Broman, 2006).
Most cases of PACG are due to pupillary block, the most frequent cause of angle
closure glaucoma (Nolan et al. 2000; Gazzard et al. 2003). Flow through the pupil
is compromised and the peripheral iris bows forward against the trabecular
meshwork. Increased pressure gradient between the posterior and anterior chamber
eventually blocks the outflow. The symptoms of acute angle closure glaucoma are
sudden and severe, with marked pain, blurred vision, elevated IOP, nausea and
vomiting, minimal cell or flare, and a fixed or sluggish mid-dilated or irregular
pupil. The initial treatment for an acute attack is to lower the IOP and relieve the
pupillary block in the affected eye, including emergency paracentesis. In chronic
angle closure glaucoma, the angle gradually narrows without precipitating an

13
acute attack and over time, a portion of the anterior chamber is permanently closed
by peripheral anterior synechiae (scar tissue). Their corneas are usually clear and
non-edematous, but may have more extensive optic disc and field of vision
damage. These patients should be treated in a similar way as POAG (Allingham et
al. 2011; Cyrlin, 2010).
2.1.4 Pathophysiology
The underlying pathophysiology of glaucoma is not yet fully understood.
However, aqueous humor dynamics, optic nerve alterations and loss of visual
functions are so far identified as key events for development of glaucoma. As
already discussed, vascular, immunologic and cell signaling mechanisms may be
involved.
2.1.4.1 Aqueous Humor Dynamics and IOP
Aqueous humor, a clear ultrafiltration fluid of plasma, fills and helps to form the
anterior and posterior chambers of the eye. The ciliary body (site of aqueous
humor production) and the trabecular meshwork and uveoscleral pathway (the
principal site of aqueous humor outflow) are the main ocular structures related to
aqueous humor dynamics (Goel et al. 2010). Aqueous leaves the eye through both
conventional and unconventional pathways. The conventional or trabecular
outflow pathway refers to exit of aqueous humor at the anterior chamber angle
through trabecular meshwork, the Schlemm canal, intrascleral channels, episcleral
and conjunctival veins. In the unconventional or uveoscleral pathway, it exits by
passing through the suprachoroidal - scleral tissues. IOP is a function of the
balance of aqueous humor inflow and outflow. A steady IOP is the result of equal
inflow and outflow of aqueous humor (Allingham et al. 2011).

14
Figure 2: Outflow of aqueous humor
2.1.4.2 Glaucomatous Optic Nerve Damage
The optic nerve head is the distal portion of the optic nerve (2nd Cranial nerve). It
encompasses the nerve fibers from the ganglionic cell layer of the retina and
converges upon the nerve head into the fundus. The optic nerve head is directly
susceptible to IOP elevations. The central area of depression in the optic head is
known as the cup. The tissue between the cup and the disc margin is the neural
rim, where the bulk of the axons are located. The nerve head may be arbitrarily
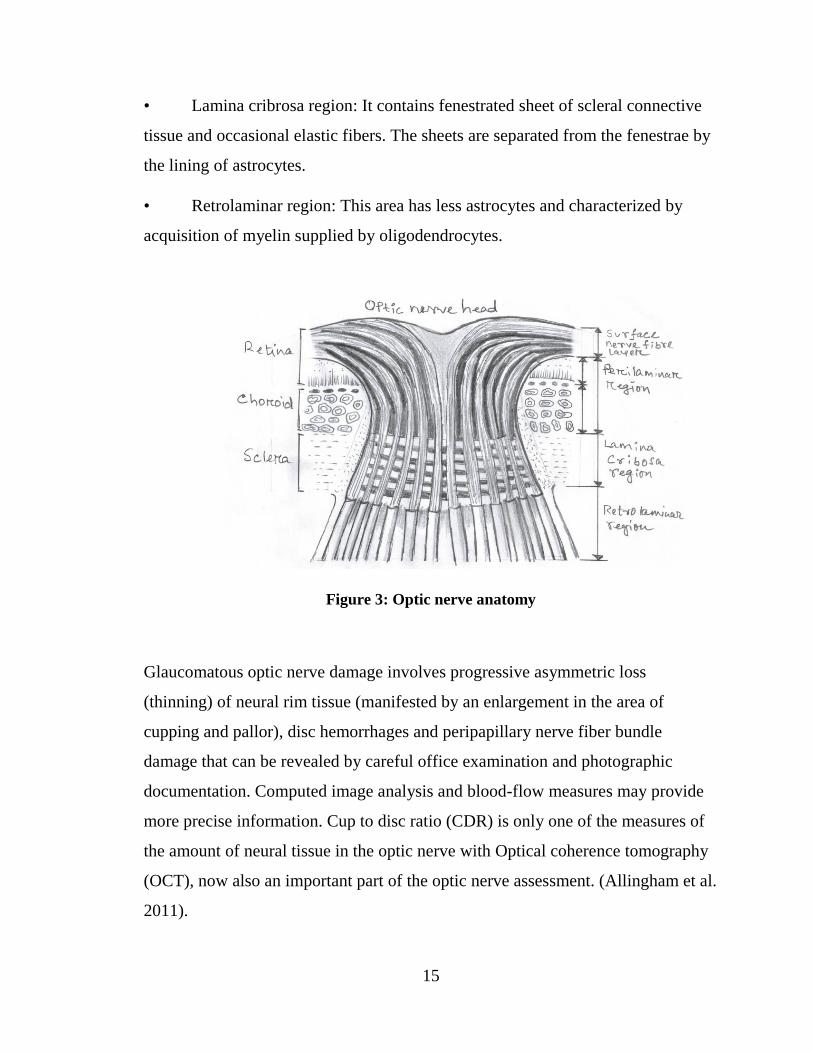
divided into four portions from anterior to posterior:
• Surface nerve fiber layer: It is the innermost part composed mainly of nerve
fibers.
• Prelaminar region: It is the anterior portion of the lamina cribrosa with
predominance of nerve axons and astrocytes. Astrocytes are glial cells which
provide a continuous layer between the nerve fibers and blood vessels in the optic
nerve head.
15
• Lamina cribrosa region: It contains fenestrated sheet of scleral connective
tissue and occasional elastic fibers. The sheets are separated from the fenestrae by
the lining of astrocytes.
• Retrolaminar region: This area has less astrocytes and characterized by
acquisition of myelin supplied by oligodendrocytes.
Figure 3: Optic nerve anatomy
Glaucomatous optic nerve damage involves progressive asymmetric loss
(thinning) of neural rim tissue (manifested by an enlargement in the area of
cupping and pallor), disc hemorrhages and peripapillary nerve fiber bundle
damage that can be revealed by careful office examination and photographic
documentation. Computed image analysis and blood-flow measures may provide
more precise information. Cup to disc ratio (CDR) is only one of the measures of
the amount of neural tissue in the optic nerve with Optical coherence tomography
(OCT), now also an important part of the optic nerve assessment. (Allingham et al.
2011).

16
2.1.4.3 Visual Field Defect in Glaucoma
The normal boundary of field of vision is approximately 60 degrees above and
nasal, 70 to 75 degrees below and 100 to 110 degrees temporal to fixation
(Allingham et al. 2011). In early glaucoma, peripheral field defects, usually a nasal
step, may be the only abnormality detected with perimetry (Caprioli and Spaeth,
1985). In advance stage central vision is also compromised. Some of the other
visual field defects associated with glaucoma include temporal wedge, arcuate
defects, - concentric contraction, and enlargement of the blind spot. Automated or
manual perimetry can be used to measure visual field (Allingham et al. 2011).
Figure 4: Normal boundary of field of vision
2.1.5 Natural History of Glaucoma
The natural history of glaucoma, in general, can be divided into five stages
(Allingham et al. 2011):
Stage 1- Initiating events: The series of conditions that initiate the chain of
events responsible for favoring the onset of any pathologic or physiologic
alterations pertinent to optic nerve function or aqueous humor dynamics.

17
Stage 2 - Structural alterations: Changes in tissues that may ultimately lead
to alterations in optic nerve function or aqueous humor dynamics.
Stage 3 - Functional alterations: Physiologic abnormalities leading directly
or indirectly to optic nerve damage.
Stage 4 - Retinal ganglionic cell and optic nerve damage: Loss of retinal
ganglionic cells and their associated axons.
Stage 5 - Visual loss: Progressive loss of vision due to progressive optic
nerve damage.
2.1.5.1 Natural History of POAG
The detection of slowly progressive POAG is delayed until in its advance stage
due to lack of symptoms. The progression rate of visual defects and response to
treatment to delay or halt the visual field damage is not uniform across all patients
(Leske et al. 2004). Considering the clinical care of POAG, the natural history can
be divided chronologically into following three phases (Allingham et al. 2011):
The Latency Phase: It starts with the glaucomatous optic nerve damage
extending up to the detection threshold, at which point the optic nerve
damage can be accurately detected by the diagnostic procedure.
Detectable Preclinical Phase: This is the lengthy asymptomatic phase
during which, glaucoma can be detected with a diagnostic procedure. This
phase continues until appearance of symptoms. However, detection of optic
nerve damage in a single visit is often difficult.
Clinical Phase: It is marked by the onset of symptoms, usually when the
disease is advanced. It may take decades to reach this phase.
2.1.5.2 Natural History of ACG
ACG can be acute, sub-acute and chronic that can occur in same person at
different time period and progression of ACG can be divided into following three
stages (Pan and Verma, 2011):

18
Anatomically narrow angle without elevated IOP, abnormal visual fields or
peripheral anterior synechiae.
Development of peripheral anterior synechiae or a closed angle with
elevated IOP.
Development of glaucomatous optic neuropathy and visual field changes
along with an anatomical angle closure.
2.1.6 Descriptive Epidemiology
Glaucoma is the second-leading cause of blindness and leading cause of irreversible
blindness worldwide, having an estimation of 79.6 million glaucoma patients by
2020 (Quigley et al. 2006) and by 2040, it will be 111.82 million (Tham et al. 2014).
Worldwide, 13.5% of blindness is due to glaucoma (Thylefors et al. 1995). More
than 50% of glaucoma patients are unaware of their disease at presentation (Reidy
et al. 1998; Wensor et al. 1998; Mitchell et al. 1996). The case definition and clinical
classification used in different glaucoma prevalence studies varies widely (Foster et
al. 2002).These differences make it difficult for direct comparison of prevalence
findings across studies. The global prevalence of glaucoma for 40-80 years age
group is 3.54%; prevalence of POAG is highest in Africa (4.20%) and that of PACG
is highest in Asia (1.09%). Men have 36% more chances to develop POAG than
women. People of urban areas have 58% more risk of developing POAG than their
rural counterpart. Glaucoma occurs more in elderly (Tham et al. 2014).
Prevalence of OAG among racial and ethnic groups varies greatly. The Baltimore
Eye Survey revealed higher prevalence of POAG in blacks (4.3%) than white
(1.3%) among age group 40 years and above (Sommer et al. 1991). For Hispanics
in USA, it was 2% (Quigley et al.2001). Glaucoma rates in Asians ranges from 1 to
4% (Rudnicka et al. 2006). In 2007, it was estimated that 24,937 Canadians had
severe vision loss due to glaucoma, corresponding to 3.1% of all vision loss. (Access
Economics Pty Limited, 2009).

19
2.1.7 Risk factors
2.1.7.1 Increased IOP
The single most important modifiable risk factor for glaucoma is elevated IOP,
though not all patients with elevated IOP develop glaucoma (Schmidl et al. 2015;
Bahrami, 2006). The role of IOP in pathogenesis of glaucoma is supported from
both clinical trials (Vass et al. 2007) and also from basic science research
(Stammer et al. 2012; Tamm, 2009).
2.1.7.2 Age
Advancing age is a recognized risk factor for OAG, having a 4 to 10 times higher
prevalence in the age group older than 40 years (Hollows and Graham 1966;
Leibowitz et al.1980; Tielsch et al. 1991). A meta-analysis of multiple population-
based studies of POAG or PACG concluded that, OR of prevalence of POAG was
1.73 with each decade increase of age (Tham et al. 2014).
2.1.7.3 Family history
Positive family history of glaucoma may increase the risk of developing glaucoma
for individuals (Burr et al. 2007; Wolfs et al. 1998; Netland et al.1993). It is an
important predictor for first-degree relative with glaucoma (Allingham et al.
2011). However, prospective studies that examined the progression of glaucoma
and family history did not find any significant association between them (Leske et
al. 2003; AGIS, 2002).
2.1.7.4 Ethnicity
Ethnicity can affect IOP and thus influences glaucoma prevalence and incidence.
African descent has higher prevalence of OAG whereas prevalence of ACG is
more in Asian and Inuit populations (Friedman and Vedula 2006; Hatt et al. 2006;
Burr et al. 2007; Schmier et al. 2007). Black people have an estimated 2 to 5 times
higher incidence of OAG than white people (Giangiacomo and Coleman, 2009).

20
2.1.7.5 Myopia
Patients with myopia have greater chance of developing OAG (Burr et al. 2007).
Large population-based surveys (Quigley et al. 1999; Michell et al. 1999) and
longitudinal studies (Phelps, 1982; Chihara et al.1997) also supported this fact.
2.1.7.6 Migraine and peripheral vasospasm
They may act as a risk factors for progressive glaucomatous optic nerve damage
(Budenz et al. 2006; Mitchell et al. 1996). This supports some role for a vascular
role in the pathogenesis of glaucoma.
2.1.7.7 Long-term use of corticosteroids
They are the main cause of drug induced glaucoma and associated with increased
IOP (Adis International 2004; Tripathi et al. 2003).
2.1.7.8 Vascular aspects
Ocular vascular disturbance which may or may not be due to increased IOP or
reduced ocular perfusion pressure may cause or contribute to glaucomatous
damage as well as retinal ganglionic cell death (Cherecheanu et al. 2013; Flammer
et al. 2002).
2.2 Management of Glaucoma
Glaucoma is generally a chronic, progressive life-long disease. Once diagnosed,
the aim of management is to delay or halt the progression of optic nerve damage
and visual field defect. The treatment plan needs assessing all risk factors for
disease progression, access to healthcare, and lifestyle and life expectancy of
patients (Allingham et al. 2011). The control of IOP, the most important
modifiable risk factor, is the mainstay of treatment.
2.2.1 Diagnosis of Glaucoma
The diagnosis of glaucoma is a clinical one based on the collective evidence from
a careful patient history, the essential elements of a comprehensive eye evaluation
that includes assessment of IOP, central corneal thickness measurement,
21
gonioscopy. Optic nerve head and retinal nerve fiber layer examination, is
important in clinical practice (Lester et al. 2013). In essence the diagnosis is made
when there are characteristic anatomical (cupping, decreased NFLT) or
physiologic (visual field defects) optic nerve changes.
2.2.1.1 Patient’s History
As applicable for all other clinical scenarios, history of a new patient of glaucoma
suspect (or referral) should include demographic information of the patient, chief
complaints, ocular and non-ocular medical and surgical history, current and
previous ocular and systematic medications, allergy history, as well as family
history of ocular and non-ocular diseases.
2.2.1.2 Comprehensive eye examination
It is very important to obtain and document accurate baseline information of the
comprehensive eye examination for assessing future progression of disease and
response of treatment(s) initiated and modifications, as needed.
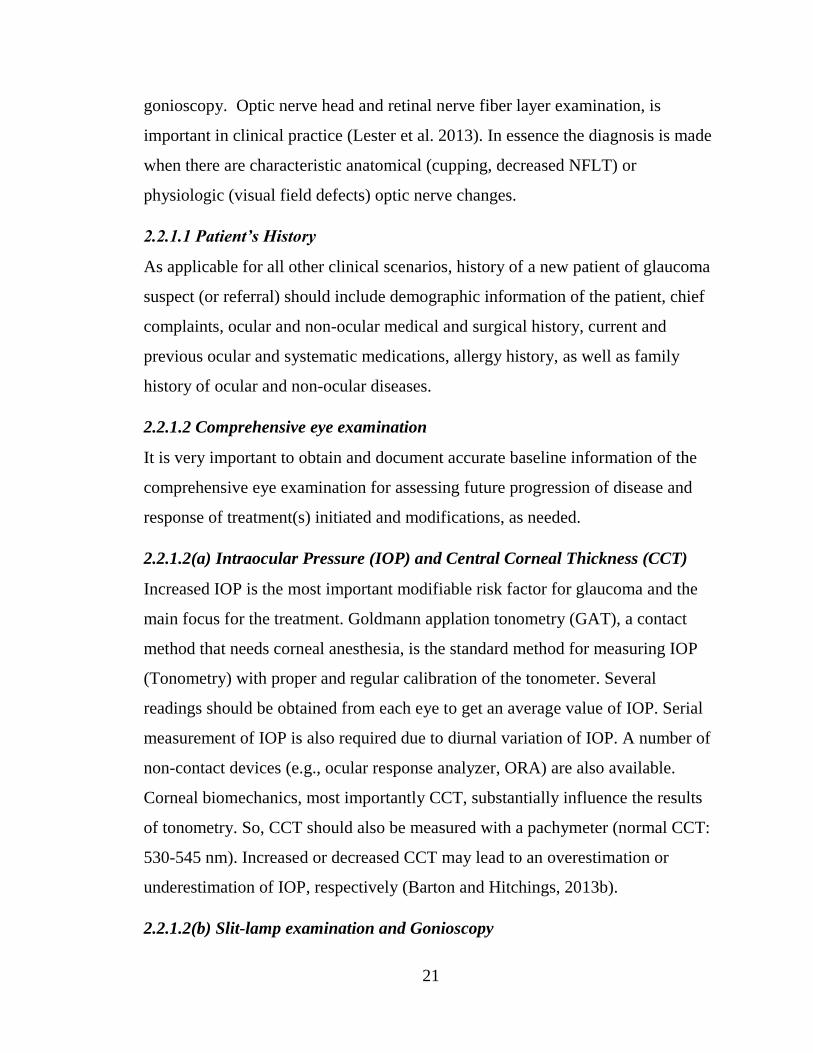
2.2.1.2(a) Intraocular Pressure (IOP) and Central Corneal Thickness (CCT)
Increased IOP is the most important modifiable risk factor for glaucoma and the
main focus for the treatment. Goldmann applation tonometry (GAT), a contact
method that needs corneal anesthesia, is the standard method for measuring IOP
(Tonometry) with proper and regular calibration of the tonometer. Several
readings should be obtained from each eye to get an average value of IOP. Serial
measurement of IOP is also required due to diurnal variation of IOP. A number of
non-contact devices (e.g., ocular response analyzer, ORA) are also available.
Corneal biomechanics, most importantly CCT, substantially influence the results
of tonometry. So, CCT should also be measured with a pachymeter (normal CCT:
530-545 nm). Increased or decreased CCT may lead to an overestimation or
underestimation of IOP, respectively (Barton and Hitchings, 2013b).
2.2.1.2(b) Slit-lamp examination and Gonioscopy

22
To exclude primary angle closure glaucoma and secondary causes (e.g., angle
recession, pigment dispersion and inflammatory forms of glaucoma), examinations
of the cornea and anterior chamber are done with the slit-lamp. Gonioscopy, the
gold standard for angle assessment (the outflow channels), is performed on slit-
lamp examination. Grading of depth of angle is done during gonioscopy. A wide
range of angle abnormalities may be found including peripheral anterior
synechiae, pigmentation of the trabecular meshwork, signs of intermittent
iridotrabecular contact, new vessels and traumatic damage to the drainage angle as
well as congenital abnormalities like Axenfeld-Rieger syndrome (Barton and
Hitchings, 2013b).
2.2.1.2(c) Dilated Fundus and Optic Disc Examination
These examinations are a must for exploring signs of glaucomatous changes in the
optic disc (including cupping of optic disc, optic disc hemorrhage, and retinal
nerve fiber layer defects) and to obtain a stereoscopic view of posterior segment to
exclude any abnormalities causing secondary glaucoma (i.e., diabetic retinopathy,
evidence of surgery for previous retinal detachment, lens abnormalities). The
retinal nerve fiber layer, viewed with red-free illumination, should be studied
carefully to detect any loss which strongly favors glaucomatous pathology.
Meticulous examination for evidence of thinning of the neuroretinal rim should
also be done (Barton and Hitchings, 2013b; Allingham et al. 2011).
2.2.1.2(d) Vertical Cup:Disc Ratio (CDR)
A large ratio suggests glaucoma or more rarely other pathology. Wide range of
CDR values in normal population reduces its sensitivity for glaucoma diagnosis to
less than perfect. (European Glaucoma Society, 2008).
2.2.1.2(e) Visual Field assessment and Perimetry
An integral part of a full ophthalmic examination, visual field assessment,
performed with manual or automated perimetry, is essential for diagnosis of
glaucoma and assessing baseline status and disease progression rate over time.

23
This test is subjective and needs patient cooperation and good response. Each eye
should be tested separately and any refractive lens correction for the patient, if
needed, should be in place. Abnormal visual field is a sign of a lesion anywhere in
the visual system from the retina to the visual cortex of the brain. Therefore, visual
field defect of glaucoma must be supported and co-related with other
glaucomatous findings of retina and optic disc and tonometry. Kinetic (moving
target) and Static (stationary target) perimetry are the two major types of
perimetry. In static perimetry, a flashing dim light is used in one area of visual
field with increasing intensity or size until the patient can recognize it. A complete
visual profile is created by repeating the whole process. In kinetic perimetry, light
intensity and size are fixed. The light is placed on the periphery of visual field and
then gradually moves centrally until the patient visualizes it. A visual field
boundary is then mapped by repeating the whole procedure (Cummings and
Malouf, 2014). The present day accepted standard way of measuring the visual
field is Automated Static Perimetry. Other automated perimetry include Short
Wave Automated Perimetry, Frequency Double Technology (FDT) Perimetry,
High-Pass Resolution Perimetry, Random Dot Motion Perimetry. Manual
Perimetry includes Tangent Screens, Arc and Bowel Perimeters (Broadway, 2012;
Barton and Hitchings, 2013b; Allingham et al. 2011).
2.2.1.2(f) Optic Nerve and Retinal Nerve Fiber Layer (RNFL) Imaging for
Structural Evaluation
Numerous imaging methods to evaluate the structural changes of the optic disc
and retina remain a mainstay for the diagnosis and management of glaucoma.
Optical Coherence Tomography (OCT), developed in 1990 and available to
ophthalmologists in 1996, provides quantitative and objective assessments of the
optic disc, macula, RNFL in glaucoma by constructing cross sectional images and
measuring the delay time of the echo of a backscattering low-coherence infrared
(843-nm) diode light source. The light source is divided into reference and sample

24
path. Reflected sample light from patient’s eye provides an interference signal
with the reference beam detected and recorded by a fiber-optic interferometer.
OCT is a non-contact method performed with the patient seating upright at a slit-
lamp like headrest. Confocal Scanning Laser Polarimetry can be used to measure
RNFL thickness as well. The retinal thickness can be measured by Retinal
Thickness Analyzer. All these devices generate reproducible, quantitative
measurements (Meira -Freitas et al. 2013; Barton and Hitchings, 2013b;
Allingham et al. 2011) and have therefore become the gold standard for structural
assessment of glaucoma nerve damage.
2.2.1.2(g) Ocular Perfusion
In patients with normal-tension glaucoma or Raynaud’s phenomenon, ocular
perfusion may be reduced (Barton and Hitchings, 2013b). Progressive worsening
of glaucoma despite well controlled IOP may be due to ocular hypo perfusion. In
such circumstances, ocular blood flow measurement may be of value. Several
methods for quantitative, comprehensive study of retinal, choroidal, and
retrobulbar circulations include vessel caliber assessment, pulsatile ocular blood-
flow measurement, scanning laser fluorescein and indocyanine green (ICG)
angiography of the peripapillary choroid and the retinal circulation. Laser Doppler
flowmetry, confocal scanning laser Doppler flowmetry, and color Doppler
imaging have been developed in the past two decades (Harris et al. 1999).
2.2.2 Planning of Treatment
As glaucoma is a chronic disease, long-term planning supplemented by a holistic
approach to the individual patient, including education of the condition is needed.
The aim of treatment for a glaucoma patient is to halt or delay the glaucomatous
progression and damage to the visual function, mostly by lowering the IOP to a
target pressure set for individual patients based on the status of the optic nerve
head and other risk factors for progression like CCT, increased age, positive
family history, African heritage and myopia for POAG; Asian heritage and

25
hyperopia are considered risk factors for ACG. In general, a target of 20% to 30%
reduction from baseline IOP is recommended. Establishing the target IOP is one of
the most important decisions to preserve the visual function and best possible
quality of life for the patient. It needs careful assessment and modification of
target IOP, if warranted, at each follow-up visit. Elevated IOP without
glaucomatous damage (i.e., ocular hypertension) may need careful follow-up only
without initiation of treatment (Allingham et al. 2011). Proper treatments delay the
progression in early glaucoma patients (Leske et al. 2003; Leske et al. 1999). In
advanced glaucoma, low IOP with minimal variation after treatment delays further
progression of glaucomatous visual function defects (AGIS, 2000).
2.2.3 Treatment Options for Glaucoma
Currently available treatment option for glaucoma are:
Medication therapy, usually eye drops
Laser therapy
Surgery
2.2.3.1 Medication therapy
The field of glaucoma pharmacology was introduced by Sir Thomas Fraser when
he mentioned the physiological action of the calabar bean (a source of
physostigmine) in his publication (Realini, 2011; Fraser, 1867). The basic
pharmacokinetics of topical glaucoma medications that include absorption,
distribution, metabolism and elimination of an administered drug should be taken
into consideration while prescribing (Mishima, 1981). Currently available major
classes of topical medications for glaucoma treatment are as follows:
Prostaglandin analogues (PGAs)
Beta-adrenoceptor antagonists
Adrenoceptor agonists
Carbonic anhydrase inhibitors (CAIs)

26
Cholinergics (acetylcholine receptor agonists)
(Marquis and Whitson.2005; Allingham et al. 2011)
2.2.3.1(a) Prostaglandin analogues (PGAs)
Since their introduction in 1996, PGAs have changed the scenario of glaucoma
therapeutics and become the choice of first-line pharmacotherapy for lowering
increased IOP (Realini, 2011; Soltau and Zimmerman, 2002). In 1982, Hungarian
physiologist Lazlo Bito developed the prototype molecule latanotoprost at
Columbia University, after he and Carl Camras revealed that, in both healthy and
glaucomatous monkeys, PGF2α (Prostaglandin F2α, a naturally-occurring
prostaglandin) lowers the IOP (Camras and Bito, 1981). It took 14 years to
develop an approvable formulation of latanotoprost (0.005%). In 2001, two other
PGAs, travoprost (0.004%) and bimatoprost (0.03%) came into the market
(Realini, 2011). They are administered once daily before bedtime and control
diurnal fluctuation of IOP. (Asrani et al. 2000; Bergea et al; 1999).
The PGAs are lipophilic, multi-carbon chain molecules derived from arachidonic
acid. They lower IOP by increasing outflow of aqueous humor, primarily through
the uveoscleral pathway (Mishima et al. 1997) and also through the TM pathway
(Ziai et al. 1993). They also relax the ciliary muscle (Crawford and Kaufman).
Patients tolerate PGAs well. Fewer topical applications with fewer severe side
effects rank PGAs as most commonly prescribed glaucoma medication. Ocular
adverse effects include conjunctival hyperemia, eyelash growth, and increased iris
pigmentation (due to increased melanin production within iris melanocytes after
long-term use (Marquis and Whitson, 2005; Watson and Stjernschantz, 1996;
Netland et al. 2001; Sherwood and Brandt, 2001). Systemic adverse effects
include headache and upper respiratory tract symptoms. Exacerbation of anterior
uveitis (Fechtner et al. 1998), cystoid macular oedema (CMO) after complicated
cataract surgery (Ayyala et al. 1998; Callanan et al. 1998) have been reported with
latanotoprost use.

27
2.2.3.1(b) Beta-adrenoceptor antagonists
Tonic sympathetic stimulation mediates the formation of aqueous humor in the
ciliary body (Wax and Molinoff, 1987). Most of the β-adrenoceptor antagonists
block both β1 and β2 receptors and decrease the production of aqueous humor
(Alward, 1998). They are used as a component in many fixed-combination
preparations as well as adjuncts and initial monotherapy (Barton and Hitchings,
2013c). The topical use of propranolol, the first β-adrenoceptor antagonists found
to decrease IOP, caused corneal anesthesia preventing its further use. Timolol
(0.25% and 0.5%), the most popular topical non-selective β1 and β2 adrenergic
antagonist, was introduced in 1978 in the USA. It is used twice a day. The US
FDA considers timolol as ‘gold standard’ for glaucoma pharmacotherapy. All-new
glaucoma medications are compared against timolol for FDA approval.
Levobunolol (0.25% and 0.5%), carteolol (1.0%), metipranolol (0.3%) are also
used twice daily (Marquis and Whitson, 2005). Reported ocular adverse effects
include conjunctival hyperemia, stinging, superficial punctate keratitis and
worsening dry eye symptoms (Coakes et al. 1981). Bradycardia, arrhythmia,
cardiac block, congestive heart failure and bronchospasm are known systemic
adverse effects. CNS adverse effects like depression, anxiety, fatigue, impotence
and hallucinations have also been reported (McMahon et al. 1979; Van Buskirk,
1980; Fraunfelder, 1980).
Betaxolol (0.25% and 0.5%), applied twice daily, is a cardioselective B1-
adrenoceptor antagonist. It is a less effective IOP lowering agent than timolol and
other non-selective agents, but has shown to be more effective in preserving visual
field than timolol (Collignon-Brach, 1992; Messmaer et al. 1991). Other than
occasional stinging after instillation, there are almost no ocular adverse effects.
Systemic adverse effects, if any, are also less pronounced than the non- selective
agents (Schoene et al. 1984).

28
2.2.3.1(c) Adrenoceptor agonists
As part of the sympathetic nervous system, α-adrenergic receptors have an
important role to regulate aqueous humor dynamics. Drugs in this class lower IOP
by increasing aqueous outflow through trabecular meshwork and uveoscleral
pathway or decreasing production, or both. Epinephrine is a non-selective
adrenergic agent that stimulates both α- and β- adrenoceptors within the eye. It
was commercially available in 1950s as topical glaucoma medication and is rarely
used now (Realini, 2011; Marquis and Whitson, 2005; Townsend and Brubaker,
1980). Ocular adverse events of epinephrine include pupillary dilatation,
conjunctival hyperemia and ocular irritation (van Alphen, 1976). Systemic adverse
events include headache, palpitation, high blood pressure and anxiety.
Clonidine, a highly lipophilic molecule with α2- and some α1- adrenoceptor
agonistic activity, readily crosses the blood-brain barrier having systemic
hypotension as an adverse effect when instilled topically into eyes. It is still in use
in part of Europe (Marquis and Whitson, 2005). Apraclonidine or para-
aminoclonidine (available in 0.5% and 1.0% concentration), a serendipity
derivative of clonidine, is a highly hydrophobic molecule (less likely crosses the
blood-brain barrier with relatively selective α2-adrenoceptor agonistic activity. It is
not used for a prolonged period due to high rate of blepharoconjunctivitis (Butler
et al. 1995). Tearing and foreign body sensation may occur with ocular instillation
(Wilkerson et al. 1991).
Brimonidine, a highly selective α2-adrenoceptor agonist, is used more commonly
as adjunctive therapy for long-term use, though monotherapy is not unusual. It is
also used to prevent post-operative IOP spike following anterior segment laser
therapy. Brimonidine 0.2% (with benzalkonium chloride as a preservative) is used
for two or three times a day (Marquis and Whitson, 2005). Allergic
blepharoconjunctivitis is seen in 12%-15% of patients after several months use
(Schuman, 1996; Schuman et al.1997). Dry mouth, fatigue and headache may

29
occur with use of brimonidine. A new formulation of 0.15% brimonidine with
stabilized oxychlorocomplex as a preservative shows lower rate of fatigue, dry
mouth, and conjunctival hyperemia (Katz, 2002). Brominidine should not be used
in children due to chance of CNS and respiratory depression (Marquis and
Whitson, 2005). Concomitant use of brimonidine and/or apraclonidine with mono-
amino oxidase inhibitors (MAOIs) is contra-indicated (Barton and Hitchings,
2013c).
2.2.3.1(d) Carbonic anhydrase inhibitors (CAIs)
Belonging to the sulphonamide group of drugs, CAIs are available in both oral and
topical form. They inhibit the catalyst carbonic anhydrase isoenzyme II in the
ciliary epithelium to suppress the conversion of CO2 and H2O to HCO3- and H+,
thus decrease aqueous humor formation (Marquis and Whitson, 2005).
Acetazolamide, the first systemic CAI introduced in 1954, is available in 125 mg
and 250 mg and a sustained-release capsule form of 500 mg with twice daily
dosing. Methazolamide (25 mg and 50 mg), weaker and slightly less effective than
acetazolamide, is often better tolerated by patients with twice or thrice daily
dosing. Despite effectiveness in lowering IOP, their clinical use is limited due to
several and often very bothersome adverse effects, including hands and feet
paresthesia, nausea, vomiting, fatigue, weight loss, metabolic acidosis, low serum
potassium (hypokalemia), low serum sodium (hyponatremia). They are reserved
for short term use in a patient with maximally tolerated medical therapy and often
before ocular surgery to control raised IOP (Realini, 2011; Marquis and Whitson,
2005).
Dorzolamide (2.0%) was the first topical CAI introduced in 1994. In 1998, another
topical CAI, brinzolamide (1.0%) became available. Both are used three times a
day. Topical CAIs have much fewer adverse events than systemic CAIs. Ocular
adverse effects include stinging, burning and itching (Realini, 2011; Marquis and
Whitson, 2005). In patients with marked endothelial compromise, irreversible

30
corneal decompensation may occur (Konowal et al. 1999). Brinzolamide has better
patient tolerability than dorzolamide (Silver, 1998). All forms of CAIs should be
avoided in patients with sulfonamide hypersensitivity (Marquis and Whitson,
2005). Unfortunately topical CAIs are much less effective than oral CAIs thus
relegating them to third or fourth line agents.
2.2.3.1(e) Cholinergics (acetylcholine receptor agonists, parasympathomimetic)
Also known as miotics, they are the oldest glaucoma drugs introduced in the 1870s
(Alward, 1998). At neuromuscular junction, they stimulate parasympathetic
receptors. As a result, there is contraction of the longitudinal muscle of the ciliary
body that pulls on the scleral spur and opens the trabecular meshwork and
schlemm canal causing increased aqueous outflow (Kaufman et al. 1976) and
subsequent reduction in IOP. They are of two types: direct-acting cholinergics,
work on the parasympathetic receptors in the eye and indirect-acting cholinergics,
work by inhibiting acetylcholinesterase enzyme and results in decrease
degradation of acetylcholine (Marquis and Whitson.2005).
Pilocarpine, the most commonly prescribed topical short direct-acting cholinergic
compound, is available in a range of 0.5% to 4.0 % concentration with four times a
day dosing. A topical gel form to be applied at bedtime is also available.
Diminished visual acuity, fixed small pupil and induced myopia are often and
retinal detachment is rarely reported ocular adverse effects. Frontal headaches
above the eye can be very bothersome. Systemic adverse effects are uncommon
and include increased salivation and sweating, diarrhea, vomiting and tachycardia.
Although effective and inexpensive, it is not used that much today because of its
ocular adverse effects and multiple dosing requirements and availability of
alternatives. Ecothiophate iodide and demecarium bromide are indirect-acting
cholinergics. As like pilocarpine, they are available in multiple concentrations and
are used twice a day. They deplete systemic cholinesterase and
pseudocholinesterase. They are used for treatment of glaucomas in aphakia and

31
pseudoaphakia in many parts of Europe and Latin America (Marquis and
Whitson.2005). Chronic use of ecothiophate iodide may predispose tocataract
formation (Thoft, 1968).
2.2.3.2 Laser Therapy
A significant advancement in the treatment of glaucoma was the introduction of
light amplification by stimulated emission of radiation or laser during the second
half of the 20th century. Lasers are now commonly used to treat various forms of
glaucoma including open angle glaucoma, pseudoexfoliative syndrome and
pigmentary glaucoma (Mainster et al. 1983; Peyman et al. 1984, Allingham et al.
2011).
2.2.3.2(a) Basics and Properties of Laser Energy
The basis of laser technology is based on the Quantum Theory of Radiation by
Albert Einstein, where he hypothesized that the photon, the tiny packets or
particles of light, has discrete quantum of energy proportional to its wavelength
(Einstein, 1917). Laser energy has distinct properties. Light emitted by lasers
causes the photons to be synchronized (coherence). A small focal spot can be
created when the laser is delivered through an optical system (commonly a slit-
lamp biomicroscope) resulting in a nearly parallel beam with limited divergence
(collimation), with only one discrete wavelength (monochromacy) and high
intensity (Allingham et al. 2011).
2.2.3.2(b) Laser effects on target tissue.
Laser therapy for glaucoma causes photocoagulation (local inflammation and
scarring) of target tissue or photovaporization (vaporization of intracellular and
extracellular fluids), facilitated by short exposure time and high-energy level and
an area of exposure that reduce heat conduction and creates a noninvasive incision
in the tissue. Thermal effect depends on wavelength of the light, duration of
exposure and amount of light energy per area of exposure. Lasers with
wavelengths between 400 to 600 nm are most useful for these procedures as

32
Melanin, the pigment of most target tissues, has a peak absorption in the blue-
green portion of the visible spectrum. High intense energy of laser in a very small
area of target tissue for an ultra-short period of time causes ionizing reaction
resulting in photodisruption, a technique in ophthalmology utilizing lasers to form
a gaseous state called plasma, which then causes acoustic shock waves that can
disrupt both pigmented and non-pigmented structures. The most common
application of this technology being excimer laser technology to treat refractive
errors. Thermal effects also play a role in photodisruption mechanism (Mainster et
al. 1983; Allingham et al. 2011).
2.2.3.2(c) Laser Delivery Units and Laser Types for Glaucoma Treatment
A slit-lamp biomicroscope is used by most laser units. In an articulated arm, a
system of fiber optics or mirrors guide the laser beam from the laser tube, through
the slit-lamp, into the patient’s eye. Other laser delivery systems use contact
probes attached to the fiber optics. For positioning and focusing of the laser beam
in the visual spectrum, an aiming laser beam of attenuated energy can be used. For
laser beams with wavelengths outside the visual spectrum, an additional laser
(e.g., helium-neon), or semiconductor diode, with wavelength of 633 and 640 nm,
respectively, is used. The control unit of most laser systems include spot size (in
microns), exposure duration (milliseconds, microseconds or nanoseconds), and
energy (joules or millijoules) or power (watts or milliwatts). Most commonly used
lasers for glaucoma are argon, Nd: YAG, and semiconductor diode. They
primarily differ by the medium in which the atom exists that causes the stimulated
emission of photons (Allingham et al. 2011).
2.2.3.2(d) Argon Laser Trabeculoplasty (ALT)
Since Krasnov reported a temporary control of IOP in open -angle glaucoma in
1973 by using ultra-short ruby laser pulses (Krasnov, 1973), control of open angle
glaucoma by treating trabecular meshwork with laser has been a common
treatment in the field of ophthalmology. Wise and Witter first reported a series of

33
56 eyes of diagnosed open angle glaucoma patients treated with argon lasers
applied 360 degree to the trabecular meshwork and concluded that, treatment of
open angle glaucoma with argon laser (laser trabeculoplasty) was an effective
alternative to filtration surgery in phakic eyes (Wise and Witter, 1979). Argon gas
is the medium in the argon laser delivery system. The wavelength is in the blue
(488nm) and green (514 nm) portions of visible spectrum and is optimum for
absorption by melanin. Green only argon light may be safer for the
ophthalmologist with equivalent efficacy of lowering IOP. The procedure is
performed at the slit lamp with gonioprism placing evenly spaced 50-100
nonpenetrating argon laser spots to the TM over 180° - 360° of the angle to
produce thermal burns around the circumference of the TM. Commonly used
parameters are spot size (50µ), pulse duration (0.1 sec) and power (400-800 mW)
(Marqquis and Whitson, 2005). The precise mechanism of improved aqueous
outflow and IOP reduction by ALT is still unclear. Heat-induced shrinkage and
tightening of treated trabecular meshwork cells may contribute to the mechanism
(Babizhayev et al. 1990). It has also been postulated that ALT reduces the
trabecular cell density by eliminating them partially, and the remaining cells
produce a different composition of the extracellular matrix with improved outflow
properties (Van Buskirk et al.1984; Kimpel and Johnson, 1992). The cellular
response and the tissue remodeling after initial mechanical injury by ALT
probably result in an improved aqueous outflow and IOP reduction (Van Buskirk,
1989). In the histopathological study of autopsy eye, Kramer and Noecker (2001)
found coagulative damage with ablation craters at the base and edge within the
uveal meshwork following ALT. Due to the initial damage to the targeted tissues,
repeat ALT is not effective in lowering IOP. (Feldman et al. 1991; Weber et al.
1989). However, efficacy of ALT in lowering IOP is equivalent compared to
medications (The Glaucoma Laser Trial Research Group, 1990). Complications of
ALT include transient IOP elevation (Frucht et al. 1985), iritis (Thomas et al.
1982) and PAS (scar) formation (Hoskins et al. 1983).

34
2.2.3.2(e) Selective Laser Trabeculoplasty (SLT)
Latina and Park reported that, when the energy of a Q-switched (to allow
photodisruption), frequency doubled, 532 nm Nd: YAG lasers (neodymium atoms
are embedded in a crystal of yttrium-aluminium-garner) with pulse durations
ranged from 10 nsec to 0.1 sec was used in a mixed cell culture of pigmented and
nonpigmented TM cells, it selectively targeted pigmented trabecular meshwork
cells without causing structural damage to non-pigmented cells (Latina and Park,
1995). The mechanism is based on the principle of selective photothermolysis,
whereby absorption of a suitable brief optical radiation with inherent optical and
thermal properties causes selective damage to target cells and destroys
melanosomes within melanocytes that minimize thermal injury to surrounding
structures (Anderson and Parrish, 1983). The desired target cell must have an
intracellular chromophore with greater optical absorption at the laser wavelength
than its surrounding tissues and the duration of laser must not exceed the time
required for thermal diffusion into the tissue (thermal relaxation time) (Kagan, et
al. 2014). The precise mechanism of action of IOP lowering effect of SLT is not
fully understood, but several potential biological and mechanical mechanisms,
particularly cytokine secretion, matrix metalloproteinase induction, increased cell
division, repopulation of burn sites and macrophage recruitment may be vital.
Clinically, the energy level of SLT is titrated until the appearance of microbubbles
(Latina and de Deon, 2005).
In the same histopathological study by Kramer and Noecker (2001), those human
autopsy eyes having SLT showed only disruption of trabecular endothelial cells,
possibly resulted from the cracking of intracytoplasmic pigment granules.
Coagulative damage or disruptions of the corneoscleral or uveal trabecular
endothelial beams were not observed. This finding suggests, at least theoretically,
SLT may be a potential repeatable procedure.

35
SLT is now a widely used and acceptable procedure for treatment of glaucoma at
both patient and ophthalmologist level. Many ophthalmologists suggest SLT even
as first line of treatment for OAG (Melamed et al. 2003; Nagar et al. 2005;
McIlraith et al. 2006). SLT as initial treatment of glaucoma results in fewer
treatment steps to maintain the target IOP and slower progression to blindness or
invasive surgery when compared to medications as initial treatment (Katz et al.
2012). SLT is also effective in lowering IOP when previous ALT failed (Latina et
al. 1998; Birt, 2007). As like ALT, SLT produces equivalent IOP reduction to
medications (Melamed et al. 2003; McIlraith et al. 2006). SLT success is
significantly predicted by baseline IOP. (Hodge et al. 2005).
There is a paucity of well designed, especially prospective studies for assessing
the safety and efficacy of SLT (Ayala and Chen, 2011). Study of safety and
efficacy of repeatability of SLT is even less studied. A few retrospective studies
have demonstrated that, repeat SLT in POAG patients had similar efficacy to
initial SLT (Avery et al. 2013; Hong et al. 2009). Another retrospective study
revealed successful IOP lowering effect of repeat SLT in eyes that did not achieve
desired IOP reduction after initial SLT (Khuri et al. 2014). A prospective study
demonstrated an 86% (26 out of 30 eyes) success rate of repeat SLT (Lai and
Bournias, 2005). The fact that this repeatability issue has not been well studied
prospectively is the cornerstone issue for this clinical trial.
IOP spike immediately after SLT may be a potential complication that can be
prevented by using topical α-agonist in the perilaser period and ensuring titration
of energy to just produce microbubbles in the target tissue. (Waisbourd and Katz,
2014). Other complications include uveitis (Kim and Singh, 2008), corneal edema
(White et al. 2013), hyphema (Shihadeh et al. 2006), macular burn (Liyanage et al.
2014), and irreversible IOP spike, especially with heavily pigmented TM
(Harasymowycz et al. 2005).

36
Comparison of ALT and SLT
The first clinical trial comparing IOP lowering effect of ALT and SLT was
conducted by Damji et al. (1999) that revealed equivalent reduction in IOP at 1-
year follow up. In their review of 145 articles, Sample et al. (2011) concluded that,
Laser trabeculoplasty is successful in lowering intraocular pressure for patients
with open-angle glaucoma, but they did not find any literature establishing the
superiority of any particular form of laser trabeculoplasty. The efficacy of both
lasers compared to each other and also to different pharmacotherapies are
equivalent. Their complications are also similar (Marquis and Whitson). SLT has
the theoretical advantage of repeatability that has yet to be established with a
sufficiently powered randomized prospective clinical trial-which is what we are
doing in this clinical trial.
2.2.3.2(f) Surgical Options
When medical or laser therapy fails to control glaucoma, surgical options have to
be considered. The glaucoma surgery aims to either increases the outflow or
decreases the production of aqueous humor (Razeghinejad and Spaeth, 2011). As
such, glaucoma surgery has two basic approaches-
(a) Aqueous humor outflow increasing surgery:
In 1856, Graefe observed that glaucoma, particularly acute attack, could be
controlled with iridectomy. In 1867, De Wecker did anterior sclerotomy, the first
filtration surgery to make a ‘filtration cicatrix’ with a full-thickness scleral
incision 1 mm posterior to the limbus, through which intraocular fluid might
escape the anterior chamber. This formed the basis of ocular filtration surgery
(Hirschberg, 1994). Modern trabeculectomy techniques started over 30 years ago
(Cairns, 1968). It involves making a fistula underneath the scleral flap into the
anterior chamber to allow the aqueous humor to pass through it into the bleb in the
subconjunctival space, thus reducing the IOP. Surgical scar formation is a
potential limiting factor for long-term success (Marquis and Whitson, 2005), that

37
can be delayed or halted to some extent by post-operative use of anti-fibrotic
agents (fluorouracil, mitomycin), thus extending the duration of trabeculectomy
success (Ruderman et al. 1987; Palmer, 1991). Complications of trabeculectomy
include hypotony, cataract formation, choroidal effusion or hemorrhage, and
endophthalmitis (Marquis and Whitson, 2005). In non-penetrating trabeculectomy
(NPT), the innermost layer of trabecular meshwork is kept intact, so the aqueous
humor can gradually pass through under the scleral flap (Zimmerman et al. 1984).
Although NPT has fewer early post-operative complications, its effectiveness,
when compared to standard trabeculectomy, is also less. (Chiselita, 2001).
When trabeculectomy fails, drainage device implant surgery can be performed.
Usually, a silicone drainage tube is implanted from the anterior chamber to a plate
or disc below the subconjunctival space (Marquis and Whitson, 2005). A number
of valved (Krupin and Ahmed) and non-valved (Baerveldt, Molteno, Schocker,
Ex-PRESS) devices are available (Razeghinejad and Spaeth, 2011).
The Ex-PRESS shunt, introduced in 1998, is a biocompatible, stainless steel
device, placed under a partial thickness scleral flap. It is often used in conditions
such as aphakia, uveitic glaucoma, and pseudoaphakia (Nyska et.al. 2003).
The iStent, is a heparin coated, non-ferromagnetic, 1 mm long L-shaped stent,
introduced in 2001 for trabecular meshwork micro-bypass procedures, that
reroutes the aqueous from the anterior chamber directly into the Schlemn’s canal
(Razeghinejad and Spaeth, 2011). Preliminary result of this procedure is
encouraging, but studies with long term follow-ups are warranted for further
evaluation (Nichamin, 2009; Fea, 2010).
(b) Surgery for decreasing aqueous humor inflow:
These are cyclodestructive procedures, the last resort to control glaucoma
refractory to medical and other surgical therapies, involving destruction of part of
the ciliary body, thus decreases the production of aqueous humor and reduces IOP

38
(Marquis and Whitson, 2005). These procedures include cyclocryotherapy
(deRoetth, 1966), cyclodiathermy (Dunphy and Albaugh, 1941), and laser
cyclophotocoagulation (Peyman et al. 1990).
2.3 Economic Evaluation of Healthcare: An Overview
In every corner of life, scarcity of resources prevails. There are no exceptions.
Hence a series of pragmatic decisions in a systematic manner for optimum use of
limited resources for the maximum benefit of stakeholders is needed (Hurley,
2000). The decision of resource allocation for healthcare is even more difficult.
Rapid accumulation of medical information and availability of different
technologies for the same medical condition often offers complicated situations to
decide which treatment option for the given condition would carry the best results
at both individual and policy level (Petitti, 2000). Mounting pressure on healthcare
budgets in every country force policy makers to consider the costing aspect of a
given treatment modality along with its clinical effectiveness to maximize
outcome and minimize costs. Economic evaluation is the comparative analysis of
alternative course of action in terms of both their costs (input) and consequences
(outcomes, effects). It provides a framework to make the best use of clinical
evidence through organized analysis of effects of all available alternatives on
health, healthcare cost and other issues deemed valuable. Economic and clinical
evaluations for a given medical condition are complementary to each other.
(Drummond et al. 2015).
Some key aspects of a good economic evaluation are as follows:
Formation of a Clear Evaluation Question:
As with any good research analysis, the carefully articulated question of an
economic analysis should clearly reflect the goals and objectives of the
interventions under consideration with outcome measures to judge the
interventions (Seflon, 2000).

39
Defining Effectiveness of Intervention and Measuring and Valuing Outcome:
For linkage of cost to effect in an economic evaluation, assessment of
effectiveness of the interventions along with value of outcomes or benefits
are vital. Conclusion about the effectiveness is often more criticized than
costing of interventions (Clyne and Edwards, 2002).
Comparison of Competing Alternatives:
This is, perhaps, the most central feature of an economic evaluation. Within
a specific context, costs and effectiveness of specific interventions or
programs in comparison should be made (Clyne and Edwards, 2002).
Defining the Perspective:
The costs and consequences of an economic evaluation are determined
critically by its perspective. The cost can be estimated from the perspective
of society. This societal perspective includes all the accrued costs and
consequences for a given situation. In perspective from government, a
sector, or even individuals, cost will be calculated according to the interest
of the party involved (Drummond et al. 2015; Clyne and Edwards, 2002).
Assessing Costs:
Careful cost assessment is a pivotal component of economic evaluation.
Conducting a cost assessment not only includes the identification of
alternatives and measurements of relevant cost items after establishing the
perspective, discounting and monetary evaluation of benefits, but also the
opportunity cost (relative to benefit) of the alternative uses (Shiell et al.
2002). Often, “Do Nothing” alternative is used to establish a baseline
comparator for resource use (Palmer and Reftery, 1999). The former may
be more costly than the latter option, as individuals may inefficiently utilize
a wide range of publicly provided alternatives (Browne, 1998). Costs may
be calculated item by item (microcosting) or based on an average or
modeled estimate (macrocosting)

40
Valuing Cost Items in Monetary Terms:
Albeit cost estimates in economic evaluation should reflect the opportunity
cost. In practice, direct costs are usually valued at the price paid for each
item, termed as the market value (Clyne and Edwards, 2002).
Time Preferences and Discounting:
Most interventions and programs, particularly in medical fields, continues
over a long period of time. In such scenario, it is necessary to consider the
time preference for money that measures the extent to which individuals
prefer to have dollar or resources today rather in future (Hurley, 2000).
Discounting reflects the loss in economic value due to delay in incurring
cost or realizing benefit. So in health economic evaluation, a discount rate
(usually 3% to 8%) is applied over all the number of years to be considered
over all the accumulated expenditure and anticipated benefits to discount
the future costs and benefits to the present (Petitti, 2000; Hurley, 2000).
Although costs estimation across most economic evaluations, in monetary units,
has a common format, the approach of consequences or benefits estimation varies
substantially (Hurley, 2000; Drummond et al. 2015). Four types of economic
evaluations are most commonly used:
In Cost Effectiveness Analysis (CEA), consequences or benefits of
different interventions are measured in natural units (e.g., life years gained,
cases prevented, deaths avoided). Alternative interventions are then
compared in terms of costs per unit effect achieved (Hurley, 2000) in the
same outcome units. For evaluating the relative efficiency of two (or more)
programs, the incremental cost-effectiveness ratio (ICER) that expresses the
additional cost needed per additional unit of effect, is determined. For a
comparison of competing programs P1 and P2, the ICER is calculated as
follows:

41
Difference in costs between programs P1 and P2
ICER =
Difference in health effects between programs P1 and P2
CEA may identify the intervention with dominant position that achieves the
desired outcome with lower costs over the other options considered
(Drummond et al. 2015; Clyne and Edwards, 2002; Hurley 2000).
In Cost-Utility Analysis (CUA), the outcomes of the interventions are
measured in terms of Quality-Adjusted Life Year (QALY) keeping all other
structures the same as CEA. QALY is a measure that assesses the effect of
a health intervention on both the quantity (length) and quality (as indicated
by people’s subjective rating of the health state between 0 or immediate
death and 1 or full health) of life. CUA is often addressed as an adaptation
of CEA (Hurley 2000; Palmer et al. 1999). Its main use is to compare costs
on outcomes that may be similar enough to compare but do not have the
same exact outcomes (e.g. death from breast cancer with morbidity from
severe eczema).
In Cost-Benefit Analysis (CBA), outcomes of interventions are valued in
monetary terms by either human capital approach or willingness to pay. In
human capital approach, health gain is valued against accompanying
increase of a person’s wage rate (market productivity). In willingness to
pay, health gain is valued against the amount the person is willing to pay to
achieve the health gain. For programs P1 and P2, net benefit can be
calculated from CBA as follows:
Net Benefit = (Benefit P1- Benefit P2) - (Cost P1-Cost P2).
If the net benefit is positive, implementation of the program P1 would
increase welfare of society and vice versa (Hurley, 2000). CBA is not used
nearly as much as CEA or CUA.

42
In Cost-Minimization Analysis (CMA), the interventions are compared
only on their costs to determine the least-expensive option, as the
effectiveness (or outcome) of the interventions is the same qualitatively and
quantitatively. This condition is not often met in real situations (Clyne and
Edwards, 2002; Petitti, 2000).
Several types of uncertainty are associated with method of analysis of economic
models. Sensitivity analysis can help the reviewer to determine which parameters
are the key drivers s of a model’s output. One-way sensitivity analysis assesses the
impact of changes of certain parameters, one at a time, on the model’s conclusion.
Probabilistic sensitivity analysis quantifies the level of confidence to the
conclusions of an economic evaluation (Taylor, 2009; Petitti, 2000).
2.4 Trial Based Economic Evaluation
When economic data are collected in a randomized control trial (RCT), it can
serve as the basis for an economic evaluation study and can be termed as ‘Trial
Based Economic Evaluation’ (Ramsey et al. 2015). When randomization is proper
in different study arms, RCT provides high internal validity with good
effectiveness data of interventions among different arms. Patient-specific data on
both costs and consequences (outcomes) are used to estimate mean cost and mean
health outcomes for an incremental analysis. However, there are some issues and
problems needed to be addressed by the researchers in such a setting of economic
evaluation. Some RCTs may lack generalizability to the target population of
interest. Effectiveness or outcome measurement in an explanatory RCT may not
mimic the real practicing intervention scenario and thus may over-estimate or
under-estimate the cost-effectiveness analysis. Inadequate patient follow-up may
adversely affect the economic evaluation (Drummond et al. 2015). Schwartzand
and Lellouch (1967), introduced ‘pragmatic approach’ along with ‘explanatory
approach’ of RCT. A compromise between the goals of internal validity and
generalizability with the aim to evaluate the effectiveness or cost-effectiveness of

43
the intervention to reflect the ‘real world’ condition when the intervention will be
in routine use, may support an economic evaluation (Drummond et al. 2015).
Thorpe et al. (2009) developed the Pragmatic-Explanatory Continuum indicator
Summary (PRECIS) to assess and display the position of any given trial within
this continuum to help trialists to assess the degree to which design decisions align
with the trial’s stated purpose of either supporting pragmatic approach (decision
making) or explanatory approach.
2.5 Markov Modelling
Markov modeling allows presentation and analysis of random and repetitive
process over time in a decision tree. It is particularly suitable for chronic disease
with recursive nature. The disease in question is divided into distinct states, known
as Markov states over a series of discrete time period with the transition
probabilities of occupying a given state known as Markov cycle. During each
cycle, the patient may move from one state to another. The length of the cycle
should represent a clinically meaningful time-interval. During the modelling
process, a patient may stay to the same state or may transit to another state at the
end of the cycle. A Markov process ultimately needs the ‘absorbing state’ when it
is impossible for patient to move from the state or the patient dies. Two other less
applied but useful Markov states are temporary state and tunnel state. Temporary
state is used for a short event when a patient can stay at that state for a maximum
of one cycle. When a temporary state lasts for more than one cycle and can transit
in a fixed sequence, it is known as tunnel state. The Markov state should also
represent a clinically and economically important event over a period of time. The
transition probabilities of a Markov chain model are assumed constant over time.
However, transition probabilities in health care are time dependent and may
change with age, sex and other relevant characteristics of patients. Costs are
typically assigned to each Markov cycle in line with the state of the patient. Health
utility or effect and cost are calculated independently from each cycle. Costs and

44
health outcomes from all cycles are then added up. The expected costs and values
of health outcomes of each Markov state are weighted by the time a patient spends
in that state. The final expected values of cost and health outcome are derived
from summing up weighted values of each cycle. Discounting for cost and health
outcome (when appropriate) should be done using the defined formula of
discounting. For survival duration, proportion of all alive patient in each state per
cycle should be weighted by 1 and those who died should be weighted by 0.
Adding the result would give the expected number of life -year of the cohort of the
Markov model. To examine the robustness of the results of a Markov model,
sensitivity analysis under variability of parameter uncertainty, analytical
uncertainty, generalizability of results and structure uncertainty are performed.
(Drummond et al.2015; Xin, 2007; Briggs and Sculpher, 1998; Sonnenberg and
Beck, 1993).
2.6 Economic Evaluation of Glaucoma
Studies on the economic evaluation of glaucoma are limited with the majority
addressing costs only (Rouland et al. 2005; Kobelt, 2002; Coyle and Drummond,
1995). Several studies on the cost-effectiveness of glaucoma screening have been
conducted. Gottlieb et al. (1983) introduced a measure of Quality Adjusted Year
of Vision (QAYV) and performed a cost-effectiveness analysis of various
screening methods of glaucoma in 40-79 years age group. They concluded that
screening of age group 55-70 years were most cost-effective, tonometry was more
cost-effective in younger groups and screening of the high-risk group for
glaucoma was more cost-effective compared to general population. Boivin et al.
(1996) did a cost-effectiveness analysis of glaucoma screening using opinion
based estimates of the effectiveness of glaucoma for a three yearly screening of
subjects 40-79 years, where perimetry was done if any abnormality was detected
on fundoscopy and tonometry. Scenarios with different screening frequency, age,
participation in screening, compliances with treatment, treatment efficacy, and

45
diagnostic tests were also examined. They did not find any proof that treatment of
glaucoma or of high intraocular pressure from a screening standpoint would arrest
the progression of glaucoma to blindness, even when treatment efficacy was
assumed to be as high as 50%. They also concluded that, the cost-effectiveness of
most glaucoma screening programs considered would not be competitive. Tuck
and Crick (1997), in their cost-effectiveness study of different modes of
screening/case-finding for glaucoma, concluded that glaucoma screening for
people aged 40 years or more could be justifiable and likely to be economically
beneficial when conducted with overall eye examinations.
In their review of the economic burden of glaucoma, Rouland et al. (2005) found
that, most costs were associated with direct medical costs, although non-medical
costs were also substantial. Treatment costs were directly proportional to severity
of disease and number of medications used and negatively correlated with
treatment efficacy in reducing IOP. With introduction of costly but more potent
and better tolerated medications, treatment costs also increased greatly.
Using a Markov model with a 25-year time horizon, Stein et al (2012) compared
the incremental cost-effectiveness of treating newly diagnosed mild OAG with
PGAs, LTP, or observation only. They concluded, both PGAs and LTP were cost-
efficient options and if the assumption of optimal medical adherence was made,
PGAs were more cost-efficient. However, they commented that, more realistic
assumption of medical adherence (considering 25% less effective than the
documented effectiveness reported in the clinical trial) might prove the other way
round.
Lee and Hutnik (2006) projected cost comparison of SLT (repeat treatment every
2 or 3 years) versus glaucoma medication (mono-, di-, and tri-drug therapy
groups) over the period of 6 years for OAG patients of Ontario aged 65 years or
more. They found, at per-patient level, SLT offered a modest potential cost saving
over primary medication regimens. However, the cost of surgery for failed SLT or

46
medical therapy and the cost for medical therapy in conjunction with SLT were
not considered in this study.
Seider et al. (2012) compared cost analysis of topical medications versus SLT
assuming a societal perspective. SLT was less costly than most brand-name
medications within 1 year and less costly than generic latanoprost and generic
timolol after 13 and 40 months, respectively. However, they did not include
complications after SLT, need for subsequent surgery, or transportation costs for
patients in their analysis.
Cantor et al. (2008) developed a Markov model to stimulate the transition of
treatment progression and to compute and compare costs of glaucoma treatment
for LTP, surgery and medication over a period of five years. They concluded that,
laser trabeculoplasty was associated with the lowest total costs compared to
treatment by medication alone or by filtering surgery for patients who were not
adequately controlled by two medications. However, they mentioned that, due to
limited availability of the transition probabilities in published literature, the model
results needed to be validated by prospective or retrospective observational
studies.
At the time of writing this thesis, we did not find any study that computed and
compared cost-effectiveness of ALT and SLT for treatment of OAG. This study
aims to compute and compare the cost-effectiveness analysis of ALT versus SLT
among uncontrolled open angle glaucoma patients (including ocular hypertension,
pigmentary dispersion syndrome and pseudoexfoliation syndrome) who have had
at least one previous full SLT, and are recruited in an ongoing clinical trial entitled
‘A randomized clinical trial of laser trabeculoplasty (SLT) in open angle glaucoma
who had been previously treated with complete SLT’.
47
Chapter 3 – Methods
The objective of this study is to compute and compare the cost-effectiveness of
repeat laser treatments (ALT versus SLT) among uncontrolled open angle
glaucoma patients (including ocular hypertension, pigmentary dispersion
syndrome and pseudoexfoliation syndrome) following previous full 360 degree
SLT, who are recruited in an ongoing clinical trial entitled ‘A randomized clinical
trial of laser trabeculoplasty (SLT) in open angle glaucoma who had been
previously treated with complete SLT’.
In section 3.1, a thorough description of the ongoing clinical trial is provided.
Section 3.2 elaborates the decision model tree with calculation of ratios of success
and failure of each intervention arm. Section 3.3 depicts the cost calculation of the
trial components and in section 3.4, final analysis and measures are outlined.
3.1 - Trial section
3.1.1 - Ethics statement
This RCT received approval from The University of Western Ontario Health
Science Research Ethics Board (REB# - 103028).
3.1.2 The Hypothesis and the Design of the Trial
The trial hypothesis is that, SLT will be equivalent to ALT for laser treatment of
open angle glaucoma. So, an active equivalence parallel armed randomized multi-
centered clinical trial based on the results of earlier clinical trial work with SLT
and ALT was undertaken in an attempt to demonstrate expected equivalence
between the two laser treatments SLT and ALT with respect to intraocular
pressure lowering in patients who had previous full SLT. There is no indication
that either laser modality would be superior to the other (Samples et al. 2011,
Rolim de Moura et al. 2007, Shi and Jia 2013). Furthermore, both laser procedures
are counted under the same OHIP code and the events of the post-laser clinical
pathways between the two are same. In keeping with an “effectiveness” type

48
clinical trial, a generalizable study population, permissive eligibility criterion, an
easily administered treatment protocol and outcomes that are relevant to patient
care were chosen. Inclusion criteria are meant to admit a range of glaucoma
patients as would be seen in the clinic – the results are explicitly meant to be
generalizable to the broader glaucoma population eligible for repeat laser
trabeculoplasty in western countries.
When performing a hypothesis testing such as an active equivalence trial like this
one, two types of basic error can occur namely type I and type II. Type I error
occurs when we reject null hypothesis when it is true. For example, when a
researcher claim based on his experiment and statistical analysis of data that, the
experimental drug is effective in reducing the morbidity of a specific disease than
the placebo, when, in fact, there is no such difference between them, a type I error
has occurred. The probability of committing type I error is known as the level of
significance, denoted by α. In practice, the standard type I error rate is 5% or
α=0.05. Type II error occurs when null hypothesis is not rejected when it is false.
When a researcher concludes that there is no difference between the experimental
drug and the placebo in reducing the morbidity of a specific disease, but in fact,
there is a difference. The probability of committing type II error is denoted as β.
The power of a test, which is denoted as 1-β, is the ability to reject a null
hypothesis when it is false. There is an inverse relationship between power and β.
Increase of power requires a larger sample size (Chow and Liu, 2004).
3.1.3 Trial Interventions
The intervention is to apply one setting of complete SLT or one setting of
complete ALT. On the day of laser trabeculoplasty, intraocular pressure is checked
and one drop of 0.15% brimonidine is instilled in the study eye before and after
laser treatment to decrease the chance of post-laser IOP spike at the one hour
measuring point. Patients are then treated with either SLT or ALT according to the
randomization schedule.

49
3.1.4 Study Center
There are sites in London, Toronto, Hamilton, Edmonton, Calgary, Halifax and
Montreal of Canada. The present study considers data from all sites.
3.1.5 Randomization and Allocation
The ophthalmologist assessed eligibility criteria and verbally explained the study
to the potential patient. Once a patient has decided to participate, they are asked to
sign the informed consent. Then they are randomized.
At each center, a blocked randomization was performed to recruit participants
alternately in order to force reasonably equal number of eyes in both treatment and
control arms. . The allocation schedule, done by computer (e.g. STATA, College
Station Texas) from the conditional uniform distribution, is generated by the study
coordinating center at the Ivey Eye Institute, University of Western Ontario with
the help of the Lawson Research Kidney Research Unit, LHSC, London, Ontario.
3.1.6 Treatment Masking
The patient, not the clinician, is masked to intervention (either one complete
setting of SLT or one complete setting of ALT).
3.1.7 Inclusion and Exclusion Criteria
Inclusion Criteria:
1. Study base: From one of the practices participating in this study.
2. More than or equal to 18 years of age.
3. Open angle glaucoma, including ocular hypertension, pigmentary
dispersion syndrome and pseudoexfoliation syndrome, as long as the angle
is open, to increase the generalizability of the study.
4. Previous 360 degree SLT (one time of 360 degree or two 180 degree).
5. Intraocular pressure greater than 16 mm Hg on at least two consecutive
occasions separated by one month. From previous SLT vs ALT clinical

50
work by Damj et al. (2006), mean IOP of diagnosed OAG patients for one
year follow-up period was as low as 17.88 mmHg with a SD of 3.92.
6. Two sighted eyes (best corrected visual acuity of 20/200 or better)
7. Willing to participate after being informed and reading the patient
information material that explains the study.
Exclusion Criteria:
1. Any evidence of secondary open angle glaucoma (other than pigmentary
and pseudoexfoliation) or narrow angle glaucoma (where the anterior
trabecular meshwork is not visible 360 degrees). As they would make the
study population too heterogeneous.
2. Advanced visual field defect in the eye being considered for treatment
(defined as a scotoma within 10 degrees of fixation or split fixation on
Humphrey's visual field 24-2, full threshold program) as they would be too
close to central visual loss to be considered ethically feasible to include.
3. Previous non laser glaucoma surgery in the eye being considered for
treatment as this would change the angle architecture too unpredictably to
be included.
4. Intraocular surgery anticipated in the 12 months after treatment.
5. Any corneal disease obscuring adequate visualization of the anterior
chamber trabecular meshwork or reliable applanation tonometry.
6. Present treatment with topical or systemic steroids or anticipated treatment
with systemic steroids in the 6-months following treatment because of a
high probability condition (such as giant cell arteritis or a collagen vascular
disease) as steroids themselves had a pressure increasing effect in an
unpredictable fashion.
7. Previous ALT.

51
3.1.8 Starting medication status of patients
Common treatment algorithms comprise the use of medication until failure
followed by laser and finally incisional surgery. However, recent trends have
shown an increasing proportion of physicians using laser first and avoiding the use
of medications until necessary (Katz et al. 2012, Mcilraith et al. 2006). To reflect
this changing clinical practice, this trial recruited patients regardless of medication
status (except for steroids).
3.1.9 Duration of Intervention
The laser session for each group takes approximately 5 minutes.
3.1.10 Baseline data, Frequency and Duration of Follow-Up
After patients are screened for eligibility and provide their informed consent,
baseline data (demographic variables and baseline IOP) are collected. There is a
follow-up visit at 1-hour post-laser, and patients are prescribed topical steroid
(1drops 4x/day). They are then evaluated at approximately the same time of day as
the baseline examination (to minimize diurnal variation in pressure), at the end of
week 1, and at 1, 3, 6 and 12 months post-operatively. At all follow-up
examinations, the IOP, best corrected vision acuity, the anterior chamber reactions
(cells/flare) are recorded. For this thesis, patients with 6-month follow -up data are
considered.
3.1.11 Primary and Secondary Outcomes
The primary outcome for the clinical trial is the change in intraocular pressure
from the baseline visit to the twelve-month visit (a continuous variable). The
Goldman applanation tonometer, calibrated weekly, is used at approximately same
time of the day (±1-hour) at baseline visit and during each follow-up. This thesis
will use data obtained at 6 months.
Secondary outcomes include, exclusion of pseudoexfoliation or pigment
dispersion syndrome and repeating the primary analysis. Status of anterior

52
chamber inflammation (graded from 0 to +4, based on standard criteria), Snellen
visual acuity (in LOGMAR units, a continuous variable), trabecular meshwork
pigmentation (graded from 0 to + 4, an ordinal variable, compared to a standard
photograph) and number of glaucoma medications needed per patient in each
group are recorded at every post-operative visit for subgroup analysis.
For this thesis, intraocular pressure change from the baseline visit to the follow-up
visit up to 6-months have been considered. The effectiveness of each intervention
(ALT and SLT) for outcomes (treatment success or failure) and relevant cost
components of the laser treatment modalities have been compiled and computed
and a cost-effectiveness analysis of repeat laser treatment (ALT vs SLT) following
at least one full previous SLT has been carried out.
3.1.12 Sample size:
In an active control equivalence trial, the formula for sample size for a continuous
outcome for each group is:
N=2v2(Zα+Zß) 2 /d2
(Chow and Lee, 2004Blackwater and Chang, 1984)
Where, N = Sample size for each group.
v2 = Variance of the continuous variable.
Zα= Type I error.
Zß= Type II error.
d2= The squared difference in the equivalence study that would be
clinically meaningful.
v2: From previous SLT vs ALT clinical work (Damji et al. 2006), the
standard deviation of the difference in IOP between the two groups at

53
different times varied between 3.4 and 5.8 mm Hg. The median standard
deviation from all pressures recorded was 5.0 mm Hg, which is used for v2.
Zα: This value is 1.96 for the standard acceptable type I error rate of 0.05,
two sided test, in an active controlled equivalence trial.
Zß: To reduce the chance of a type II error, which is central to an
equivalence study, 90% power is used. This value is therefore 1.282.
d2: A meaningful clinical difference (squared) that would change the
management of OAG had been chosen to be 3 mm Hg by the expert group.
As we have an active control group (ALT) and a comparator group (SLT), the
total sample size (for both active control and comparator group) would be
2N=4v2(Zα+Zß) 2 /d2
Plugging the value of the formula, the total sample size
2N=4(5.0) 2 (1.96+1.282) 2 /32
2N=117 eyes.
Assuming a 10% drop out rate would require to increase the sample size by (1-d)
where d is 0.1 in this case. The sample size would be:
2N=117/ (1 - 0.1)
2N=130 eyes
When cluster sampling would be done, the sample size estimate must be increased
by the factor:
1 + (m-1)

54
Where m = Average cluster size
= The intra-class correlation coefficient (Friedman et al. 1996).
Based on previous work, it is estimated that 15% of individuals might be
randomized from any one center from a cluster (Damjii et al. 2006). With this
assumption, the average cluster size is 1.15. As the cluster would be within fairly
homogenous practices, the might be as high as 0.7. If = 0, then each
individual in one clusters responds same as individual in any other cluster. If =
1, then all individuals in a cluster responds the same (Friedman et al. 1996).
So adjustment factor 1 + (m-1) = 1 + (.15)0.7 = 1.105.
Multiplying this correction factor by 130 eyes resulted a final sample size of 144
eyes.
At the time of writing this thesis, a total of 91 eyes has completed the 6-month
follow-up. In this study, analysis is based on this sample size (91 eyes). Based on
this reduced sample size, the recalculated power of the study would be 81%
instead of 90% (See Appendix C for details).
3.1.13 Trial Management
Data, recorded on a standardized form by the research assistant, are entered in a
web based data uptake system, checked for completeness, errors and
inconsistencies by the coordinating center at located at the clinical research unit,
Ivey Eye Institute, University of Western Ontario. Any data discrepancy is fixed
accordingly. A double data entry protocol, that require the data entry personnel to
re-enter all data a second time using identical error verification parameters, is used
to ensure data integrity and accuracy for all key variables. Patient confidentiality is
guarded with stringent security procedures.
The executive committee oversees all aspects of the trial. The Data Safety and
Monitoring Committee (DSMC), independent of the trial functioning participants,

55
consists of two glaucoma expert physicians and one epidemiologist/biostatistician,
with provision to invite ad hoc expert consultancies as required. The DSMC
ensures that that study participants are not exposed to unnecessary or unreasonable
risks and that the study is being conducted according to the highest scientific and
ethical standards. Based on the review of both primary and secondary interim
analysis, the DSMC has the right to recommend whether the study needs to be
changed or terminated. In the event that the Study PI and/or the Executive
Committee disagree with the DSMC recommendation to modify or to terminate
the trial, a third party arbitrator from the University of Western Ontario Research
Ethics Board, who possesses the knowledge and experience to make a final
decision in the matter, will be called upon.
3.2 Decision Tree Model
For this thesis, a decision tree model was created using TreeAge Pro 2009 to
represent the possible treatment outcome for a patient over a period of 6-month
after intervention. Due to the short span of follow-up time and few treatment
outcomes, this decision tree model would be sufficient to model the clinical
scenario without the need of Markov modeling.
The model was built using the data from the ongoing clinical trial cohort of adults
aged 18 years or more suffering from uncontrolled open angle glaucoma patients
(including ocular hypertension, pigmentary dispersion syndrome and
pseudoexfoliation syndrome) with maximally tolerated medical therapy and at
least one previous full SLT. The outcome of interest is the IOP lowering effect of
each intervention.
Our focus of interest was to evaluate the cost-effectiveness of the laser treatments
(SLT versus ALT) following previous full SLT based on the treatment outcome at
6-month post -laser follow-up.

56
3.2.1 Structuring the decision tree model
The overall structure was determined after consultation with ophthalmology
experts by identifying possible clinical pathways of patients undergoing repeat
laser trabeculoplasty. In our trial, patients underwent laser (either ALT or SLT). .
Presence or absence of an IOP spike at 1-hour post-laser (defined as rise of IOP ≥
5 mm after 1-hourlaser intervention from baseline for this study) is considered a
possibility consistent with previous published studies (Kara et al. 2013; Johnson et
al. 2006; Nagar et al. 2005). Laser surgery might either be successful (using
definitions in line with similar previous studies - either 3mmHg reduction in
absolute intra ocular pressure from baseline or a reduction of ≥ 20% from baseline
IOP at 6-month follow-up), in which case they would follow the initial normal
standard of care (i.e. laser visit + 4 follow-up visits). Based on standard of care, it
was decided that for the failure cases of the laser treatments at 6-month visit (v6),
patients either would have another SLT (if IOP at v6 is <= 5 mm from baseline) or
proceed to incisional surgery (if IOP at v6 > 5mm from baseline), which would
add the costs of another SLT or surgery, respectively, and also cost of additional 4
follow-up visits for each scenario.
3.2.2 Societal and Ministry perspective of the decision model tree
For societal perspective, data from all participants are included to calculate the
ratio of outcome and IOP spike in the decision tree. For ministry perspective, only
data from participants having age 65 years or more are considered. The reason
being that all drug costs are covered by the ministry when patients are 65 years or
older. Ideally, from societal perspective, indirect medical costs that may include
wage loss, travel costs for treatment purposes, wage loss of accompanying persons
etc., should be included in the cost analysis of any medical situation. However,
indirect treatment cost has more impact in chronic disease of young population
leading to disability and significant loss of economic contribution to the society.
Disease like glaucoma, which mainly affects elderly population, comparatively

57
has less economic impact in terms of indirect medical cost. Moreover, laser
treatments for glaucoma is a short outpatient medical procedure without any
significant disastrous post-procedural adverse events. It does not need hospital
admission. So for this specific study, exclusion of indirect medical cost would not
have any substantial cost-impact that may affect the cost-effectiveness outcome.
3.2.3 Calculation of success and failure ratio of each intervention for the
decision tree model
Based on the definition of success of treatment, ratio of success is calculated from
the proportion of patients in each intervention arm with a successful outcome. The
ratio of failure is calculated from (1-ratio of success). Success of treatment is
defined as either 3mmHg reduction in absolute IOP from baseline IOP or a
reduction of ≥20% from baseline IOP to follow-up visit at 6-month, as defined in
the Manual of Procedure (MOP) of the clinical trial. Similar definition of success
has also been used previously. (Akhtar 2014; Martow et al. 2011; Mao et al. 2008;
Hodge et al. 2005).
3.2.4 Determining effectiveness of each intervention
Each intervention arm (ALT and SLT) is stratified based on outcome (success or
failure) at 6-month post-intervention follow-up visit (v6). So there are a total of 4
groups as follows:
ALT Success group
ALT failure group
SLT success group
SLT failure group
For each group, baseline mean IOP and mean IOP reduction from baseline at 6-
month post-laser follow-up periods (v6) are determined. The effectiveness of ALT
and SLT for each group is calculated considering the reduction of mean IOP at v6.

58
The following general formula is used:
Effectiveness of Intervention at v6 = (Mean IOP reduction at
v6)/Mean Baseline IOP
Considering societal (all participants considered) and ministry perspective
(participants aged 65 years and above), there are 2 separate decision model trees.
Expected costs and effectiveness of each intervention are calculated from them.
The incremental cost-effectiveness ratio (ICER) is calculated as the extra cost
needed to lower one additional unit of IOP in mmHg from baseline for each
decision model tree.

59
Figure 5: Decision Tree Model of ALT and SLT intervention: Societal perspective

60
Figure 6: Decision Tree Model of ALT and SLT intervention: Ministry Perspective

61
3.2.5 Calculation of expected values of costs and effectiveness
From the decision tree model of societal and ministry perspective, we have
calculated the expected values of costs and effectiveness for both ALT and SLT
interventions.
3.2.6 Calculation of incremental cost-effectiveness ratios (ICERS)
From the expected values of costs and effectiveness of ALT and SLT
interventions, we have calculated the ICERs for reduction of 1 mmHg IOP from
baseline at 6-month post-intervention period from both societal and ministry
perspective.
3.2.7 Willingness to pay (WTP)
We compare ICERs from previous economic studies with similar clinical
scenarios of treating OAG with IOP lowering medications for 6-month follow-up
period.
3.2.8 Sensitivity analysis
Sensitivity analysis is an essential component of both decision tree and cost-
effectiveness analysis. It is a well-accepted, method to evaluate and address the
uncertainty on the conclusion of a decision analysis (Petitti, 2000). We consider
IOP lowering effect of ALT and SLT intervention and Capital Cost of ALT and
SLT to be potential drivers of the decision tree model for generating the expected
values of costs and effectiveness for both ALT and SLT interventions. We would
perform one way sensitivity analysis to investigate the extent to which the
uncertainty of these variables would affect the decision model tree results. We
would assign plausible ranges based on upper and lower 25% limits for the base
case value. This would provide substantial evidence to address the uncertainty of
base case ICERs value for both interventions (ALT vs SLT) from societal and
ministry perspective. Moreover, the statistical and quasi-statistical methods (e.g.,
probability density function, the Bayesian approach) for estimating the uncertainty

62
of expected outcome from the decision analytic model has not been widely applied
(Petitti, 2000).
3.3 Calculation of intervention costs
Many parts of costing of the trial had been calculated previously (Akhter, 2015).
We have updated these costing as needed and calculated costing of new items.
3.3.1 Calculation of direct costs
Direct costs in health care problems are agreed generally as opportunity costs of
formal health-care goods and services like hospital and nursing-home care
expenses, health care personnel fee schedules, drugs and so on (Ernst R, 2006).
For this thesis, direct costs have been calculated considering charges of health care
delivery personnel, procedural costs, post-operative medication costs and per-
patient capital costs of interventions.
3.3.1.1 Physician time and follow-up schedule:
It includes baseline assessment, 1laser intervention appointment and 5 scheduled
follow-up visits of partial assessment and tonometry at one hour, one week and 1,
3, and 6-month post-laser procedure. For failure cases at 6months, additional costs
of either a repeat SLT or incisional surgery and 4 follow-up visits are added.
For monetary valuation of unit cost, as nearly half the participants are from
Ontario and fee schedules for similar services are nearly same across Canada, we
use the OHIP fee schedule, in general as follows:
Laser visit: $205.55 (OHIP fee code: E134)
Follow-up visit: $34.05 (OHIP code A234-partial assessment $28.95 +
OHIP code G435-tonometry $5.10).
Glaucoma filtration surgery: $550.00 (OHIP code E132)

63
3.3.1.2 Ophthalmic technician time and nurse time:
An ophthalmic technician assists the ophthalmologist to perform tonometry and
other examination procedures. Interviews with the trial ophthalmic technicians
revealed that they spent an average of 40 minutes during the laser visit and 15
minutes at each follow-up visit. The average wage of an ophthalmic technician is
determined $30/hour. We took the information from St. Joseph's Health Care
(SJHC), London, Ontario from payroll services of Healthcare Materials
Management Services (HMMS). Unit cost for an ophthalmic technician is
$0.50/min.
For nurses, an average of 1-hour is necessary for laser intervention, and two nurses
are required. The average hourly wedge of nurse time of $31/hour is obtained from
HMMS.
We assume that, these costs are similar across Canada.
3.3.1.3 Capital costs:
Capital costs are investments as an asset which is used over time (Drummond et
al. 2015). Costs of equipment needed for the intervention using monetary values
from the HMMS at SJHC are calculated. Capital cost is the same for each patient
of the same arm. The following schema is used to calculate per patient capital cost
(Drummond et al. 2015):
Per patient capital cost =
((L+TR+EC+(SC*Y)+(LR*Y)+(MS*N*Y))/(N*Y)
Where, L=Laser
TR=Tube Replacement
EC=Exam chair
SC=Service Contract
LR=Annual Lens Replacement Cost

64
MS= Medications/Supplies per Patient (includes tonometry cleaning
supplies, brimonidine drops, Gel for lens application)
N=Number of patients (Based on expert opinion)
Y=Laser lifetime in years
Table 1: Capital cost calculation
Item Cost for ALT
(CAD)
Cost for SLT
(CAD)
Laser 180,000 70,000
Tube Replacement 25,000 N/A
Exam chair 5,000 5,000
Service Contract 8,800 5,085
Lens Replacement per year 500 500
Laser lifetime in years 8 8
Medications/Supplies per Patient 1 1
Number of patients 1000 500
Per patient capital cost (Unit
Cost) 36.56 30.92
3.3.1.4 Medications:
As hospitals provided post-laser use of brimonidine, it is included in the capital
cost. Maxidex eye drop (4x/day for 4 days) is prescribed for each patient post-laser
($8.39 for 1 bottle of 5ml with 10% pharmacy mark up, included in direct cost).
Baseline medications and their costs have not been considered for this thesis with
the assumption that, appropriate randomization would result in a homogenous
distribution of participants across the two intervention groups based on disease
severity and baseline IOP lowering drug consumption (mean number of
medications used in each group).
65
3.3.2 Costs not included:
Other than the laser equipment, the cost of hospital infrastructures, overheads and
buildings is not considered as they are difficult to assess and assigning them to the
specific procedure usually results in irreducible capriciousness and sensitivity to
methods (Tan et al. 2009, Finkler et al. 2007, Barnett, 2009).
Indirect costs, often termed as direct non-health care costs, refers to productivity
costs associated with lost or impaired ability of work or lost productivity due to
death or disability (Neumann, 2009). This is more concern for a societal
perspective. According to the Panel on Cost-Effectiveness Analysis of US Public
Health Service, productivity costs should not be valued monetarily. It should be
encompassed as health effects from the intervention (Gold et al. 1996). However,
for highly disabling illness of young patients, exclusion of productivity costs from
the numerator of CEA may have a large effect (Petitti, 2000). As laser
trabeculoplasty is an outpatient procedure, that usually does not require long term
absence from normal daily tasks, wage loss due to the intervention procedure of
patients and their accompanying personnel, where applicable, is ignored in this
thesis. Travel costs are also not included assuming that, they would be similar in
both intervention arms, thus nullifying each other and would not influence the
CEA if not included.
3.4 Final Analyses and measures
Our main purpose is to perform a cost-effectiveness analysis for this thesis.
Demographic characteristics of participants after stratification based on
intervention arms are done. Expected costs on all decision model trees are
performed and ICER for each decision model tree is calculated and compared.
One way sensitivity analysis is done considering the IOP lowering effect and
capital cost of ALT and SLT as the potential drivers for changes is expected cost
of laser modalities. Treatment outcomes (success and failure) of both arms are
presented considering different parameters.

66
Chapter 4 - Results
4.1 Descriptive Statistics
Data was available for 91 participants for a 6-month follow-up period, 46 in ALT
arm and 45 in SLT arm. Mean age of ALT arm was slightly higher than SLT
(69.28±8.72 vs 65.97±11.81). In both arms, number of male participants were
slightly higher than females. More right eyes were treated in ALT group and for
SLT group, it was reversed. Caucasian race ranked highest among both arms
(82.6% in ALT vs 82.2%). (Table 2).
Table 2: Descriptive statistics of participants
Demographics ALT SLT
Age(Yrs)±(SD) 69.28±8.72 65.97±11.81
Male 28 25
Female 18 20
Treated Eye-Right (OD) 26 18
Treated Eye- Left (OS) 20 27
Race/Ethnicity
Caucasian 38 37
African 4 2
Asian 2 2
Middle East 0 3
Aboriginal 1 1
Self-Defined 1 0
4.2 Number of IOP lowering Medications at Baseline:
The mean of number of IOP lowering medications at baseline for ALT group was
1.22 (95% CI, 0.90 to 1.53) and for SLT group was 1.36 (95% CI, 0.97 to 1.74).
(Table 3).

67
Table 3: Number of IOP lowering medications at baseline
Number of Medications
Intervention
Arm 0 1 2 3 4 Mean 95% CI Total
ALT 15 13 11 7 0 1.22 0.90, 1.53 46
SLT 16 10 8 9 2 1.36 0.97, 1.74 45
4.3 Baseline and Follow-up Mean IOP at different time point:
Mean Baseline IOP for ALT and SLT arm were similar (21.65±4.08 vs
22.13±4.21, respectively). ALT arm showed a steady decrease over 6-month
duration. However, for SLT arm, there was a rise in Mean IOP at 6-month
compared to IOP reduction at 3-month from baseline (19.11±4.29 vs 17.54±3.71,
respectively). (Table 4).
Table 4: Mean IOP (in mmHg) at baseline and different time points
Timeline ALT SLT
Baseline 21.65±4.08 (Min:12, Max:33) 22.13±4.21 (Min: 16, Max: 30)
1-hour 14.76±4.83 (Min:5.5, Max:33.5) 15.86±5.17 (Min: 8, Max: 28)
1-week 20.14±4.83(Min:11.5, Max:33) 17.92±4.27 (Min: 11.5, Max: 28.5)
1-month 18.71±4.20(Min:11, Max:29) 17.43±3.91 (Min: 11, Max: 26)
3-month 18.43±5.42(Min:6, Max:41) 17.54±3.71 (Min: 12, Max: 25.5)
6-month 18.22±4.37(Min:9, Max:31) 19.11±4.29 (Min: 13.5, Max: 32)
4.4 Mean IOP Reduction from Baseline at different time points:
While ALT arm showed a steady and sustained reduction in IOP from baseline to
6-month follow-up, SLT arm demonstrated a more mean IOP reduction up to 3-
month follow-up than ALT arm, but at 6-month, had less mean IOP reduction
than ALT. (Table 5).

68
Table 5: Mean IOP reduction (in mmHg) from baseline at different time points
Timeline ALT SLT
Baseline 21.65±4.08 22.13±4.21
1-week 1.51±3.88 4.22±4.42
1-month 2.94±4.42 4.70±4.44
3-month 3.22±5.44 4.59±3.80
6-month 3.43±5.17 3.02±4.59
4.5 Eyes achieving 20% IOP reduction from Baseline to different time
points:
ALT arm had gradual increase of number of eyes achieving 20% reduction of IOP
from baseline for the 6-month time horizon. For SLT arm, up to 1-month, almost
half of the eyes (48.8%) had achieved this, but at 3-month and 6-month follow-up,
there was substantial drop (44.4% and 35.5%, respectively). (Table 6).
Table 6: Eyes with 20% IOP reduction from baseline at different time points
Timeline ALT (n=46) SLT (n=45)
1-week 23.9% (11/46) 48.8% (22/45)
1-month 39.1% (18/46) 48.8% (22/45)
3-month 36.9%(17/46 ) 44.4% (20 /45)
6-month 41.3% (19/46 ) 35.5% (16/45)
4.6 Outcome of treatment (success or failure) at 6-month follow-up
We defined success of treatment as either 20% reduction of IOP from baseline or
absolute reduction of IOP of 3mmHg or more from baseline, or both. ALT arm
had higher success outcome at 6-month follow-up. (Table 7).
Table 7: Outcome of treatment at 6-month follow-up
Outcome ALT (n=46) SLT (n=45)
Success 58.7% (27/46) 42.2% (19/45)
Failure 41.3% (19/46) 57.8% (26/45)

69
Majority of the patients in both arms had previous SLT done twice. Only 1
patient, in ALT arm, had previous SLT done three times. (Table 8).
Table 8: Previous SLT history and outcome at 6-month follow-up
ALT (n=46) SLT (n=45)
Previous
SLT Success Failure Success Failure
Once 19.6% (9/46) 13.0% (6/46) 8.9% (4/45) 20.0% (9/45)
Twice 39.1% (18/46) 26.1% (12/46) 33.3% (15/45) 37.8% (17/45)
Thrice 0.0% (0/46) 2.2% (1/46) 0.0% (0/45 eyes) 0.0% (0/45)
In ALT arm, 23 out of 38 eyes of Caucasians had successful outcome at 6-month,
compared to 14 out of 37 eyes in SLT arm. (Table 9).
Table 9: Outcome among race/ethnicity at 6-month follow-up
Race/Ethnicity ALT(Success/Failure) SLT (Success/Failure)
Caucasian 23/15 14/23
African 1/3 1/1
Asian 2/0 2/0
Middle East 0/0 2/1
Aboriginal 1/0 0/1
Self-Defined 0/1 0/0
Only 1 patient in ALT arm had an IOP spike at 1-hour post-laser. (Table 10).
Table 10: IOP Spike at 1-hour post-laser
ALT SLT
IOP Spike 1 0
No IOP Spike 45 45
For failure cases at 6-month, either repeat SLT or surgery had been designed based
on IOP of that visit. Repeat SLT was planned for patients with IOP 5 mmHg or

70
less from baseline. Surgery was planned for those having IOP greater than 5
mmHg from baseline. ALT arm had a total of 19 failure cases and SLT arm had
26. (Table 11).
Table 11: Further treatment plan for failure cases at 6-month follow-up
Treatment Plan ALT SLT
Repeat SLT 16 24
Surgery 3 2
4.7: Obtaining Ratio of Treatment outcome for the Decision Model Tree
4.7.1 Societal perspective
For societal perspective, all data, irrespective of age were considered. Ratio for
IOP spike at 1-hour post-laser for ALT and SLT group were 0.02 and 0,
respectively and that for No IOP spike were 0.98 and 1, respectively. (Table 12).
Table 12: One-hour post-laser IOP spike for ALT and SLT group: Societal
perspective
Intervention
Arm
IOP
Spike
No IOP
Spike IOP Spike Ratio No IOP Spike Ratio
ALT (n=46) 1 45 0.02 (1/46) 0.98 (45/46)
SLT (n=45) 0 45 0 (0/45) 1 (45/45)

71
Success ratio of IOP spike and no IOP spike group at 6-month post-laser follow up
for ALT arm were 0 and 0.6, respectively. (Table 13).
Table 13: IOP Spike at 1-hour post-laser and treatment outcome at 6-month for
ALT: Societal perspective
Treatment
Outcome IOP Spike at 1-hr post-laser IOP Spike No IOP Spike
At 6-month Yes (n=1) No (n=45) Outcome Ratio Outcome Ratio
Success 0 27 0 (0/1) 0.6 (27/45)
Failure 1 18 1 (1/1) 0.4(18/45)
Success ratio of IOP spike and no IOP spike group at 6-month post-laser follow up
for SLT arm were 0 and 0.42, respectively. (Table 14).
Table 14: IOP Spike at 1-hour post-laser and treatment outcome at 6-month for
SLT group: Societal perspective
Treatment
Outcome IOP Spike at 1-hr post-laser IOP Spike No IOP Spike
At 6-month Yes (n=0) No (n=45) Outcome Ratio Outcome Ratio
Success 0 19 0 0.42 (19/45)
Failure 0 26 0 0.58 (26/45)
For 19 failure cases of ALT, the ratio of repeat SLT and surgery for IOP spike
group were 0 and 1, respectively and for no IOP spike group were 0.89 and 0.11,
respectively. (Table 15).
Table 15: Treatment (Rx) plan for failure cases (at 6-month follow-up) of ALT
group: Societal perspective
Future Rx Plan IOP Spike at 1-hr post-laser IOP Spike No IOP Spike
for Failure Cases Yes (n=1) No (n=18) Outcome Ratio Outcome Ratio
Repeat SLT 0 16 0 (0/1) 0.89 (16/18)
Surgery 1 2 1 (1/1) 0.11 (2/18)
72
For 26 failure cases of SLT, there was no case in IOP spike group. For no IOP
spike group, ratio of repeat SLT and surgery were 0.92 and 0.08, respectively.
(Table 16).
Table 16: Treatment (Rx) plan for failure cases (at 6-month follow-up) of SLT
group: Societal perspective
Future Rx Plan IOP Spike at 1-hr post-laser IOP Spike No IOP Spike
for Failure Cases Yes (n=0) No (n=26) Outcome Ratio Outcome Ratio
Repeat SLT 0 24 0 0.92 (24/26)
Surgery 0 2 0 0.08 (2/26)
4.7.2 Ministry Perspective
For ministry perspective, data from participants aged greater than or equal to 65
years were considered. Ratio for IOP spike at 1-hour post-laser for ALT and SLT
arms were 0.03 and 0, respectively and that for No IOP spike group were 0.97 and
1, respectively. (Table 17).
Table 17: One hour post-laser IOP spike for ALT and SLT group: Ministry
perspective
Intervention
Arm
IOP
Spike
No IOP
Spike IOP Spike Ratio No IOP Spike Ratio
ALT (n=33) 1 32 0.03 (1/33) 0.97 (32/33)
SLT (n=24) 0 24 0 (0/24) 1 (24/24)
Success ratio of IOP spike and no IOP spike at 6-month post laser follow up for
ALT arm was 0 and 0.59, respectively and that of failure group were 1 and 0.41,
respectively. (Table 18).

73
Table 18: IOP Spike at 1-hour post-laser and treatment outcome at 6-month for
ALT group: Ministry perspective
Treatment
Outcome IOP Spike at 1-hr post-laser IOP Spike No IOP Spike
At 6-month Yes (n=1) No (n=32) Outcome Ratio Outcome Ratio
Success 0 19 0 (0/1) 0.59 (19/32)
Failure 1 13 1 (1/1) 0.41(13/32)
Success ratio of IOP spike and no IOP spike at 6-month post laser follow up for
SLT arm were 0 and 0.42, respectively and that of failure group were 0 and 0.58,
respectively. (Table 19).
Table 19: IOP spike at 1-hour post-laser and treatment outcome at 6-month for SLT
group: Ministry perspective
Treatment
Outcome IOP Spike at 1-hr post-laser IOP Spike No IOP Spike
At 6-month Yes (n=0) No (n=24) Outcome Ratio Outcome Ratio
Success 0 10 0 0.42 (10/24)
Failure 0 14 0 0.58 (14/24)
For 14 failure cases of ALT arm, the ratio of repeat SLT and surgery for IOP spike
group were 0 and 1, respectively and for no IOP spike group were 0.85 and 0.15,
respectively. (Table 20).
Table 20: Treatment plan for failure cases (at 6-month follow-up) of ALT group:
Ministry perspective
Future Treatment
Plan IOP Spike at 1-hr post-laser IOP Spike No IOP Spike
for Failure Cases Yes (n=1) No (n=13) Outcome Ratio Outcome Ratio
Repeat SLT 0 11 0 (0/1) 0.85 (11/13)
Surgery 1 2 1 (1/1) 0.15 (2/13)

74
For 14 failure cases of SLT arm, there was no case in IOP spike group and for no
IOP spike group, ratio of repeat SLT and surgery were 0.93 and 0.07, respectively.
(Table 21).
Table 21: Treatment plan for failure cases (at 6-month follow-up) of SLT group:
Ministry perspective
Future Treatment
Plan IOP Spike at 1-hr post-laser IOP Spike No IOP Spike
for Failure Cases Yes (n=0) No (n=14) Outcome Ratio Outcome Ratio
Repeat SLT 0 13 0 0.93 (13/14)
Surgery 0 1 0 0.07 (2/26)
4.8 Cost of the intervention arms
Capital cost of ALT and SLT per patient were 36.56 and 30.92 CAD, respectively.
Health personnel charges and drug costs were included in the costing. (Table 22).
Table 22: Cost-Calculations of the interventions
Item Cost (In Canadian Dollar)
ALT Capital (Per Patient) 36.56
SLT Capital (Per Patient) 30.92
Maxidex Eye drop with 10% pharmacy mark up 9.23
Laser Charge for Ophthalmologist 205.55
Laser Charge for Technician 20.00
Surgery Charge for Ophthalmologist 550.00
Surgery Charge for Nurse 70.00
Follow-up Charge for Ophthalmologist 34.05
Follow-up Charge for Technician 7.50

75
4.9 Mean IOP reduction at 6-Month Follow-up
4.9.1 Societal perspective:
Mean IOP reduction of ALT and SLT arms from the societal perspective were
3.435 mmHg (95% CI: 1.898 to 4.971) and 3.027 mmHg (95% CI: 1.648 to 4.405)
from baseline. This difference was not statistically significant (p=0.69).
(Table 23).
Table 23: Baseline IOP and IOP reduction at 6-month: Societal perspective
Intervention Arm n Mean IOP reduction at 6-month 95% CI
ALT 46 3.435 1.898, 4.971
SLT 45 3.027 1.648, 4.405
*p-Value 0.69
*By non-paired t-test
4.9.2 Ministry Perspective:
Mean IOP reduction of ALT and SLT arms from the ministry perspective were
3.697 mmHg and 2.883 mmHg from baseline. This difference was not statistically
significant (p=0.56). (Table 24).
Table 24: Baseline IOP and IOP reduction at 6-month: Ministry perspective
Intervention Arm n Mean IOP reduction at 6-month 95% CI
ALT 33 3.697 1.649, 5.744
SLT 24 2.883 0.926, 4.841
*p-Value 0.56
*By non-paired t-test

76
4.10 Determination of Effectiveness for Intervention Arms
4.10.1 Societal perspective
IOP lowering effectiveness for each success and failure group for ALT and SLT
arms were calculated for societal perspectives. For failure group, effectiveness
were negative. Success group of both arms had higher Baseline IOP. (Table 25).
Table 25: IOP lowering effectiveness at 6-month follow-up for ALT and SLT:
Societal perspective
Intervention
Arm
Outcome of
Intervention
at 6-month
Follow-Up
(n) Baseline
Mean IOP
Mean IOP
reduction from
Baseline at 6-
month Follow-
Up (v6)
Effectiveness: Mean
IOP reduction at v6
from Baseline /
Mean Baseline IOP
ALT ALT Success 27 22.741 6.574 0.289
ALT ALT Failure 19 20.105 -1.026 -0.051
SLT SLT Success 19 24.421 7.263 0.297
SLT SLT Failure 26 20.461 -0.069 -0.003
4.10.2 Ministry Perspective
IOP lowering effectiveness for each success and failure group for ALT and SLT
arms were calculated for ministry perspective also and revealed similar results as
that of societal perspective. (Table 26).
Table 26: IOP lowering effectiveness at 6-month follow-up (v6) for ALT and SLT
group: Ministry perspective
Intervention
Arm
Outcome of
Intervention
at 6-month
Follow-Up
(n)
Baseline
mean
IOP
Mean IOP
reduction from
Baseline at 6-
month (v6)
Effectiveness: Mean
IOP reduction at v6
from Baseline / Mean
Baseline IOP
ALT ALT Success 19 23.263 7.263 0.312
ALT ALT Failure 14 20 -1.143 -0.057
SLT SLT Success 10 23.7 7.2 0.304
SLT SLT Failure 14 21.5 -0.199 -0.009

77
4.11 Expected Values (Cost/Effectiveness) from the Decision Model Tree
4.11.1 Societal perspective
From societal perspective, the expected value of cost and effectiveness derived
from the decision tree model for ALT arm was CAD 458/0.149 mmHg of IOP
reduction from baseline IOP and that for SLT arm was CAD 448/0.123 mmHg of
IOP reduction from baseline IOP. (Figure 9).

78
Figure 7: Expected Values of Cost/Effectiveness from Decision Model Tree: Societal perspective

79
4.11.2 Ministry Perspective
From ministry perspective, the expected value of cost and effectiveness derived from the decision tree model for
ALT arm was CAD 467/0.154 mmHg of IOP reduction from baseline IOP and that for SLT arm was CAD 446/0.122
mmHg of IOP reduction from baseline IOP. (Figure 10)
Figure 8: Expected Values of Cost/Effectiveness from Decision Model Tree: Ministry Perspective

80
4.12: Incremental Cost-Effectiveness Ratio (ICER)
4.12.1 Societal perspective
Effectiveness of both treatment arms was calculated based on reduction of IOP by
each intervention from the societal perspective (all age included). Effectiveness
was calculated as an average of mean IOP reduction at 6-month post-laser follow-
up from mean baseline IOP. No strategies were clearly dominated by any other.
Cost-Effectiveness (C/E) ratio for SLT was 3645.03 and that for ALT was
3072.65. To switch from SLT to ALT, It would cost $ 356.49 for each extra unit
IOP reduction. (Table 27).
Table 27: CEA of ALT vs SLT, base case: Societal perspective
Strategy Cost
Incremental
cost
Effectiveness
at 6-month
follow-up
Incremental
effectiveness C/E
Incremental
C/E (ICER)
SLT 448.34 0.123 3645.03
ALT 457.58 9.24 0.149 0.026 3072.65 356.49
Figure 9: Cost-Effectiveness graph from the societal perspective
The cost-effectiveness graph from the societal perspective with cost on y-axis and
effectiveness on x-axis showing none of the interventions were clearly dominated
by any other, denoted by joining the ALT and SLT legend by a straight line.

81
4.12.2 Ministry Perspective
For ministry perspective, the same effectiveness as that of societal perspective for
each corresponding group was used. Participants aged ≥ 65 years were considered.
The results were similar as that of societal perspective with different values. To
switch from SLT to ALT, It would cost $ 649.71 for each extra unit IOP reduction.
(Table 28).
Table 28: CEA of ALT vs SLT, base case: Ministry perspective
Strategy Cost
Incremental
Cost
Effectiveness
at 6-month
follow-up
Incremental
Effectiveness C/E
Incremental
C/E (ICER)
SLT 446.28 0.122 3644.32
ALT 466.89 20.61 0.154 0.032 3028.25 649.71
Figure 10: Cost-Effectiveness graph from ministry perspective
Cost-Effectiveness graph from ministry perspective with cost on y-axis and
effectiveness on x-axis showing none of the interventions were clearly dominated
by any other denoted by joining the ALT and SLT legend by a straight line.

82
4.13 Sensitivity Analysis
IOP lowering effectiveness and capital cost of ALT and SLT were considered as
potential drivers of the decision model tree and the resultant ICERs. A one-way
sensitivity analysis with 25% above and below value of base case variables with 4
equal intervals in between were used for both societal and ministry perspective.
4.13.1 One-Way Sensitivity analysis of Effectiveness: Societal perspective
A 25% lowering of ALT Success Effectiveness and 25% increase of SLT Success
Effectiveness results in dominance of SLT over ALT. (Table 29).
Table 29: Sensitivity analysis of effectiveness value: Societal perspective
ICER
Group
Variable
25% lower from Base
Case
25% higher from
Base Case Dominance of Strategy
ALT
Success
ALT is dominated by
SLT 135.38
ALT is dominated by
SLT when base case
value is lowered by
25%
ALT
Failure 449.34 295.44 None
SLT
Success 162.11
ALT is dominated by
SLT
ALT is dominated by
SLT when base case
value is increased by
25%
SLT
Failure 348.69 356.49 None

83
Figure 11: One-Way Sensitivity analysis of Effectiveness: Societal perspective
The horizontal axis of the graphs represent the effectiveness value, with base case
value in the middle. The vertical axis is the incremental cost-effectiveness ratio
(ICER).
4.13.2 One-Way Sensitivity analysis of Capital Cost: Societal perspective
One way sensitivity analysis of capital cost of ALT and SLT revealed that, none of
the strategies were clearly dominated by any other.
Table 30: Sensitivity analysis of capital cost value from societal perspective
ICER
Group
Variable 25% lower from Base Case 25% higher from Base Case
Dominance of
Strategy
ALT Capital 149.15 563.83 None
SLT Capital 536.83 176.15 None
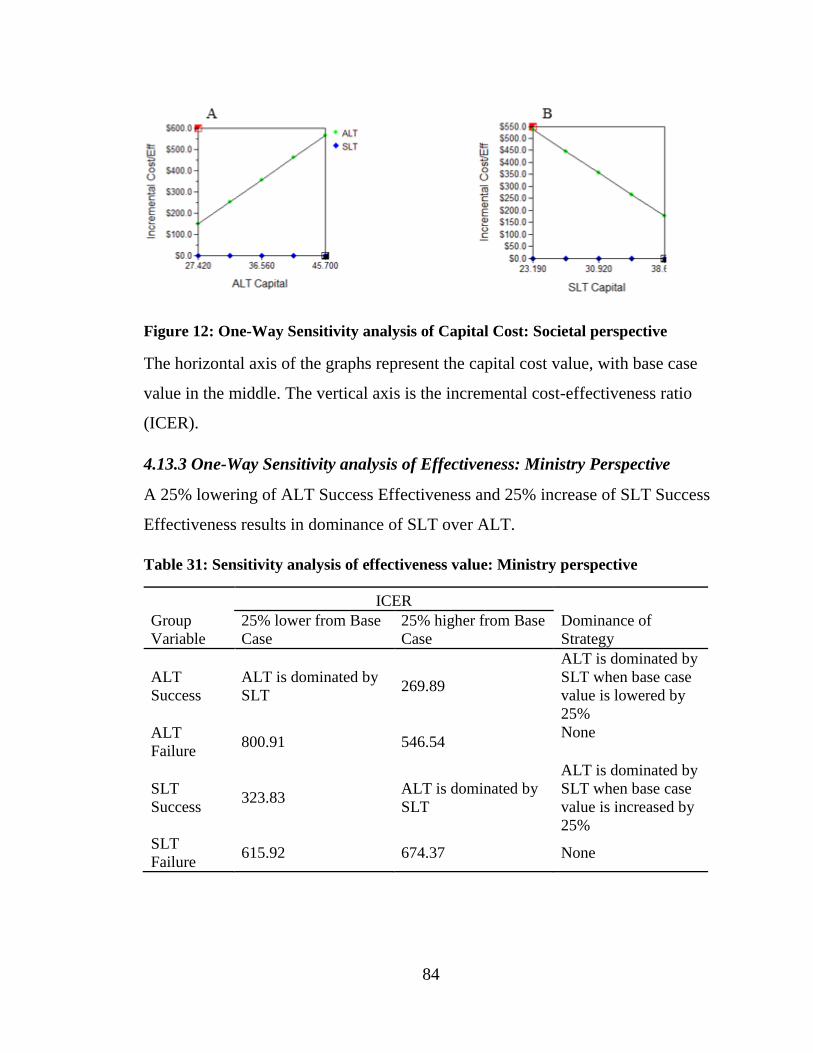
84
Figure 12: One-Way Sensitivity analysis of Capital Cost: Societal perspective
The horizontal axis of the graphs represent the capital cost value, with base case
value in the middle. The vertical axis is the incremental cost-effectiveness ratio
(ICER).
4.13.3 One-Way Sensitivity analysis of Effectiveness: Ministry Perspective
A 25% lowering of ALT Success Effectiveness and 25% increase of SLT Success
Effectiveness results in dominance of SLT over ALT.
Table 31: Sensitivity analysis of effectiveness value: Ministry perspective
ICER
Group
Variable
25% lower from Base
Case
25% higher from Base
Case
Dominance of
Strategy
ALT
Success
ALT is dominated by
SLT 269.89
ALT is dominated by
SLT when base case
value is lowered by
25%
ALT
Failure 800.91 546.54
None
SLT
Success 323.83
ALT is dominated by
SLT
ALT is dominated by
SLT when base case
value is increased by
25%
SLT
Failure 615.92 674.37 None

85
Figure 13: One-Way Sensitivity analysis of Effectiveness: Ministry perspective
The horizontal axis of the graphs represent the effectiveness value, with base case
value in the middle. The vertical axis is the incremental cost-effectiveness ratio
(ICER).

86
4.13.4 One-Way Sensitivity analysis of Capital Cost: Ministry Perspective
One way sensitivity analysis of capital cost of ALT and SLT revealed that, none of
the strategies were clearly dominated by any other. (Table 32; See Appendix A for
details).
Table 32: Sensitivity analysis of capital cost value: Ministry perspective
ICER
Group
Variable
25% lower from Base
Case
25% higher from Base
Case
Dominance of
Strategy
ALT
Capital 484.8 814.62 None
SLT
Capital 801.14 498.28 None
Figure 14: One-Way Sensitivity analysis of Capital Cost: Ministry Perspective
The horizontal axis of the graphs represent the capital cost value, with base case
value in the middle. The vertical axis is the incremental cost-effectiveness ratio
(ICER).

87
Chapter 5: Discussion
5.1 Results
In this thesis, the primary objective was to compute and compare the cost-
effectiveness of two laser treatment modalities for uncontrolled open angle
glaucoma (OAG) patients (including ocular hypertension, pigmentary dispersion
syndrome and pseudoexfoliation syndrome) with at least one full previous SLT
who were enrolled in an ongoing, active, equivalence parallel armed randomized
multi-centered clinical trial entitled ‘A randomized clinical trial of selective laser
trabeculoplasty (SLT) in open angle glaucoma who had been previously treated
with complete SLT’. Data from those patients who completed a 6-month post-laser
follow-up (a total of 91 cases) were included in the analysis. Both societal and
ministry perspective had been considered for the analysis. For societal perspective,
all patients were considered. For ministry perspective, patients aged ≥ 65 years
had been considered only. All analyses were done by comparing the intervention
arms (ALT versus SLT). Based on the treatment outcome at 6-month post-
intervention follow-up (either success or failure of treatment), two decision model
trees, one for each perspective (societal and ministry), were developed. Ratio of
IOP spike in mmHg at 1-hour post-laser was included in both the decision model
trees. Weinreb et al. (1983) reported progression of visual field (VF) loss in
advanced glaucoma patient experiencing post-laser IOP spike. IOP in the early
post-procedural period might be a good predictor of treatment outcome (Downes
et al. 1994). Reductions of mean IOP in mmHg from baseline to 6-month post-
intervention follow-up for both treatment outcomes for each intervention arm were
calculated and used in the cost-effectiveness analysis as the effectiveness of
corresponding outcome of intervention arm (i.e, ALT Success Effectiveness, ALT
Failure Effectiveness, SLT Success Effectiveness, SLT Failure Effectiveness). For
this thesis, the treatment success was defined as a reduction of IOP of 3mmHg or
20% reduction or both from baseline at 6-month post-intervention follow-up. The
MOP of the running clinical trial and previous studies on IOP reduction of OAG

88
used either or both of the conditions as a treatment success (Akhtar 2014; Martow
et al. 2011; Mao et al. 2008; Hodge et al. 2005). For cost-effectiveness analysis
(CEA), expected value of cost and effectiveness were determined from the
decision model tree from both societal and ministry perspective, and incremental
cost effectiveness ratios (ICERs) were determined. The expected value of
individualized care in cost-effectiveness analysis and decision making is a useful
tool to identify opportunity to improvement of efficiency in health care (van
Gestel et al. 2012). A one-way sensitivity analysis for effectiveness value and
capital cost for both intervention arms and perspectives were performed using a
range of 25% above and below the base case value with 4 equal intervals in
between. Due to the short horizon of follow-up, discounting was not considered
for CEA. The impact of IOP reduction on quality of life (improved or not) would
not have been apparent for this follow-up period and therefore was not an analysis
option. So, willingness to pay by the patients for ALT and SLT treatment
strategies was not considered for this scenario.
5.1.1 Clinical Trial Cohort
Baseline demographic characteristics were comparable between ALT and SLT
intervention arm. The mean age of clinical trial cohort for both ALT and SLT
groups were above 65 years, reflecting the natural progressive deterioration and
chronicity of OAG. Symptoms affecting visual field, including visual loss,
generally start at age 65 years and up (Access Economics Pty Limited). Most of
the patients were Caucasians. Mean baseline IOP for both intervention arms were
quite close (2.2% higher in SLT arm). While SLT group showed a steady and
higher reduction of IOP for the first three month compared to ALT group, the
scenario reversed back in favor of ALT at 6-month post-laser follow-up. At that
time, 58.7% eyes of ALT arm achieved successful outcome and for SLT arm, it
was 42.2%.

89
5.1.2 Use of IOP lowering medications at baseline:
Among 91 participants, a total of 60 participants were on 1 or more IOP lowering
medications. The mean number of medications for ALT group was 1.22 (95% CI:
0.90 to 1.53) and for SLT it was 1.36 (95% CI: 0.97 to 1.74). This very close
approximation of two means (of number of medications) represent a proxy for
homogeneous distribution of severity of disease across the randomized group. This
also rationalized the exclusion of medication costs used at baseline for the cost-
effectiveness analysis.
5.1.3 Costing Aspects
For calculation of cost, we considered the charges of health care delivery
personnel, procedural costs, post-operative medication costs and per-patient
capital costs of interventions as direct costs, as these were the core costing for
performing laser treatments for OAG. The costs of hospital infrastructures,
overheads and buildings were not considered as they were difficult to assess and
assigning them to the specific procedure like laser therapy for OAG in a hospital
setting might cause much variability and sensitivity to methods and results (Tan et
al. 2009; Finkler et al. 2007; Barnett, 2009). We also did not consider indirect cost
such as wage loss due to the intervention procedure of patients and their
accompanying personnel, as both ALT and SLT were outpatient procedure that
neither required long time absence from normal daily tasks nor in-patient care. We
assumed that, this indirect cost would have an unsubstantial impact on cost
outcome. Travel cost was also not considered with the assumption of similar
expense in both intervention arms as an effect of proper randomization and thus
would have a minimal impact, if at all, in the cost outcome. The per patient capital
cost of ALT and SLT intervention groups were $36.56 and $30.92, respectively.
5.1.4 Effectiveness Aspects and IOP reduction at 6-month follow-up
Laser treatment modalities for OAG were intended to reduce the pre-treatment
IOP to a target level. So the reduction of post-laser IOP from baseline to 6-month

90
follow-up visit had been considered as an effectiveness of ALT and SLT
intervention arms for this thesis. Effectiveness had been determined for both
societal and ministry perspective. From societal perspective, the effectiveness of
IOP reduction from baseline for SLT success group was slightly higher than
corresponding ALT group (0.297 mmHg versus 0.289 mmHg). They remained
similar for failure group also (SLT: -0.003 mmHg, ALT: -0.051 mmHg). For the
ministry perspective, effectiveness of success and failure of ALT were higher than
their SLT counterpart (ALT Success: 0.312 mmHg, SLT Success: 0.304 mmHg;
ALT Failure: -0.057 mmHg and SLT Failure: -0.009). From societal perspective,
expected value of effectiveness of ALT intervention was 0.149 mmHg and for
SLT intervention, it was 0.123 mmHg. From the ministry perspective, expected
effectiveness for ALT and SLT group were 0.154 mmHg and 0.122 mmHg,
respectively. The effectiveness of both intervention arms remained close to each
other.
The difference of mean IOP reduction at 6-month post-laser follow-up for both
intervention arms from both societal and ministry perspectives were not significant
statistically.
5.1.5 Cost-Effectiveness Analysis (CEA) and Incremental Cost Effectiveness
Ratio (ICER): Societal perspective
The expected cost and effectiveness of ALT and SLT from the constructed
decision model tree were used to determine which laser modality was cost-
effective at 6-month post-laser follow-up from societal perspective. None of the
interventions were clearly dominated by any other. Expected cost of ALT was a
little higher than SLT ($458 versus $448, respectively) and so as the effectiveness
(0.149 mmHg versus 0.123 mmHg). ALT strategy was slightly costly and slightly
more effective compared to SLT. To switch from SLT to ALT, it would cost
$356.49 for each extra unit IOP reduction.

91
5.1.6 Cost-Effectiveness Analysis (CEA) and Incremental Cost Effectiveness
Ratio (ICER): Ministry Perspective
The Ministry perspective also revealed similar results as that of societal
perspective with different values. Expected cost of ALT was higher than SLT
($467 versus $446, respectively) and so as the effectiveness (0.154 mmHg versus
0.122 mmHg). Expected cost and effectiveness of SLT from societal and ministry
perspective were almost close to each other; whereas they were a little higher for
ALT from ministry perspective. Cost-Effectiveness(C/E) ratio of SLT was
3644.32 and that for ALT was 3028.25. To switch from SLT to ALT, it would cost
$ 649.71 for each extra unit IOP reduction.
5.1.7 Sensitivity Analysis: Societal perspective
For effectiveness variables, a 25% lowering of ALT Success Effectiveness and
25% increase of SLT Success Effectiveness results in dominance of SLT over
ALT. No other variables show any clear dominance to each other.
Varying capital costs also revealed similar results as that of base case analysis.
None of the interventions were clearly dominated by any other.
5.1.8 Sensitivity Analysis: Ministry Perspective
One-way sensitivity analysis from the ministry perspective, , also produced similar
results as that of societal perspective. A 25% lowering of ALT Success
Effectiveness and 25% increase of SLT Success Effectiveness results in
dominance of SLT over ALT. Other variables did not show any clear dominance
upon each other.
Sensitivity analysis of capital costs also revealed similar results as that of base
case for ministry perspective with no clear dominance of the interventions by any
other.
5.1.9 Willingness to pay for 1mmHg reduction of IOP: ICERs from other IOP
lowering agents in similar scenario:

92
Lachaine et al. (2008) conducted a cost-effectiveness analysis of prostaglandin
analogues for ophthalmic use. They did a systematic literature searches and
conducted this CEA study from ministry perspective by using a decision analytic
model considering PGAs with other comparative IOP lowering agents as first line
of treatment and for both eyes assuming a 100% patient compliance. Costs were
calculated from Ontario sources. Effectiveness was defined as reduction of IOP
from at six month from baseline. For a six month duration of treatment, they
calculated the ICER. When comparing Timolol with Latanoprost, Latanoprost
was costly and more effective than Timolol and the ICER was 81.80 dollars.
When comparing Timolol with Travoprost, Travoprost was costly & more
effective than Timolol & ICER was 110.61 dollars. These ICERs for reduction of
1 additional mm Hg of IOP are much less than our calculated ICERs. In other
words, Willingness to pay for 1mmHg reduction of IOP is much less than our
calculated ICER. (Table 33).
Table 33: Cost-effectiveness analysis of prostaglandin analogues for ophthalmic use
Strategy Cost
(C) Incremental
Cost IOP
reduction at
6-month (E)
Incremental
IOP
reduction C/E Incremental
C/E (ICER)
Timolol 112.52
6.31
17.84
Latanoprost 200.37 87.85 7.38 1.07 27.15 81.80 VS
Timolol 112.38
6.73
16.69
Travoprost 191.64 79.26 7.45 0.72 25.73 110.61
5.2 Strengths of the Study
The major strength of this study is its active equivalence parallel armed
randomized, single blinded, multi-centered clinical trial to assess the effectiveness
of ALT and SLT in terms of IOP reduction from baseline. The study protocol

93
included a generalizable study population, permissive eligibility criteria, an easily
administered treatment protocol and outcomes that are almost the same compared
to regular care of such patients across Canada. One of the major criticisms of
clinical trial based cost-effectiveness analysis is the application of rigorous
protocol that might not be compatible with regular health care delivery for similar
patients, especially may compliance could have been compromised in regular
patient care and the costing might not reflect the real scenario (Drummond et al.
2015). This study design diminished these criticisms due to the very short single
treatment protocol, where compliance is 100% guaranteed and use of regular
patient care set-up for trial patients, the cost of which is a true mirror image of
direct patient care costing in a regular hospital out-patient or ophthalmological
health care delivery center.
5.3 Limitations of the study
The study has several limitations. The sample size used for this thesis is less than
the calculated sample size (91 instead of 144 eyes) of the trial, so the power of the
study was reduced. The 6-month follow-up outcomes may vary when one year or
more follow-up period would be considered. In that case, cost-effectiveness
analysis of the intervention arms may yield different results. Although it was
assumed that, indirect cost of treatment would not have a substantial impact on
cost calculation, it would bolster any cost-effectiveness analysis, especially for
societal perspective, if authentic data of indirect treatment costs could be collected
from the patients.
5.4 Conclusion
Our study result revealed that, for a 6-month post-intervention follow-up for
uncontrolled glaucoma patients who have had at least one previous full SLT,
neither ALT nor SLT strategies were clearly dominated by any other. ALT is
slightly more effective and slightly costly over SLT strategy. To switch from SLT

94
to ALT, it would cost $ 356.49 for each extra unit IOP reduction from societal
perspective and from ministry perspective, the same would cost $ 649.71. This
ICERs were much higher in comparison to ICERS of other IOP lowering
strategies in similar situations. Sensitivity analysis with effectiveness variables
showed dominance of SLT over ALT for some instance. SLT has the theoretical
plausibility of repeatability and it is also easier to perform than ALT. All these
factors should be considered when opting between ALT and SLT strategies for
treatment of open angle glaucoma in patients having previous full SLT treatment.
5.5 Implication of Study Results and Future Direction
Our study provides information regarding the cost-effectiveness of SLT versus
ALT in uncontrolled OAG patients previously treated with full SLT. As none of
the alternatives were a dominant strategy at 6-month post-laser follow-up, and the
cost and effectiveness of both strategies do not differ greatly, either options could
be opted by the treating ophthalmologist considering the CEA. ALT is slightly
more effective and also slightly costly. SLT has theoretical advantage of
repeatability and its application is easy than that of ALT. A long term follow-up
study with additional authentic information on indirect treatment costs from the
patients in the future may provide more convincing cost-effective analysis
information. It will help both the health policy makers and health care providers to
choose between SLT and ALT treatment strategies with more confidence for the
betterment of open angle glaucoma patients.

95
References:
Access Economics Pty Limited. The Cost of Vision Loss in Canada: Summary
Report. Retrieved on March 10 2015 from: http://
www.cnib.ca/eng/CNIB%20Document%20Library/Research/Summaryreport_Cov
l.pdf.
Adis International (2004) Corticosteroids are the main culprits in drug induced
glaucoma. Drugs & Therapy Perspectives. 2004;20:19–22.
Agarwal P, Daher AM, Agarwal R. Aqueous humor TGF-β2 levels in patients
with open-angle glaucoma: A meta-analysis. Molecular Vision 2015; 21:612-620.
AGIS Investigators. The Advanced Glaucoma Intervention Study (AGIS): 7. The
relationship between control of intraocular pressure and visual field deterioration.
Am J Ophthalmol. 2000;130(4):429-440.
AGIS Investigators. The Advanced Glaucoma Intervention Study (AGIS): 12.
Baseline risk factors for sustained loss of visual field and visual acuity in patients
with advanced glaucoma. Am J Ophthalmol. 2002;134(4):499-512.
Akhtar O. A comparison of clinical trial and model-based cost estimates in
glaucoma - the case of repeat laser trabeculoplasty in Ontario. University of
Western Ontario - Electronic Thesis and Dissertation Repository. 2014; Paper
2577.
Allingham RR, Damji KF, Freedman S, Moroi SE, Rhee DJ. Shields Textbook of
Glaucoma (6th ed.). Philadelphia, PA: Lippincott Williams & Wilkins. 2011.
Alward WLM. Medical Management of Glaucoma. NEJM.1998;339(18):1298-
1307.
Anderson DR. Glaucoma: the damage caused by pressure. XLVI Edward Jackson
Memorial Lecture. Am J Ophthalmol. 1989;108:485-495.
Anderson RR, Parrish JA. Selective photothermolysis: precise microsurgery by
selective absorption of pulsed radiation. Science. 1983; 29;220(4596):524-527.

96
Asrani S, Zeimer R, Wilensky J, Gieser D, Vitale S, Lindenmuth K. Large diurnal
fluctuations in intraocular pressure are an independent risk factor in patients with
glaucoma. J Glaucoma. 2000;9(2):134-142.
Aström S, Stenlund H, Lindén C. Incidence and prevalence of pseudoexfoliations
and open-angle glaucoma in northern Sweden: II. Results after 21 years of follow-
up. Acta Ophthalmol Scand. 2007;85(8):832-837.
Auw-Haedrich C , Meyer P, Ginderdeuren RV. Glaucoma. In: Heegaard S,
Grossniklaus H (eds.), Eye Pathology: An Illustrated Guide. Verlag Berlin
Heidelberg: Springer; 2015:197-232.
Avery N, Ang GS, Nicholas S, Wells A. Repeatability of primary selective laser
trabeculoplasty in patients with primary open-angle glaucoma. Int Ophthalmol.
2013;33: 501–506.
Ayala M, Chen E. Long-term outcomes of selective laser trabeculoplasty (SLT)
treatment. Open Ophthalmol J. 2011; 5: 32–34.
Ayyala RS, Cruz DA, Margo CE, Harman LE, Pautler SE, Misch DM, Mines JA,
Richards DW. Cystoid macular edema associated with latanoprost in aphakic and
pseudophakic eyes. Am J Ophthalmol. 1998;126(4):602-604.
Babizhayev MA1, Brodskaya MW, Mamedov NG, Batmanov YYe. Clinical,
structural and molecular phototherapy effects of laser irradiation on the trabecular
meshwork of human glaucomatous eyes. Graefes Arch Clin Exp Ophthalmol.
1990;228(1):90-100.
Bagnis A, Papadia M, Scotto R, Traverso CE. Current and emerging medical
therapies in treatment of glaucoma. Expert Opin Emerg Drugs. 2011;16(2):293–
307.
Bahrami H. Causal Models in Primary Open Angle Glaucoma. Ophthalmic
Epidemiology. 2006;13: 291-298.
Barnett PG. An improved set of standards for finding cost for cost-effectiveness
analysis. Med Care. 2009 Jul;47(7 Suppl 1):S82-8.
Barnshaw HD. Great names in the early history of glaucoma. Int Ophthalmol Clin.
1979;19(1):3-7.

97
Barton K, Hitchings RA. Diagnosing Glaucoma. In: Budenz D (ed) Management
of Glaucoma. London, UK.Springer Healthcare;2013b:1-32.
Barton K, Hitchings RA. Introduction. In: Budenz D (ed) Management of
Glaucoma. London, UK.Springer Healthcare;2013a:49-69.
Barton K, Hitchings RA. Management of Glaucoma. In: Budenz D (ed)
Management of Glaucoma. London, UK.Springer Healthcare;2013c:71-100.
Berdahl JP, Allingham RR, Johnson DH. Cerebrospinal Fluid Pressure Is
Decreased in Primary Open-angle Glaucoma. Ophthalmology. 2008;115(5):763–
768.
Bergea B, Bodin L, Svedbergh B. Impact of intraocular pressure regulation on
visual fields in open-angle glaucoma. Ophthalmology. 1999;106(5):997-1004.
Birt CM. Selective laser trabeculoplasty retreatment after prior argon laser
trabeculoplasty: 1-year results. Can J Ophthalmol. 2007;42(5):715-719.
Blackwelder WC, and Chang MA. Sample Size Graphs for “proving the null
hypothesis”. Controlled Clinical Trials 1984;5:97-105.
Boivin JF, McGregor M, Archer C. Cost effectiveness of screening for primary
open angle glaucoma. J Med Screen. 1996;3(3):154-163.
Briggs A, Sculpher S. An introduction to Markov modelling for economic
evaluation. Pharmacoeconmics. 1998;13(4): 397-409.
Broadway CD. Visual field testing for glaucoma - a practical guide. Community
Eye Health. 2012; 25(79 & 80):66-70.
Budenz DL, Anderson DR, Feuer WJ, Beiser JA, Schiffman J, Parrish RK, Piltz-
Seymour JR, GordonMO,KassMAOcular Hypertension Treatment Study Group.
Detection and prognostic significance of optic disc hemorrhages during the Ocular
Hypertension Treatment Study. Ophthalmology. 2006; 113:2137–2143.
Burr JM, MowattG, Hernández R, SiddiquiMA,CookJ, Lourenco T,Ramsay C,
Vale L, Fraser C, Azuara-Blanco A, Deeks J, Cairns J, Wormald R, McPherson S,
Rabindranath K, Grant A. The clinical effectiveness and cost-effectiveness of
screening for open angle glaucoma: a systematic review and economic evaluation.
Health Technology Assessment. 2007; 11:1–190.

98
Butler P, Mannschreck M, Lin S, Hwang I, Alvarado J. Clinical experience with
the long-term use of 1% apraclonidine. Incidence of allergic reactions. Arch
Ophthalmol. 1995;113(3):293-296.
Cairns JE. Trabeculectomy. Preliminary report of a new method. Am J
Ophthalmol. 1968;66(4):673-679.
Callanan D, Fellman RL, Savage JA. Latanoprost-associated cystoid macular
edema. Am J Ophthalmol. 1998;126(1):134-135.
Camras CB, Bito LZ. Reduction of intraocular pressure in normal and
glaucomatous primate (Aotus trivirgatus) eyes by topically applied prostaglandin
F2 alpha. Curr Eye Res. 1981;1(4):205-209.
Canadian Institute for Health Information. National Health Expenditure Trends,
1975 to 2013. Ottawa, ON: CIHI; 2013.
Cantor LB, Katz LJ, Cheng JW, Chen E, Tong KB, Peabody JW. Economic
evaluation of medication, laser trabeculoplasty and filtering surgeries in treating
patients with glaucoma in the US. Curr Med Res Opin. 2008;24(10):2905-2918.
Caprioli J, Spaeth GL. Static threshold examination of the peripheral nasal visual
field in glaucoma. Arch Ophthalmol. 1985;103(8):1150-1154.
Chauhan BC, Mikelberg FS, Balaszi AG, LeBlanc RP, Lesk MR, Trope GE;
Canadian Glaucoma Study Group. Canadian Glaucoma Study: 2. risk factors for
the progression of open-angle glaucoma. Arch Ophthalmol. 2008;126(8):1030-
1036.
Cherecheanu AP, Garhofer G, Schmidl D, Werkmeister R, Schmetterer L. Ocular
perfusion pressure and ocular blood flow in glaucoma. Curr. Opin. Pharmacol.
2013;13:36–42.
Chihara E, Liu X, Dong J, Takashima Y, Akimoto M, Hangai M, Kuriyama S,
Tanihara H, Hosoda M, Tsukahara S. Severe myopia as a risk factor for
progressive visual field loss in primary open-angle glaucoma. Ophthalmologica.
1997;211(2):66-71.
Chiselita D. Non-penetrating deep sclerectomy versus trabeculectomy in primary
open-angle glaucoma surgery. Eye. 2001;15(Pt 2):197-201.

99
Chow LC, Liu J-P. Designing and analysis of clinical trials: Concepts and
methodologies (2nd ed.). 2004. New Jersey. John Wiley & Sons, Inc.
Clyne G, Edwards R. Understanding economic evaluations: A guide for health and
human services. Can J Program Eval. 2002; 17(3): 1-23.
Coakes RL, Mackie IA, Seal DV. Effects of long-term treatment with timolol on
lacrimal gland function. Br J Ophthalmol. 1981;65(9):603-605.
Coleman AL, Miglior S. Risk factors for glaucoma onset and progression. Surv
Ophthalmol. 2008;53(1 suppl):S3–S10. [PubMed: 19038621]
Collignon-Brach J. Long-term effect of ophthalmic beta-adrenoceptor antagonists
on intraocular pressure and retinal sensitivity in primary open-angle glaucoma.
Curr Eye Res. 1992;11(1):1-3.
Coyle D, Drummond M. The economic burden of glaucoma in the UK. The need
for a far-sighted policy. Pharmacoeconomics. 1995;7(6):484-489.
Crawford K, Kaufman PL. Pilocarpine antagonizes prostaglandin F2 alpha-
induced ocular hypotension in monkeys. Evidence for enhancement of Uveoscleral
outflow by prostaglandin F2 alpha. Arch Ophthalmol. 1987;105(8):1112-1116.
Cummins MA, Malouf N. Visual Field Testing Technique. Medscape. 2014.
Retrieved on July 27, 2015 from http://emedicine.medscape.com/article/2094663-
technique#c4.
Cvenkel B, Hvala A, Drnovsek-Olup B, Gale N. Acute ultrastructural changes of
the trabecular meshwork after selective laser trabeculoplasty and low power argon
laser trabeculoplasty. Lasers Surg Med.2003;33(3): 204-208.
Cyrlin MN. Primary and Secondary Angle-Closure Glaucomas. In: Schacknow
PN, Samples JR (eds.), The Glaucoma Book: A Practical, Evidence-Based
Approach to Patient Care. New York: Springer Science+Business Media, LLC,
2010.
Damji KF, Bovell AM, Hodge WG, Rock W, Shah K, Buhrmann R, Pan YI.
Selective laser trabeculoplasty versus argon laser trabeculoplasty: results from a 1-
year randomized clinical trial. Br J Ophthalmol. 2006;90:1490–1494. doi:
10.1136/bjo.2006.098855.

100
Damji KF, Shah KC, Rock WJ, Bains HS, Hodge WG. Selective laser
trabeculoplasty v argon laser trabeculoplasty: a prospective randomised clinical
trial. Br J Ophthalmol 1999;83:718–722.
Damji KF, Shah KC, Rock WJ, Bains HS, Hodge WG. Selective laser
trabeculoplasty v argon laser trabeculoplasty: a prospective randomised clinical
trial. Br J Ophthalmol. 1999;83(6):718-722.
De Roetth A Jr. Cryosurgery for the treatment of glaucoma. Am J Ophthalmol.
1966;61(3):443-450.
Downes SM, Misson GP, Jones HS, O'Neill. The predictive value of post-
operative intraocular pressure following trabeculectomy. Eye. 1994; 8:394–397.
Drummond MF, Sculpher MJ, Claxon K, Stoddart GL, Torrance GW. Methods for
the Economic Evaluation of Health Care Programmes. Fourth Edition. Oxford,
New York: Oxford University Press, 2005.
Dunphy EB, Albaugh CH. Cyclodiathermy: An Operation for the Treatment of
Glaucoma. Trans Am Ophthalmol Soc. 1941;39:193-213.
Einstein A. Quantentheorie der Strahlung (The Quantum Theory of Radiation).
Physikalische Zeitschrift. 1917;18:121-128.
Ernst R. Indirect costs and cost-effectiveness analysis. Value Health. 2006; 9(4):
253-261.
European Glaucoma Society. Terminology and Guidelines for Glaucoma. 3rd
edition. Savona, Italy: Dogma; 2008.
Fea AM. Phacoemulsification versus phacoemulsification with micro-bypass stent
implantation in primary open-angle glaucoma: randomized double-masked clinical
trial. J Cataract Refract Surg. 2010;36(3):407-412.
Fechtner RD, Khouri AS, Zimmerman TJ, Bullock J, Feldman R, Kulkarni P,
Michael AJ, Realini T, Warwar R. Anterior uveitis associated with latanoprost.
Am J Ophthalmol. 1998;126(1):37-41.
Feldman RM, Katz LJ, Spaeth GL, Crapotta JA, Fahmy IA, Ali MA. Long-term
efficacy of repeat argon laser trabeculoplasty. Ophthalmology. 1991;98(7):1061-
1065.

101
Fink AI, Jordan AJ, Lao PN, Fong DA. Therapeutic limitations of argon laser
trabeculoplasty. Br J Ophthalmol.1988;72(4):263-269.
Finkler SA, Ward DM, Baker JJ. Essentials of cost accounting for health care
organizations, Third edition. Sudbury, MA: Jones and Bartlett Learning, 2007.
Flammer J, Orgul S, Costa VP, Orzalesi N, Krieglstein GK, Serra LM, Renard JP,
Stefánsson E. The impact of ocular blood flow in glaucoma. Prog. Retin. Eye Res.
2002; 21:359–393.
Foster PJ, Buhrmann R, Quigley HA, Johnson GJ. The definition and
classification of glaucoma in prevalence surveys. Br J Ophthalmol. 2002;
86(2):238-242.
Fraser TR. On the Physiological Action of the Calabar Bean. J Anat Physiol.
1867;1(2):323-332.
Fraunfelder FT. Interim report: National Registry of possible Drug-induced Ocular
Side Effects. Ophthalmology. 1980;87(2):87-90.
Frezzotti R. The glaucoma mystery from ancient times to the 21st century: the
glaucoma mystery: ancient concepts. Acta Ophthalmol Scand Suppl.
2000;(232):14-18.
Friedman DS, Vedula SS (2006) Lens extraction for chronic angle-closure
glaucoma. Cochrane Database of Systematic Reviews 3, CD005555.
Friedman DS, Wilson MR, Liebmann JM, Fechtner RD, Weinreb RN. An
evidence-based assessment of risk factors for the progression of ocular
hypertension and glaucoma. Am J Ophthalmol. 2004;138(3 suppl):S19–S31.
[PubMed: 15364049].
Friedman LM, Furberg CD, DeMets DL. Fundamentals of Clinical Trials, (3rd
Ed.). 1996. St. Louis, Missouri: Mosby-Year Book Inc.
Frucht J, Bishara S, Ticho U. Early intraocular pressure response following laser
trabeculoplasty. Br J Ophthalmol. 1985;69(10):771-773.
Gazzard G, Friedman DS, Devereux JG, Chew PT, Seah SK. A prospective
ultrasound biomicroscopy evaluation of changes in anterior segment morphology
after laser iridotomy in Asian eyes. Ophthalmology. 2003;110:630–638.

102
Gemenetzi M, Yang Y, Lotery AJ. Current concepts on primary open-angle
glaucoma genetics: a contribution to disease pathophysiology and future treatment.
Eye. 2011;26: 355-369.
Giangiacomo A, Coleman AL. The Epidemiology of Glaucoma. In: Grehn F,
Stamper R, editors. Glaucoma [Internet]. Springer Berlin Heidelberg; 2009 [cited
2016 May 15]. p. 13–21. Available from:
http://link.springer.com/chapter/10.1007/978-3-540-69475-5_2
Goel M, Picciani RG, Lee RK, Bhattacharya SK. Aqueous Humor Dynamics: A
Review. Open Ophthalmol J. 2010;4: 52–59.
Gold MR, Siegel JE, Russell LB, Weinstein MC. Cost-Effectiveness in Health and
Medicine. Oxford, England: Oxford University Press; 1996.
Gottanka J, Kuhlmann A, Scholz M, Johnson DH, Lütjen-Drecoll E.
Pathophysiologic Changes in the Optic Nerves of Eyes with Primary Open Angle
and Pseudoexfoliation Glaucoma. IOVS. 2005;46(11):4170-4181.
Gottlieb LK, Schwartz B, Pauker SG. Glaucoma screening. A cost-effectiveness
analysis. Surv Ophthalmol. 1983;28(3):206-226.
Grieshaber MC, Pienaar A, Olivier J, Stegmann R. Clinical Evaluation of the
Aqueous Outflow System in Primary Open-Angle Glaucoma for Canaloplasty.
IOVS. 2010; 51(3):1498-1504.
Harasymowycz PJ, Papamatheakis DG, Latina M, De Leon M, Lesk MR, Damji
KF. Selective laser trabeculoplasty (SLT) complicated by intraocular pressure
elevation in eyes with heavily pigmented trabecular meshworks. Am J
Ophthalmol. 2005;139(6):1110-1113.
Harris A, Chung HS, Ciulla TA, Kagemann L. Progress in measurement of ocular
blood flow and relevance to our understanding of glaucoma and age-related
macular degeneration. Prog Retin Eye Res. 1999;18(5):669-687.
Health Council of Canada. (2009). Value for Money: Making Canadian Health
Care Stronger. Toronto: Health Council. www.healthcouncilcanada.ca.
Hirschberg J. The history of ophthalmology, vol. 11. Bonn: Wayenborg
Publications; 1994.
103
Hodge W, Buhrmann R, Gold D. For a Canadian Vision Health Strategy. 2004.
www.cnib.ca
Hodge WG, Damjii KF, Rock W, Buhrmann R, Bovell AM et al. Baseline IOP
predicts selective laser trabeculoplasty success at 1 year post-treatment: results
from a randomised clinical Trial. Br J Ophthalmol. 2005;89:1157–1160.
Hollows FC, Graham PA. Intraocular pressure, glaucoma, and glaucoma suspects
in a defined population. The British Journal of Ophthalmology. 1966;50:570–586.
Hong BK, Winer JC, Martone JF, Wand M, Altman B, Shields B. Repeat
Selective Laser Trabeculoplasty. J Glaucoma. 2009;18(3):180–183.
Hoskins HD Jr, Hetherington J Jr, Minckler DS, Lieberman MF, Shaffer RN.
Complications of laser trabeculoplasty. Ophthalmology. 1983;90(7):796-809.
Hurley JE. Health Economics (1st ed.). Canada: McGraw-Hill Ryerson. 2010.
Johnson M. What controls aqueous humour outflow resistance? Exp Eye Res.
2006; 82(4): 545–557.
Johnson PB, Katz LJ, Rhee DJ. Selective laser trabeculoplasty: predictive value of
early intraocular pressure measurements for success at 3-months. Br J Ophthalmol.
2006; 90(6): 741–743.
Kagan DB, Gorfinkel NS, Hutnik CM. Mechanisms of selective laser
trabeculoplasty: a review. Clin Experiment Ophthalmol. 2014;42(7):675-681.
Kara N, Altan C, Yuksel K, Tetikoglu M. Comparison of the efficacy and safety of
selective laser trabeculoplasty in cases with primary open-angle glaucoma and
pseudoexfoliative glaucoma. Kaohsiung J Med Sci. 2013;29(9):500-504.
Katz LJ, Steinmann WC, Kabir A, Molineaux J, Wizov SS, Marcellino G;
SLT/Med Study Group. Selective laser trabeculoplasty versus medical therapy as
initial treatment of glaucoma: a prospective, randomized trial. J Glaucoma 2012;
21(7): 460-468.
Katz LJ. Twelve-month evaluation of brimonidine-purite versus brimonidine in
patients with glaucoma or ocular hypertension. J Glaucoma. 2002;11(2):119-126.

104
Kaufman PL, Bárány EH. Loss of acute pilocarpine effect on outflow facility
following surgical disinsertion and retrodisplacement of the ciliary muscle from
the scleral spur in the cynomolgus monkey. Invest Ophthalmol. 1976;15(10):793-
807.
Keeler CR. The Ophthalmoscope in the Lifetime of Hermann von Helmholtz.
Arch Ophthalmol. 2002;120(2):194-201.
Kholdebarin R, Campbell RJ, Jin YP, Buys YM. Multicenter study of compliance
and drop administration in glaucoma. Can J Ophthalmol. 2008;43(4):454-461.
Khouri AS, Lin J, Berezina TL, Maltzman B, Fechtner RD. Repeat Selective Laser
Trabeculoplasty can be Effective in Eyes with Initial Modest Response. Middle
East Afr J Ophthalmol. 2014; 21(3): 205–209.
Kim DY, Singh A. Severe iritis and choroidal effusion following selective laser
trabeculoplasty. Ophthalmic Surg Lasers Imaging. 2008;39(5):409-411.
Kimpel MW, Johnson DH. Factors influencing in vivo trabecular cell replication
as determined by 3H-thymidine labelling; an autoradiographic study in cats. Curr
Eye Res. 1992;11(4):297-306.
Kniestedt C, Punjabi O, Lin S, Stamper RL. Tonometry through the ages. Surv
Ophthalmol. 2008;53(6):568-591.
Kobelt G. Health economics, economic evaluation, and glaucoma. J Glaucoma.
2002;11(6):531-539.
Konowal A, Morrison JC, Brown SV, Cooke DL, Maguire LJ, Verdier DV,
Fraunfelder FT, Dennis RF, Epstein RJ. Irreversible corneal decompensation in
patients treated with topical dorzolamide.Am J Ophthalmol. 1999;127(4):403-406.
Kramer TR, Noecker RJ. Comparison of the morphologic changes after selective
laser trabeculoplasty and argon laser trabeculoplasty in human eye bank eyes.
Ophthalmology. 2001;108(4):773-779.
Krasnov MM. Laser puncture of anterior chamber angle in glaucoma. Am J
Ophthalmol. 1973;75:674-678.

105
Lachaine J, Hodge WG, Steffensen I, Murray C, Barnes D, Foerster V, Ducruet T,
Mensinkai S. Prostaglandin analogues for ophthalmic use: a cost-effectiveness
analysisCan J Ophthalmol. 2008;43(1):33-41.
Lai J, Bournias TE. Repeatability of Selective Laser Trabeculoplasty (SLT). Invest
Ophthalmol Vis Sci. 2005; 46: e-abstract 119.
Latina MA, de Leon JM. Selective laser trabeculoplasty. Ophthalmol Clin North
Am. 2005;18(3):409-419.
Latina MA, Park C. Selective targeting of trabecular meshwork cells: in vitro
studies of pulsed and CW laser interactions. Exp Eye Res. 1995;60: 359–371.
Latina MA, Sibayan SA, Shin DH, Noecker RJ, Marcellino G. Q-switched 532-nm
Nd: YAG laser trabeculoplasty (selective laser trabeculoplasty) A multicenter,
pilot, clinical study. Ophthalmology. 1998;105(11):2082-2088.
Lee DA, Topper JE, Brubaker RF. Effect of clonidine on aqueous humor flow in
normal human eyes. Exp Eye Res. 1984;38(3):239-246.
Lee R, Hutnik CM. Projected cost comparison of selective laser trabeculoplasty
versus glaucoma medication in the Ontario Health Insurance Plan. Can J
Ophthalmol. 2006;41(4):449-456.
Leffler CT, Schwartz SG, Gliberti FM, Young MT, Bermudez, D. What was
Glaucoma Called Before the 20th Century? Ophthalmology and Eye Diseases
2015:(7) 21–33.
Leffler CT, Schwartz SG, Hadi TM, Salman A, Vasuki V. The early history of
glaucoma: the glaucous eye (800 BC to 1050 AD). Clin Ophthalmol. 2015;9:207–
215.
Leibowitz HM, Krueger DE, Maunder LR, Milton RC, Kini MM, Kahn HA,
Nickerson RJ, Pool J, Colton TL, Ganley JP, Loewenstein JI, Dawber TR. The
Framingham Eye Study monograph: an ophthalmological and epidemiological
study of cataracts, glaucoma, diabetic retinopathy, macular degeneration, and
visual acuity in a general population of 2631 adults, 1973–1975. Survey of
Ophthalmology. 1980; 24:335–610.
Leske MC, Heijl A, Hussein M, Bengtsson B, Hyman L, Komaroff E; Early
Manifest Glaucoma Trial Group. Factors for glaucoma progression and the effect

106
of treatment: the early manifest glaucoma trial. Arch Ophthalmol. 2003;121(1):48-
56.
Leske MC, Heijl A, Hyman L, Bengtsson B, Komaroff E. Factors for progression
and glaucoma treatment: the Early Manifest Glaucoma Trial. Curr Opin
Ophthalmol 2004;15:102-106.
Leske MC, Heijl A, Hyman L, Bengtsson B. Early Manifest Glaucoma Trial:
design and baseline data. Ophthalmology. 1999;106(11):2144-2153.
Lester M, Telani S, Vagge A, Bagnis A. Diagnosis of Glaucoma. In: Glaucoma:
Basic and Clinical Perspectives. Unitec House, 2 Albert Place, London N3 1QB,
UK (Future Medicine Ltd).2013: 58-79.
Liyanage SE, Kumaran N, De Alwis D. Macular burns resulting from the
accidental use of selective laser trabeculoplasty mode during a laser capsulotomy.
Br J Ophthalmol. 2014;98(1):141-142.
Mainster MA, Sliney DH, Belcher CD 3rd, Buzney SM. Laser photodisruptors.
Damage mechanisms, instrument design and safety. Ophthalmology.
1983;90(8):973-991.
Mao AJ, Pan XJ, McIlraith I, Strasfeld M, Colev G, Hutnik C. Development of a
prediction rule to estimate the probability of acceptable intraocular pressure
reduction after selective laser trabeculoplasty in open-angle glaucoma and ocular
hypertension. J Glaucoma. 2008;17(6):449-454.
Mark HH. Buphthalmos: early glaucoma history. Acta Opthalmol (Copenh).
2010;(6):591-594.
Marquis RE, Whitson JT. Management of glaucoma: focus on pharmacological
therapy. Drugs Aging. 2005;22(1):1-21.
Martow E, Hutnik CM, Mao A. SLT and adjunctive medical therapy: a prediction
rule analysis. J Glaucoma. 2011 Apr-May;20(4):266-70.
Martow E, Hutnik CM, Mao A. SLT and adjunctive medical therapy: a prediction
rule analysis.J Glaucoma. 2011;20(4):266-270.

107
Mcilraith I, Strasfeld M, Colev G, Hutnik CM. Selective laser trabeculoplasty as
initial and adjunctive treatment for open-angle glaucoma. J Glaucoma. 2006
Apr;15(2):124-30.
McMahon CD, Shaffer RN, Hoskins HD Jr, Hetherington J Jr. Adverse effects
experienced by patients taking timolol. Am J Ophthalmol. 1979;88(4):736-738.
Meira-Freitas D, Lisboa R, Medeiros FA. Advances in the Structural Evaluation
of Glaucoma with Optical Coherence Tomography. Curr Ophthalmol Rep.
2013;1:98–105.
Melamed S, Ben Simon GJ, Levkovitch-Verbin H. Selective laser trabeculoplasty
as primary treatment for open-angle glaucoma: a prospective, nonrandomized pilot
study. Arch Ophthalmol. 2003;121(7):957-960.
Messmer C, Flammer J, Stümpfig D. Influence of betaxolol and timolol on the
visual fields of patients with glaucoma. Am J Ophthalmol. 1991;112(6):678-681.
Mishima HK, Kiuchi Y, Takamatsu M, Rácz P, Bito LZ. Circadian intraocular
pressure management with latanoprost: diurnal and nocturnal intraocular pressure
reduction and increased uveoscleral outflow. Surv Ophthalmol. 1997;41 Suppl
2:S139-144.
Mishima S. Clinical pharmacokinetics of the eye. Proctor lecture. Invest
Ophthalmol Vis Sci. 1981;21(4):504-541.
Mitchell P, Smith W, Attebo K, Healey P. Prevalence of open-angle glaucoma in
Australia: the Blue Mountains eye study. Ophthalmology. 1996:103:1661–1669.
Mitchell P, Smith W, Attebo K, Healey PR. Prevalence of open-angle glaucoma in
Australia. The Blue Mountains Eye Study. Ophthalmology. 1996; 103:1661-1669.
Mitchell P, Wang JJ, Hourihan F. The relationship between glaucoma and
pseudoexfoliation: the Blue Mountains Eye Study. Arch Ophthalmol.
1999;117(10):1319-24.
Musch DC, Shimizu T, Niziol LM, Gillespie BW, Cashwell LF, Lichter PR.
Clinical Characteristics of Newly Diagnosed Primary, Pigmentary, and
Pseudoexfoliative Open-Angle Glaucoma in the Collaborative Initial Glaucoma
Treatment Study. Br J Ophthalmol. 2012;96(9):1180-1184.

108
Nagar M, Ogunyomade A, O'Brart DP, Howes F, Marshall J. A randomised,
prospective study comparing selective laser trabeculoplasty with latanoprost for
the control of intraocular pressure in ocular hypertension and open angle
glaucoma. Br J Ophthalmol. 2005;89(11):1413-1417.
Nathan J. Hippocrates to Duke-Elder: an overview of the history of glaucoma.
Clin Exp Optom. 2000;83(3):116-118.
Netland PA, Landry T, Sullivan EK, Andrew R, Silver L, Weiner A, Mallick S,
Dickerson J, Bergamini MV, Robertson SM, Davis AA; Travoprost Study Group.
Travoprost compared with latanoprost and timolol in patients with open-angle
glaucoma or ocular hypertension. Am J Ophthalmol. 2001;132(4):472-484.
Netland PA, Wiggs JL, Dreyer EB. Inheritance of glaucoma and genetic
counseling of glaucoma patients. Int Ophthalmol Clin.1993;33:101–120.
Neumann PJ. Costing and perspective in published cost-effectiveness Analysis.
Med Care. 2009; 47(7) S28-S32.
Nichamin LD. Glaukos iStent Trabecular Micro-Bypass. Middle East Afr J
Ophthalmol. 2009;16(3):138-40.
Nolan WP, Foster PJ, Devereux JG, Uranchimeg D, Johnson GJ, Baasanhu J.
YAG laser iridotomy treatment for primary angleclosure in east Asian eyes. Br J
Ophthalmol. 2000;84:1255–1259.
Nyska A, Glovinsky Y, Belkin M, Epstein Y. Biocompatibility of the Ex-PRESS
miniature glaucoma drainage implant. J Glaucoma. 2003;12(3):275-280.
Palmer S, Raftery J. Opportunity cost. BMJ.1999; 318:1551–1552.
Palmer S, Byford S, Raftery J. Types of economic evaluation. BMJ. 1999; 318:
1349.
Palmer SS.. Mitomycin as adjunct chemotherapy with trabeculectomy.
Ophthalmology. 1991;98(3):317-321.
Pan Y, Varma R. Natural history of glaucoma. Indian J Ophthalmol. 2011;59
Suppl 1:S19-23.

109
Petitti, DB. Meta-Analysis, Decision Analysis, and Cost-Effectiveness Analysis
Methods for Quantitative Synthesis in Medicine (2nd ed.). 2000. New York:
Oxford University Press.
Peyman GA, Naguib KS, Gaasterland D.Trans-scleral application of a
semiconductor diode laser. Lasers Surg Med. 1990;10(6):569-575.
Peyman GA, Raichand M, Zeimer RC. Ocular effects of various laser
wavelengths. Surv Ophthalmol. 1984;28(5):391-404.
Phelps CD. Effect of myopia on prognosis in treated primary open-angle
glaucoma. Am J Ophthalmol.1982;93(5):622-628.
Quigley HA, Broman AT. The number of people with glaucoma worldwide in
2010 and 2020. Br J Ophthalmol. 2006;90: 262-267.
Quigley HA, Varma R, Tielsch JM, Katz J, Sommer A, Gilbert DL. The
relationship between optic disc area and open-angle glaucoma: the Baltimore Eye
Survey. J Glaucoma. 1999;8(6):347-352.
Quigley HA, West SK, Rodriguez J, Munoz B, Klein R, Snyder R. The prevalence
of glaucoma in a population-based study of Hispanic subjects: Proyecto VER.
Arch Ophthalmol. 2001;119(12):1819-1826.
Quigley HA. Neuronal death in glaucoma. Prog Retin Eye Res. 1999;18(1):39-57.
Ramsey SD, Willke RJ, Glick H, Reed SD, Augustovski F, Jonsson B, Briggs A,
Sullivan SD. Cost-effectiveness analysis alongside clinical trials II-An ISPOR
Good Research Practices Task Force report. Value Health. 2015;18(2):161-172.
Razeghinejad MR, Spaeth GL. A history of the surgical management of glaucoma.
Optom Vis Sci. 2011;88(1):E39-47.
Realini T, Fechtner RD. 56,000 ways to treat glaucoma. Ophthalmology.
2002;109(11):1955-1956.
Realini, T. A History of Glaucoma Pharmacology. Optom. Vis. Sci. 2011;88(1):
36-38.

110
Reidy A, Minassian DC, Vafidis G, Joseph J, Farrow S, Wu J, Desai P. Connolly
A. Prevalence of serious eye disease and visual impairment in a north London
population: population based, cross sectional study. BMJ.1998;
30;316(7145):1643-1646.
Ritch R, Schlötzer-Schrehardt U. Exfoliation syndrome. Surv Ophthalmol.
2001;45:265–315.
Ritch R. Exfoliation syndrome-the most common identifiable cause of open-angle
glaucoma. J Glaucoma. 1994;3(2):176-177.
Robinson R. Costbenefit analysis. BMJ.1993;307:859862.
Rolim de Moura C, Paranhos A Jr, Wormald R. Laser trabeculoplasty for open-
angle glaucoma. Cochrane Database Syst Rev. 2007; (4):CD003919.
Rotchford AP, Murphy KM. Compliance with Timolol treatment in Glaucoma.
Eye. 1998;12:234-236.
Rouland J-F, Berdeaux G, Lafuma A. The economic burden of glaucoma and
ocular hypertension: implications for patient management: a review. Drugs Aging.
2005; 22(4): 315-321
Ruderman JM, Welch DB, Smith MF, Shoch DE.A randomized study of 5-
fluorouracil and filtration surgery. Am J Ophthalmol. 1987;104(3):218-224.
Rudnicka AR, Mt-Isa S, Owen CG, Cook DG, Ashby D. Variations in primary
open-angle glaucoma prevalence by age, gender, and race: a Bayesian meta-
analysis. Invest Ophthalmol Vis Sci 2006;47: 4254-4261.
Rylander NR, Vold SD. Cost analysis of glaucoma medications. Am J
Ophthalmol. 2008 Jan;145(1):106-13.
Samples JR, Singh K, Lin SC, Francis BA, Hodapp E, Jampel HD, Smith SD.
Laser trabeculoplasty for open-angle glaucoma: a report by the American academy
of ophthalmology. Ophthalmol 2011; 118(11): 2296-2302
Schmidl D, Schmetterer L, Garhőfer G, Popa-Cherecheanu A. Pharmacotherapy of
Glaucoma. J Ocul Pharmacol Ther.2015; 31(2): 63-77.

111
Schmier JK, Halpern MT, Jones ML. The economic implications of glaucoma: a
literature review. Pharmacoeconomics. 2007;25(4):287-308.
Schoene RB, Abuan T, Ward RL, Beasley CH. Effects of topical betaxolol,
timolol, and placebo on pulmonary function in asthmatic bronchitis. Am J
Ophthalmol. 1984;97(1):86-92.
Schuman JS, Horwitz B, Choplin NT, David R, Albracht D, Chen K. A 1-year
study of brimonidine twice daily in glaucoma and ocular hypertension. A
controlled, randomized, multicenter clinical trial. Chronic Brimonidine Study
Group. Arch Ophthalmol. 1997;115(7):847-852.
Schuman JS. Clinical experience with brimonidine 0.2% and timolol 0.5% in
glaucoma and ocular hypertension. Surv Ophthalmol. 1996;41 Suppl 1:S27-37.
Schwartz D, Lellouch J. Explanatory and pragmatic attitudes in therapeutical
trials. J Chronic Dis. 1967;20(8):637-648.
Sefton T. Getting less for more: Economic evaluation in the social welfare field.
CASE paper 44. London: Centre for the Analysis of Social Exclusion, London
School of Economics. 2000.
Seider MI, Keenan JD, Han Y. Cost of selective laser trabeculoplasty vs topical
medications for glaucoma. Arch Ophthalmol. 2012;130(4):529-530.
Sheill A, Donaldson C, Mitton C, Currie G. Health economic evaluation. J
Epidemiol Commun H. 2002; 56:85-88.
Sherwood M, Brandt J; Bimatoprost Study Groups 1 and 2. 6-month comparison
of bimatoprost once-daily and twice-daily with timolol twice-daily in patients with
elevated intraocular pressure. Surv Ophthalmol. 2001;45 Suppl 4:S361-368.
Shi JM, Jia SB. Selective laser trabeculoplasty. Int J Ophthalmol. 2012; 5(6): 742–
749.
Shihadeh WA, Ritch R, Liebmann JM. Hyphema occurring during selective laser
trabeculoplasty. Ophthalmic Surg Lasers Imaging. 2006;37(5):432-433.
Sommer A, Tielsch JM, Katz J, Quigley HA, Gottsch JD, Javitt J, Singh K.
Relationship between intraocular pressure and primary openangle glaucoma

112
among white and black Americans: The Baltimore Eye Survey. Arch
Ophthalmol.1991;109(8):1090-1095.
Sonnenberg FA, Beck JR. Markov models in medical decision Making: A
practical guide.Med Decis Making 1993;13:322-338.
Sorsby A. Acute glaucoma: an historical note. Br J Ophthalmol. 1932;16(9):555-
559.
Stamer, WD, Acott, TS. Current understanding of conventional outflow
dysfunction in glaucoma. Curr. Opin. Ophthalmol. 2012;23:135–143.
Statistics Canada. Canadian Community Health Survey, Healthy Aging. 2010.
Retrieved on August 18, 2015 from http://www5.statcan.gc.ca/cansim/pick-
choisir?lang=eng&p2=33&id=1051200.
Stein JD, Kim DD, Peck WW, Giannetti SM, Hutton DW. Cost-effectiveness of
medications compared with laser trabeculoplasty in patients with newly diagnosed
open-angle glaucoma. Arch Ophthalmol. 2012;130(4):497-505.
Tamm ER, Fuchshofer R. What increases outflow resistance in primary open-
angle glaucoma? Surv Ophthalmol. 2007;52 Suppl 2:S101-4.
Tamm ER. The trabecular meshwork outflow pathways: structural and functional
aspects. Exp. Eye Res. 2009;88:648–655.
Tan SS. Microcosting in economic evaluations: Issues of accuracy, feasibility,
consistency and generalizability. PhD Thesis. 2009. Rotterdam: Erasmus
Universiteit Rotterdam.
Taylor M. What is sensitivity analysis? Hayward medical communications.2009.
Retrieved on September 25, 2015 from:
http://www.medicine.ox.ac.uk/bandolier/painres/download/whatis/Cost-effect.pdf.
Tello C, Radcliffe N, Ritch R. Pigmentary Dispersion Syndrome and Glaucoma.
In: Schacknow PN, Samples JR (eds.), The Glaucoma Book: A Practical,
Evidence-Based Approach to Patient Care. New York, NY: Springer.2010.
Tham Y-C, Li X, Wong TY, Quigley HA, Aung T, Cheng CY. Global Prevalence
of Glaucoma and Projections of Glaucoma Burden through 2040: A Systematic
Review and Meta-Analysis.Ophthalmology. 2014; 121(11):2081–2090.

113
The Glaucoma Laser Trial Research Group. The Glaucoma Laser Trial (GLT). 2.
Results of argon laser trabeculoplasty versus topical medicines. Ophthalmology.
1990;97(11):1403-1413.
The Glaucoma Laser Trial Research Group. The Glaucoma Laser Trial (GLT) and
Glaucoma Laser Trial follow-up study: 7. Results. Am J Ophthalmol.
1995;120(6):718-731.
Thoft RA.Incidence of lens changes in patients treated with echothiophate iodide.
Arch Ophthalmol. 1968;80(3):317-320. Soltau JB, Zimmerman TJ. Changing
paradigms in the medical treatment of glaucoma. Surv Ophthalmol. 2002;47 Suppl
1:S2-5.
Thomas JV, Simmons RJ, Belcher CD 3rd. Argon laser trabeculoplasty in the
presurgical glaucoma patient. Ophthalmology. 1982;89(3):187-197.
Thorpe KE, Zwarenstein M, Oxman AD, Treweek S, Furberg CD, Altman DG,
Tunis S, Bergel E, Harvey I, Magid DJ, Chalkidou K. A pragmatic-explanatory
continuum indicator summary (PRECIS): a tool to help trial designers. CMAJ.
2009;180(10):E47-57.
Thylefors DS, Negrel AD, Pararajasegaram R, Dadzie KY. Global data on
blindness. Bull World Health Organ. 1995;73:115-21.
Tielsh JM, Sommer A, Katz J, Sommer A, Quigley HA, Javitt JC. Racial
variations in the prevalence of primary open-angle glaucoma. The Baltimore Eye
Survey. JAMA. 1991;266;369-374.
Townsend DJ, Brubaker RF. Immediate effect of epinephrine on aqueous
formation in the normal human eye as measured by fluorophotometry. Invest
Ophthalmol Vis Sci. 1980;19(3):256-266.
Tripathi RC, Tripathi BJ, Haggerty C. Drug-induced glaucomas mechanism and
management. Drug Safety. 2003;26:749–767.
Tuck MW, Crick RP. The cost-effectiveness of various modes of screening for
primary open angle glaucoma. Ophthalmic Epidemiol. 1997;4(1):3-17.
van Alphen GW. The adrenergic receptors of the intraocular muscles of the human
eye. Invest Ophthalmol. 1976;15(6):502-505.

114
van Buskirk EM, Pond V, Rosenquist RC, Acott TS. Argon laser trabeculoplasty.
Studies of mechanism of action.Ophthalmology.1984;91(9):1005-1010.
van Buskirk EM. Adverse reactions from timolol administration. Ophthalmology.
1980;87(5):447-450.
van Buskirk EM. Pathophysiology of laser trabeculoplasty. Surv Ophthalmol.
1989;33(4):264-72.
van Gestel A, Grutters J, Schouten J, Webers C, Beckers H, Joore M, Severens J.
The role of the expected value of individualized care in cost-effectiveness analyses
and decision making. Value Health. 2012;15(1):13-21.
Vijaya L, Manish P, Ronnie G, Shantha B. Management of complications in
glaucoma surgery. Indian J Ophthalmol. 2011;59(1): S131-S140.
Waisbourd M, Katz LJ. Selective laser trabeculoplasty as a first-line therapy: a
review. Can J Ophthalmol. 2014;49(6):519-522.
Waisbourd M, Katz LJ. Selective laser trabeculoplasty as a first-line therapy: a
review. Can J Ophthalmol. 2014;49(6):519-522.
Wang SK, Chang RT. An emerging treatment option for glaucoma: Rho kinase
inhibitors. Clinical Ophthalmology. 2014:8 883–890.
Watson P, Stjernschantz J. A 6-month, randomized, double-masked study
comparing latanoprost with timolol in open-angle glaucoma and ocular
hypertension. The Latanoprost Study Group. Ophthalmology. 1996;103(1):126-37.
Wax MB, Molinoff PB. Distribution and properties of beta-adrenergic receptors in
human iris-ciliary body. Invest Ophthalmol Vis Sci 1987;28: 420-430.
Weber PA, Burton GD, Epitropoulos AT. Laser trabeculoplasty retreatment.
Ophthalmic Surg. 1989;20(10):702-706.
Weinreb NR, Aung T, Medeiros FA. The Pathophysiology and Treatment of
Glaucoma A Review. JAMA. 2014;311(18):1901-1911.
Weinreb RN, Ruderman J, Juster R, Zweig K. Immediate intraocular pressure
response to argon laser trabeculoplasty. Am J Ophthalmol.1983;95(3):279-286.

115
Wensor MD, McCarty CA, Stanislavsky YL, Livingston PM, Taylor HR. The
prevalence of glaucoma in the Melbourne Visual Impairment Project.
Ophthalmology. 1998;105(4):733-9.
Wentz SM, Kim NJ, Wang J, Amireskandari A, Siesky B, Harris A. Novel
therapies for open-angle glaucoma. F1000 Prime Reports. 2014;6:102.
White AJ, Mukherjee A, Hanspal I, Sarkies NJ, Martin KR, Shah P. Acute
transient corneal endothelial changes following selective laser trabeculoplasty.
Clin Experiment Ophthalmol. 2013;41(5):435-441.
Wise JB, Witter SL. Argon laser therapy for open angle glaucoma. A pilot study.
Arch Ophthalmol. 1979;97:319-322.
Wolfs RC, Klaver CC, Ramrattan RS, van Duijn CM, Hofman A, de Jong PT.
Genetic risk of primary open-angle glaucoma. Population based familial
aggregation study. Arch Ophthalmol. 1998;116:1640–1645.
Xin S. Markov Modelling in Healthcare Economic Evaluations. Chin J Evid-based
Med. 2007; 7(10): 750-756.
Ziai N, Dolan JW, Kacere RD, Brubaker RF. The effects on aqueous dynamics of
PhXA41, a new prostaglandin F2 alpha analogue, after topical application in
normal and ocular hypertensive human eyes. Arch Ophthalmol.
1993;111(10):1351-1358.
Zimmerman TJ, Kooner KS, Ford VJ, Olander KW, Mandlekorn RM, Rawlings
FE, Leader BJ, Koskan AJ. Effectiveness of nonpenetrating trabeculectomy in
aphakic patients with glaucoma. Ophthalmic Surg. 1984;15(1):44-50.

116
Appendix
Appendix A: One-way Sensitivity Analysis Table
Appendix A1: ALT Effect Success Sensitivity: Societal Perspective
ALT
Effect
Success Strategy Cost
Incr
Cost Eff
Incr
Eff C/E
Incr C/E
(ICER)
0.217 SLT 448 0.123 3645.03
ALT 458 0.107 4293.13 (Dominated)
0.253 SLT 448 0.123 3645.03
ALT 458 9 0.128 0.005 3581.77 1944.49
0.289 SLT 448 0.123 3645.03
ALT 458 9 0.149 0.026 3072.65 356.49
0.325 SLT 448 0.123 3645.03
ALT 458 9 0.17 0.047 2690.25 196.23
0.361 SLT 448 0.123 3645.03
ALT 458 9 0.191 0.068 2392.49 135.38

117
Appendix A2: ALT Effect Failure Sensitivity: Societal Perspective
ALT
Effect
Failure Strategy Cost
Incr
Cost Eff Incr Eff C/E
Incr C/E
(ICER)
-0.064 SLT 448 0.123 3645.03
ALT 458 9 0.144 0.021 3187.28 449.34
-0.0575 SLT 448 0.123 3645.03
ALT 458 9 0.146 0.023 3128.92 397.57
-0.051 SLT 448 0.123 3645.03
ALT 458 9 0.149 0.026 3072.65 356.49
-0.0445 SLT 448 0.123 3645.03
ALT 458 9 0.152 0.029 3018.37 323.11
-0.038 SLT 448 0.123 3645.03 ALT 458 9 0.154 0.031 2965.98 295.44
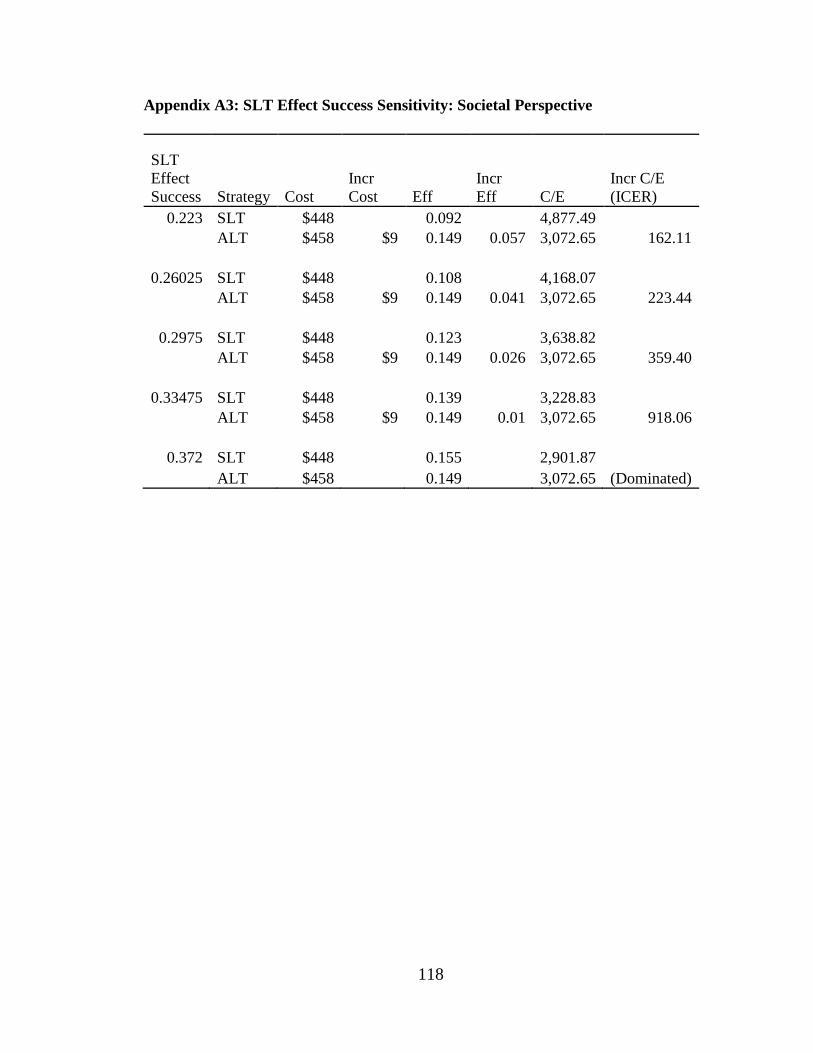
118
Appendix A3: SLT Effect Success Sensitivity: Societal Perspective
SLT
Effect
Success Strategy Cost
Incr
Cost Eff
Incr
Eff C/E
Incr C/E
(ICER)
0.223 SLT $448 0.092 4,877.49
ALT $458 $9 0.149 0.057 3,072.65 162.11
0.26025 SLT $448 0.108 4,168.07
ALT $458 $9 0.149 0.041 3,072.65 223.44
0.2975 SLT $448 0.123 3,638.82
ALT $458 $9 0.149 0.026 3,072.65 359.40
0.33475 SLT $448 0.139 3,228.83
ALT $458 $9 0.149 0.01 3,072.65 918.06
0.372 SLT $448 0.155 2,901.87
ALT $458 0.149 3,072.65 (Dominated)

119
Appendix A4: SLT Effect Failure Sensitivity: Societal Perspective
SLT
Effect
Failure Strategy Cost
Incr
Cost Eff
Incr
Eff C/E
Incr
C/E
(ICER)
-0.004 SLT 448 0.122 3662.3
ALT 458 9 0.149 0.026 3072.65 348.69
-0.004 SLT 448 0.123 3657.97
ALT 458 9 0.149 0.026 3072.65 350.61
-0.004 SLT 448 0.123 3653.64
ALT 458 9 0.149 0.026 3072.65 352.55
-0.003 SLT 448 0.123 3649.33
ALT 458 9 0.149 0.026 3072.65 354.51
-0.003 SLT 448 0.123 3645.03 ALT 458 9 0.149 0.026 3072.65 356.49

120
Appendix A5: ALT Capital Sensitivity: Societal Perspective
ALT
Capital Strategy Cost
Incr
Cost Eff Incr Eff C/E
Incr
C/E
(ICER)
27.42 SLT 448 0.123 3645.03
ALT 452 4 0.149 0.026 3036.56 149.15
31.99 SLT 448 0.123 3645.03
ALT 455 7 0.149 0.026 3054.6 252.82
36.56 SLT 448 0.123 3645.03
ALT 458 9 0.149 0.026 3072.65 356.49
41.13 SLT 448 0.123 3645.03
ALT 460 12 0.149 0.026 3090.69 460.16
45.7 SLT 448 0.123 3645.03 ALT 463 15 0.149 0.026 3108.74 563.83

121
Appendix A6: SLT Capital Sensitivity: Societal Perspective
SLT
Capital Strategy Cost
Incr
Cost Eff Incr Eff C/E
Incr
C/E
(ICER)
23.19 SLT 441 0.123 3585.1
ALT 455 14 0.149 0.026 3054.54 536.83
27.055 SLT 445 0.123 3615.06
ALT 456 12 0.149 0.026 3063.59 446.66
30.92 SLT 448 0.123 3645.03
ALT 458 9 0.149 0.026 3072.65 356.49
34.785 SLT 452 0.123 3674.99
ALT 459 7 0.149 0.026 3081.7 266.32
38.65 SLT 456 0.123 3704.96 ALT 460 5 0.149 0.026 3090.76 176.15

122
Appendix A7: ALT Effect Success Sensitivity: Ministry Perspective
ALT
Effect
Success Strategy Cost
Incr
Cost Eff
Incr
Eff C/E
Incr C/E
(ICER)
0.234 SLT 446 0.122 3644.32
ALT 467 0.11 4262.32 (Dominated)
0.273 SLT 446 0.122 3644.32
ALT 467 21 0.132 0.009 3540.84 2192.57
0.312 SLT 446 0.122 3644.32
ALT 467 21 0.154 0.032 3028.25 649.71
0.351 SLT 446 0.122 3644.32
ALT 467 21 0.176 0.054 2645.3 381.36
0.39 SLT 446 0.122 3644.32 ALT 467 21 0.199 0.076 2348.34 269.89

123
Appendix A8: ALT Effect Failure Sensitivity: Ministry Perspective
ALT
Effect
Failure Strategy Cost
Incr
Cost Eff
Incr
Eff C/E
Incr
C/E
(ICER)
-0.071 SLT 446 0.122 3644.32
ALT 467 21 0.148 0.026 3150.61 800.91
-0.064 SLT 446 0.122 3644.32
ALT 467 21 0.151 0.029 3088.22 717.43
-0.057 SLT 446 0.122 3644.32
ALT 467 21 0.154 0.032 3028.25 649.71
-0.05 SLT 446 0.122 3644.32
ALT 467 21 0.157 0.035 2970.57 593.68
-0.043 SLT 446 0.122 3644.32 ALT 467 21 0.16 0.038 2915.04 546.54

124
Appendix A9: SLT Effect Success Sensitivity: Ministry Perspective
SLT
Effect
Success Strategy Cost
Incr
Cost Eff
Incr
Eff C/E
Incr C/E
(ICER)
0.228 SLT 446 0.091 4929.13
ALT 467 21 0.154 0.064 3028.25 323.83
0.266 SLT 446 0.107 4190.46
ALT 467 21 0.154 0.048 3028.25 432.23
0.304 SLT 446 0.122 3644.32
ALT 467 21 0.154 0.032 3028.25 649.71
0.342 SLT 446 0.138 3224.13
ALT 467 21 0.154 0.016 3028.25 1307.72
0.38 SLT 446 0.154 2890.81 ALT 467 0.154 3028.25 (Dominated)

125
Appendix A10: SLT Effect Failure Sensitivity: Ministry Perspective
SLT Effect
Failure Strategy Cost
Incr
Cost Eff
Incr
Eff C/E
Incr
C/E
(ICER)
-0.012 SLT 446 0.121 3696.85
ALT 467 21 0.154 0.033 3028.25 615.92
-0.01075 SLT 446 0.121 3674.78
ALT 467 21 0.154 0.033 3028.25 629.57
-0.0095 SLT 446 0.122 3652.97
ALT 467 21 0.154 0.032 3028.25 643.83
-0.00825 SLT 446 0.123 3631.42
ALT 467 21 0.154 0.031 3028.25 658.75
-0.007 SLT 446 0.124 3610.12 ALT 467 21 0.154 0.031 3028.25 674.37

126
Appendix A11: ALT Capital Sensitivity: Ministry Perspective
ALT
Capital Strategy Cost
Incr
Cost Eff
Incr
Eff C/E
Incr
C/E
(ICER)
27.42 SLT 446 0.122 3644.32
ALT 462 15 0.154 0.032 2994.32 484.8
31.99 SLT 446 0.122 3644.32
ALT 464 18 0.154 0.032 3011.29 567.26
36.56 SLT 446 0.122 3644.32
ALT 467 21 0.154 0.032 3028.25 649.71
41.13 SLT 446 0.122 3644.32
ALT 470 23 0.154 0.032 3045.21 732.17
45.7 SLT 446 0.122 3644.32 ALT 472 26 0.154 0.032 3062.18 814.62

127
Appendix A12: SLT Capital Sensitivity: Ministry Perspective
SLT
Capital Strategy Cost
Incr
Cost Eff
Incr
Eff C/E
Incr
C/E
(ICER)
23.19 SLT 439 0.122 3583.76
ALT 464 25 0.154 0.032 3011.3 801.14
27.055 SLT 443 0.122 3614.04
ALT 466 23 0.154 0.032 3019.78 725.43
30.92 SLT 446 0.122 3644.32
ALT 467 21 0.154 0.032 3028.25 649.71
34.785 SLT 450 0.122 3674.6
ALT 468 18 0.154 0.032 3036.72 574
38.65 SLT 454 0.122 3704.88 ALT 470 16 0.154 0.032 3045.2 498.28

128
Appendix B: Different Forms Used in the RCT
Form 0 -Participant Contact Form For the Main Study
Study ID#____________; Initials:_________ DOB:______________ F ( ); M ( )
Full Name of the Participant:__________________________
Hospital chart #____________________________
What’s the best time to call you?
From_________To _________; From_________To _________;
From_________To _________
Tel # to reach you? Home phone ( ) or cell phone
( )
Email (if you preferred)? ______________________________________________
If you have someone else to answer the phone or arrange your appointment:
Relationship: ____________________
Name:_______________________________
What’s the best time to call him/her?
From________To ________; From_________To _________;
From________To ______
Tel # to reach him/her? Home phone ( ) or cell phone
( )
Email (if he/she preferred)? ______________________________________________

129
Form 1-Randomization Form
Informed Consent
1. Has the participant had the study explained to him/her, signed the Consent Form and
had a copy given to him/her? Yes No
2. Does the participant meet all inclusion and exclusion criteria? Yes No
Study Eye (check one) [ ] OD [ ] OS
3. Does the patient agree to be randomized? Yes No
4. Web-based Randomization
5. Randomization Number_________________
6. Treatment group: Arm 1 ( ) Arm 2 ( )
Study
ID
#
Study site
#
Study
Eye
Patient
initials
Today’s
date (m/d/y) Visit
Staff initials
Randomization

130
Form 2-Inclusion and Exclusion Check List
Inclusion Criteria (yes):
1. From one of the practices participating in this study ( ).
2. Older or equal to 18 years of age ( ).
3. Open angle glaucoma including pigmentary dispersion syndrome and pseudoexfoliation
syndrome ( ) a) Open angle glaucoma ( )
b) Pigmentary dispersion syndrome ( )
c) Pseudoexfoliation syndrome ( )
d) Ocular hypertension ( )
4. Previous 360 degree SLT (One time of 360 degree SLT or two 180 SLT on the same eye)
( )
5. Intraocular pressure greater than 16 mm Hg on at least two consecutive occasions separated by
one month ( )
6. Two sighted eyes. Sighted is defined as best corrected visual acuity of 20/200 or better in the
absence of an advanced VF defect which is defined below (Exclusion Criteria (b)). Two eyes
of the same patient may not be included in the study.
7. Willing to participate and sign the consent Form ( ).
Exclusion Criteria (No): 1. Any evidence of secondary open angle glaucoma (other than pigmentary and pseudoexfoliation)
or narrow angle glaucoma (where the anterior trabecular meshwork is not visible 360 degrees). These
patients would make the study population too heterogeneous ( ). 2. Previous non laser glaucoma surgery in the eye being considered for treatment as this changes
the angle architecture too unpredictably to be included ( ).
3. Intraocular surgery anticipated in the 12 months after treatment ( )
4. Any corneal disease obscuring adequate visualization of the anterior chamber trabecular
meshwork or reliable applanation tonometry ( ).
5. Present treatment with topical or systemic steroids or anticipated treatment with systemic steroids
in the 6 months following treatment because of a high probability condition (such as
giant cell arteritis or a collagen vascular disease) as steroids themselves have a
pressure increasing effect in an unpredictable fashion. ( ). 6. Any previous ALT ( )
*IF NO WAS ANSWERED TO ANY INCLUSION CRITERIA, OR YES TO ANY
EXCLUSION CRITERIA DO NOT ENROLL
Investigator’s Signature Date
Study ID
#
Study Site
#
Study
Eye
Patient
initials
Today’s date
(m/d/y) Visit
Screening
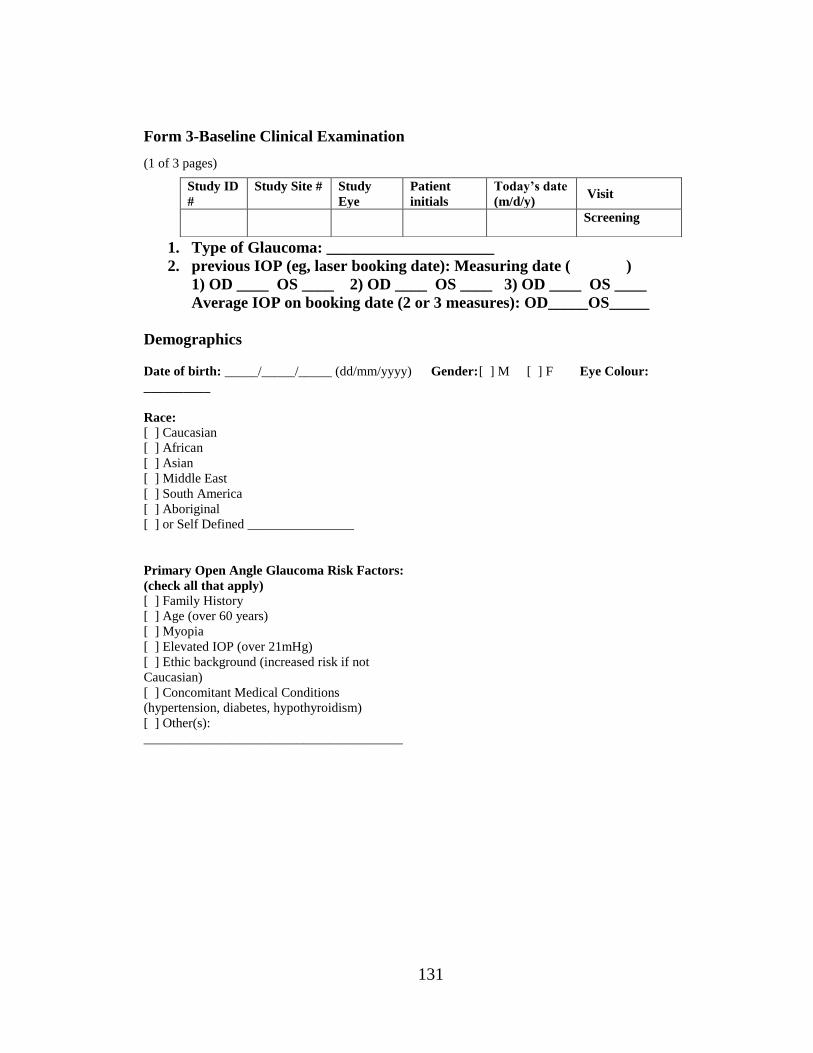
131
Form 3-Baseline Clinical Examination
(1 of 3 pages)
1. Type of Glaucoma: _____________________
2. previous IOP (eg, laser booking date): Measuring date ( )
1) OD ____ OS ____ 2) OD ____ OS ____ 3) OD ____ OS ____
Average IOP on booking date (2 or 3 measures): OD_____OS_____
Demographics
Date of birth: _____/_____/_____ (dd/mm/yyyy) Gender: [ ] M [ ] F Eye Colour:
__________
Race:
[ ] Caucasian
[ ] African
[ ] Asian
[ ] Middle East
[ ] South America
[ ] Aboriginal
[ ] or Self Defined ________________
Primary Open Angle Glaucoma Risk Factors:
(check all that apply)
[ ] Family History
[ ] Age (over 60 years)
[ ] Myopia
[ ] Elevated IOP (over 21mHg)
[ ] Ethic background (increased risk if not
Caucasian)
[ ] Concomitant Medical Conditions
(hypertension, diabetes, hypothyroidism)
[ ] Other(s):
_______________________________________
Study ID
#
Study Site # Study
Eye
Patient
initials
Today’s date
(m/d/y) Visit
Screening

132
Study Eye: (check one) [ ] OD [ ] OS
SLT History:
TYPE
OF
LASE
R:
-SLT
DATE
OF Laser
EYE(S
)
-OD
-OS
-both
Degre
es:
-180
-360
-other
LOCATI
ON:
-inferior
-superior
-nasal
-temporal
-other
Power:
SLT: _.
_mj
Applicat
ion
(shots):
_ _ _
Total
Energy
=
(power
x
applicat
ions)
SLT: _
_ mj
Ocular Medical and Surgical History (excluding previous ALT or SLT)
DIAGNOSIS/SURGERY EYE(S) ONSET
<5YEARS
5-10 YEARS
>10YEARS
ONGOING OR
RESOLVED
Form3 (Baseline, 2/3)
Non-Ocular Medical and Surgical History:
DIAGNOSIS/SURGERY ONSET (<5
YEARS;
5-10 YEARS; >10
YEARS)
ONGOING OR
RESOLVED

133
Intraocular Pressure (IOP)
METHOD OF
MEASUREMENT
TIME IOP (mmHg)
Goldman Applanation
Tonometry
IOP: take two measurements
& average them if the diff. is
< 2 mm Hg.
-If the difference ≥3 mm Hg,
take 3 measurements and take
the median as the value.
____:____hrs
(24 hour clock)
1. OD ____ OS ____
2. OD ____ OS ____
3. OD ____ OS ____
Average IOP
OD ____ OS ____
Target IOP for this
Patient?_____________________________________________________________
Signature of Mire Reader Date
Signature of Dial reader Date
Central Corneal Thickness (CCT):
METHOD OF
MEASUREMENT
TIME CCT (µM)
Ultrasound Pachymetry
___:___ hrs
(24 hour clock)
OD ______ µm
OS ______ µm
Signature of Person Performing CCT Date
Form3 (Baseline, 3/3)
Best-Corrected Visual Acuity (BCVA):
METHOD OF
MEASUREMENT
TIME VISUAL ACUITY
Snellen
___:___ hrs
(24 hour clock)
OD ___________
OS ___________
* For consistency please use the same chart in the same room, using the same lighting throughout the trial.
Signature of Person Performing BCVA Date

134
SCORING RIGHT EYE (OD) LEFT EYE (OS)
Modified Shaffer
Closed
Schwalbe’s Line
Trabecular Meshwork
Scleral Spur
Ciliary Body Band
Gonioscopy (with gonio
lens)
Grade 0
Grade 1
Grade 2
Grade 3
Grade 4
Gonioscopy (with gonio
lens)
Grade 0
Grade 1
Grade 2
Grade 3
Grade 4
None
Light
Medium
Dark Brown
Almost Black
Trabecular Meshwork
(Angle) Pigmentation
Grade 0
Grade 1
Grade 2
Grade 3
Grade 4
Trabecular Meshwork
(Angle) Pigmentation
Grade 0
Grade 1
Grade 2
Grade 3
Grade 4
PAS is absent or
present
Peripheral Anterior
Synechiae
Absent
Present
Peripheral Anterior
Synechiae
Absent
Present
Cup to Disc Ratio
0.__
Cup to Disc Ratio
0.__ Cells Scoring:
0=0 cells; +0.5=1-5 cells
(trace); +1=6-15 cells;
+2=16-25 cells; +3=26-50
cells; +4=>50cells
Flare Scoring:
0=None; +1=Faint;
+2=Moderate;
+3=Marked; +4= Intense
Anterior Chamber
Inflammation
Cells _____
Flare _____
Anterior Chamber
Inflammation
Cells _____
Flare _____
Signature of Person Performing Ophthalmic Examination Date

135
Form 4-Laser Treatment Log Record
(page 1 of 2)
Study Eye: (check one) [ ] OD [ ] OS
Prior to Laser Check IOP, BCVA and AC for inflammation
Intraocular Pressure (IOP): or Not Done (Screening and Treatment Combined)
METHOD OF
MEASUREMENT
TIME IOP (MMHG) Baseline IOP rule
Goldman
Applanation
Tonometry
To measure IOP:
-Take two
measurements and
average them if the
difference is within 2
mm Hg.
-If the difference is
greater than 3 mm Hg,
take 3 measurements
and take the median as
the value.
____:____hrs
(24 hour
clock)
1. OD ____
OS ____
2. OD ____
OS ____
3. OD ____
OS ____
Average IOP
OD ____ OS ____
Average of IOP on
booking date (Avg
OD____ OS_____)
and laser date (if
different date from the
baseline measurement
date) (Avg OD____
OS_____)
Baseline IOP:
OD____ OS_____
* the computer will do
the calculation of
Baseline IOP, you may
verify it, if you have
any doubt, please let
Francie know .
Signature of Mire Reader Date
Signature of Dial reader
Study
ID
#
Study Site
#
Study
Eye
Patient
initials
Today’s
date
(m/d/y)
Visit Study arm
1 or 2
Laser treatment

136
Best-Corrected Visual Acuity (BCVA): or Not Done (Screening and Treatment
Combined)
METHOD OF
MEASUREMENT
TIME VISUAL ACUITY
Snellen
___:___ hrs
(24 hour clock)
OD ___________
OS ___________
*If three letters or more are read correctly on that line, capture that line on the source document (ie;
if the patient reads all but 2 letters correctly on the 20/20 line, you will still record 20/20 as the visual
acuity)
*As per inclusion (e): Two sighted eyes. Sighted is defined as best corrected visual acuity of 20/200 or
better
*If the patient cannot read 20/400 or better, check for CF, HM, LP
* For consistency please use the same chart in the same room, using the same lighting throughout the
trial, if possible
Signature of Person Performing BCVA Date
Form 4-Laser Treatment Log Record (page 2 of 2)
CELLS SCORING:
0=0 CELLS; +0.5=1-5
CELLS (TRACE); +1=6-
15 CELLS; +2=16-25
CELLS; +3=26-50
CELLS; +4=>50CELLS
FLARE SCORING:
0=NONE; +1=FAINT;
+2=MODERATE;
+3=MARKED; +4=
INTENSE
ANTERIOR CHAMBER
INFLAMMATION (OD)
CELLS _____
FLARE _____
ANTERIOR CHAMBER
INFLAMMATION
(OS)
CELLS _____
FLARE _____
Signature of Person Performing AC Examination Date
Study
ID
#
Study Site
#
Study
Eye
Patient
initials
Today’s
date
(m/d/y)
Visit Study arm
1 or 2
Laser treatment

137
Laser treatment:
Time: _
_hour_
_min
ALT SLT
Protocol (p) Actual Protocol Actual
Location Inferior 180 (p)
superior 180
nasal 180
temporal 180
Inferior 180
(p)
superior 180
nasal 180
temporal 180
Applications 50 50
Spot size 50 uM 400 uM
Duration 0.1 sec 3 nsec
Power range 400-800 mW 0.5 -1.4 mJ
Total energy
(Application
x power)
_ _application x
___mW /1000
_ _._ _ _W __applications
x
_._mJ
_ _ ._ mJ
Total Energy
Level from
the
Machine?
Brimonidine-
post laser
1 drop 1 drop
Signature of Person Performing Laser Date
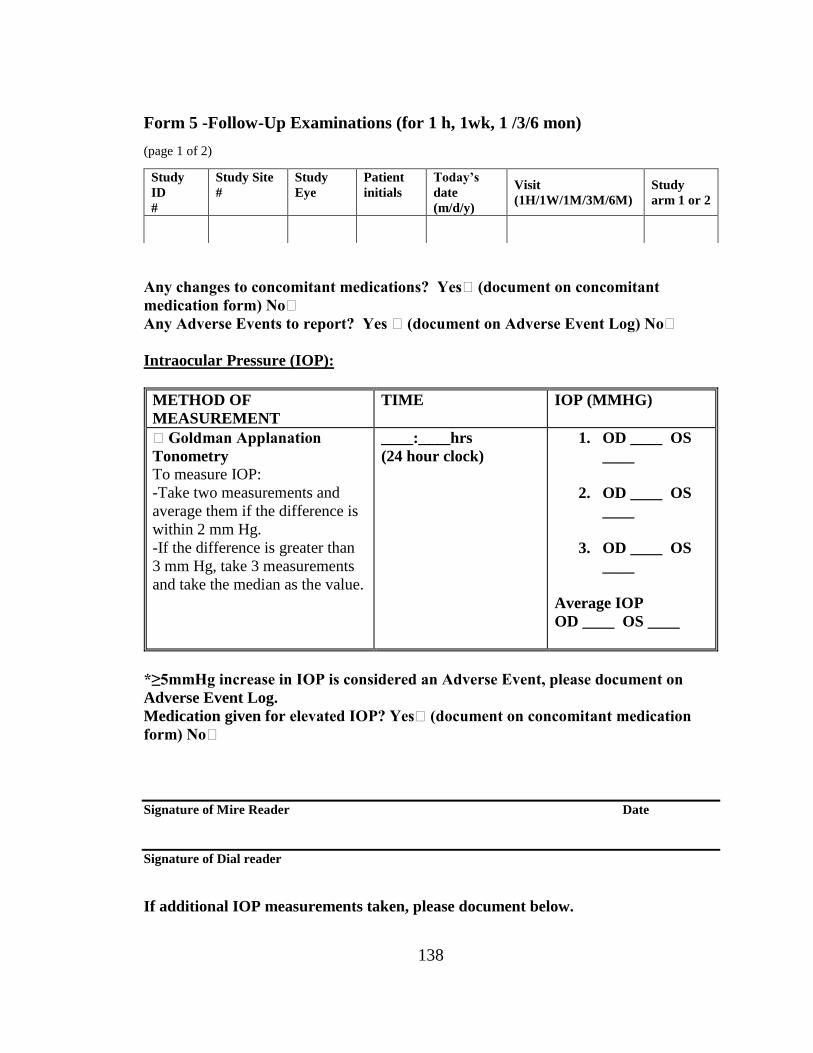
138
Form 5 -Follow-Up Examinations (for 1 h, 1wk, 1 /3/6 mon)
(page 1 of 2)
Any changes to concomitant medications? Yes (document on concomitant
medication form) No
Any Adverse Events to report? Yes (document on Adverse Event Log) No
Intraocular Pressure (IOP):
METHOD OF
MEASUREMENT
TIME IOP (MMHG)
Goldman Applanation
Tonometry
To measure IOP:
-Take two measurements and
average them if the difference is
within 2 mm Hg.
-If the difference is greater than
3 mm Hg, take 3 measurements
and take the median as the value.
____:____hrs
(24 hour clock)
1. OD ____ OS
____
2. OD ____ OS
____
3. OD ____ OS
____
Average IOP
OD ____ OS ____
*≥5mmHg increase in IOP is considered an Adverse Event, please document on
Adverse Event Log.
Medication given for elevated IOP? Yes (document on concomitant medication
form) No
Signature of Mire Reader Date
Signature of Dial reader
If additional IOP measurements taken, please document below.
Study
ID
#
Study Site
#
Study
Eye
Patient
initials
Today’s
date
(m/d/y)
Visit
(1H/1W/1M/3M/6M)
Study
arm 1 or 2

139
If additional medication given for elevated IOP, please document on concomitant
medication form.
Time: ___:___ hrs OD ___mmHg
OS ___mmHg
Time: ___:___ hrs OD ___mmHg
OS ___mmHg
Time: ___:___ hrs OD ___mmHg
OS ___mmHg
Form 5 -Follow-Up Examinations (for 1 h, 1wk, 1 /3/6 mon) (page 2 of2)
Best-Corrected Visual Acuity (BCVA):
METHOD OF
MEASUREMENT
TIME VISUAL ACUITY
Snellen
___:___ hrs
(24 hour clock)
OD ___________
OS ___________
*If three letters or more are read correctly on that line, capture that line on the source document (ie;
if the patient reads all but 2 letters correctly on the 20/20 line, you will still record 20/20 as the visual
acuity)
*As per inclusion (e): Two sighted eyes. Sighted is defined as best corrected visual acuity of 20/200 or
better
*If the patient cannot read 20/400 or better, check for CF, HM, LP
* For consistency please use the same chart in the same room, using the same lighting throughout the
trial, if possible
Signature of Person Performing BCVA Date
Study
ID
#
Study Site
#
Study
Eye
Patient
initials
Today’s
date
(m/d/y)
Visit
(1H/1W/1M/3M/6M)
Study
arm 1 or 2

140
CELLS SCORING:
0=0 CELLS; +0.5=1-5
CELLS (TRACE); +1=6-
15 CELLS; +2=16-25
CELLS; +3=26-50
CELLS; +4=>50CELLS
FLARE SCORING:
0=NONE; +1=FAINT;
+2=MODERATE;
+3=MARKED; +4=
INTENSE
ANTERIOR CHAMBER
INFLAMMATION
(OD)
CELLS _____
FLARE _____
ANTERIOR CHAMBER
INFLAMMATION
(OS)
CELLS _____
FLARE _____
Signature of Person Performing Examination Date
Other findings by
Investigator:_____________________________________________________________
________________________________________________________________________
________________________________________ Course/Complications: (check all that
apply)
[ ] Anterior Chamber Reaction 3+ or greater
[ ] Pain or Discomfort
[ ] Blurred Vision
[ ] IOP Spike (increase of 5mmHg or more) indicate increase __mmHg
[ ] Persistent IOP Elevation
[ ] Peripheral Anterior Synechiae
[ ] Corneal cloudiness
[ ] Scarring
[ ] Others: ________________________________________________________
[ ] None

141
Appendix C: Recalculation of Power of the Study for Reduced Sample Size
As we have an active control group (ALT) and a comparator group (SLT), the
total sample size (for both active control and comparator group) would be:
2(N) = 2{2v2 (Zα+Zß)2 /d2}
When 2(N) = 91
v2 = 52
Zα = 1.96
d2 = 32
Then, Zß = 0.9
When Zß = 0.9, the power of the study = 81%

142
Curriculum vitae
Name: Muhammad Rakibuz-Zaman
Education: The University of Western Ontario
London, Ontario, Canada
2014-2016, MSc (Epidemiology)
Sir Salimullah Medical College
Dhaka, Bangladesh
1992-1999 MBBS
Employment: Graduate Research Assistant
Department of Epidemiology and Biostatistics
The University of Western Ontario
2014-2016
Awards: Western Graduate Research Scholarship (WGRS)
2014-2016
Publication:
(Selected)
Hamade N, Hodge WG, Rakibuz-Zaman M, Malvankar-Mehta MS. The
Effects of Low-Vision Rehabilitation on Reading Speed and Depression in
Age Related Macular Degeneration: A Meta-Analysis. PLoS
ONE.2016;11(7) :1-15.
Wu F, Parvez F, Islam T, Ahmed A, Rakibuz-Zaman M, Hasan R, Argos
M, Levy D, Sarwar G, Ahsan H, Chen Y. Betel quid use and mortality in
Bangladesh: a cohort study. Bulletin of the World Health Organization
2015;93:684-692.

143
Farzan SF, Karagas MR, Jiang J, Wu F, Liu M, Newman JD, Jasmine F,
Kibriya MG, Paul-Brutus R, Parvez F, Argos M, Bryan MS, Eunus M,
Ahmed A, Islam T, Rakibuz-Zaman M, Hasan R, Sarwar G, Slavkovich V,
Graziano J, Ahsan H, Chen Y. Gene-arsenic interaction in longitudinal
changes of blood pressure: Findings from the Health Effects of Arsenic
Longitudinal Study (HEALS) in Bangladesh. Toxicol Appl Pharmacol.
2015 Oct 1;288(1):95-105.
Pesola GR, Argos M, Chen Y, Parvez F, Ahmed A, Hasan R, Rakibuz-
Zaman M, Islam T, Eunus M, Sarwar G, Chinchilli VM, Neugut AI, Ahsan
H. Dipstick proteinuria as a predictor of all-cause and cardiovascular
disease mortality in Bangladesh: A prospective cohort study. Prev Med.
2015 Sep;78:72-77.
Jiang J, Liu M, Parvez F, Wang B, Wu F, Eunus M, Bangalore S, Newman
JD, Ahmed A, Islam T, Rakibuz-Zaman M, Hasan R, Sarwar G, Levy D,
Slavkovich V, Argos M, Bryan MS, Farzan SF, Hayes RB, Graziano JH,
Ahsan H, Chen Y. Association between Arsenic Exposure from Drinking
Water and Longitudinal Change in Blood Pressure among HEALS Cohort
Participants. Environ Health Perspect. 2015 Aug;123(8):806-12. doi:
10.1289/ehp.1409004. PMID: Epub 2015 Mar 27.
Gao J, Tong L, Argos M, Scannell Bryan M, Ahmed A, Rakibuz-Zaman M,
Kibriya MG, Jasmine F, Slavkovich V, Graziano JH, Ahsan H, Pierce BL.
The Genetic Architecture of Arsenic Metabolism Efficiency: A SNP-Based
Heritability Study of Bangladeshi Adults. Environ Health Perspect. 2015
Mar 13.
Seow WJ, Pan WC, Kile ML, Tong L, Baccarelli AA, Quamruzzaman Q,
Rahman M, Mostofa G, Rakibuz-Zaman M, Kibriya M, Ahsan H, Lin X,
Christiani DC. A distinct and replicable variant of the squamous cell
carcinoma gene inositol polyphosphate-5-phosphatase modifies the

144
susceptibility of arsenic-associated skin lesions in Bangladesh. Cancer.
2015 Mar 10. doi: 10.1002/cncr.29291
Jiang J, Liu M, Parvez F, Wang B, Wu F, Eunus M, Bangalore S, Ahmed
A, Islam T, Rakibuz-Zaman M, Hasan R, Sarwar G, Levy D, Argos M,
Scannell Bryan M, Graziano J, Hayes RB, Ahsan H, Chen Y. Association
of major dietary patterns and blood pressure longitudinal change in
Bangladesh. J Hypertens. 2015 Jun;33(6):1193-200.
Argos M, Kalra T, Rathouz PJ, Chen Y, Pierce B, Parvez F, Islam T,
Ahmed A, Rakibuz-Zaman M, Hasan R, Sarwar G, Slavkovich V, van
Geen A, Graziano J, Ahsan H. Arsenic exposure from drinking water, and
all-cause and chronic-disease mortalities in Bangladesh (HEALS): a
prospective cohort study. Lancet. 2010 Jul 24;376(9737):252-8.
Conference Presentation:
Muhammad Rakibuz-Zaman, MBBS, Jeffrey Tin-Yu Chow, William
Hodge, MD, PhD, FRCSC, Francie F. Si, MD, MSc, Cindy Hutnik,
BSc, MD, PhD, FRCSC, Marcelo Nicolela, MD, FRCSC, Andrew
Crichton, MD, FRCSC, Catherine Birt, MD, FRCSC, Karim F. Damji,
MD, FRCSC, E. Sogbesan, MD, Dariusz Gozdzik, Lesya Shuba, MD,
PhD, FRCSC, Michael Dorey, MD, FRCSC, Bryce Ford, MD, FRCSC.
Repeat SLT vs ALT, interim analysis of demographics and safety. Ivey
Eye Institute Ophthalmology Research Day, London, ON, Nov. 2015.
Podium Presentation.
Poster Presentation:
Clinico-Histopathological Characteristics of Skin Lesions among
Arsenicosis Patients in Bangladesh. [Forgery International Workshop
(From 21-23 November, 2011 in India)]


![A New Glaucoma “VITAL SIGN” - Review of Ophthalmologytype of intervention (e.g., medication, minimally invasive glaucoma sur-gery [MIGS], selective laser trabeculoplasty [SLT],](https://img.pdfslide.net/doc/110x75/5e3244bb16c5527c8a10a4a6/a-new-glaucoma-aoevital-signa-review-of-ophthalmology-type-of-intervention-eg.jpg)