Embed Size (px)
Citation preview
2014 AACE® INTERNATIONAL TECHNICAL PAPER
EST.1648.1 Copyright © AACE® International.
This paper may not be reproduced or republished without expressed written consent from AACE® International
EST.1648
Cost Estimating for Offshore Oil & Gas Facility Decommissioning
Dr. Robert C. Byrd, PE, Donald J. Miller, and Steven M. Wiese
Abstract—The paper reviews the process of decommissioning a typical offshore facility in the US Gulf of Mexico. This includes all aspects of the process from planning to deck and jacket removal, and site clearance. Well plugging and abandonment (P&A) is discussed but not pursued in detail. The areas of uncertainty with respect to estimating the cost are discussed. An example of an estimate for a typical facility is provided in detail. Comparisons are made between estimated and actual cost outcomes, along with a discussion of the variances and their causes. Conclusions and recommendations for improving the quality of decommissioning cost estimates are provided.
2014 AACE® INTERNATIONAL TECHNICAL PAPER
EST.1648.2 Copyright © AACE® International.
This paper may not be reproduced or republished without expressed written consent from AACE® International
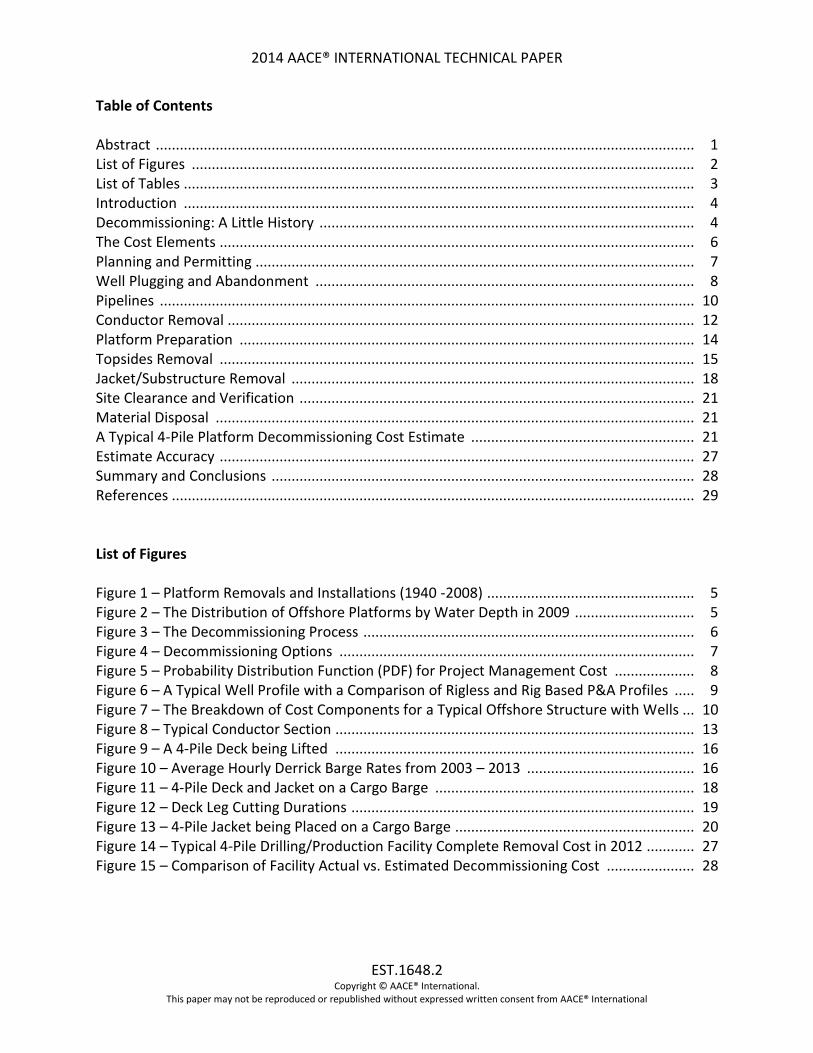
Table of Contents Abstract ....................................................................................................................................... 1 List of Figures .............................................................................................................................. 2 List of Tables ................................................................................................................................ 3 Introduction ................................................................................................................................ 4 Decommissioning: A Little History .............................................................................................. 4 The Cost Elements ....................................................................................................................... 6 Planning and Permitting .............................................................................................................. 7 Well Plugging and Abandonment ............................................................................................... 8 Pipelines ...................................................................................................................................... 10 Conductor Removal ..................................................................................................................... 12 Platform Preparation .................................................................................................................. 14 Topsides Removal ....................................................................................................................... 15 Jacket/Substructure Removal ..................................................................................................... 18 Site Clearance and Verification ................................................................................................... 21 Material Disposal ........................................................................................................................ 21 A Typical 4-Pile Platform Decommissioning Cost Estimate ........................................................ 21 Estimate Accuracy ....................................................................................................................... 27 Summary and Conclusions .......................................................................................................... 28 References ................................................................................................................................... 29 List of Figures Figure 1 – Platform Removals and Installations (1940 -2008) .................................................... 5 Figure 2 – The Distribution of Offshore Platforms by Water Depth in 2009 .............................. 5 Figure 3 – The Decommissioning Process ................................................................................... 6 Figure 4 – Decommissioning Options ......................................................................................... 7 Figure 5 – Probability Distribution Function (PDF) for Project Management Cost .................... 8 Figure 6 – A Typical Well Profile with a Comparison of Rigless and Rig Based P&A Profiles ..... 9 Figure 7 – The Breakdown of Cost Components for a Typical Offshore Structure with Wells ... 10 Figure 8 – Typical Conductor Section .......................................................................................... 13 Figure 9 – A 4-Pile Deck being Lifted .......................................................................................... 16 Figure 10 – Average Hourly Derrick Barge Rates from 2003 – 2013 .......................................... 16 Figure 11 – 4-Pile Deck and Jacket on a Cargo Barge ................................................................. 18 Figure 12 – Deck Leg Cutting Durations ...................................................................................... 19 Figure 13 – 4-Pile Jacket being Placed on a Cargo Barge ............................................................ 20 Figure 14 – Typical 4-Pile Drilling/Production Facility Complete Removal Cost in 2012 ............ 27 Figure 15 – Comparison of Facility Actual vs. Estimated Decommissioning Cost ...................... 28
2014 AACE® INTERNATIONAL TECHNICAL PAPER
EST.1648.3 Copyright © AACE® International.
This paper may not be reproduced or republished without expressed written consent from AACE® International
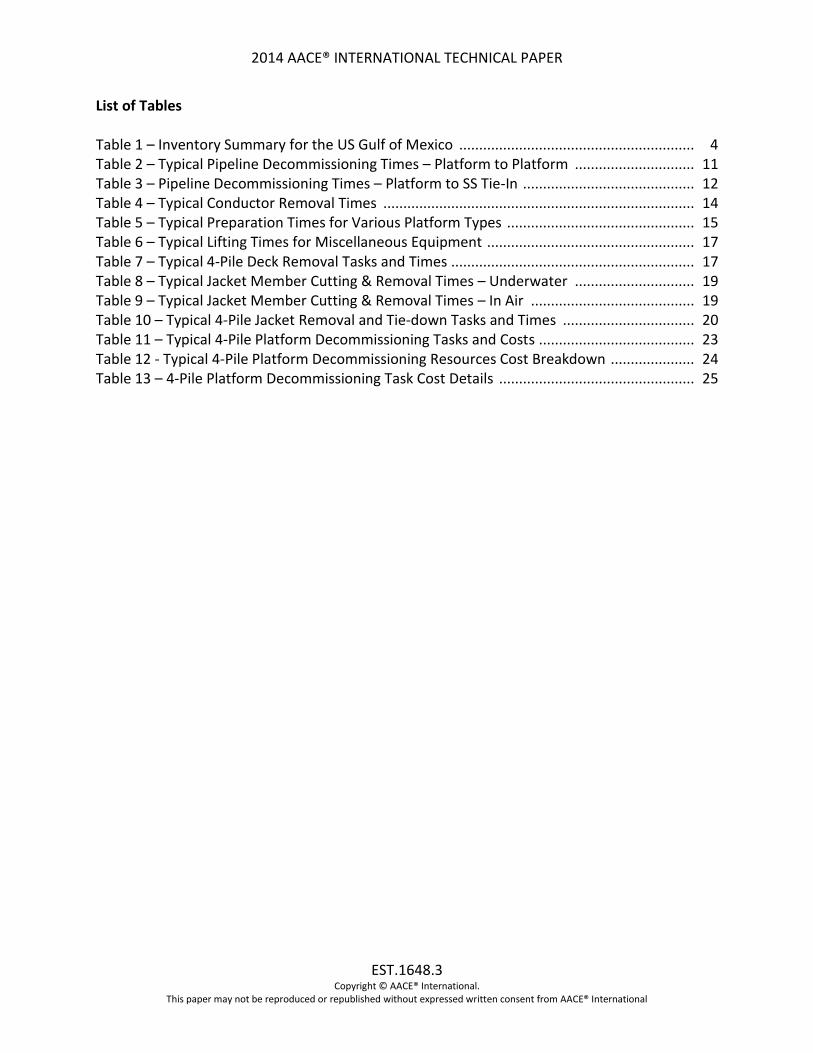
List of Tables Table 1 – Inventory Summary for the US Gulf of Mexico ........................................................... 4 Table 2 – Typical Pipeline Decommissioning Times – Platform to Platform .............................. 11 Table 3 – Pipeline Decommissioning Times – Platform to SS Tie-In ........................................... 12 Table 4 – Typical Conductor Removal Times .............................................................................. 14 Table 5 – Typical Preparation Times for Various Platform Types ............................................... 15 Table 6 – Typical Lifting Times for Miscellaneous Equipment .................................................... 17 Table 7 – Typical 4-Pile Deck Removal Tasks and Times ............................................................. 17 Table 8 – Typical Jacket Member Cutting & Removal Times – Underwater .............................. 19 Table 9 – Typical Jacket Member Cutting & Removal Times – In Air ......................................... 19 Table 10 – Typical 4-Pile Jacket Removal and Tie-down Tasks and Times ................................. 20 Table 11 – Typical 4-Pile Platform Decommissioning Tasks and Costs ....................................... 23 Table 12 - Typical 4-Pile Platform Decommissioning Resources Cost Breakdown ..................... 24 Table 13 – 4-Pile Platform Decommissioning Task Cost Details ................................................. 25
2014 AACE® INTERNATIONAL TECHNICAL PAPER
EST.1648.4 Copyright © AACE® International.
This paper may not be reproduced or republished without expressed written consent from AACE® International
Introduction
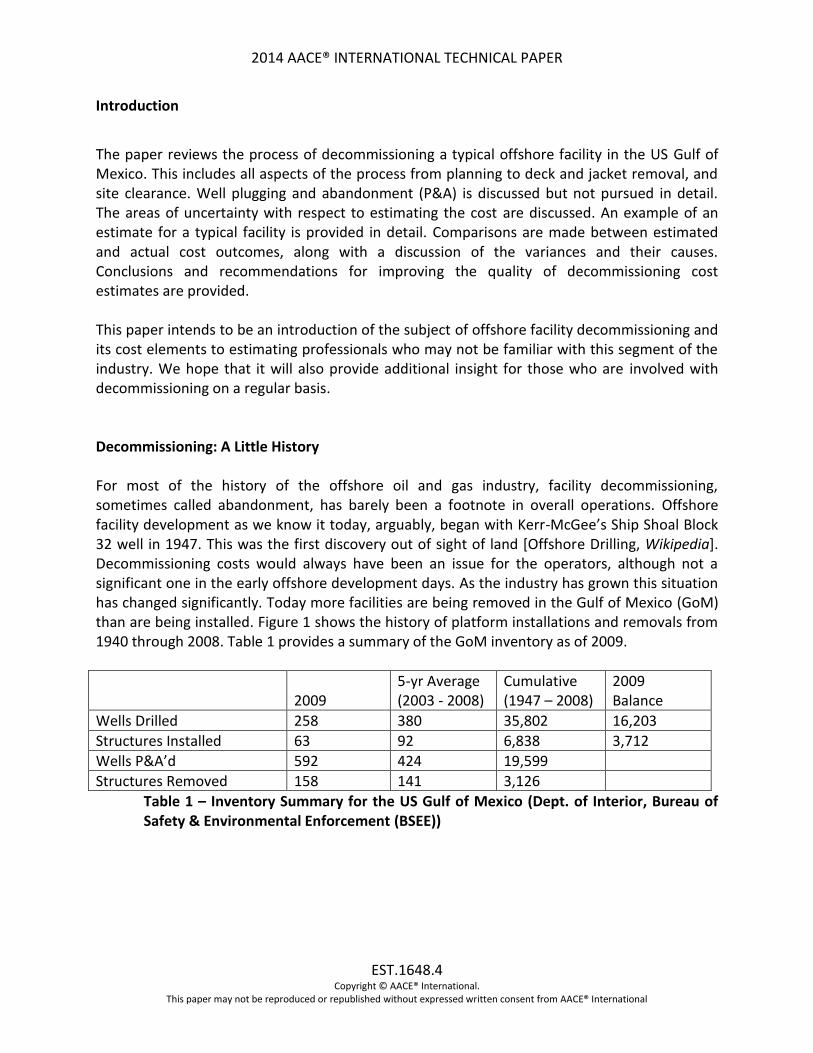
The paper reviews the process of decommissioning a typical offshore facility in the US Gulf of Mexico. This includes all aspects of the process from planning to deck and jacket removal, and site clearance. Well plugging and abandonment (P&A) is discussed but not pursued in detail. The areas of uncertainty with respect to estimating the cost are discussed. An example of an estimate for a typical facility is provided in detail. Comparisons are made between estimated and actual cost outcomes, along with a discussion of the variances and their causes. Conclusions and recommendations for improving the quality of decommissioning cost estimates are provided. This paper intends to be an introduction of the subject of offshore facility decommissioning and its cost elements to estimating professionals who may not be familiar with this segment of the industry. We hope that it will also provide additional insight for those who are involved with decommissioning on a regular basis. Decommissioning: A Little History For most of the history of the offshore oil and gas industry, facility decommissioning, sometimes called abandonment, has barely been a footnote in overall operations. Offshore facility development as we know it today, arguably, began with Kerr-McGee’s Ship Shoal Block 32 well in 1947. This was the first discovery out of sight of land [Offshore Drilling, Wikipedia]. Decommissioning costs would always have been an issue for the operators, although not a significant one in the early offshore development days. As the industry has grown this situation has changed significantly. Today more facilities are being removed in the Gulf of Mexico (GoM) than are being installed. Figure 1 shows the history of platform installations and removals from 1940 through 2008. Table 1 provides a summary of the GoM inventory as of 2009.
2009 5-yr Average (2003 - 2008)
Cumulative (1947 – 2008)
2009 Balance
Wells Drilled 258 380 35,802 16,203
Structures Installed 63 92 6,838 3,712
Wells P&A’d 592 424 19,599
Structures Removed 158 141 3,126
Table 1 – Inventory Summary for the US Gulf of Mexico (Dept. of Interior, Bureau of Safety & Environmental Enforcement (BSEE))

2014 AACE® INTERNATIONAL TECHNICAL PAPER
EST.1648.5 Copyright © AACE® International.
This paper may not be reproduced or republished without expressed written consent from AACE® International
Figure 1 – Platform Removals and Installations (1940 -2008) (BSEE)
Figure 2 – The Distribution of Offshore Platforms by Water Depth in 2009 (BSEE)
0
500
1000
1500
2000
2500
3000
3500
0 to 200 201 to 400 401 to 800 801 to 1000
Above 1000
3480
442
47 4 25
Nu
mb
er
of
Acti
ve P
latf
orm
s
Water Depth (Meters)
2014 AACE® INTERNATIONAL TECHNICAL PAPER
EST.1648.6 Copyright © AACE® International.
This paper may not be reproduced or republished without expressed written consent from AACE® International
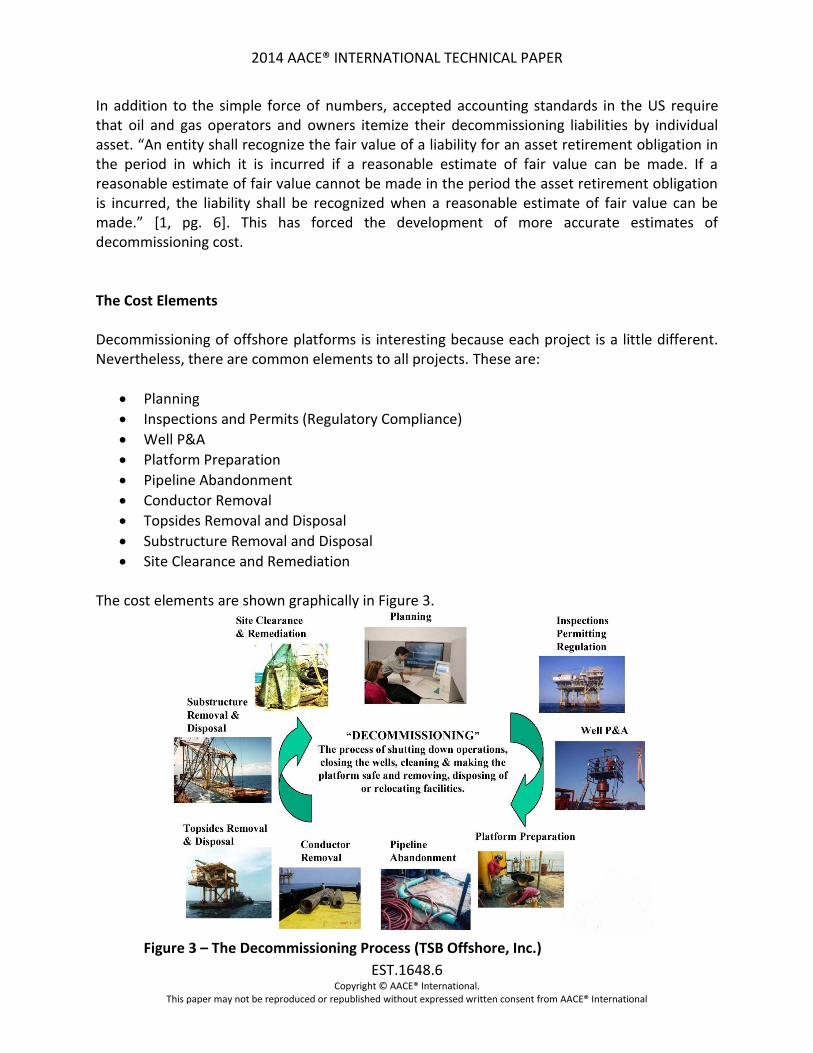
In addition to the simple force of numbers, accepted accounting standards in the US require that oil and gas operators and owners itemize their decommissioning liabilities by individual asset. “An entity shall recognize the fair value of a liability for an asset retirement obligation in the period in which it is incurred if a reasonable estimate of fair value can be made. If a reasonable estimate of fair value cannot be made in the period the asset retirement obligation is incurred, the liability shall be recognized when a reasonable estimate of fair value can be made.” [1, pg. 6]. This has forced the development of more accurate estimates of decommissioning cost. The Cost Elements Decommissioning of offshore platforms is interesting because each project is a little different. Nevertheless, there are common elements to all projects. These are:
Planning
Inspections and Permits (Regulatory Compliance)
Well P&A
Platform Preparation
Pipeline Abandonment
Conductor Removal
Topsides Removal and Disposal
Substructure Removal and Disposal
Site Clearance and Remediation The cost elements are shown graphically in Figure 3.
Figure 3 – The Decommissioning Process (TSB Offshore, Inc.)
2014 AACE® INTERNATIONAL TECHNICAL PAPER
EST.1648.7 Copyright © AACE® International.
This paper may not be reproduced or republished without expressed written consent from AACE® International
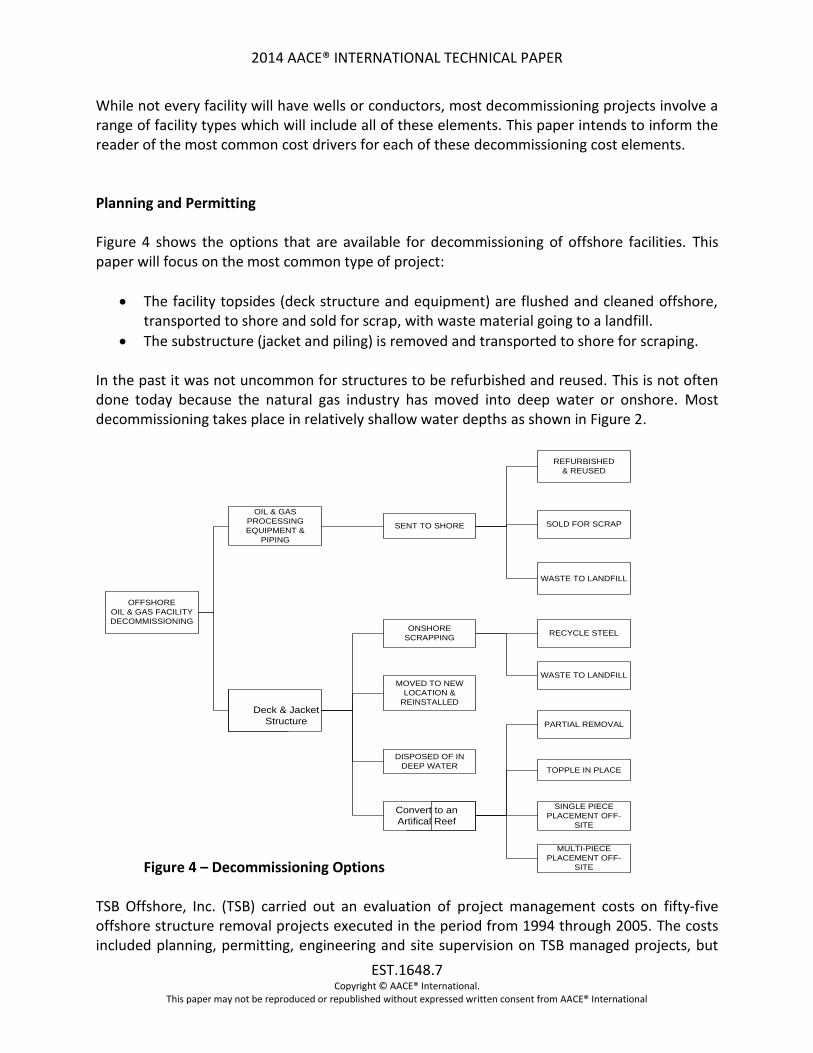
While not every facility will have wells or conductors, most decommissioning projects involve a range of facility types which will include all of these elements. This paper intends to inform the reader of the most common cost drivers for each of these decommissioning cost elements. Planning and Permitting Figure 4 shows the options that are available for decommissioning of offshore facilities. This paper will focus on the most common type of project:
The facility topsides (deck structure and equipment) are flushed and cleaned offshore, transported to shore and sold for scrap, with waste material going to a landfill.
The substructure (jacket and piling) is removed and transported to shore for scraping. In the past it was not uncommon for structures to be refurbished and reused. This is not often done today because the natural gas industry has moved into deep water or onshore. Most decommissioning takes place in relatively shallow water depths as shown in Figure 2.
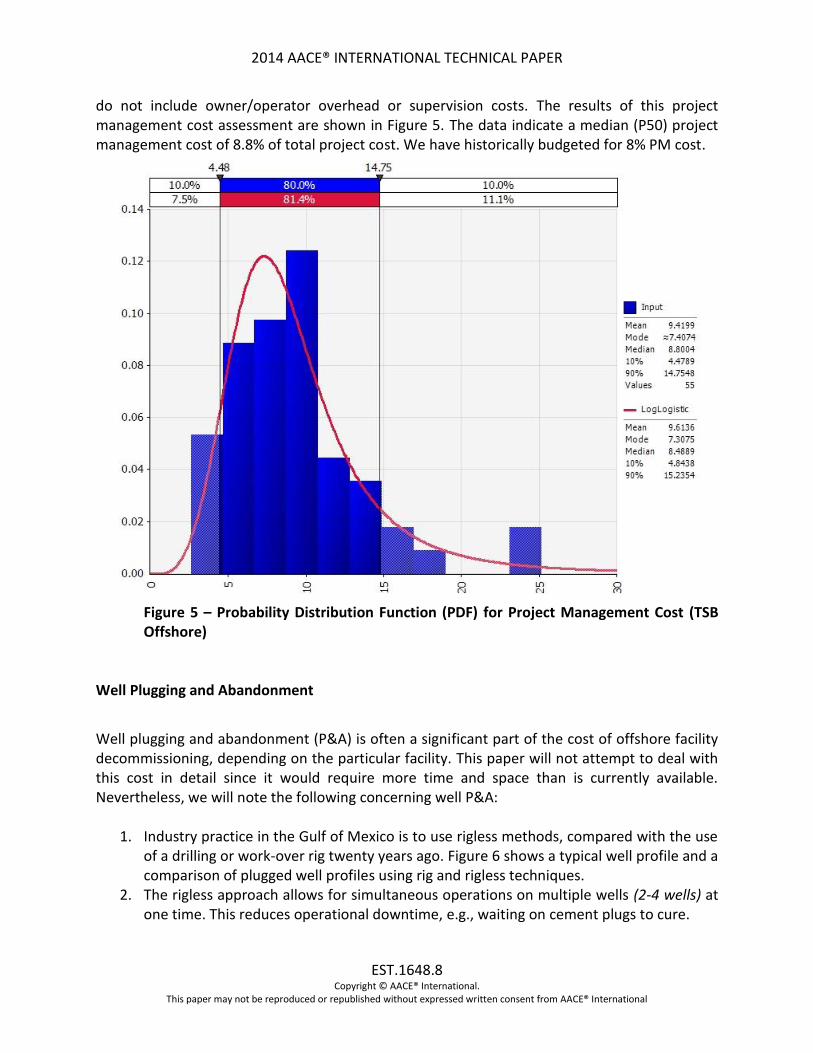
Figure 4 – Decommissioning Options TSB Offshore, Inc. (TSB) carried out an evaluation of project management costs on fifty-five offshore structure removal projects executed in the period from 1994 through 2005. The costs included planning, permitting, engineering and site supervision on TSB managed projects, but
OFFSHORE
OIL & GAS FACILITY
DECOMMISSIONING
OIL & GAS
PROCESSING
EQUIPMENT &
PIPING
SENT TO SHORE
DISPOSED OF IN
DEEP WATER
REFURBISHED
& REUSED
SOLD FOR SCRAP
WASTE TO LANDFILL
ONSHORE
SCRAPPING
MOVED TO NEW
LOCATION &
REINSTALLED
PARTIAL REMOVAL
TOPPLE IN PLACE
SINGLE PIECE
PLACEMENT OFF-
SITE
MULTI-PIECE
PLACEMENT OFF-
SITE
RECYCLE STEEL
WASTE TO LANDFILL
Deck & Jacket
Structure
Convert to an
Artifical Reef
2014 AACE® INTERNATIONAL TECHNICAL PAPER
EST.1648.8 Copyright © AACE® International.
This paper may not be reproduced or republished without expressed written consent from AACE® International
do not include owner/operator overhead or supervision costs. The results of this project management cost assessment are shown in Figure 5. The data indicate a median (P50) project management cost of 8.8% of total project cost. We have historically budgeted for 8% PM cost.
Figure 5 – Probability Distribution Function (PDF) for Project Management Cost (TSB Offshore)
Well Plugging and Abandonment
Well plugging and abandonment (P&A) is often a significant part of the cost of offshore facility decommissioning, depending on the particular facility. This paper will not attempt to deal with this cost in detail since it would require more time and space than is currently available. Nevertheless, we will note the following concerning well P&A:
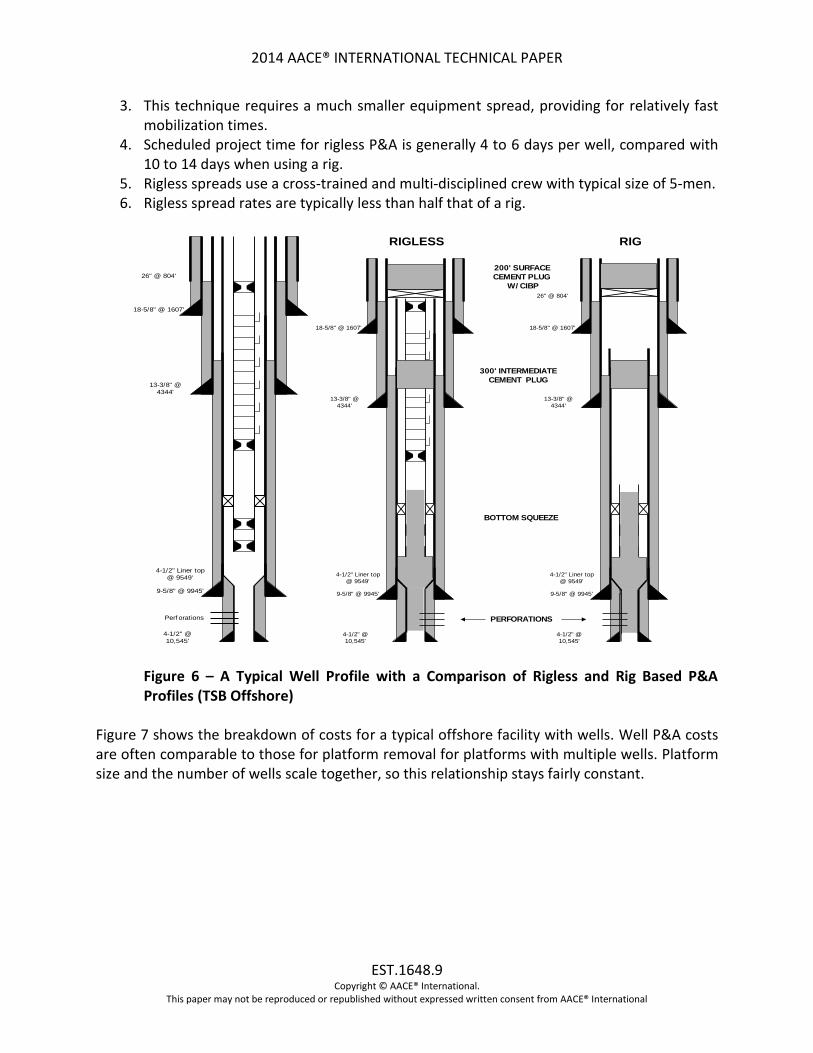
1. Industry practice in the Gulf of Mexico is to use rigless methods, compared with the use of a drilling or work-over rig twenty years ago. Figure 6 shows a typical well profile and a comparison of plugged well profiles using rig and rigless techniques.
2. The rigless approach allows for simultaneous operations on multiple wells (2-4 wells) at one time. This reduces operational downtime, e.g., waiting on cement plugs to cure.
2014 AACE® INTERNATIONAL TECHNICAL PAPER
EST.1648.9 Copyright © AACE® International.
This paper may not be reproduced or republished without expressed written consent from AACE® International
3. This technique requires a much smaller equipment spread, providing for relatively fast mobilization times.
4. Scheduled project time for rigless P&A is generally 4 to 6 days per well, compared with 10 to 14 days when using a rig.
5. Rigless spreads use a cross-trained and multi-disciplined crew with typical size of 5-men. 6. Rigless spread rates are typically less than half that of a rig.
Figure 6 – A Typical Well Profile with a Comparison of Rigless and Rig Based P&A Profiles (TSB Offshore)
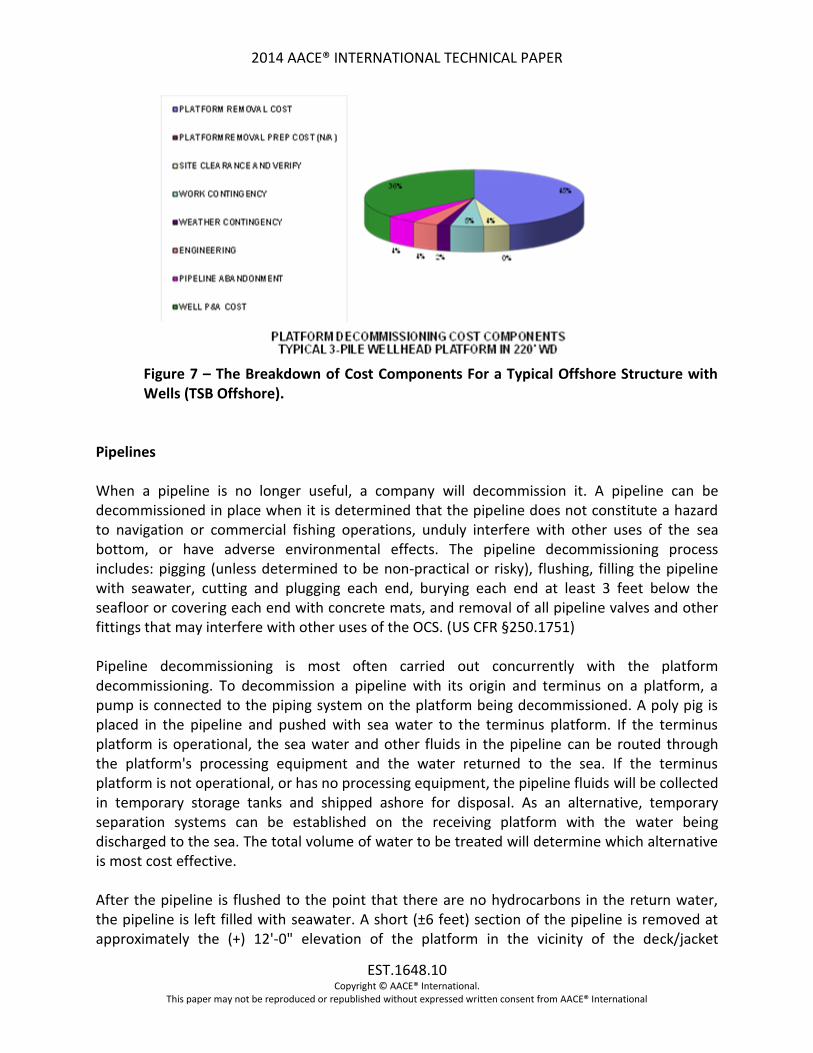
Figure 7 shows the breakdown of costs for a typical offshore facility with wells. Well P&A costs are often comparable to those for platform removal for platforms with multiple wells. Platform size and the number of wells scale together, so this relationship stays fairly constant.
26" @ 804'
18-5/8" @ 1607'
13-3/8" @
4344'
9-5/8" @ 9945'
4-1/2" Liner top
@ 9549'
4-1/2" @
10,545'
Perf orations
18-5/8" @ 1607'
13-3/8" @
4344'
9-5/8" @ 9945'
4-1/2" Liner top
@ 9549'
4-1/2" @
10,545'
26" @ 804'
18-5/8" @ 1607'
13-3/8" @
4344'
9-5/8" @ 9945'
4-1/2" Liner top
@ 9549'
4-1/2" @
10,545'
RIGLESS RIG
300' INTERMEDIATE
CEMENT PLUG
200' SURFACE
CEMENT PLUG
W/ CIBP
BOTTOM SQUEEZE
PERFORATIONS
2014 AACE® INTERNATIONAL TECHNICAL PAPER
EST.1648.10 Copyright © AACE® International.
This paper may not be reproduced or republished without expressed written consent from AACE® International
Figure 7 – The Breakdown of Cost Components For a Typical Offshore Structure with Wells (TSB Offshore).
Pipelines When a pipeline is no longer useful, a company will decommission it. A pipeline can be decommissioned in place when it is determined that the pipeline does not constitute a hazard to navigation or commercial fishing operations, unduly interfere with other uses of the sea bottom, or have adverse environmental effects. The pipeline decommissioning process includes: pigging (unless determined to be non-practical or risky), flushing, filling the pipeline with seawater, cutting and plugging each end, burying each end at least 3 feet below the seafloor or covering each end with concrete mats, and removal of all pipeline valves and other fittings that may interfere with other uses of the OCS. (US CFR §250.1751) Pipeline decommissioning is most often carried out concurrently with the platform decommissioning. To decommission a pipeline with its origin and terminus on a platform, a pump is connected to the piping system on the platform being decommissioned. A poly pig is placed in the pipeline and pushed with sea water to the terminus platform. If the terminus platform is operational, the sea water and other fluids in the pipeline can be routed through the platform's processing equipment and the water returned to the sea. If the terminus platform is not operational, or has no processing equipment, the pipeline fluids will be collected in temporary storage tanks and shipped ashore for disposal. As an alternative, temporary separation systems can be established on the receiving platform with the water being discharged to the sea. The total volume of water to be treated will determine which alternative is most cost effective. After the pipeline is flushed to the point that there are no hydrocarbons in the return water, the pipeline is left filled with seawater. A short (±6 feet) section of the pipeline is removed at approximately the (+) 12'-0" elevation of the platform in the vicinity of the deck/jacket
2014 AACE® INTERNATIONAL TECHNICAL PAPER
EST.1648.11 Copyright © AACE® International.
This paper may not be reproduced or republished without expressed written consent from AACE® International
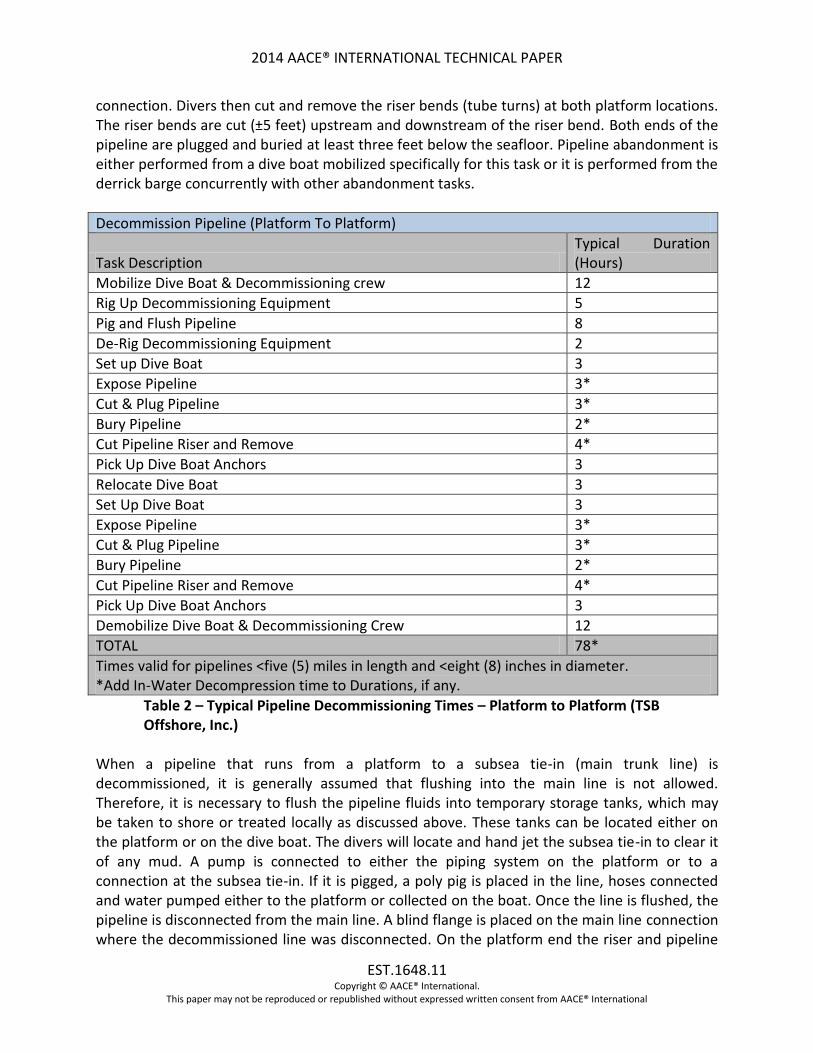
connection. Divers then cut and remove the riser bends (tube turns) at both platform locations. The riser bends are cut (±5 feet) upstream and downstream of the riser bend. Both ends of the pipeline are plugged and buried at least three feet below the seafloor. Pipeline abandonment is either performed from a dive boat mobilized specifically for this task or it is performed from the derrick barge concurrently with other abandonment tasks.
Decommission Pipeline (Platform To Platform)
Task Description Typical Duration (Hours)
Mobilize Dive Boat & Decommissioning crew 12
Rig Up Decommissioning Equipment 5
Pig and Flush Pipeline 8
De-Rig Decommissioning Equipment 2
Set up Dive Boat 3
Expose Pipeline 3*
Cut & Plug Pipeline 3*
Bury Pipeline 2*
Cut Pipeline Riser and Remove 4*
Pick Up Dive Boat Anchors 3
Relocate Dive Boat 3
Set Up Dive Boat 3
Expose Pipeline 3*
Cut & Plug Pipeline 3*
Bury Pipeline 2*
Cut Pipeline Riser and Remove 4*
Pick Up Dive Boat Anchors 3
Demobilize Dive Boat & Decommissioning Crew 12
TOTAL 78*
Times valid for pipelines <five (5) miles in length and <eight (8) inches in diameter. *Add In-Water Decompression time to Durations, if any.
Table 2 – Typical Pipeline Decommissioning Times – Platform to Platform (TSB Offshore, Inc.)
When a pipeline that runs from a platform to a subsea tie-in (main trunk line) is decommissioned, it is generally assumed that flushing into the main line is not allowed. Therefore, it is necessary to flush the pipeline fluids into temporary storage tanks, which may be taken to shore or treated locally as discussed above. These tanks can be located either on the platform or on the dive boat. The divers will locate and hand jet the subsea tie-in to clear it of any mud. A pump is connected to either the piping system on the platform or to a connection at the subsea tie-in. If it is pigged, a poly pig is placed in the line, hoses connected and water pumped either to the platform or collected on the boat. Once the line is flushed, the pipeline is disconnected from the main line. A blind flange is placed on the main line connection where the decommissioned line was disconnected. On the platform end the riser and pipeline

2014 AACE® INTERNATIONAL TECHNICAL PAPER
EST.1648.12 Copyright © AACE® International.
This paper may not be reproduced or republished without expressed written consent from AACE® International
are treated as noted previously. Tables 2 and 3 show the typical task times for platform to platform and platform to subsea tie-in pipeline decommissioning.
Decommission Pipeline (Platform To Subsea Tie-In)
Task Description Typical Duration (Hours)
Mobilize Dive Boat & Decommissioning crew 12
Set Up Dive Boat 3
Locate Subsea Tie-In 6*
Expose Subsea Tie-In 6*
Rig Up Decommissioning Equipment 5
Pig & Flush Pipeline 8
Derig Decommissioning Equipment 2
Plug & Blind Subsea Tie-In (SSTI) 6*
Bury SSTI 2*
Pick Up Dive Boat Anchors 3
Relocate Dive Boat 3
Set Up Dive Boat 3
Expose Pipeline 3*
Cut & Plug Pipeline 3*
Bury Pipeline 2*
Cut Pipeline Riser and Remove 4*
Pick Up Dive Boat Anchors 3
Demobilize Dive Boat & Crew 12
TOTAL 84*
Times valid for pipelines < five (5) miles in length and <eight (8) inches in diameter. *Add In-Water Decompression time to Durations, if any.
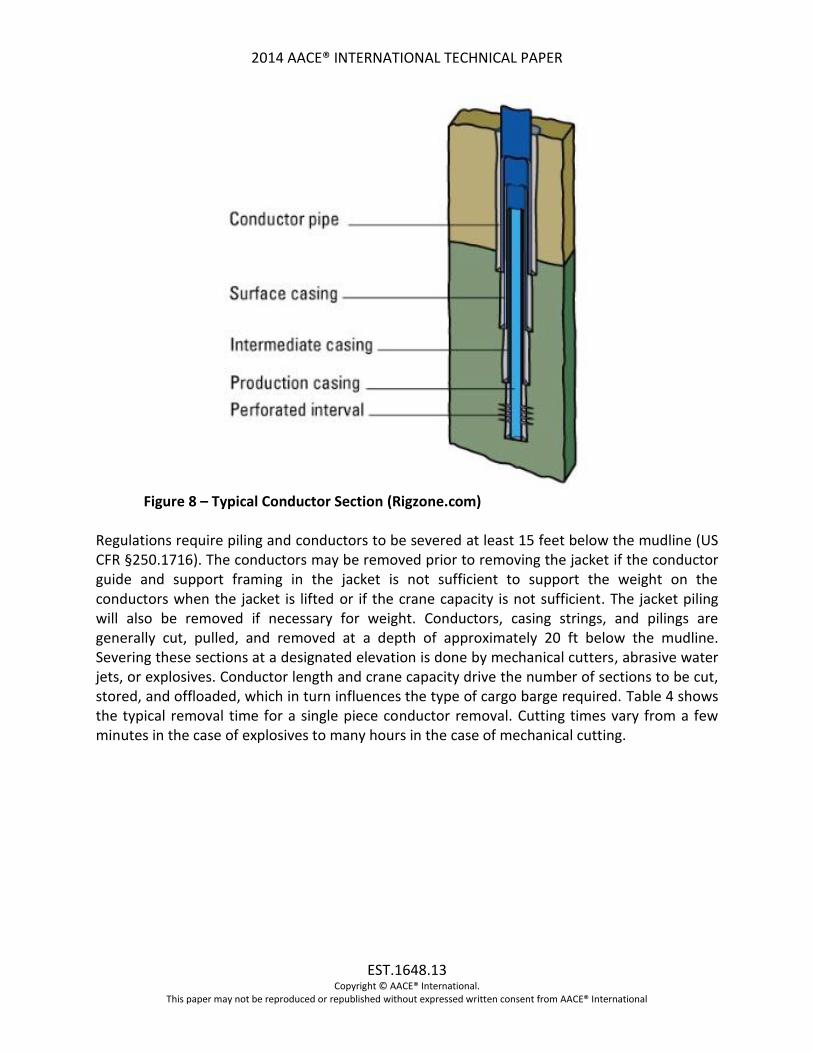
Table 3 – Pipeline Decommissioning Times – Platform to SS Tie-In (TSB Offshore, Inc.) Conductor Removal A conductor pipe is a relatively short, large-diameter pipe driven into the sea floor prior to drilling offshore oil wells. This pipe, also known as a drive pipe, functions as support to the initial sedimentary part of the well, the surface casing. Conductors aid in preventing the looser surface layer from caving in and blocking the wellbore in its initial stage as the casing strings are set. The concentric casing pipes serve as protection for the drilling pipe and well fluids and provides a return path for cuttings from the drill bit. When drilling is completed the casing string provides a path for the well production tubing. These pipes are bonded together with cement grout that is pumped in to the annuli as they are set. Figure 8 shows a typical conductor and casing string for a single-well completion.
2014 AACE® INTERNATIONAL TECHNICAL PAPER
EST.1648.13 Copyright © AACE® International.
This paper may not be reproduced or republished without expressed written consent from AACE® International
Figure 8 – Typical Conductor Section (Rigzone.com)
Regulations require piling and conductors to be severed at least 15 feet below the mudline (US CFR §250.1716). The conductors may be removed prior to removing the jacket if the conductor guide and support framing in the jacket is not sufficient to support the weight on the conductors when the jacket is lifted or if the crane capacity is not sufficient. The jacket piling will also be removed if necessary for weight. Conductors, casing strings, and pilings are generally cut, pulled, and removed at a depth of approximately 20 ft below the mudline. Severing these sections at a designated elevation is done by mechanical cutters, abrasive water jets, or explosives. Conductor length and crane capacity drive the number of sections to be cut, stored, and offloaded, which in turn influences the type of cargo barge required. Table 4 shows the typical removal time for a single piece conductor removal. Cutting times vary from a few minutes in the case of explosives to many hours in the case of mechanical cutting.

2014 AACE® INTERNATIONAL TECHNICAL PAPER
EST.1648.14 Copyright © AACE® International.
This paper may not be reproduced or republished without expressed written consent from AACE® International
Remove Conductors In One Section
Task Description Duration (Hours)
Pin Casing String to Conductor 0.75
Choke Life Sling(s) Around Conductor 0.5
Lift Conductor Free of Jacket 0.5
Revolve Crane to Position Conductor Over Cargo Barge 0.1
Lay Conductor on Cargo Barge 0.25
Disconnect Slings 0.2
TOTAL 2.3
Table 4 – Typical Conductor Removal Times (TSB Offshore, Inc.) Platform Preparation Platform preparation should be completed prior to the mobilization of the derrick barge spread. Preparation is a two-phase operation. Phase I prepares the platform, making it safe for hot work, i.e., burning and welding. Phase II consists of any preparation required to expedite removal of the platform by the derrick barge. To make the platform area safe for hot work, all vessels and piping are drained and flushed with water. All liquids are collected in the sump. From the sump the liquids are pumped into approved tanks for transport ashore and disposal. Typically a crew paid on a day rate prepares a platform for removal after wells are P&A’d. The preparations involve an inspection above and below water to determine the condition of the structure and identify potential problems with the salvage. After the platform is safe, preparation commences. This preparation could include replacing the lifting pad eyes, removing equipment packages, adding any required bracing, cutting the deck in sections, adding new pad eyes, and cutting loose all equipment to be removed by the derrick barge. Decommissioning times vary, depending on the size of the platform and the amount of equipment on it. Deck weight serves as a proxy for the topsides equipment preparation costs that increase as deck weight increases. Table 5 shows the typical platform preparation times for a variety of platform types.

2014 AACE® INTERNATIONAL TECHNICAL PAPER
EST.1648.15 Copyright © AACE® International.
This paper may not be reproduced or republished without expressed written consent from AACE® International
Platform Preparation (Duration In Days)
Platform Type With Equipment (Days)
Auxiliary 4
Auxiliary w/Quarters 4
Caisson 2
Compressor 7
Drill/Production 21
Drilling 7
Facilities 14
Glycol Dehydration 7
Junction 4
LACT 2
LTX 14
Pipe Rack 2
Production 14
Quarters 3
Riser Support 0
Satellite 2
Self-Contained 7
Service 0
Storage 7
Tender 2
Treater 7
Well Protector 2
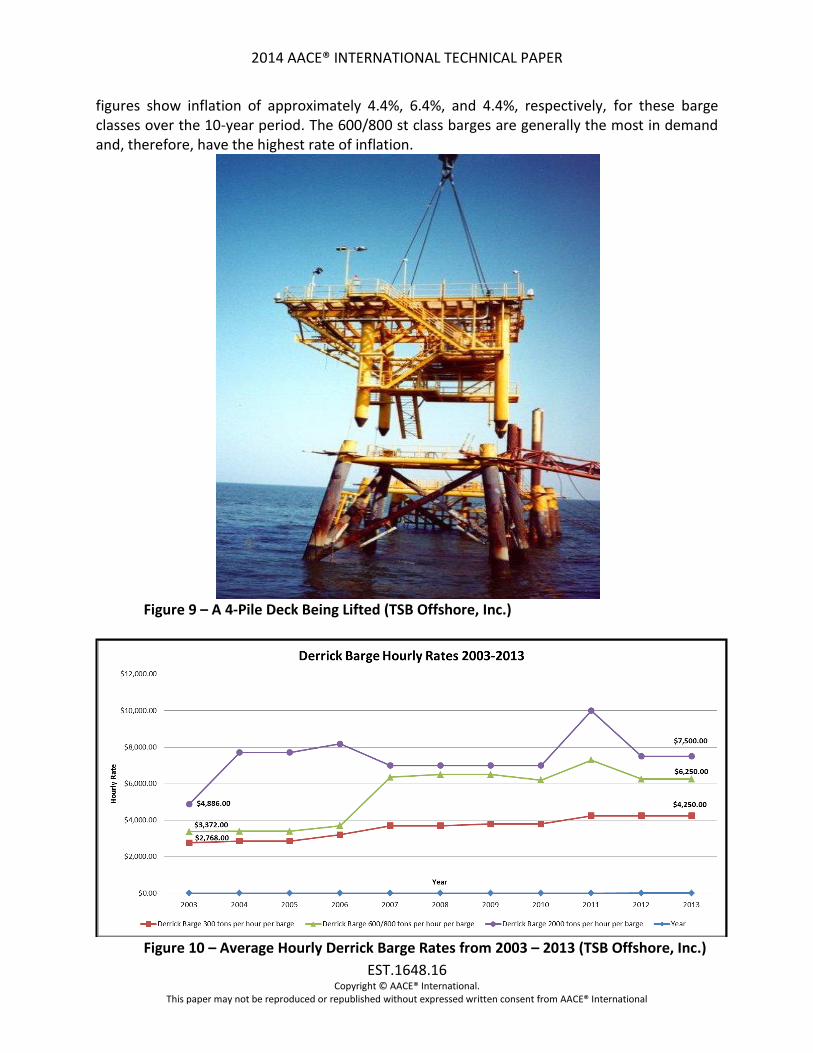
Table 5 – Typical Preparation Times for Various Platform Types (TSB Offshore, Inc.) Topsides Removal Removal of the topside facilities, deck, conductors, piles, and jacket is fundamental in a decommissioning project. Topsides removal follows the installation process more or less in reverse sequence. Modules are removed and placed on a cargo barge and secured by welding sea-fastenings to the deck of the barge. The deck module support structure is removed after cutting the welded connections between the piles and the deck legs. The deck structure is then seated in load spreaders and secured on the cargo barge. Figure 9 shows a 4-pile deck structure being lifted. The primary cost driver in offshore structure removal is the cost of derrick barge services. Figure 10 shows the average hourly derrick barge rates for 2003 to 2013 for three commonly used barge lifting capacity classes in short tons (st): 300 st, 600 to 800 st, and 2000 st. The
2014 AACE® INTERNATIONAL TECHNICAL PAPER
EST.1648.16 Copyright © AACE® International.
This paper may not be reproduced or republished without expressed written consent from AACE® International
figures show inflation of approximately 4.4%, 6.4%, and 4.4%, respectively, for these barge classes over the 10-year period. The 600/800 st class barges are generally the most in demand and, therefore, have the highest rate of inflation.
Figure 9 – A 4-Pile Deck Being Lifted (TSB Offshore, Inc.)
Figure 10 – Average Hourly Derrick Barge Rates from 2003 – 2013 (TSB Offshore, Inc.)

2014 AACE® INTERNATIONAL TECHNICAL PAPER
EST.1648.17 Copyright © AACE® International.
This paper may not be reproduced or republished without expressed written consent from AACE® International
Topside lifting preparation includes: Preparing slings and shackles, connecting slings to the lifting block, connecting shackles to the deck pad eyes, and connecting the tugger-winch lines to the deck legs is done concurrently with cutting the deck leg to pile splices assuming no equipment is removed prior to lifting the deck. If the platform contains equipment that must be removed separately prior to lifting the deck, the time added for removal will depend upon the quantity and size of the equipment, the location from which it will be lifted, and also any special rigging arrangements, such as spreader bars or frames that may be required. The durations shown in Table 6 are commonly used for lifting preparation times.
Equipment weighting less than 20 tons 0.5 hours
Equipment weighting 20 tons – 100 tons 1.0 hours
Equipment weighting 100 tons – 200 tons 2.0 hours
Table 6 – Typical Lifting Times for Miscellaneous Equipment (TSB Offshore, Inc.) The wire slings used to lift the deck are placed on the hook of the derrick barge crane's lifting block and the crane is rotated until the lifting block is positioned over the deck. The block is lowered, slings are connected by the shackles to the pad eyes, and the lifting block is then raised until the deck is lifted clear of the jacket. Times to sea fasten a deck vary (depending on the deck weight and number of legs) from 4 to 18 hours. This work is generally performed concurrently with other tasks and does not add to the critical path in most cases. Table 7 shows the typical removal tasks and times for a 4-pile deck.
4 PILE DECK REMOVAL
Task Description Duration (Hours)
Rig slings to Deck 3.0
Connect Slings to #3 Block 0.3
Connect Tugger Winch Lines to Deck 0.5
Lift Deck 0.3
Rotate to Cargo Barge 0.5
Position Deck Over Load Spreaders 0.5
Lower Deck onto/into Load Spreaders 0.2
Start Sea fastening 3.0
Disconnect and Remove Rigging 1.0
TOTAL 9.3
Table 7 – Typical 4-Pile Deck Removal Tasks and Times (TSB Offshore, Inc.)

2014 AACE® INTERNATIONAL TECHNICAL PAPER
EST.1648.18 Copyright © AACE® International.
This paper may not be reproduced or republished without expressed written consent from AACE® International
Figure 11 – 4-Pile Deck and Jacket on a Cargo Barge (TSB Offshore, Inc.)
Jacket/Substructure Removal The Jacket is a key part of the structure supporting the deck and topsides in a fixed offshore platform. The jacket provides support for the piling which actually carries the weight of the topsides. The height of the jacket is defined by water depth plus about an additional approximately 5 meters above sea level. The structure of the jacket is designed to satisfy multiple constraints: weight of topsides equipment, impact of sea states, wind, currents, corrosion, and fatigue. The jacket also acts to protect conductors and pipelines from the surface to the seabed. Jackets are removed after piles are severed and conductors are severed and in most cases removed. Because jackets vary in weight, height, number of legs, and function, different removal methods must be considered. Jackets are generally removed and taken ashore for disposal.

2014 AACE® INTERNATIONAL TECHNICAL PAPER
EST.1648.19 Copyright © AACE® International.
This paper may not be reproduced or republished without expressed written consent from AACE® International
Figure 12 – Deck Leg Cutting Durations (TSB Offshore, Inc.)
Figure 12 shows the cutting times for deck legs of various diameters. Tables 8 and 9 show the times required to cut jacket members of various diameters underwater and in the air.
Cut Jacket Members Underwater
Member Size (diameter) Duration (Minutes)
<10” 30
12” – 16” 45
18” – 24” 75
Rig & Remove member (each) 60
Table 8 – Typical Jacket Member Cutting & Removal Times – Underwater (TSB Offshore, Inc.)
Cut Jacket Members Topside
Member Size (diameter) Duration (Minutes)
<10” 10
12” – 16” 25
18” – 24” 60
Rig & Remove member (each) 30
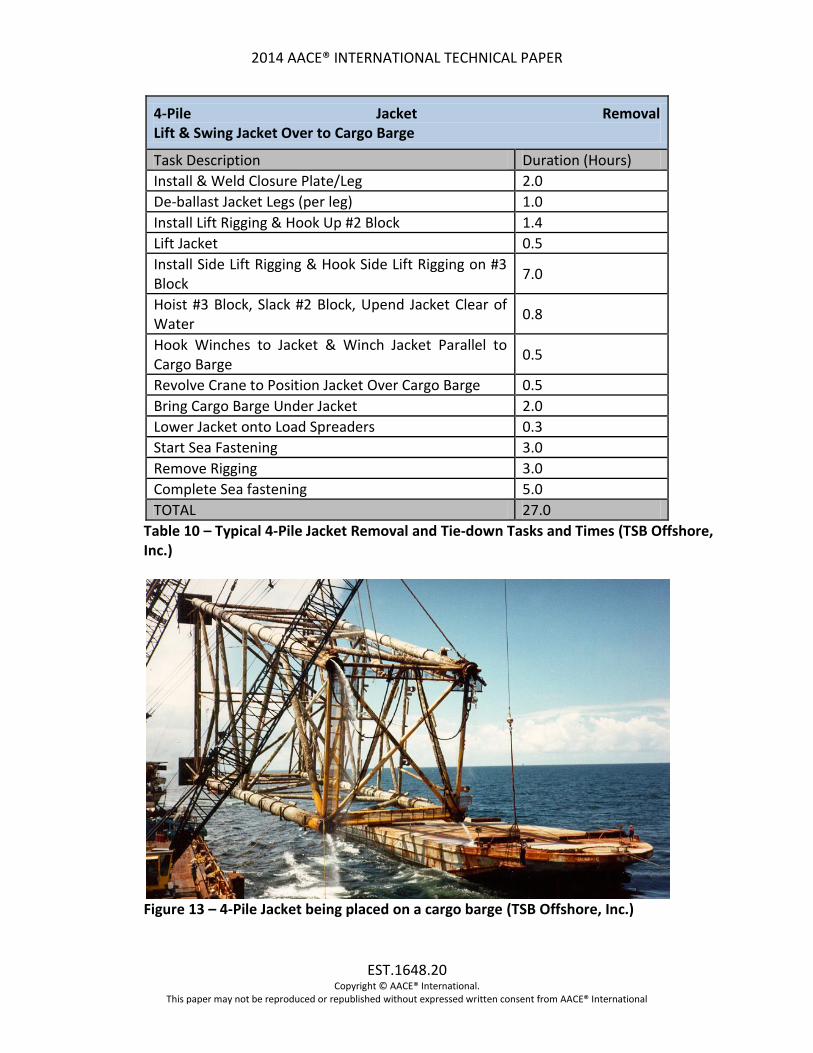
Table 9 – Typical Jacket Member Cutting & Removal Times – In Air (TSB Offshore, Inc.) Table 10 shows the typical removal and tie-down tasks and times for a 4-pile Jacket. Figure 13 shows a 4-pile jacket from approximately 200 ft depth being loaded onto a cargo barge. The pre-installed load spreaders can be seen.
2014 AACE® INTERNATIONAL TECHNICAL PAPER
EST.1648.20 Copyright © AACE® International.
This paper may not be reproduced or republished without expressed written consent from AACE® International
4-Pile Jacket Removal Lift & Swing Jacket Over to Cargo Barge
Task Description Duration (Hours)
Install & Weld Closure Plate/Leg 2.0
De-ballast Jacket Legs (per leg) 1.0
Install Lift Rigging & Hook Up #2 Block 1.4
Lift Jacket 0.5
Install Side Lift Rigging & Hook Side Lift Rigging on #3 Block
7.0
Hoist #3 Block, Slack #2 Block, Upend Jacket Clear of Water
0.8
Hook Winches to Jacket & Winch Jacket Parallel to Cargo Barge
0.5
Revolve Crane to Position Jacket Over Cargo Barge 0.5
Bring Cargo Barge Under Jacket 2.0
Lower Jacket onto Load Spreaders 0.3
Start Sea Fastening 3.0
Remove Rigging 3.0
Complete Sea fastening 5.0
TOTAL 27.0
Table 10 – Typical 4-Pile Jacket Removal and Tie-down Tasks and Times (TSB Offshore, Inc.)
Figure 13 – 4-Pile Jacket being placed on a cargo barge (TSB Offshore, Inc.)
2014 AACE® INTERNATIONAL TECHNICAL PAPER
EST.1648.21 Copyright © AACE® International.
This paper may not be reproduced or republished without expressed written consent from AACE® International
Site Clearance and Verification Site clearance, remediation and verification are the last tasks in decommissioning. Site clearance removes all debris that has accumulated on the seafloor, regardless of its origin. Remediation includes a verification process ensuring that the site is clear. Once the platform removal is completed and the lease is to be terminated, all debris that has accumulated on the bottom during the life of the platform must be removed. This is done by using a bottom scanning sonar to locate the debris. Divers are used to retrieve the debris that can’t be recovered by other means. According to Federal regulations, all decommissioned locations in water depths less than 300 ft must be cleared of all obstructions created by oil and gas activities. In practice all debris from all sources must be removed. For a platform or other facility site in water depths less than 300 feet, a trawl with heavy nets must be dragged over the site. For a platform or other facility site in water depths 300 feet or more, you must either drag a trawl over the site, scan across the site using sonar equipment, or use another approved method. Locations are defined as a 300-ft radius circle centered on the well for exploratory or delineation wells drilled with a mobile offshore drilling unit, or a 1,320-ft radius circle centered on the platform geometric center for platforms. (US CFR §250.1741) Material Disposal As offshore facility decommissioning is practiced in the Gulf of Mexico, material disposal is not a significant cost factor. Therefore, it will not be dealt with in detail in this paper. Common practice is to transfer title to all removed material (decks, equipment, jackets, piles, etc.) to the derrick barge contractor, who then transports it to shore for disposal. Depending on the condition of the material, it may be reconditioned and reused. However, in most cases it is sold for scrape. The contractor may make a small profit on this transaction, but the money involved is generally very small compared to other costs involved with the decommissioning process. This situation may be unique to the Gulf of Mexico where there is well established infrastructure for material disposal. Other areas, such as the US west coast, cannot take material disposal for granted. A Typical 4-Pile Platform Decommissioning Cost Estimate TSB has formalize the cost estimating process by taking many years of experience in the field and developing algorithms for the various tasks involved in decommissioning. This involved interviewing the inspectors and construction superintendents who oversaw hundreds of removals over a number of years. This resulted in what is now called the Platform Abandonment Estimation System (PAES™) database software system. This system produces a complete estimate template that is based on input of the general descriptive information about the facility. This initial estimate can then be customized or fine-tuned by a knowledgeable

2014 AACE® INTERNATIONAL TECHNICAL PAPER
EST.1648.22 Copyright © AACE® International.
This paper may not be reproduced or republished without expressed written consent from AACE® International
estimator. The following is an example of a platform decommissioning cost estimate generated by PAES™. The example platform is a Drilling/Production platform installed in 1975 in 235 feet water depth. Based on the assumed deck and jacket weights, a 2000-ton capacity derrick barge will remove the platform. The deck with equipment and jacket will be loaded onto 240' and 300' cargo barges, respectively, taken to shore and offloaded. The major assumptions for the project are:
1. All work is performed during the summer work season. 2. A weather allowance of 20% is included, consisting of 14% for regular work
season weather and 6% for named tropical storms. 3. Platform, pipeline and well P&A mobilization times are estimated from the
Eugene Island sea buoy. 4. Main piles are severed explosively, thereby requiring the least possible
amount of derrick barge time. 5. Explosives are used in accordance with current BSEE guidelines. 6. Hourly rates for construction and diving spreads were received from offshore
contractors in the 2012 construction season. 7. Pipelines are pigged, flushed, the tube-turns removed, the ends plugged and
buried and abandoned in situ and are considered trouble free lines. 8. Site clearance and verification is in accordance with the current BSEE
requirements. 9. Operator’s internal overhead or other costs including costs for operator's field
representative are not included. 10. The estimates do not include costs for land transportation, dock usage, load-
out cost for vessels, offload costs for vessels other than cargo barges, onshore crane or other charges or third-party management other than engineering and project management.
11. Engineering & Project Management is assumed to be 8% of the total of all other costs.
12. Assumption of risk is not included in this estimate, i.e., the rates are based on a true time and material contract with the operator assuming the risk.
13. A Miscellaneous Work Provision of 15% is included in addition to the itemized derrick barge work. This provision is necessary based on an assessment of a large number of actual removals in the Gulf of Mexico and is not a contingency. It accounts for work that will be performed but that is not itemized in the estimate.
14. A work contingency is not included. 15. The derrick barge contractor takes possession of the facility as-is where-is
upon completion of sea-fastening to the cargo barge, per the material disposal discussion above.
2014 AACE® INTERNATIONAL TECHNICAL PAPER
EST.1648.23 Copyright © AACE® International.
This paper may not be reproduced or republished without expressed written consent from AACE® International
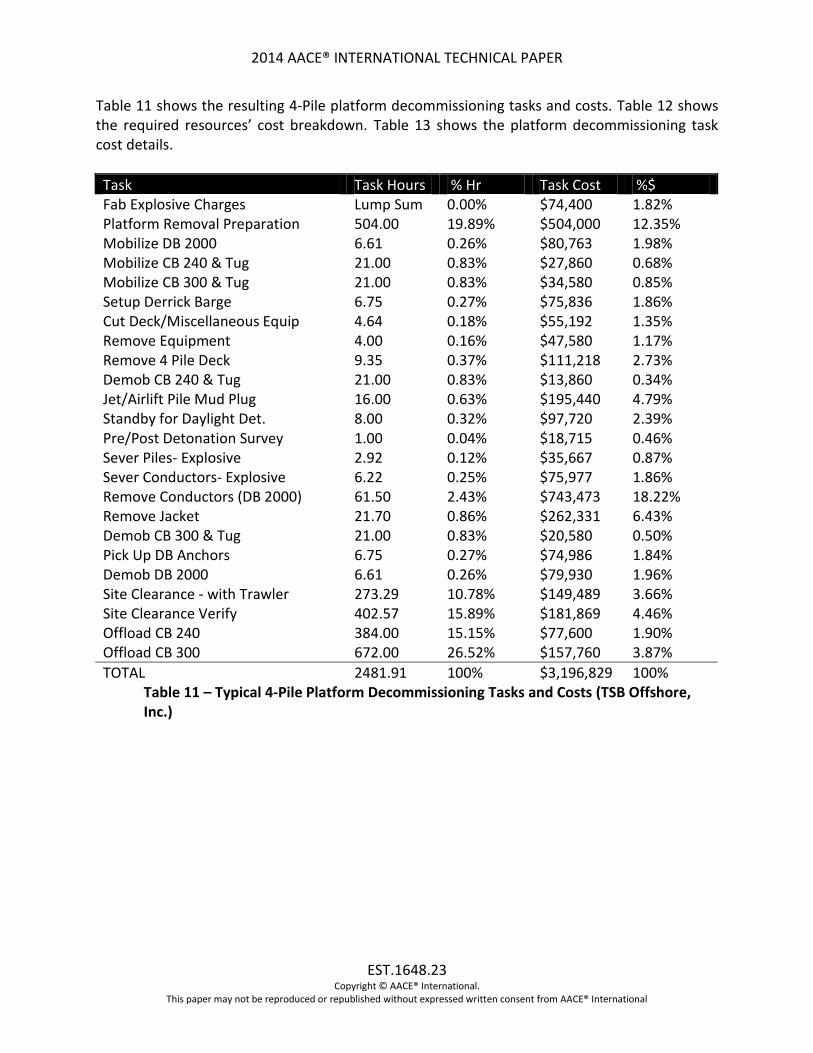
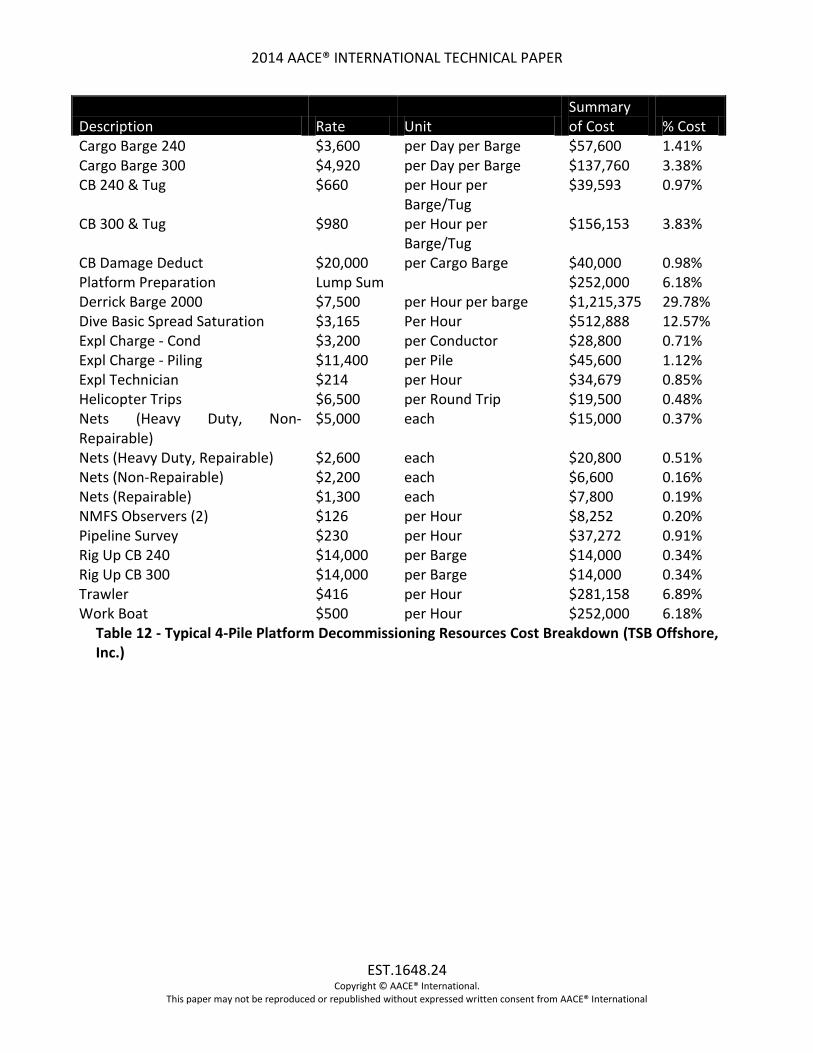
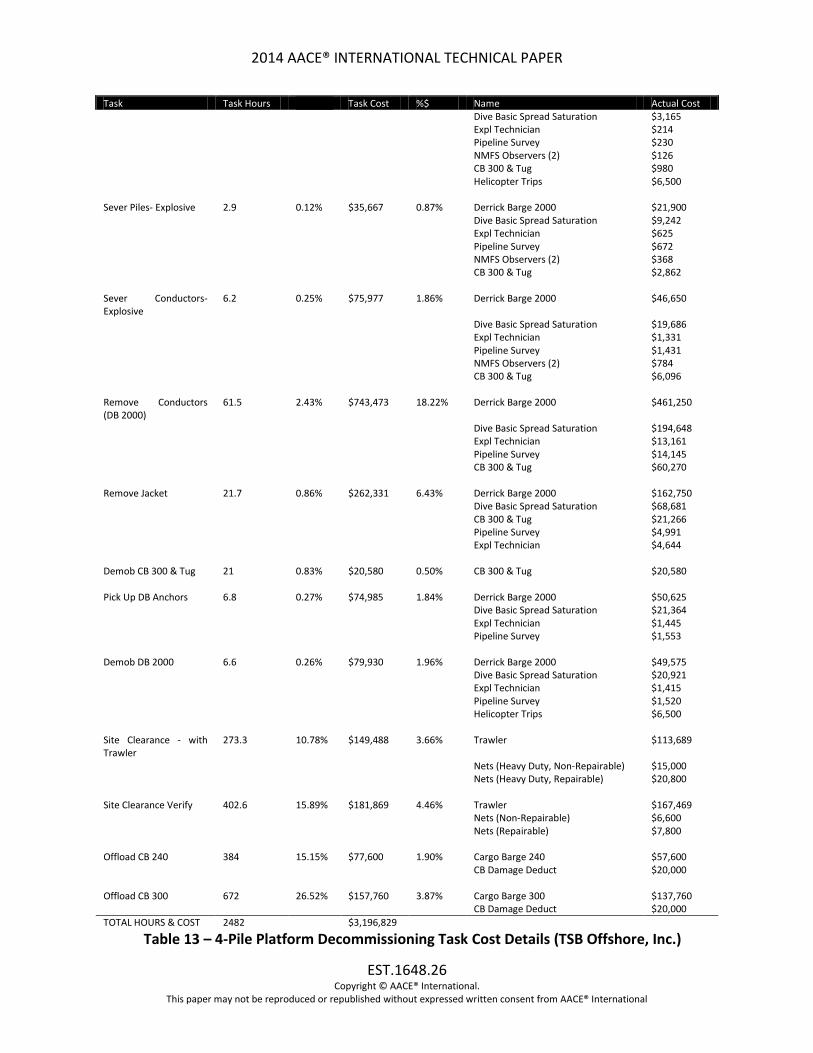
Table 11 shows the resulting 4-Pile platform decommissioning tasks and costs. Table 12 shows the required resources’ cost breakdown. Table 13 shows the platform decommissioning task cost details.
Task Task Hours % Hr Task Cost %$ Fab Explosive Charges Lump Sum 0.00% $74,400 1.82% Platform Removal Preparation 504.00 19.89% $504,000 12.35% Mobilize DB 2000 6.61 0.26% $80,763 1.98% Mobilize CB 240 & Tug 21.00 0.83% $27,860 0.68% Mobilize CB 300 & Tug 21.00 0.83% $34,580 0.85% Setup Derrick Barge 6.75 0.27% $75,836 1.86% Cut Deck/Miscellaneous Equip 4.64 0.18% $55,192 1.35% Remove Equipment 4.00 0.16% $47,580 1.17% Remove 4 Pile Deck 9.35 0.37% $111,218 2.73% Demob CB 240 & Tug 21.00 0.83% $13,860 0.34% Jet/Airlift Pile Mud Plug 16.00 0.63% $195,440 4.79% Standby for Daylight Det. 8.00 0.32% $97,720 2.39% Pre/Post Detonation Survey 1.00 0.04% $18,715 0.46% Sever Piles- Explosive 2.92 0.12% $35,667 0.87% Sever Conductors- Explosive 6.22 0.25% $75,977 1.86% Remove Conductors (DB 2000) 61.50 2.43% $743,473 18.22% Remove Jacket 21.70 0.86% $262,331 6.43% Demob CB 300 & Tug 21.00 0.83% $20,580 0.50% Pick Up DB Anchors 6.75 0.27% $74,986 1.84% Demob DB 2000 6.61 0.26% $79,930 1.96% Site Clearance - with Trawler 273.29 10.78% $149,489 3.66% Site Clearance Verify 402.57 15.89% $181,869 4.46% Offload CB 240 384.00 15.15% $77,600 1.90% Offload CB 300 672.00 26.52% $157,760 3.87%
TOTAL 2481.91 100% $3,196,829 100% Table 11 – Typical 4-Pile Platform Decommissioning Tasks and Costs (TSB Offshore, Inc.)
2014 AACE® INTERNATIONAL TECHNICAL PAPER
EST.1648.24 Copyright © AACE® International.
This paper may not be reproduced or republished without expressed written consent from AACE® International
Description Rate Unit Summary of Cost % Cost
Cargo Barge 240 $3,600 per Day per Barge $57,600 1.41% Cargo Barge 300 $4,920 per Day per Barge $137,760 3.38% CB 240 & Tug $660 per Hour per
Barge/Tug $39,593 0.97%
CB 300 & Tug $980 per Hour per Barge/Tug
$156,153 3.83%
CB Damage Deduct $20,000 per Cargo Barge $40,000 0.98% Platform Preparation Lump Sum $252,000 6.18% Derrick Barge 2000 $7,500 per Hour per barge $1,215,375 29.78% Dive Basic Spread Saturation $3,165 Per Hour $512,888 12.57% Expl Charge - Cond $3,200 per Conductor $28,800 0.71% Expl Charge - Piling $11,400 per Pile $45,600 1.12% Expl Technician $214 per Hour $34,679 0.85% Helicopter Trips $6,500 per Round Trip $19,500 0.48% Nets (Heavy Duty, Non-Repairable)
$5,000 each $15,000 0.37%
Nets (Heavy Duty, Repairable) $2,600 each $20,800 0.51% Nets (Non-Repairable) $2,200 each $6,600 0.16% Nets (Repairable) $1,300 each $7,800 0.19% NMFS Observers (2) $126 per Hour $8,252 0.20% Pipeline Survey $230 per Hour $37,272 0.91% Rig Up CB 240 $14,000 per Barge $14,000 0.34% Rig Up CB 300 $14,000 per Barge $14,000 0.34% Trawler $416 per Hour $281,158 6.89% Work Boat $500 per Hour $252,000 6.18%
Table 12 - Typical 4-Pile Platform Decommissioning Resources Cost Breakdown (TSB Offshore, Inc.)

2014 AACE® INTERNATIONAL TECHNICAL PAPER
EST.1648.25 Copyright © AACE® International.
This paper may not be reproduced or republished without expressed written consent from AACE® International
Task Task Hours Task Cost %$ Name Actual Cost Fab Explosive Charges Lump Sum 0.00% $74,400 1.82% Expl Charge - Piling $45,600 Expl Charge - Cond $28,800 Platform Preparation 504 19.89% $504,000 12.35% Platform Prep $252,000 Work Boat $252,000 Mobilize DB 2000 6.6 0.26% $80,763 1.98% Derrick Barge 2000 $49,575 Dive Basic Spread Saturation $20,921 Expl Technician $1,415 Pipeline Survey $1,520 Helicopter Trips $6,500 NMFS Observers (2) $833 Mobilize CB 240 & Tug 21 0.83% $27,860 0.68% CB 240 & Tug $13,860 Rig Up CB 240 $14,000 Mobilize CB 300 & Tug 21 0.83% $34,580 0.85% CB 300 & Tug $20,580 Rig Up CB 300 $14,000 Setup Derrick Barge 6.8 0.27% $75,836 1.86% Derrick Barge 2000 $50,625 Dive Basic Spread Saturation $21,364 Expl Technician $1,445 Pipeline Survey $1,553 NMFS Observers (2) $851 Cut Deck/Equip/Misc 4.6 0.18% $55,193 1.35% Derrick Barge 2000 $34,800 Dive Basic Spread Saturation $14,686 Expl Technician $993 Pipeline Survey $1,067 NMFS Observers (2) $585 CB 240 & Tug $3,062 Remove Equipment 4 0.16% $47,580 1.17% Derrick Barge 2000 $30,000 Dive Basic Spread Saturation $12,660 Expl Technician $856 Pipeline Survey $920 NMFS Observers (2) $504 CB 240 & Tug $2,640 Remove 4 Pile Deck 9.4 0.37% $111,218 2.73% Derrick Barge 2000 $70,125 Dive Basic Spread Saturation $29,593 Expl Technician $2,001 Pipeline Survey $2,151 NMFS Observers (2) $1,178 CB 240 & Tug $6,171 Demob CB 240 & Tug 21 0.83% $13,860 0.34% CB 240 & Tug $13,860 Jet/Airlift Pile Mud Plug 16 0.63% $195,440 4.79% Derrick Barge 2000 $120,000 Dive Basic Spread Saturation $50,640 Expl Technician $3,424 Pipeline Survey $3,680 NMFS Observers (2) $2,016 CB 300 & Tug $15,680 Standby for Daylight Det.
8 0.32% $97,720 2.39% Derrick Barge 2000 $60,000
Dive Basic Spread Saturation $25,320 Expl Technician $1,712 Pipeline Survey $1,840 NMFS Observers (2) $1,008 CB 300 & Tug $7,840 Pre/Post Detonation Survey
1 0.04% $18,715 0.46% Derrick Barge 2000 $7,500
2014 AACE® INTERNATIONAL TECHNICAL PAPER
EST.1648.26 Copyright © AACE® International.
This paper may not be reproduced or republished without expressed written consent from AACE® International
Task Task Hours Task Cost %$ Name Actual Cost Dive Basic Spread Saturation $3,165 Expl Technician $214 Pipeline Survey $230 NMFS Observers (2) $126 CB 300 & Tug $980 Helicopter Trips $6,500 Sever Piles- Explosive 2.9 0.12% $35,667 0.87% Derrick Barge 2000 $21,900 Dive Basic Spread Saturation $9,242 Expl Technician $625 Pipeline Survey $672 NMFS Observers (2) $368 CB 300 & Tug $2,862 Sever Conductors- Explosive
6.2 0.25% $75,977 1.86% Derrick Barge 2000 $46,650
Dive Basic Spread Saturation $19,686 Expl Technician $1,331 Pipeline Survey $1,431 NMFS Observers (2) $784 CB 300 & Tug $6,096 Remove Conductors (DB 2000)
61.5 2.43% $743,473 18.22% Derrick Barge 2000 $461,250
Dive Basic Spread Saturation $194,648 Expl Technician $13,161 Pipeline Survey $14,145 CB 300 & Tug $60,270 Remove Jacket 21.7 0.86% $262,331 6.43% Derrick Barge 2000 $162,750 Dive Basic Spread Saturation $68,681 CB 300 & Tug $21,266 Pipeline Survey $4,991 Expl Technician $4,644 Demob CB 300 & Tug 21 0.83% $20,580 0.50% CB 300 & Tug $20,580 Pick Up DB Anchors 6.8 0.27% $74,985 1.84% Derrick Barge 2000 $50,625 Dive Basic Spread Saturation $21,364 Expl Technician $1,445 Pipeline Survey $1,553 Demob DB 2000 6.6 0.26% $79,930 1.96% Derrick Barge 2000 $49,575 Dive Basic Spread Saturation $20,921 Expl Technician $1,415 Pipeline Survey $1,520 Helicopter Trips $6,500 Site Clearance - with Trawler
273.3 10.78% $149,488 3.66% Trawler $113,689
Nets (Heavy Duty, Non-Repairable) $15,000 Nets (Heavy Duty, Repairable) $20,800 Site Clearance Verify 402.6 15.89% $181,869 4.46% Trawler $167,469 Nets (Non-Repairable) $6,600 Nets (Repairable) $7,800 Offload CB 240 384 15.15% $77,600 1.90% Cargo Barge 240 $57,600 CB Damage Deduct $20,000 Offload CB 300 672 26.52% $157,760 3.87% Cargo Barge 300 $137,760 CB Damage Deduct $20,000
TOTAL HOURS & COST 2482 $3,196,829
Table 13 – 4-Pile Platform Decommissioning Task Cost Details (TSB Offshore, Inc.)
2014 AACE® INTERNATIONAL TECHNICAL PAPER
EST.1648.27 Copyright © AACE® International.
This paper may not be reproduced or republished without expressed written consent from AACE® International
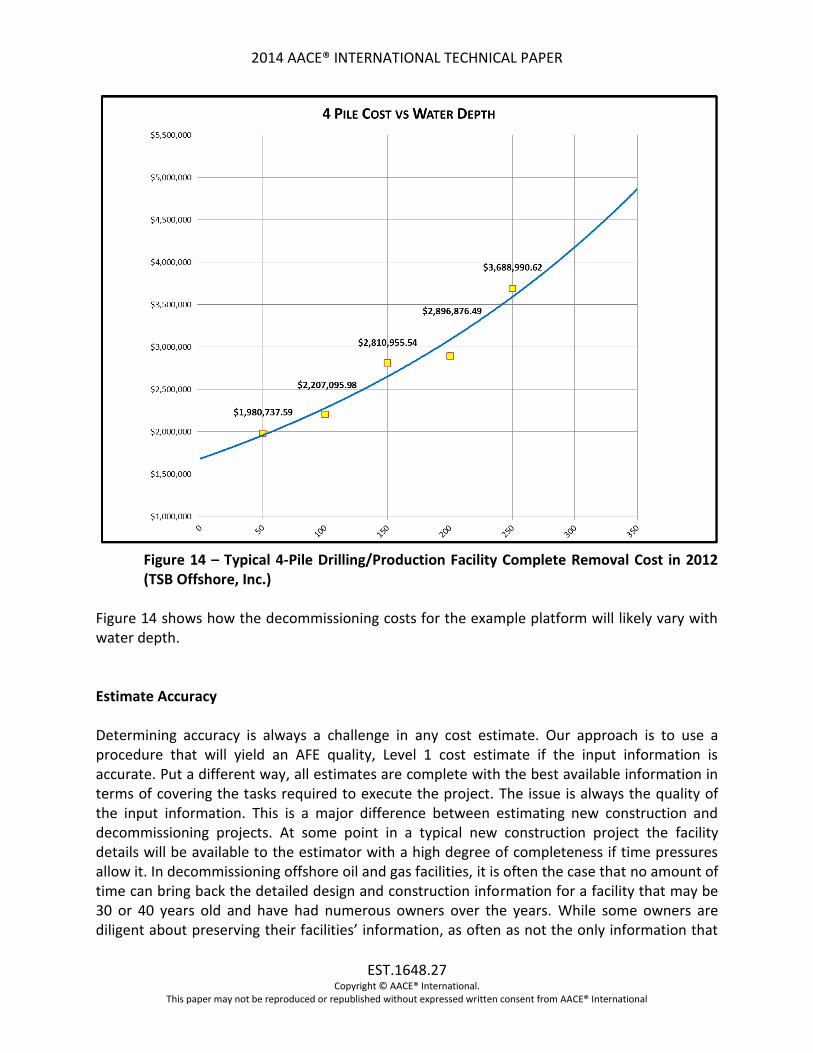
Figure 14 – Typical 4-Pile Drilling/Production Facility Complete Removal Cost in 2012 (TSB Offshore, Inc.)
Figure 14 shows how the decommissioning costs for the example platform will likely vary with water depth. Estimate Accuracy Determining accuracy is always a challenge in any cost estimate. Our approach is to use a procedure that will yield an AFE quality, Level 1 cost estimate if the input information is accurate. Put a different way, all estimates are complete with the best available information in terms of covering the tasks required to execute the project. The issue is always the quality of the input information. This is a major difference between estimating new construction and decommissioning projects. At some point in a typical new construction project the facility details will be available to the estimator with a high degree of completeness if time pressures allow it. In decommissioning offshore oil and gas facilities, it is often the case that no amount of time can bring back the detailed design and construction information for a facility that may be 30 or 40 years old and have had numerous owners over the years. While some owners are diligent about preserving their facilities’ information, as often as not the only information that
2014 AACE® INTERNATIONAL TECHNICAL PAPER
EST.1648.28 Copyright © AACE® International.
This paper may not be reproduced or republished without expressed written consent from AACE® International
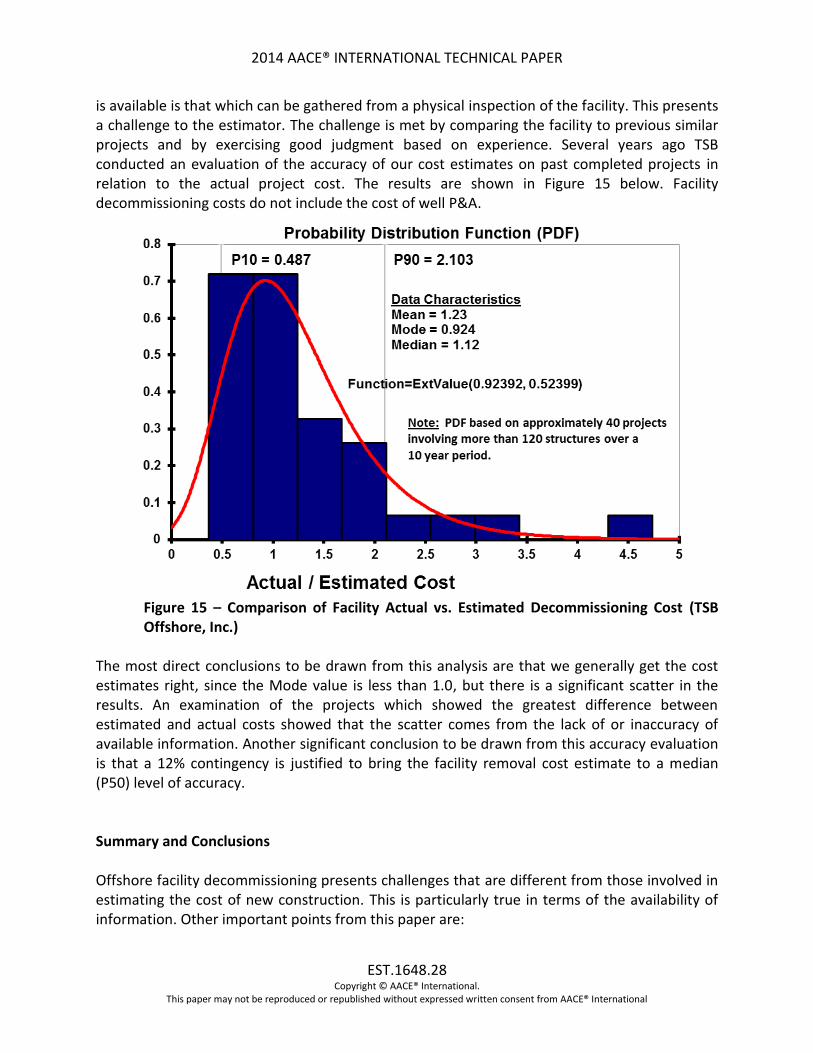
is available is that which can be gathered from a physical inspection of the facility. This presents a challenge to the estimator. The challenge is met by comparing the facility to previous similar projects and by exercising good judgment based on experience. Several years ago TSB conducted an evaluation of the accuracy of our cost estimates on past completed projects in relation to the actual project cost. The results are shown in Figure 15 below. Facility decommissioning costs do not include the cost of well P&A.
Figure 15 – Comparison of Facility Actual vs. Estimated Decommissioning Cost (TSB Offshore, Inc.)
The most direct conclusions to be drawn from this analysis are that we generally get the cost estimates right, since the Mode value is less than 1.0, but there is a significant scatter in the results. An examination of the projects which showed the greatest difference between estimated and actual costs showed that the scatter comes from the lack of or inaccuracy of available information. Another significant conclusion to be drawn from this accuracy evaluation is that a 12% contingency is justified to bring the facility removal cost estimate to a median (P50) level of accuracy. Summary and Conclusions Offshore facility decommissioning presents challenges that are different from those involved in estimating the cost of new construction. This is particularly true in terms of the availability of information. Other important points from this paper are:
2014 AACE® INTERNATIONAL TECHNICAL PAPER
EST.1648.29 Copyright © AACE® International.
This paper may not be reproduced or republished without expressed written consent from AACE® International
The historical performance of decommissioning tasks form useful guidelines in developing the estimated cost of future projects. A number of examples are provided.
Project Management and Engineering costs of 8.8% can be justified from historical averages from over 50 projects
A project contingency of 12% can be justified from an evaluation of actual versus estimated costs facility removals.
Facility decommissioning costs can be estimated accurately. References 1. Financial Accounting Standards Board. Statement of Financial Accounting Standards No.
143. Accounting for Asset Retirement Obligations. Norwalk, CT: Financial Accounting Standards Board (2001)
2. US Code of Federal Regulations, Section 250.
Dr. Robert C. Byrd, PE
TSB Offshore, Inc. [email protected]
Donald J. Miller,
TSB Offshore, Inc. [email protected]

2014 AACE® INTERNATIONAL TECHNICAL PAPER
EST.1648.30 Copyright © AACE® International.
This paper may not be reproduced or republished without expressed written consent from AACE® International
Steven M. Wiese TSB Offshore, Inc.