Embed Size (px)
Citation preview
REV.2.02 Final September 30, 2005
COST ESTIMATING GUIDELINES FOR GENERATION IV NUCLEAR ENERGY SYSTEMS
09/30/2005
- 2 -
ECONOMIC MODELING WORKING GROUP (EMWG)
MEMBERS OF EMWG
William Rasin, Chairman, Consultant, United States Kazunori Hirao, co-Chairman, JNC, Japan
Evelyne Bertel, Technical Secretariat, OECD Nuclear Energy Agency Pierre Berbey, EDF, France
Romney Duffey, AECL, Canada Hussein Khalil, Argonne National Laboratory, United States
Izumi Kinoshita, CRIEPI, Japan ManKi Lee, KAERI, Republic of Korea
François-Luc Linet, CEA, France Keith Miller, BNFL, United Kingdom
Eugene Onopko, Consultant, United States Geoffrey Rothwell, Stanford University, United States
Jean-Loup Rouyer, EDF, France Risto Tarjanne, Lapeenranta University of Technology, Euratom
Kent Williams, Oak Ridge National Laboratory, United States
09/30/2005
- 3 -
FOREWORD
In March of 2003, the U.S. DOE Nuclear Energy Research Advisory Committee and the Generation IV International Forum (GIF) published A Technology Roadmap for Generation IV Nuclear Energy Systems. This Roadmap described the research and development needed to have new safe, economic, and reliable nuclear energy systems available for deployment before the year 2030. Among the many research and development tasks identified was the need for models and methods for economic analysis of those advanced nuclear energy systems under consideration. The needed research and development was called out in the Roadmap and further defined in supporting documents produced by the Evaluation Methodology Group and the Economic Crosscut Group.
An Economic Modeling Working Group (EMWG) was established by the GIF in 2003 to create
economic models and guidelines to facilitate future evaluations of the Generation IV nuclear energy systems and assess progress toward the GIF economic goals. Members of the EMWG are appointed and supported by the individual GIF countries and work under the general guidance of the GIF Experts Group.
This report is a key element of the EMWG work to create an Integrated Nuclear Energy Economic
Model for application to Generation IV Nuclear Energy Systems. It is intended to be a living document that will be updated numerous times over the next several years to: further refine the different cost models; broaden the coverage of the economic assessment tools to energy products other than electricity, including hydrogen; and include an analysis of the economic impacts of plant size and modularity. Accompanying software, used in conjunction with these Guidelines will facilitate consistent, comprehensible cost estimates for evaluation of the Generation IV Nuclear Energy Systems with respect to the established economic goals.
The Executive Summary and Introduction should serve as information for the GIF Policy and
Experts Groups to initiate costs estimates at the appropriate times. The body of the Guidelines, along with the accompanying software, provides the information and guidance necessary for the system development teams to perform the requested cost estimates and to assess their progress toward the Generation IV economic goals.
09/30/2005
- 4 -
TABLE OF CONTENTS
Abstract ....................................................................................................................................... 8 Executive Summary ...................................................................................................................... 9 References ................................................................................................................................. 12 1. Introduction ...................................................................................................................... 13 1.1 Purpose of Cost Estimating Guidelines ............................................................................... 13 1.2 Differences from Previous Guidelines.................................................................................. 14 1.3 Relationship between the Present Guidelines and the Overall EMWG Modeling Effort .......... 16 1.4 Definition of Cost Estimating Terms .................................................................................. 17 1.5 The GIF Code Of Account (COA) ...................................................................................... 26 References ................................................................................................................................. 31 2. Structure of an Integrated Nuclear Energy Economic Model ................................................ 32 2.1 Flow Diagram for an Integrated Nuclear Energy Economic Model ....................................... 32 2.2 Top-down Versus Bottom-up Cost Estimating..................................................................... 34 2.3 Integration of Cost Estimating into the Design Process ........................................................ 35 2.4 Figures of Merit of Interest in these Guidelines ................................................................... 35 References ................................................................................................................................. 36 3. Estimating Categories for RD&D Costs .............................................................................. 38 3.1 Rationale for Selection of Categories for Estimation ............................................................ 38 3.2 Comprehensive COA for RD&D Activities......................................................................... 38 4. General Ground Rules and Assumptions ............................................................................. 42 4.1 Introduction ...................................................................................................................... 42 4.2 Project Execution .............................................................................................................. 42 4.3 Commercialization Plan..................................................................................................... 42 4.4 Estimate Components ........................................................................................................ 43 4.5 Project Code of Accounts (COA) ....................................................................................... 43 4.6 Project Scope and Definition .............................................................................................. 44 4.7 Inclusions/Exclusions/Qualifications .................................................................................. 45 4.8 Project Estimate ................................................................................................................ 45 4.9 Region and Site Definition ................................................................................................. 48 4.10 FOAK Plant ...................................................................................................................... 48 4.11 NOAK Plant ..................................................................................................................... 49 4.12 Estimate Reporting Format ................................................................................................ 49 4.13 Estimate Validation ........................................................................................................... 50 5. Guidance for Cost Estimates Prepared by the Top-down Approach… .. ……………………… 65 5.1 Cost Modeling Needs for Innovative System Designers ....................................................... 65 5.2 Top-down Modeling Principles .......................................................................................... 65 5.3 Use of Top-down Modeling for Generation IV Systems ....................................................... 70 References ................................................................................................................................. 78 6. Guidance for Cost Estimates Prepared By the Bottom-up Approach…... …………………….. 80 6.1 Cost Categories................................................................................................................. 80
09/30/2005
- 5 -
6.2 General Ground Rules ....................................................................................................... 81 6.3 Specific Cost Estimating Assumptions................................................................................ 81 6.4 Construction Costs ............................................................................................................ 82 6.5 Other Capital Cost Components ......................................................................................... 84 6.6 Annual O&M Costs........................................................................................................... 84 6.7 LUEC Calculations ........................................................................................................... 84 6.8 Power Plant Detailed Bottom-up Estimating Notes .............................................................. 84 6.9 Discipline Notes for Scope/Quantity Development .............................................................. 85 6.10 Other Plants ...................................................................................................................... 87 6.11 Dedicated Fabrication Facility............................................................................................ 88 6.12 Fuel Fabrication Plant........................................................................................................ 88 6.13 Fuel Reprocessing Plant..................................................................................................... 88 References ................................................................................................................................. 88 7. Total Capital at Risk ...…………………………………………………………………………. 89 7.1 Cash Flow ........................................................................................................................ 89 7.2 Interest During Construction (IDC) .................................................................................... 89 7.3 Contingency ..................................................................................................................... 90 7.4 Total Capital Investment Cost ............................................................................................ 91 7.5 Capital Cost Component of the LUEC ................................................................................ 92 References ................................................................................................................................. 93 8. Fuel Cycle Costs ……………………………………………………………………. ............. . 94 8.1 Introduction ...................................................................................................................... 94 8.2 Costing of Commercially Available Fuel Cycle Services and Materials ................................. 95 8.3 Costing of Fuel Cycle Services and Materials Not Available Commercially .......................... 97 References ................................................................................................................................. 98 9. Calculation of the LUEC ................................................................................................... 99 9.1 Levelized Unit Electricity Costs ......................................................................................... 99 9.2 O&M Costs ...................................................................................................................... 99 9.3 D&D Costs ..................................................................................................................... 103 References ............................................................................................................................... 105 10. Calculation of unit costs for non-electricity end products (to be added later)........................ 106 11. Cost estimation for factory-produced reactor modules (to be added later) ........................... . 108 Abbreviations, Acronyms and Equation Symbols ........................................................................ 110 Appendix A. Contingency in Nuclear Energy Systems Cost Estimating........................................ 113 Appendix B. A Costing Process for Advanced Reactor Design .................................................... 122 Appendix C. Site-related Engineering and Management Tasks..................................................... 123 Appendix D. Siting Parameters .................................................................................................. 124 Appendix E. Estimating FOAK to NOAK Capital Costs.............................................................. 126 Appendix F. GIF Code of Accounts Dictionary .......................................................................... 129
09/30/2005
- 6 -
List of Tables Table 1.1 Comparison of cost estimating guidelines for ORNL (1993) and Generation IV............ 15 Table 1.2 GIF power generation plant COA .............................................................................. 28 Table 1.3 Structure of the GIF nuclear fuel cycle COA .............................................................. 29 Table 1.4 Structure of the GIF O&M COA................................................................................ 30 Table 3.1 GIF COA for RD&D support activities ...................................................................... 39 Table 4.1 2001 composite labor crews and costs (USA) ............................................................. 51 Table 4.2 2001 composite labor crews and costs (Europe) ........................................................... 51 Table 4.3 2001 composite labor crews and costs (Asia) ............................................................... 52 Table 4.4 2001 Bulk commodity pricing (USA).......................................................................... 53 Table 4.5 2001 Bulk commodity pricing (Europe) ...................................................................... 54 Table 4.6 2001 Bulk commodity pricing (Asia) .......................................................................... 55 Table 4.7 Bulk commodity unit hour installation rates (USA) ...................................................... 56 Table 4.8 Bulk commodity unit hour installation rates (Europe)................................................... 57 Table 4.9 Bulk commodity unit hour installation rates (Asia) ...................................................... 58 Table 4.10 Commodity definition ................................................................................................ 59 Table 4.11 Escalation adjustment factors ..................................................................................... 60 Table 4.12 Estimate reporting format ........................................................................................... 60 Table 4.13 1970’s LWR US Experience Data Single Unit Plant 588 MWe BWR, Fuel Load 2/74 .. 61 Table 4.14 1970’s LWR US Experience Data Unit 1 of 2 - 1086 MWe BWR, Fuel Load 7/82........ 61 Table 4.15 1970’s LWR US Experience Data Unit 2 of 2, 1086 MWe BWR, Fuel Load 3/84 ......... 62 Table 4.16 1970’s LWR US Experience Data Common for 2 x 1086 MWe BWR, Fuel Load 3/84 . 62 Table 4.17 1970’s LWR US Experience Data Two units and Common 2 x 1086 MWe BWR, Fuel Load 7/82 & 3/84 .............................................. 63 Table 4.18 1970’s LWR US Experience Data 8 units 8 821 MWe LWR ....................................... 63 Table 4.19 1970’s LWR US Experience Data Building Data ........................................................ 64 Table 5.1 Example reference plant data utilization ..................................................................... 73 Table 5.2 Sample reference plant – Data utilization ................................................................... 74 Table 5.3 Sample reference plant – Cost factor development ...................................................... 74 Table 5.4 Sample subject plant – Subject plant estimate ............................................................. 75 Table 5.5 Sample subject plant estimate – Modularized plant cost development........................... 75 Table 7.1 Total Capital Cost Estimate Reporting Format ............................................................ 92 Table 8.1 Expected range of unit costs for uranium and fuel cycle services.................................. 97 Table 9.1 Annualized O&M COA description ......................................................................... 100 Table 9.2 Annual O&M cost format for multi-unit plants ......................................................... 101 Table 9.3 On-site staff requirements ....................................................................................... 102 Table 9.4 Annual insurance premiums for medium-size advanced nuclear plants ....................... 103 Table A.1 Comparison of AAEC and EPRI cost estimate categories .......................................... 113 Table A.2 Medians, means and standard deviations for lognormal estimates............................... 116 Table F.1 Comparison of COA structure for reactor and non-reactor facilities ........................... 143 Table F.2 Estimate reporting format ........................................................................................ 146 List of Figures Figure ES.1 Structure of the proposed integrated nuclear energy economic model (INEEM).............. 9 Figure 1.1 Temporal relationships of RD&D, deployment and standard plant costs ......................... 26 Figure 2.1 Structure of the proposed INEEM ................................................................................ 32 Figure 2.2 Structure and logic of the design, construction and production cost parts of the model..... 33 Figure 2.3 Structure and logic of the fuel cycle part of the model................................................... 33
09/30/2005
- 7 -
Figure 5.1 Schematic diagram of simplified top-down estimating process....................................... 68 Figure A.1 Cost estimate with a normal distribution .................................................................... 114 Figure A.2 Lognormal densities for three project stage estimates ................................................. 115 Figure A.3 Lognormal cumulative distributions for three project stage estimates........................... 116
09/30/2005
- 8 -
COST ESTIMATING GUIDELINES FOR GENERATION IV NUCLEAR ENERGY SYSTEMS
ABSTRACT
The economic goals of Generation IV nuclear energy systems, as adopted by the Generation IV International Forum (GIF), are:
• to have a life-cycle cost advantage over other energy sources, i.e., to have a lower levelized unit cost of energy on average over their lifetime; and
• to have a level of financial risk comparable to other energy projects, i.e., to involve similar total capital investment and capital at risk.
The Economics Crosscut Group of the Generation IV Roadmap Project recommended that a
standardized cost estimating protocol should be developed to provide decision makers with a credible basis to assess, compare, and eventually select future nuclear energy systems taking into account a robust evaluation of their economic viability. The GIF accepted this recommendation and established the Economic Modeling Working Group (EMWG) to develop this protocol.
This document provides a uniform set of assumptions, a uniform Code Of Accounts (COA), cost-
estimating ground rules, and estimating requirements to be used in developing cost estimates for advanced nuclear energy systems. It discusses the development of all relevant life cycle costs for Generation IV systems, including the planning, research, development, demonstration (including prototype), deployment, and commercial stages.
Software models will accompany this document. The combination of the software and Guidelines
will facilitate the development of consistent, comprehensible cost estimates to be performed by the system development teams as requested by the GIF Policy and Experts Groups.
The Levelized Unit of Energy Cost (LUEC) that is evaluated includes design, construction,
commissioning, operations and maintenance, fuel cycle, and decommissioning costs for the First-Of-A-Kind (FOAK) through Nth-Of-A-Kind (NOAK) commercial units. It is expected that system development teams (System Steering Committees) will provide feedback to the EMWG on these cost estimating guidelines and consult as needed with the EMWG when preparing cost and schedule estimates.
09/30/2005
- 9 -
EXECUTIVE SUMMARY
This document describes the structure of an integrated economic model for Generation IV nuclear energy systems. It will be accompanied by software implementing the guidelines and models. This model will be a tool for integrating cost information prepared by Generation IV system development teams during the development and demonstration of their concept, thus assuring a standard format and comparability among concepts. This methodology will allow the Generation IV International Forum (GIF) Experts Group to give an overview to policy makers and system development teams on the status of current economic estimates for each system and the relative status of the different systems with respect to the Generation IV economic goals. The Executive Summary and Chapter 1 – Introduction – should be useful to the Experts and Policy Groups in understanding and commissioning system cost estimates. The remainder of the document provides detailed information and processes to guide the system development teams in performing consistent cost estimates. Interaction with the EMWG could also help designers compare design options within a given concept, find the optimal design options, and guide their research, development, and demonstration (RD&D) program to solve those problems with the most economic impact on life cycle costs.
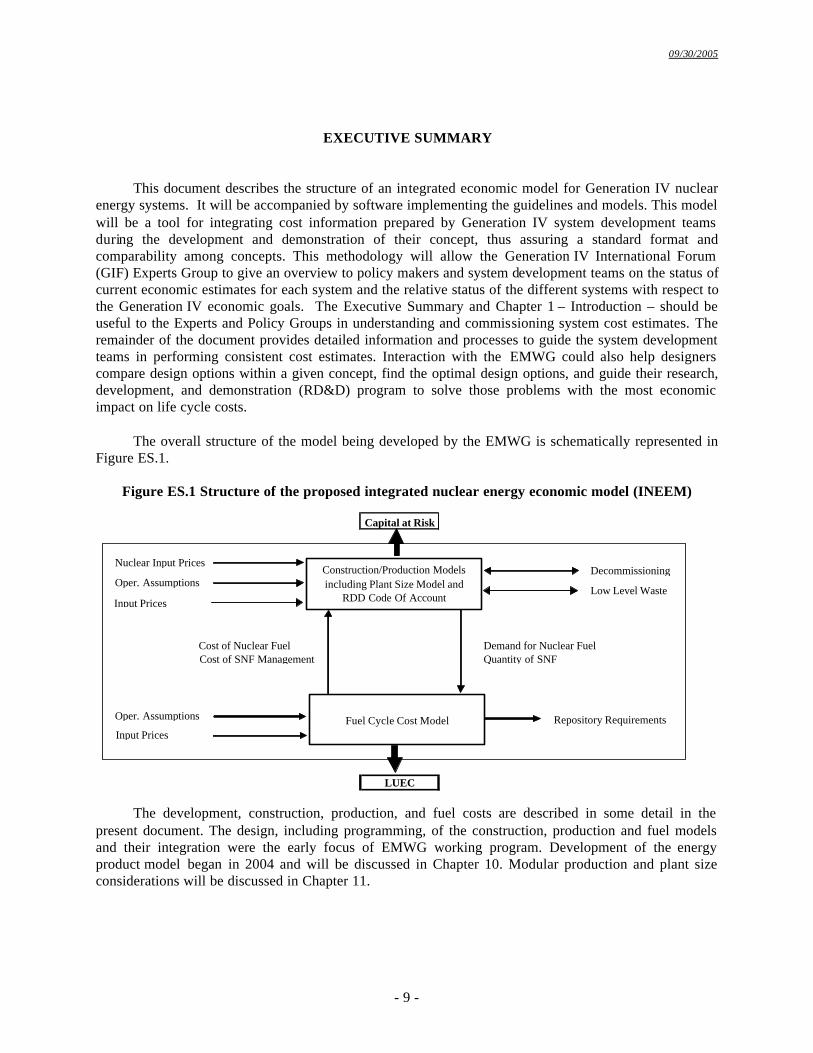
The overall structure of the model being developed by the EMWG is schematically represented in
Figure ES.1.
Figure ES.1 Structure of the proposed integrated nuclear energy economic model (INEEM)
Capital at Risk
LUEC
Nuclear Input Prices
Oper. Assumptions
Input Prices
Construction/Production Models including Plant Size Model and
RDD Code Of Account
Decommissioning
Low Level Waste
Cost of SNF ManagementCost of Nuclear Fuel
Oper. Assumptions
Input PricesFuel Cycle Cost Model
Demand for Nuclear FuelQuantity of SNF
Repository Requirements
The development, construction, production, and fuel costs are described in some detail in the
present document. The design, including programming, of the construction, production and fuel models and their integration were the early focus of EMWG working program. Development of the energy product model began in 2004 and will be discussed in Chapter 10. Modular production and plant size considerations will be discussed in Chapter 11.
09/30/2005
- 10 -
Standard Code Of Accounts (COA)
The life cycle of any nuclear system, including those considered by GIF, includes expenditures over many years for such major categories as RD&D, commercial design, construction, commissioning, operations, fueling, and decommissioning. The ability to further subdivide these cost categories into activities at lower levels gives further insight into the technical and business issues associated with each concept. If subdivisions can be made in a common manner for all concepts, relevant comparisons can be achieved. This may be accomplished by using a uniform COA system. For many years the standard COA for construction and design costs was the Engineering Economic Data Base (EEDB) (ORNL, 1988a and 1988b) which was derived from an older NUS COA.
The International Atomic Energy Agency (IAEA) has developed its own account system (IAEA, 2000) that subsumes the EEDB for capital costs and develops additional codes for operation and maintenance, fuel cycle services, and other parts of a reactor system life cycle. The IAEA account system was modified slightly to create a GIF Code of Accounts, described in Section 1.5. It is sometimes referred to as the “two-digit” level, i.e., costs are rolled-up at the level of major subsystems. It can be used to organize a cost estimate prepared using either a bottom-up or top-down approach. For RD&D costs (Chapter 3) the EMWG created its own hybrid cost accounting system. Cost Estimation Methodology
There are two approaches to cost estimation that can be considered for Generation IV nuclear energy systems:
• a top-down method based on scaling and detailed information from similar reactor systems, described in Chapter 5; and
• conventional bottom-up (cost engineering) estimating techniques, described in Chapter 6, that can be used for conventional projects close to deployment, and include accounting for all construction commodities, plant equipment, and labor hours.
• General ground rules and assumptions applicable to both approaches are given in Chapter 4.
New, highly innovative nuclear energy systems, such as the Lead-Cooled Fast (LFR) or the Molten Salt Reactor (MSR) systems, are likely to have their early estimates prepared with cost-scaling equations, using formulas to account for indirect and support costs. Cost modules, using cost/size scaling equations, can be developed by system development teams. Examples of such cost modules are given in the descriptions of codes developed in Argentina (Grinblat et al., 2002), France (Nisan et al., 2003), and the United States (Williams, 1984).
More conventional systems, such as the Sodium-Cooled Fast Reactor (SCR) are likely to have their
estimates prepared at a high level of detail. The standard cost-estimating categories and a common COA (at least at the two-digit level) are to be utilized for both methods.
Construction/Production Model
Cost estimates prepared by system design teams will report the overall direct and indirect costs for reactor system design and construction (base construction cost) and an estimate of the reactor annual operation and maintenance costs. The intent is that these costs be developed using the GIF account system described in Section 1.5, prepared by the methods outlined in both Chapters 5 and 6. The decision maker, however, needs more than just the overall costs in each life cycle category. Of particular interest are the cost per kilowatt of installed capacity and the cost of electricity generation (cost per kilowatt-hour) from such systems, including the contribution of capital and non-fuel operations to this figure of merit.
09/30/2005
- 11 -
Chapter 7 describes how Interest During Construction (IDC), contingencies, and other
supplemental items are added to the base construction cost to obtain the total project capital cost. This total cost is amortized over the economic life of the plant so that the capital contribution to the levelized unit of energy cost (LUEC) can be calculated. Operation and maintenance (O&M) and Dismantling and Decommissioning (D&D) costs, along with electricity production information, yield the contributions of non-fuel costs to the overall cost of electricity. Chapter 9 includes these algorithms, derived from earlier ORNL nuclear energy plant (NECDB) databases and reports (Delene and Hudson, 1993; and ORNL, 1988c). Fuel Cycle Cost Model
Fuel cycle materials and services are purchased separately by the utility or the fuel subcontractor. For fuel cycles commercially deployed, there are mature industries worldwide that can provide these materials and services. Markets are competitive and prices are driven by supply and demand. The fuel cycle model requires as inputs the amount of fuel needed for the initial core and subsequent equilibrium cores, along with the fissile enrichment of the U or Pu, and for U, the transaction tails assay assumed by the enrichment service provider. The EMWG will use algorithms similar to those described in (NEA, 1994) to model the overall cost for each step and ultimately the unit cost contribution of fuel to the cost of electricity. Background material on the economic aspects of fuel cycle choices including information on nuclear materials and fuel cycle service unit costs for conventional reactor types which use commercially available fuels can be found in (NEA, 1994 and 2002). These documents include cost data on fuel reprocessing and high-level waste disposal for closed fuel cycles and spent fuel disposal for the once through option.
The present document (Chapter 8) addresses also innovative fuel cycles or fuel cycle steps for
which no industrial scale or commercial facilities currently exist, especially for fuel fabrication, reprocessing, and waste disposal. For example, the Very-High-Temperature Reactor system will require high-temperature particle fuel and the Sodium Fast Reactor system might require innovative pyrometallurgical and pyrochemical facilities for fuel fabrication, reprocessing, and re-fabrication. For such systems fuel cycle service price data generally are not readily available. Therefore, it will be necessary to calculate a unit cost of fuel cycle service, such as $/kgHM for fuel fabrication, using a methodology similar to that used for LUEC calculation for the reactor system. This means that the design team must supply data on the design and construction costs for the facilities, along with an estimate of their annual production rates and operation costs. Algorithms similar to those in Chapter 7 and 9 can produce rough approximations of the unit costs.
Reactor Modularity and Non-Electricity Products The heat generated by some Generation IV systems has the potential for uses other than electricity production, such as the production of hydrogen by thermal cracking of steam. There are also possible co-production models where the heat is used for both electricity production and process heat applications. The energy products model deals with these issues and is discussed in Chapter 10.
The cost issues and possible economic benefits that might result from the factory production of all
or part of a reactor system are dealt with in a plant size model discussed in Chapter 11.
09/30/2005
- 12 -
Note to the Reader The reader should keep in mind that the EMWG guidelines are conceived as a living document.
A section to be developed in the near future will include sample calculations using the algorithms discussed in the remainder of this document. As the Generation IV design teams proceed in developing their systems it will be necessary for the EMWG to work with them to insure that these Cost Estimating Guidelines meet their needs, as well as those of the program decision makers.
References Delene, J.G., and Hudson, C.R., 1993, Cost Estimate Guidelines for Advanced Nuclear Power Technologies; ORNL/TM-10071/R3, Oak Ridge National Laboratory, Oak Ridge, TN, USA, May 1993. Grinblat, P., Gimenez, M., & Schlamp, M., 2002, CAREM: Nuclear Safety Internalized Cost-Effectively from the Concept Genesis, Comision Nacional de Energia Atomica, Bariloche, Argentina. IAEA, 2000, Economic Evaluation of Bids for Nuclear Power Plants: 1999 Edition, Technical Reports Series No. 396, International Atomic Energy Agency, Vienna, Austria. NEA, 1994, Economics of the Nuclear Fuel Cycle, OECD Nuclear Energy Agency (OECD/NEA), Paris, France. Available on the NEA website www.nea.fr NEA, 2000, Trends in the Nuclear Fuel Cycle, OECD Nuclear Energy Agency (OECD/NEA), Paris, France. Nisan, S., Rouyer, J-L., Marcetteau, P., and Duflo, D., 2003, SEMER: a simple code for the economic evaluation of nuclear and fossil energy-based production systems, in Nuclear Engineering and Design 221 (2003) pp. 301-313. ORNL, 1988a, Phase IX Update (1987) Report for the Energy Economic Data Base Program EEDB-IX; DOE/NE-0091; Prepared by United Engineers and Constructors Inc., Philadelphia, PA, under the direction of Oak Ridge National Laboratory, Oak Ridge, TN, USA, July 1988. ORNL, 1988b, Technical Reference Book for the Energy Economic Data Base Program EEDB-IX (1987); DOE/NE-0092; Prepared by United Engineers and Constructors, Inc., Philadelphia, PA, under the direction of Oak Ridge National Laboratory, Oak Ridge, TN, USA, July 1988. ORNL, 1988c, Nuclear Energy Cost Data Base: A Reference Data Base for Nuclear and Coal-fired Powerplant Power Generation Cost Analysis (NECDB); DOE/NE-0095, Prepared by Oak Ridge National Laboratory, Oak Ridge, TN, USA, September 1988. Williams, K.A., 1984, A Methodology for Economic Evaluation of Process Technologies in the Early Research and Development Stages; KOA-5684, Oak Ridge Gaseous Diffusion Plant; August 1984 (Also a 1984 PhD thesis of the same title for the University of Tennessee, Knoxville, TN, USA. CD-ROM version available from author, E-mail: [email protected]).
09/30/2005
- 13 -
1. INTRODUCTION
1.1 Purpose of Cost Estimating Guidelines
The economic goals of Generation IV nuclear energy systems, as adopted by Generation IV International Forum (GIF), are (1) to have a life-cycle cost advantage over other energy sources and (2) to have a level of financial risk comparable to other energy projects. In addition, it is expected that Generation IV systems will be deployed in international energy markets that may be highly competitive.
An Integrated Nuclear Energy Economic Model is central to standardized and credible economic
evaluation of Generation IV nuclear energy systems. The innovative nuclear systems considered within Generation IV require new tools for their economic assessment, since their characteristics differ significantly from those of current Generation II and III nuclear energy plants. The Generation IV Economic Modeling Working Group (EMWG) has undertaken a multi-year task of developing such a comprehensive model to support Generation IV International Forum (GIF) objectives. If such a model is to make realistic comparisons between the different reactor technologies/systems and provide a “level playing field” for economic evaluation, ideally the base assumptions and data underlying the model must be applied consistently to all systems. This desired goal is made difficult because, in reality, the Generation IV systems have different design bases, product streams, development costs, and deployment paths.
These Guidelines, in conjunction with the accompanying software, are intended to implement the
Integrated Nuclear Energy Economic Model. The Introduction and Executive Summary of the Guidelines should be useful to the GIF Policy and Expert Groups in commissioning and evaluating cost estimates for the Generation IV Systems. The body of the Guidelines provides the information necessary for the system design teams to perform cost estimates using the software.
It is anticipated that the system development teams for the various concepts will work toward
developing the technical, schedule, and cost information for the six Generation IV systems: • Gas-Cooled Fast Reactor System (GFR).
• Lead-Cooled Fast Reactor System (LFR). • Molten Salt Reactor System (MSR).
• Sodium-Cooled Fast Reactor System (SFR). • Supercritical-Water-Cooled Reactor System (SCWR). • Very-High-Temperature Reactor System (VHTR). It is anticipated that each team will begin the development of a “baseline” reactor system concept at
a “pre-conceptual” level. Given sufficient funding, it is hoped that most teams may have sufficient information, with some data possibly generated by architect/engineer (A/E) subcontractors, to aid in the design and cost estimating process. It is understood that some teams may not have reached this goal due to lack of funding support from their international sponsors. Since the six reactor systems are at different stages of Research, Development and Demonstration (RD&D), knowledge required for preparation of comparable cost estimates varies widely between systems and between nations.
This fact makes early imposition of a “level playing field” cost-estimating methodology difficult,
but not insurmountable. There are, indeed, cost estimating organizational concepts, inputs, and
09/30/2005
- 14 -
assumptions that can be applied to all six concepts that can expedite an unbiased evaluation. Among the cost estimating inputs, the following assumptions and methodologies are fixed for all concepts:
• Site characteristics for international “generic” sites.
• Design, construction, and operation labor rates, and productivity within a country (for bottom-up cost estimating).
• Construction commodity prices within a country (for bottom-up cost estimating). • Methodology for determining economic figures of merit, such as $/kW installed and $/MWh of
power generated (for both bottom-up and top-down cost estimating). • Cost estimating categories including those that can be subdivided by a standard Code of
Accounts (COA) structure, such as the GIF COA presented in these Guidelines (either for bottom-up or “top-down” cost estimating).
• Standardized cost/price assumptions for fuel cycle materials and services, such as yellow cake and enrichment services, where fuel cycle steps and costs, such as for fuel fabrication, may vary by reactor type.
• Financial parameters such as discount rates and amortization periods. • A robust method for contingency determination (compensates for different levels of design
maturity or cost basis variance). • Stated definitions for all cost estimating terms and estimating categories. • Stated definitions for all scheduling terms and schedule categories.
• The use of cost scaling relationships when insufficient detail is available. (The use of cost-scaling relationships and data derived from other technologies or projects is often referred to as top-down cost estimating.)
This document provides this information to all the Generation IV system design teams along with a
set of standard (typical) cost figures of merit and the method to calculate them. The present guidelines will be updated as necessary. These Guidelines will be accompanied by software that implements the models and major assumptions.
Creating guidelines early in the Generation IV International Forum program has several
advantages: • It establishes a cost-estimating language that can be used throughout the rest of the program. • It sets a common basis for the quality and format (code-of-accounts) of cost estimates.
• It may lead to consideration of using cost scaling and cost-figure-of-merit optimization in the design process, which will enhance competitiveness. ( See Appendix B for a discussion of the use of a process that integrates cost estimation with design development.)
For these reasons this document addresses the cost estimation process as well as cost estimating guidelines. The purpose of the present guidelines is to extend previous costing methods and approaches to address Generation IV systems. However, these EMWG guidelines can be applied to earlier designs and non-Generation IV concepts as well.
1.2 Differences from Previous Guidelines
For over two decades the USDOE and its contractors have been using cost estimating guidelines to ensure consistent treatment of competing reactor and non-reactor electric power production technologies. A working set of guidelines (Delene and Hudson, 1993) were issued by ORNL in 1993 to support the non-commercial (DOE-NE) evaluation of two Liquid Metal Reactor (LMR) concepts and a Modular High
09/30/2005
- 15 -
Temperature Gas-cooled Reactor (MHTGR) concept, assumed to be constructed and operated under a regulated utility financial environment. These were the two “advanced” reactor technologies that DOE’s Office of Nuclear Energy was funding at that time. (One or both may serve as a “reference” set of costs for design variations.) The 1993 guidelines were supported by two other documents:
• the September 1988 Nuclear Energy Cost Data Base (NECDB) (ORNL, 1988a) which contains a detailed description of the model needed to calculate the Levelized Unit of Energy Cost (LUEC) from fossil and nuclear energy plants; and
• the highly detailed 1987 Energy Economic Data Base (EEDB) (ORNL, 1988b and 1988c) developed by United Engineers and Constructors (now part of The Washington Group, Inc.).
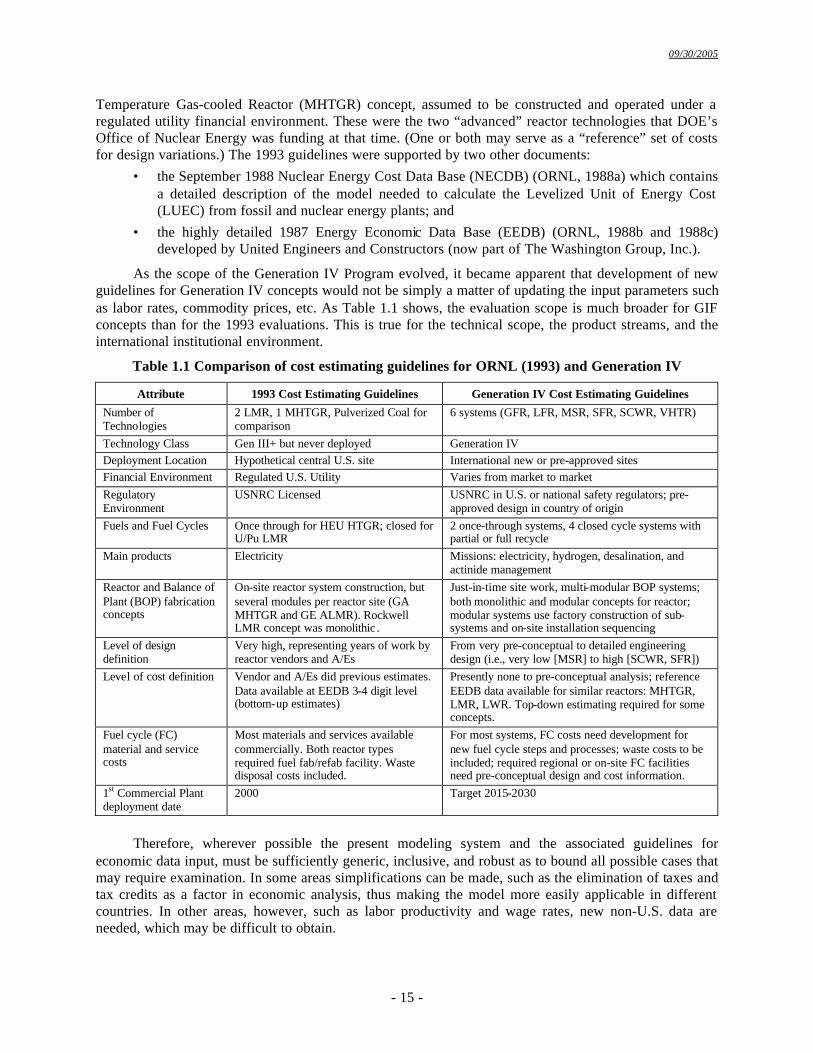
As the scope of the Generation IV Program evolved, it became apparent that development of new guidelines for Generation IV concepts would not be simply a matter of updating the input parameters such as labor rates, commodity prices, etc. As Table 1.1 shows, the evaluation scope is much broader for GIF concepts than for the 1993 evaluations. This is true for the technical scope, the product streams, and the international institutional environment.
Table 1.1 Comparison of cost estimating guidelines for ORNL (1993) and Generation IV
Attribute 1993 Cost Estimating Guidelines Generation IV Cost Estimating Guidelines
Number of Technologies
2 LMR, 1 MHTGR, Pulverized Coal for comparison
6 systems (GFR, LFR, MSR, SFR, SCWR, VHTR)
Technology Class Gen III+ but never deployed Generation IV Deployment Location Hypothetical central U.S. site International new or pre-approved sites Financial Environment Regulated U.S. Utility Varies from market to market Regulatory Environment
USNRC Licensed USNRC in U.S. or national safety regulators; pre-approved design in country of origin
Fuels and Fuel Cycles Once through for HEU HTGR; closed for U/Pu LMR
2 once-through systems, 4 closed cycle systems with partial or full recycle
Main products Electricity Missions: electricity, hydrogen, desalination, and actinide management
Reactor and Balance of Plant (BOP) fabrication concepts
On-site reactor system construction, but several modules per reactor site (GA MHTGR and GE ALMR). Rockwell LMR concept was monolithic .
Just-in-time site work, multi-modular BOP systems; both monolithic and modular concepts for reactor; modular systems use factory construction of sub-systems and on-site installation sequencing
Level of design definition
Very high, representing years of work by reactor vendors and A/Es
From very pre-conceptual to detailed engineering design (i.e., very low [MSR] to high [SCWR, SFR])
Level of cost definition Vendor and A/Es did previous estimates. Data available at EEDB 3-4 digit level (bottom-up estimates)
Presently none to pre-conceptual analysis; reference EEDB data available for similar reactors: MHTGR, LMR, LWR. Top-down estimating required for some concepts.
Fuel cycle (FC) material and service costs
Most materials and services available commercially. Both reactor types required fuel fab/refab facility. Waste disposal costs included.
For most systems, FC costs need development for new fuel cycle steps and processes; waste costs to be included; required regional or on-site FC facilities need pre-conceptual design and cost information.
1st Commercial Plant deployment date
2000 Target 2015-2030
Therefore, wherever possible the present modeling system and the associated guidelines for
economic data input, must be sufficiently generic, inclusive, and robust as to bound all possible cases that may require examination. In some areas simplifications can be made, such as the elimination of taxes and tax credits as a factor in economic analysis, thus making the model more easily applicable in different countries. In other areas, however, such as labor productivity and wage rates, new non-U.S. data are needed, which may be difficult to obtain.
09/30/2005
- 16 -
In the present guidelines, 5% and 10% real (i.e., excluding inflation) discount rates are used because they are considered representative of the average cost of capital for most nuclear energy plant owners. The 5% real discount rate is appropriate for plants operating under the more traditional “regulated utility” model where revenues are guaranteed by captive markets. The 10% real discount rate would be more appropriate for a riskier “deregulated” or “merchant plant” environment where the plant must compete with other generation sources for revenues.
Generation IV cost estimation focuses on the life cycle costs for the nuclear energy plant (with
single or multiple reactors). For some concepts, however, additional facilities beyond the reactor building will be needed to support the fuel cycle. These might, for example, include a regional fuel fabrication facility capable of making high temperature particle fuel for a fleet of VHTRs or an on-site pyrometallurgical facility capable of reprocessing and re-fabricating SFR metal fuel in a closed fuel cycle.
The possibility of costing non-electricity products, such as hydrogen, will require cost estimates be
prepared for these on-site facilities that make use of thermal energy from the reactor(s). For modular concepts, the cost and amortization of a factory producing major reactor systems may
be required, unless an existing factory that makes equipment modules is already in use. These life cycle costs will need to be compared to the costs of typical on-site construction of most systems.
Finally, EMWG will not model unit costs for competing technologies, such as fossil or renewable
generation facilities, or conventional fossil-fuel based H2 production facilities. For electrical generation there are recent reports that deal with fossil and renewable sources using similar models to the 1993 Guidelines, e.g., see the ORNL Fusion study (Delene et al., 2000) and the OECD study (IEA and NEA, 1998).
1.3 Relationship between the Present Guidelines and the Overall EMWG Modeling Effort
This project will upgrade existing modules of nuclear-economic models (component models such as capital, operation, fuel cycle, etc.) and develop new ones where needed. Over the duration of the EMWG support to GIF, models will be updated or developed that address each of the following four economic areas: Construction/Production Cost (or “Cost Model”); Nuclear Fuel Cycle (or “Fuel Model”); Energy Products, and Plant Size. The present version of the Guidelines addresses only the Construction/Production and Fuel Models. Future work will address the last two.
A more detailed description of what is desired for each of these four over-arching models is given
in the Crosscutting Economics R&D Scope Report (USDOE and GIF, 2003). Those four models will then be integrated to provide an Integrated Nuclear Energy Economic Model, combining all the nuclear-economic models described above. This model will provide a robust tool for economic evaluation within the Viability and Performance phases of the Generation IV project.
Cost estimates for the development, design, construction, and operation costs of future energy
plants will exhibit considerable uncertainty, where the magnitude of uncertainty depends on the level of reference design costing and degree of detailed engineering definition. To manage the cost estimating task for advanced nuclear energy plant concepts, a number of simplifying assumptions must be made, including:
• Systems at the deployment stage are presumed pre-licensed in their country of origin. For example, the nuclear plant licensing reform recently enacted for the U.S. allows one-step licensing and certification of a standard plant design. Underlying all this is the intent that the systems satisfy the overall safety criteria for Generation IV.
09/30/2005
- 17 -
• The NOAK plant is assumed to be built such that its cost and schedule variations compared to the FOAK are known. (See Appendix E)
• A pre-approved – licensed – site exists for plant construction.
• The assumed finance and business model is such that project financing is available for all phases of the final engineering design, site development, plant layout, owner’s costs, construction, and commissioning of a plant.
• No provision is made for force majeure, war, labor strikes, or future changes in regulatory requirements.
The present guidelines are intended to provide a consistent comparison between the advanced
reactor technologies under consideration. The costs obtained using the guidelines are intended to be reasonable estimates that envelop the ultimate cost in an uncertain environment. The reported estimates should represent the most likely costs, including the appropriate contingency (see Appendix A).
1.4 Definitions of Cost Estimating Terms
The following definitions of terms will provide the background necessary for interpreting the present guidelines. It is understood that some of these terms will not be used or applicable until much later in the system development and deployment cycle.
BOP (Balance of Plant): All areas of plant and systems that are not included in Nuclear Island
scope. Base Cost: The base construction cost is the most likely plant construction cost based on the direct
and indirect costs only. This cost is lower than the total capital cost because cost elements such as contingency and interest are not included. Direct costs are those costs directly associated with an item-by-item basis with the equipment and structures that comprise the complete energy plant, fuel cycle facility, module fabrication factory, or end-use plant. Indirect costs are expenses for services applicable to all portions of the physical plant. These include field indirect costs, design services, engineering services, Architect Engineer (A/E) home office engineering and design services, field office engineering and services, and construction management services. Reactor or other factory equipment manufacturer home office engineering and services are included in separate detail for appropriate accounts 35-38.
Baseline Cost: Refers to the initial costs developed for the subject plant, prior to validation and any
subsequent cost adjustments. Baseline Plant: Refers to the initial design of the subject plant before optimization and cost/benefit
revisions. Category: Refers to grouping of commodities that are common to a design discipline or lead craft,
such as Concrete, Structural, Architectural, Civil, Mechanical, Piping, Instrumentation, or Electrical. Category Wage: A composite cost per hour of the mix of crafts involved in all construction
activities for the commodit ies that are included in the category of work. This composite cost per hour simplifies the estimating process and is based on actual construction experience for the percentages of crafts involved in each category of work
COA Detail: Describes a summary of plant components common to a system, facility, or function.
09/30/2005
- 18 -
Commodity: A component detail of Category, such as Concrete Category consisting of commodities Formwork, Rebar, Embeds, and Structural Concrete.
Common Plant Facilities: Common plant facilities are those systems, structures, and components
that provide common support to the operation at a new energy plant site and include such facilities as administration building, provisions for refueling, general warehouse, water supply, general fire systems, energy distribution, cooling water intakes, dry storage, civil and engineering offices, etc. These common plant facilities may be sized to be shared by other plant units added subsequently.
Constant Money: Constant money cost is the cost for an item measured in money that have a
general purchasing power as of some reference date, e.g., January 1, 2001. Because inflation is associated with the erosion of the purchasing power of money, constant money analysis factors out inflation. In the Generation IV economic analyses carried out using the present guidelines only constant money costs will be considered. (See also Real Cost of Money).
Construction Module: A construction module is a free standing, transportable pre-assembly of a
major portion of the plant, or a complete system or sub-system of the unit. A construction module may be a pre-assembly of a single system or portion thereof, or may contain elements of all the systems that exist in a given location in the plant. A construction module might contain parts of the building structure. A construction module might be assembled in a factory, shipped to the plant site, and installed in the plant (perhaps after minor assembly and/or linking). In some cases this might be an entire reactor island structure, i.e., a “reactor module.” The direct costs for modules should contain within them their share of the manufacturing costs, including the fair burden of the cost of operating the factory where they are manufactured. If not, the factory-related costs must be accounted for elsewhere.
Construction Supervision: Refers to field non-manual personnel engaged in direct supervision of
construction activities such as superintendents and field engineers. Contingency: Contingency is an adder to account for uncertainty in the cost estimate (see
Section 6.3 and Appendix A). Contingency includes an Allowance For Indeterminants (AFI) and should be related to the level of design, degree of technological advance, and the quality/reliability pricing level of given components (see Section 7.3). Contingency does not include any allowance for potential changes from external factors, such as changing government regulations, major design changes or project scope changes, catastrophic events (force majeure), labor strikes, extreme weather conditions, varying site conditions, or project funding (financial) limitations. Contingencies can be also applied to the interest during construction (IDC) and the capacity factor (CF) to account for uncertainty in the reactor design/construction schedule and reactor performance respectively.
Cost Component: Usually a detail component of a COA, such as Reactor vessel in a Nuclear
Steam Supply COA; it can be a pump or piping components in a heat transfer system account detail. Includes cost elements for equipment, labor and materials.
Cost Element: Refers to cost details separated to Equipment, Labor, or Materials. Cost Factor: Calculated resultant factor that relates a reference plant cost detail for the ratio of
parameters between the reference plant and subject plant. Cost Factor Exponent: Consideration of “size benefit” or common costs reflected in the cost of
similar equipment, facility, or system with different ratings, capacity, or other suitable parameter. It is usually applied against the ratio of parameter values.
09/30/2005
- 19 -
Craft Mix: Refers to the percentages of crafts involved in the performance of construction work for a category of work. As an example, “concrete” category includes: carpenters for formwork, iron workers for the rebar, laborers for actual placement of concrete and general assistance, as well as operating engineers for concrete pumps, cement finishers and other support craft such as electricians to monitor embedded conduits during concrete placement.
Craft Wage: Refers to individual craft wage determination including all costs such as wages,
fringe benefits, premium costs, travel or living allowance, apprentice allowance, union dues, as well as employer’s costs, such as insurance, and taxes. It excludes other allowances, such as small tools.
Crew Wage: Refers to a mix of wage rates calculated for a single craft crew, comprising of
journeymen, apprentices, foremen, and general foremen. Deployment Costs: Costs of developing a standard design and licensing it. These are considered
part of FOAK costs and are distinct from R & D costs. These are non-recurring costs for subsequent plants and may be amortized over all the plants prior to NOAK plant (See Figure 1.1).
Deployment Phase: Refers to the period when all standard design and other plant data are
generated to support commercial application of the standard plant. During this period are incurred all non-recurring costs that are required for the FOAK plant and will not be needed for any subsequent identical plants in a series.
Design Services: Refers to services performed offsite or onsite to produce all design documents and calculations required to construct the plant. For a standard plant with certified design and pre-licensed, the services are limited to those required to adopt the standard plant design for the specific site conditions. Those services include engineering and other support services, such as administrative, procurement and project control personnel, and their cost include salaries, office space, office furniture, office equipment, supplies, communications, travel and other labor related costs. Fees for the services are included in “62” account.
Direct cost: All costs that are identifiable to construction of permanent plant, excluding support
services such as field indirect costs, construction supervision and other indirect costs (See also Base cost). Direct Labor: Refers to construction crafts involved with construction activities that are
identifiable to permanent plant, rather than general support activities such as site clean-up. It includes truck and crane drivers delivering equipment to permanent locations and all work operations that are identifiable to permanent plant, such as equipment maintenance or construction testing prior to plant startup.
Discount rate: In the context of the present guidelines, discount rate will be taken as equal to the
real cost of money. Comparison calculations are to be performed for 5% and 10% discount rates. See definition for “real cost of money (r)”.
Economic life: The period of commercial operation over which capital costs are recovered. This default value adopted in the EMWG calculation tool is 40 years but it may be modified by the user. The economic life usually will differ from the licensed lifetime as well as from the expected technical lifetime but should in no case exceed one of those.
Escalation rate: The rate of cost change. This rate can be greater than or less than the general
inflation rate, as measured by the Gross Domestic Product Implicit Price Deflator. For Generation IV cost estimation, it will be assumed to be zero, unless otherwise justified. Escalation of reference plant costs
09/30/2005
- 20 -
that are expressed in values prior to Jan 2001 pricing basis are to be adjusted based on appropriate indices. See also Table 4.11 Escalation adjustment factors.
Equipment: Equipment for reactors includes all manufactured items ordered and delivered to a
site, and used in construction. Such items may be procured on a design and build contract from qualified vendors, wherein design responsibility belongs to the seller (vendor) or is maintained by the buyer or purchasing agent on a “build-to-print” basis. To facilitate top-down estimating techniques, only process related equipment costs will be categorized as equipment cost. Non-process related equipment such as HVAC, plumbing, lifting or maintenance equipment, large pipe and valves, electrical and control equipment is to be classified as material costs.
Equipment module: An equipment module is a pre-packaged and site delivered (skid-mounted,
factory-assembled) package that includes (but is not limited to) equipment, piping, instrumentation, controls, structural components, and electrical items. Module types include Box Modules, Equipment Modules, Structural Modules, Connection Modules, Electrical Modules, Control System Modules and Dressed Equipment Modules. These Modules are applicable to both the Nuclear and Balance of Plant, including support buildings. The same definition applies for equipment modules in fuel cycle, end-use, or module factory facilities.
Factory (manufacturing facility) FOAK costs: These FOAK costs include the development of
manufacturing specifications, factory equipment, facilities, startup, tooling, and setup of factories that are used for manufacturing specific equipment for the nuclear energy system. These costs can be minimized if existing facilities are used for module production, which might not be dedicated or even its primary use application (e.g., a shipyard or any other factory that already builds modules for other industries or units). For a new modular nuclear energy plant, the new module fabrication factory might be considered a FOAK cost and included in module prices. If these costs are to be spread over a production run (or fleet size), then the cost should be estimated on that basis, and the number of plants or production needed to recover the factory costs defined. The module prices are in the unit/plant costs and as such, the price should be amortized in the LUEC or product cost over some number of modular reactors produced over its projected lifetime. The capital cost of the modules must amortize the module factory capital costs plus the normal annual production (operating) costs for the factory. For a pre-existing factory it is assumed that the price of the modules includes a fair share of any factory operating and capital recovery costs (overheads).
First commercial plant costs: The first commercial plant is the first standard plant of a particular
type that is sold to an entity for the purpose of commercial production of electricity and/or other products. The costs include all engineering, equipment, construction, testing, tooling, project management, and any other costs that are repetitive in nature. Any costs unique to the first commercial plant, which will not be incurred for subsequent plants of the identical design, will be identified and broken out separately as FOAK plant costs. The “learning” process for this first plant will reflect its first commercial plant status and not be the average over a larger number of later plants. See Figure 1.1.
Fleet size: Refers to size or capacity of same type of plant for considerations of sizing support
facilities such as fuel fabrication or reprocessing. It has been standardized to a 32 GWe capacity for the purpose of Generation IV nuclear energy system cost estimates.
FOAK plant costs: These are FOAK costs necessary to put a first commercial plant in place that
will not be incurred for subsequent plants. Design and design certification costs are examples of such costs. See Figure 1.1.
09/30/2005
- 21 -
Force account: Construction Labor Force account involves the direct hiring and supervision of craft labor to perform a construction activity by a prime contractor, as opposed to the prime contractor hiring a subcontractor to perform these functions.
Indirect cost: Consists of all costs that are not directly identifiable with specific permanent plant,
such as field indirect, construction supervision, design services, and PM/CM services (See also “Base cost”).
Industrial grade construction: Industrial grade construction means construction practices that
conform to generally-accepted commercial requirements, such as those required for fossil-fired plant construction. Industrial grade construction could be used for end-use facilities, such as hydrogen production. A module factory could also use industrial grade construction for the production of some modules (See also “Nuclear-safety grade”).
Indirect Labor: Refers to construction craft labor involved in performing support activities that
are not directly identifiable to permanent plant; it includes temporary facilities, temporary services, warehousing, construction equipment maintenance, security services, etc.
Inflation rate: The rate of change in the general price level as measured by the Gross Domestic
Product Implicit Price Deflator. The inflation rate is assumed to be zero in constant money based studies. Initial core cost: The cost of the materials and services required to provide the first loading of
fresh fuel assemblies to the reactor(s). In the present guidelines, the initial core costs will be considered part of the total capital investment that is amortized in the capital component of LUEC. The fuel cycle algorithms discussed in Chapter 8 are used to calculate the initial core costs.
Interest During Construction (IDC): IDC is the interest accrued for up-front cost financing, i.e.,
it is accrued to the end of construction and plant startup (See Section 7.2). Large monolithic plant: A large monolithic plant is an energy plant consisting of a large nuclear
steam supply system (NSSS) having an energy, and/or product output. In some instances, a plant of this size is referred to as an integrated plant or stick-built plant. All today’s PWRs and BWRs are considered monolithic plants.
Levelized Unit of Energy Cost (LUEC): For the “standard plant” it includes costs associated with
non-generic licensing, capital investment, operation and maintenance of the energy plant, owner’s costs, ongoing refurbishment, fuel, waste disposal, and decommissioning the plant at the end of life, and may include revenue offsets due to byproduct production. Typically the four components of LUEC reported are: the capital component (recovery of capital cost over economic life); the production or non-fuel O&M component; the fuel component; and the decommissioning (D&D) component. Chapter 9 discusses the calculation of LUEC. Normally this cost does not have R&D and demonstration (prototype) cost embedded in it. If the FOAK plant is a commercial plant, it would have some FOAK costs, such as generic design and design certification, recovered in the LUEC. The remaining recoverable costs would be recurring “standard plant” costs. For a power plant generating electricity LUEC is the “Levelized Unit of Electricity Cost”.
Materials: Materials include field-purchased (site material) and/or bulk commodity items, such as
lumber, concrete, structural steel, and plumbing items. All piping is a materials item. Also all wire and cable and raceways are material items, including those in building service power systems. Also included is non-process related equipment such as HVAC, cranes, hoists, doors, plumbing, sewage treatment,
09/30/2005
- 22 -
electrical and control equipment, etc. To facilitate top-down estimating techniques, only process related equipment is to be classified as equipment cost.
Modular unit: A smaller capacity unit that is constructed on site with benefits from modularity
effects. Modularity: Generic term, representing a comparative use of many standardized smaller units,
with a lesser number of larger units, for the same installed capacity (MWe). Modularization: Process of converting the design and construction of a monolithic plant or stick-
built scope to facilitate factory fabrication of modules for shipment and installation in the field as complete assemblies.
Module: Usually refers to a packaged, fully functional assembly for use with other standardized
assemblies to obtain a system. See also Construction Module and Equipment Module. Monolithic plant: refers to a plant constructed in field without extensive use of modules. It is also
referred to as a “stick-built” plant. Multi-unit plant: A plant consisting of more than one production unit. Nominal currency/dollars: The reference currency adopted by default in the Guidelines is the US
dollar. Nominal dollar cost is the cost for an item measured in as-spent dollars and includes inflation. Nominal dollars are sometimes referred to as “current” dollars, “year of expenditure” dollars, or “as spent” dollars. The methodology in this document uses real dollars rather than nominal dollars.
Nominal cost of money: The nominal cost of money is the percentage rate used in calculations
involving the time value of money containing an inflation component. It explicitly provides for part of the return on an investment to keep up with inflation.
Non-recurring costs: Common costs incurred prior to commercial operation of FOAK that are part
of the program costs and are to be shared by all plants. They exclude costs that are required for each plant such as site licensing and site specific design. These costs will be amortized over all the plants prior to NOAK plant.
Nth-Of-A-Kind (NOAK) plant cost: The NOAK plant is the nth-of-a-kind or equilibrium
commercial plant of identical design to the FOAK plant. NOAK plant cost includes all engineering, equipment, construction, testing, tooling, project management, and any other costs that are repetitive in nature and would be incurred if an identical plant were built. The NOAK plant cost reflects the beneficial cost experience of prior plants. NOAK plant is defined as the next plant after the unit that achieves 8.0 GWe of capacity (See Figure 1.1).
Nuclear Island (NI): Refers to the part of plant containing a majority of nuclear related equipment
and systems. Typically it consists of containment, reactor building, fuel handling building, etc. Nuclear-safety grade: Refers to construction practices that satisfy the Quality Assurance and other
requirements of national licensing (e.g., 10CFR50, Appendix B in the United States). Both reactor and fuel cycle facilities will require some nuclear grade construction.
Overnight cost: The (total) overnight cost (OC) is the base construction cost plus applicable
owner’s cost, contingency and first core costs. It is referred to as an overnight cost in the sense that time
09/30/2005
- 23 -
value costs (IDC) are not included, i.e., as if the plant were constructed “overnight” with no accrual of interest [OC = TCIC – IDC]. The total overnight cost is expressed as a constant dollar amount in reference year dollars. Commissioning and first core costs are included in the overnight cost for this study, which is not usually the case for conventional reactor estimates. This expanded definition is used to reflect the fact that the first core must be paid for before revenues are accrued. Allowing all “up-front” costs to be combined into one lump sum term prior to calculation of the IDC simplifies the algorithms used to calculate the LUEC.
Owners Cost: Refers to cost components that are typically Owner responsibility including scope of
COA 40 - Capitalized operations, 50 - Capitalized supplementary costs, and 60 - Capitalized financial costs.
Owner’s discretionary items: For a power plant these include the switchyard (after the bus-bar)
and transmission system, the hydrogen distribution system, and fuel or module transportation equipment. These are not included in the LUEC but may be included in Owners cost for a specific project.
Parameter: Refers to a measure of system or equipment rating, capacity, weight or other measure
that represents a basis for calculation of cost adjustment factors. Plant: Complete project, comprising power generation plant alone or in conjunction with other
plants, such as hydrogen production or desalination. PM/CM Services: Refers to Project Management (PM) and/or Construction Management (CM)
services performed onsite or offsite for management of total project; includes project manager and staff, procurement buyers and contract administration, project cost engineers, project schedulers, first aid, medical, administrative, payroll, accounting, clerical, labor relations, security, etc., and salaries, salary related costs, office equipment, supplies and fees for the services.
Power unit: A power unit (sometimes called a “building block”) is a combination of one or more
reactor modules and associated electrical generation equipment and structures that represent the smallest unit for commercial electrical generation. Power units may be duplicated for capacity expansion.
Process Equipment: Refers to equipment items that are required to perform the design system
function for all physical processes. Equipment for services systems such as HVAC, ventilation, plumbing, potable water, sewer, cranes, hoists, etc are categorized as materials. This segregation facilitates top-down estimating techniques whereby process equipment costs are basis for application of bulk factors to estimate piping, electrical and other commodities.
Productivity: Refers to a measure of labor effectiveness relative to a standard. Actual job hours
divided by standard hours for the same work scope represents a productivity factor for the project. Standard hours are calculated by multiplying the quantity of work times the standard unit hours for the work. Usually it is expressed by category of work, such as concrete, piping or electrical category. Also it can be calculated for total direct, indirect or total craft labor as well as craft supervision or total field non-manual.
Prototype-of-a-Kind (POAK): Costs specific to any prototype plant. These include prototype-
specific design, development, licensing, construction, testing, and operation of the prototype to support the demonstration of the system or concept (this prototype may assist, but does not meet or satisfy standard plant design certification). These costs are separate from FOAK (see Chapter 3) and are not amortized within the LUEC.
09/30/2005
- 24 -
Research, Development and Demonstration (RD&D) costs: Costs associated with material, component, system, process, and fuel development and testing performed specifically for the particular advanced concept. These costs are often borne by governments or by industry consortia, and are recovered depending on national practices. In the present guidelines, RD&D costs are not distributed into the cost of electricity production. However, their sum for each system is an important figure of merit for GIF decision makers. Chapter 3 contains a generic list of these costs for the reactor and its fuel, including prototype costs (See deployment cost definition for other “non-standard” costs and Figure 1.1).
Reactor module: A reactor module is a single reactor and that portion of the nuclear island that is
duplicated, and capable of criticality when loaded with fuel as an integral part of a building block of energy production. It is delivered to site as a prefabricated component, without necessarily requiring additional construction. (See also equipment module).
Real cost of money (r): The real cost of money is the percentage rate used in calculations
involving the time value of money when the inflation component has been removed (constant money calculations). Calculations using the real cost of money assume that the money maintains a constant value in terms of purchasing power, and, thus, no return on investment (ROI) is needed to cover inflation. For consistency of comparisons, cost estimates carried out with the present guidelines should be made for two rates: 5% and 10%.
Reference Plant: A collection of information, including of plant description, plant characteristics
and design data (with ratings and parameters) and cost data that represent a similar process, system, facility, or equipment component. The data is used for cost development of a plant cost component or COA detail.
Reference plant costs: These are the basis for estimating baseline plant costs in the absence of a
fully worked up (or proven) cost for a commercial unit (i.e., a surrogate basis for estimating total plant cost and cost differences). The reference plant is not part of the overall project, but rather a benchmark from which to begin costing the baseline subject plant. Obtaining this information may involve many months of labor (See Chapter 4 on top-down cost estimation using reference plant costs).
Single-unit plant: A stand-alone commercial energy plant consisting of a single unit and all
necessary common plant facilities is referred to as a single-unit plant. This is the smallest unit of energy capacity normally sold to a customer, such as a utility.
Specific cost: Total cost divided by the net capacity (net kWe) of the plant. Standard fuel facility design costs: These costs include the design and engineering of facility and
equipment, proof testing of equipment, and licensing for any concept. Standard fuel facilities may be either integral to the energy plant, central, or both. These costs should be amortized into the fuel cycle costs rather than the reactor costs.
Standard Hours: Calculated hours of construction quantity work scope times the standard unit
hours. The ratio of project hours divided by standard hours for the same work scope is a measure of project productivity.
Standard plant design costs: Costs associated with the engineering and engineering support
functions for the design of the standard plant. These are a FOAK non-recurring cost for the first commercial standard plant. These do not include the site-specific engineering costs that are associated with all standard plants.
09/30/2005
- 25 -
Standard plant licensing costs: Costs associated with licensing related activities performed to establish that the design of the standard plant is adequate for obtaining a license. In the United States, it includes the design and analysis of prototype tests necessary for certification, coordination with NRC, and preparation of documents required for certification of the standard plant design. These are a FOAK non-recurring cost for the first commercial standard plant. These do not include the site-specific engineering costs that are associated with all standard plants.
Standard Unit Hours: A set of unit hour rates per quantity of work scope. Usually, serves as a
basis for calculation of standard hours for a project before application of a productivity factor for a specific project or site.
Station: One or more plants on a single site. Each plant can be one or more units. Subject plant: A specific type of plant that is being developed by the individual system designer
and is being estimated. System Designer: Refers to the organization performing the design of the specific type of plant. Technology development costs: See RD&D costs. Transition period: The period from the start of the construction of the FOAK to the end of
construction of the last plant before the NOAK plant. Transition-period plant-specific capital costs: The capital costs for the transition plants (2OAK,
3OAK, etc.). These costs exclude any non-recurring FOAK costs and include costs for manufacturing of factory equipment, site construction, site-specific engineering, and home office construction support. The transition in costs from the first to NOAK commercial plant and the beneficial cost effects of serial manufacturing and construction should be documented, for guidance, see Appendix E.
Total Capital Investment Cost: The Total Capital Investment Cost (TCIC) is an all inclusive
plant capital cost (or lump-sum up-front cost) developed for the purpose of calculating the plant LUEC ($/MWh), the unit cost of a fuel cycle material or service (such as $/kg U), end-use product (such as $/kg H2), or a factory-fabricated module or equipment item (such as $/module). This cost is the base construction cost plus contingency, escalation (zero for these studies, unless justified), IDC, owner’s cost (including utility’s start-up cost), commissioning (non-utility start-up cost), and initial fuel core costs (for reactor). Since constant dollar costing will be used in these studies, escalation and inflation are not included.
Unit: See also single-unit plant. A set of facilities and systems to produce electrical energy and/or
other product such as hydrogen or desalinated water as one set of energy source and conversion or production systems, such as reactor and turbine generator systems.
Unit Equipment Cost: Total costs associated with a piece of process equipment. Usually includes
vendor engineering, testing, certification, packaging for shipment, local delivery, warranty, and recommended construction spare parts.
Unit Hours: Sum of all construction craft time spent for installation of equipment or commodity
divided by the unit of quantity for the equipment or commodity, including delivery from storage, installation, craft time for inspections and construction testing before plant startup.
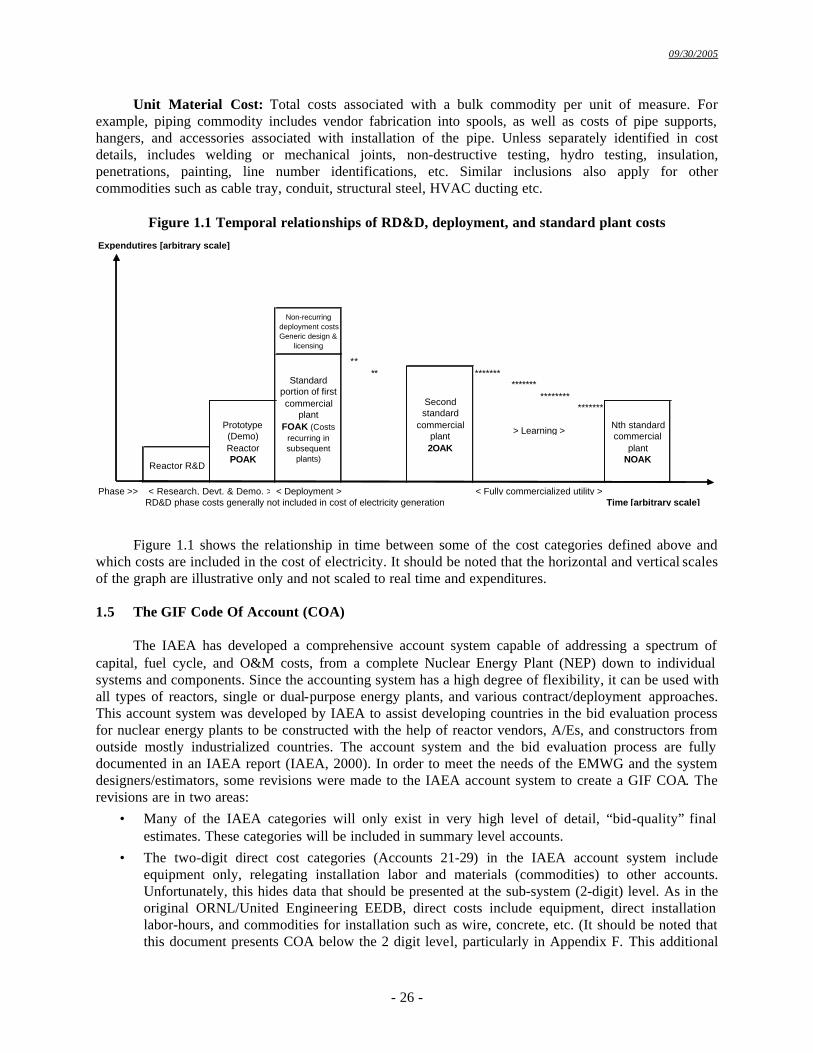
09/30/2005
- 26 -
Unit Material Cost: Total costs associated with a bulk commodity per unit of measure. For example, piping commodity includes vendor fabrication into spools, as well as costs of pipe supports, hangers, and accessories associated with installation of the pipe. Unless separately identified in cost details, includes welding or mechanical joints, non-destructive testing, hydro testing, insulation, penetrations, painting, line number identifications, etc. Similar inclusions also apply for other commodities such as cable tray, conduit, structural steel, HVAC ducting etc.
Figure 1.1 Temporal relationships of RD&D, deployment, and standard plant costs
Expendutires [arbitrary scale]
**** *******
***************
*******
Phase >> < Deployment >RD&D phase costs generally not included in cost of electricity generation Time [arbitrary scale]
Non-recurring deployment costs Generic design &
licensing
> Learning > Nth standard commercial
plant NOAK
< Research, Devt. & Demo. > < Fully commercialized utility >
Second standard
commercial plant 2OAK
Reactor R&D
Prototype (Demo) Reactor POAK
Standard portion of first commercial
plant FOAK (Costs
recurring in subsequent
plants)
Figure 1.1 shows the relationship in time between some of the cost categories defined above and which costs are included in the cost of electricity. It should be noted that the horizontal and vertical scales of the graph are illustrative only and not scaled to real time and expenditures.
1.5 The GIF Code Of Account (COA)
The IAEA has developed a comprehensive account system capable of addressing a spectrum of capital, fuel cycle, and O&M costs, from a complete Nuclear Energy Plant (NEP) down to individual systems and components. Since the accounting system has a high degree of flexibility, it can be used with all types of reactors, single or dual-purpose energy plants, and various contract/deployment approaches. This account system was developed by IAEA to assist developing countries in the bid evaluation process for nuclear energy plants to be constructed with the help of reactor vendors, A/Es, and constructors from outside mostly industrialized countries. The account system and the bid evaluation process are fully documented in an IAEA report (IAEA, 2000). In order to meet the needs of the EMWG and the system designers/estimators, some revisions were made to the IAEA account system to create a GIF COA. The revisions are in two areas:
• Many of the IAEA categories will only exist in very high level of detail, “bid-quality” final estimates. These categories will be included in summary level accounts.
• The two-digit direct cost categories (Accounts 21-29) in the IAEA account system include equipment only, relegating installation labor and materials (commodities) to other accounts. Unfortunately, this hides data that should be presented at the sub-system (2-digit) level. As in the original ORNL/United Engineering EEDB, direct costs include equipment, direct installation labor-hours, and commodities for installation such as wire, concrete, etc. (It should be noted that this document presents COA below the 2 digit level, particularly in Appendix F. This additional
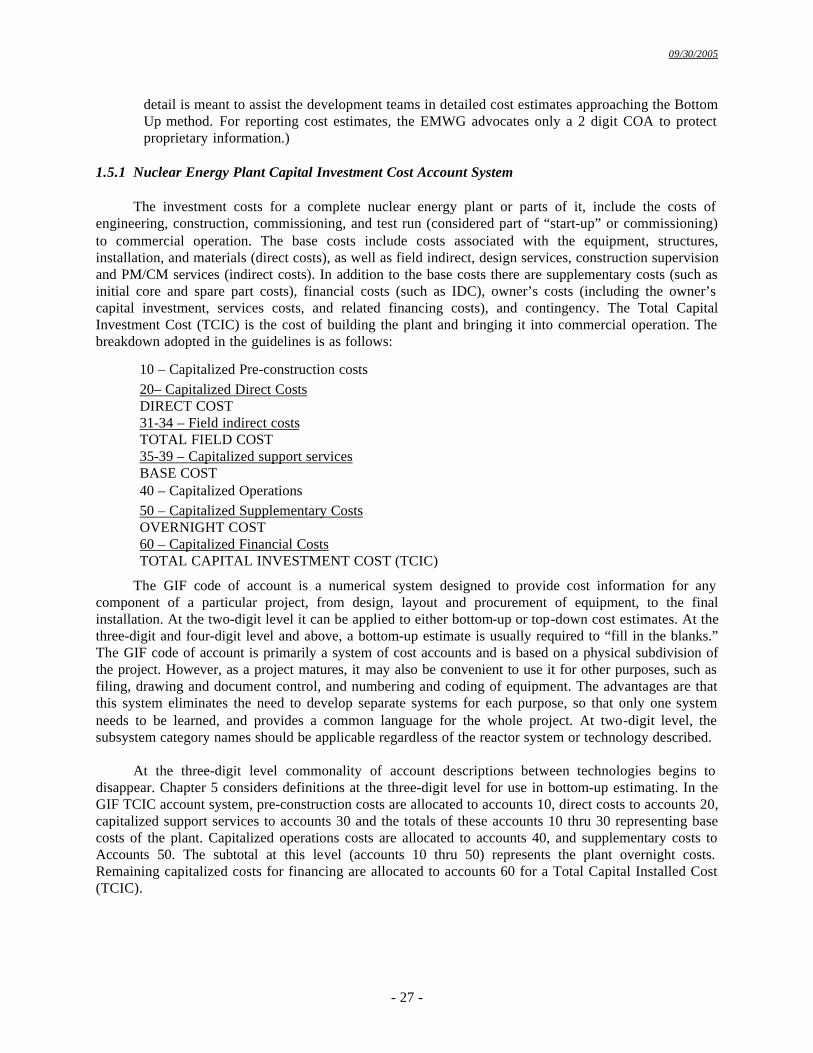
09/30/2005
- 27 -
detail is meant to assist the development teams in detailed cost estimates approaching the Bottom Up method. For reporting cost estimates, the EMWG advocates only a 2 digit COA to protect proprietary information.)
1.5.1 Nuclear Energy Plant Capital Investment Cost Account System
The investment costs for a complete nuclear energy plant or parts of it, include the costs of engineering, construction, commissioning, and test run (considered part of “start-up” or commissioning) to commercial operation. The base costs include costs associated with the equipment, structures, installation, and materials (direct costs), as well as field indirect, design services, construction supervision and PM/CM services (indirect costs). In addition to the base costs there are supplementary costs (such as initial core and spare part costs), financial costs (such as IDC), owner’s costs (including the owner’s capital investment, services costs, and related financing costs), and contingency. The Total Capital Investment Cost (TCIC) is the cost of building the plant and bringing it into commercial operation. The breakdown adopted in the guidelines is as follows:
10 – Capitalized Pre-construction costs 20– Capitalized Direct Costs DIRECT COST 31-34 – Field indirect costs TOTAL FIELD COST 35-39 – Capitalized support services BASE COST 40 – Capitalized Operations 50 – Capitalized Supplementary Costs OVERNIGHT COST 60 – Capitalized Financial Costs TOTAL CAPITAL INVESTMENT COST (TCIC)
The GIF code of account is a numerical system designed to provide cost information for any component of a particular project, from design, layout and procurement of equipment, to the final installation. At the two-digit level it can be applied to either bottom-up or top-down cost estimates. At the three-digit and four-digit level and above, a bottom-up estimate is usually required to “fill in the blanks.” The GIF code of account is primarily a system of cost accounts and is based on a physical subdivision of the project. However, as a project matures, it may also be convenient to use it for other purposes, such as filing, drawing and document control, and numbering and coding of equipment. The advantages are that this system eliminates the need to develop separate systems for each purpose, so that only one system needs to be learned, and provides a common language for the whole project. At two-digit level, the subsystem category names should be applicable regardless of the reactor system or technology described.
At the three-digit level commonality of account descriptions between technologies begins to
disappear. Chapter 5 considers definitions at the three-digit level for use in bottom-up estimating. In the GIF TCIC account system, pre-construction costs are allocated to accounts 10, direct costs to accounts 20, capitalized support services to accounts 30 and the totals of these accounts 10 thru 30 representing base costs of the plant. Capitalized operations costs are allocated to accounts 40, and supplementary costs to Accounts 50. The subtotal at this level (accounts 10 thru 50) represents the plant overnight costs. Remaining capitalized costs for financing are allocated to accounts 60 for a Total Capital Installed Cost (TCIC).
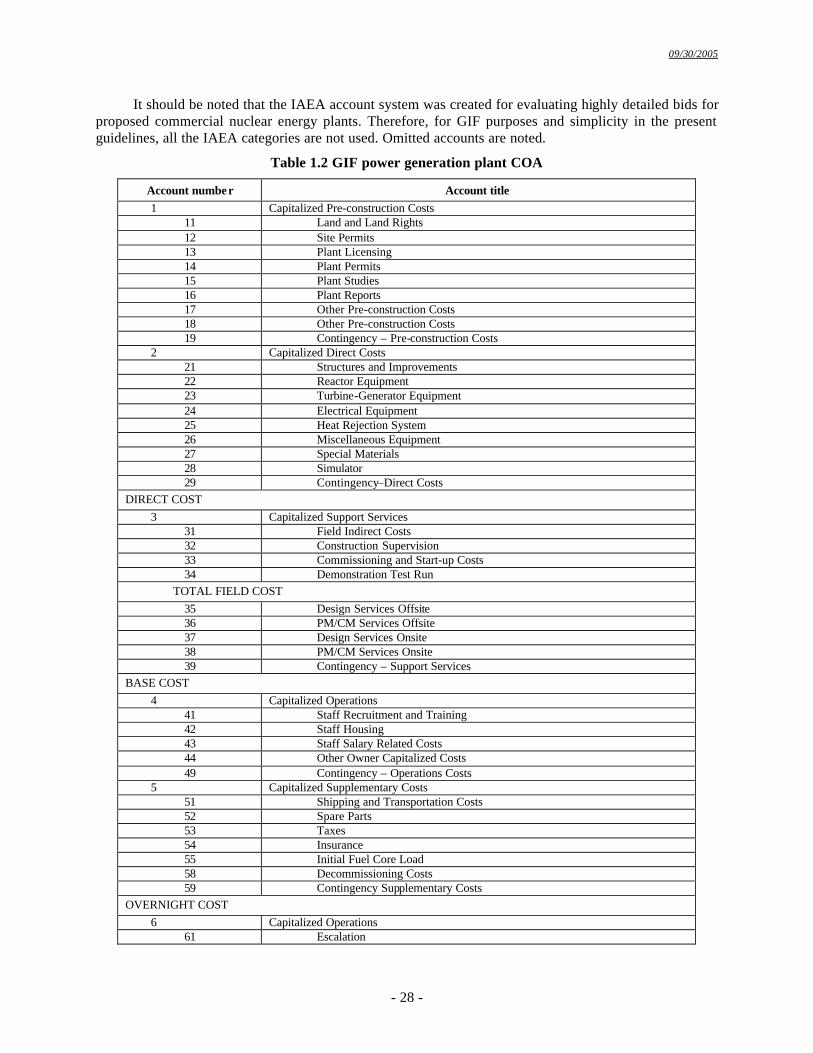
09/30/2005
- 28 -
It should be noted that the IAEA account system was created for evaluating highly detailed bids for proposed commercial nuclear energy plants. Therefore, for GIF purposes and simplicity in the present guidelines, all the IAEA categories are not used. Omitted accounts are noted.
Table 1.2 GIF power generation plant COA
Account number Account title 1 Capitalized Pre-construction Costs
11 Land and Land Rights 12 Site Permits 13 Plant Licensing 14 Plant Permits 15 Plant Studies 16 Plant Reports 17 Other Pre-construction Costs 18 Other Pre-construction Costs 19 Contingency – Pre-construction Costs
2 Capitalized Direct Costs 21 Structures and Improvements 22 Reactor Equipment 23 Turbine-Generator Equipment 24 Electrical Equipment 25 Heat Rejection System 26 Miscellaneous Equipment 27 Special Materials 28 Simulator 29 Contingency–Direct Costs
DIRECT COST 3 Capitalized Support Services
31 Field Indirect Costs 32 Construction Supervision 33 Commissioning and Start-up Costs 34 Demonstration Test Run
TOTAL FIELD COST 35 Design Services Offsite 36 PM/CM Services Offsite 37 Design Services Onsite 38 PM/CM Services Onsite 39 Contingency – Support Services
BASE COST 4 Capitalized Operations
41 Staff Recruitment and Training 42 Staff Housing 43 Staff Salary Related Costs 44 Other Owner Capitalized Costs 49 Contingency – Operations Costs
5 Capitalized Supplementary Costs 51 Shipping and Transportation Costs 52 Spare Parts 53 Taxes 54 Insurance 55 Initial Fuel Core Load 58 Decommissioning Costs 59 Contingency Supplementary Costs
OVERNIGHT COST 6 Capitalized Operations
61 Escalation
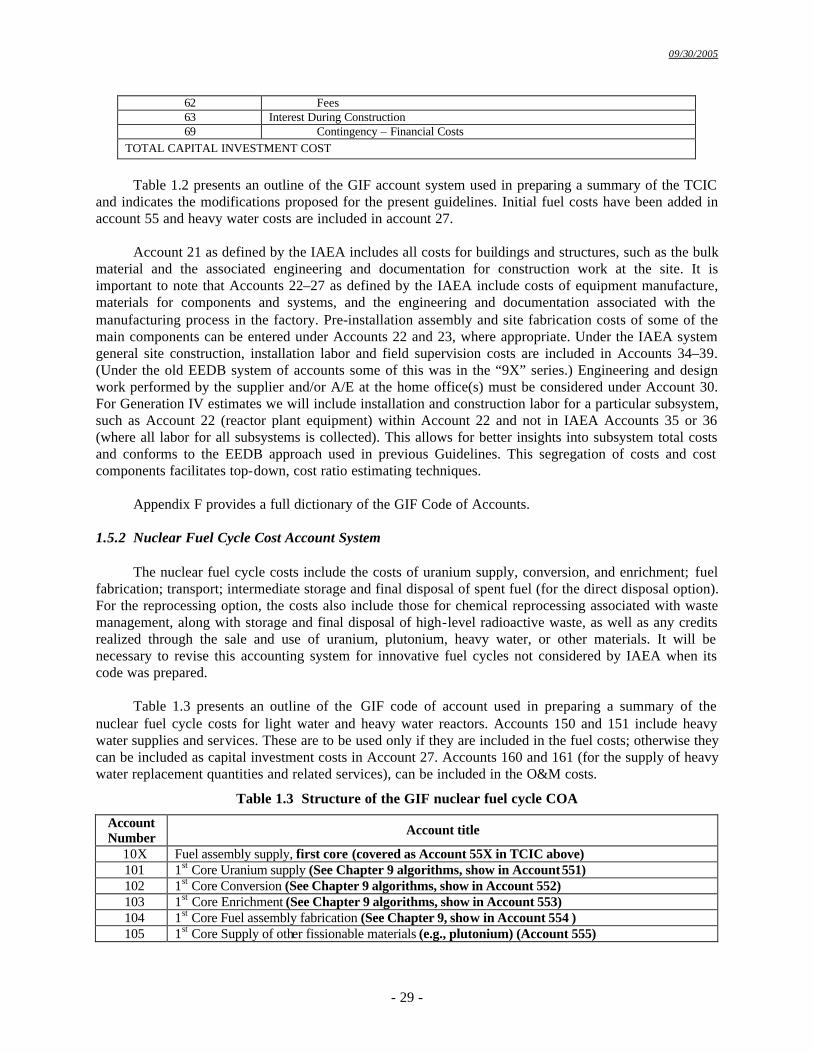
09/30/2005
- 29 -
62 Fees 63 Interest During Construction 69 Contingency – Financial Costs
TOTAL CAPITAL INVESTMENT COST
Table 1.2 presents an outline of the GIF account system used in preparing a summary of the TCIC
and indicates the modifications proposed for the present guidelines. Initial fuel costs have been added in account 55 and heavy water costs are included in account 27.
Account 21 as defined by the IAEA includes all costs for buildings and structures, such as the bulk
material and the associated engineering and documentation for construction work at the site. It is important to note that Accounts 22–27 as defined by the IAEA include costs of equipment manufacture, materials for components and systems, and the engineering and documentation associated with the manufacturing process in the factory. Pre-installation assembly and site fabrication costs of some of the main components can be entered under Accounts 22 and 23, where appropriate. Under the IAEA system general site construction, installation labor and field supervision costs are included in Accounts 34–39. (Under the old EEDB system of accounts some of this was in the “9X” series.) Engineering and design work performed by the supplier and/or A/E at the home office(s) must be considered under Account 30. For Generation IV estimates we will include installation and construction labor for a particular subsystem, such as Account 22 (reactor plant equipment) within Account 22 and not in IAEA Accounts 35 or 36 (where all labor for all subsystems is collected). This allows for better insights into subsystem total costs and conforms to the EEDB approach used in previous Guidelines. This segregation of costs and cost components facilitates top-down, cost ratio estimating techniques.
Appendix F provides a full dictionary of the GIF Code of Accounts.
1.5.2 Nuclear Fuel Cycle Cost Account System The nuclear fuel cycle costs include the costs of uranium supply, conversion, and enrichment; fuel
fabrication; transport; intermediate storage and final disposal of spent fuel (for the direct disposal option). For the reprocessing option, the costs also include those for chemical reprocessing associated with waste management, along with storage and final disposal of high-level radioactive waste, as well as any credits realized through the sale and use of uranium, plutonium, heavy water, or other materials. It will be necessary to revise this accounting system for innovative fuel cycles not considered by IAEA when its code was prepared.
Table 1.3 presents an outline of the GIF code of account used in preparing a summary of the
nuclear fuel cycle costs for light water and heavy water reactors. Accounts 150 and 151 include heavy water supplies and services. These are to be used only if they are included in the fuel costs; otherwise they can be included as capital investment costs in Account 27. Accounts 160 and 161 (for the supply of heavy water replacement quantities and related services), can be included in the O&M costs.
Table 1.3 Structure of the GIF nuclear fuel cycle COA
Account Number Account title
10X Fuel assembly supply, first core (covered as Account 55X in TCIC above) 101 1st Core Uranium supply (See Chapter 9 algorithms, show in Account 551) 102 1st Core Conversion (See Chapter 9 algorithms, show in Account 552) 103 1st Core Enrichment (See Chapter 9 algorithms, show in Account 553) 104 1st Core Fuel assembly fabrication (See Chapter 9, show in Account 554 ) 105 1st Core Supply of other fissionable materials (e.g., plutonium) (Account 555)
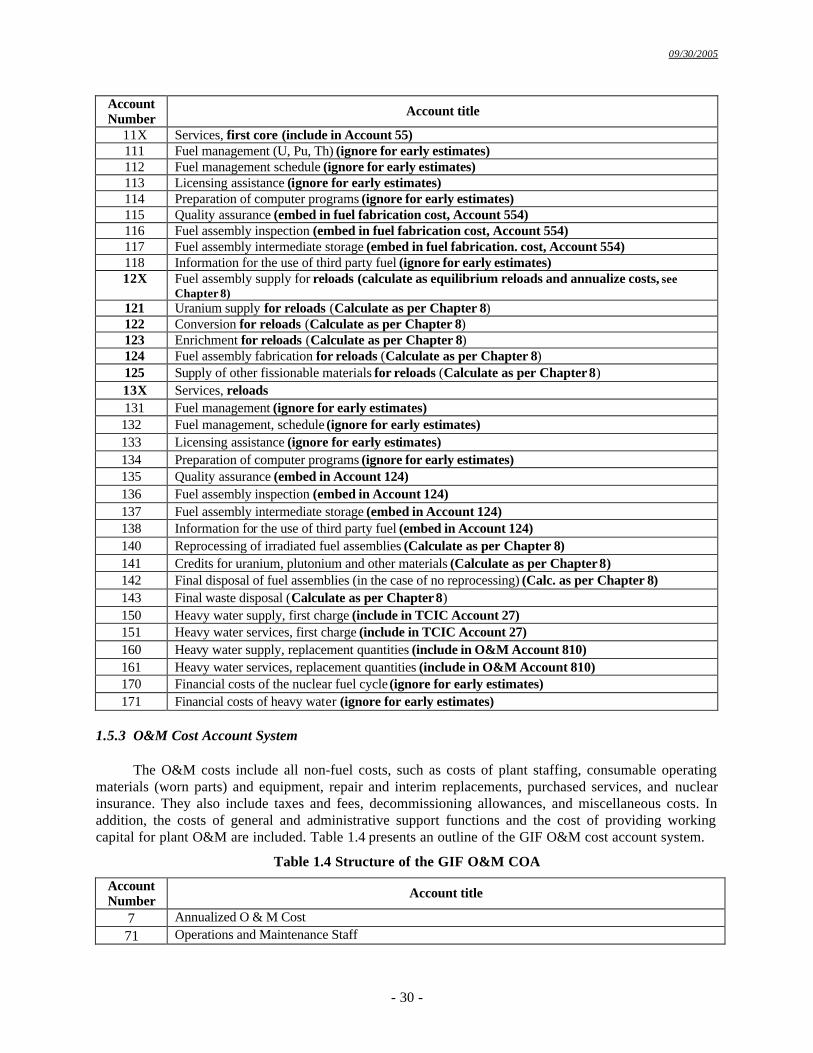
09/30/2005
- 30 -
Account Number Account title
11X Services, first core (include in Account 55) 111 Fuel management (U, Pu, Th) (ignore for early estimates) 112 Fuel management schedule (ignore for early estimates) 113 Licensing assistance (ignore for early estimates) 114 Preparation of computer programs (ignore for early estimates) 115 Quality assurance (embed in fuel fabrication cost, Account 554) 116 Fuel assembly inspection (embed in fuel fabrication cost, Account 554) 117 Fuel assembly intermediate storage (embed in fuel fabrication. cost, Account 554) 118 Information for the use of third party fuel (ignore for early estimates) 12X Fuel assembly supply for reloads (calculate as equilibrium reloads and annualize costs, see
Chapter 8) 121 Uranium supply for reloads (Calculate as per Chapter 8) 122 Conversion for reloads (Calculate as per Chapter 8) 123 Enrichment for reloads (Calculate as per Chapter 8) 124 Fuel assembly fabrication for reloads (Calculate as per Chapter 8) 125 Supply of other fissionable materials for reloads (Calculate as per Chapter 8) 13X Services, reloads 131 Fuel management (ignore for early estimates) 132 Fuel management, schedule (ignore for early estimates) 133 Licensing assistance (ignore for early estimates) 134 Preparation of computer programs (ignore for early estimates) 135 Quality assurance (embed in Account 124) 136 Fuel assembly inspection (embed in Account 124) 137 Fuel assembly intermediate storage (embed in Account 124) 138 Information for the use of third party fuel (embed in Account 124) 140 Reprocessing of irradiated fuel assemblies (Calculate as per Chapter 8) 141 Credits for uranium, plutonium and other materials (Calculate as per Chapter 8) 142 Final disposal of fuel assemblies (in the case of no reprocessing) (Calc. as per Chapter 8) 143 Final waste disposal (Calculate as per Chapter 8) 150 Heavy water supply, first charge (include in TCIC Account 27) 151 Heavy water services, first charge (include in TCIC Account 27) 160 Heavy water supply, replacement quantities (include in O&M Account 810) 161 Heavy water services, replacement quantities (include in O&M Account 810) 170 Financial costs of the nuclear fuel cycle (ignore for early estimates) 171 Financial costs of heavy water (ignore for early estimates)
1.5.3 O&M Cost Account System
The O&M costs include all non-fuel costs, such as costs of plant staffing, consumable operating
materials (worn parts) and equipment, repair and interim replacements, purchased services, and nuclear insurance. They also include taxes and fees, decommissioning allowances, and miscellaneous costs. In addition, the costs of general and administrative support functions and the cost of providing working capital for plant O&M are included. Table 1.4 presents an outline of the GIF O&M cost account system.
Table 1.4 Structure of the GIF O&M COA
Account Number Account title
7 Annualized O & M Cost 71 Operations and Maintenance Staff
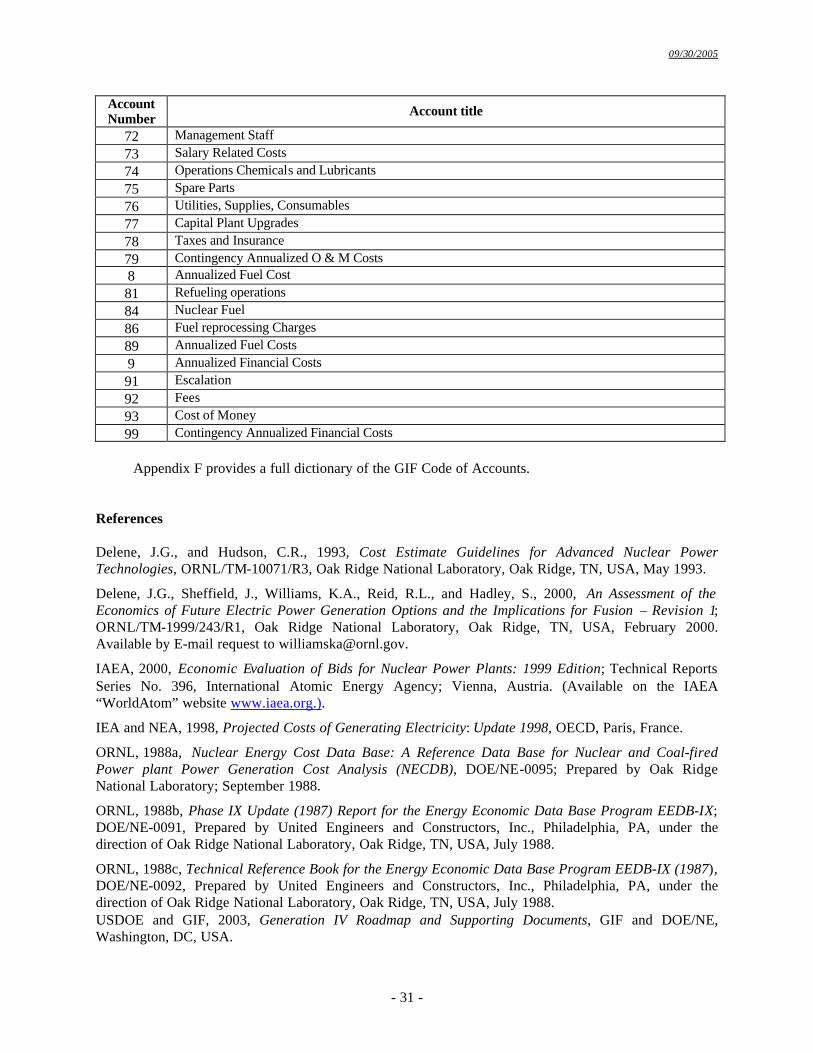
09/30/2005
- 31 -
Account Number Account title
72 Management Staff 73 Salary Related Costs 74 Operations Chemicals and Lubricants 75 Spare Parts 76 Utilities, Supplies, Consumables 77 Capital Plant Upgrades 78 Taxes and Insurance 79 Contingency Annualized O & M Costs 8 Annualized Fuel Cost 81 Refueling operations 84 Nuclear Fuel 86 Fuel reprocessing Charges 89 Annualized Fuel Costs 9 Annualized Financial Costs 91 Escalation 92 Fees 93 Cost of Money 99 Contingency Annualized Financial Costs
Appendix F provides a full dictionary of the GIF Code of Accounts.
References Delene, J.G., and Hudson, C.R., 1993, Cost Estimate Guidelines for Advanced Nuclear Power Technologies, ORNL/TM-10071/R3, Oak Ridge National Laboratory, Oak Ridge, TN, USA, May 1993.
Delene, J.G., Sheffield, J., Williams, K.A., Reid, R.L., and Hadley, S., 2000, An Assessment of the Economics of Future Electric Power Generation Options and the Implications for Fusion – Revision 1; ORNL/TM-1999/243/R1, Oak Ridge National Laboratory, Oak Ridge, TN, USA, February 2000. Available by E-mail request to [email protected].
IAEA, 2000, Economic Evaluation of Bids for Nuclear Power Plants: 1999 Edition; Technical Reports Series No. 396, International Atomic Energy Agency; Vienna, Austria. (Available on the IAEA “WorldAtom” website www.iaea.org.).
IEA and NEA, 1998, Projected Costs of Generating Electricity: Update 1998, OECD, Paris, France.
ORNL, 1988a, Nuclear Energy Cost Data Base: A Reference Data Base for Nuclear and Coal-fired Power plant Power Generation Cost Analysis (NECDB), DOE/NE-0095; Prepared by Oak Ridge National Laboratory; September 1988.
ORNL, 1988b, Phase IX Update (1987) Report for the Energy Economic Data Base Program EEDB-IX; DOE/NE-0091, Prepared by United Engineers and Constructors, Inc., Philadelphia, PA, under the direction of Oak Ridge National Laboratory, Oak Ridge, TN, USA, July 1988.
ORNL, 1988c, Technical Reference Book for the Energy Economic Data Base Program EEDB-IX (1987), DOE/NE-0092, Prepared by United Engineers and Constructors, Inc., Philadelphia, PA, under the direction of Oak Ridge National Laboratory, Oak Ridge, TN, USA, July 1988. USDOE and GIF, 2003, Generation IV Roadmap and Supporting Documents, GIF and DOE/NE, Washington, DC, USA.
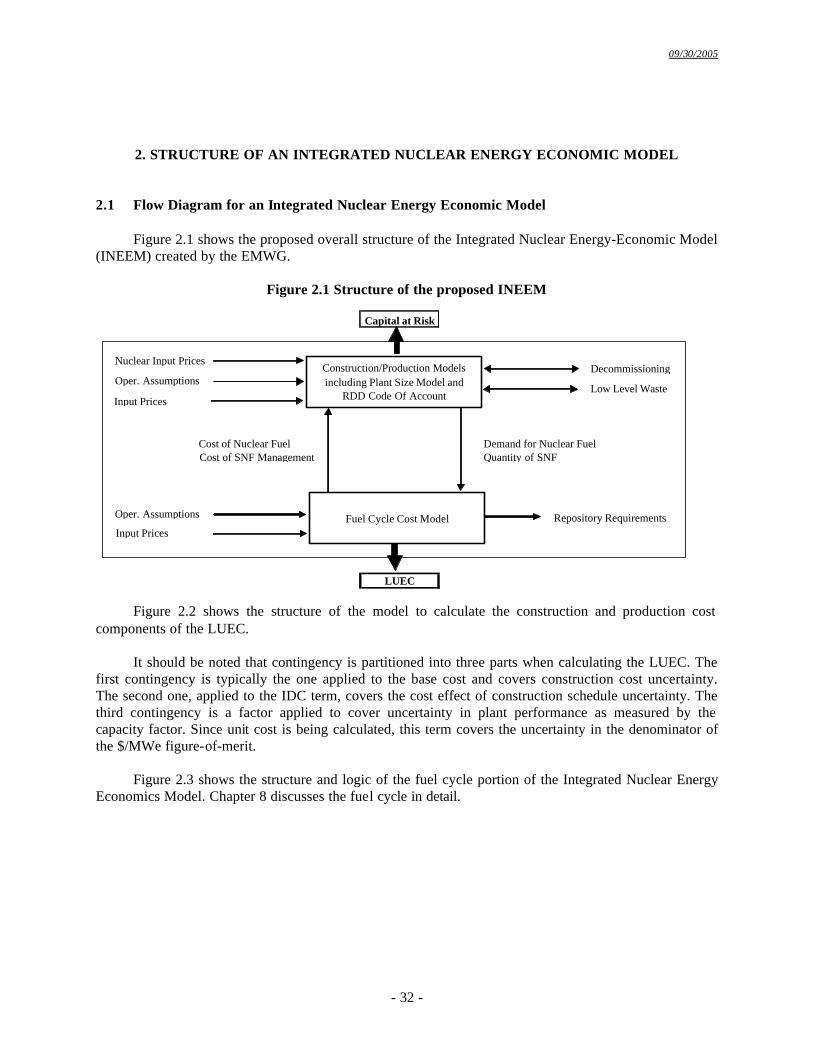
09/30/2005
- 32 -
2. STRUCTURE OF AN INTEGRATED NUCLEAR ENERGY ECONOMIC MODEL
2.1 Flow Diagram for an Integrated Nuclear Energy Economic Model
Figure 2.1 shows the proposed overall structure of the Integrated Nuclear Energy-Economic Model (INEEM) created by the EMWG.
Figure 2.1 Structure of the proposed INEEM
Capital at Risk
LUEC
Nuclear Input Prices
Oper. Assumptions
Input Prices
Construction/Production Models including Plant Size Model and
RDD Code Of Account
Decommissioning
Low Level Waste
Cost of SNF ManagementCost of Nuclear Fuel
Oper. Assumptions
Input PricesFuel Cycle Cost Model
Demand for Nuclear FuelQuantity of SNF
Repository Requirements
Figure 2.2 shows the structure of the model to calculate the construction and production cost
components of the LUEC. It should be noted that contingency is partitioned into three parts when calculating the LUEC. The
first contingency is typically the one applied to the base cost and covers construction cost uncertainty. The second one, applied to the IDC term, covers the cost effect of construction schedule uncertainty. The third contingency is a factor applied to cover uncertainty in plant performance as measured by the capacity factor. Since unit cost is being calculated, this term covers the uncertainty in the denominator of the $/MWe figure-of-merit.
Figure 2.3 shows the structure and logic of the fuel cycle portion of the Integrated Nuclear Energy
Economics Model. Chapter 8 discusses the fuel cycle in detail.
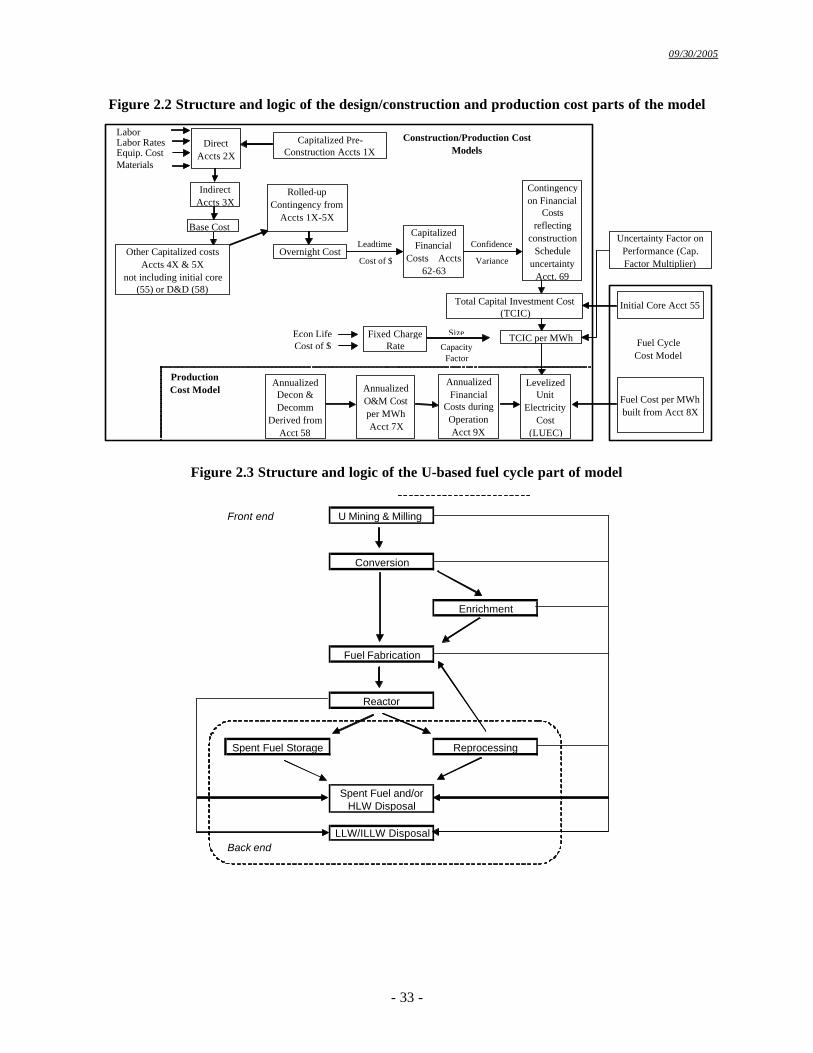
09/30/2005
- 33 -
Figure 2.2 Structure and logic of the design/construction and production cost parts of the model
Direct Accts 2X
Capitalized Pre-Construction Accts 1X
Indirect Accts 3X
Rolled-up Contingency from
Accts 1X-5X
Overnight Cost
Base Cost
Other Capitalized costs Accts 4X & 5X
not including initial core (55) or D&D (58)
Leadtime
Cost of $
Capitalized Financial
Costs Accts 62-63
Confidence
Variance
Contingency on Financial
Costs reflecting
construction Schedule
uncertainty Acct. 69
Total Capital Investment Cost (TCIC)
TCIC per MWhFixed Charge Rate
Size
Capacity Factor
Econ LifeCost of $
Levelized Unit
Electricity Cost
(LUEC)
Annualized Financial
Costs during Operation Acct 9X
Annualized O&M Cost per MWh Acct 7X
Annualized Decon & Decomm
Derived from Acct 58
Production Cost Model
Construction/Production Cost Models
Fuel Cost per MWh built from Acct 8X
Initial Core Acct 55
Fuel Cycle Cost Model
Uncertainty Factor on Performance (Cap. Factor Multiplier)
Labor Labor RatesEquip. CostMaterials
Figure 2.3 Structure and logic of the U-based fuel cycle part of model
Front end U Mining & Milling
Conversion
Enrichment
Fuel Fabrication
Reactor
Spent Fuel Storage Reprocessing
Spent Fuel and/or HLW Disposal
LLW/ILLW DisposalBack end
09/30/2005
- 34 -
2.2 Top-down Versus Bottom-up Cost Estimating
The models needed to assess the economics of Generation IV nuclear energy systems must be more than the arithmetical manipulation of dozens of two-digit level cost accounting categories and calculated figures of merit based upon the EMWG guidelines. They must be backed up by more detailed concept-specific cost estimates. This detailed estimating is the responsibility of the system development teams. The preparation of an estimate can take two paths: top-down or bottom-up, depending on the maturity of the concept, the financial resources available to the design/estimating team, and the type of scientific/engineering individuals on the system development team. These two paths are discussed below.
2.2.1 Bottom-up Estimating
This is the more familiar type of estimating applied to projects as they near construction. For large
nuclear projects Architect/Engineering (A/E) teams generally perform bottom-up estimating in conjunction with a utility. The A/E prepares a detailed baseline design with layout diagrams for all major systems. This estimate is prepared from the bottom up, i.e., from very detailed items, such as equipment lists, commodity quantity estimates by take-off from drawings or direct from conceptual 3D design models (“bricks and mortar”). Unit prices and unit labor-hour rates are then applied to the estimated quantities, extended and summarized to the code of accounts for the direct cost elements. Project execution plans provide basis for detail estimates of the field indirect costs, together with the construction schedule for the time related field indirect costs. This process is often described as working from “engineering take-offs” and requires a staff of at least a dozen engineers and estimators, even at the conceptual design level. The thousands of detail items and activities are then organized into a Code of Accounts at least to the three-or-four digit level for all categories. Activities are often subdivided into a “Work Breakdown Structure” or WBS that conforms to the COA and task schedule. The scheduling activity is also at a high level of detail and requires the use of scheduling software, such as “Primavera” systems. For use in the EMWG models, the highly detailed 3 to 6 digit COA entries must be rolled up to the two-digit level. Other estimates, such as those for operations, would require similar rollups from highly detailed staffing and consumables information. As bottom-up estimating proceeds, cost contingencies decline (expressed as a percentage of base costs at a fixed confidence level, e.g., 80% chance that an overrun of the base cost plus assigned contingency will not occur). Chapter 4 defines the kinds of Base Cost categories that are used in this type of estimating. As expected, this method must be backed up by data, such as unit costs of labor, commodities, installation rates, construction labor-hour estimates, and siting requirements. Chapter 4 of this document presents typical values for these unit rates. Chapter 6 presents the process for bottom-up estimating.
2.2.2 Top-down Cost Estimating
For projects early in their life cycle, top-down estimating techniques can be used. It is likely that many of the Generation IV systems will use these methods, since these systems are at an early stage of development. At this stage, the design/development/estimating staff is usually small, and financial resources are limited. The first task is to develop a reference design to which cost estimating techniques can be applied. The cost estimating part of this task generally is accomplished by considering the costs of systems and equipment used for similar projects and then scaling the system or equipment upwards or downwards. As an example, one might start cost estimating work on the VHTR by scaling reactor plant equipment from a project for which detailed estimates are available, such as the General Atomics HTGR.
Auxiliary costs and indirect costs are often calculated with standardized factors or formulas. For
example, calculating design costs as a fixed fraction, based on historical experience, of construction costs, can be done. With these formulas are sometimes found cost-scaling equations; however, at this time there exists no set of equations that can be used for all projects. These equations are equipment specific and
09/30/2005
- 35 -
must be developed by the designers and cost estimators working jointly. Several countries, including Argentina, Canada, and France, are using such an approach on advanced reactor design and estimating. Some of their work is discussed in Chapter 5. Despite its lack of cost detail, this method has the advantage that it can be used to optimize designs such that the lowest LUEC can be realized. Chapter 5 presents the process for top-down estimating.
2.3 Integration of Cost Estimating into the Design Process
Earlier Cost Estimating Guidelines were used to calculate the major cost figures-of-merit for a bottom-up reference or baseline design. Before the availability to designers of high-speed desktop computers and workstations, CADD tools, and data base systems, reactor system designs were nearly always fixed and completed before the detailed cost estimation process was initiated. Integration of nuclear core physics, thermal hydraulics, safety limits, etc., into one design was usually done manually. Value engineering was always used to guide the design process. However, it was unusual for cost estimating models or algorithms to be directly built into the engineer’s design tools. Usually, cost estimating guidelines were not considered until the formal bottom-up cost estimating process.
With new computational and data management tools, it is now possible to integrate cost estimation
directly into the top-down design process. This allows the possibility of LUEC and baseline capital cost optimization during design. For Generation I, II, and III reactor designs this procedure was not readily available. With the Generation IV design efforts there is opportunity for cost modeling to be directly integrated into the design process. One such costing process, used by AECL, is outlined in Appendix B.
The use of computer models integrating process science/engineering, performance, design, plant
layout, cost scaling, cost figures of merit, and optimization is not new and has been used extensively in chemical process industries (Williams, 1984). DOE-NE used Oak Ridge developed FORTRAN-based models of this type extensively in the mid-1980s to evaluate uranium enrichment technologies. Improved optimization tools coupled with reactor models are now being used for reactor design (Nisan et al., 2003; Grinblat et al., 2002). Cost estimating guidelines and “rules of thumb” are used to establish some of the scaling rules and calculation of figures of merit, such as LUEC. The “cost modules” use cost/size scaling equations for capital cost calculation and scaling relationships for variable costs within the O&M and fuel cost models. A model of this type was used for economic feasibility studies of the U.S. Atomic Vapor Laser Isotope Separation process and the Advanced Gas Centrifuge Enrichment process. If connected to single variable or multivariable sensitivity analysis software, such models can help the RD&D and deployment program identify those performance and cost parameters that have the most influence on projected unit cost, and therefore identify those parameters that should be given most priority in the RD&D program. 2.4 Figures of Merit of Interest in these Guidelines
A number of aggregated costs that can be calculated using the present guidelines are of high interest for GIF decision makers. These high level figures of merit are described below.
2.4.1 Costs to Research, Develop and Demonstrate the Generation IV Reactor System
These costs normally do not get factored into the cost of electricity (or other products); however, they represent a significant cost to the governments and/or industrial consortia that undertake RD&D of the various concepts. The decision makers need to know early the costs of these programs that could be in the hundreds of millions of US dollars before a demonstration unit is constructed. The demonstration costs could conceivably be in the 1-2 billion US dollar range for some concepts. Government, programmatic, and utility decision makers will ultimately need to consider the probable penetration of the
09/30/2005
- 36 -
various concepts in the electricity market and whether the RD&D costs are justified. Chapter 3 provides a generic list of the likely RD&D activities for the reactor and its fuel cycle, and an account system for organizing them. Some programmatic RD&D activities may benefit more than one concept, e.g., Generation IV reactor materials research. The high level figures-of-merit to be reported here are RD&D cash flows by year over the entire length of the RD&D program and their lump sum cost in constant money.
2.4.2 Capital At Risk
The specific capital investment cost of a nuclear power plant is calculated by dividing the TCIC (including base costs, owner’s cost, contingency, commissioning, initial core, and interest during construction) by the design net capacity of the plant. The usual unit for this figure of merit is constant monetary unit of the reference date (e.g., US dollar of January 2001) per net kWe. Calculation of total capital investment cost is covered in Chapter 7 and represents the Total Capital At Risk.
2.4.3 Annual Non-Fuel Operation Costs (O&M costs)
This figure of merit includes the total costs of the staffing, consumables, maintenance, subcontracts, overheads, etc., that comprise the normal year by year operations of the nuclear power plant. In some years there may be capital upgrades or capital replacements that cause “spikes” in the annual cost. However, developers/estimators should average these over the number of years of operation for the purpose of cost levelization (fuel reloads are to be considered separately). A contingency should be calculated within this total to cover uncertainties in this unit cost. This cost should be reported in constant money per year. Unless otherwise specified and justified this cost will be assumed constant over the economic lifetime of the plant. Chapter 8 lists the O&M cost categories and the IAEA account system code number for each. Payments to the dismantling and decommissioning (D&D) fund are often included in O&M. If the D&D component of the LUEC is to be calculated separately, which is preferable, the annual payments to the D&D fund should be removed from the O&M total.
2.4.4 Annual Fuel Cycle Costs
This cost is the annualized cost of the reload fuel required to sustain energy production. The schedule of payments may not be the same each year because of extended fuel residence times per cycle, now higher than one year, and the staggered way in which fuel cycle materials and services are purchased. To support the EMWG approach of levelized cost calculation, the total lifetime reload costs should be divided by the number of years of the lifetime, and reported in constant money per year. Chapter 9 lists the various activities, services, and materials that comprise these costs.
2.4.5 Levelized Unit of Energy Cost and its Components
The Levelized Unit of Energy Cost (LUEC) is the high level figure of merit of most interest to
utility decision makers. It is normally broken down into four main contributors to its total: a capital component (which includes up-front cost financing and amortization over the economic life); an O&M component; a fuel cycle component (fuel reloads); and a D&D component. The component costs and the total are generally expressed in constant money per unit of electricity/energy produced (e.g., US dollar/MWh). Calculation of LUEC is covered in Chapter 9.
09/30/2005
- 37 -
References Grinblat, P., Gimenez, M., and Schlamp, M., 2002, CAREM: Nuclear Safety Internalized Cost-Effectively from the Concept Genesis, Comision Nacional de Energia Atomica, Bariloche, Argentina. Nisan, S., Rouyer, J-L., Marcetteau, P., and Duflo, D., 2003, SEMER: a simple code for the economic evaluation of nuclear and fossil energy-based production systems, in Nuclear Engineering and Design 221 (2003) pp. 301-313. Williams, K.A.; 1984, A Methodology for Economic Evaluation of Process Technologies in the Early Research and Development Stages, KOA-5684, Oak Ridge Gaseous Diffusion Plant, August 1984, Oak Ridge, TN, USA. (Also a 1984 PhD thesis of the same title for the University of Tennessee, Knoxville, TN, CD-ROM version available from author/ E-mail: [email protected])
09/30/2005
- 38 -
3. ESTIMATING CATEGORIES FOR RD&D COSTS
3.1 Rationale for Selection of Categories for Estimation
One of the figures of merit for evaluation of Generation IV systems will be the projected costs of the Research, Development, and Demonstration-Prototype (RD&D) program. These costs include the design and construction of any prototype reactor and/or fuel cycle facility. However, within the GIF Program, it is unlikely that these costs will be amortized into the LUEC, or levelized cost of other products, resulting from commercial operation of Generation IV systems (FOAK and NOAK reactors). It is likely that most RD&D costs will be financed by governments, multi-governmental organizations, and/or public/private consortia. The fact that such organizational entities are willing to support large RD&D expenditures is driven by the perceived environmental, socioeconomic, national energy security, non-proliferation, and safety advantages of the Generation IV systems. In the future, the resulting projected costs for these systems will be weighed against their likely market penetration, i.e., how well a given system fits into a national grid and infrastructure, and how it can economically compete with other energy systems.
No existing Code-of-Accounts structure, such as the EEDB or those used in the Department of
Defense (DOD), fits nuclear reactor and fuel cycle RD&D costs. Based on DOE/NNSA past and present programs (such as the former New Production Reactors Program and the present Fissile Materials Disposition Program), it was possible to examine their Work Breakdown Structure and develop a generic RD&D COA. These can be divided into two major areas: reactor RD&D and fuel RD&D. It should be recognized that many of the required RD&D activities are dictated by fuel performance, safety, and regulatory requirements, such as the need to irradiate test fuel with post irradiation examination (PIE). New fuel cycles often require the design and construction of demonstration or pilot plant facilities. Table 3.1 lists the categories in a COA structure that should be found in a comprehensive generic Generation IV RD&D program.
3.2 Comprehensive COA for RD&D Activities
The expected technology development, planning, and prototype costs will be itemized and expressed in constant dollars as defined in Section 5.2 (Item 2). These include all costs necessary to bring a concept to the deployment/commercialization stage, but not including the FOAK plant costs, such as design and licensing. The first estimate of RD&D costs in the Generation IV program should have a 50% confidence level, such that the actual cost has a 50% chance of being in a particular cost range. The timing of each cost item (at 50% confidence level) should be identified. The confidence should increase with development of the technology. The cash flows for these items should be provided on an annual basis. The RD&D (including prototyping) categories of major costs for most Generation IV systems are further broken down in Table 3.1, which lists the generic categories of RD&D needed for a successful program. The prototype design and construction cost should be reported at the two-digit COA level. In addition to tabular cost data, a complete text description of the methods and assumptions used in developing the costs should be submitted with the cost data.
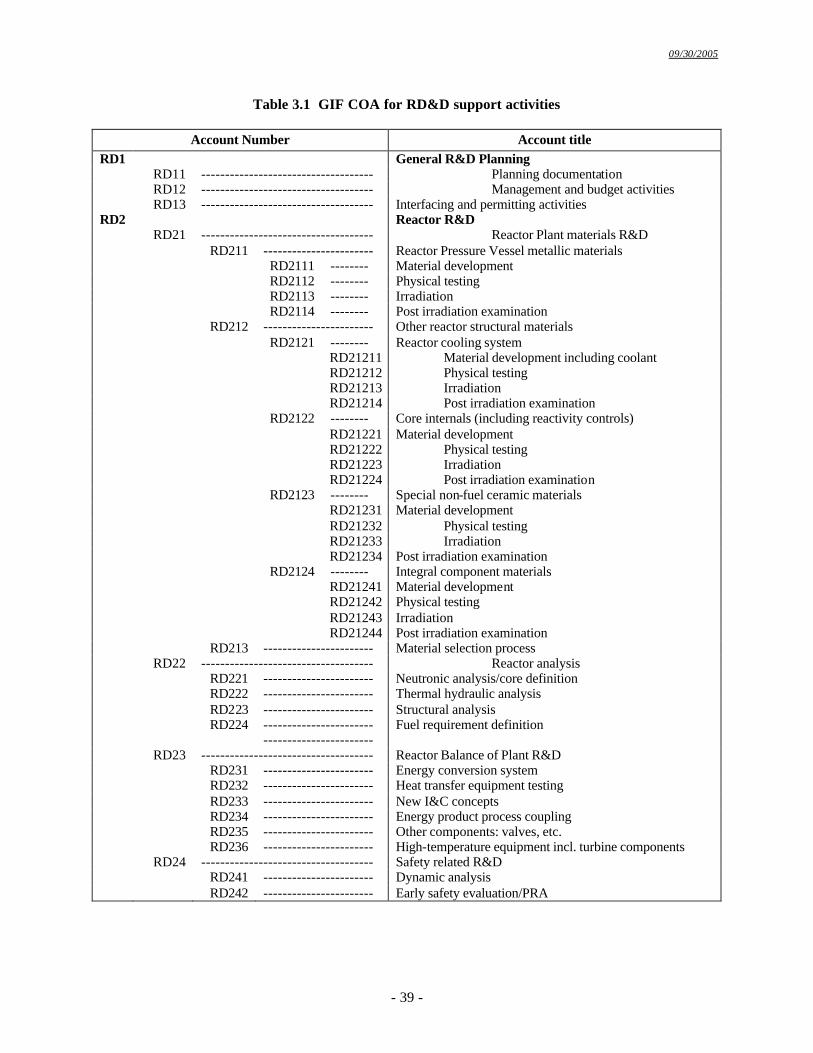
09/30/2005
- 39 -
Table 3.1 GIF COA for RD&D support activities
Account Number Account title RD1 General R&D Planning RD11 ------------------------------------ Planning documentation RD12 ------------------------------------ Management and budget activities RD13 ------------------------------------ Interfacing and permitting activities RD2 Reactor R&D RD21 ------------------------------------ Reactor Plant materials R&D RD211 ----------------------- Reactor Pressure Vessel metallic materials RD2111 -------- Material development RD2112 -------- Physical testing RD2113 -------- Irradiation RD2114 -------- Post irradiation examination RD212 ----------------------- Other reactor structural materials RD2121 -------- Reactor cooling system RD21211 Material development including coolant RD21212 Physical testing RD21213 Irradiation RD21214 Post irradiation examination RD2122 -------- Core internals (including reactivity controls) RD21221 Material development RD21222 Physical testing RD21223 Irradiation RD21224 Post irradiation examination RD2123 -------- Special non-fuel ceramic materials RD21231 Material development RD21232 Physical testing RD21233 Irradiation RD21234 Post irradiation examination RD2124 -------- Integral component materials RD21241 Material development RD21242 Physical testing RD21243 Irradiation RD21244 Post irradiation examination RD213 ----------------------- Material selection process RD22 ------------------------------------ Reactor analysis RD221 ----------------------- Neutronic analysis/core definition RD222 ----------------------- Thermal hydraulic analysis RD223 ----------------------- Structural analysis RD224 -----------------------
----------------------- Fuel requirement definition
RD23 ------------------------------------ Reactor Balance of Plant R&D RD231 ----------------------- Energy conversion system RD232 ----------------------- Heat transfer equipment testing RD233 ----------------------- New I&C concepts RD234 ----------------------- Energy product process coupling RD235 ----------------------- Other components: valves, etc. RD236 ----------------------- High-temperature equipment incl. turbine components RD24 ------------------------------------ Safety related R&D RD241 ----------------------- Dynamic analysis RD242 ----------------------- Early safety evaluation/PRA
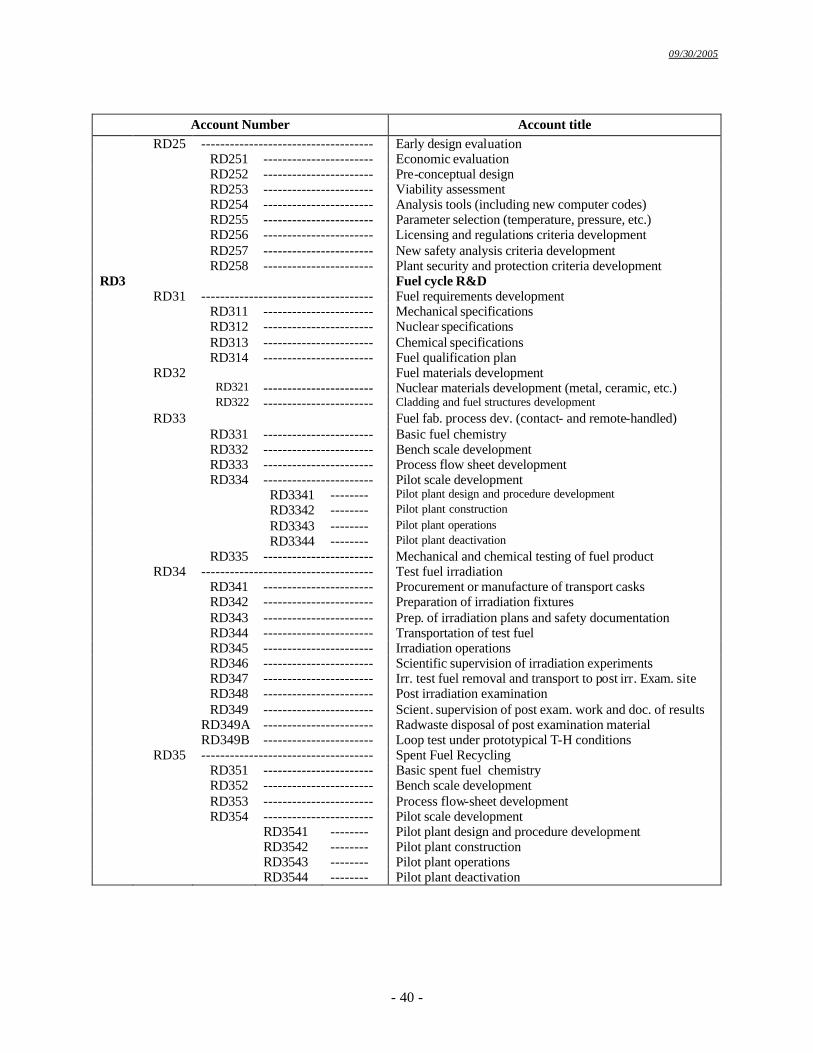
09/30/2005
- 40 -
Account Number Account title
RD25 ------------------------------------ Early design evaluation RD251 ----------------------- Economic evaluation RD252 ----------------------- Pre-conceptual design RD253 ----------------------- Viability assessment RD254 ----------------------- Analysis tools (including new computer codes) RD255 ----------------------- Parameter selection (temperature, pressure, etc.) RD256 ----------------------- Licensing and regulations criteria development RD257 ----------------------- New safety analysis criteria development RD258 ----------------------- Plant security and protection criteria development RD3 Fuel cycle R&D RD31 ------------------------------------ Fuel requirements development RD311 ----------------------- Mechanical specifications RD312 ----------------------- Nuclear specifications RD313 ----------------------- Chemical specifications RD314 ----------------------- Fuel qualification plan RD32 Fuel materials development RD321 ----------------------- Nuclear materials development (metal, ceramic, etc.) RD322 ----------------------- Cladding and fuel structures development RD33 Fuel fab. process dev. (contact- and remote-handled) RD331 ----------------------- Basic fuel chemistry RD332 ----------------------- Bench scale development RD333 ----------------------- Process flow sheet development RD334 ----------------------- Pilot scale development RD3341 -------- Pilot plant design and procedure development RD3342 -------- Pilot plant construction RD3343 -------- Pilot plant operations RD3344 -------- Pilot plant deactivation RD335 ----------------------- Mechanical and chemical testing of fuel product RD34 ------------------------------------ Test fuel irradiation RD341 ----------------------- Procurement or manufacture of transport casks RD342 ----------------------- Preparation of irradiation fixtures RD343 ----------------------- Prep. of irradiation plans and safety documentation RD344 ----------------------- Transportation of test fuel RD345 ----------------------- Irradiation operations RD346 ----------------------- Scientific supervision of irradiation experiments RD347 ----------------------- Irr. test fuel removal and transport to post irr. Exam. site RD348 ----------------------- Post irradiation examination RD349 ----------------------- Scient. supervision of post exam. work and doc. of results RD349A ----------------------- Radwaste disposal of post examination material RD349B ----------------------- Loop test under prototypical T-H conditions RD35 ------------------------------------ Spent Fuel Recycling RD351 ----------------------- Basic spent fuel chemistry RD352 ----------------------- Bench scale development RD353 ----------------------- Process flow-sheet development RD354 ----------------------- Pilot scale development RD3541 -------- Pilot plant design and procedure development RD3542 -------- Pilot plant construction RD3543 -------- Pilot plant operations RD3544 -------- Pilot plant deactivation
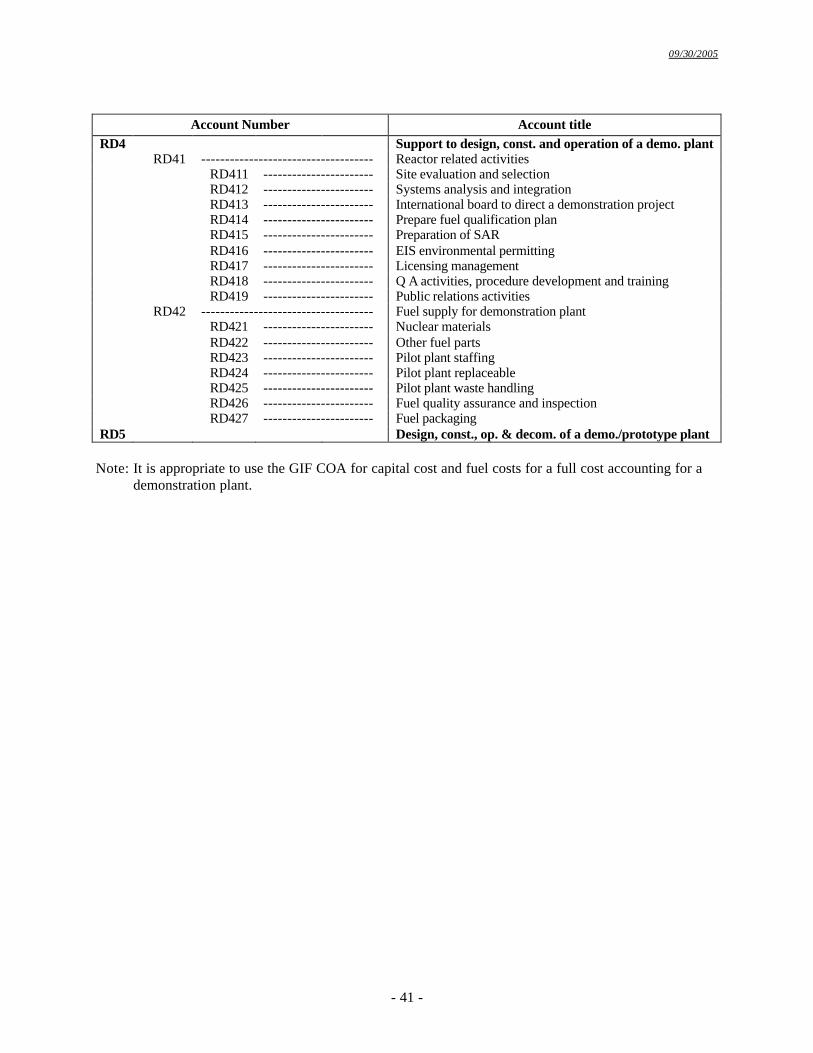
09/30/2005
- 41 -
Account Number Account title
RD4 Support to design, const. and operation of a demo. plant RD41 ------------------------------------ Reactor related activities RD411 ----------------------- Site evaluation and selection RD412 ----------------------- Systems analysis and integration RD413 ----------------------- International board to direct a demonstration project RD414 ----------------------- Prepare fuel qualification plan RD415 ----------------------- Preparation of SAR RD416 ----------------------- EIS environmental permitting RD417 ----------------------- Licensing management RD418 ----------------------- Q A activities, procedure development and training RD419 ----------------------- Public relations activities RD42 ------------------------------------ Fuel supply for demonstration plant RD421 ----------------------- Nuclear materials RD422 ----------------------- Other fuel parts RD423 ----------------------- Pilot plant staffing RD424 ----------------------- Pilot plant replaceable RD425 ----------------------- Pilot plant waste handling RD426 ----------------------- Fuel quality assurance and inspection RD427 ----------------------- Fuel packaging RD5 Design, const., op. & decom. of a demo./prototype plant
Note: It is appropriate to use the GIF COA for capital cost and fuel costs for a full cost accounting for a
demonstration plant.
09/30/2005
- 42 -
4. GENERAL GROUND RULES AND ASSUMPTIONS
4.1 Introduction This chapter describes the general ground rules to be followed in developing the base construction
capital cost for the advanced concepts. Additional ground rules and assumptions that apply to the top-down estimating approach are included with Chapter 5 and specific ground rules that apply to the detail bottom-up estimating approach are included with Chapter 6.
Nearly all these ground rules are based on design and construction practices in the United States for
past and existing nuclear projects. The EMWG is in the process of incorporating specific input from other regions and conversion of measurement units to international standards, as such information can be found.
4.2 Project Execution
The assumptions on the organizational structure to be used in developing the cost estimate are described below. These are based on traditional US business practices. Generation IV nuclear system projects may have a non-traditional structure. The project management structure must minimize risk and complete the plant on time and on budget. 1. Overall project management for an energy system will be provided by an integrated utility, a
generating company (GENCO), or another entity engaged in the direct production of commercial energy. For regional fuel cycle facilities, a chemical or nuclear service company already engaged in this line of business is assumed to provide overall project management. For module fabrication, a heavy machine fabricator or shipbuilder is assumed to handle management responsibility. If fuel cycle or end-use facilities are on the reactor site, their owners will bear their part of project management responsibilities.
2. A single reactor manufacturer (RM) and a single A/E contractor (i.e., single mark-ups for their services) will be employed to design NSSS and other nuclear plant equipment, to design plant buildings and structures, to prepare all technical documentation and reports, to provide all procurement services and to support construction activities.
3. A single construction manager, who may also be the A/E, will be responsible for providing PM/CM services to manage all construction activities.
4. These assumptions do not exclude a single vendor/generating entity that would supply and construct commercial facilities. The estimator must clearly state all assumptions regarding organizational structure.
5. Construction of the project will be estimated based on work being performed on a regular working week. Alternative schedules such as double shift or rolling 4-10s, may be addressed in addendum.
4.3 Commercialization Plan
1. This is the first phase of project development through the R&D phase. Each technology will be
evaluated for compliance with the stated goals of this phase before approval to proceed to phase II – conceptual design.
2. Successful designs may proceed to phase III – detailed design, including any prototype or demonstration testing and concluding with plant certification of a standard design.
09/30/2005
- 43 -
3. Commercial plant commitments for multiple plants will be obtained before the first commercial plant (FOAK) construction on an approved site.
4. All project services, procurement and construction award will be based on competitive bids for a series of identical plants.
5. Dedicated factory facilities for fabrication of plant equipment or factory modules will be constructed or adapted to support construction of the FOAK plant.
6. The development of fuel fabrication facilities may proceed concurrent with the conceptual design and detail design phases for the power plant dependant on the source of first reactor fuel.
7. Fuel reprocessing facilit ies may proceed concurrent with the power plant conceptual design and detail design phases, depending on scheduled requirements for reprocessing services.
8. Subsequent plants up to NOAK plant will be constructed without any significant changes in the certified design.
9. NOAK plant is defined as the next plant after 8 GWe of plant capacity has been constructed. This rating, together with consideration of plant capacity, sequence and timing of unit construction provide a basis for calculation of learning affect on cost of plants between the FOAK and NOAK plants.
10. For purposes of sizing the fuel fabrication and reprocessing facilities, a nominal fleet size of 32 GWe is to be assumed for each reactor type.
11. Detail design, certification and other non-recurring costs will be separately identified and assumed to be amortized over the plants prior to NOAK plant.
4.4 Estimate Components
Describe estimate components and identify how they are handled in the estimating process and COA. - Unit, Common, recurring, NI/BOP, FOAK, NOAK, Direct, Indirect, Schedule, Contingency, Phases of project development, Power/product, dedicated factory, Fuel fabrication, reprocessing, capitalized, annual, financing, decommissioning, LUEC,
4.5 Project COA 1. The GIF COA (originally derived from the IAEA and EEDB COA) will be the structure used for cost
estimates. Used by ORNL, the EEDB COA was an evolutionary expansion and modification of the NUS 531 COA. The EEDB also served as the basis for the capital part of the IAEA account system described in (IAEA, 2000). Sample EEDB COA for the advanced liquid metal reactor (ALMR), the modular high-temperature gas-cooled reactor (MHTGR), and a light water reactor are given in Appendices A, B, and C of (Delene, 1993). See Appendix F for full GIF COA structure and dictionary.
2. The use of a consistent COA structure facilitates top-down estimating techniques when reference plant data and estimate details are summarized to the desired level for facility, system, or major equipment component. These estimate summaries are then adjusted by cost factors developed for the required plant relative to the reference plant parameter. All the available reference plant estimate details can then be incorporated into the subject plant estimate inclusive of commodity quantities, hours, equipment, and material costs.
3. Reference plant detail estimates summarized by COA can provide bulk commodity ratios to equipment cost that can subsequently provide the basis for current estimate with current pricing of process equipment costs.
4. Within the structure of GIF COA, each technology is to develop a detail COA that uniquely defines the specific plant features to ensure full and exclusive scope for the project.
09/30/2005
- 44 -
5. The COA will be the basis for subsequent project development of equipment numbering, plant area designations, drawing register and other consistent identity applications throughout the plant life, including operations.
4.6 Project Scope Definition 1. Whenever possible, the cost estimates will reflect the plant requirements and design as detailed in the
Design Requirements, System Design Descriptions (SDDs), and other formal design documentation for the given concept. Individual system boundaries will be defined in the SDDs. It is recognized that none of the Generation IV concept designs have evolved to the point that these documents are available.
2. It is expected that each reactor concept project scope definition will consist of facilities and systems that are developed specifically for the reactor concept, some systems that can be adapted from reference plant data and others that can be extracted entirely from reference plant information. For example, the reactor system may require unique design, while the reactor cooling system could be an adaptation from reference plant design with appropriate cost factors and some BOP systems may be completely defined by reference plant data. Different estimating techniques may be employed as appropriate for each type of project scope definition.
3. As an aid in establishing system-to-system boundaries for COA definition and costing purposes, the following general guidelines are given. These apply to reactor and fuel cycle facility concepts for which the design is at least at the conceptual level.
4. The cost for all electrical power terminations, including connectors, should be borne by the electrical power system. For the trace heating system, the interface with the electrical power system is the individual heater controllers. For building service power and lighting systems, the interface with the electrical power system is the individual power lighting panel.
5. The expense for terminating instrumentation and control cabling and wiring (with the exception of control system fiber optic cabling) should also be included in the electrical power system. This includes terminations with individual sensors as well as providing electrical interconnections between panels, cabinets, consoles, data processing units, controllers, etc. The expense for terminating the control system fiber optics is included with the control system.
6. Costs for routing, laying or pulling wire and cable in ducts, conduits, and trays will be included in the electrical power system.
7. The costs for attachments to structures (e.g., anchor bolts and auxiliary steel) should be borne by the equipment item requiring the support. Embedments (such as sleeves and attachment plates) are included in the cost of structures.
8. The cost estimate for a system, equipment, facility, or structure will include those costs associated with fabricating, installing, and/or constructing the particular item described in the SDDs or Building and Structures Design Descriptions (BSDDs).
9. For costing purposes, the boundaries of a system, facility, or structure are as defined in the SDDs or BSDDs and in the piping and instrumentation diagrams (P&IDs).
10. The industrial non nuclear-safety portion of each plant is designed and erected to the same standards as a conventional fossil-fuel power plant. Only the nuclear-safety-grade structures and equipment require the more elaborate procedures, documentation, and Q/A-Q/C overview. Any on-site fuel manufacturing, handling, and reprocessing, or other fuel cycle facilities, will be assumed to be nuclear-safety-grade.
11. Project scope definition for the indirect cost is typically defined by other than design documents. Field indirect costs are influenced by the project execution plan, construction schedule and major contracting decisions. The indirect cost is also very dependant on the direct costs of construction.
09/30/2005
- 45 -
Direct hours are of major consideration for both the construction schedule and the magnitude of indirect support required. To this end, it is vital that direct hours are quantified throughout the estimating process and are available by category of work or craft.
12. Non-manual services for field and home office are typically defined by manpower and durations for major tasks involved with each COA scope. The level of detail for the tasks involved will progress from initial summary levels in conceptual estimates to detail tasks with sequence logic in finalized estimates.
13. Engineering and Home Office Services includes the A/E costs for design, engineering, procurement, cost engineering, Q/A−Q/C, reproduction services, etc. (Account 35 and 37).
14. Any module fabricator (factory owner) costs for engineering, Q/A, etc., should be separately shown. Reactor design costs by the manufacturer should also be separately shown.
4.7 Inclusions/Exclusions/Qualifications
1. It is assumed that all engineering and cost information, including specifications, drawings, and virtual
construction and sequence (CADD output) and that all equipment, material, and labor resources are available as required.
2. It is assumed that the baseline construction requires no premium time (overtime) work to recover from schedule delays. Costs for possible schedule recovery overtime will be reflected in the contingency cost (see Section 6.3). The use of premium time for normal baseline construction over and above a standard working week should be identified.
3. It is assumed that funding is available as required to support uninterrupted design, testing, construction, installation, checkout, and plant startup.
4. Cost items to be excluded from the base construction cost estimate include items beyond the plant bus bar, such as the switchyard and transmission lines. See plant site definition in Appendix D for other site related assumptions.
4.8 Project Estimate
Assumptions and general ground rules for project estimate are provided by subject in the following subsections, starting with overall project estimate below. 1. The base construction cost estimates will be developed so that they are the most likely cost for a
particular cost entry without any IDC, escalation, or contingency as defined in Section 1.4. All values defined as costs to the buyer include supplier profit margins.
2. Estimate details are to be summarized to level 2 of COA and provide input to other cost models for calculating LUEC.
3. The cost estimate entries for a given direct or indirect cost should be based on quantities of commodities/materials and equipment together with unit costs (see Tables 4.4 through 4.6). The installation costs should be based on quantities, installation rates (see Tables 4.7 through 4.9) and labor rates (see Tables 4.1 through 4.3) The basic cost algorithm for a particular account code is: Cost = Labor Costs (craft labor installation or structure construction) + Material Costs (concrete, rebar, etc.) + Equipment Costs (including profit, taxes, and vendor engineering), where: Labor Cost = (number of commodity units) x (unit installation rate hr/unit) x (unit labor cost/hr) Equipment Cost = (number of units required in plant) x (cost per unit) Material Cost = (number of units required in plant) x (cost per unit).
09/30/2005
- 46 -
4. The unit installation rate describes how many hours it takes to install a given commodity unit, e.g., how many labor-hours it takes a crew to pour a cubic meter of concrete. A given account code may be the summation of several different equipment items, commodities, and types of craft labor involved.
5. All construction will be estimated as direct hire, including specialty contractors. All field labor will be quantified and included as labor cost. Process equipment will be separated from all other equipment and material costs.
6. Estimate reporting requirements are discussed in Section 4.12.
4.8.1 Estimate Pricing Date and Currency 1. Cost estimates will be reported in constant dollars of January 1, 2001. 2. Bulk commodity unit hour installation rates are given in Tables 4.7 through 4.9 for nuclear and
non-nuclear construction practices. Bulk commodity definitions are given in Table 4.10. The craft labor rates shown in Table 4.1 were obtained from escalation of Mean’s Construction Data (Reed Business, 1992), for year 2001 for a medium labor cost U.S. site. Tables 4.2 and 4.3 show the corresponding craft labor rates for Europe and Asia regions. The labor installation rates were developed by applying a productivity factor to estimating standard rates. Nuclear productivity factors were developed from a set of early nuclear projects, which did not experience post-TMI (Three Mile Island, March 1979) back-fitting. Non-nuclear installation rates were developed from current fossil power project experience. The commodity installation rates (Table 4.7) are not a complete set of such information needed to cost a plant design, but are provided as an example of the productivity level for the construction scope. The composite costs of bulk commodities shown in Table 4.4 were escalated from historical data by Whitman et al., 1992 index for the North-Central Region of the U.S. The bulk commodity unit costs (Tables 4.4 through 4.6) are intended to be a measure of bulk commodity pricing levels for the different regions. Any exception to the labor rates, commodity prices and installation labor hours shown on Tables 4.1 through 4.10 should be justified.
3. The estimator will use cost information relevant to the reference date (January 1, 2001, for current studies) where possible. If such information is not available, costs in terms of another reference year may be adjusted, where applicable, using appropriate cost indices. Examples of such adjustment factors using both the Gross Domestic Product implicit price deflator and the Handy-Whitman cost index for Nuclear Production Plant Electric Utility construction costs (North Central region) are given in Table 4.11.
4.8.2 Direct Equipment and Material Pricing
1. Assume that the cost of using any government-owned or operated facility is estimated at full cost
recovery, including all direct costs, related indirect costs, and any other related general and administrative costs.
2. All construction and installation costs may reflect a separated construction concept whereby nuclear-safety grade and Seismic Category 1 construction are separated from conventional industrial (non nuclear safety) construction. All costs of equipment, materials, storage, quality assurance (Q/A), quality control (Q/C), and labor productivity for the non nuclear-safety areas will reflect conventional nuclear industrial practice. The portions or fractions of the plant constructed under each construction grade shall be documented.
3. If a plant uses a new, dedicated factory for producing construction modules for the NSSS and/or balance of plant (BOP), the proper amortization of the factory cost over its production life must be included in the FOAK and subsequent plant costs. If an existing factory/plant is used, or if a separate
09/30/2005
- 47 -
business model has been adopted for dealing with those costs, the basis for site-delivered cost assumptions should be reported. These should include factory construction cash flow, capitalization, operations cost, and amortization assumptions (e.g., number of units assumed for factory capital cost recovery).
4. Majority of the Equipment for Nuclear Power Plant systems are expected to be world-wide pricing levels and not differ significantly by region. Equipment costs are to be inclusive of vendor design, fabrication, testing and certification, packing for in-country shipment and normal 12 months warranty. The costs are delivered to site, excluding freight forwarding, ocean shipment and customs clearances. The costs include allowances for installation materials and any construction spares; any pre-service maintenance requirements are also included. Plant start-up, commissioning and operational spares for 12 months are to be included with indirect accounts.
5. Majority of the non process equipment and materials for nuclear power plant facilities or systems are expected to be world-wide pricing levels and not differ significantly by region. Some bulk commodities such as concrete, lumber, small pipe, miscellaneous steel, embedded metals and similar locally procured items may differ by region and the pricing levels depicted by the sample unit costs in Table 4.4 need to be provided with the estimate submission.
4.8.4 Direct Labor Productivity
1. All plant construction will be accomplished by the labor force with exception of specialty tasks
subcontracted by the A/E. Costs for all tasks, including subcontracted tasks, must be reported as equipment cost, material cost, labor hours and labor cost per hour. Specialty subcontractor overheads are typically included with material costs.
2. The unit hour rates depicted in table 4.7 are representative of the productivity determined for US advanced nuclear plant construction. A productivity factor was determined for a mid USA site based on actual construction experience (pre TMI event) adjusted for benefits of a standard nuclear power plant with complete design that has been pre-certified. The rates were calculated by applying the productivity factor to a set of standard unit hour rates for all construction activities.
3. The rates are representative of a standard working week for a commercial plant, better than a test or demonstration facility. Additional improvements may be applicable for NOAK plant, see section 4.10 and appendix E.
4.8.5 Labor Cost/Hour 1. Labor rates for craft labor employed to assemble equipment at any on-site fabrication shop will be the
same as construction crew rates. Off-site craft rates at a module factory are likely to be lower and the work more productive, steady and safer than for on-site fabrication, but will incur factory overheads.
2. Composite cost per hour for manual labor includes a craft mix for the category of work; craft crew consisting of journeyman, foreman and apprentices; craft wages; premium cost (if any); travel or living allowances, geographic factors, merit factors, public holidays, sick leave; vacation pay; pension funds; medical insurance; unemployment insurance; and all labor related costs paid by employer such as taxes and insurance.
3. Construction camp related costs for housing; meals and transport are excluded from the composite cost per hour, if required, should be included with the indirect accounts.
4. Other labor related costs such as tools, supplies and consumables are excluded from the composite cost per hour and are to be included with the indirect accounts.
5. Composite labor costs (base rate plus fringe benefits) to be used for the U.S. site in 2001 dollars are given in Table 4.1.
09/30/2005
- 48 -
6. Composite costs per hour for non-manual personnel include payroll, payroll additives, bonus, incentive pay, taxes, insurance, superannuation or retirement funds, and other payroll related costs. Excluding office supplies, office equipment, office space, travel, relocation, training or other ancillary costs.
4.8.6 Field Indirect Costs 1. Indirect cost accounts consist of all costs that are not directly identifiable with specific permanent
plant, such as 31 - field indirect, 32 - construction supervision, 35 & 37 design services, and 36 & 38 PM/CM services.
2. Material handling for major equipment is to be included with direct accounts. Maintenance of permanent plant equipment prior to plant start-up is to be included with direct accounts. Crane operators and truck drivers for support of direct account activities are to be included with direct accounts.
3. Only multi purpose, multi craft scaffolding and staging is to be included with indirect accounts 31. Single craft scaffold and mobile platforms are with direct accounts.
4. Individual craft clean-up is with direct accounts, general site clean-up and trash handling is with indirect accounts 31.
5. Installation spares are with direct accounts, spare part requirements during testing is with indirect accounts 33 or 34. Operating spares are with supplementary cost account 52.
6. Construction testing of installed systems is with direct accounts. System pre-operational testing and start-up activities are with indirect account 33. Plant demonstration test run is with account 34, Operator recruitment, training and other associated costs are with owner account 40.
4.9 Region and Site Definition
The following regions have been considered in the present version of the Guidelines for
development of plant estimate: Americas, Asia and Europe. 1. Site/Seismic conditions for each region are considered in Appendix D. Most current North American,
Asian or European reference site data is proprietary and cannot be used in this report. It will be necessary to eventually collect and/or develop such data.
2. Site land (Account 11) should be based on the estimated site area, including any buffer zones (200 hectares minimum) and a cost of $37 000/hectare in the United States. It is assumed that the total land cost is incurred at the same time as the decision is made to build a plant.
4.10 FOAK Plant
The following assumptions apply to costing the FOAK plant. 1. The costs for this plant should not include any RD&D (including prototype) costs. They can include
site-delivered equipment costs from a dedicated factory and design certification costs. The total FOAK plant cost has two basic parts as shown in Fig 1.1 under “deployment”: the standard plant cost, i.e., the types of costs that will be repeated in subsequent costs (site-related design and construction); and the true FOAK costs, such as first-of-kind design and design certification costs. If there are exceptions to this, these must be clearly identified. Regarding fuel cycle FOAK costs, the fuel cost for all units, FOAK through NOAK, will include its fair share of the life cycle costs for a new fuel cycle facility constructed either on-site or off-site. Fuel facility construction costs are part of these fuel-related life cycle costs.
09/30/2005
- 49 -
2. Each system development team (Proponent) will perform the estimates for the standard FOAK plant based on current construction experience for similar facilities. Learning experience can be included for NOAK plant based on learning factors to be developed by each team. Guideline factors for each doubling of construction experience are 0.94 for equipment costs, 0.90 for construction labor and a 10% reduction in material costs for multi plant orders.
3. The cost estimate will include the cost for all site-specific licensing or pre-licensed sites. A generic plant design approval (certification) is part of the FOAK non-recurring deployment costs.
4. Standard plant costs include all engineering, equipment, construction, testing, tooling, project management costs, and any other costs that are repetitive (recurring) in nature and would be incurred in building an identical plant. A sample listing of mostly site-related repetitive engineering and management tasks is presented in Appendix C.
5. Appendix E deals with learning and the relationship between the capital costs of the POAK, FOAK, and NOAK plants. Because system development teams are estimating FOAK costs, Appendix E discusses how POAK and NOAK costs can be reasonably estimated from FOAK costs.
4.11 NOAK Plant
The following assumptions apply to costing the NOAK plant. • Design is identical or nearly identical to the first commercial plant (any engineering or license
changes from the FOAK must be amortized) • The plant site is enveloped by the reference site conditions. • No product improvements are incorporated; that is, the first commercial plant design is frozen.
• Equipment manufacture and plant construction are performed by the same contractors as for the first set of plants.
• All project services, procurement and construction award will be based on competitive bids for a series of identical plants.
• There are no changes in USNRC (or other national) regulations or major codes and standards subsequent to the first plant.
• The cost estimate will include the cost for all site-specific licensing or pre-licensed sites. A generic plant design approval, e.g., design certification in the United States is assumed.
• Plant costs include all engineering, equipment, construction, testing, tooling, project management costs, and any other costs that are repetitive in nature and would be incurred in building an identical plant (see Appendix C).
Nonrecurring engineering and home office services costs of the RM or EQM are assumed to be
zero for the NOAK plant. Any applicable recurring RM or EQM engineering costs should be identified.
4.12 Estimate Reporting Format 1. Capital costs should be separated into two categories related to whether the equipment/construction is
nuclear-safety-grade or industrial non-nuclear-safety-grade. The plant design contractor (RM, EQM and A/E) will determine the boundaries of the nuclear-safety-grade and industrial non-nuclear-safety grade areas. Costs within each category will be reported in GIF COA format as illustrated in Appendices A, B, and C of (Delene, 1993) and in the modified IAEA format (see Appendix F).
2. Although included and reported in the overall plant estimate, costs of common plant facilities will, in addition, be identified at the two-digit account level and listed separately in GIF COA format.
09/30/2005
- 50 -
3. In cases where equipment items or piping are combined with structures to produce a factory-assembled equipment module, a work sheet documenting each module should be prepared. The work sheet will identify by three-digit GIF COA the applicable items and costs that comprise the module. For each three-digit account, the work sheet will provide the equipment and material costs, shop, and field labor hours and costs, factory overhead and profit, freight, and total module cost. In addition, the text must describe the approach used to estimate each of the cost items. For the total plant cost estimate three-digit level costs for items that are part of a factory module must remain in the GIF COA that represents that particular item. So, costs for structural portions of a module should be reported in Account 21 and equipment/piping costs should be reported in the relevant system account (Accounts 22-26). The total factory cost, including shop labor and materials, should be recorded as factory equipment costs in the GIF COA cost estimate format. Field labor to install a module should be recorded as site labor in the GIF COA estimate format. Labor costs to produce and/or install a module may be prorated among the related three-digit GIF COA, if necessary. The basis for cost-related assumptions regarding the module factory must be documented. Such assumptions include factory location, factory labor rates, and amortization of factory capital costs over the fleet size of module production, labor unit productivity, factory overhead, and module shipping cost assumptions. The wage rates for factory craft workers should be based on the local craft labor data for the factory site. Any adjustments to the labor rates to reflect the factory environment, including overheads and general and administrative (G&A) costs must be fully supported in the future cost estimate reports. For large equipment items and modules, the site delivered transportation costs are to be identified as a line item.
4. For large factory equipment items, such as the reactor vessel and internals, steam generators, heat exchangers, etc., supporting cost data by component must be available for review. The supporting data will include factory material cost, material weights, factory labor hours, recurring cost, and total cost for each equipment item.
4.13 Estimate Validation
Major estimate and plant parameters are to be tabulated with comparison to reference plant data. Major differences should be explained with supporting data. Some or all of the following parameter checks can be implemented. 1. Parameters per kWe for - Process equipment cost, material cost, direct hours, direct cost, COA
summary, category costs. See table 4.17. 2. Bulk ratios to process equipment – Materials per $1,000 of Process equipment cost, Installation hours
per $1,000 of process equipment cost. 3. Indirect cost ratios to direct cost – Total field indirect COA cost percentage of total direct cost, total
field indirect COA cost percentage of total direct hours, field indirect COA total hour percentage of total direct hours. See tables 4.13 through 4.16 for 1970’s US nuclear plant experience data.
4. Ratios to reference plant summary COA – Comparison of major COA summaries to reference plant data.
5. Category cost percentages of total direct cost – Distribution of direct and indirect cost by category of work with percentages relative to total direct cost. See tables 4.13 through 4.16 for 1970’s US nuclear plant experience data.
6. Productivity comparison data – Tabulation of sample unit rates and other productivity data with comparisons to reference plant data and actual industry experience.
7. Equipment and material pricing data – Tabulation of major equipment and material pricing data with comparisons to reference plant data and current industry data.
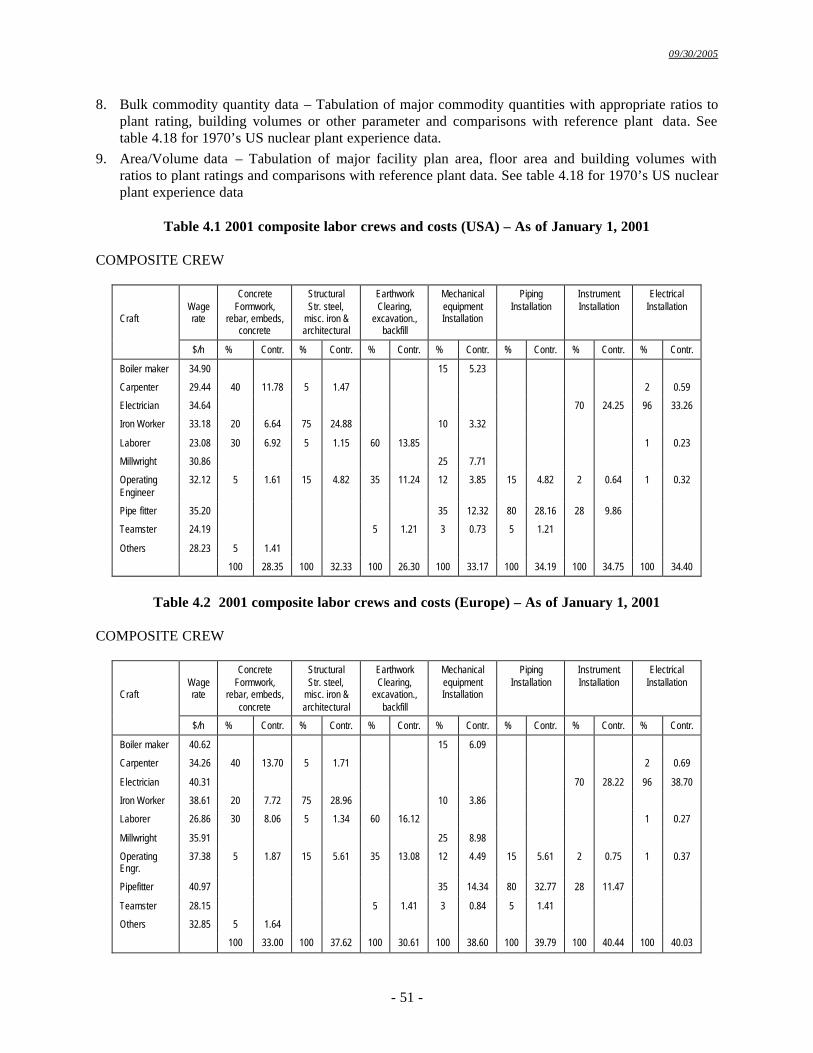
09/30/2005
- 51 -
8. Bulk commodity quantity data – Tabulation of major commodity quantities with appropriate ratios to plant rating, building volumes or other parameter and comparisons with reference plant data. See table 4.18 for 1970’s US nuclear plant experience data.
9. Area/Volume data – Tabulation of major facility plan area, floor area and building volumes with ratios to plant ratings and comparisons with reference plant data. See table 4.18 for 1970’s US nuclear plant experience data
Table 4.1 2001 composite labor crews and costs (USA) – As of January 1, 2001
COMPOSITE CREW
Craft
Wage rate
Concrete Formwork,
rebar, embeds, concrete
Structural Str. steel,
misc. iron & architectural
Earthwork Clearing,
excavation., backfill
Mechanical equipment Installation
Piping Installation
Instrument. Installation
Electrical Installation
$/h % Contr. % Contr. % Contr. % Contr. % Contr. % Contr. % Contr.
Boiler maker 34.90 15 5.23
Carpenter 29.44 40 11.78 5 1.47 2 0.59
Electrician 34.64 70 24.25 96 33.26
Iron Worker 33.18 20 6.64 75 24.88 10 3.32
Laborer 23.08 30 6.92 5 1.15 60 13.85 1 0.23
Millwright 30.86 25 7.71
Operating Engineer
32.12 5 1.61 15 4.82 35 11.24 12 3.85 15 4.82 2 0.64 1 0.32
Pipe fitter 35.20 35 12.32 80 28.16 28 9.86
Teamster 24.19 5 1.21 3 0.73 5 1.21
Others 28.23 5 1.41
100 28.35 100 32.33 100 26.30 100 33.17 100 34.19 100 34.75 100 34.40
Table 4.2 2001 composite labor crews and costs (Europe) – As of January 1, 2001
COMPOSITE CREW
Craft
Wage rate
Concrete Formwork,
rebar, embeds, concrete
Structural Str. steel,
misc. iron & architectural
Earthwork Clearing,
excavation., backfill
Mechanical equipment Installation
Piping Installation
Instrument. Installation
Electrical Installation
$/h % Contr. % Contr. % Contr. % Contr. % Contr. % Contr. % Contr.
Boiler maker 40.62 15 6.09
Carpenter 34.26 40 13.70 5 1.71 2 0.69
Electrician 40.31 70 28.22 96 38.70
Iron Worker 38.61 20 7.72 75 28.96 10 3.86
Laborer 26.86 30 8.06 5 1.34 60 16.12 1 0.27
Millwright 35.91 25 8.98
Operating Engr.
37.38 5 1.87 15 5.61 35 13.08 12 4.49 15 5.61 2 0.75 1 0.37
Pipefitter 40.97 35 14.34 80 32.77 28 11.47
Teamster 28.15 5 1.41 3 0.84 5 1.41
Others 32.85 5 1.64
100 33.00 100 37.62 100 30.61 100 38.60 100 39.79 100 40.44 100 40.03
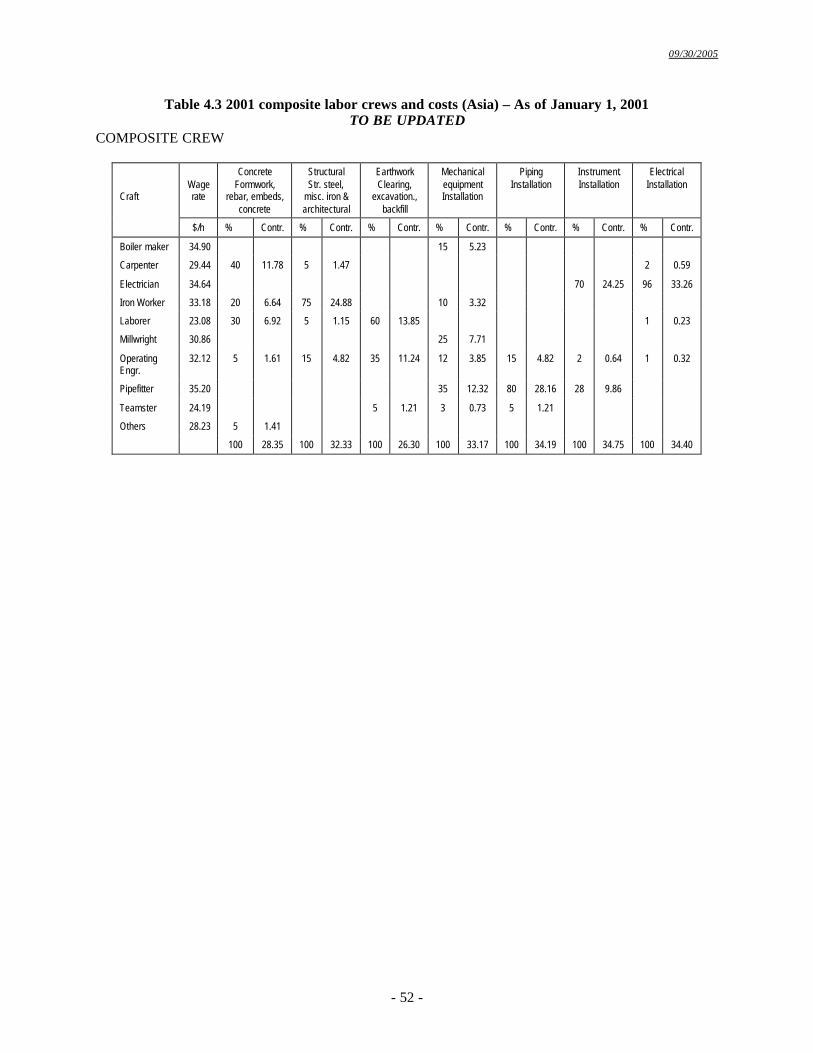
09/30/2005
- 52 -
Table 4.3 2001 composite labor crews and costs (Asia) – As of January 1, 2001 TO BE UPDATED
COMPOSITE CREW
Craft
Wage rate
Concrete Formwork,
rebar, embeds, concrete
Structural Str. steel,
misc. iron & architectural
Earthwork Clearing,
excavation., backfill
Mechanical equipment Installation
Piping Installation
Instrument. Installation
Electrical Installation
$/h % Contr. % Contr. % Contr. % Contr. % Contr. % Contr. % Contr.
Boiler maker 34.90 15 5.23
Carpenter 29.44 40 11.78 5 1.47 2 0.59
Electrician 34.64 70 24.25 96 33.26
Iron Worker 33.18 20 6.64 75 24.88 10 3.32
Laborer 23.08 30 6.92 5 1.15 60 13.85 1 0.23
Millwright 30.86 25 7.71
Operating Engr.
32.12 5 1.61 15 4.82 35 11.24 12 3.85 15 4.82 2 0.64 1 0.32
Pipefitter 35.20 35 12.32 80 28.16 28 9.86
Teamster 24.19 5 1.21 3 0.73 5 1.21
Others 28.23 5 1.41
100 28.35 100 32.33 100 26.30 100 33.17 100 34.19 100 34.75 100 34.40
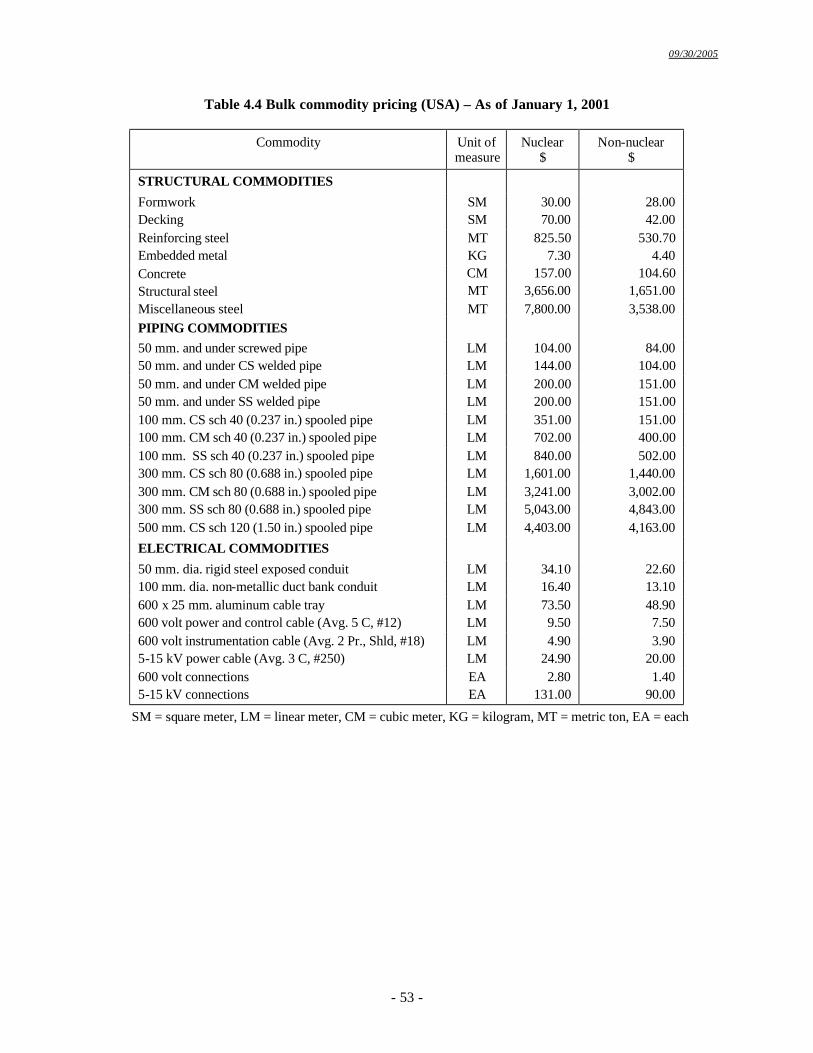
09/30/2005
- 53 -
Table 4.4 Bulk commodity pricing (USA) – As of January 1, 2001
Commodity Unit of measure
Nuclear $
Non-nuclear $
STRUCTURAL COMMODITIES
Formwork SM 30.00 28.00 Decking SM 70.00 42.00 Reinforcing steel MT 825.50 530.70 Embedded metal KG 7.30 4.40 Concrete CM 157.00 104.60 Structural steel MT 3,656.00 1,651.00 Miscellaneous steel MT 7,800.00 3,538.00 PIPING COMMODITIES
50 mm. and under screwed pipe LM 104.00 84.00 50 mm. and under CS welded pipe LM 144.00 104.00 50 mm. and under CM welded pipe LM 200.00 151.00 50 mm. and under SS welded pipe LM 200.00 151.00 100 mm. CS sch 40 (0.237 in.) spooled pipe LM 351.00 151.00 100 mm. CM sch 40 (0.237 in.) spooled pipe LM 702.00 400.00 100 mm. SS sch 40 (0.237 in.) spooled pipe LM 840.00 502.00 300 mm. CS sch 80 (0.688 in.) spooled pipe LM 1,601.00 1,440.00 300 mm. CM sch 80 (0.688 in.) spooled pipe LM 3,241.00 3,002.00 300 mm. SS sch 80 (0.688 in.) spooled pipe LM 5,043.00 4,843.00 500 mm. CS sch 120 (1.50 in.) spooled pipe LM 4,403.00 4,163.00
ELECTRICAL COMMODITIES
50 mm. dia. rigid steel exposed conduit LM 34.10 22.60 100 mm. dia. non-metallic duct bank conduit LM 16.40 13.10 600 x 25 mm. aluminum cable tray LM 73.50 48.90 600 volt power and control cable (Avg. 5 C, #12) LM 9.50 7.50 600 volt instrumentation cable (Avg. 2 Pr., Shld, #18) LM 4.90 3.90 5-15 kV power cable (Avg. 3 C, #250) LM 24.90 20.00 600 volt connections EA 2.80 1.40 5-15 kV connections EA 131.00 90.00
SM = square meter, LM = linear meter, CM = cubic meter, KG = kilogram, MT = metric ton, EA = each
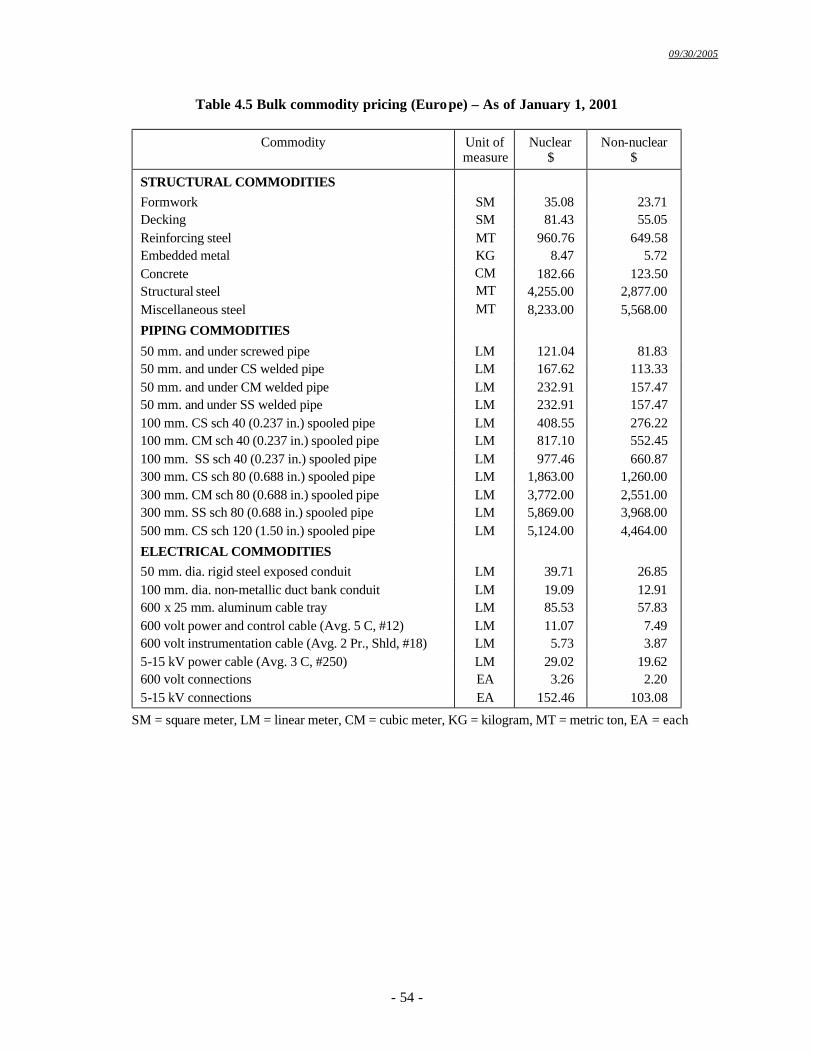
09/30/2005
- 54 -
Table 4.5 Bulk commodity pricing (Europe) – As of January 1, 2001
Commodity Unit of measure
Nuclear $
Non-nuclear $
STRUCTURAL COMMODITIES Formwork SM 35.08 23.71 Decking SM 81.43 55.05 Reinforcing steel MT 960.76 649.58 Embedded metal KG 8.47 5.72 Concrete CM 182.66 123.50 Structural steel MT 4,255.00 2,877.00 Miscellaneous steel MT 8,233.00 5,568.00
PIPING COMMODITIES
50 mm. and under screwed pipe LM 121.04 81.83 50 mm. and under CS welded pipe LM 167.62 113.33 50 mm. and under CM welded pipe LM 232.91 157.47 50 mm. and under SS welded pipe LM 232.91 157.47 100 mm. CS sch 40 (0.237 in.) spooled pipe LM 408.55 276.22 100 mm. CM sch 40 (0.237 in.) spooled pipe LM 817.10 552.45 100 mm. SS sch 40 (0.237 in.) spooled pipe LM 977.46 660.87 300 mm. CS sch 80 (0.688 in.) spooled pipe LM 1,863.00 1,260.00 300 mm. CM sch 80 (0.688 in.) spooled pipe LM 3,772.00 2,551.00 300 mm. SS sch 80 (0.688 in.) spooled pipe LM 5,869.00 3,968.00 500 mm. CS sch 120 (1.50 in.) spooled pipe LM 5,124.00 4,464.00
ELECTRICAL COMMODITIES
50 mm. dia. rigid steel exposed conduit LM 39.71 26.85 100 mm. dia. non-metallic duct bank conduit LM 19.09 12.91 600 x 25 mm. aluminum cable tray LM 85.53 57.83 600 volt power and control cable (Avg. 5 C, #12) LM 11.07 7.49 600 volt instrumentation cable (Avg. 2 Pr., Shld, #18) LM 5.73 3.87 5-15 kV power cable (Avg. 3 C, #250) LM 29.02 19.62 600 volt connections EA 3.26 2.20 5-15 kV connections EA 152.46 103.08
SM = square meter, LM = linear meter, CM = cubic meter, KG = kilogram, MT = metric ton, EA = each
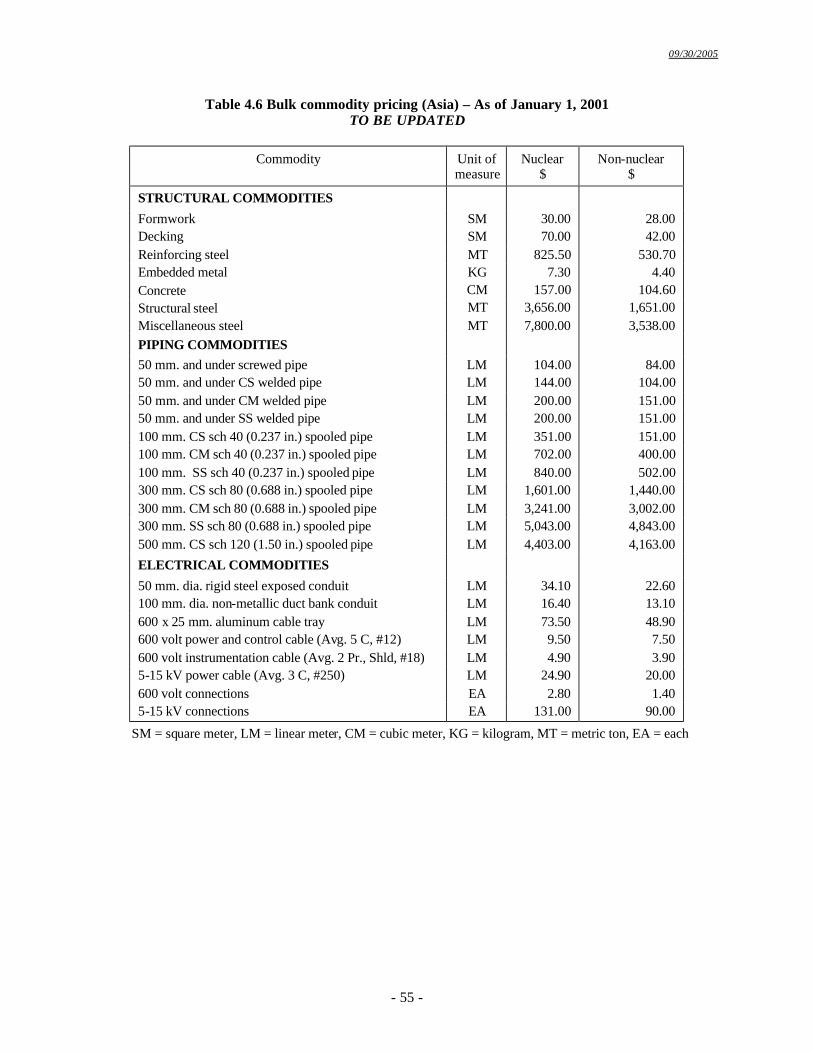
09/30/2005
- 55 -
Table 4.6 Bulk commodity pricing (Asia) – As of January 1, 2001 TO BE UPDATED
Commodity Unit of
measure Nuclear
$ Non-nuclear
$
STRUCTURAL COMMODITIES
Formwork SM 30.00 28.00 Decking SM 70.00 42.00 Reinforcing steel MT 825.50 530.70 Embedded metal KG 7.30 4.40 Concrete CM 157.00 104.60 Structural steel MT 3,656.00 1,651.00 Miscellaneous steel MT 7,800.00 3,538.00 PIPING COMMODITIES
50 mm. and under screwed pipe LM 104.00 84.00 50 mm. and under CS welded pipe LM 144.00 104.00 50 mm. and under CM welded pipe LM 200.00 151.00 50 mm. and under SS welded pipe LM 200.00 151.00 100 mm. CS sch 40 (0.237 in.) spooled pipe LM 351.00 151.00 100 mm. CM sch 40 (0.237 in.) spooled pipe LM 702.00 400.00 100 mm. SS sch 40 (0.237 in.) spooled pipe LM 840.00 502.00 300 mm. CS sch 80 (0.688 in.) spooled pipe LM 1,601.00 1,440.00 300 mm. CM sch 80 (0.688 in.) spooled pipe LM 3,241.00 3,002.00 300 mm. SS sch 80 (0.688 in.) spooled pipe LM 5,043.00 4,843.00 500 mm. CS sch 120 (1.50 in.) spooled pipe LM 4,403.00 4,163.00
ELECTRICAL COMMODITIES
50 mm. dia. rigid steel exposed conduit LM 34.10 22.60 100 mm. dia. non-metallic duct bank conduit LM 16.40 13.10 600 x 25 mm. aluminum cable tray LM 73.50 48.90 600 volt power and control cable (Avg. 5 C, #12) LM 9.50 7.50 600 volt instrumentation cable (Avg. 2 Pr., Shld, #18) LM 4.90 3.90 5-15 kV power cable (Avg. 3 C, #250) LM 24.90 20.00 600 volt connections EA 2.80 1.40 5-15 kV connections EA 131.00 90.00
SM = square meter, LM = linear meter, CM = cubic meter, KG = kilogram, MT = metric ton, EA = each
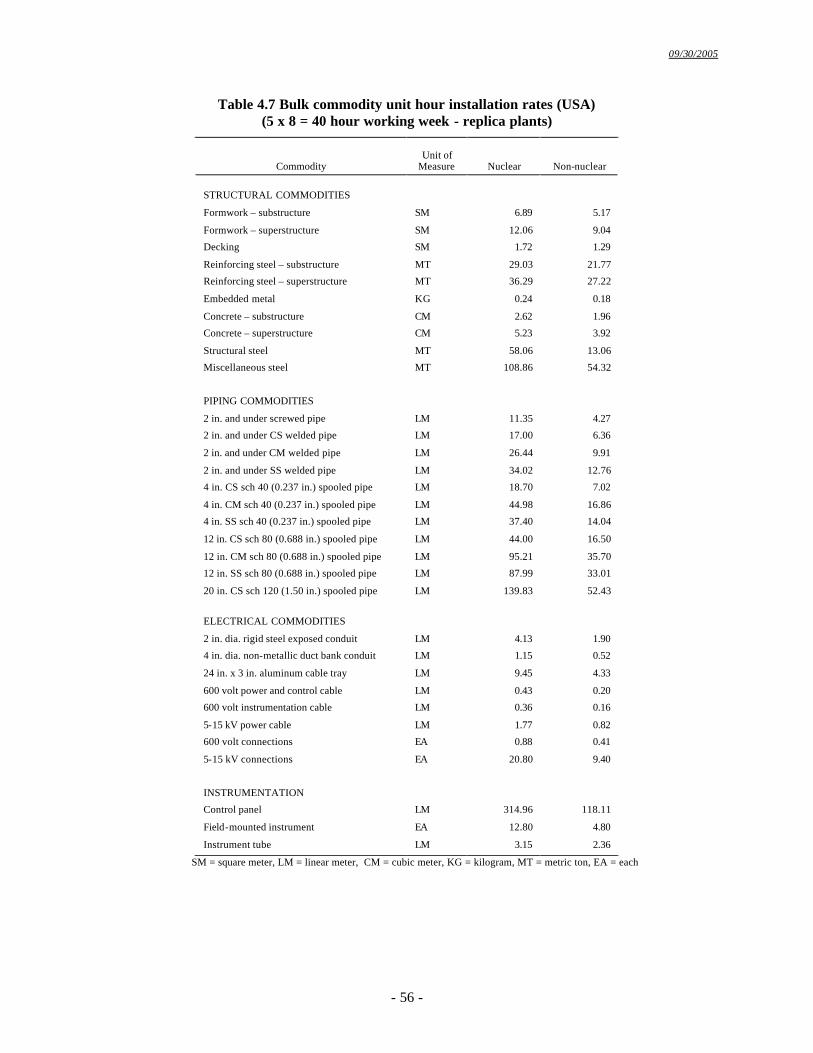
09/30/2005
- 56 -
Table 4.7 Bulk commodity unit hour installation rates (USA) (5 x 8 = 40 hour working week - replica plants)
Commodity
Unit of
Measure
Nuclear
Non-nuclear
STRUCTURAL COMMODITIES
Formwork – substructure SM 6.89 5.17
Formwork – superstructure SM 12.06 9.04
Decking SM 1.72 1.29
Reinforcing steel – substructure MT 29.03 21.77
Reinforcing steel – superstructure MT 36.29 27.22
Embedded metal KG 0.24 0.18
Concrete – substructure CM 2.62 1.96
Concrete – superstructure CM 5.23 3.92
Structural steel MT 58.06 13.06
Miscellaneous steel MT 108.86 54.32
PIPING COMMODITIES
2 in. and under screwed pipe LM 11.35 4.27
2 in. and under CS welded pipe LM 17.00 6.36
2 in. and under CM welded pipe LM 26.44 9.91
2 in. and under SS welded pipe LM 34.02 12.76
4 in. CS sch 40 (0.237 in.) spooled pipe LM 18.70 7.02
4 in. CM sch 40 (0.237 in.) spooled pipe LM 44.98 16.86
4 in. SS sch 40 (0.237 in.) spooled pipe LM 37.40 14.04
12 in. CS sch 80 (0.688 in.) spooled pipe LM 44.00 16.50
12 in. CM sch 80 (0.688 in.) spooled pipe LM 95.21 35.70
12 in. SS sch 80 (0.688 in.) spooled pipe LM 87.99 33.01
20 in. CS sch 120 (1.50 in.) spooled pipe LM 139.83 52.43
ELECTRICAL COMMODITIES
2 in. dia. rigid steel exposed conduit LM 4.13 1.90
4 in. dia. non-metallic duct bank conduit LM 1.15 0.52
24 in. x 3 in. aluminum cable tray LM 9.45 4.33
600 volt power and control cable LM 0.43 0.20
600 volt instrumentation cable LM 0.36 0.16
5-15 kV power cable LM 1.77 0.82
600 volt connections EA 0.88 0.41
5-15 kV connections EA 20.80 9.40
INSTRUMENTATION
Control panel LM 314.96 118.11
Field-mounted instrument EA 12.80 4.80
Instrument tube LM 3.15 2.36
SM = square meter, LM = linear meter, CM = cubic meter, KG = kilogram, MT = metric ton, EA = each
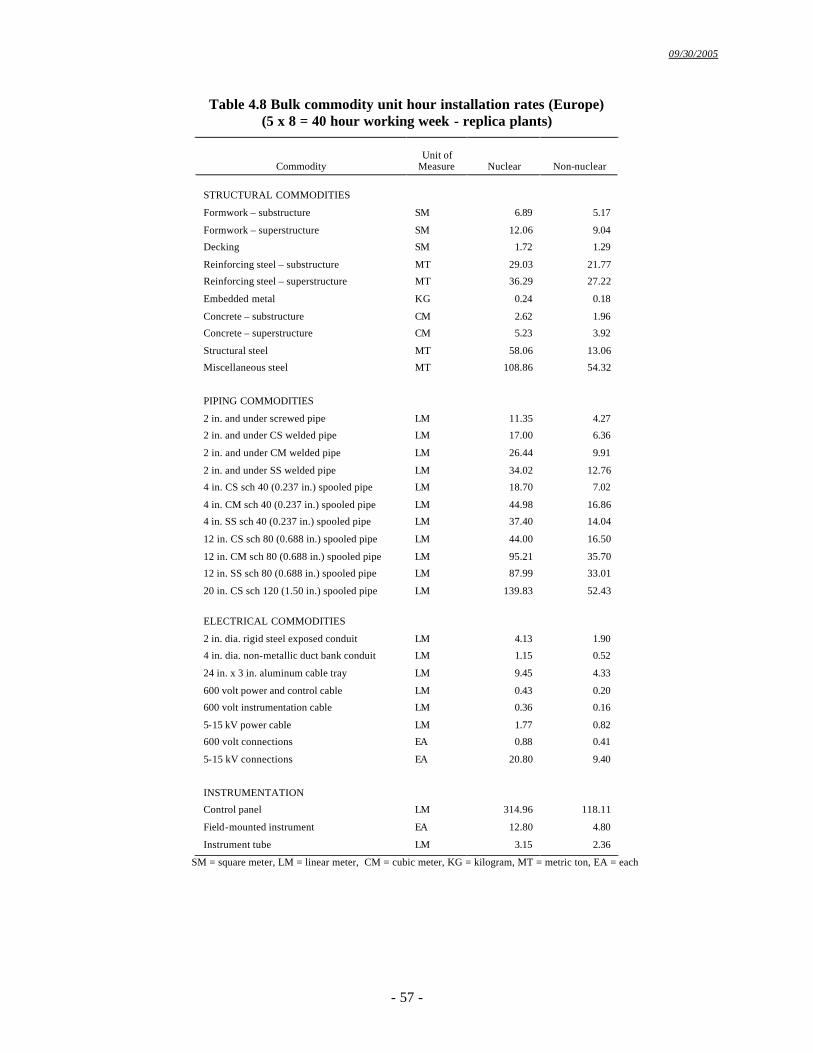
09/30/2005
- 57 -
Table 4.8 Bulk commodity unit hour installation rates (Europe) (5 x 8 = 40 hour working week - replica plants)
Commodity
Unit of
Measure
Nuclear
Non-nuclear
STRUCTURAL COMMODITIES
Formwork – substructure SM 6.89 5.17
Formwork – superstructure SM 12.06 9.04
Decking SM 1.72 1.29
Reinforcing steel – substructure MT 29.03 21.77
Reinforcing steel – superstructure MT 36.29 27.22
Embedded metal KG 0.24 0.18
Concrete – substructure CM 2.62 1.96
Concrete – superstructure CM 5.23 3.92
Structural steel MT 58.06 13.06
Miscellaneous steel MT 108.86 54.32
PIPING COMMODITIES
2 in. and under screwed pipe LM 11.35 4.27
2 in. and under CS welded pipe LM 17.00 6.36
2 in. and under CM welded pipe LM 26.44 9.91
2 in. and under SS welded pipe LM 34.02 12.76
4 in. CS sch 40 (0.237 in.) spooled pipe LM 18.70 7.02
4 in. CM sch 40 (0.237 in.) spooled pipe LM 44.98 16.86
4 in. SS sch 40 (0.237 in.) spooled pipe LM 37.40 14.04
12 in. CS sch 80 (0.688 in.) spooled pipe LM 44.00 16.50
12 in. CM sch 80 (0.688 in.) spooled pipe LM 95.21 35.70
12 in. SS sch 80 (0.688 in.) spooled pipe LM 87.99 33.01
20 in. CS sch 120 (1.50 in.) spooled pipe LM 139.83 52.43
ELECTRICAL COMMODITIES
2 in. dia. rigid steel exposed conduit LM 4.13 1.90
4 in. dia. non-metallic duct bank conduit LM 1.15 0.52
24 in. x 3 in. aluminum cable tray LM 9.45 4.33
600 volt power and control cable LM 0.43 0.20
600 volt instrumentation cable LM 0.36 0.16
5-15 kV power cable LM 1.77 0.82
600 volt connections EA 0.88 0.41
5-15 kV connections EA 20.80 9.40
INSTRUMENTATION
Control panel LM 314.96 118.11
Field-mounted instrument EA 12.80 4.80
Instrument tube LM 3.15 2.36
SM = square meter, LM = linear meter, CM = cubic meter, KG = kilogram, MT = metric ton, EA = each
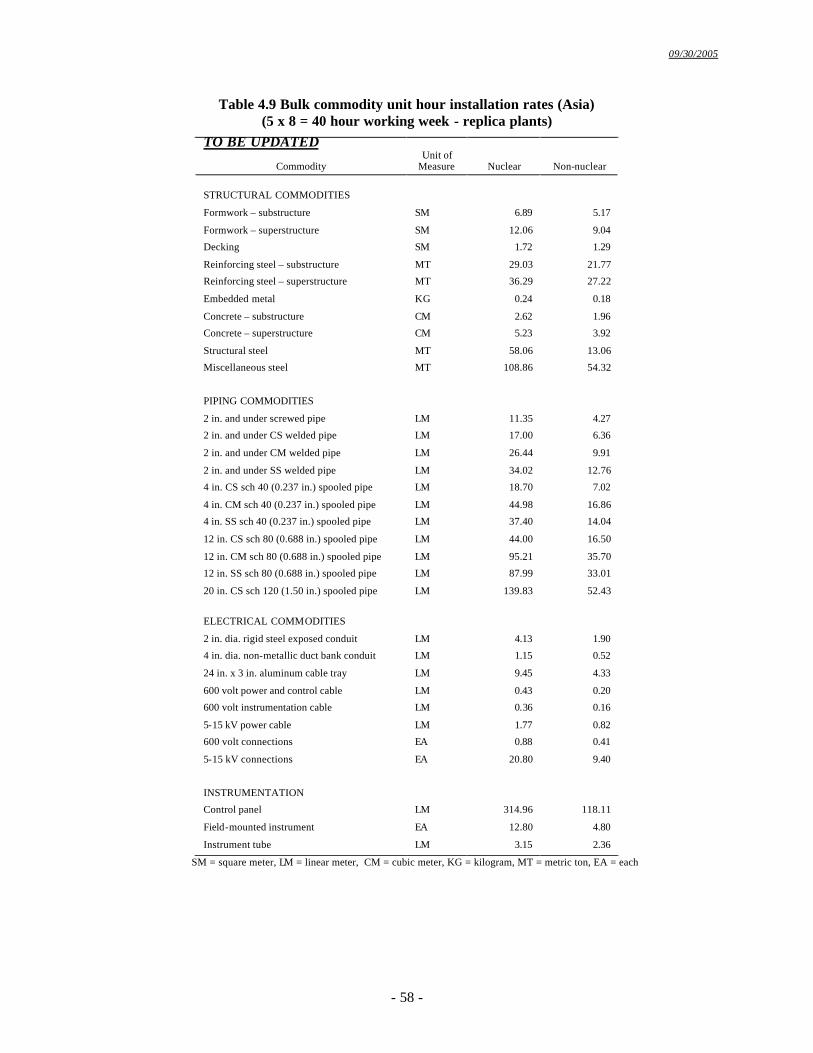
09/30/2005
- 58 -
Table 4.9 Bulk commodity unit hour installation rates (Asia) (5 x 8 = 40 hour working week - replica plants)
TO BE UPDATED
Commodity
Unit of
Measure
Nuclear
Non-nuclear
STRUCTURAL COMMODITIES
Formwork – substructure SM 6.89 5.17
Formwork – superstructure SM 12.06 9.04
Decking SM 1.72 1.29
Reinforcing steel – substructure MT 29.03 21.77
Reinforcing steel – superstructure MT 36.29 27.22
Embedded metal KG 0.24 0.18
Concrete – substructure CM 2.62 1.96
Concrete – superstructure CM 5.23 3.92
Structural steel MT 58.06 13.06
Miscellaneous steel MT 108.86 54.32
PIPING COMMODITIES
2 in. and under screwed pipe LM 11.35 4.27
2 in. and under CS welded pipe LM 17.00 6.36
2 in. and under CM welded pipe LM 26.44 9.91
2 in. and under SS welded pipe LM 34.02 12.76
4 in. CS sch 40 (0.237 in.) spooled pipe LM 18.70 7.02
4 in. CM sch 40 (0.237 in.) spooled pipe LM 44.98 16.86
4 in. SS sch 40 (0.237 in.) spooled pipe LM 37.40 14.04
12 in. CS sch 80 (0.688 in.) spooled pipe LM 44.00 16.50
12 in. CM sch 80 (0.688 in.) spooled pipe LM 95.21 35.70
12 in. SS sch 80 (0.688 in.) spooled pipe LM 87.99 33.01
20 in. CS sch 120 (1.50 in.) spooled pipe LM 139.83 52.43
ELECTRICAL COMMODITIES
2 in. dia. rigid steel exposed conduit LM 4.13 1.90
4 in. dia. non-metallic duct bank conduit LM 1.15 0.52
24 in. x 3 in. aluminum cable tray LM 9.45 4.33
600 volt power and control cable LM 0.43 0.20
600 volt instrumentation cable LM 0.36 0.16
5-15 kV power cable LM 1.77 0.82
600 volt connections EA 0.88 0.41
5-15 kV connections EA 20.80 9.40
INSTRUMENTATION
Control panel LM 314.96 118.11
Field-mounted instrument EA 12.80 4.80
Instrument tube LM 3.15 2.36
SM = square meter, LM = linear meter, CM = cubic meter, KG = kilogram, MT = metric ton, EA = each
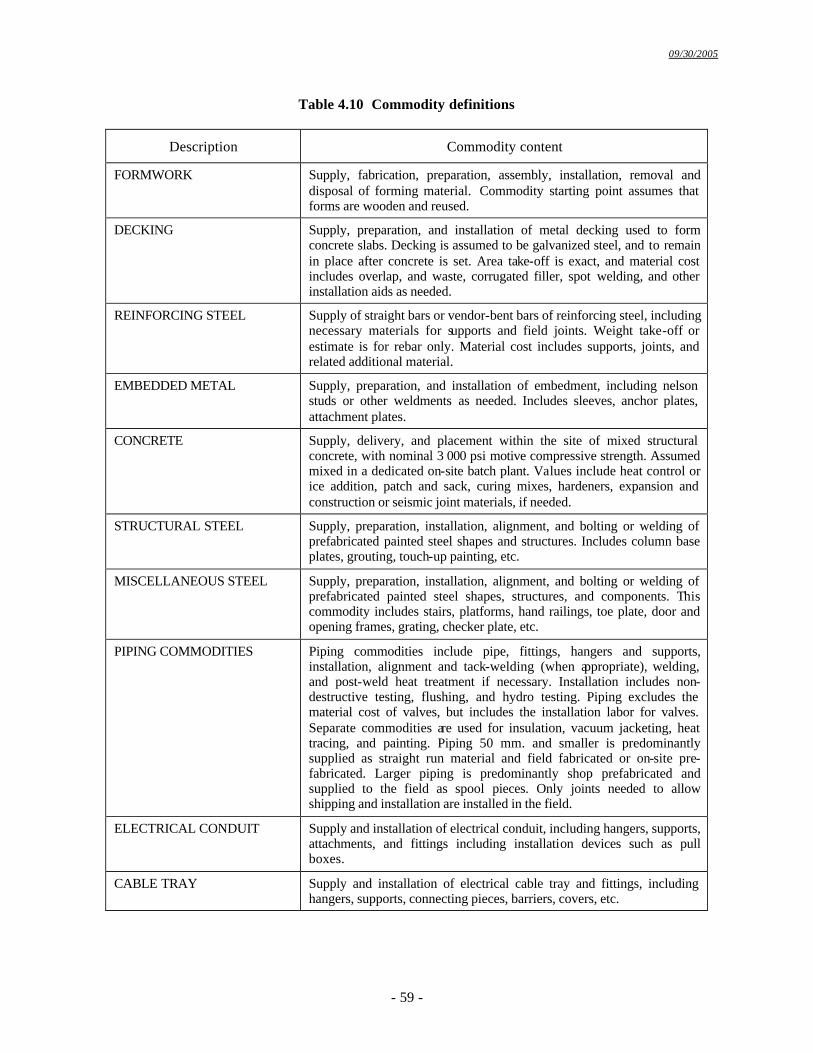
09/30/2005
- 59 -
Table 4.10 Commodity definitions
Description Commodity content
FORMWORK Supply, fabrication, preparation, assembly, installation, removal and disposal of forming material. Commodity starting point assumes that forms are wooden and reused.
DECKING Supply, preparation, and installation of metal decking used to form concrete slabs. Decking is assumed to be galvanized steel, and to remain in place after concrete is set. Area take-off is exact, and material cost includes overlap, and waste, corrugated filler, spot welding, and other installation aids as needed.
REINFORCING STEEL Supply of straight bars or vendor-bent bars of reinforcing steel, including necessary materials for supports and field joints. Weight take-off or estimate is for rebar only. Material cost includes supports, joints, and related additional material.
EMBEDDED METAL Supply, preparation, and installation of embedment, including nelson studs or other weldments as needed. Includes sleeves, anchor plates, attachment plates.
CONCRETE Supply, delivery, and placement within the site of mixed structural concrete, with nominal 3 000 psi motive compressive strength. Assumed mixed in a dedicated on-site batch plant. Values include heat control or ice addition, patch and sack, curing mixes, hardeners, expansion and construction or seismic joint materials, if needed.
STRUCTURAL STEEL Supply, preparation, installation, alignment, and bolting or welding of prefabricated painted steel shapes and structures. Includes column base plates, grouting, touch-up painting, etc.
MISCELLANEOUS STEEL Supply, preparation, installation, alignment, and bolting or welding of prefabricated painted steel shapes, structures, and components. This commodity includes stairs, platforms, hand railings, toe plate, door and opening frames, grating, checker plate, etc.
PIPING COMMODITIES Piping commodities include pipe, fittings, hangers and supports, installation, alignment and tack-welding (when appropriate), welding, and post-weld heat treatment if necessary. Installation includes non-destructive testing, flushing, and hydro testing. Piping excludes the material cost of valves, but includes the installation labor for valves. Separate commodities are used for insulation, vacuum jacketing, heat tracing, and painting. Piping 50 mm. and smaller is predominantly supplied as straight run material and field fabricated or on-site pre-fabricated. Larger piping is predominantly shop prefabricated and supplied to the field as spool pieces. Only joints needed to allow shipping and installation are installed in the field.
ELECTRICAL CONDUIT Supply and installation of electrical conduit, including hangers, supports, attachments, and fittings including installation devices such as pull boxes.
CABLE TRAY Supply and installation of electrical cable tray and fittings, including hangers, supports, connecting pieces, barriers, covers, etc.
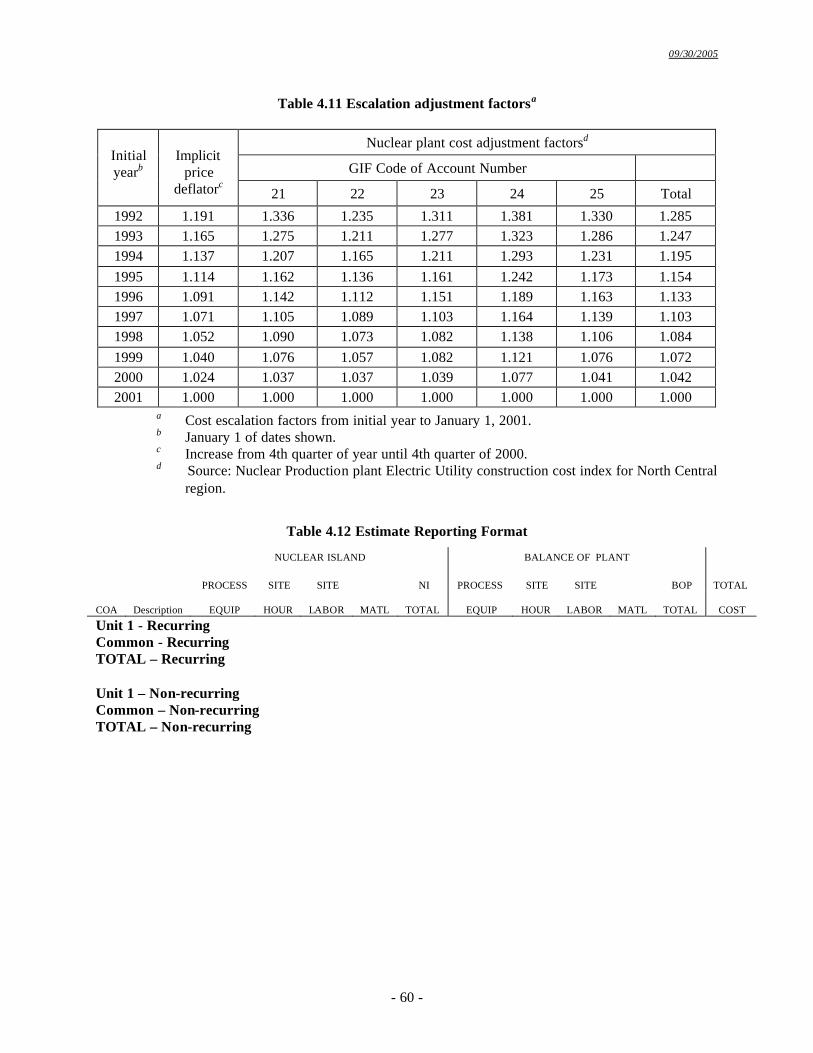
09/30/2005
- 60 -
Table 4.11 Escalation adjustment factorsa
Nuclear plant cost adjustment factorsd
GIF Code of Account Number
Initial yearb
Implicit
price deflatorc 21 22 23 24 25 Total
1992 1.191 1.336 1.235 1.311 1.381 1.330 1.285 1993 1.165 1.275 1.211 1.277 1.323 1.286 1.247 1994 1.137 1.207 1.165 1.211 1.293 1.231 1.195 1995 1.114 1.162 1.136 1.161 1.242 1.173 1.154 1996 1.091 1.142 1.112 1.151 1.189 1.163 1.133 1997 1.071 1.105 1.089 1.103 1.164 1.139 1.103 1998 1.052 1.090 1.073 1.082 1.138 1.106 1.084 1999 1.040 1.076 1.057 1.082 1.121 1.076 1.072 2000 1.024 1.037 1.037 1.039 1.077 1.041 1.042 2001 1.000 1.000 1.000 1.000 1.000 1.000 1.000
a Cost escalation factors from initial year to January 1, 2001. b January 1 of dates shown. c Increase from 4th quarter of year until 4th quarter of 2000. d Source: Nuclear Production plant Electric Utility construction cost index for North Central
region.
Table 4.12 Estimate Reporting Format NUCLEAR ISLAND BALANCE OF PLANT
PROCESS SITE SITE NI PROCESS SITE SITE BOP
TOTAL
COA Description EQUIP
HOUR
LABOR
MATL
TOTAL EQUIP
HOUR
LABOR
MATL
TOTAL COST
Unit 1 - Recurring Common - Recurring TOTAL – Recurring Unit 1 – Non-recurring Common – Non-recurring TOTAL – Non-recurring
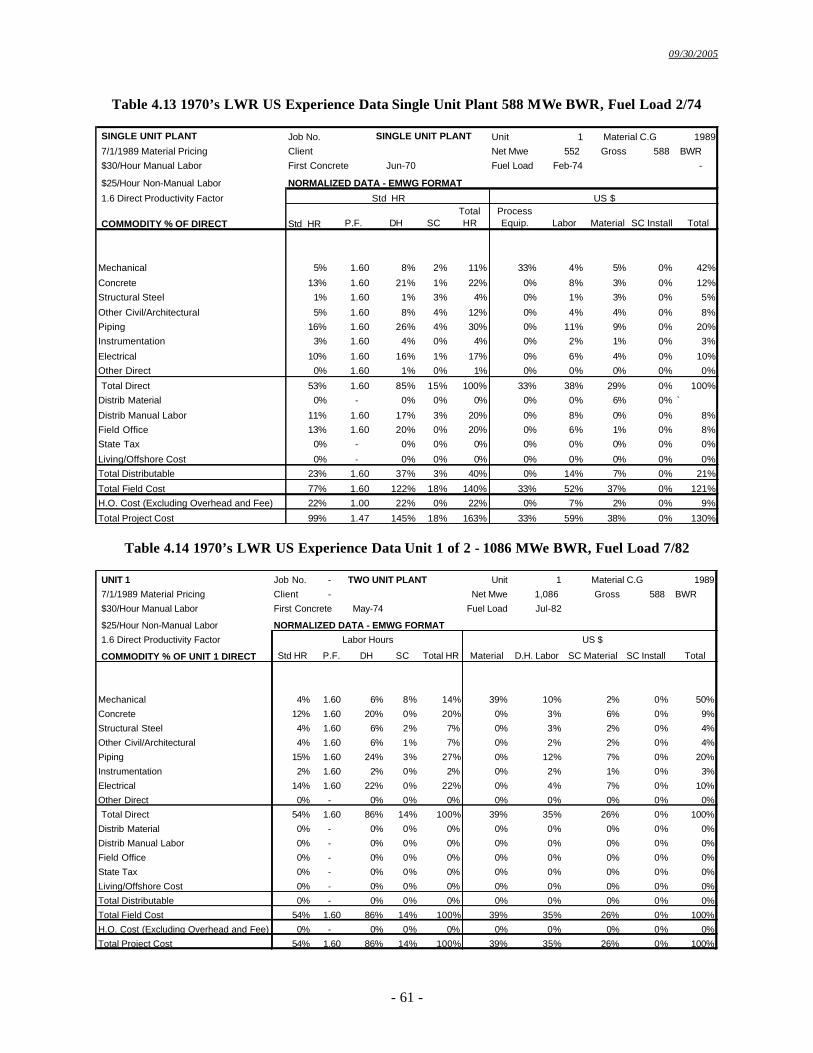
09/30/2005
- 61 -
Table 4.13 1970’s LWR US Experience Data Single Unit Plant 588 MWe BWR, Fuel Load 2/74
SINGLE UNIT PLANT Job No. SINGLE UNIT PLANT Unit 1 19897/1/1989 Material Pricing Client Net Mwe 552 Gross 588 BWR$30/Hour Manual Labor First Concrete Jun-70 Fuel Load Feb-74 -
$25/Hour Non-Manual Labor NORMALIZED DATA - EMWG FORMAT
1.6 Direct Productivity Factor
COMMODITY % OF DIRECT Std HR P.F. DH SCTotal HR
Process Equip. Labor Material SC Install Total
Mechanical 5% 1.60 8% 2% 11% 33% 4% 5% 0% 42%
Concrete 13% 1.60 21% 1% 22% 0% 8% 3% 0% 12%Structural Steel 1% 1.60 1% 3% 4% 0% 1% 3% 0% 5%
Other Civil/Architectural 5% 1.60 8% 4% 12% 0% 4% 4% 0% 8%Piping 16% 1.60 26% 4% 30% 0% 11% 9% 0% 20%Instrumentation 3% 1.60 4% 0% 4% 0% 2% 1% 0% 3%
Electrical 10% 1.60 16% 1% 17% 0% 6% 4% 0% 10%Other Direct 0% 1.60 1% 0% 1% 0% 0% 0% 0% 0%
Total Direct 53% 1.60 85% 15% 100% 33% 38% 29% 0% 100%Distrib Material 0% - 0% 0% 0% 0% 0% 6% 0% `
Distrib Manual Labor 11% 1.60 17% 3% 20% 0% 8% 0% 0% 8%Field Office 13% 1.60 20% 0% 20% 0% 6% 1% 0% 8%State Tax 0% - 0% 0% 0% 0% 0% 0% 0% 0%
Living/Offshore Cost 0% - 0% 0% 0% 0% 0% 0% 0% 0%Total Distributable 23% 1.60 37% 3% 40% 0% 14% 7% 0% 21%
Total Field Cost 77% 1.60 122% 18% 140% 33% 52% 37% 0% 121%H.O. Cost (Excluding Overhead and Fee) 22% 1.00 22% 0% 22% 0% 7% 2% 0% 9%
Total Project Cost 99% 1.47 145% 18% 163% 33% 59% 38% 0% 130%
Std HR US $
Material C.G
Table 4.14 1970’s LWR US Experience Data Unit 1 of 2 - 1086 MWe BWR, Fuel Load 7/82
UNIT 1 Job No. - TWO UNIT PLANT Unit 1 1989
7/1/1989 Material Pricing Client - Net Mwe 1,086 Gross 588 BWR
$30/Hour Manual Labor First Concrete May-74 Fuel Load Jul-82
$25/Hour Non-Manual Labor NORMALIZED DATA - EMWG FORMAT
1.6 Direct Productivity Factor
COMMODITY % OF UNIT 1 DIRECT Std HR P.F. DH SC Total HR Material D.H. Labor SC Material SC Install Total
Mechanical 4% 1.60 6% 8% 14% 39% 10% 2% 0% 50%
Concrete 12% 1.60 20% 0% 20% 0% 3% 6% 0% 9%
Structural Steel 4% 1.60 6% 2% 7% 0% 3% 2% 0% 4%
Other Civil/Architectural 4% 1.60 6% 1% 7% 0% 2% 2% 0% 4%
Piping 15% 1.60 24% 3% 27% 0% 12% 7% 0% 20%
Instrumentation 2% 1.60 2% 0% 2% 0% 2% 1% 0% 3%
Electrical 14% 1.60 22% 0% 22% 0% 4% 7% 0% 10%
Other Direct 0% - 0% 0% 0% 0% 0% 0% 0% 0%
Total Direct 54% 1.60 86% 14% 100% 39% 35% 26% 0% 100%
Distrib Material 0% - 0% 0% 0% 0% 0% 0% 0% 0%
Distrib Manual Labor 0% - 0% 0% 0% 0% 0% 0% 0% 0%
Field Office 0% - 0% 0% 0% 0% 0% 0% 0% 0%
State Tax 0% - 0% 0% 0% 0% 0% 0% 0% 0%
Living/Offshore Cost 0% - 0% 0% 0% 0% 0% 0% 0% 0%
Total Distributable 0% - 0% 0% 0% 0% 0% 0% 0% 0%
Total Field Cost 54% 1.60 86% 14% 100% 39% 35% 26% 0% 100%
H.O. Cost (Excluding Overhead and Fee) 0% - 0% 0% 0% 0% 0% 0% 0% 0%
Total Project Cost 54% 1.60 86% 14% 100% 39% 35% 26% 0% 100%
Labor Hours US $
Material C.G
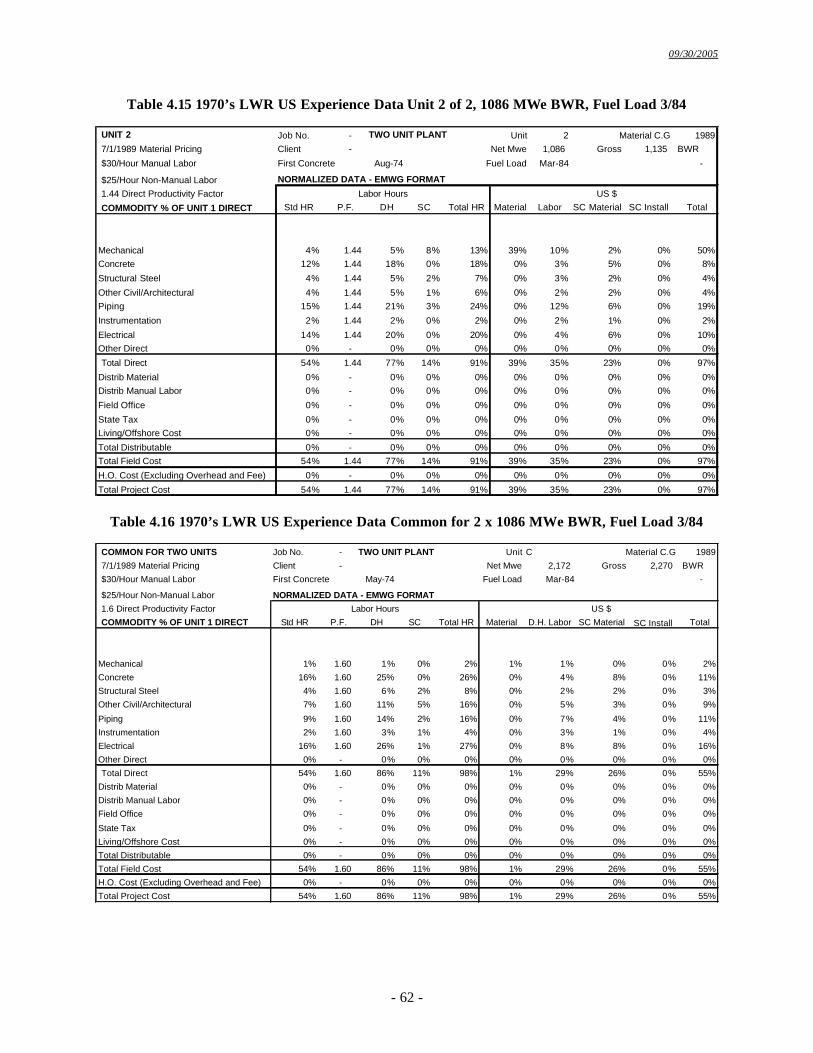
09/30/2005
- 62 -
Table 4.15 1970’s LWR US Experience Data Unit 2 of 2, 1086 MWe BWR, Fuel Load 3/84
UNIT 2 Job No. - TWO UNIT PLANT Unit 2 Material C.G 19897/1/1989 Material Pricing Client - Net Mwe 1,086 Gross 1,135 BWR
$30/Hour Manual Labor First Concrete Aug-74 Fuel Load Mar-84 -
$25/Hour Non-Manual Labor NORMALIZED DATA - EMWG FORMAT
1.44 Direct Productivity Factor
COMMODITY % OF UNIT 1 DIRECT Std HR P.F. DH SC Total HR MaterialD.H.
Labor SC Material SC Install Total
Mechanical 4% 1.44 5% 8% 13% 39% 10% 2% 0% 50%Concrete 12% 1.44 18% 0% 18% 0% 3% 5% 0% 8%
Structural Steel 4% 1.44 5% 2% 7% 0% 3% 2% 0% 4%
Other Civil/Architectural 4% 1.44 5% 1% 6% 0% 2% 2% 0% 4%Piping 15% 1.44 21% 3% 24% 0% 12% 6% 0% 19%
Instrumentation 2% 1.44 2% 0% 2% 0% 2% 1% 0% 2%
Electrical 14% 1.44 20% 0% 20% 0% 4% 6% 0% 10%Other Direct 0% - 0% 0% 0% 0% 0% 0% 0% 0%
Total Direct 54% 1.44 77% 14% 91% 39% 35% 23% 0% 97%
Distrib Material 0% - 0% 0% 0% 0% 0% 0% 0% 0%Distrib Manual Labor 0% - 0% 0% 0% 0% 0% 0% 0% 0%
Field Office 0% - 0% 0% 0% 0% 0% 0% 0% 0%
State Tax 0% - 0% 0% 0% 0% 0% 0% 0% 0%Living/Offshore Cost 0% - 0% 0% 0% 0% 0% 0% 0% 0%
Total Distributable 0% - 0% 0% 0% 0% 0% 0% 0% 0%Total Field Cost 54% 1.44 77% 14% 91% 39% 35% 23% 0% 97%
H.O. Cost (Excluding Overhead and Fee) 0% - 0% 0% 0% 0% 0% 0% 0% 0%
Total Project Cost 54% 1.44 77% 14% 91% 39% 35% 23% 0% 97%
Labor Hours US $
Table 4.16 1970’s LWR US Experience Data Common for 2 x 1086 MWe BWR, Fuel Load 3/84
COMMON FOR TWO UNITS Job No. - TWO UNIT PLANT Unit C Material C.G 1989
7/1/1989 Material Pricing Client - Net Mwe 2,172 Gross 2,270 BWR
$30/Hour Manual Labor First Concrete May-74 Fuel Load Mar-84 -
$25/Hour Non-Manual Labor NORMALIZED DATA - EMWG FORMAT
1.6 Direct Productivity Factor
COMMODITY % OF UNIT 1 DIRECT Std HR P.F. DH SC Total HR Material D.H. Labor SC Material SC Install Total
Mechanical 1% 1.60 1% 0% 2% 1% 1% 0% 0% 2%
Concrete 16% 1.60 25% 0% 26% 0% 4% 8% 0% 11%
Structural Steel 4% 1.60 6% 2% 8% 0% 2% 2% 0% 3%
Other Civil/Architectural 7% 1.60 11% 5% 16% 0% 5% 3% 0% 9%
Piping 9% 1.60 14% 2% 16% 0% 7% 4% 0% 11%
Instrumentation 2% 1.60 3% 1% 4% 0% 3% 1% 0% 4%
Electrical 16% 1.60 26% 1% 27% 0% 8% 8% 0% 16%
Other Direct 0% - 0% 0% 0% 0% 0% 0% 0% 0%
Total Direct 54% 1.60 86% 11% 98% 1% 29% 26% 0% 55%
Distrib Material 0% - 0% 0% 0% 0% 0% 0% 0% 0%
Distrib Manual Labor 0% - 0% 0% 0% 0% 0% 0% 0% 0%
Field Office 0% - 0% 0% 0% 0% 0% 0% 0% 0%
State Tax 0% - 0% 0% 0% 0% 0% 0% 0% 0%
Living/Offshore Cost 0% - 0% 0% 0% 0% 0% 0% 0% 0%
Total Distributable 0% - 0% 0% 0% 0% 0% 0% 0% 0%
Total Field Cost 54% 1.60 86% 11% 98% 1% 29% 26% 0% 55%
H.O. Cost (Excluding Overhead and Fee) 0% - 0% 0% 0% 0% 0% 0% 0% 0%
Total Project Cost 54% 1.60 86% 11% 98% 1% 29% 26% 0% 55%
Labor Hours US $
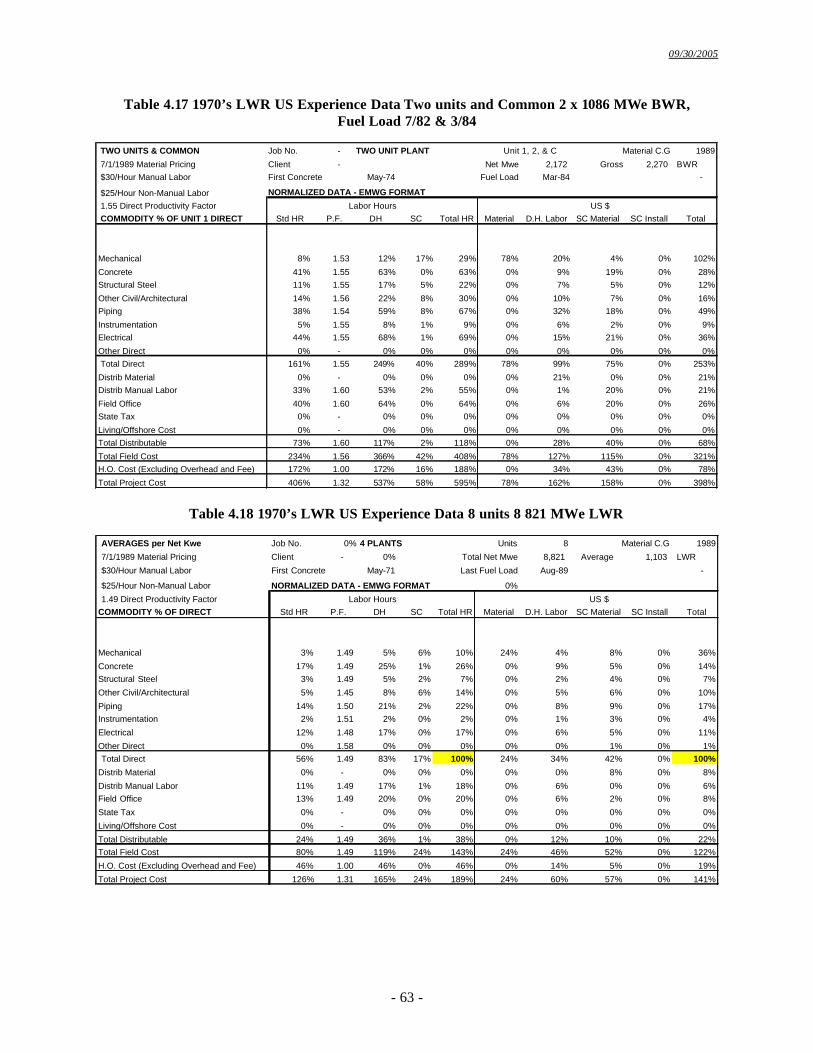
09/30/2005
- 63 -
Table 4.17 1970’s LWR US Experience Data Two units and Common 2 x 1086 MWe BWR, Fuel Load 7/82 & 3/84
TWO UNITS & COMMON Job No. - TWO UNIT PLANT Unit 1, 2, & C Material C.G 1989
7/1/1989 Material Pricing Client - Net Mwe 2,172 Gross 2,270 BWR$30/Hour Manual Labor First Concrete May-74 Fuel Load Mar-84 -
$25/Hour Non-Manual Labor NORMALIZED DATA - EMWG FORMAT
1.55 Direct Productivity FactorCOMMODITY % OF UNIT 1 DIRECT Std HR P.F. DH SC Total HR Material D.H. Labor SC Material SC Install Total
Mechanical 8% 1.53 12% 17% 29% 78% 20% 4% 0% 102%
Concrete 41% 1.55 63% 0% 63% 0% 9% 19% 0% 28%Structural Steel 11% 1.55 17% 5% 22% 0% 7% 5% 0% 12%
Other Civil/Architectural 14% 1.56 22% 8% 30% 0% 10% 7% 0% 16%Piping 38% 1.54 59% 8% 67% 0% 32% 18% 0% 49%
Instrumentation 5% 1.55 8% 1% 9% 0% 6% 2% 0% 9%Electrical 44% 1.55 68% 1% 69% 0% 15% 21% 0% 36%
Other Direct 0% - 0% 0% 0% 0% 0% 0% 0% 0%Total Direct 161% 1.55 249% 40% 289% 78% 99% 75% 0% 253%
Distrib Material 0% - 0% 0% 0% 0% 21% 0% 0% 21%Distrib Manual Labor 33% 1.60 53% 2% 55% 0% 1% 20% 0% 21%
Field Office 40% 1.60 64% 0% 64% 0% 6% 20% 0% 26%State Tax 0% - 0% 0% 0% 0% 0% 0% 0% 0%
Living/Offshore Cost 0% - 0% 0% 0% 0% 0% 0% 0% 0%Total Distributable 73% 1.60 117% 2% 118% 0% 28% 40% 0% 68%
Total Field Cost 234% 1.56 366% 42% 408% 78% 127% 115% 0% 321%H.O. Cost (Excluding Overhead and Fee) 172% 1.00 172% 16% 188% 0% 34% 43% 0% 78%
Total Project Cost 406% 1.32 537% 58% 595% 78% 162% 158% 0% 398%
Labor Hours US $
Table 4.18 1970’s LWR US Experience Data 8 units 8 821 MWe LWR
AVERAGES per Net Kwe Job No. 0% 4 PLANTS Units 8 Material C.G 1989
7/1/1989 Material Pricing Client - 0% Total Net Mwe 8,821 Average 1,103 LWR
$30/Hour Manual Labor First Concrete May-71 Last Fuel Load Aug-89 -
$25/Hour Non-Manual Labor NORMALIZED DATA - EMWG FORMAT 0%
1.49 Direct Productivity FactorCOMMODITY % OF DIRECT Std HR P.F. DH SC Total HR Material D.H. Labor SC Material SC Install Total
Mechanical 3% 1.49 5% 6% 10% 24% 4% 8% 0% 36%
Concrete 17% 1.49 25% 1% 26% 0% 9% 5% 0% 14%Structural Steel 3% 1.49 5% 2% 7% 0% 2% 4% 0% 7%
Other Civil/Architectural 5% 1.45 8% 6% 14% 0% 5% 6% 0% 10%
Piping 14% 1.50 21% 2% 22% 0% 8% 9% 0% 17%Instrumentation 2% 1.51 2% 0% 2% 0% 1% 3% 0% 4%
Electrical 12% 1.48 17% 0% 17% 0% 6% 5% 0% 11%
Other Direct 0% 1.58 0% 0% 0% 0% 0% 1% 0% 1%Total Direct 56% 1.49 83% 17% 100% 24% 34% 42% 0% 100%
Distrib Material 0% - 0% 0% 0% 0% 0% 8% 0% 8%
Distrib Manual Labor 11% 1.49 17% 1% 18% 0% 6% 0% 0% 6%Field Office 13% 1.49 20% 0% 20% 0% 6% 2% 0% 8%
State Tax 0% - 0% 0% 0% 0% 0% 0% 0% 0%
Living/Offshore Cost 0% - 0% 0% 0% 0% 0% 0% 0% 0%
Total Distributable 24% 1.49 36% 1% 38% 0% 12% 10% 0% 22%Total Field Cost 80% 1.49 119% 24% 143% 24% 46% 52% 0% 122%
H.O. Cost (Excluding Overhead and Fee) 46% 1.00 46% 0% 46% 0% 14% 5% 0% 19%
Total Project Cost 126% 1.31 165% 24% 189% 24% 60% 57% 0% 141%
Labor Hours US $
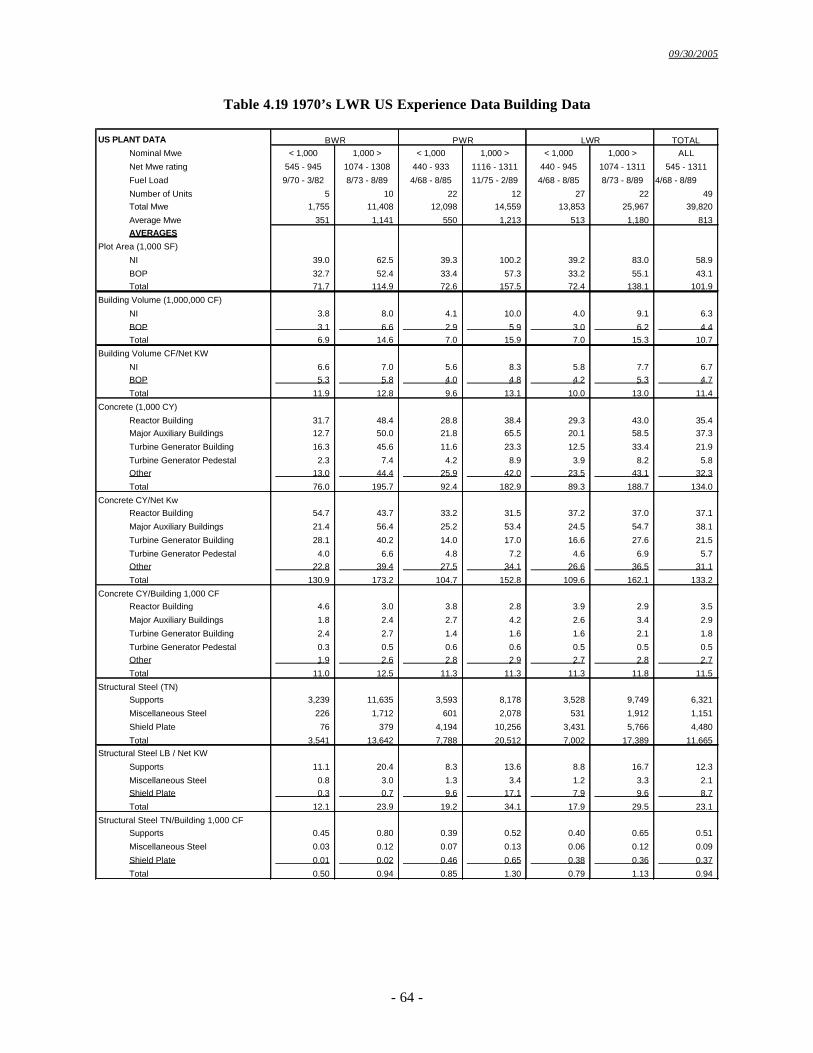
09/30/2005
- 64 -
Table 4.19 1970’s LWR US Experience Data Building Data
US PLANT DATA TOTALNominal Mwe < 1,000 1,000 > < 1,000 1,000 > < 1,000 1,000 > ALL
Net Mwe rating 545 - 945 1074 - 1308 440 - 933 1116 - 1311 440 - 945 1074 - 1311 545 - 1311
Fuel Load 9/70 - 3/82 8/73 - 8/89 4/68 - 8/85 11/75 - 2/89 4/68 - 8/85 8/73 - 8/89 4/68 - 8/89
Number of Units 5 10 22 12 27 22 49 Total Mwe 1,755 11,408 12,098 14,559 13,853 25,967 39,820
Average Mwe 351 1,141 550 1,213 513 1,180 813 AVERAGES
Plot Area (1,000 SF)
NI 39.0 62.5 39.3 100.2 39.2 83.0 58.9
BOP 32.7 52.4 33.4 57.3 33.2 55.1 43.1 Total 71.7 114.9 72.6 157.5 72.4 138.1 101.9
Building Volume (1,000,000 CF)
NI 3.8 8.0 4.1 10.0 4.0 9.1 6.3
BOP 3.1 6.6 2.9 5.9 3.0 6.2 4.4 Total 6.9 14.6 7.0 15.9 7.0 15.3 10.7
Building Volume CF/Net KW
NI 6.6 7.0 5.6 8.3 5.8 7.7 6.7 BOP 5.3 5.8 4.0 4.8 4.2 5.3 4.7
Total 11.9 12.8 9.6 13.1 10.0 13.0 11.4
Concrete (1,000 CY)
Reactor Building 31.7 48.4 28.8 38.4 29.3 43.0 35.4 Major Auxiliary Buildings 12.7 50.0 21.8 65.5 20.1 58.5 37.3
Turbine Generator Building 16.3 45.6 11.6 23.3 12.5 33.4 21.9
Turbine Generator Pedestal 2.3 7.4 4.2 8.9 3.9 8.2 5.8 Other 13.0 44.4 25.9 42.0 23.5 43.1 32.3
Total 76.0 195.7 92.4 182.9 89.3 188.7 134.0
Concrete CY/Net KwReactor Building 54.7 43.7 33.2 31.5 37.2 37.0 37.1
Major Auxiliary Buildings 21.4 56.4 25.2 53.4 24.5 54.7 38.1
Turbine Generator Building 28.1 40.2 14.0 17.0 16.6 27.6 21.5
Turbine Generator Pedestal 4.0 6.6 4.8 7.2 4.6 6.9 5.7 Other 22.8 39.4 27.5 34.1 26.6 36.5 31.1
Total 130.9 173.2 104.7 152.8 109.6 162.1 133.2
Concrete CY/Building 1,000 CFReactor Building 4.6 3.0 3.8 2.8 3.9 2.9 3.5
Major Auxiliary Buildings 1.8 2.4 2.7 4.2 2.6 3.4 2.9
Turbine Generator Building 2.4 2.7 1.4 1.6 1.6 2.1 1.8
Turbine Generator Pedestal 0.3 0.5 0.6 0.6 0.5 0.5 0.5 Other 1.9 2.6 2.8 2.9 2.7 2.8 2.7
Total 11.0 12.5 11.3 11.3 11.3 11.8 11.5
Structural Steel (TN)Supports 3,239 11,635 3,593 8,178 3,528 9,749 6,321
Miscellaneous Steel 226 1,712 601 2,078 531 1,912 1,151
Shield Plate 76 379 4,194 10,256 3,431 5,766 4,480
Total 3,541 13,642 7,788 20,512 7,002 17,389 11,665 Structural Steel LB / Net KW
Supports 11.1 20.4 8.3 13.6 8.8 16.7 12.3
Miscellaneous Steel 0.8 3.0 1.3 3.4 1.2 3.3 2.1 Shield Plate 0.3 0.7 9.6 17.1 7.9 9.6 8.7
Total 12.1 23.9 19.2 34.1 17.9 29.5 23.1
Structural Steel TN/Building 1,000 CFSupports 0.45 0.80 0.39 0.52 0.40 0.65 0.51
Miscellaneous Steel 0.03 0.12 0.07 0.13 0.06 0.12 0.09
Shield Plate 0.01 0.02 0.46 0.65 0.38 0.36 0.37
Total 0.50 0.94 0.85 1.30 0.79 1.13 0.94
BWR PWR LWR
09/30/2005
- 65 -
5. GUIDANCE FOR COST ESTIMATES PREPARED BY THE TOP-DOWN APPROACH
For several years, during the early phase of the Generation IV RD&D program, designs will be “pre-conceptual” for the less mature concepts and “preliminary” for the more mature concepts. In this situation, appropriate data for some of the plant systems may be lacking to develop a bottom-up cost estimate. Therefore, a more global approach, the top-down approach, is needed to help the designers and decision makers in comparing design options. Top-down approaches use simpler models than the ORNL bottom-up approach adopted for the 1993 evaluation of the MHTGR and LMR. The approaches described below keep the GIF COA structure at a two-digit level, with aggregation of many sub-accounts.
Some of the systems comprising Generation IV plants will have similarities in BOP and reactor
systems, facilities and buildings that can be related to previously-studied advanced nuclear plant technologies. Some of the systems may have similarities to non-nuclear technologies and if suitable cost data is available, it could be utilized for estimating subject plant equipment or system. The systems that are unique to a new technology may need to be sufficiently defined and their major parameters quantified to establish relationships to previously studied plants. Other, more common systems and facilities might be directly estimated with global adjustments for plant ratings and current pricing.
This chapter describes some of the top-down estimating techniques that could be utilized; other
techniques could be utilized if the resulting estimates have been validated to current pricing data. These guidelines do not provide a comprehensive handbook on cost estimating of future nuclear systems which would include more exhaustive data, detailed method descriptions and extensive examples of complete energy plant estimates. Such data acquisition and complete examples of applications is currently outside the EMWG charter.
5.1 Cost Modeling Needs of Innovative System Designers
A reactor system designer starts by conceptualizing a coherent image of a new system (reactor, fuel cycle, optimized electricity generation or process heat co-production, etc.). Within GIF, this image aims at meeting the major goals of Generation IV systems in the fields of economics, safety, use of resources, reduction of wastes, and resistance to proliferation. The designer develops a reference design for the primary nuclear energy plant components, the safety system, and the containment with the help of computer models, such as fuel performance codes and thermal hydraulic models.
After developing a “back-of-an-envelope” conceptualization, the designer must verify and optimize
a concept before launching detailed engineering studies. In the RD&D program the designer needs economic models to develop and compare design options around the reference concept. The top-down modeling approach has been developed in Argentina (Grinblat et al., 2002), Canada (Duffey, 2003) and France (Nisan et al., 2003). These types of studies have also been proposed for US reactor concepts (Yoder et al., 2002) and used by DOE for other advanced energy systems (Williams, 1984, and Delene et al., 1988). It is a relevant economic modeling technique for this phase of the GIF Program.
5.2 Top-down Modeling Principles
The basic principle in developing a top-down model is that for most advanced development projects, especially in their preliminary phases, it may be sufficient to make an approximate cost estimation by the simplest and fastest methods available. The results obtained are then further refined in progressive stages of the project when choices of options and technologies are more developed. The most
09/30/2005
- 66 -
important requirement is that consistent estimating techniques be used for the systems considered so that economic comparisons can be made between competing design alternatives within a given concept. To this end all costs should be captured in the GIF code of accounts to the appropriate level of detail. Components of an estimate may be developed at a high level of detail and summarized to a consistent code of account level for inclusion in the overall estimate.
Another top-down estimating technique uses costs of process equipment that are better defined and
then applies bulk factors for other commodities that typically are not detailed when the initial estimate is undertaken. This technique requires bulk factors to be derived from similar nuclear power or non-nuclear project cost data. This cost estimating approach has been used in the chemical and petrochemical industries where continued development over several decades has produced simple, but powerful, methods for cost evaluations.
5.2.1 Levels of Economic Modeling
There are several levels of economic modeling that can be applied to: (1) a total plant cost; (2) level two of the COA; (3) a group of systems or a specific system; or (4) a major equipment component, such as steam generator or reactor vessel. Each of these techniques can be adapted to different parts of one cost estimate:
• Plant cost models can be relevant for major plant components, such as BOP scope. • COA cost model can be relevant for the scope at a level two or three of the code of accounts. • System cost model can be relevant for a specific system scope, such as a safety injection
system. • Equipment cost model can be relevant for a major piece of equipment such as a steam generator
or reactor vessel. • Equipment cost with bulk factors can be relevant for any of the above models.
These different levels of models are not independent and may complement each other. The results
obtained through COA cost models can enrich the corresponding plant models and give a first framework for the system or equipment cost models. The system or equipment cost models results can serve to validate COA and plant cost models. For certain components of plant costs, it may be efficient to rely on bottom-up estimating techniques if the commodities can be readily quantified, for example building and facility structures.
5.2.2 Top-down Modeling
The basic steps involved in the development of cost models are the following:
1. A “reference” energy plant cost is carefully decomposed into several “cost modules.” An estimating module represents a group of cost elements (or items) having similar characteristics and relationships. Each of these cost elements can represent a task in the overall cost module, e.g., site acquisition and development, system or major process equipment, such as a pressure vessel, etc. The cost modules should correspond to the Code of Accounts structure. The selected cost module cost data is adjusted to normalize it before use, including pricing date, currency, productivity, labor cost, pricing level, and other regional cost effects.
2. A detailed study is then conducted of generic cost models (a cost model is generic if it has been previously used, developed, or published in literature) that bear a sufficient number of similarities or analogies with the cost module that one would like to assess.
09/30/2005
- 67 -
3. Generic cost models. Estimates of project specific equipment, system or COA may be performed by utilizing appropriate reference plant data, recent commitments or other relevant pricing basis together with a global cost model in the form of a simple equation such as:
Ci = Ai + (Bi x Pi n),
where: Ci is the cost of the subject plant element; Ai is a fixed component of the reference plant cost; Bi is a variable component of the reference plant cost; Pi is a ratio of subject plant to reference plant component parameter value; n is an exponent that reflects the size benefit of rating for the component (see section 5.3.3); and Pin is equivalent to a cost factor for ratio of parameters between subject plant and reference plant data.
4. Specific models. Specific cost models may be developed for major process equipment such as reactor vessel, steam generators or large heat exchangers that relate costs to ratings, materials and other details developed specifically for the subject plant. They usually require the project team to develop additional data to support cost development, especially for unique features that cannot be ascertained from reference plant data. Specific models may include graphs and/or complex equations.
5. As an example, the cost evaluation model for a PWR pressure vessel was developed from available models for the stainless steel-lined, high-pressure vessels used in the nuclear industry. It resulted in an equation similar to:
Reactor Vessel Cost = )]()6.0/()3/()[( 1.05.0 GkpvFdvhvEdvBA +⋅⋅⋅+⋅ , where: dv is vessel diameter; hv is the vessel height; and kpv is a coefficient that represents the pressure vessel. The adjustment coefficients are obtained by applying well known statistical techniques (e.g.,
ordinary least squares) for a large number of values of P (e.g., a range of MWe values). The models are more finely tuned by using reference or published data on existing installations and by taking into account field materials, field labor, and other industrial factors. Finally, a validation of the model is undertaken by comparison of the model output to current vendor pricing data, historical data, or detailed reference plant estimates. 5.2.3 Simplified Top-down estimating process
A simplified top-down estimating process includes discrete steps that are depicted in Figure 5.1 and described as follows. The item numbers correspond to the diagram below.
The first four items are general data sources that are of a more regional nature rather than specific to system design. The data is required for conversion and adjustment of reference plant cost data prior to development of subject plant cost estimates. 1. Guideline – Review these Estimating Guidelines for requirements in format, content and
methodology. 2. Guideline – Determine Regional cost data, productivity factors, pricing levels, cost indexes, currency
conversion factors, and other regional information. 3. Guideline – Establish currency conversion factors for all regions. 4. Guideline – Establish cost indexes for all regions for adjustment of reference plant costs to nominal
cost date.
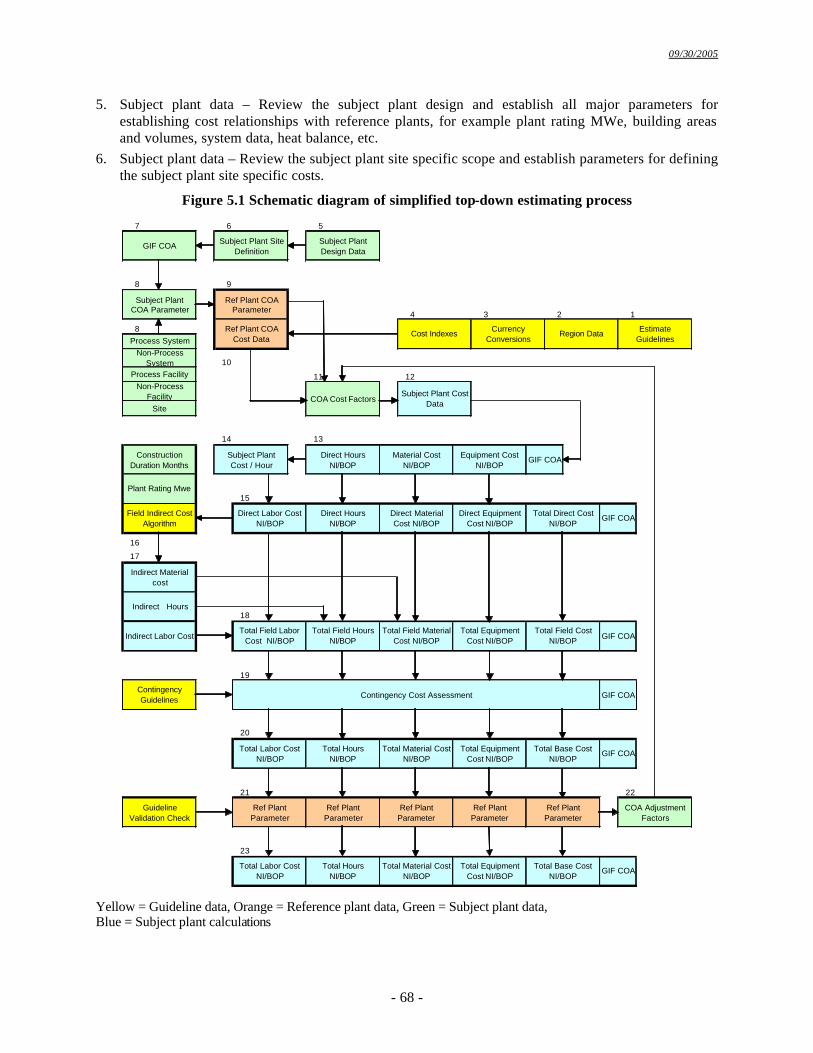
09/30/2005
- 68 -
5. Subject plant data – Review the subject plant design and establish all major parameters for establishing cost relationships with reference plants, for example plant rating MWe, building areas and volumes, system data, heat balance, etc.
6. Subject plant data – Review the subject plant site specific scope and establish parameters for defining the subject plant site specific costs.
Figure 5.1 Schematic diagram of simplified top-down estimating process
7 6 5
8 9
4 3 2 1
8
10
11 12
14 13
15
16
17
18
19
20
21 22
23
Total Base Cost NI/BOP
GIF COATotal Labor Cost NI/BOP
Total Hours NI/BOP
Total Material Cost NI/BOP
Total Equipment Cost NI/BOP
GIF COA
Guideline Validation Check
Ref Plant Parameter
Ref Plant Parameter
Ref Plant Parameter
Ref Plant Parameter
Ref Plant Parameter
COA Adjustment Factors
Total Labor Cost NI/BOP
Total Hours NI/BOP
Total Material Cost NI/BOP
Total Equipment Cost NI/BOP
Total Field Cost NI/BOP
Total Base Cost NI/BOP
Contingency Guidelines Contingency Cost Assessment GIF COA
Total Field Labor Cost NI/BOP
Total Field Hours NI/BOP
Total Field Material Cost NI/BOP
Total Equipment Cost NI/BOP
GIF COA
Indirect Labor Cost
Indirect Hours
Indirect Material cost
GIF COA
GIF COA
Plant Rating Mwe
Field Indirect Cost Algorithm
Direct Labor Cost NI/BOP
Direct Hours NI/BOP
Direct Material Cost NI/BOP
Direct Equipment Cost NI/BOP
Total Direct Cost NI/BOP
Construction Duration Months
Subject Plant Cost / Hour
Direct Hours NI/BOP
Material Cost NI/BOP
Non-Process Facility COA Cost Factors
Subject Plant Cost DataSite
Equipment Cost NI/BOP
Estimate GuidelinesProcess System
Non-Process System
Process Facility
Ref Plant COA Cost Data
Cost Indexes Currency Conversions
Region Data
GIF COA Subject Plant Site Definition
Subject Plant Design Data
Subject Plant COA Parameter
Ref Plant COA Parameter
Yellow = Guideline data, Orange = Reference plant data, Green = Subject plant data, Blue = Subject plant calculations
09/30/2005
- 69 -
7. Subject plant data – Review the subject plant scope to the GIF COA to ensure a complete project cost definition, inclusive of areas that may not be defined at the time of cost development.
8. Subject plant data – Segregate subject plant scope to cost elements that can be related to reference plant data. These cost elements may be at summary COA levels for components, systems, or complete facilities for portions of the plant that are readily relatable to reference plant data. For unique and specific design features associated with the subject plant, the scope may need to be developed to a more detailed level to support cost development, even with a top-down approach. Quantify the major plant parameter that relates to the scope of the desired cost element. The parameter may be: total plant rating MWe; system capacity in Btu or GPM, pressure or temperature; physical characteristics such as weight, liters or cubic meters: other suitable parameter.
9. Reference plant data – Select a reference plant that contains the required cost element with corresponding plant parameter data.
10. Reference plant data – Adjust the reference plant cost data for the required pricing levels, productivity levels, and cost component separation, including GIF COA. Extract the reference plant costs for the scope of the cost element and quantify the same parameter associated with the cost element.
11. Reference plant data – Establish a ratio of the parameter for subject plant to reference plant. Using guideline cost exponents that are appropriate to the cost element, calculate the cost adjustment factor.
12. Subject plant calculation - Apply the cost adjustment factor to the reference plant cost details to calculate the equivalent costs for the subject plant. Each cost element should consist of equipment cost, material cost, and construction labor hours if possible. This level of detail is required to support other top-down estimating techniques for cost elements, such as field indirect costs, manpower levels, or scheduling considerations. Different reference plants can be used for various cost elements of the subject plant provided they are adjusted to the common GIF COA, regional influence, pricing, and productivity levels.
13. Subject plant calculation – Summarize all the cost elements to level three and two of the GIF COA. 14. Subject plant calculation – Develop composite labor cost per hour inclusive of all benefits, including
fringe benefits, travel, and living costs. The labor cost per hour is usually calculated for the planned workweek by craft for journeyman, apprentice, and foreman, then applied for a craft crew and extended by craft mix percentages for a category of work (i.e. civil, mechanical, electrical, etc.), or total direct cost level if an average craft mix is used for direct costs.
15. Subject plant calculation – The subject plant direct labor hours, derived from the reference plant cost data, are extended by the appropriate cost per hour to estimate the labor cost component, and added to the equipment cost and material costs to calculate the subject plant total direct cost.
16. Guideline – Field indirect costs can be calculated with algorithms that relate the size of plant and duration of the construction period relative to the direct craft labor cost (See section 5.3.5).
17. Subject plant calculation – Field indirect costs consist of three components that are related to: a. one time charges, such as temporary facilities purchased and erected at start of construction; b. schedule duration related costs, such as equipment rentals and site cleanup; and c. direct construction related, such as tools and consumables.
Suitable algorithms can be used to calculate the field indirect costs and hours. The resultant craft hours together with the planned construction schedules provide basis for development of manpower levels and staffing curves.
18. Subject plant calculation – The summary of Direct Cost and Field Indirect Costs produce Total Field Cost. This provides the baseline cost data for calculation of Design and Project Management / Construction Management (PM/CM) Services.
19. Guideline – A contingency assessment is performed for the subject plant estimated costs to derive the appropriate contingency costs for each summary account code level. See Appendix A.
09/30/2005
- 70 -
20. Subject plant calculation – The subject plant costs are summarized to appropriate levels of GIF COA. 21. Guideline – Several validation checks can be performed to compare the subject plant cost estimate
relative to cost parameters derived from reference plants cost data. Parameters such as indirect cost percentage of direct cost, services percentage of field costs, cost per kWe, direct equipment percentage of total direct cost, direct labor cost of total direct cost, direct labor hours, and material cost per monetary unit value (e.g., US$ 1000) of equipment cost, etc.
22. Subject plant calculation – The results of the validation process provide adjustments that are recycled to the cost factors in step 11, until the results are validated relative to established parameters for reference plant cost data.
23. Subject plant calculation – The summary is Base Cost before calculation of other capitalized costs and Total Overnight Cost.
24. Subject plant calculation – A summary at level 2 COA provides input to other cost models for calculation of LUEC.
5.3 Use of Top-down Modeling for Generation IV Systems 5.3.1 Reference Conceptual Design
To develop a cost model of a nuclear energy system, the following minimum design information is
needed: • a description of the process and its reference operating conditions (including energy and material
balances); • a schematic figure of the major nuclear components (reactor vessel, steam generator, heat
exchangers, etc.) and coolant circuits (active and passive safety circuits) with conceptual size and layout arrangements (geometry);
• the type and volume of containment/confinement; and • a description with major dimensions of the facilities outside the nuclear island.
This information is used as follows:
• Equipment cost can be derived from known cost of similar equipment with cost factors derived by the ratios of known parameters, such as rating, capacity or weight. Cost exponent factors are typically used in establishing the cost factor from the ratio of parameter data, as discussed in section 5.3.3.
• For system cost data, specific cost models may be applied, but generally, a rough sizing of the system and physical parameters established for weight, volume, materials, complexity, or other environmental factors can be compared with reference plant data and identified differences estimated or a cost factor applied, based on expert judgment.
• Buildings and facility structures can be estimated by application of unit cost rates to the quantity of commodities, when dimensions and type of structure are known.
• Bulk commodities, such as pipe and cable, can be estimated with global models from cost data obtained from reference plant information. Differences can be estimated or a cost factor applied, based on expert judgment.
5.3.2 Reference plant data
A reference conceptual design cost model is an assembly of several models and data allowing cost estimations that are representative of the concept studied. The reference plant data may consist of several plants with systems or component that are similar to subject plant. The reference plant cost data will be
09/30/2005
- 71 -
the basis (tool box) to estimate costs for the subject plant design. Reference plant data will consist of technical and physical scope information defined by P&ID’s, System Design Descriptions and data sets, process flow diagrams and facility arrangement drawings. The corresponding cost estimate will be available with details to commodity level, and will typically include COA, description, quantity, equipment cost, material cost, hours, labor cost, and total cost by line entry. The estimate definition will include a description of the project execution plan; basis for scope development; date of pricing; direct productivity data; craft wage rate information and basis for other project costs. Typically, the discussion of project contingency cost determination provides a good understanding of the confidence levels for various components of the cost. 1. Before any part of the reference plant cost data is utilized, several adjustment factors need to be
calculated for application on a global basis for all reference plant direct cost detail records. 2. The pricing basis of the reference plant estimate requires a global cost factor for all costs except
labor. (Labor cost will be adjusted with factors for productivity and local wage rates). Process equipment and materials can be adjusted globally, by establishing cost factors based on various cost indexes between the reference plant date of pricing and the subject plant pricing date and applied at an appropriate level of detail.
3. Currency conversions, if required, should be performed by establishing the appropriate cost factors that will apply to process equipment and material costs only. Labor will be extended based on subject project productivity and composite cost per hour.
4. Analysis of the sample unit hour rates between the reference plant estimate and the subject plant requirements, can establish a comparative productivity level and a cost factor to adjust all the craft hours at the direct cost level.
5. Labor cost is best adjusted by applying composite labor cost per hour that has been developed specifically for the subject plant and reference pricing date.
6. Other project costs, including field indirect costs are to be separately developed for the subject plant after all the direct cost components are summarized and a construction schedule established. Comparisons to the reference plant ratios can provide a validation check for the subject plant estimate.
7. The subject plant COA definition is utilized to ensure that all the required scope is identified for an estimating basis by identification of a reference plant for top-down estimating technique or some other estimating technique such as equipment bulk factors or bottom-up commodity detail estimate. Different reference plants can be utilized that are most appropriate for the scope of the subject plant. The entire project scope is identified to an estimating technique that is most appropriate to each segment together with the source reference plant data.
8. It is recommended that all the global adjustments are incorporated in an update of the reference plant cost estimate details together with any re-alignment for GIF COA structure, such that a completely normalized and relevant cost data base is established for use by the subject plant design team.
9. The team selects an appropriate section of the reference plant project scope that is most similar to the facility, system or COA for the subject plant and extracts the estimate details for the corresponding scope.
10. An appropriate major parameter is established for the selected scope and a cost factor calculated for the ratio of the parameters between the subject plant and reference plant ratings.
11. An estimating cost model is established consisting of: links to the reference plant detail estimate; all the cost factors required to normalize the data for the subject plant; system or COA parameter cost factor development for the selected COA; and resultant COA detail for the subject plant. The model will include ability to perform checks and validation of the resultant subject plant direct cost estimate and provide refinement COA adjustment factors for the details.
09/30/2005
- 72 -
12. Extracted summary information will provide input data with selected quantities and labor requirements to support development of construction schedule. Future development may facilitate schedule development with iterative process linked to the estimate details and construction plan inputs such as work week, sustained installation rates and manpower densities.
13. Validated cost details will be summarized to second level COA and provide input to other cost models for calculation of LUEC.
14. Tables 5. 2 thru 5.5 show sample calculations for components of a reactor system. Table 5.2 shows the reference plant data and basis for normalizing the data prior to use. Table 5.3 shows development of parameter ratio and cost factors for each account level. Table 5.4 shows the subject plant parameters and resultant subject plant estimate. Table 5.5 shows conversion of the subject plant estimate with a variable degree of modularization by factory produced modules. Similar techniques can assist development of early estimates with sufficient detail for subsequent monitoring of costs (trending) as design evolves.
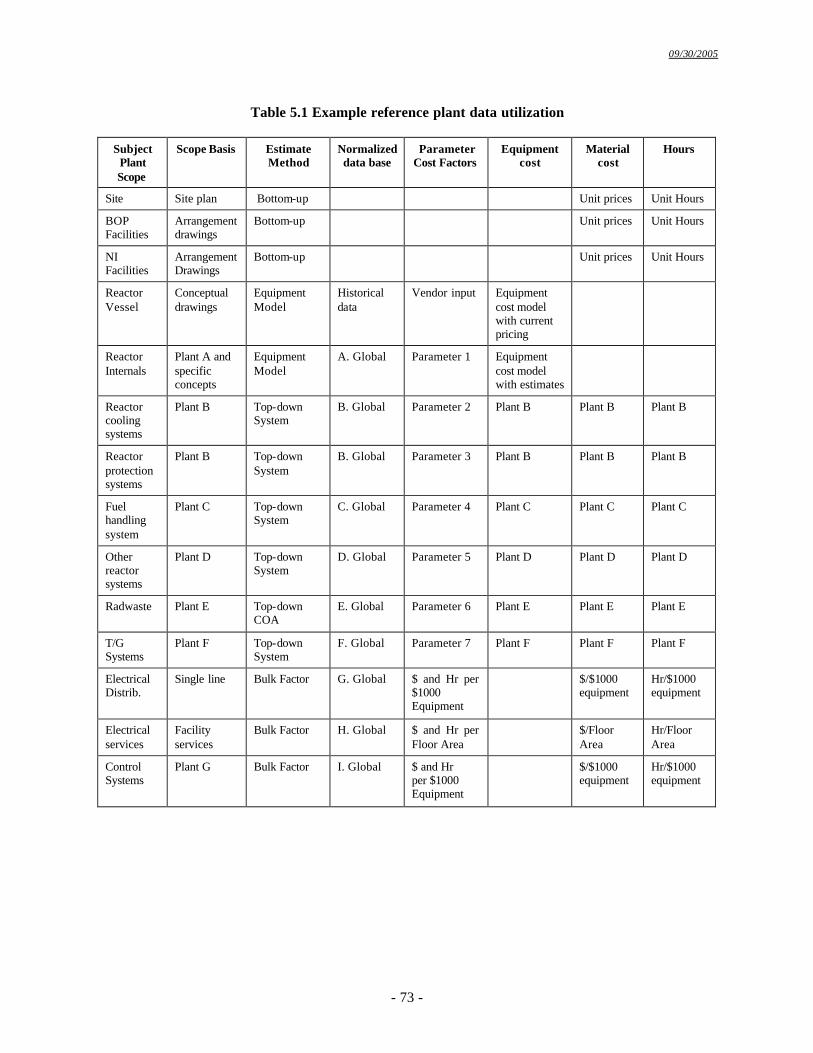
09/30/2005
- 73 -
Table 5.1 Example reference plant data utilization
Subject Plant Scope
Scope Basis Estimate Method
Normalized data base
Parameter Cost Factors
Equipment cost
Material cost
Hours
Site Site plan Bottom-up Unit prices Unit Hours
BOP Facilities
Arrangement drawings
Bottom-up Unit prices Unit Hours
NI Facilities
Arrangement Drawings
Bottom-up Unit prices Unit Hours
Reactor Vessel
Conceptual drawings
Equipment Model
Historical data
Vendor input Equipment cost model with current pricing
Reactor Internals
Plant A and specific concepts
Equipment Model
A. Global Parameter 1 Equipment cost model with estimates
Reactor cooling systems
Plant B Top-down System
B. Global Parameter 2 Plant B Plant B Plant B
Reactor protection systems
Plant B Top-down System
B. Global Parameter 3 Plant B Plant B Plant B
Fuel handling system
Plant C Top-down System
C. Global Parameter 4 Plant C Plant C Plant C
Other reactor systems
Plant D Top-down System
D. Global Parameter 5 Plant D Plant D Plant D
Radwaste Plant E Top-down COA
E. Global Parameter 6 Plant E Plant E Plant E
T/G Systems
Plant F Top-down System
F. Global Parameter 7 Plant F Plant F Plant F
Electrical Distrib.
Single line Bulk Factor G. Global $ and Hr per $1000 Equipment
$/$1000 equipment
Hr/$1000 equipment
Electrical services
Facility services
Bulk Factor H. Global $ and Hr per Floor Area
$/Floor Area
Hr/Floor Area
Control Systems
Plant G Bulk Factor I. Global $ and Hr per $1000 Equipment
$/$1000 equipment
Hr/$1000 equipment
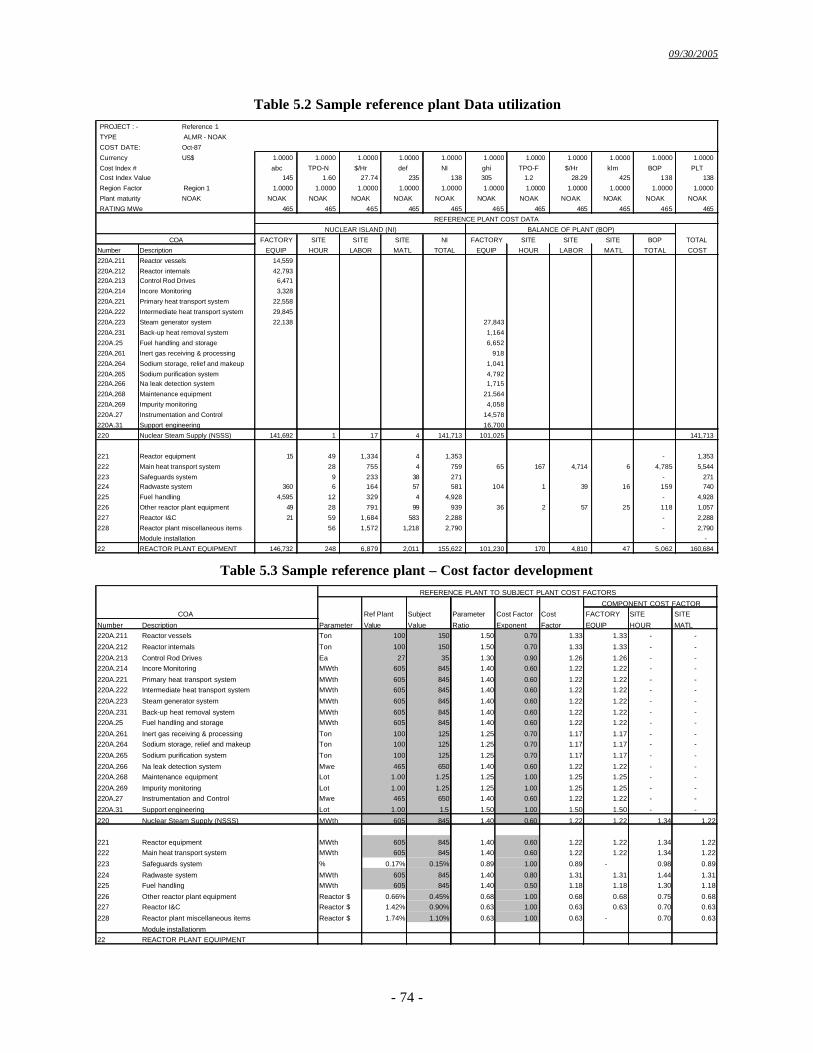
09/30/2005
- 74 -
Table 5.2 Sample reference plant Data utilization PROJECT : - Reference 1
TYPE ALMR - NOAK
COST DATE: Oct-87
Currency US$ 1.0000 1.0000 1.0000 1.0000 1.0000 1.0000 1.0000 1.0000 1.0000 1.0000 1.0000
Cost Index # abc TPO-N $/Hr def NI ghi TPO-F $/Hr klm BOP PLTCost Index Value 145 1.60 27.74 235 138 305 1.2 28.29 425 138 138
Region Factor Region 1 1.0000 1.0000 1.0000 1.0000 1.0000 1.0000 1.0000 1.0000 1.0000 1.0000 1.0000
Plant maturity NOAK NOAK NOAK NOAK NOAK NOAK NOAK NOAK NOAK NOAK NOAK NOAK
RATING MWe 465 465 465 465 465 465 465 465 465 465 465
FACTORY SITE SITE SITE NI FACTORY SITE SITE SITE BOP TOTAL
Number Description EQUIP HOUR LABOR MATL TOTAL EQUIP HOUR LABOR MATL TOTAL COST
220A.211 Reactor vessels 14,559
220A.212 Reactor internals 42,793 220A.213 Control Rod Drives 6,471
220A.214 Incore Monitoring 3,328
220A.221 Primary heat transport system 22,558
220A.222 Intermediate heat transport system 29,845
220A.223 Steam generator system 22,138 27,843
220A.231 Back-up heat removal system 1,164
220A.25 Fuel handling and storage 6,652
220A.261 Inert gas receiving & processing 918
220A.264 Sodium storage, relief and makeup 1,041
220A.265 Sodium purification system 4,792 220A.266 Na leak detection system 1,715
220A.268 Maintenance equipment 21,564
220A.269 Impurity monitoring 4,058
220A.27 Instrumentation and Control 14,578
220A.31 Support engineering 16,700
220 Nuclear Steam Supply (NSSS) 141,692 1 17 4 141,713 101,025 141,713
221 Reactor equipment 15 49 1,334 4 1,353 - 1,353
222 Main heat transport system 28 755 4 759 65 167 4,714 6 4,785 5,544
223 Safeguards system 9 233 38 271 - 271 224 Radwaste system 360 6 164 57 581 104 1 39 16 159 740
225 Fuel handling 4,595 12 329 4 4,928 - 4,928
226 Other reactor plant equipment 49 28 791 99 939 36 2 57 25 118 1,057
227 Reactor I&C 21 59 1,684 583 2,288 - 2,288
228 Reactor plant miscellaneous items 56 1,572 1,218 2,790 - 2,790
Module installation -
22 REACTOR PLANT EQUIPMENT 146,732 248 6,879 2,011 155,622 101,230 170 4,810 47 5,062 160,684
REFERENCE PLANT COST DATA
NUCLEAR ISLAND (NI) BALANCE OF PLANT (BOP)
COA
Table 5.3 Sample reference plant – Cost factor development
Ref Plant Subject Parameter Cost Factor Cost FACTORY SITE SITE
Number Description Parameter Value Value Ratio Exponent Factor EQUIP HOUR MATL220A.211 Reactor vessels Ton 100 150 1.50 0.70 1.33 1.33 - -
220A.212 Reactor internals Ton 100 150 1.50 0.70 1.33 1.33 - -
220A.213 Control Rod Drives Ea 27 35 1.30 0.90 1.26 1.26 - -220A.214 Incore Monitoring MWth 605 845 1.40 0.60 1.22 1.22 - -
220A.221 Primary heat transport system MWth 605 845 1.40 0.60 1.22 1.22 - -220A.222 Intermediate heat transport system MWth 605 845 1.40 0.60 1.22 1.22 - -
220A.223 Steam generator system MWth 605 845 1.40 0.60 1.22 1.22 - -
220A.231 Back-up heat removal system MWth 605 845 1.40 0.60 1.22 1.22 - -220A.25 Fuel handling and storage MWth 605 845 1.40 0.60 1.22 1.22 - -
220A.261 Inert gas receiving & processing Ton 100 125 1.25 0.70 1.17 1.17 - -220A.264 Sodium storage, relief and makeup Ton 100 125 1.25 0.70 1.17 1.17 - -
220A.265 Sodium purification system Ton 100 125 1.25 0.70 1.17 1.17 - -
220A.266 Na leak detection system Mwe 465 650 1.40 0.60 1.22 1.22 - -220A.268 Maintenance equipment Lot 1.00 1.25 1.25 1.00 1.25 1.25 - -
220A.269 Impurity monitoring Lot 1.00 1.25 1.25 1.00 1.25 1.25 - -220A.27 Instrumentation and Control Mwe 465 650 1.40 0.60 1.22 1.22 - -
220A.31 Support engineering Lot 1.00 1.5 1.50 1.00 1.50 1.50 - -
220 Nuclear Steam Supply (NSSS) MWth 605 845 1.40 0.60 1.22 1.22 1.34 1.22
221 Reactor equipment MWth 605 845 1.40 0.60 1.22 1.22 1.34 1.22222 Main heat transport system MWth 605 845 1.40 0.60 1.22 1.22 1.34 1.22
223 Safeguards system % 0.17% 0.15% 0.89 1.00 0.89 - 0.98 0.89
224 Radwaste system MWth 605 845 1.40 0.80 1.31 1.31 1.44 1.31225 Fuel handling MWth 605 845 1.40 0.50 1.18 1.18 1.30 1.18
226 Other reactor plant equipment Reactor $ 0.66% 0.45% 0.68 1.00 0.68 0.68 0.75 0.68227 Reactor I&C Reactor $ 1.42% 0.90% 0.63 1.00 0.63 0.63 0.70 0.63
228 Reactor plant miscellaneous items Reactor $ 1.74% 1.10% 0.63 1.00 0.63 - 0.70 0.63
Module installationm22 REACTOR PLANT EQUIPMENT
REFERENCE PLANT TO SUBJECT PLANT COST FACTORS
COMPONENT COST FACTORCOA
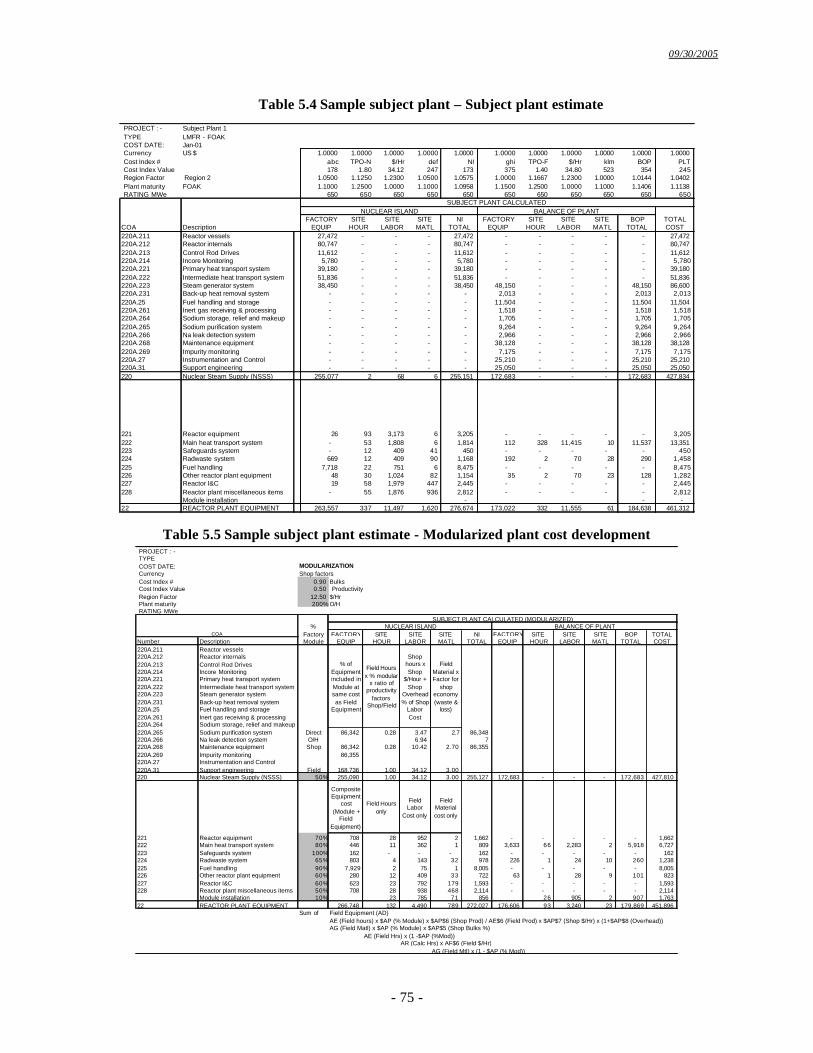
09/30/2005
- 75 -
Table 5.4 Sample subject plant – Subject plant estimate PROJECT : - Subject Plant 1TYPE LMFR - FOAKCOST DATE: Jan-01Currency US $ 1.0000 1.0000 1.0000 1.0000 1.0000 1.0000 1.0000 1.0000 1.0000 1.0000 1.0000 Cost Index # abc TPO-N $/Hr def NI ghi TPO-F $/Hr klm BOP PLTCost Index Value 178 1.80 34.12 247 173 375 1.40 34.80 523 354 245 Region Factor Region 2 1.0500 1.1250 1.2300 1.0500 1.0575 1.0000 1.1667 1.2300 1.0000 1.0144 1.0402 Plant maturity FOAK 1.1000 1.2500 1.0000 1.1000 1.0958 1.1500 1.2500 1.0000 1.1000 1.1406 1.1138 RATING MWe 650 650 650 650 650 650 650 650 650 650 650
FACTORY SITE SITE SITE NI FACTORY SITE SITE SITE BOP TOTALCOA Description EQUIP HOUR LABOR MATL TOTAL EQUIP HOUR LABOR MATL TOTAL COST220A.211 Reactor vessels 27,472 - - - 27,472 - - - - - 27,472 220A.212 Reactor internals 80,747 - - - 80,747 - - - - - 80,747 220A.213 Control Rod Drives 11,612 - - - 11,612 - - - - - 11,612 220A.214 Incore Monitoring 5,780 - - - 5,780 - - - - - 5,780 220A.221 Primary heat transport system 39,180 - - - 39,180 - - - - - 39,180 220A.222 Intermediate heat transport system 51,836 - - - 51,836 - - - - - 51,836 220A.223 Steam generator system 38,450 - - - 38,450 48,150 - - - 48,150 86,600 220A.231 Back-up heat removal system - - - - - 2,013 - - - 2,013 2,013 220A.25 Fuel handling and storage - - - - - 11,504 - - - 11,504 11,504 220A.261 Inert gas receiving & processing - - - - - 1,518 - - - 1,518 1,518 220A.264 Sodium storage, relief and makeup - - - - - 1,705 - - - 1,705 1,705 220A.265 Sodium purification system - - - - - 9,264 - - - 9,264 9,264 220A.266 Na leak detection system - - - - - 2,966 - - - 2,966 2,966 220A.268 Maintenance equipment - - - - - 38,128 - - - 38,128 38,128 220A.269 Impurity monitoring - - - - - 7,175 - - - 7,175 7,175 220A.27 Instrumentation and Control - - - - - 25,210 - - - 25,210 25,210 220A.31 Support engineering - - - - - 25,050 - - - 25,050 25,050 220 Nuclear Steam Supply (NSSS) 255,077 2 68 6 255,151 172,683 - - - 172,683 427,834
221 Reactor equipment 26 93 3,173 6 3,205 - - - - - 3,205 222 Main heat transport system - 53 1,808 6 1,814 112 328 11,415 10 11,537 13,351 223 Safeguards system - 12 409 41 450 - - - - - 450 224 Radwaste system 669 12 409 90 1,168 192 2 70 28 290 1,458 225 Fuel handling 7,718 22 751 6 8,475 - - - - - 8,475 226 Other reactor plant equipment 48 30 1,024 82 1,154 35 2 70 23 128 1,282 227 Reactor I&C 19 58 1,979 447 2,445 - - - - - 2,445 228 Reactor plant miscellaneous items - 55 1,876 936 2,812 - - - - - 2,812
Module installation - - - 22 REACTOR PLANT EQUIPMENT 263,557 337 11,497 1,620 276,674 173,022 332 11,555 61 184,638 461,312
NUCLEAR ISLAND BALANCE OF PLANTSUBJECT PLANT CALCULATED
Table 5.5 Sample subject plant estimate - Modularized plant cost development
PROJECT : -TYPECOST DATE: MODULARIZATIONCurrency Shop factorsCost Index # 0.90 BulksCost Index Value 0.50 ProductivityRegion Factor 12.50 $/HrPlant maturity 200% O/HRATING MWe
%Factory FACTORY SITE SITE SITE NI FACTORY SITE SITE SITE BOP TOTAL
Number Description Module EQUIP HOUR LABOR MATL TOTAL EQUIP HOUR LABOR MATL TOTAL COST220A.211 Reactor vessels220A.212 Reactor internals220A.213 Control Rod Drives220A.214 Incore Monitoring220A.221 Primary heat transport system220A.222 Intermediate heat transport system220A.223 Steam generator system220A.231 Back-up heat removal system220A.25 Fuel handling and storage220A.261 Inert gas receiving & processing220A.264 Sodium storage, relief and makeup220A.265 Sodium purification system Direct 86,342 0.28 3.47 2.7 86,348 220A.266 Na leak detection system O/H 6.94 7 220A.268 Maintenance equipment Shop 86,342 0.28 10.42 2.70 86,355 220A.269 Impurity monitoring 86,355 220A.27 Instrumentation and Control220A.31 Support engineering Field 168,736 1.00 34.12 3.00 220 Nuclear Steam Supply (NSSS) 50% 255,090 1.00 34.12 3.00 255,127 172,683 - - - 172,683 427,810
Composite Equipment
cost (Module +
Field Equipment)
Field Hours only
Field Labor
Cost only
Field Material cost only
221 Reactor equipment 70% 708 28 952 2 1,662 - - - - - 1,662 222 Main heat transport system 80% 446 11 362 1 809 3,633 66 2,283 2 5,918 6,727 223 Safeguards system 100% 162 - - - 162 - - - - - 162 224 Radwaste system 65% 803 4 143 32 978 226 1 24 10 260 1,238 225 Fuel handling 90% 7,929 2 75 1 8,005 - - - - - 8,005 226 Other reactor plant equipment 60% 280 12 409 33 722 63 1 28 9 101 823 227 Reactor I&C 60% 623 23 792 179 1,593 - - - - - 1,593 228 Reactor plant miscellaneous items 50% 708 28 938 468 2,114 - - - - - 2,114
Module installation 10% 23 785 71 856 26 905 2 907 1,763 22 REACTOR PLANT EQUIPMENT 266,748 132 4,490 789 272,027 176,606 93 3,240 23 179,869 451,896
Sum of Field Equipment (AD)AE (Field hours) x $AP (% Module) x $AP$6 (Shop Prod) / AE$6 (Field Prod) x $AP$7 (Shop $/Hr) x (1+$AP$8 (Overhead))AG (Field Matl) x $AP (% Module) x $AP$5 (Shop Bulks %)
AE (Field Hrs) x (1 -$AP (%Mod))AR (Calc Hrs) x AF$6 (Field $/Hr)
AG (Field Mtl) x (1 - $AP (% Mod))
COA
% of Equipment included in Module at same cost as Field
Equipment
Field Hours x % modular
x ratio of productivity
factors Shop/Field
Shop hours x Shop
$/Hour + Shop
Overhead % of Shop
Labor Cost
Field Material x Factor for
shop economy (waste &
loss)
SUBJECT PLANT CALCULATED (MODULARIZED)BALANCE OF PLANTNUCLEAR ISLAND
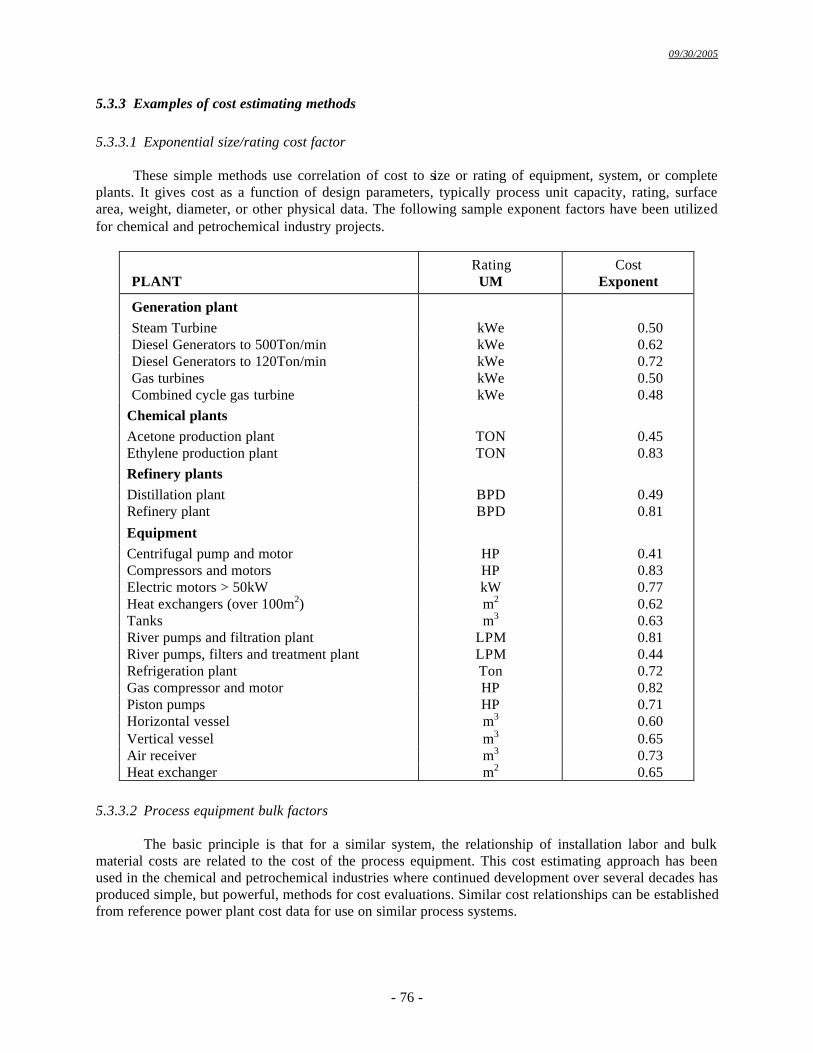
09/30/2005
- 76 -
5.3.3 Examples of cost estimating methods 5.3.3.1 Exponential size/rating cost factor
These simple methods use correlation of cost to size or rating of equipment, system, or complete plants. It gives cost as a function of design parameters, typically process unit capacity, rating, surface area, weight, diameter, or other physical data. The following sample exponent factors have been utilized for chemical and petrochemical industry projects.
PLANT Rating UM
Cost Exponent
Generation plant Steam Turbine kWe 0.50 Diesel Generators to 500Ton/min kWe 0.62 Diesel Generators to 120Ton/min kWe 0.72 Gas turbines kWe 0.50 Combined cycle gas turbine kWe 0.48
Chemical plants Acetone production plant TON 0.45 Ethylene production plant TON 0.83 Refinery plants Distillation plant BPD 0.49 Refinery plant BPD 0.81 Equipment Centrifugal pump and motor HP 0.41 Compressors and motors HP 0.83 Electric motors > 50kW kW 0.77 Heat exchangers (over 100m2) m2 0.62 Tanks m3 0.63 River pumps and filtration plant LPM 0.81 River pumps, filters and treatment plant LPM 0.44 Refrigeration plant Ton 0.72 Gas compressor and motor HP 0.82 Piston pumps HP 0.71 Horizontal vessel m3 0.60 Vertical vessel m3 0.65 Air receiver m3 0.73 Heat exchanger m2 0.65
5.3.3.2 Process equipment bulk factors
The basic principle is that for a similar system, the relationship of installation labor and bulk material costs are related to the cost of the process equipment. This cost estimating approach has been used in the chemical and petrochemical industries where continued development over several decades has produced simple, but powerful, methods for cost evaluations. Similar cost relationships can be established from reference power plant cost data for use on similar process systems.
09/30/2005
- 77 -
5.3.4 Design Options Studies Once the first baseline design for a new concept has been modeled using cost-scaling equations, the
designer can use the integrated design/cost model with an optimization package to further develop the concept. This should be done before launching into more detailed studies using a fixed baseline design.
The potential of this top-down approach for assessing the economics of co-generation of potable
desalinated water and/or hydrogen by products with electricity will be studied within the framework of the EMWG integrated modeling system in 2006. In the course of further engineering studies, both bottom-up and top-down approaches will be used to better estimate the costs of the different parts of the Generation IV systems, including innovative fuel cycles.
5.3.5 Generic Studies
Generic studies to analyze size (modularity) and series effects (e.g., cost beneficial effects of learning in manufacturing and construction) can be performed with the help of top-down modeling (see Marcetteau et al., 2001). This type of work will be extended in future investigation by EMWG of monolithic versus modular construction costs. The effect of modularity on the marketing and reliability of electricity will also be considered.
5.3.6 Top-down Approach for Indirect Capital and Non-Capital Life Cycle Costs
Most of the discussion above dealt with the top-down scaling of equipment and structures for the
new concept. These costs would be rolled-up to the two-digit level as Accounts 21-29. Indirect costs are mostly project support labor costs. These are not usually estimated early in the RD&D program. There are, however, rules of thumb that can be used to calculate the indirect costs (Accounts 30-41) as a fraction of the direct costs. A literature review will be required to find the best algorithms. Engineering-economic textbooks often contain such Cost-Estimating Relationships (CER) for conventional industrial and chemical facilities.
A technique that was previously developed for Generation III+ plant field indirect costs is
presented as an example. Field indirect costs comprise three categories of costs: 1. Fixed, one time charges for items such as purchase and erection of temporary construction
facilities, fence, access road, or utility connections. 2. Scope related costs such as, tools, construction area cleanup, material handling and
warehousing, and 3. Time related costs such as construction equipment rental, site cleanup, and temporary facility
maintenance. Actual cost data was analyzed and costs defined for the three components for a typical 1200 MWe
project, Nuclear Island and BOP scope. An algorithm was developed to calculate the field indirect costs for any size plant. The algorithm for 1/1200 costs are as follows:
NI = 5.09 x 10⁶ (P/1200).33 + 0.48 LN + 3.20 x 10⁵ (P/1200).5 M, BOP = 5.09 x 10⁶ (P/1200).66 + 0.34 LF + 3.20 x 10⁵ (P/1200) M, where: P = Plant rating (MWe) LN = Labor cost for Nuclear Island scope LF = Labor cost for BOP scope
09/30/2005
- 78 -
M = Construction duration (Months) Similar algorithms can be developed for other indirect costs such as construction supervision, design services and PM/CM services.
5.3.7 Other life cycle cost elements. Other life cycle elements that need top-down estimating techniques are the following. Pre-construction costs: Typically only cost of land is included in this category. A cost per acre is
sufficient definition of these costs. The area is to include the project site and any exclusion areas around the plant site.
Contingencies: If an integrated design/cost model exists, an uncertainty analysis can be used for
contingency calculations. This is explained in Appendix A. Interest During Construction: This is handled in the same way as for bottom-up estimating,
except that, in the absence of detailed schedule information, a multi-year, cumulative (e.g., “S-curve”) spending pattern can be imposed on the TCIC.
Commissioning and Start-Up Costs: A CER can be developed from historical data that present
start-up cost as a fraction of TCIC or even RD&D costs. A project that requires high spending on RD&D will probably also involve higher startup costs.
Operations: Some operations cost models exist for conventional reactor types. The ORNL O&M
cost model (Bowers et al., 1987) from the mid-1980s is one such model containing cost-estimating relationships based on water reactor experience. By the use of careful operations analysis, the EMWG and the system development teams should be able to develop new algorithms from old ones, as was the case with SEMER capital costs.
Fuel Cycle Costs: Any new reactor is likely to still use some of the materials and services that are
already commercialized. Scaling might be required in the development of capital and operating costs for a new type of fuel fabrication or reprocessing facilities. The guiding principles would be the same as for developing CERs for the reactor, as described above. Chemical and metallurgical industry CERs should be useful.
D&D Costs: On bottom-up versus top-down D&D cost estimates, see (Pasqualetti and
Rothwell, 1991). For many studies D&D costs are calculated as a fraction of the overnight costs. During the 1970s D&D was often assumed to be 10% of overnight nuclear power plant cost in constant money; recent D&D cost experience indicates that 10 to 33% may be more realistic. The Guidelines recommends assuming that D&D costs represent one third of Total Direct Costs. References Bowers, H.L., Fuller, L.C., and Myers, M.L., 1987, Cost Estimating Relationships for Nuclear Power Plant Operations and Maintenance; ORNL/TM-10563, Oak Ridge National Laboratory; Oak Ridge, TN, USA, November 1987. Delene, J. G., Krakowski, R. A., Sheffield, J., and Dory, R. A, 1988, GENEROMAK: Fusion Physics, Engineering and Costing Model ;Oak Ridge National Laboratory, Oak Ridge, TN, USA.

09/30/2005
- 79 -
Gautier, G.M., 2003, SCOR (Simple Compact Reactor), in Proceedings of ICAPP 2003 held in Cordoba, Spain. Grinblat, P., Gimenez, M., and Schlamp, M., 2002, CAREM: Nuclear Safety Internalized Cost-Effectively from the Concept Genesis, Comision Nacional de Energia Atomica, Bariloche, Argentina. Marcetteau, P., Rouyer, J.L., and Nisan, S., 2001, Size and Series Effects on the Economics of Nuclear Power Plants, in Proceedings of ICONE 9 held in Nice, France. Nisan, S., Rouyer, J-L., Marcetteau, P., and Duflo, D., 2003, SEMER: a simple code for the economic evaluation of nuclear and fossil energy-based production systems, in Nuclear Engineering and Design 221 (2003) pp. 301-313. Pasqualetti, M.J. and Rothwell, G.S. (editors), 1991, “Special Issue on Nuclear Decommissioning Economics.”; The Energy Journal (1991). Williams, K.A.; 1984, A Methodology for Economic Evaluation of Process Technologies in the Early Research and Development Stages, KOA-5684, Oak Ridge Gaseous Diffusion Plant, August 1984, Oak Ridge, TN, USA. (Also a 1984 PhD thesis of the same title for the University of Tennessee, Knoxville, TN, CD-ROM version available from author/ E-mail: [email protected]). Yoder, G. L., et al., 2002, Optimizing a Generation IV Nuclear Power Plant Design Using a genetic Algorithm & 4+D Virtual Reality Technology, proposal to International NERI program Announcement LAB NE-INERI-2002-001, Submitted by Oak Ridge National Laboratory, Auburn University, Seoul National Laboratory, and Philosopia, Inc. in August 2002.
09/30/2005
- 80 -
6. GROUND RULES FOR DETAIL BOTTOM-UP ESTIMATING
This chapter defines the bottom-up estimating guidelines. In Section 6.1 standard plant cost is differentiated from (1) one-time costs incurred during the RD&D stages and (2) the deployment stage with FOAK costs. Section 6.2 refers to the general assumptions underlying cost estimate preparation. Section 6.3 gives specific guidelines. Section 6.4 describes the requirements for estimating direct and indirect capital costs. Section 6.5 to 6.7 briefly outline the requirements for other project costs and will be expanded in later issues of these guidelines. Sections 6.8 and 6.9 provide detail estimating notes by discipline. Sections 6.10 to 6.13 briefly outline the requirements for other plants and will be expanded in later issues of these guidelines.
There are two basic reasons to deal with high-detail bottom-up cost estimating guidelines for
Generation IV systems at an early stage in the RD&D/deployment path: 1. Some of the concepts are closely related to existing reactors for which detailed designs and cost
estimates are available. Examples are the VHTR, which contains many of the features of the GT-MHR or the PBMR (Pebble Bed Modular Reactor). The SFR is also related closely to Japanese and French LMR concepts and to the PRISM/IFR concept developed by General Electric and Argonne National Laboratory. The SCWR builds on conventional water reactor technology. These three concepts should be able to move to detailed bottom-up estimating quickly.
2. It is useful to impose the concept of consistent “level playing field” cost estimating, using guidelines, at an early point in the RD&D program. As A/Es are engaged by the various design teams, they can become accustomed to the discipline imposed by the use of guidelines. If cost estimating conforms to the guidelines and is transparent to all design groups, it will have higher credibility and lead to better decision making.
6.1 Cost Categories
Costs are to be expressed in constant reference year dollars. The data tables for specific estimating parameters in this chapter use January 1, 2001, dollars). All technology development (reactor and fuel cycle RD&D) and prototype life cycle (proto-design, proto-construction, and proto-operations) are to be included in RD&D. A similar accounting structure can be imposed on prototype costs as for commercial plants; in fact, for competing prototype designs within a given concept some sort of cost estimating uniformity will be required to enable fair decision making. All categories may not be applicable for a given system (e.g., a prototype plant may not be needed for all advanced systems). All year-by-year RD&D costs should be reported as a “pre-commercial” category and should not be amortized in the LUEC. Another set of pre-commercial costs are the true FOAK costs that do not recur for subsequent plants (see Figure 1.1). The timing of all pre-commercial expenditures (cash flows) should be identified starting in 2005. Fuel cycle facility construction and operation costs, and the costs of existing fuel cycle materials and services, are discussed in Chapter 8.
The assignment of the costs into categories and their time distributions (discrete cash flows) allows
these estimates to be combined (aggregated cash flows) for a concept through the first commercial plant as a function of time. If the transition plant costs and NOAK plant costs are included, the costs and time distributions may be combined as appropriate for a given plan of commercialization and allows all expenditures for a concept to be shown as a function of time. Details of the energy plant, fuel cycle
09/30/2005
- 81 -
facility, end-use (electricity or hydrogen production), and module factory capital costs should be given in the GIF COA format, which is explained in Appendix F.
A detailed estimate is one of the major milestones in the development of a project from concept to
commercial operation. The first of the detail estimates is usually performed when the design progress reaches sufficient detail to support quantification of major project scope to commodity level. The required design status includes a comprehensive equipment listing that is supported by data sheets and P&ID’s for all the process systems as well as the majority of non-process service systems. The facility structural details are sufficiently developed to support quantification of rebar densities for slabs, walls and other structural components. Electrical may be just at single line levels and the controls may be limited to control room and overall plant control concepts.
During project evolution detail estimates may be performed for initial budget, preliminary estimate
and a final project estimate that may be basis for contractual budgets for the life of the project. The estimate development is a team effort involving all lead personnel and for a typical nuclear
power project requires a schedule of 3 months with a budget of approximately 2000 hours for project control personnel. A project estimator joins the team to prepare the instructions in the form of an estimate kick-off package.
6.2 General Ground Rules
See section 4 for discussion of general ground rules and assumptions that are applicable to both the bottom-up and top-down estimating techniques.
6.3 Specific Cost-Estimating Assumptions
The following assumptions will be used in developing the base construction cost estimates with the bottom-up detail estimating techniques.
1. For full bottom-up detail estimating process, the project scope definition is required to be at a fairly
definitive level, sufficient to quantify not only the process equipment with data sheets but also most of the other commodities such as non-process equipment, pipe and valves, concrete and structural steel, HVAC and plumbing, electrical equipment, control room equipment.
2. Some of the commodities such as electrical cable or field instrumentation may not be sufficiently detailed at time of initiating a bottom-up detail estimate. Typical definitive project estimates include quantification of commodities such as cable and raceway that has been developed from equipment lists, circuit loading tabulations, instrumentation indexes and historical parametric data for average number of cables per circuit and average lengths.
3. For the direct cost, the subject plant will be quantified to commodity levels to the same level as the composite unit pricing and unit hour applications. For example the scope of structures and Concrete category of work will include quantification of commodities for 11. - Temporary form, 12. - Permanent form, 13. - Embedded metals, 14. - Reinforcing steel and 15. – Structural concrete. See the description of commodity codes in Appendix F – Code of Accounts. Standard commodity COA with unit prices and unit hours will be available for use by each reactor design team.
4. Other coding of the estimate detail to support reporting requirements is to be included at the detail record level. Separation of nuclear and non-nuclear costs, unitized and common costs, recurring and non-recurring costs, etc. See discussion in section 4. - General ground rules and assumptions.
5. The quantification of the project scope can serve other project needs besides the estimate. Engineering work plans and staffing levels can utilize quantity of commodities with historic design
09/30/2005
- 82 -
production rates. Construction schedules depend on quantities of commodity and historic sustained rates of installation. COA coding can provide identifications for procurement, delivery and installation progress reporting. Eventual testing and startup activities are supported by the GIF COA coding that was initially defined during the bottom-up detail estimating process.
6. Each GIF COA detail at level 3 or lower is to be quantified and coded to the commodity detail with links to standard unit equipment cost or unit material cost and a standard unit hour rate for each commodity. Labor cost will be developed with a standard composite cost per hour by category of work. Each detail record will then be extended for a total cost.
7. Each detail record will carry coding to identify scope or quantity basis and basis for pricing equipment or material costs. The quantity basis will identify how the quantity was developed and the pricing basis will in most cases come from the standard commodity unit rates, except when a record is created with specific input that is unique to the project. This information will compile total project costs on a pricing basis and provide input to contingency cost assessments.
6.4 Construction costs
The estimate kick-off package provides a recap of the project status and the ground rules for the
estimate and discusses the methodology to be utilized for the quantification, pricing and labor development for all the components of the project scope.
Scoping documentation packages for each discipline estimator are assembled for an efficient start
to the estimating effort. An estimate kick-off meeting is conducted with attendance by all senior team members, including
project management, engineering, procurement and construction (EPC). The meeting familiarizes everyone with the forthcoming effort to ensure appropriate support during the ongoing design effort with minimal disruption.
The estimate kick-off package includes:
1. Background – Brief history of project, placing the estimate deliverable in project perspective. 2. Intent – Describes the purpose and emphasizes the goals to be achieved. 3. Project scope – Describes the physical scope and the scope of services to be included for each major
account. 4. Participant and Division of responsibility – Identification of the team members and the area of
responsibility in support of the estimating effort. 5. Documentation of estimate basis – identifies the process for transmittals and documentation for all
basis reflected in estimate. 6. Coding requirements – describes the project code of accounts and other type of information to be
captured and coded during the estimating process for all project needs. 7. Services estimates – describes the requirements for development of estimates for services by each
participating organization. Requirements for identification of tasks, staffing levels, durations, staff salary grades, manpower levels and other cost input.
8. Quantification of capital plant – This is the major section of the estimating effort supported by project control personnel and the package describes in detail, the available scoping basis and the methodology to be used for quantification each commodity for each discipline. The methodology identifies take-off items and those that will use some parametric approach for concurrence by the team. Use of reference project data is identified. The basis for each commodity quantity is to be identified by a code.
09/30/2005
- 83 -
9. Labor development for direct costs – Requirements to utilize standard unit hours for subsequent application of productivity factors that have been determined for the site. Composite labor cost per hour were previously developed with input from construction and labor relations departments. The rates are calculated by category of work and estimating discipline.
10. Material and equipment pricing for directs – Guidelines for development of commodity unit prices for input to the estimating programs and subsequent input of scope quantity records. Use of reference project data is identified. The basis for each commodity unit cost is to be identified by a code. Procurement department support requirements are identified. Instructions for inclusions or exclusions for items such as tax, freight, escalation, warranty, spare parts or vendor support is provided.
11. Direct cost validation checks – Identifies requirements for comparison and reconciliation to previous estimates and actual project data, with tabulation of ratios and other parameter checks for validation of the current estimate at direct cost levels.
12. Field indirect cost –Identifies responsibilities for input and review for the indirect cost component such as support craft labor, temporary facilities and services, construction equipment, tools and supplies, non-manual staff, office costs, insurances, bonds and start-up support requirements. Identifies requirements for comparison and reconciliation to any previous estimates and/or reference project current or historic data. The requirements for tabulation of ratios and other parametric validation checks for the indirect accounts are defined.
13. Construction schedule – after the scope and quantities have been reviewed and finalized, the development of the project construction schedule is initiated with sequence and activities based on category quantities and the durations based on historical sustained rates of installation. The schedule is further developed to reflect the proposed project execution plan, construction work week, pre-assembly or modularization plans. The schedule is then resource loaded and optimized to produce staffing curves by craft, installation curves and cash flow requirements. A comparison to historic data supports the review process.
14. PM/CM and design costs – Level of effort staffing plans are to be developed for the PM/CM services. Design costs to be developed for remaining tasks based on quantity of commodity to be designed and budget rates of production. Other tasks are developed for level of effort and project schedule. Estimated salary grades are assigned for the tasks and summarized by COA. The resultant hours are extended with composite rates inclusive of benefits, taxes and insurance for total labor cost. Office space, equipment, travel, consulting services and other costs are quantified and priced at current pricing levels. Fees, incentives and other costs are calculated based on estimate guidelines and contractual agreements.
15. Contingency cost and schedule – the estimate is to be summarized by the coded basis of scope and pricing and the project team provides input to a risk analysis that relates level of risk for cost overrun and the corresponding contingency. Management provides the acceptable level of risk and the probability of cost overrun. The assessment is to be in accordance with the estimating guidelines for the project.
16. Reviews – Identifies the series of reviews and supporting data to be presented. Initial reviews are conducted with engineering for all the project quantities, prior to proceeding with other cost development. Discipline reviews are conducted with EPC participation. Project schedule reviews are conducted with project construction and construction management departments. Total project cost estimate is then presented for review by management and supported by the EPC team. Final reviews would be presented by the project management team to corporate or governing agencies directors for final approval of the project budget.
09/30/2005
- 84 -
6.5 Other Capital Cost Components
Other capital costs for accounts 30-60 – This scope of the estimate may be sequenced after resolution of the construction cost and schedule, which may become a basis for other capital costs. Describes the scope and pricing basis for each major account, including required documentation, summaries and comparison data. Reactor first fuel load costs may come from a separate estimating effort for the fuel fabrication facility.
6.6 Annual O&M Costs
At the conclusion of the capital cost and with input from that effort, the annual operating costs are to be developed with staffing levels by department, position and salary grade, consumables, lubricants and other supplies quantified for annual costs.
6.7 LUEC Calculations
The estimate details are to be summarized to level 2 COA and provide input to separate cost models for calculation of LUEC for capital cost, Fuel and annual O & M cost components.
6.8 Power Plant Detailed Bottom-up Estimating Notes 1. For full bottom-up detail estimating process, the project scope definition is required to be at a fairly
definitive level, sufficient to quantify not only the process equipment with data sheets but also most of the other commodities such as non-process equipment, pipe and valves, concrete and structural steel, HVAC and plumbing, electrical equipment, control room equipment, and other commodities.
2. Some of the commodities such as electrical cable or field instrumentation may not be sufficiently detailed at time of initiating a bottom-up detail estimate. Typical project estimates include quantification of commodities such as cable and raceway that has been developed parametrically from available project data and historical information.
3. For the direct cost, the subject plant will be quantified to commodity levels to the same level as the composite unit pricing and unit hour applications. For example the scope of structures and concrete category of work will include quantification of commodities for 11. - Temporary form, 12. - Permanent form, 13. - Reinforcing steel, 14. - Embedded metals, and 15. – Structural concrete. See the description of commodity codes in Appendix F – Code of Accounts. Standard commodity COA with unit prices and unit hours will be available for use by each reactor design team.
4. Other coding of the estimate detail to support reporting requirements is to be included at the detail record level. Separation of nuclear and non-nuclear costs, unitized and common costs, recurring and non-recurring costs, etc. See discussion in section 4. - General ground rules and assumptions.
5. The quantification of the project scope can serve other project needs besides the estimate. Engineering work plans and staffing levels can utilize quantity of commodities such as pipe, with historic design production rates. Construction schedules depend on quantities of commodity and historic sustained rates of installation. COA coding can provide identifications for procurement, delivery and installation progress tracking and reporting. Eventual testing and startup activities are supported by the GIF COA coding that was initially defined during the bottom-up detail estimating process.
6. Each GIF COA detail at level 3 or lower is to be quantified and coded to the commodity detail with links to standard unit equipment cost or unit material cost and a standard unit hour rate for each commodity. Labor cost will be developed with a standard composite cost per hour by category of work. Each detail record will then be extended for a total cost.
09/30/2005
- 85 -
7. Each detail record will carry coding to identify scope or quantity basis and basis for pricing equipment or material costs. The quantity basis will identify how the quantity was developed and the pricing basis will in most cases come from the standard commodity unit rates, except when a record is created with specific input that is unique to the project. This information will compile total project costs on a pricing basis and provide input to contingency cost assessments.
8. Project indirect costs will initially be estimated with algorithms similar to the top-down estimating technique as described in Section 5.3.6. Subsequent project definition may include individual account quantification, unit pricing and staffing requirements development by task and duration. Composite costs per hour of labor may eventually reflect actual salary levels by grade of personnel.
9. Cost summaries based on standard unit rates and standard labor cost per hour will facilitate a direct comparison between alternative reactor concepts. The differences in direct cost will essentially be scope related for each reactor design.
10. Appropriate cost factors to adjust the standard unit rates to each region will be developed with input by the individual design team and region. These factors may be global for each cost component or be variable by category of work. It is unlikely that commodity level factors will be developed or required.
11. Direct cost summaries based on the region adjusted unit rates will be the basis for tabulation of FOAK and NOAK plant costs. Appropriate learning adjustment factors, amortization of non recurring costs and other considerations will produce level 2 COA summaries that in turn will provide input to other cost models for calculation of LUEC.
12. The relationship of project costs for the different reactor concepts may change for different regions. It is likely that labor productivity and composite cost per hour may contribute to an increase or decrease in the LUEC for the regions considered.
13. The resultant LUEC costs are the final cost comparison between the different reactor concepts. Other considerations such as proliferation or sustainability may contribute to the comprehensive evaluation of the recommended reactor system.
6.9 Discipline Notes for Scope/Quantity Development
The estimate kick-off package is to discuss major techniques that are to be utilized in developing the scope and quantities by discipline. The project team will consider the costs of providing any additional details versus contributions to accuracy and impact on plant costs. Other considerations for project use such as traceability, procurement status and construction tracking may optimize the estimating effort budget and schedule.
Sample discipline – methodology tabulation Category/Commodity Methodology CIVIL Site excavation Develop for area of site Structural excavation Develop for all buildings Structural backfill Develop from excavation and construction scope Trenching Develop from site plan markup for pipe and duct bank Temporary formwork Develop from arrangement drawings Permanent formwork Develop from arrangement drawings Embedded metals Allowance ratio to volume of concrete by structural component Reinforcing steel Take-off sample ratio to volume of concrete by structural component Concrete Develop from arrangement drawings with use of averagewall/slab
thicknesses as necessary Structural steel Take-off or develop from arrangement drawings for process buildings,
non-process buildings use allowance weight/building floor areas Miscellaneous steel Ratio to weight of structural steel
09/30/2005
- 86 -
Liner plate Develop with engineering definition Roofing Process buildings by take-off, other with allowances per floor area Siding Process buildings by take-off, other with allowances per floor area Painting/coating Develop from arrangement drawings marked up by engineering for
type of system Windows/doors Take-off from arrangement drawings Interior finishes and furnishings Develop from arrangement drawings marked up by engineering Non process buildings Allowances of cost and hours per floor area, including services. MECHANICAL Process equipment Per equipment list verified with P&ID’s Non-process equipment Per equipment list, P&ID’s and reference plant development HVAC ductwork Develop from engineering markup of arrangement drawings Insulation Develop for scope defined by engineering PIPING Process system piping Conceptual routing of pipe from P&ID and arrangement drawings Utility system piping Conceptual layout of utility piping systems on arrangement drawings or
site plans, plus system equipment interconnections. Facility services piping Plumbing and drainage systems conceptual layout mark up on
arrangement drawings Process systems valves Take-off from P&ID’s including allowances for instrumentation root
valves. Large pipe hangers Average spacing, including use of multiple pipe hangers. Small pipe hangers Not quantified. Included in cost of small pipe Miscellaneous piping items Not quantified. Included in allowance for miscellaneous piping
operations ratio to large and small pipe Pipe Insulation Develop with pipe scope based on engineering definition for insulation
requirements. ELECTRICAL Distribution equipment, DC and emergency power Take-off from single line diagrams Cable tray Develop from conceptual tray layout marked up on arrangement
drawings. Duct bank conduit Develop from conceptual routing marked up on site plans. PC&I Exposed conduit Develop from historical ratio of raceway to cable Scheduled power cable Develop for single line diagram distribution and connected loads with
average length and average size distribution. Scheduled Control cable Develop with historical ratio to connected loads, average length and
average size distribution Scheduled instrumentation cable Develop with historical ratio to quantity of field instruments, average
length and average size distribution. Grounding Develop from conceptual layout mark up on site plan plus route length
of cable tray. Process buildings lighting Reference plant ratio of commodities per floor area. Non-process building lighting Not quantified. Included in costs per floor area. Yard lighting Developed from conceptual layout marked up on site plans. Communication systems Developed from engineering markup of arrangement drawings. Cathodic protection Develop allowance from engineering system description and marked up
site plans. Heat tracing Develop allowance from engineering system description and
quantification of piping systems. Radio system Develop from engineering system description and markup of
arrangement drawings for the antenna system. Security system Develop allowance for system with engineering input and reference
plant data. INSTRUMENTATION Plant protection and control system Develop costs with engineering capacity data and vendor input.
09/30/2005
- 87 -
Control room equipment Develop from arrangement drawings and system data sheets. Local control panels Develop from equipment list and reference plant data. Instrument racks Design allowances by areas of plant. Field mounted instruments Instrument index and take off from P&ID’s. Control valves Take off from P&ID’s. Instrumentation bulks Reference plant date ratio to field mounted instruments.
Guidelines and parametric data to be developed for project scope that typically is not available at time of initial detail bottom-up estimate. 1. Reinforcing steel weight ratio to volume of concrete by structural component. 2. Embedded metals weight ratio to volume of concrete by structural component. 3. Service building allowance quantity of composite concrete per floor area. 4. Service building allowance architectural and services per floor area. 5. Miscellaneous steel quantity percentage of structural steel. 6. Architectural finish cost and hours per floor area by building. 7. HVAC system ductwork and controls cost and hours per building volume by building. 8. Small pipe quantity percentage of large pipe. 9. Pipe hangers percent cost and hours of large pipe. 10. Pipe insulation percent cost and hours of large pipe. 11. Piping miscellaneous operations percent cost and hours of large and small pipe. 12. Instrumentation bulks quantity ratio to field instruments. 13. Instrumentation control panels cost and hours per length of field panels. 14. Power, Control and Instrumentation (PCI) cable development guideline. 15. PCI cable connection quantity development guideline. 16. PCI exposed conduit development guidelines. 17. Non-metallic underground conduit quantity development guideline. 18. Lighting fixtures quantity, per floor area by building. 19. Lighting wire and conduit quantity, cost and hours per light fixture. 20. Lighting panels and miscellaneous equipment cost and hours percentage of light fixtures. 21. Communication systems cost and hours per floor area by building. 22. Security system allowance cost and hours. 23. Grounding system conceptual quantity, cost and hours development guideline. 6.10 Other Plants
Similar estimating process is applicable for estimating hydrogen production, desalination or other co-generation concepts. Summaries of the direct costs will be merged with the power plant direct cost, prior to estimating the indirect and owner accounts for the combined project. Level 2 COA summaries will provide input to other cost models for calculation of LUEC and Levelized unit product cost (LUPC). 6.11 Dedicated fabrication facility
Any dedicated factory proposed for fabrication of major equipment or structural modules should be estimated in detail for the construction costs as a separate project and a separate investment recovery. Annual ownership and operation costs should be estimated for the planned production capability or throughput. Amortization of the factory capital costs and operation costs are to be calculated for recovery
09/30/2005
- 88 -
over the planned production quantity and expressed as a percentage overhead cost relative to shop labor. All components manufactured at the factory will be priced inclusive of shop overheads with the amortization component. Process equipment and materials that will be built into the factory modules are to be priced without mark-up. 6.12 Fuel fabrication plant
Fuel fabrication facilities are to be sized to meet the projected fuel needs for the reactor concept and the nominal fleet size of 32 GW of plant capacity. Similar estimating process will be utilized to estimate the capital construction costs of the fuel fabrication plant. Separate estimates of the annual operating costs and production capacity will provide input to a separate cost model for calculation of levelized unit fuel cost (LUFC) including returns on the investment. The resultant costs will provide the fuel cost component for calculation of LUEC for the power plant. The first fuel load may be required prior to commercial operation of the dedicated fuel fabrication facility therefore the cost may be significantly higher if fabrication is a manual process. 6.13 Fuel reprocessing plant
Similar considerations as for the fuel fabrication plant except the schedule requirements are linked to the back-end of the fuel cycle. Separate estimates of the annual operating costs and reprocessing capacity will provide input to a separate cost model for calculation of levelized unit reprocessing cost (LURC) including returns on the investment. The resultant costs will provide the fuel reprocessing cost component for calculation of LUEC for the power plant.
References Delene, J.G. and Hudson, C.R., 1993, Cost Estimate Guidelines for Advanced Nuclear Power Technologies; ORNL/TM-10071/R3, Oak Ridge National Laboratory, Oak ridge, TN, USA, May 1993. IAEA, 2000, Economic Evaluation of Bids for Nuclear Power Plants: 1999 Edition, Technical Reports Series No. 396, International Atomic Energy Agency; Vienna, Austria. ORNL, 1988, Technical Reference Book for the Energy Economic Data Base Program EEDB-IX (1987); DOE/NE-0092, Prepared by United Engineers and Constructors, Inc., Philadelphia, PA, under the direction of Oak Ridge National Laboratory, Oak Ridge, TN, USA, July 1988. Reed Business, 1992, Means Building Construction Cost Data, Reed Business Information Co. Whitman, Requardt, & Associates, 1992, The Handy-Whitman Index of Public Utility Construction Costs, Bulletin No. 154, Baltimore, MD, USA.
09/30/2005
- 89 -
7. TOTAL CAPITAL AT RISK
This section provides the ground rules for preparing an estimate of the Total Capital Investment Cost (TCIC) of an energy plant. TCIC corresponds to the Total Capital At Risk figure of merit for the Generation IV Economic Goal: to have a level of financial risk comparable to other energy projects. The base and overnight construction costs, described in Chapters 5 and 6, are the starting point for costs developed in this section. The TCIC should be calculated in January 2001 constant dollars. In the present guidelines cost estimation inflation and escalation are excluded. This chapter discusses cash flow, IDC and contingency.
7.1 Cash Flow
If possible (most likely for bottom-up estimates) the cash flow (funding) requirements during the design, construction, and start-up period should be determined on a quarterly basis (four schedule increments per year) for the prototype, FOAK, and NOAK plants. Some concepts might not have enough detailed engineering and scheduling completed to report cost data by quarters. If this is the case, annual cash flows should be reported or a generic (e.g., “S-curve”) cumulative distribution should be explicitly applied to the TCIC. The cash flow should be expressed in 2001 constant dollars, as are the overnight costs, and should indicate whether contingency costs are included. Contingency costs should be explicitly included in the cash flow data if it is not assumed that contingency cash flow is directly proportional to base construction cost cash flow. Time effects, such as escalation, should not be included in the cash flow, since estimates are to be prepared in constant dollars.
7.2 Interest During Construction (IDC)
Once money is raised and the construction payments begin, an accumulated return (interest) to the
construction loan, investors, or bank must be accrued until commercial operation. This return is referred to as IDC. Usually, in the United States, the IDC rate is an average cost of money, including both equity and debt capital used to finance a project. Because methods of financing and taxation vary widely from country to country, the EMWG suggests that financing and taxation should not be used to discriminate among technologies at this stage of Generation IV system development. For comparison purposes, cost estimators using the present guidelines should calculate IDC at both 5% and 10% (see IEA and NEA, 1998).
Constant dollar interest will be calculated using the cash flow summaries developed following
Chapter 5 and using discount rates of both 5% and 10%. All interest costs will be capitalized up to the commercial operation date using the following method. The equation is:
]1)1[( = IDC1
−+ −=
=∑ jt
Jj
jj
opXC ,
where: Cj = cash flow for year or quarter j, reflecting beginning-of-period borrowing IDC = constant dollar IDC cost J = number of periods (quarters or years of construction) j = period # top = quarter or year of commercial operation X = real discount rate expressed annually or quarterly, as appropriate.
09/30/2005
- 90 -
If the cash flow data developed does not explicitly contain contingency costs, then the interest
calculated using the cash flow summaries must be adjusted by the ratio of the total overnight cost to base construction cost as:
. IDC x cost
ycontingenc +cost = IDC cost basetotal ycontingencpre
ycontingencpre−
−
If discounted cash flows, taken back to a reference year before construction, are used to calculate
unit costs of electricity or other products, the IDC does not need to be calculated, since the discounting process automatically accounts for interest charges. IDC on equipment and facilities related to non-electrical energy products will be treated separately.
7.3 Contingency
Contingency applies to both bottom-up and top-down estimates. The difference is in the level of
detail and level of mathematical/methodological complexity with which contingency is estimated. For Generation IV system cost estimation there are three contingencies to consider: base cost, schedule and performance.
7.3.1 Contingency on Base Cost plus Commissioning Cost (Account 52)
This contingency is an allowance applied to the base cost (sum or all items/activities in level one of
COAs 1X thru 5X). It is usually calculated by multiplying the sum of the above accounts by a contingency factor. The factor is often represented as a percentage, for example if a 20% contingency has been applied, the base cost will be multiplies by 1.2 to reflect contingency.
Calculation of contingency is a complex subject. There are both deterministic and probabilistic
methods for calculating its value. Deterministic methods, such the Hackney method (Hackney, 1997) require assessment of the maturity and complexity level of the various aspects of the project and cost weighting of the base estimate. The probabilistic approach requires statistical methods and the determination of uncertainty ranges for the key cost parameters affecting the costs. Also, a contingency must have a statistical level of confidence associated with it. As an example, a decision maker may want an estimate that gives him 90% confidence that the pre-contingency cost estimate plus the contingency lump sum or “overnight cost” will not be overrun. Appendix A describes the definitional, statistical, and economic issues associated with contingency determination.
7.3.2 Contingency on Schedule (Account 69)
Cost overruns for many projects are caused by construction schedule slippage: “time is money” and
schedule slippage causes an increase in both base and financing (interest) costs. Since it is too early to have detailed construction schedules for Generation IV projects, calculation of the costs of schedule overruns or under-runs cannot be explicitly calculated by linking scheduling software, such as Primavera or Microsoft Project with cost uncertainty software, such as @Risk, Crystal Ball, or ORMONTE (Williams, 1989). The application of a contingency factor to the IDC is suggested as a means of representing the cost effects of schedule uncertainty (See Appendix A. Section 3.1.).
7.3.3 Contingency on Reactor Performance
Performance under-run is a major cause of unit cost overrun for energy projects. The major
measure of energy production performance for an energy plant is the capacity factor (CF). If a new
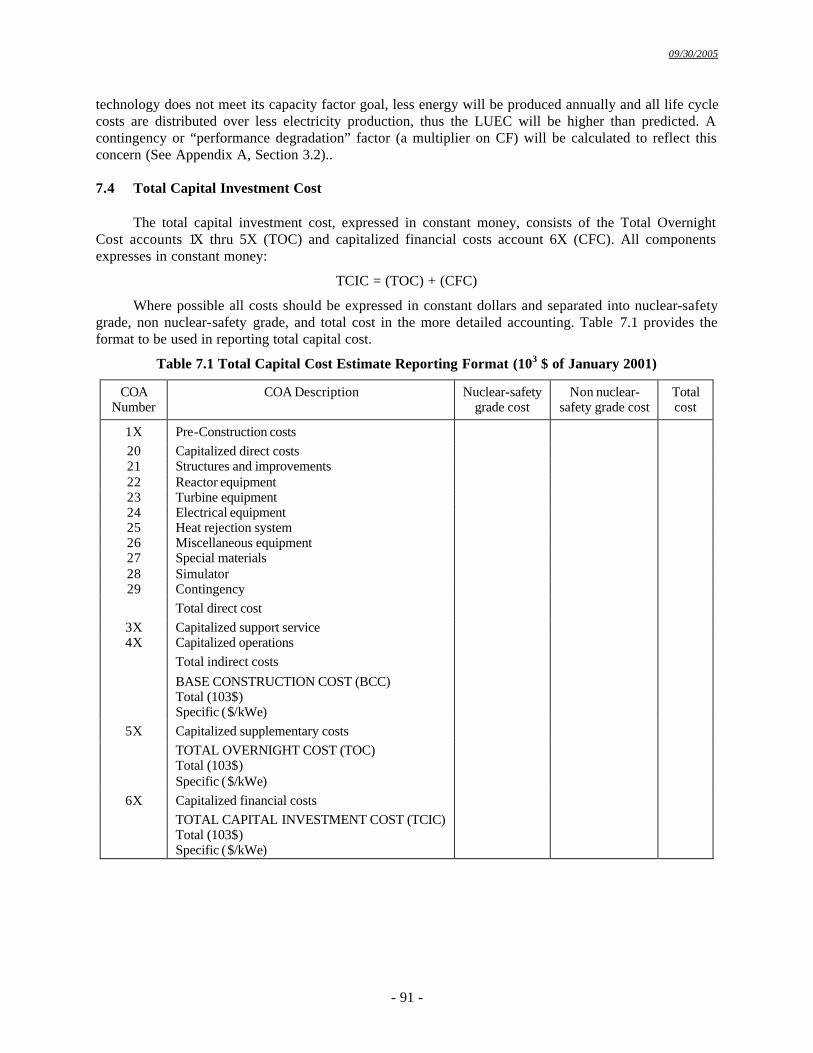
09/30/2005
- 91 -
technology does not meet its capacity factor goal, less energy will be produced annually and all life cycle costs are distributed over less electricity production, thus the LUEC will be higher than predicted. A contingency or “performance degradation” factor (a multiplier on CF) will be calculated to reflect this concern (See Appendix A, Section 3.2)..
7.4 Total Capital Investment Cost
The total capital investment cost, expressed in constant money, consists of the Total Overnight
Cost accounts 1X thru 5X (TOC) and capitalized financial costs account 6X (CFC). All components expresses in constant money:
TCIC = (TOC) + (CFC)
Where possible all costs should be expressed in constant dollars and separated into nuclear-safety grade, non nuclear-safety grade, and total cost in the more detailed accounting. Table 7.1 provides the format to be used in reporting total capital cost.
Table 7.1 Total Capital Cost Estimate Reporting Format (103 $ of January 2001)
COA Number
COA Description Nuclear-safety grade cost
Non nuclear-safety grade cost
Total cost
1X Pre-Construction costs 20 Capitalized direct costs 21 Structures and improvements 22 Reactor equipment 23 Turbine equipment 24 Electrical equipment 25 Heat rejection system 26 Miscellaneous equipment 27 Special materials 28 Simulator 29 Contingency
Total direct cost 3X Capitalized support service 4X Capitalized operations
Total indirect costs BASE CONSTRUCTION COST (BCC)
Total (103$) Specific ($/kWe)
5X Capitalized supplementary costs TOTAL OVERNIGHT COST (TOC)
Total (103$) Specific ($/kWe)
6X Capitalized financial costs TOTAL CAPITAL INVESTMENT COST (TCIC)
Total (103$) Specific ($/kWe)
09/30/2005
- 92 -
7.5 Capital Cost Component of the LUEC
Under the assumption of equal annual energy generation, the equation for calculating the constant dollar levelized capital cost can be expressed as:
LCC = (FCR x TCIC)/E, where: LCC = Levelized Capital Cost in constant dollars, ($/MWh); FCR = constant dollar Fixed Charge Rate (per year); TCIC = Total Capital Investment Cost in constant dollars ($); and E = annual electric energy generation for single unit (MWh/year).
A fixed charge rate is normally used to account for return on capital, depreciation, interim
replacements, property tax, and income tax effects. The fixed charge rate is discussed in detail in Appendix B of Delene and Hudson (1993). The fixed charge rate can be calculated using the NECDB (ORNL, 1988) methodology as implemented in an IBM type PC code (Coen and Delene, 1989). Since for Generation IV cost estimation tax and depreciation considerations are being ignored at present, the constant dollar fixed charge rate is calculated as a capital recovery factor, or amortization factor, as one would use to calculate the amortization of a loan:
FCR = X/[1 – (1 + X)-Lecon],
Where: X = real discount rate (5% and 10 %); and Lecon = economic or regulatory life of the plant (years), assumed to be the same as the number of years of commercial operation. The TCIC, which is the sum of the overnight cost plus the cost of the construction loan, is being
“rolled-over” to a mortgage-type loan that recovers all of the capital investment (principal plus interest) over the operational or regulatory life of the plant. As more robust plants capable of 50+ years of regulatory life are constructed, and as investors demand shorter payback periods, the future capital recovery period is likely to be considerably shorter than actual plant operating or regulatory lifetimes.
In the present guidelines, 5% and 10% real rates of return are used because they are considered
representative of the average cost of capital for most nuclear energy plant owners. The 5% real discount rate is appropriate for plants operating under the more traditional “regulated utility” model where revenues are guaranteed by captive markets. The 10% real discount rate would be more appropriate for a riskier “deregulated” or “merchant plant” environment where the plant must compete with other generation sources for revenues.
The levelized cost of capital (expressed in $/MWh) for nuclear plants is usually the largest
component of the overall cost of electricity, mainly because the capital facility must be extremely robust, have adequate safety systems, and be built to very high Q/A standards. Other unit cost components are lower, especially fuel, since nuclear energy plants produce a large amount of energy from a very small volume. This differs from fossil plants, where fuel is usually the dominant unit cost component. References Coen, J. J., and Delene, J.G., 1989, User Instructions for Levelized Power Generation Cost Codes Using an IBM-Type PC, ORNL/TM-10997, January 1989, Oak Ridge national Laboratory; Oak Ridge, TN, USA.
09/30/2005
- 93 -
Delene, J.G., and Hudson, C.R., 1993, Cost Estimate Guidelines for Advanced Nuclear Power Technologies; ORNL/TM-10071/R3, May 1993, Oak Ridge National Laboratory, TN, USA. Hackney, J.W., 1997, Control and Management of Capital Projects, American Association of Cost Engineers, Morgantown, WV, USA. IEA and NEA, 1998, Projected Costs of Generating Electricity: Update 1998, OECD, Paris, France. ORNL, 1988, Nuclear Energy Cost Data Base: A Reference Data Base for Nuclear and Coal-fired Power Plant Power Generation Cost Analysis (NECDB); DOE/NE-0095, September 1988, Prepared by Oak Ridge National Laboratory, Oak Ridge, TN, USA. Williams, K. A., and Hudson, C. R. II, 1989, ORMONTE: An Uncertainty Analysis Code for Use with User-developed Systems Models on Mainframe or Personal Computers, ORNL/TM-10714,Oak Ridge National Laboratory, Oak Ridge, TN, USA.
09/30/2005
- 94 -
8. FUEL CYCLE COST
8.1 Introduction
If the levelised lifetime cost methodology is adopted for estimating total generation cost, adopting the same approach for fuel cycle cost ensures consistency. The cash out-flow for fuel cycle material and services commences before the reactor starts to generate electricity and continues well after the reactor ceases operation. The exact timing of payments for uranium, fuel fabrication, reprocessing, etc., depends on the fuel cycle chosen and the associated lead and lag times for each of the fuel cycle components.
In order to calculate the overall fuel cycle cost, the magnitude of each component cost Fi and the
appropriate point in time when it occurs must be identified. The quantities and specifications of the fuel required are derived from the reactor characteristics and will be provided by system development teams; these quantities of material and services must be adjusted to allow for process losses in the various component stages of the nuclear fuel cycle. Each component cost can then be calculated by multiplying the quantity of material or service by the unit price (cost to the owner/operator).
)(.)( tPMtF iii =
where: Mi = Quantity of material/service required for step i Pi (t) = Price of material/service i at the time t In this version of the guidelines, it is assumes that at equilibrium, fuel cycle requirements and
performance can be averaged over economic the lifetime of the plant. With this assumption, the levelized fuel cycle cost can be calculated using the formula below:
( )( )∑ ∑++=
−=−+i
TLtt
Ttttt
i
r
tF20
1001
)(
where: t0 = reference date (generally commissioning date) L = reactor lifetime T1 = max. value of lead time (in front-end) T2 = max. value of lag time (in back-end) r = discount rate The unit cost factors ($/kg of material) that are addressed in this chapter will depend on the
following factors: • Fissile/fertile materials used (NATU, LEU, HEU, MOX, U-Th, etc.). • Enrichment of fissile materials. • Other materials in the fuel assemblies (Zr, graphite, etc.).
• Services required for producing the needed materials (mining, milling, conversion, enrichment, fabrication).
• Costs of spent fuel disposal or of reprocessing and HLW (incl. TRU waste) disposal.
09/30/2005
- 95 -
The availability of existing fuel infrastructure or the need to create new infrastructure is a key driver of fuel cycle unit costs.
8.2 Costing of Commercially Available Fuel Cycle Services and Materials
The following paragraphs give an overview of the costs of the different fuel cycle steps as reported
in literature as well as possible tendencies for future developments of these cost as perceived at present, according to a recent NEA study on trends in the nuclear fuel cycle (NEA, 2002).
The very low natural uranium prices prevailing at the end of the 20th century, i.e., about
20 $/kgU3O8, imposed economic difficulties even for the very best mines. While a continued supply of uranium from materials declared excess to national security by the US and Russia is likely to maintain this low price in the short term, a rebound of demand for newly mined natural uranium (due to draw-down of inventories and other market factors) could result in price increase. Indeed, significant uranium price increase occurred between 2003 and 2005. A minimum price range of 40-50 $kgU3O8 likely would be needed to allow the mining industry to expand production to cope with a renewed growth of nuclear power capacity.
The conversion market, in essence based on chemical processes, has experienced a period of
decreasing prices in the past years. The present price for long-term contracts for conversion of natural uranium oxide to uranium hexafluoride for enrichment lie in a nominal range of 4 to 6 $/kgU, while spot prices in 2000 (reported by NUKEM) lie in the range of 2.45 to 3.85 $/kgU. In the longer term, an upper bound of about 8 $/kgU may be expected.
As indicated above, the enrichment market has seen significant changes and is characterized by
persistent over-capacity. This has resulted in a present price range of about 80 to 100 $/SWU. In the years to come, the market situation will continue to be influenced by highly-enriched uranium coming from disarmament programs, which is likely to induce downward pressure on enrichment prices.
Existing excess capacities in a highly competitive market have led to a drastic decrease in the UOX
fabrication price, currently in a range between 200 and 300 $/kgU. With respect to the future development of the UOX fabrication price, the most important factors are technical developments influencing the fuel assembly demand (e.g., burn-up increase), continued efforts to further improve the efficiency of the manufacturing processes, as well as effects resulting from mergers of suppliers (e.g., reduction of excess capacities). In contrast to all other steps in the fuel cycle, fuel assembly design and fabrication also influences the specific costs of the other steps and, being the link between fuel cycle and nuclear power plant, may influence the remaining elements of the energy generating costs as well.
Costs for interim storage of spent UOX-fuel were also reported ranging from 40 to 80 $/kgU,
where an interim storage time of two years is standard. Another source reports a cost for “away-from-reactor” wet storage of LWR fuel assemblies (in 1987$) to be a fixed 50 $/kgHM plus 5×T $/kgHM within a range of plus or minus 50%, where T(years) is the period of storage (NEA, 1989). Spent-fuel transport costs have been reported in many publications to be around 50 $/kgHM (40 to 60 $/kgHM).
Concerning reprocessing, the situation is different because the market is characterized by a
situation with only two main commercial vendors relying on long term contracts with certain utilities. New contracts, making use of existing facilities, seem to indicate significant price reductions, taking benefit from the accumulated experience and reflecting that much of the investment costs have been amortized. In the future, the new plants would benefit greatly from the large experience that has been gained during the last decades, allowing simplifying the plants, decreasing their size, reducing
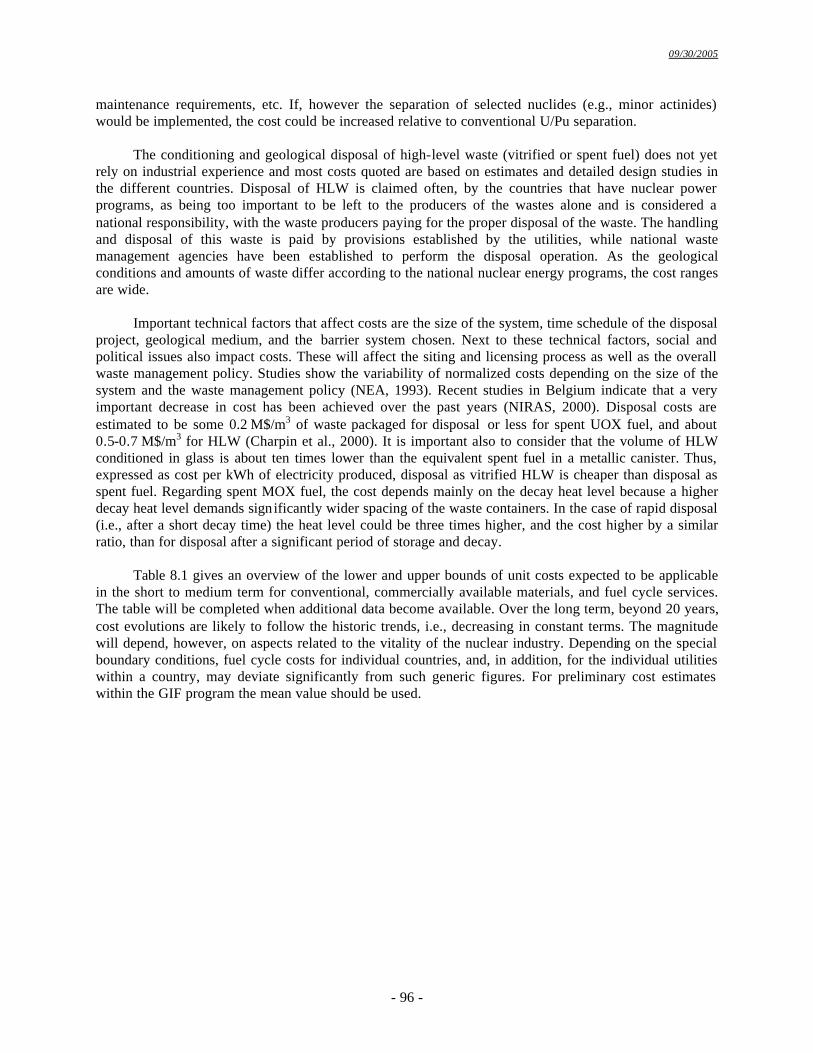
09/30/2005
- 96 -
maintenance requirements, etc. If, however the separation of selected nuclides (e.g., minor actinides) would be implemented, the cost could be increased relative to conventional U/Pu separation.
The conditioning and geological disposal of high-level waste (vitrified or spent fuel) does not yet
rely on industrial experience and most costs quoted are based on estimates and detailed design studies in the different countries. Disposal of HLW is claimed often, by the countries that have nuclear power programs, as being too important to be left to the producers of the wastes alone and is considered a national responsibility, with the waste producers paying for the proper disposal of the waste. The handling and disposal of this waste is paid by provisions established by the utilities, while national waste management agencies have been established to perform the disposal operation. As the geological conditions and amounts of waste differ according to the national nuclear energy programs, the cost ranges are wide.
Important technical factors that affect costs are the size of the system, time schedule of the disposal
project, geological medium, and the barrier system chosen. Next to these technical factors, social and political issues also impact costs. These will affect the siting and licensing process as well as the overall waste management policy. Studies show the variability of normalized costs depending on the size of the system and the waste management policy (NEA, 1993). Recent studies in Belgium indicate that a very important decrease in cost has been achieved over the past years (NIRAS, 2000). Disposal costs are estimated to be some 0.2 M$/m3 of waste packaged for disposal or less for spent UOX fuel, and about 0.5-0.7 M$/m3 for HLW (Charpin et al., 2000). It is important also to consider that the volume of HLW conditioned in glass is about ten times lower than the equivalent spent fuel in a metallic canister. Thus, expressed as cost per kWh of electricity produced, disposal as vitrified HLW is cheaper than disposal as spent fuel. Regarding spent MOX fuel, the cost depends mainly on the decay heat level because a higher decay heat level demands significantly wider spacing of the waste containers. In the case of rapid disposal (i.e., after a short decay time) the heat level could be three times higher, and the cost higher by a similar ratio, than for disposal after a significant period of storage and decay.
Table 8.1 gives an overview of the lower and upper bounds of unit costs expected to be applicable
in the short to medium term for conventional, commercially available materials, and fuel cycle services. The table will be completed when additional data become available. Over the long term, beyond 20 years, cost evolutions are likely to follow the historic trends, i.e., decreasing in constant terms. The magnitude will depend, however, on aspects related to the vitality of the nuclear industry. Depending on the special boundary conditions, fuel cycle costs for individual countries, and, in addition, for the individual utilities within a country, may deviate significantly from such generic figures. For preliminary cost estimates within the GIF program the mean value should be used.
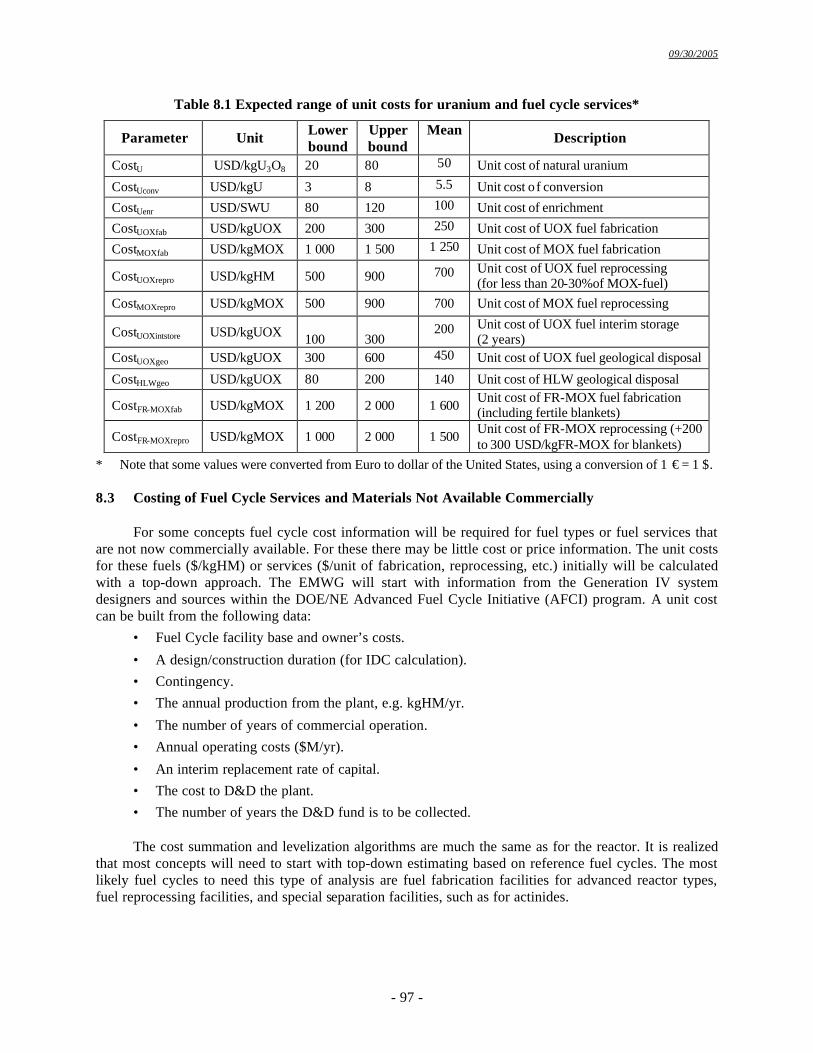
09/30/2005
- 97 -
Table 8.1 Expected range of unit costs for uranium and fuel cycle services*
Parameter Unit Lower bound
Upper bound
Mean Description
CostU USD/kgU3O8 20 80 50 Unit cost of natural uranium
CostUconv USD/kgU 3 8 5.5 Unit cost o f conversion
CostUenr USD/SWU 80 120 100 Unit cost of enrichment
CostUOXfab USD/kgUOX 200 300 250 Unit cost of UOX fuel fabrication
CostMOXfab USD/kgMOX 1 000 1 500 1 250 Unit cost of MOX fuel fabrication
CostUOXrepro USD/kgHM 500 900 700 Unit cost of UOX fuel reprocessing (for less than 20-30%of MOX-fuel)
CostMOXrepro USD/kgMOX 500 900 700 Unit cost of MOX fuel reprocessing
CostUOXintstore USD/kgUOX 100
300
200 Unit cost of UOX fuel interim storage (2 years)
CostUOXgeo USD/kgUOX 300 600 450 Unit cost of UOX fuel geological disposal
CostHLWgeo USD/kgUOX 80 200 140 Unit cost of HLW geological disposal
CostFR-MOXfab USD/kgMOX 1 200 2 000 1 600 Unit cost of FR-MOX fuel fabrication (including fertile blankets)
CostFR-MOXrepro USD/kgMOX 1 000 2 000 1 500 Unit cost of FR-MOX reprocessing (+200 to 300 USD/kgFR-MOX for blankets)
* Note that some values were converted from Euro to dollar of the United States, using a conversion of 1 € = 1 $.
8.3 Costing of Fuel Cycle Services and Materials Not Available Commercially For some concepts fuel cycle cost information will be required for fuel types or fuel services that
are not now commercially available. For these there may be little cost or price information. The unit costs for these fuels ($/kgHM) or services ($/unit of fabrication, reprocessing, etc.) initially will be calculated with a top-down approach. The EMWG will start with information from the Generation IV system designers and sources within the DOE/NE Advanced Fuel Cycle Initiative (AFCI) program. A unit cost can be built from the following data:
• Fuel Cycle facility base and owner’s costs.
• A design/construction duration (for IDC calculation). • Contingency. • The annual production from the plant, e.g. kgHM/yr.
• The number of years of commercial operation. • Annual operating costs ($M/yr).
• An interim replacement rate of capital. • The cost to D&D the plant. • The number of years the D&D fund is to be collected. The cost summation and levelization algorithms are much the same as for the reactor. It is realized
that most concepts will need to start with top-down estimating based on reference fuel cycles. The most likely fuel cycles to need this type of analysis are fuel fabrication facilities for advanced reactor types, fuel reprocessing facilities, and special separation facilities, such as for actinides.
09/30/2005
- 98 -
References Charpin, J.M., Dessus, B. and Pellat, R., 2000, Étude économique prospective de la filière électrique nucléaire, Rapport au Premier Ministre, Paris, France. NEA, 1989, Plutonium Fuel, an Assessment, OECD, Paris, France. NEA, 1993, The Cost of High-Level Waste Disposal in Geological Repositories, An Analysis of Factors Affecting Cost Estimates, OECD, Paris, France. NEA, 1994, The Economics of the Nuclear Fuel Cycle, OECD, Paris, France. NEA, 2002, Trends in the Nuclear Fuel Cycle, OECD, Paris, France. NIRAS/ONDRAF, 2000, ACTUA, No. 36-37, Belgium.
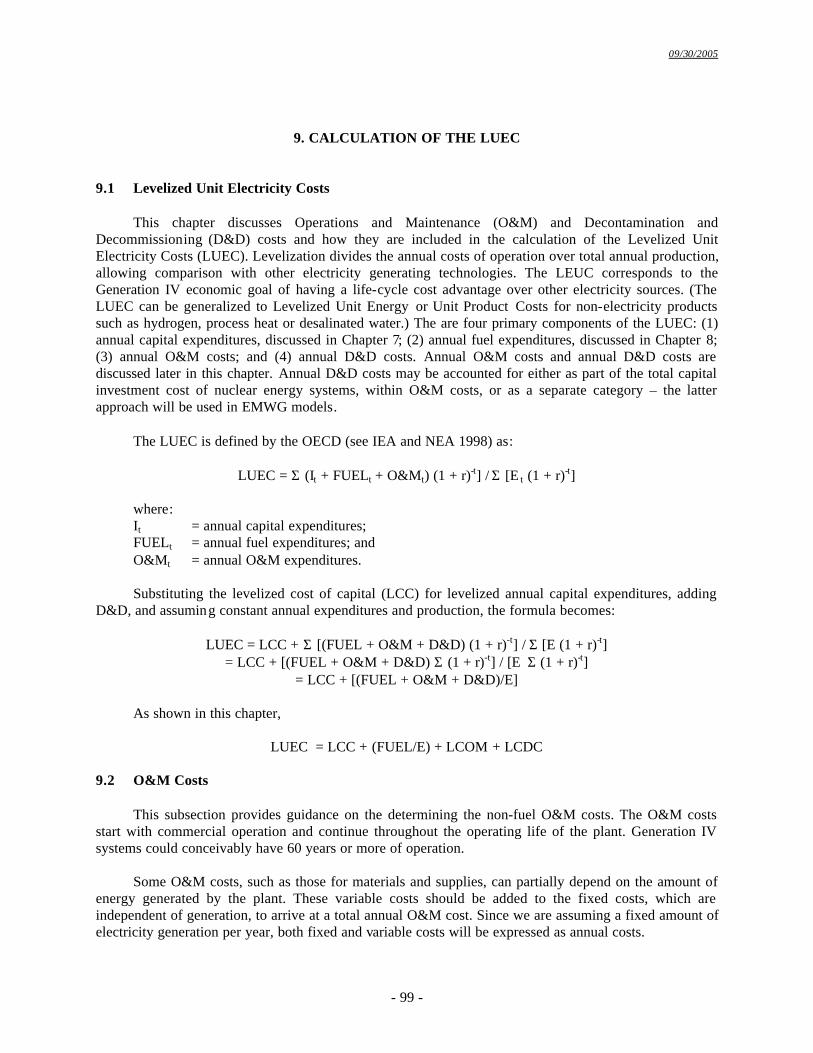
09/30/2005
- 99 -
9. CALCULATION OF THE LUEC
9.1 Levelized Unit Electricity Costs
This chapter discusses Operations and Maintenance (O&M) and Decontamination and Decommissioning (D&D) costs and how they are included in the calculation of the Levelized Unit Electricity Costs (LUEC). Levelization divides the annual costs of operation over total annual production, allowing comparison with other electricity generating technologies. The LEUC corresponds to the Generation IV economic goal of having a life-cycle cost advantage over other electricity sources. (The LUEC can be generalized to Levelized Unit Energy or Unit Product Costs for non-electricity products such as hydrogen, process heat or desalinated water.) The are four primary components of the LUEC: (1) annual capital expenditures, discussed in Chapter 7; (2) annual fuel expenditures, discussed in Chapter 8; (3) annual O&M costs; and (4) annual D&D costs. Annual O&M costs and annual D&D costs are discussed later in this chapter. Annual D&D costs may be accounted for either as part of the total capital investment cost of nuclear energy systems, within O&M costs, or as a separate category – the latter approach will be used in EMWG models.
The LUEC is defined by the OECD (see IEA and NEA 1998) as:
LUEC = Σ (It + FUELt + O&Mt) (1 + r)-t] / Σ [E t (1 + r)-t]
where: It = annual capital expenditures; FUELt = annual fuel expenditures; and O&Mt = annual O&M expenditures. Substituting the levelized cost of capital (LCC) for levelized annual capital expenditures, adding
D&D, and assuming constant annual expenditures and production, the formula becomes:
LUEC = LCC + Σ [(FUEL + O&M + D&D) (1 + r)-t] / Σ [E (1 + r)-t] = LCC + [(FUEL + O&M + D&D) Σ (1 + r)-t] / [E Σ (1 + r)-t]
= LCC + [(FUEL + O&M + D&D)/E]
As shown in this chapter,
LUEC = LCC + (FUEL/E) + LCOM + LCDC 9.2 O&M Costs
This subsection provides guidance on the determining the non-fuel O&M costs. The O&M costs start with commercial operation and continue throughout the operating life of the plant. Generation IV systems could conceivably have 60 years or more of operation.
Some O&M costs, such as those for materials and supplies, can partially depend on the amount of
energy generated by the plant. These variable costs should be added to the fixed costs, which are independent of generation, to arrive at a total annual O&M cost. Since we are assuming a fixed amount of electricity generation per year, both fixed and variable costs will be expressed as annual costs.
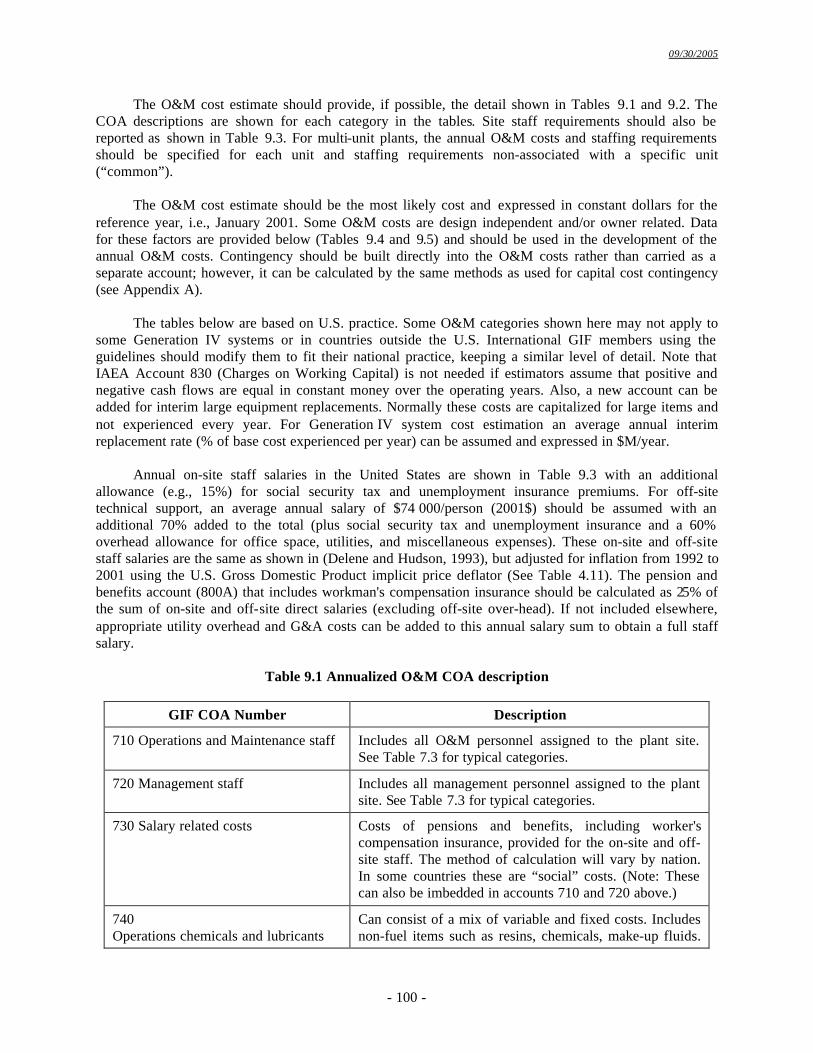
09/30/2005
- 100 -
The O&M cost estimate should provide, if possible, the detail shown in Tables 9.1 and 9.2. The COA descriptions are shown for each category in the tables. Site staff requirements should also be reported as shown in Table 9.3. For multi-unit plants, the annual O&M costs and staffing requirements should be specified for each unit and staffing requirements non-associated with a specific unit (“common”).
The O&M cost estimate should be the most likely cost and expressed in constant dollars for the
reference year, i.e., January 2001. Some O&M costs are design independent and/or owner related. Data for these factors are provided below (Tables 9.4 and 9.5) and should be used in the development of the annual O&M costs. Contingency should be built directly into the O&M costs rather than carried as a separate account; however, it can be calculated by the same methods as used for capital cost contingency (see Appendix A).
The tables below are based on U.S. practice. Some O&M categories shown here may not apply to
some Generation IV systems or in countries outside the U.S. International GIF members using the guidelines should modify them to fit their national practice, keeping a similar level of detail. Note that IAEA Account 830 (Charges on Working Capital) is not needed if estimators assume that positive and negative cash flows are equal in constant money over the operating years. Also, a new account can be added for interim large equipment replacements. Normally these costs are capitalized for large items and not experienced every year. For Generation IV system cost estimation an average annual interim replacement rate (% of base cost experienced per year) can be assumed and expressed in $M/year.
Annual on-site staff salaries in the United States are shown in Table 9.3 with an additional
allowance (e.g., 15%) for social security tax and unemployment insurance premiums. For off-site technical support, an average annual salary of $74 000/person (2001$) should be assumed with an additional 70% added to the total (plus social security tax and unemployment insurance and a 60% overhead allowance for office space, utilities, and miscellaneous expenses). These on-site and off-site staff salaries are the same as shown in (Delene and Hudson, 1993), but adjusted for inflation from 1992 to 2001 using the U.S. Gross Domestic Product implicit price deflator (See Table 4.11). The pension and benefits account (800A) that includes workman's compensation insurance should be calculated as 25% of the sum of on-site and off-site direct salaries (excluding off-site over-head). If not included elsewhere, appropriate utility overhead and G&A costs can be added to this annual salary sum to obtain a full staff salary.
Table 9.1 Annualized O&M COA description
GIF COA Number Description
710 Operations and Maintenance staff Includes all O&M personnel assigned to the plant site. See Table 7.3 for typical categories.
720 Management staff Includes all management personnel assigned to the plant site. See Table 7.3 for typical categories.
730 Salary related costs Costs of pensions and benefits, including worker's compensation insurance, provided for the on-site and off-site staff. The method of calculation will vary by nation. In some countries these are “social” costs. (Note: These can also be imbedded in accounts 710 and 720 above.)
740 Operations chemicals and lubricants
Can consist of a mix of variable and fixed costs. Includes non-fuel items such as resins, chemicals, make-up fluids.
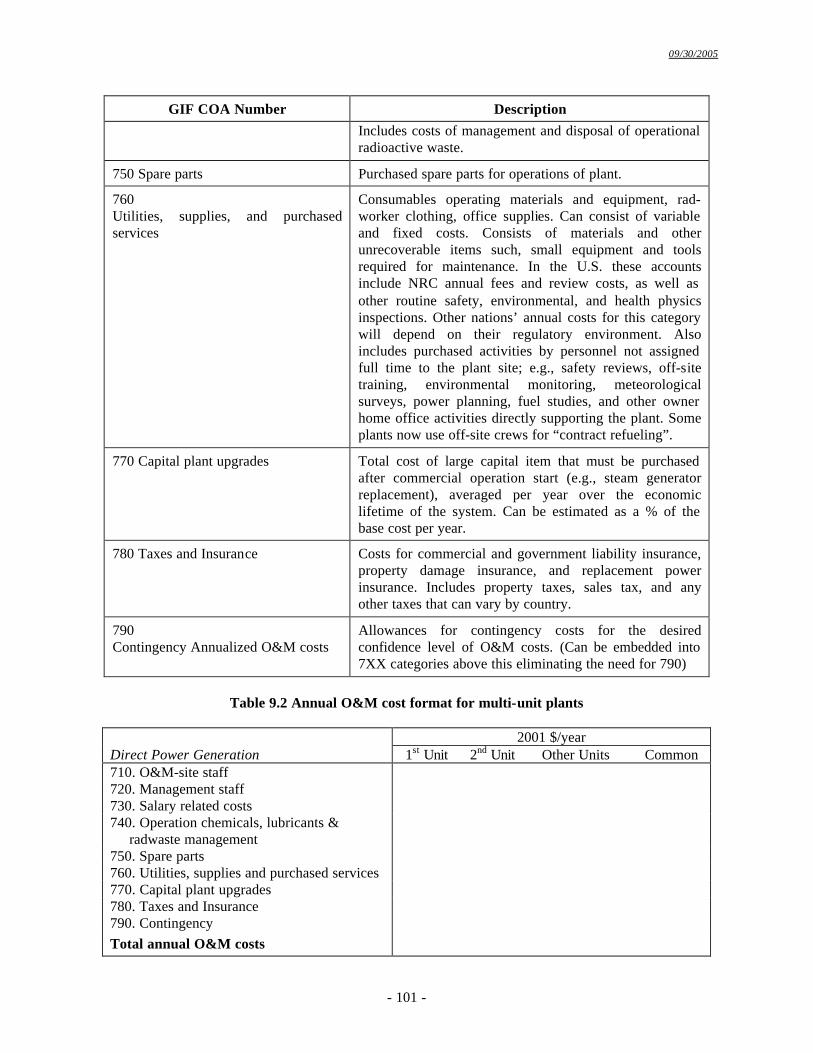
09/30/2005
- 101 -
GIF COA Number Description Includes costs of management and disposal of operational radioactive waste.
750 Spare parts Purchased spare parts for operations of plant.
760 Utilities, supplies, and purchased services
Consumables operating materials and equipment, rad-worker clothing, office supplies. Can consist of variable and fixed costs. Consists of materials and other unrecoverable items such, small equipment and tools required for maintenance. In the U.S. these accounts include NRC annual fees and review costs, as well as other routine safety, environmental, and health physics inspections. Other nations’ annual costs for this category will depend on their regulatory environment. Also includes purchased activities by personnel not assigned full time to the plant site; e.g., safety reviews, off-site training, environmental monitoring, meteorological surveys, power planning, fuel studies, and other owner home office activities directly supporting the plant. Some plants now use off-site crews for “contract refueling”.
770 Capital plant upgrades Total cost of large capital item that must be purchased after commercial operation start (e.g., steam generator replacement), averaged per year over the economic lifetime of the system. Can be estimated as a % of the base cost per year.
780 Taxes and Insurance Costs for commercial and government liability insurance, property damage insurance, and replacement power insurance. Includes property taxes, sales tax, and any other taxes that can vary by country.
790 Contingency Annualized O&M costs
Allowances for contingency costs for the desired confidence level of O&M costs. (Can be embedded into 7XX categories above this eliminating the need for 790)
Table 9.2 Annual O&M cost format for multi-unit plants
2001 $/year
Direct Power Generation 1st Unit 2nd Unit Other Units Common 710. O&M-site staff 720. Management staff 730. Salary related costs 740. Operation chemicals, lubricants & radwaste management
750. Spare parts 760. Utilities, supplies and purchased services 770. Capital plant upgrades 780. Taxes and Insurance 790. Contingency Total annual O&M costs
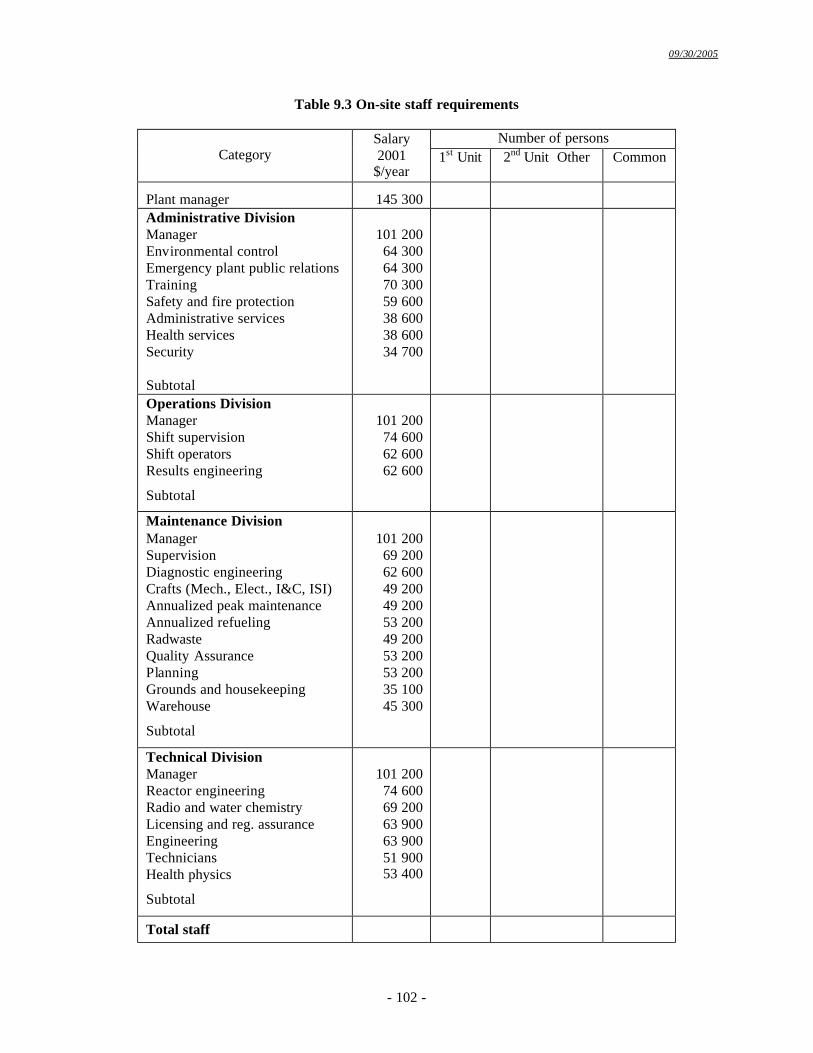
09/30/2005
- 102 -
Table 9.3 On-site staff requirements
Number of persons Category
Salary 2001
$/year 1st Unit 2nd Unit Other Common
Plant manager 145 300
Administrative Division Manager Environmental control Emergency plant public relations Training Safety and fire protection Administrative services Health services Security Subtotal
101 200
64 300 64 300 70 300 59 600 38 600 38 600 34 700
Operations Division Manager Shift supervision Shift operators Results engineering
Subtotal
101 200
74 600 62 600 62 600
Maintenance Division Manager Supervision Diagnostic engineering Crafts (Mech., Elect., I&C, ISI) Annualized peak maintenance Annualized refueling Radwaste Quality Assurance Planning Grounds and housekeeping Warehouse
Subtotal
101 200
69 200 62 600 49 200 49 200 53 200 49 200 53 200 53 200 35 100 45 300
Technical Division Manager Reactor engineering Radio and water chemistry Licensing and reg. assurance Engineering Technicians Health physics
Subtotal
101 200
74 600 69 200 63 900 63 900 51 900 53 400
Total staff
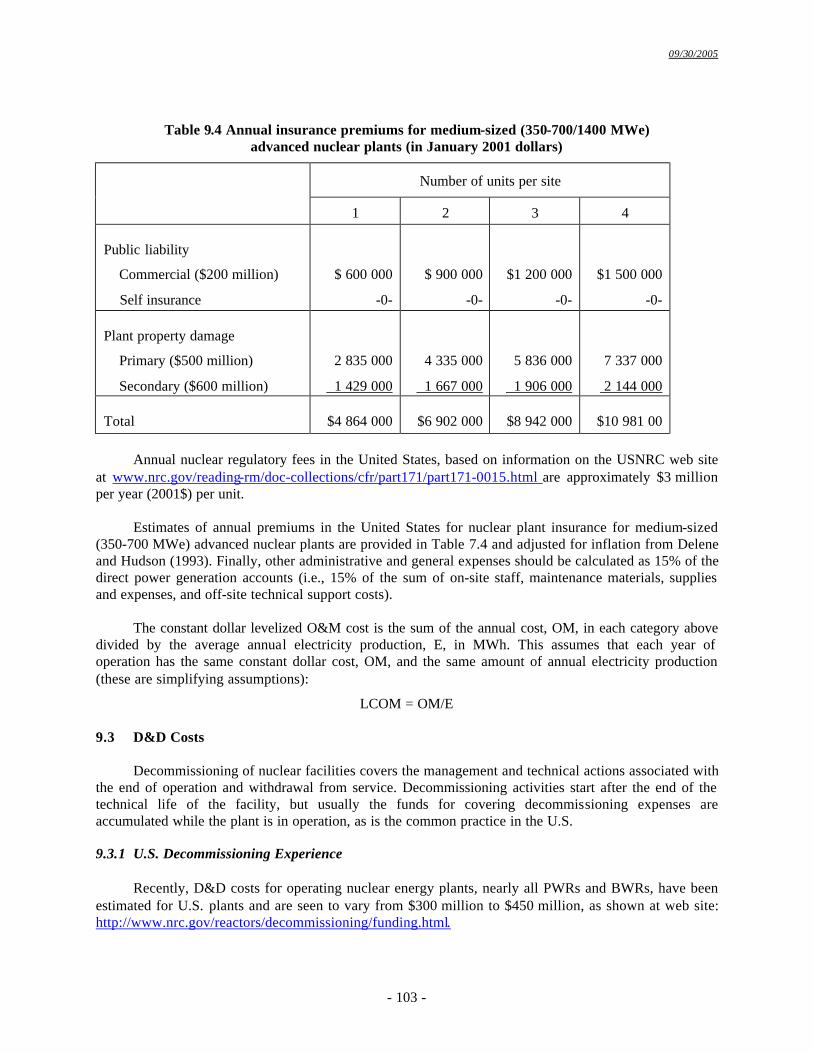
09/30/2005
- 103 -
Table 9.4 Annual insurance premiums for medium-sized (350-700/1400 MWe) advanced nuclear plants (in January 2001 dollars)
Number of units per site
1 2 3 4
Public liability
Commercial ($200 million)
Self insurance
$ 600 000
-0-
$ 900 000
-0-
$1 200 000
-0-
$1 500 000
-0-
Plant property damage
Primary ($500 million)
Secondary ($600 million)
2 835 000
1 429 000
4 335 000
1 667 000
5 836 000
1 906 000
7 337 000
2 144 000
Total
$4 864 000
$6 902 000
$8 942 000
$10 981 00
Annual nuclear regulatory fees in the United States, based on information on the USNRC web site at www.nrc.gov/reading-rm/doc-collections/cfr/part171/part171-0015.html are approximately $3 million per year (2001$) per unit.
Estimates of annual premiums in the United States for nuclear plant insurance for medium-sized
(350-700 MWe) advanced nuclear plants are provided in Table 7.4 and adjusted for inflation from Delene and Hudson (1993). Finally, other administrative and general expenses should be calculated as 15% of the direct power generation accounts (i.e., 15% of the sum of on-site staff, maintenance materials, supplies and expenses, and off-site technical support costs).
The constant dollar levelized O&M cost is the sum of the annual cost, OM, in each category above
divided by the average annual electricity production, E, in MWh. This assumes that each year of operation has the same constant dollar cost, OM, and the same amount of annual electricity production (these are simplifying assumptions):
LCOM = OM/E 9.3 D&D Costs
Decommissioning of nuclear facilities covers the management and technical actions associated with
the end of operation and withdrawal from service. Decommissioning activities start after the end of the technical life of the facility, but usually the funds for covering decommissioning expenses are accumulated while the plant is in operation, as is the common practice in the U.S. 9.3.1 U.S. Decommissioning Experience
Recently, D&D costs for operating nuclear energy plants, nearly all PWRs and BWRs, have been
estimated for U.S. plants and are seen to vary from $300 million to $450 million, as shown at web site: http://www.nrc.gov/reactors/decommissioning/funding.html.
09/30/2005
- 104 -
It is recommended that a typical value of $350 million US$ of 2001, be used as the radiological decommissioning cost of a single unit of a water reactor at a nuclear energy plant. This does not include dismantling costs or the costs of restoring the site to unrestricted use. In addition, a default minimum cost, that is a function of unit size, has also been defined. The default values are based on the USNRC minimum prescribed decommissioning costs developed by PNL (to release the site from NRC regulation). Separate minimum costs as a function of unit thermal output were prescribed for PWRs and BWRs. For this edition of the guidelines, the previous relations were increased by the rate of inflation since 1992. The minimum cost equations are given below.
PWR: Cost (million $) = 173 + 0.024 (P-1200) BWR: Cost (million $) = 220 + 0.024 (P-1200) Other: Cost (million $) = 197 + 0.024 (P-1200)
where P = unit (block) thermal power MWth. Costs are constant at the 1200 MWth and 3400 MWth values for power levels below 1200 MWth and above 3400 MWth. These costs are assumed to increase at the rate of inflation.
For reactor types other than BWRs or PWRs an average value should be used, based on design team’s estimates. In absence of detailed estimates, estimators can use a “rule of thumb” that the total constant dollar decommissioning cost is 33% of the total direct capital cost. Contingency should be built directly into the D&D costs rather than carried as a separate account; however, it can be calculated by the same methods as used for capital cost contingency (see Appendix A).
Normally in the United States it is assumed that an external sinking fund consisting of high-grade
tax-free bonds is established to accumulate the funds necessary for decommissioning. For Generation IV cost estimation, 5% and 10% real (not including inflation) discount rates will be assumed for a D&D sinking fund. For consistency of the analysis, it is assumed that the D&D fund will be accumulated over the plant’s economic life. The constant dollar sinking fund formula can be used to calculate the required annual constant dollar payment:
LDDP = CDD x SFF(Xreal, Lecon),
where: LDDP = the annual constant dollar payment made to the D&D sinking fund; CDD = estimated decommissioning cost in reference year constant dollars; Lecon. = life of the plant assumed for fund accumulation; Xreal = the real discount rate; and SFF(r, t) = sinking fund factor at rate r for t years, that is SFF(r, t) = r/[(1+r)t - 1]. Following the treatment used for O&M costs, the levelized D&D cost can be expressed as:
LCDC = LDDP/E 9.3.2 International Decommissioning Experience
In most countries, the regulator requires operators/owners of nuclear facilities to accumulate a
decommissioning fund on the basis of decommissioning cost estimates that are audited by regulators and/or the government. Therefore, decommissioning costs have been published and analyzed in many national and international studies. The data available on decommissioning costs include: feedback from experience on completed decommissioning projects; ongoing projects; model calculations; and scaling of real costs taking into account reactor size, site, and type.
09/30/2005
- 105 -
There are large differences in the national policies and industrial strategies adopted in decommissioning projects or assumed for cost estimation. The resulting variability of decommissioning costs has been recognized in all international studies. However, the analyses identify cost drivers and provided reasonable formulas to estimate decommissioning costs for planning and funding purpose.
The last NEA study on decommissioning policies, strategies, and costs (NEA, 2003) showed that
decommissioning cost estimates reported remain below $500/kWe for nearly all water reactors covered in the analysis and, in average, decommissioning cost was estimated at about $350/kWe. This result is consistent with the Guideline’s assumptions.
The study showed also that labor costs generally represent a significant share of total
decommissioning costs, ranging from 20 to 40%. Two cost elements were found to represent a major share of total costs: dismantling and waste treatment/disposal, accounting for around 30% each. Three other cost elements were found to each represent another 10% of the total: (1) security, survey, and maintenance; (2) site cleanup and landscaping; and (3) project management, engineering, and site support. Other cost items were found not to exceed 5% of the total cost.
For Generation IV systems, D&D costs will likely vary depending on the reactor type and size. At
the first stage of model development (top-down estimating) within EMWG, a generic assumption seems to be the best way to estimate undiscounted decommissioning costs. Once the Generation IV system designs become more precise, a bottom-up approach will be adopted to estimate D&D costs more precisely. At that stage, the standardized list of cost items proposed by international organizations (EC, IAEA, and NEA., 1999) could be a useful framework. References EC, IAEA and NEA, 1999, A Proposed Standardised List of Items for Costing Purposes, OECD, Paris. IEA and NEA, 1998, Projected Costs of Generating Electricity: Update 1998, OECD. IAEA, 2000, Economic Evaluation of Bids for Nuclear Power Plants 1999 Edition, Technical Reports Series No. 396, IAEA, Vienna, Austria. NEA, 2003, Decommissioning Nuclear Power Plants: Policies, Strategies and Costs, OECD.

09/30/2005
- 106 -
10. CALCULATION OF UNIT COSTS FOR NON-ELECTRICITY END PRODUCTS

09/30/2005
- 107 -

09/30/2005
- 108 -
11. COST ESTIMATES FOR FACTORY-PRODUCED REACTOR MODULES

09/30/2005
- 109 -
09/30/2005
- 110 -
ABBREVIATIONS, ACRONYMS, & EQUATION SYMBOLS
AACE American Association of Cost Engineers A/E Architect/Engineering firm AECL Atomic Energy Limited of Canada AFI Allowance for indeterminates (type of contingency) AFUDC Allowance for Funds Used During Construction AFCI Advanced Fuel Cycle Initiative (DOE-NE program) ALMR Advanced liquid metal reactor ALWR Advanced light water reactor (III+) BCC Base construction cost BOP Balance of plant BSDD Building and structure design description BWR Boiling water reactor CADD Computer aided design and drafting CEA Comissariat à l’énergie atomique (French Atomic Energy Agency) CER Cost-estimating relationship CF Capacity factor CM Construction manager CS Carbon steel (refers to type of pipe) COA Code-of-account(s) CONT Contingency on base + owner’s costs D&D Decontamination and decommissioning DOE Department of energy EEDB Energy economic data base EDF Électricité de France (French utility) EIS Environmental Impact Statement EMWG Economic modeling working group EPC Engineering, procurement and construction EPRI Electric Power Research Institute EQM Equipment manufacturer ER Environmental report FBR Fast breeder reactor FC Fuel Cycle FCR Fixed charge rate FOAK First-of-a-kind GA General Atomics G&A General and administrative (costs) GDP Gross domestic product GIF Generation IV International Forum GFR Gas-cooled fast reactor GW Gigawatt GWe Gigawatt electric HEU Highly enriched uranium HM Heavy metal HTR High-temperature reactor HTGR High temperature gas-cooled reactor HVAC Heating, ventilation and air conditioning
09/30/2005
- 111 -
IAEA International Atomic Energy Agency IEA International Energy Agency I&C Instrumentation and control IDC Interest during construction IFR Integral fast reactor INEEM Integrated nuclear energy economic model LFR Lead-cooled fast reactor LCC Life cycle cost LCIC Levelized cost of capital component of LUEC LCOM Levelized O&M component of LUEC LCFC Levelized fuel cycle component of LUEC LCDC Levelized D&D component of LUEC LEU Low-enriched uranium LFR Lead-cooled fast reactor LMR Liquid metal reactor LTA Lead test assembly LUEC Levelized Unit of Electricity Cost LUFC Levelized Unit Fuel Cost LUPC Levelized Unit Product Cost (Hydrogen, etc) LURC Levelized Unit Reprocessing Cost MHTGR Modular high-temperature gas-cooled reactor MOX Mixed oxide fuel MSR Molten salt reactor MTBF Mean time between failures MTTR Mean time to repair MW Megawatt MWe Megawatt electric MWh Megawatt hour MWth Megawatt thermal NATU Natural uranium NEA Nuclear Energy Agency NECDB Nuclear energy cost data base NEP Nuclear energy plant NI Nuclear Island facilities NNSA National Nuclear Security Administration (USA) NOAK Nth of a kind NSSS Nuclear steam supply system OC Overnight cost OECD Organization for Economic Co-operation and Development O&M Operation and maintenance ORNL Oak Ridge National Laboratory PBMR Pebble bed modular reactor P&IDs Piping & Instrumentation Diagrams PM/CM Project Management/Construction Management PNL Pacific Northwest National Laboratory POAK Prototype-of-a-kind PRA Probabilistic risk assessment PWR Pressurized water reactor Pu Plutonium Q/A Quality assurance Q/C Quality control
09/30/2005
- 112 -
r Real cost of money RCV Reactor cooling-related vessels R&D Research and development RD&D Research, development, and demonstration RM Reactor manufacturer/vendor RPV Reactor pressure vessel SAP Safety Assessment Principles for Nuclear Plants (U.K.) SAR Safety analysis report SCWR Supercritical-water-cooled reactor SDD System Design Description SEMER Système d’évaluation et de modélisation économique des réacteurs SFF Sinking fund factor SFR Sodium-cooled fast reactor SS Stainless steel (pipe type) SWU Separative work unit TCIC Total capital investment cost TOC Total overnight cost T/G Turbine/Generator T-H Thermal hydraulic U Uranium UOX Uranium oxide fuel USDOD U.S. Department of Defense USDOE U.S. Department of Energy USNRC U.S. Nuclear Regulatory Commission VHTR Very-high-temperature reactor WBS Work Breakdown Structure
09/30/2005
- 113 -
APPENDIX A. CONTINGENCY IN NUCLEAR ENERGY SYSTEM COST ESTIMATION
During the life of a nuclear energy system project, major cost estimates must be performed during each stage: (1) the initial R&D effort, (2) concept development, (3) concept confirmation, (4) preliminary design, (5) detail design, (6) construction, and (7) commercial operation. The project scope definition and the estimated cost basis improve with project specific detail. Progressively, the improvements in the pricing basis of the estimate reduce the risks and the associated contingency rates that are required to meet a desired confidence level.
The basis for establishing contingency rates to meet desired confidence levels should be
consistent for each estimate through the life of the project. Each risk assessment should be based on the degree of confidence inherent in the components of the estimate. Initially, the pricing basis might include allowances that carry a high risk of cost overrun, but as the definition improves and more effort is made to improve the pricing basis with actual quotations, the precision of the estimated cost improves and lower contingency rates can meet the specified level of confidence.
The following are guidelines for contingency cost assessments at various stages of the project.
1. R&D concept development estimate or conceptual screening: Initial cost estimates developed during the R&D phase of a nuclear energy system typically have limited design information and most effort is concentrated on defining the unique features of the reactor concept, fuel configuration, and the main heat cycle. The majority of the costs will be based on reference plant data with only the unique scope estimated with current price data. A simple model of project costs identifying the major cost drivers is sufficient, but the associated contingency rates could be as high as ± 50%, see Table A.1. (For examples of R&D concept development estimates, see A Technology Roadmap for Generation IV Nuclear Energy Systems, December 2002.)
2. Conceptual, feasibility, or simplified estimate: With technology development, the project scope and costs becomes more defined. Lower contingency rates, e.g., ± 30%, yield the same confidence levels or probabilities of cost overrun.
3. Preliminary, detailed, or finalized estimate, or forecast: Improvements in specifying the project scope and pricing basis reduce the overall project contingency rate. Typically at these stages of project definition, it is desirable to perform a more thorough risk assessment using simulation software, such as @RISK. The assessment is performed by constructing a detailed model of project costs, establishing functional relationships between costs and underlying uncertainties, and specifying a probability distribution for each uncertainty. The simulation software assigns random values to each uncertain variable and calculates the resultant project costs. With thousands of simulated costs, the probability of cost overrun can be calculated. Selecting the desired confidence level, or probability of cost overrun, provides a corresponding contingency level. (This same methodology can be used with the initial concept development estimates by constructing simple project cost models with a limited number of uncertain variables.) The process of assigning probability ranges to variables provides a means of identifying cost risks. In some cases, the extremely high and low values can be calculated for variables such as the composite labor cost as a function of overtime premiums or the percentage of apprentice labor.
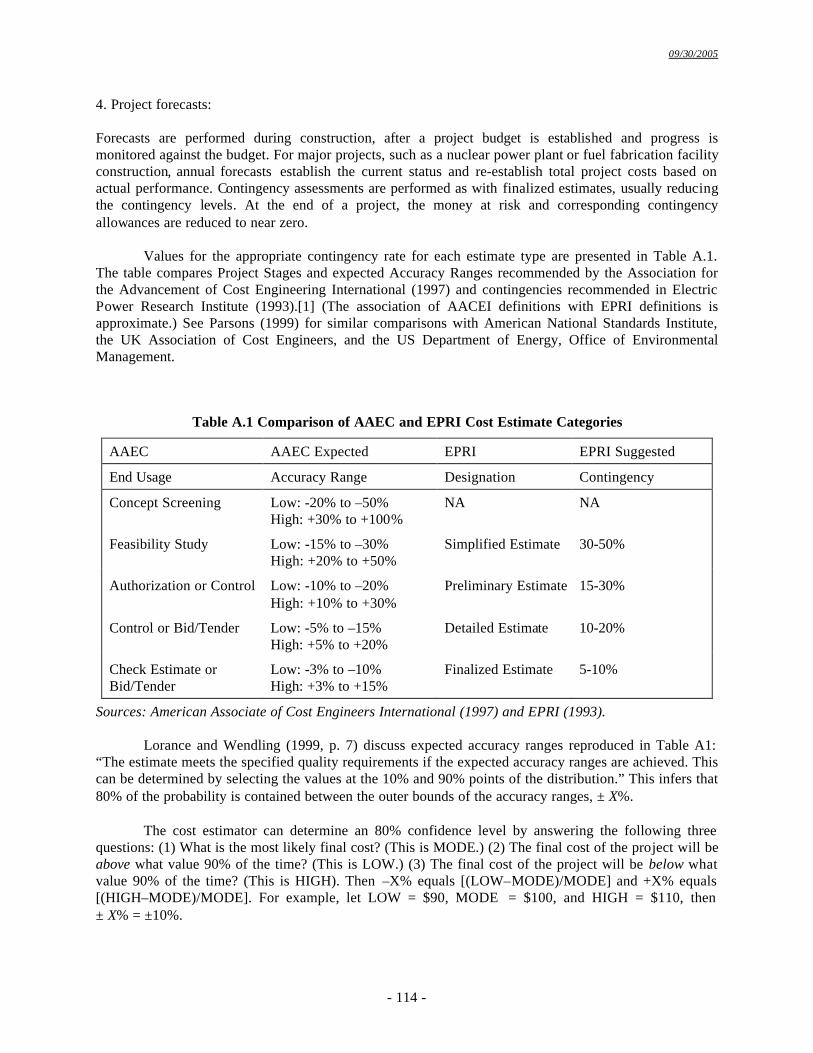
09/30/2005
- 114 -
4. Project forecasts:
Forecasts are performed during construction, after a project budget is established and progress is monitored against the budget. For major projects, such as a nuclear power plant or fuel fabrication facility construction, annual forecasts establish the current status and re-establish total project costs based on actual performance. Contingency assessments are performed as with finalized estimates, usually reducing the contingency levels. At the end of a project, the money at risk and corresponding contingency allowances are reduced to near zero.
Values for the appropriate contingency rate for each estimate type are presented in Table A.1. The table compares Project Stages and expected Accuracy Ranges recommended by the Association for the Advancement of Cost Engineering International (1997) and contingencies recommended in Electric Power Research Institute (1993).[1] (The association of AACEI definitions with EPRI definitions is approximate.) See Parsons (1999) for similar comparisons with American National Standards Institute, the UK Association of Cost Engineers, and the US Department of Energy, Office of Environmental Management.
Table A.1 Comparison of AAEC and EPRI Cost Estimate Categories
AAEC AAEC Expected EPRI EPRI Suggested
End Usage Accuracy Range Designation Contingency
Concept Screening Low: -20% to –50% High: +30% to +100%
NA NA
Feasibility Study Low: -15% to –30% High: +20% to +50%
Simplified Estimate 30-50%
Authorization or Control Low: -10% to –20% High: +10% to +30%
Preliminary Estimate 15-30%
Control or Bid/Tender Low: -5% to –15% High: +5% to +20%
Detailed Estimate 10-20%
Check Estimate or Bid/Tender
Low: -3% to –10% High: +3% to +15%
Finalized Estimate 5-10%
Sources: American Associate of Cost Engineers International (1997) and EPRI (1993).
Lorance and Wendling (1999, p. 7) discuss expected accuracy ranges reproduced in Table A1: “The estimate meets the specified quality requirements if the expected accuracy ranges are achieved. This can be determined by selecting the values at the 10% and 90% points of the distribution.” This infers that 80% of the probability is contained between the outer bounds of the accuracy ranges, ± X%.
The cost estimator can determine an 80% confidence level by answering the following three questions: (1) What is the most likely final cost? (This is MODE.) (2) The final cost of the project will be above what value 90% of the time? (This is LOW.) (3) The final cost of the project will be below what value 90% of the time? (This is HIGH). Then –X% equals [(LOW–MODE)/MODE] and +X% equals [(HIGH–MODE)/MODE]. For example, let LOW = $90, MODE = $100, and HIGH = $110, then ± X% = ±10%.
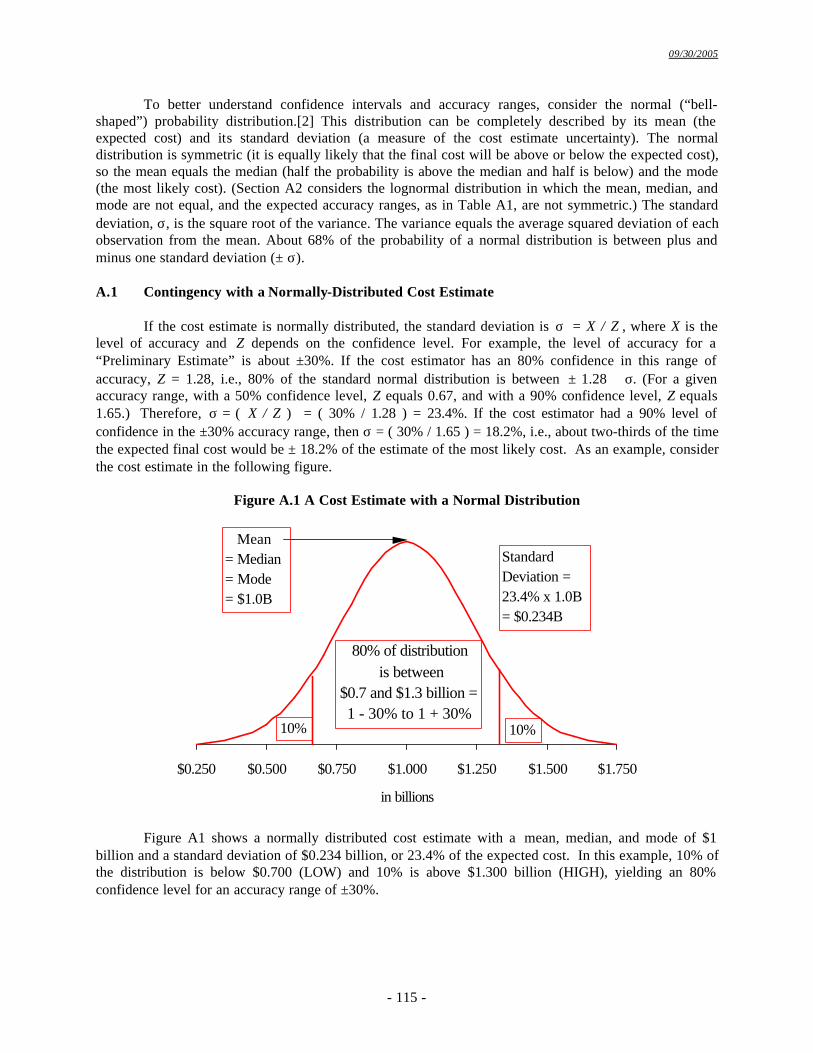
09/30/2005
- 115 -
To better understand confidence intervals and accuracy ranges, consider the normal (“bell-shaped”) probability distribution.[2] This distribution can be completely described by its mean (the expected cost) and its standard deviation (a measure of the cost estimate uncertainty). The normal distribution is symmetric (it is equally likely that the final cost will be above or below the expected cost), so the mean equals the median (half the probability is above the median and half is below) and the mode (the most likely cost). (Section A2 considers the lognormal distribution in which the mean, median, and mode are not equal, and the expected accuracy ranges, as in Table A1, are not symmetric.) The standard deviation, σ, is the square root of the variance. The variance equals the average squared deviation of each observation from the mean. About 68% of the probability of a normal distribution is between plus and minus one standard deviation (± σ). A.1 Contingency with a Normally-Distributed Cost Estimate
If the cost estimate is normally distributed, the standard deviation is σ = X / Z , where X is the level of accuracy and Z depends on the confidence level. For example, the level of accuracy for a “Preliminary Estimate” is about ±30%. If the cost estimator has an 80% confidence in this range of accuracy, Z = 1.28, i.e., 80% of the standard normal distribution is between ± 1.28 ⋅ σ. (For a given accuracy range, with a 50% confidence level, Z equals 0.67, and with a 90% confidence level, Z equals 1.65.) Therefore, σ = ( X / Z ) = ( 30% / 1.28 ) = 23.4%. If the cost estimator had a 90% level of confidence in the ±30% accuracy range, then σ = ( 30% / 1.65 ) = 18.2%, i.e., about two-thirds of the time the expected final cost would be ± 18.2% of the estimate of the most likely cost. As an example, consider the cost estimate in the following figure.
Figure A.1 A Cost Estimate with a Normal Distribution
Figure A1 shows a normally distributed cost estimate with a mean, median, and mode of $1 billion and a standard deviation of $0.234 billion, or 23.4% of the expected cost. In this example, 10% of the distribution is below $0.700 (LOW) and 10% is above $1.300 billion (HIGH), yielding an 80% confidence level for an accuracy range of ±30%.
$0.250 $0.500 $0.750 $1.000 $1.250 $1.500 $1.750
in billions
Mean = Median = Mode = $1.0B
80% of distribution is between
$0.7 and $1.3 billion =1 - 30% to 1 + 30%
10% 10%
Standard Deviation =23.4% x 1.0B = $0.234B
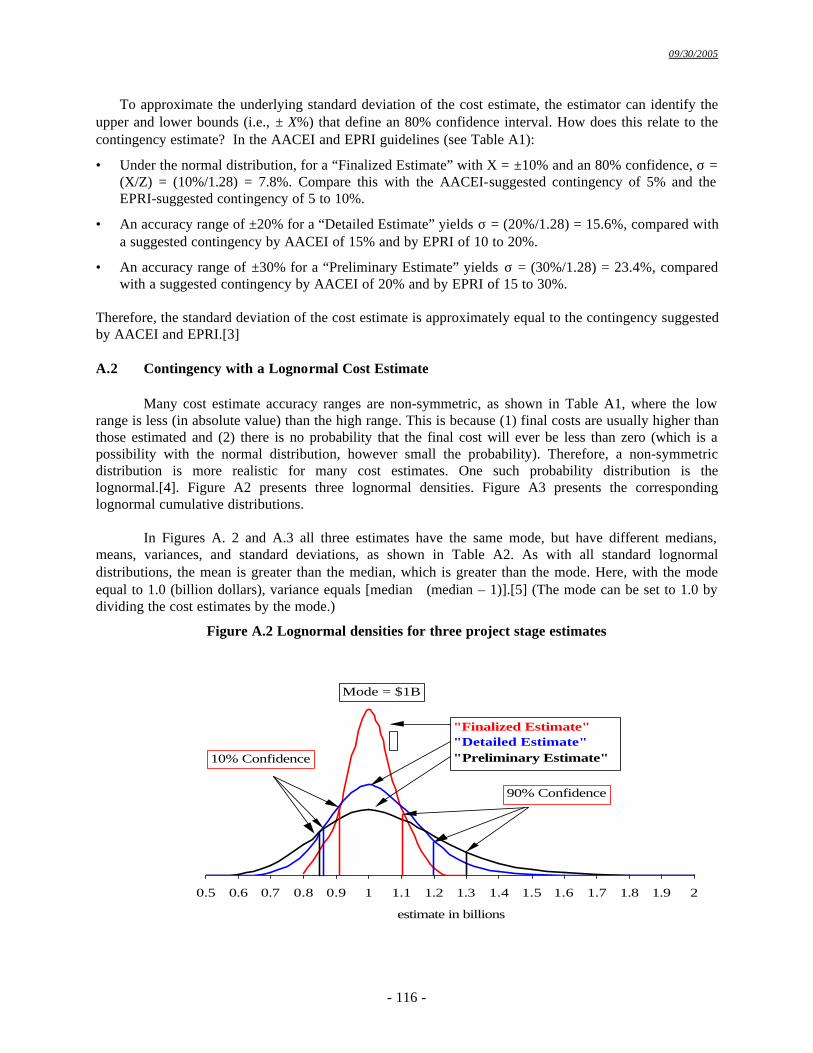
09/30/2005
- 116 -
To approximate the underlying standard deviation of the cost estimate, the estimator can identify the upper and lower bounds (i.e., ± X%) that define an 80% confidence interval. How does this relate to the contingency estimate? In the AACEI and EPRI guidelines (see Table A1):
• Under the normal distribution, for a “Finalized Estimate” with X = ±10% and an 80% confidence, σ = (X/Z) = (10%/1.28) = 7.8%. Compare this with the AACEI-suggested contingency of 5% and the EPRI-suggested contingency of 5 to 10%.
• An accuracy range of ±20% for a “Detailed Estimate” yields σ = (20%/1.28) = 15.6%, compared with a suggested contingency by AACEI of 15% and by EPRI of 10 to 20%.
• An accuracy range of ±30% for a “Preliminary Estimate” yields σ = (30%/1.28) = 23.4%, compared with a suggested contingency by AACEI of 20% and by EPRI of 15 to 30%.
Therefore, the standard deviation of the cost estimate is approximately equal to the contingency suggested by AACEI and EPRI.[3] A.2 Contingency with a Lognormal Cost Estimate
Many cost estimate accuracy ranges are non-symmetric, as shown in Table A1, where the low range is less (in absolute value) than the high range. This is because (1) final costs are usually higher than those estimated and (2) there is no probability that the final cost will ever be less than zero (which is a possibility with the normal distribution, however small the probability). Therefore, a non-symmetric distribution is more realistic for many cost estimates. One such probability distribution is the lognormal.[4]. Figure A2 presents three lognormal densities. Figure A3 presents the corresponding lognormal cumulative distributions.
In Figures A. 2 and A.3 all three estimates have the same mode, but have different medians,
means, variances, and standard deviations, as shown in Table A2. As with all standard lognormal distributions, the mean is greater than the median, which is greater than the mode. Here, with the mode equal to 1.0 (billion dollars), variance equals [median ⋅ (median – 1)].[5] (The mode can be set to 1.0 by dividing the cost estimates by the mode.)
Figure A.2 Lognormal densities for three project stage estimates
0.5 0.6 0.7 0.8 0.9 1 1.1 1.2 1.3 1.4 1.5 1.6 1.7 1.8 1.9 2
estimate in billions
Mode = $1B
90% Confidence
10% Confidence
"Finalized Estimate" "Detailed Estimate" "Preliminary Estimate"
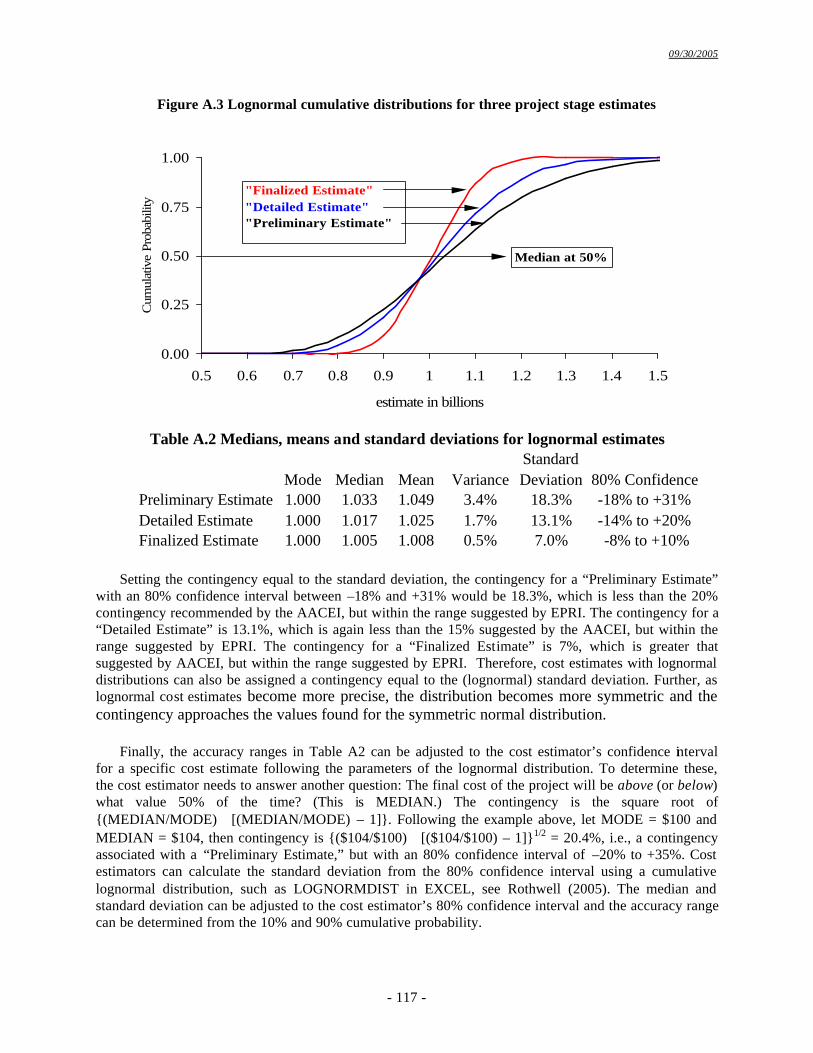
09/30/2005
- 117 -
Figure A.3 Lognormal cumulative distributions for three project stage estimates
Table A.2 Medians, means and standard deviations for lognormal estimates Standard
Mode Median Mean Variance Deviation 80% ConfidencePreliminary Estimate 1.000 1.033 1.049 3.4% 18.3% -18% to +31%Detailed Estimate 1.000 1.017 1.025 1.7% 13.1% -14% to +20%Finalized Estimate 1.000 1.005 1.008 0.5% 7.0% -8% to +10%
Setting the contingency equal to the standard deviation, the contingency for a “Preliminary Estimate”
with an 80% confidence interval between –18% and +31% would be 18.3%, which is less than the 20% contingency recommended by the AACEI, but within the range suggested by EPRI. The contingency for a “Detailed Estimate” is 13.1%, which is again less than the 15% suggested by the AACEI, but within the range suggested by EPRI. The contingency for a “Finalized Estimate” is 7%, which is greater that suggested by AACEI, but within the range suggested by EPRI. Therefore, cost estimates with lognormal distributions can also be assigned a contingency equal to the (lognormal) standard deviation. Further, as lognormal cost estimates become more precise, the distribution becomes more symmetric and the contingency approaches the values found for the symmetric normal distribution.
Finally, the accuracy ranges in Table A2 can be adjusted to the cost estimator’s confidence interval for a specific cost estimate following the parameters of the lognormal distribution. To determine these, the cost estimator needs to answer another question: The final cost of the project will be above (or below) what value 50% of the time? (This is MEDIAN.) The contingency is the square root of {(MEDIAN/MODE) ⋅ [(MEDIAN/MODE) – 1]}. Following the example above, let MODE = $100 and MEDIAN = $104, then contingency is {($104/$100) ⋅ [($104/$100) – 1]}1/2 = 20.4%, i.e., a contingency associated with a “Preliminary Estimate,” but with an 80% confidence interval of –20% to +35%. Cost estimators can calculate the standard deviation from the 80% confidence interval using a cumulative lognormal distribution, such as LOGNORMDIST in EXCEL, see Rothwell (2005). The median and standard deviation can be adjusted to the cost estimator’s 80% confidence interval and the accuracy range can be determined from the 10% and 90% cumulative probability.
0.00
0.25
0.50
0.75
1.00
0.5 0.6 0.7 0.8 0.9 1 1.1 1.2 1.3 1.4 1.5
estimate in billions
Cum
ulat
ive
Prob
abili
ty
"Finalized Estimate""Detailed Estimate""Preliminary Estimate"
Median at 50%
09/30/2005
- 118 -
A.3 Contingency in Levelized Capital Cost Estimation
This section proposes a method for determining the contingency associated with the estimation of the levelized capital cost (LCC):
LCC = [ CRF(r, T) · (BCC + IDC + contingencies) ] / Σ [ E (1 + r ) –t] (A1) where CRF is the Capital Recovery Factor, equal to { r (1 + r)T / [ (1 + r)T – 1] }; BCC is the base
construction cost; IDC is Interest During Construction; and E is the output per period (discounted to the present). Also, overnight cost (OC) is equal to BCC plus the contingency associated with the BCC estimate, as discussed in Sections A1 and A2. The Total Capital Investment Cost (TCIC) is BCC plus IDC plus all associated contingencies. This section provides a method of calculating a contingency associated with levelized capital costs based on the standard deviations of its underlying uncertainties. The contingency associated with BCC (σC) was discussed above. Therefore, we discuss the contingency associated with IDC and E. A.3.1 Estimating Interest During Construction Contingency
Interest During Construction (IDC) is the cost of financing overnight cost (equal to BCC plus contingency) during the construction period. Abstracting from regulatory accounting, IDC is simply the difference between the value of construction expenditures at the start of the project and the value of these expenditures at the end of the project. It arises from the convention of calculating the value of the project at the time of construction completion. In fact, if all costs and revenues throughout the project’s life were discounted to the beginning of construction, IDC would be zero.
To estimate IDC, consider capital expenditures discounted to the beginning of commercial
operation (i.e., when revenues from the project begin): 1 IDC = Σ CXt [ (1 + r) –t – 1 ] (A2) t = – LT
where LT is the lead time (construction duration in months) of the project; CXt are construction expenditures in month t; and r is the monthly cost of capital. (This formula assumes discounting from the beginning of each period. If the period were one year, this would lead to an overestimate if there are financing charges from the time of the expenditure. To correct for this, some formulas assume expenditure at mid-period. However, the overestimate of IDC approaches zero as the length of the period approaches zero, e.g., with monthly accounting the overestimate is small.)
Equation (A2) is a straightforward calculation if the construction expenditure distribution CXt (t = –LT, –LT +1, … , 1) and LT are known. However, at the beginning of the project both of these are uncertain. To focus on lead time uncertainty, assume that the CXt have a uniform distribution, such that CXt = OC / LT, where OC is overnight construction cost (base construction cost plus contingency) in real currency, i.e., abstracting from escalation during construction. Equation (A2) becomes (with the translation of subscripts): lt idc = Σ (OC / lt ) [ (1 + r) t – 1 ] , (A3a) t = 1 lt = (OC / lt ) { [ Σ (1 + r) t ] – lt }, (A3b) t = 1
09/30/2005
- 119 -
where idc is uncertain IDC and lt is uncertain lead time (with a mean of LT and a standard deviation of σLT). What is the standard deviation of idc? We can simplify Equation (A3b) by considering the series as a uniform, present worth factor: lt Σ (1 + r) t = [ (1 + r) lt – 1 ] / r (A4) t = 1 Further, this exponential expression can be approximated with a second-order expansion: (1 + r) lt ≈ 1 + lt ⋅ r + lt ( lt – 1 ) ( r 2 / 2 ) + … , (A5) which can be substituted into Equation (A4) and simplified as lt Σ (1 + r) t ≈ lt + lt ( lt – 1 ) ( r / 2 ) . (A6)
t = 1
Substituting this into Equation (A3b) and simplifying:
idc ≅ OC ( lt – 1 ) ( r / 2 ) ≅ lt ⋅ OC ⋅ ( r / 2 ) , (A7)
The mean of idc is LT ⋅ OC ⋅ (r/2) and the standard deviation is σLT ⋅ OC ⋅ (r/2) (where LT is the mean lead time and σLT is the standard deviation of the lead time). The standard deviation of the IDC rate (%) is σLT ⋅ ( r/2 ).
For example, with overnight costs of $1160 million (M), a construction lead time of 48 months, a real discount rate of 0.833%/month (=10% per year), IDC equals $232M. If the standard deviation of LT were 12 months, the standard deviation of IDC would be $58M and the standard deviation of the IDC rate would be 5%. The Total Capital Investment Cost (TCIC = OC + IDC + contingencies) would be $1160M + $232M + $58M = $1450M. As the construction cost and schedule estimates become more precise, the standard deviation of the cost and lead time estimates should decrease, leading to a reduction in the associated contingencies.
Following the methodology in Section A1, contingency on IDC can be represented as σLT ⋅ OC ⋅
(r/2), where the standard deviation of lead time can be determined by specifying an accuracy (± X%) with an 80% confidence interval for the estimate of lead time. This accuracy may be greater than or less than the accuracy of the base construction cost estimate. It should correspond to the level of detail of the construction schedule estimate. (This assumes that σC and σLT are not correlated.)
A 3. 2 Estimating Capacity Factor Contingency
Next, E is annual output (e.g., in megawatt-hours), can be defined as E = CF ⋅ MAX ⋅ Y , (A8) where (1) the capacity factor, CF, is the percent of maximum output generated in a year, (2) MAX is the plant’s annual net maximum dependable output, and (3) Y is the total hours in a year. (MAX and Y are constants.) For example, a power plant with a net maximum dependable capacity of 1350 MW (equivalent to a gross capacity of 1400 MW) operating at a 90% capacity factor for 8,760 hours per year generates about 10,600,000 MWh for sale per year. The CF can be decomposed to facilitate an analysis of its uncertainty:
09/30/2005
- 120 -
CF = [ E /(MAX ⋅ H )] ⋅ (H / Y) = CU ⋅ SF , (A9)
where H is the total generating hours per a year. The first term, [E / (MAX ⋅ H )], is the capacity utilization rate, CU, a measure of how close the plant is to potential output when it is running. The second term, (H / Y), is the service factor, SF, the percentage of the time the plant is running. For example, if the CU rate is 95% and the SF is 95%, then the capacity factor would be about 90%. On these rates for U.S. nuclear power plants, see Rothwell (2000).
Although there can be uncertainty associated with CU (and CU can be estimated at less than 100%), the uncertainty in CF is usually dominated by uncertainty in the Service Factor, i.e., how much time a facility will be down for repair and maintenance. Assuming that the expected capacity factor is 90% (= SF and CU = 100%), the expected number of days of outage would be 36.5 days per year. Assuming an accuracy range of ±30% with a confidence of 80%, expected days of outage would be between 25.5 and 47.5 days per year, i.e., the capacity factor would range from 93% to 87% with a standard deviation (σSF) of 23% for the days of outage. Following the same methodology as above, the standard deviation on the Capacity Factor, σCF, would be σSF ⋅ (1 – SF) = 23% ⋅ (1 – 90%) = 23% ⋅ 10% = 2.3% and the contingency-adjusted Capacity Factor would be 87.7% = CU ⋅ ( SF – σCF ), treating the contingency as a penalty. On the other hand, an accuracy range of ±20% with a confidence of 80% would imply a standard deviation of 16% or σCF = 1.6% and a contingency-adjusted capacity factor of 88.4%.
Contingency on CF can be set equal to –σCF, where the standard deviation of capacity factor can
be determined by estimating the standard deviation of scheduled outage days from specifying an accuracy range (± X%) with an 80% confidence interval. This accuracy may be greater than or less than the accuracy of the base construction cost or construction schedule estimate. It should correspond with the level of detail of the operations and maintenance schedule estimate.
A.3.3 Estimating Levelized Capital Cost Contingency
The standard deviation of estimates for cost, lead time, and capacity factor give reasonable values for each contingency. These standard deviations can be derived from the estimator’s 80% confidence interval around the most-likely values. This should lead to contingencies that are approximately equal to those suggested by guidelines such as AACEI (1997) and EPRI (1993).
Taking these contingencies into account leads to a contingency-adjusted value for the Levelized
Capital Cost:
LCC = CFR(r, T) · { (BCC+σC) · [1 + (LT + σLT) (r/2)] }/ [(CF – σCF ) (MAX ⋅ Y)], (A11)
where LCC is expressed in $ per unit of output; CFR, r, SF, and σCF are expressed as percentages (e.g., r = 10%); T is expressed in years; BCC and σC are expressed in real dollars; LT and σLT are expressed in months; MAX is expressed in MW; and Y is hours per year.
For example, if CFR = 10.23%, BCC = $1,000M, σC = $160M, LT = 48 months, σLT = 12 months, CF = 90%, σCF = 2.3%, MAX = 1000MW, and Y = 8,760 hours; then LCC = $17.37/MWh. Ignoring Capacity Factor contingency reduces LCC to $16.93/MWh; ignoring Capacity Factor and IDC contingencies reduces LCC to $16.56/MWh; and ignoring all contingencies reduces LCC to $14.27/MWh. In this example, base construction cost contingency has the greatest impact on LCC. Therefore, the greatest attention should be paid to reducing uncertainty in the base construction cost estimate (this should also reduce uncertainty in the construction schedule and in the maintenance and repair schedule).
09/30/2005
- 121 -
Endnotes 1. EPRI (1993) is the last publicly available version of the Technology Assessment Guide. Later versions are proprietary, but use the same definitions and Suggested Contingencies as in Table A1. 2. The normal density function is N( x ) = (2 π σ 2) −½ Α exp{ − (1/2) Α ( x − µ ) 2 / σ 2 }, µ is the mean and σ is the standard deviation. See Palisade (1996, p. 235). 3. Lorance and Wendling (1999, p. 7) state “We are most familiar with and strongly support assigning contingency such that the base estimate plus contingency equals the 50/50 point (median) of the cumulative distribution.” In their Monte Carlo example, “note that at the 50/50 point is a 16.2% contingency.” (p. 6). The standard deviation of their cost estimate is 16.6% = (14,170/85,156), i.e., their example is consistent with the conclusion reached here.
4. The lognormal density is LN( x ) = x−1 (2 π σ 2)−½ Αexp{−(1/2)Α(ln x − µ)2 / σ 2 }, where µ equals the natural log of the median and σ 2 equals the natural log of the median minus the natural log of the mode. The mean is exp{µ + (σ 2 /2)}. The variance is exp{2µ – σ 2 }[ exp{σ 2 } – 1] and the standard deviation equals the square root of the variance. See Palisade (1996, p. 233) and Johnson, Kotz, and Balkarishnan (1995). The LOGNORMDIST function in EXCEL (e.g., in OFFICE97, equal to LOGNORM in Palisade, 1996, p. 232) can be used to calculate the lognormal probability cumulative distribution, as in Figures 3 and 4. However, in LOGNORMDIST the “mean” is the natural logarithm of the median in Table A2 and the “standard deviation” is as in Table A2. 5. With the mode equal to 1.0, both µ and σ 2 are equal to the natural log of the median and the variance equals exp{2 ln(median) – ln(median)}[ exp{ln(median) }–1] = [median ⋅ (median–1)]. References Association for the Advancement of Cost Engineering International, AACEI (1997). “Cost Estimate Classification System – As Applied in Engineering, Procurement, and Construction for the Process Industries,” AACE International Recommended Practice No. 18R-97 (revised June 15, 1998). www.aacei.org Electric Power Research Institute, EPRI (1993). Technology Assessment Guide. Palo Alto, CA: EPRI. TR-102276-V1R7. Johnson, N.L., S. Kotz, and N. Balkarishnan (1995). Continuous Univariate Distributions-vol. 2. New York: John Wiley & Sons. Lorance, R.B. and R.V. Wendling (1999). “Basic Techniques for Analyzing and Presentation of Cost Risk Analysis,” AACE International Transactions. www.decisioneering.com/ articles/lorance.html Palisade (1996). Guide to Using @Risk. Newfield, NY. www.palisade.com Parsons, E.L. (1999). “Waste management project contingency analysis,” U.S. Department of Energy, Federal Energy Technology Center (DOE/FETC-99/1100). www.netl.doe.gov/publications/others/techrpts/parsons.pdf Rothwell, G.S., 2000. “Profitability Risk Assessment at Nuclear Power Plants under Electricity Deregulation in The Impact of Competition” (Montgomery Research, www.UtilitiesProject.com). Rothwell, G.S. (2005). “Cost Contingency as the Standard Deviation of the Cost Estimate” Cost Engineering (tentatively accepted, 2005).
09/30/2005
- 122 -
APPENDIX B. A Costing Process for Advanced Reactor Design With the start of Generation IV design efforts there is opportunity for cost modeling to be directly integrated into the design process. The Cost Estimating Guidelines can become integrated into the design process. The resulting “Costing Process” is the use of an integrated model that unites engineering aspects (such as thermal hydraulics, nuclear core physics, heat transfer, process control, etc.) with economics by using cost scaling algorithms for various subsystems. (The EEDB report with PWR cost scaling relationships has examples of such algorithms for reactor systems.) As an example, a costing process used by AECL for advanced reactor design has the following sequential elements and is based on a reference perturbation technique:
(a) Establish targets for cost, product streams, performance, safety, O&M, etc. (b) Establish a reference (built or designed) plant cost (c) Define the changes from that reference design for a given concept (d) Cost-estimate the changes (e) Iterate back to (c) when needed vis -a-vis the targets in (a) (f) Finalize the system concept and outline the RD&D needs (g) Conduct engineering and cost feasibility study for the concept, including uncertainty and risk (h) Iterate back to (c) if needed: establish any reference changes (i) Finalize the design concept and its FOAK cost using actual bids/quotes as needed (j) Define confirmatory RD&D cost and schedule, including uncertainty and risk (k) Establish Preliminary Engineering Design (l) Cost estimate the design including NOAK estimates, including uncertainty and risk (m) Cost estimate all product streams per assumed market(s) (n) Iterate to (i) as needed (o) Conduct Engineering Design Program for FOAK and/or prototype, complete RD&D (p) Undertake independent review of costs with customer(s) (q) Establish Owners Costs and define business model (r) Finalize cost(s) for all product streams (e.g., hydrogen, electricity, process heat, etc.) (s) Establish risk, financing, contract, and project model for build schedule (t) Iterate to (q) as needed (u) Prepare formal cost estimates to bid spec(s) using guidelines and/or conventional national practice
09/30/2005
- 123 -
APPENDIX C. Site-related Engineering and Management Tasks
• Prepare site-related engineering specifications and drawings (layouts, design, manufacturing, installation, and interface control drawings).
• Identify and re-tab non-site drawings (design, manufacturing, installation, and interface control drawings), technical documents, specifications, and manuals to show applicability to the Target Plant.
• Update and maintain technical work packages.
• Provide support at vendor's plant to witness factory acceptance testing. • Support the constructor during plant construction and acceptance testing.
• Provide support to the Materials Review Board • Provide support as specifically requested to SAR (including emergency response) to show
that the plant is identical in design.
• Support vendor bid evaluations and negotiations as requested by Procurement for releases of previously bid and committed awards.
• Support the Constructor in the resolution of any field problems. • Prepare site-specific licensing documents, such as ER and SAR.
• Repeat plant planning and scheduling and administrative, quality assurance, procurement, and industrial and public relations activities.
• Provide modularization schedule/sequencing plan.
• Provide engineering necessary to excavate and lay out the site for construction. This includes excavation drawings; de-watering calculations and analyses; and design and layout of access roads, parking lots, utilities, etc.
• Provide project management services associated with the above tasks.
09/30/2005
- 124 -
APPENDIX D. Siting Parameters
GENERAL
Soil and subsurface conditions are such that no unusual problems are associated with soil-bearing capacity or rock removal, major cut and fill operations, and de-watering.
Assumed site access will not rely on barge delivery of large pre-assemblies or modules. All
deliveries will be possible by rail or road transport without requiring unreasonable size or weight capacity.
Cooling water make-up for on-site cooling towers will be available at site boundary. Construction access, construction electricity, water, telephone, police service, ambulance service,
and other support services are available in the proximity of the site. The primary purpose of defining regions is intended to support comparison of different
reactor systems at the same site, rather than the same reactor system at different sites.
D.1 North America D.1.1 United States
The 1993 ORNL Guidelines (Delene and Hudson, 1993)defined a reference site in the Northern US
along with the relevant meteorological, water, seismic, soil, atmospheric dispersion, and infrastructure data. This data is no longer relevant due to the fact that under DOE partial sponsorship, utilities in the U.S. have now identified three actual existing plant sites for analysis. Unfortunately at this time the data is not available. The only siting parameter available in the ALWR Requirements Document, Volume 1, is the 0.3g seismic acceleration. The full listing of site parameters is in one of the proprietary volumes. No alternative sites have been found on IAEA or NEA web sites.
It is suggested that the EMWG limit its assumptions on siting for U.S. sites to 0.3 g (i.e.,
294 cm.sec-2) seismic and the use of cooling towers for the ultimate heat sink. Most other parameters will be second order effects, especially for the conceptual design stage. D.1.2 Canada It is suggested that the EMWG limit its assumptions on siting for Canadian sites to 0.3 g (i.e., 294 cm.sec-
2) seismic and optional use of cooling towers for the ultimate heat sink. Most other parameters will be second order effects, especially for the conceptual design stage. D.2 Asia D.2.1 Japan
In Japan, the main steps for seismic design are as follows (Nuclear safety Commission of Japan, 1981).
09/30/2005
- 125 -
At first, the classification of the facilities is carried out. For class As and class A facilities, the maximum design earthquake ground motion S1 and/or extreme design earthquake ground motion S2 are to be evaluated. Reference for S1 is the recorded (historical) earthquake, and that for S2 is the seismological review.
Design seismic force, depending on the site location, is decided by the S1 or S2 earthquake ground
motion and the static seismic force. The maximum S1, S2 design earthquakes for the operating power stations in Japan are 450 gal and 600 gal (1 gal = 1 cm.sec-2), respectively. D.3 Europe D.3.1 France Proper assumptions for European sites will be added later. D.3.2 United Kingdom Requirement for site selection and qualifications are provided by HM Nuclear Installations Inspectorate – Safety Assessment Principles (SAP) for Nuclear Plants at their web site, http://www.hse.gov.uk/nuclear/saps.htm References Delene, J.G., and Hudson, C.R., 1993, Cost Estimate Guidelines for Advanced Nuclear Power Technologies, ORNL/TM-10071/R3, Oak Ridge National Laboratory, Oak Ridge, TN, USA, May 1993. Nuclear Safety Commission of Japan, 1981, Examination guide for seismic design of nuclear power reactor facilities, Tokyo, Japan.
09/30/2005
- 126 -
APPENDIX E. Estimating FOAK to NOAK Capital Costs
Design teams will be estimating Base Construction Costs (BCC) as First-of-a-Kind (FOAK) costs and Nth-of-a-Kind (NOAK) costs. (BCC are the sum of Direct Costs, DC, and Indirect Costs, IC.) This appendix discusses the translation of FOAK to NOAK costs and vice versa.
To facilitate consistency in the estimates produced by each design team, the following assumptions
define the basis for calculation of the cost adjustment factors for a nominal plant size of 1,000 MWe: Definition of FOAK plant
• First commercial plant built with estimated equipment, materials and labor productivity based on current or recent nuclear plant experience.
• Past US nuclear plants are regarded as “Replica Plant” experience. Somewhat better than true FOAK plants.
• Marketing strategy may consider pricing of all plants, from the first commercial plant to the plant prior to NOAK plant, and to be levelized for recovery of common development, design, certification, tooling, fabrication plant recovery and other common non-recurring costs.
• Deployment costs or true FOAK, non-recurring cost components are to be identified and separately priced.
Definition of NOAK plant Identical plant supplied and built by same vendors and contractors as the FOAK plant with only the site specific scope adopted for the NOAK plant site needs.
• NOAK costs are achieved for the next plant after 8 gigawatt (GWe) of capacity has been constructed of a particular nuclear energy system.
• Costs decline with each doubling of experience. • Fleet size is 32 GWe for considerations of sizing support facilities such as fuel fabrication or
reprocessing. • The series of plants from FOAK through NOAK plant are assumed to be competitively bid for a
comprehensive award and release of individual plants on an optimum schedule for the selected vendors and contractors.
• Project execution (up through the NOAK plant) is based on a single large A/E organization providing project management, engineering, procurement and construction (EPC) services. Construction will be performed by direct hire labor with subcontractors for specialty work.
Cost factors between FOAK and NOAK plants
• Construction schedule for the first commercial plant is most likely performed on a regular 5 x 8’s work week schedule. Subsequent plants may incorporate accelerated construction schedules optimized to reduce plant costs inclusive of cost of money. Alternative construction work week schedules such as rolling 4 x 10’s can improve productivity by reducing manpower densities, improving material flow and work access. Alternative workweek schedules may incur premium labor costs and still produce an overall cost benefit, especially when cost of money is included in the assessment.
09/30/2005
- 127 -
• Construction labor learning effect has been demonstrated on many construction projects. Learning cost factors of 0.90 for every doubling of construction labor is recommended, and has been utilized in other previous cost studies.
• Learning effect is also reflected in pricing of shop fabricated equipment, especially the non-standard equipment that is typical for nuclear power plants. A learning cost factor of 0.94 for every doubling of process equipment costs is recommended.
• The marketing strategy of awarding multiple plant orders supports procurement of large quantity of bulk materials with discounted pricing. Other cost studies have utilized a 10% discount for NOAK plant orders.
• The learning effect is also applicable to field indirect costs that will experience benefits of repeat construction activities that are pre-planned at detail daily work plans and pre-staged work packages. NOAK plant construction indirect costs will experience a reduction relative to the direct labor costs which are also affected by their own learning factors. A learning cost factor of 0.97 for every doubling of plant construction costs is recommended.
• Operations and Maintenance are a major component of the LEUC and historically have demonstrated reductions in costs attributed to improvements in the information technology and owners operations and maintenance programs. Proponents are to provide supporting data for any learning factors applicable to O&M costs of the NOAK plant and beyond.
There are two cost drivers: (1) the recovery of deployment costs over the transitional units; and (2)
the decline in BCC from learning-by-doing (and other cost saving effects, such as, scale economies in commodity purchasing) during the construction of transitional units.
First, we consider the allocation of design and certification costs, DEPLOY. To quote the
Guidelines, “Deployment costs: Costs of developing a standard design and licensing it. These are considered part of non-recurring FOAK costs and are distinct from R & D costs.” (These are “True FOAK Costs” in Figure 1.1.)
We assume DEPLOY are equally distributed over 8 GWe of capacity. For example, if each unit
were 1,000 MW, then all deployment costs would be recovered with the first eight units, such that the 9th unit would be free of deployment costs. On the other hand, if each unit were 333 MWe, these costs would be distributed over the first 24 units, so that the 25th unit would be free of deployment costs. Deployment cost per unit is:
DEPLOYUNIT = ( DEPLOY ⋅ SIZE ) / ( 8 GWe ),
Where DEPLOY is in millions of dollars per unit and SIZE is the unit size in gigawatts. For example, if design costs were $200M, certification costs were $200M, and these costs are recovered over the construction of the first 8 - 1,000 MW units, then DEPLOYUNIT would be $50M/unit.
Second, we model the decline in BCC from FOAK to NOAK units. To quote the Guidelines,
“Learning experience can be included for NOAK plant based on learning factors to be developed by each team. Guideline factors for each doubling of construction experience are 0.94 for equipment costs, 0.90 for construction labor and a 10% reduction in material costs for multi plant orders.” If all accounts are not broken into equipment, labor, and commodities, cost estimators can assume that direct costs (Account 2) decline at the rate appropriate for equipment, i.e., 0.94. (This is an approximation.) Under these assumptions: BCCi = DEPLOYUNIT + IC + ( DC ⋅ GWi
γ ) for GWi < 8 GW
BCCi = IC + ( DC ⋅ 8 γ ) for GWi ≥ 8 GW
09/30/2005
- 128 -
where γ represents the “learning elasticity” and GWi is the cumulative capacity. (See International Atomic Energy Agency, International Project on Innovative Nuclear Reactors and Fuel Cycles, INPRO, May 2003, p. 46). We assume that learning elasticity is such that cost declines by 6% with each doubling, i.e., that γ = –0.089 = (log 0.94/log 2. For example, with FOAK DC1 = $1,000M, DC24 = $940M, BCC4-7 = $884M, BCCNOAK = $831M. With deployment costs of $57M and Indirect Costs of $400M, BCC1 = $1,457M, DC24 = $1,397M, BCC4-7 = $1,341M, and BCCNOAK = $1,231M.
09/30/2005
- 129 -
Appendix F. GIF Code of Accounts Dictionary
The investment costs for a complete nuclear energy plant or parts of it, include the costs of engineering, construction, commissioning, and test run (considered part of “start-up” or commissioning) to commercial operation. The base costs include costs associated with the equipment, structures, installation, and materials (direct costs), as well as field indirect, design services, construction supervision and PM/CM services (indirect costs). In addition to the base costs there are supplementary costs (such as initial core and spare part costs), financial costs (such as IDC), owner’s costs (including the owner’s capital investment, services costs, and related financing costs) and contingency. The Total Capital Investment Cost (TCIC) is the cost of building the plant and bringing it into commercial operation.
The structure of a Code of Accounts adopted in the guidelines is as follows: 10 – Capitalized Pre-construction costs 20– Capitalized Direct Costs DIRECT COST 31-34 – Field indirect costs TOTAL FIELD COST 35-39 – Capitalized support services BASE COST 40 – Capitalized Operations 50 – Capitalized Supplementary Costs OVERNIGHT COST 60 – Capitalized Financial Costs TOTAL CAPITAL INVESTMENT COST (TCIC)
This structure was developed from references to the IAEA and EEDB code of accounts and the needs for the proponents to optimize their design options as well as GIF evaluations of alternative plant concepts. The structure facilitates project evolution from R&D, detail design, commercialization or deployment phases and provides continuity of cost data throughout the life of the project.
The GIF COA system is a numerical system designed to provide cost information for any
component of a particular project, from design, layout and procurement of equipment, to the final installation. At the two-digit level it can be applied to either top-down or bottom-up cost estimates. At the three-digit and four-digit level and above, a bottom-up estimate is usually required to “fill in the blanks.” The GIF account system is primarily a system of cost accounts and is based on a physical subdivision of the project. However, as a project matures, it may also be convenient to use it for other purposes, such as filing, drawing and document control, and numbering and coding of equipment. The advantages are that this system eliminates the need to develop separate systems for each purpose, so that only one system needs to be learned, and provides a common language for the whole project, so that various phases of the work can be readily related. At two-digit level, the subsystem category names should be applicable regardless of the reactor system or technology described.
At the three-digit level commonality of account descriptions between technologies begins to
disappear. Chapter 5 considers definitions at the three-digit level for use in bottom-up estimating. In the GIF COA system, pre-construction costs are allocated to 10 accounts, direct costs to accounts 20, capitalized support services to accounts 30 and the totals of these accounts 10 through 30 representing
09/30/2005
- 130 -
base costs of the plant. Capitalized operations costs are allocated to accounts 40, and supplementary costs to Accounts 50. The subtotal at this level (accounts 10 through 50) represents the plant overnight costs. Remaining capitalized costs for financing are allocated to accounts 60 for a Total Capital Installed Cost (TCIC). F.1 GIF Code of Account Structure and Dictionary for Capital Cost Estimates
The GIF COA structure includes prefixes and suffixes to the basic code for separation and summarization of costs to various levels. The structure and details are described in the following sections.
F.2 Structure F.3 Direct Costs F.4 Indirect Costs F.5 Annualized Costs F.6 Non-Reactor Codes
F.2 Structure
The full code of account structure consists of components for identification and segregation of costs by:
Unit, Plant, System/Facility and Commodity Unit prefix: Numeric digit representing a unit of a multiple unit plant or a module number of a
multiple module plant. 1 – Unit or module one 2 – Unit or module two 3 – Unit or module three 4 – Unit or module four 5 – Unit or module five 6 – Unit or module six 7 – Unit or module seven 8 – Unit or module eight 9 – Common to all modules or units Plant prefix: Alpha character representing the type of plant, such as: A – Reactor Plant B – Fuel Fabrication Plant C – Fuel Reprocessing Plant D – Desalination Plant E – Hydrogen Generation Plant F – Other Process Plant System/Facility identifier consists of three digits that are EEDB and IAEA derived and represent
the major systems, and buildings of the plant: The first digit groups the costs by type: 1 – Capitalized Pre-construction costs 2 – Capitalized Direct Costs 3 – Capitalized Support services 4 – Capitalized Operations 5 – Capitalized Supplementary Costs
09/30/2005
- 131 -
6 – Capitalized Financial Costs 7 – Annualized O & M Cost 8 – Annualized Fuel Cost 9 – Annualized Financial Cost The second digit identifies summary costs contained within first digit: 1 – Capitalized Pre-construction Costs 11 – Land and Land Rights 12 – Site Permits 13 – Plant Licensing 14 – Plant Permits 15 – Plant Studies 16 – Plant Reports 17 – Other Pre-construction Costs 18 – Other Pre-construction Costs 19 – Contingency – Pre-construction Costs 2 – Capitalized Direct Costs 21 – Structures and Improvements 22 – Reactor Equipment 23 – Turbine-Generator Equipment 24 – Electrical Equipment 25 – Heat Rejection System 26 – Miscellaneous Equipment 27 – Special Materials 28 – Simulator 29 – Contingency – Direct Costs
Direct Cost (10-20) 3 – Capitalized Support Services 31 – Field Indirect Costs 32 – Construction Supervision 33 – Commissioning and Start-up Costs 34 – Demonstration Test Run Field Cost (10-34) 35 – Design Services Offsite 36 – PM/CM Services Offsite 37 – Design Services Onsite 38 – PM/CM Services Onsite 39 – Contingency – Support Services Base Construction Cost (BCC) (10-30) 4 – Capitalized Operations 41 – Staff Recruitment and Training 42 – Staff Housing 43 – Staff Salary Related Costs 44 – Other Owner Capitalized Costs 49 – Contingency – Operations Costs
09/30/2005
- 132 -
5 – Capitalized Supplementary Costs 51 – Shipping and Transportation Costs 52 – Spare Parts 53 – Taxes 54 – Insurance 55 – Initial Fuel Core Load 58 – Decommissioning Costs 59 – Contingency Supplementary Costs Total Overnight Cost (TOC) (10-50) 6 – Capitalized Financial Costs 61 – Escalation 62 – Fees 63 – Interest During Construction 69 – Contingency – Financia l Costs Total Capital Investment Cost (TCIC) (10-60) 7 – Annualized O & M Cost 71 – Operations and Maintenance Staff 72 – Management Staff 73 – Salary Related Costs 74 – Operations Chemicals and Lubricants. 75 – Spare Parts 76 – Utilities, Supplies, Consumables 77 – Capital Plant Upgrades 78 – Taxes and Insurance 79 – Contingency Annualized O & M Costs 8 – Annualized Fuel Cost 81 – Refueling operations 84 – Nuclear Fuel 86 – Fuel reprocessing Charges 89 – Contingency Annualized Fuel Costs 9 – Annualized Financial Costs 91 – Escalation 92 – Fees 93 – Cost of Money 99 – Contingency Annualized Financial Costs The third and following digits prior to the decimal point separator, (typically third digit) provide the
lowest level of GIF code for comparisons between plants and development of reference plant costs by top-down techniques. The details are discussed below. Commodity Codes:
Following the GIF code is a decimal point separating the commodities that are included in each GIF code. Detail, bottoms-up estimates would be performed by quantification of the commodities to
09/30/2005
- 133 -
individual size level, and application of unit hour and unit cost rates, to develop the detail commodity cost and then summarized to the third digit of the GIF code.
The detail commodity account structure consists of the following categories and commodities: 1- Concrete Category : Commodities - 11 Formwork, 12 decking, 13 rebar, 14 embedded metals,
15 structural concrete, 16 fill concrete, 17 precast concrete, 18 concrete structural modules. 2 – Structural Category: Commodities - 21 Structural steel, 22 miscellaneous steel, 23 liners, 24
fabricated commodities, 25 architectural, 26 earthwork, 27 piles, 28 site improvements. 3 – Nuclear Steam Supply System Category: Commodities - 31 Reactor vessel, 32 reactor
internals, 33 CRD components, 34 install internals, 35 install components, 36 installation support activities.
4 – Mechanical Equipment Category: Commodities - 41 T/G equipment, 42 condenser, 43
rotating equipment, 44 heat exchangers, 45 tanks and vessels, 46 water treatment, 47 radwaste, 48 miscellaneous equipment, 49 HVAC system components.
5 – Piping Category: Commodities - 51 Large shop fabricated pipe, 54 special pipe, 55 small pipe,
56 vendor pipe, 58 valves, 59 hangers and piping miscellaneous operations. 6 – Instrumentation Category: Commodities - Control room equipment, local control panels,
field mounted instruments, instrument supports, instrumentation tubing, packaged control systems, control and relief valves, calibration testing.
7 – Electrical Equipment Category : Commodities - Switchgear, transformers, bus duct, D.C.
equipment, motor control centers, other electrical equipment, miscellaneous electrical equipment, switchyard equipment.
8 – Electrical Bulks Category: Commodities - Cable tray, scheduled conduit, other conduit,
scheduled wire and cable, scheduled connections, other wire and cable. 9 – Specialty Materials and Equipment Category: Commodities - Plant specific materials and
equipment unique to other plants such as fuel fabrication, fuel reprocessing, hydrogen generation, or desalination.
Commodity detail codes provide further separation for structural component, size or detail type of
commodity. As an example, a full detail code 1A212.112 would represent: (1) Unit one, (A) Reactor Plant,
(212) Reactor Building, .1 Concrete Category, (.11) Formwork, (.112) Formwork for Walls and Columns F.3 Direct Costs
In the GIF COA account system structure (IAEA and EEDB - derived) the “twenty-X” series is
reserved for the direct costs of reactor construction, i.e., the on-site labor, materials, and equipment for reactor construction. The original IAEA account system does not include labor in the 2X series of accounts. It included labor-hours in an indirect account. The EMWG has decided for the GIF Code of Account, to put labor in the direct costs to obtain greater understanding and integrity of subsystem costs. The direct labor component includes the labor costs of “hands-on” craft (up to foreman) workers. The
09/30/2005
- 134 -
category does not include indirect workers (Non Manual labor) such as superintendents, field engineers, A/E, or reactor-vendor home office staff, or construction services staff. These are included in the “Support Services” Accounts 3X. Subcontract cost and labor should be included in the 2X series if it is for the direct scope of work. Craft labor providing common support of construction such as temporary lighting, warehousing, clean-up, etc, is included in account 31 – Field Indirect Costs.
At the two digit level (COA “2X”) this GIF (IAEA/EEDB) format should fit most reactor types and
also be useable for top-down estimates. At the three digit level (COA “2XX”) some of the subsystems may only fit a non-generic GIF plant, i.e., they will only apply to a specific reactor technology. The three digit categories below (beneath each two-digit header) give the user an indication of where the more detailed cost items should be grouped. An attempt has been made to keep the three-digit definitions as generic as possible, although most are based on the PWR COA dictionary in the original EEDB documents (ORNL, 1988). Engineering judgment can be used to assign non-PWR systems, such as circulating helium in a gas-cooled reactor, to GIF COA accounts with functions similar to those in the PWR, e.g., Heat Rejection System Account 252. Annex I of the IAEA document (IAEA, 2000) gives a “dictionary” of accounts at the 3-digit level (nearly thirty pages long) and differs somewhat from the U.S. (EEDB) practice in the abbreviated three digit definitions below. At the two-digit level, all 2X accounts match the modified IAEA account system.
Account 1 – Pre-Construction Costs Account 11 - Land and Land Rights: (Not in IAEA account system, but in EEDB 20; the EMWG
decided to retain this scope in new account 11). This account includes the purchase of new land for the reactor site, including that needed for any co-located facilities, including dedicated fuel cycle ones. Costs for acquisition of land rights should be included. This category does not include siting costs such as geo-technical work (account 211) or the preparation of environmental documentation (account 16).
Account 12 – Site Permits: This account includes costs associated with obtaining all site permits to
permit construction of the permanent plant. Account 13 – Plant Licensing: This account includes costs associated with obtaining plant licenses
for construction and operation of the plant. Account 14 – Plant permits: This account includes costs associated with obtaining all permits for
construction and operation of the plant. Account 15 – Plant studies: This account includes costs associated with plant studies performed
for the site or plant in support of construction and operation of the plant. Account 16 – Plant Reports: This account includes costs associated with production of major
reports such as EIS, SAR, Accounts 17-18 – Other pre-construction costs Account 19 – Contingency Pre-construction Costs: An assessment of additional cost that is
necessary to achieve desired confidence level for the pre-construction costs not to be exceeded. Account 2 – Capitalized Direct Costs
09/30/2005
- 135 -
Account 21 - Structures and Improvements: This account covers costs for civil work and civil structures, mostly buildings, exclusive of those for the cooling towers. Suggested 3-digit accounts are as follows:
Acct 211 Site preparation/Yard work: Clearing, grubbing, scraping, geo-technical work, site cut, fill and compact, drainage, fences, landscaping, etc.
Acct 212 Reactor Island Civil Structures: (Primary process facility) The concrete and metalwork, including installation labor, for the building surrounding and supporting the nuclear island. The reactor containment structure would be included here. The biological shielding around the reactor core and the refueling canal are also included. For PWRs the steam generators would be located inside this structure. Includes structural excavation and backfill, foundations, walls, slabs, siding, roof, architectural finishes, elevators, lighting, HVAC (general building service), fire protection, plumbing, drainage, etc.
Acct 213 Turbine Generator Building: (Secondary process facility). The concrete and structural metalwork, including installation labor, for the building surrounding and supporting the turbine generator(s). For concepts that do not produce electricity, this account can be replaced with appropriate energy product buildings. Includes structural excavation and backfill, foundations, walls, slabs, siding, roof, architectural finishes, elevators, lighting, HVAC, fire protection, plumbing, drainage, etc.
The rest of these 21 series accounts are for other support buildings on the site. Those with a “*” after the account number are likely to be needed for any of the six Generation IV systems. Modular concepts might have a separate building housing centralized function for all modules, such as an external control room. The building costs here are for the complete civil structure, including structural excavation and backfill, foundations, finishes and building services such as elevators, lighting, HVAC, fire protection or domestic water and drainage but do not include the specialized equipment within.
Acct 214* Security Building and Gatehouse: Houses the security force and support staff. The gatehouse controls entrance and egress to the site and visitor control functions.
Acct 215* Reactor Service (Auxiliary) Building: Houses the fuel storage area, the spent fuel pool, the control room, and most other BOP functions.
Acct 216* Radwaste Building: This building accommodates the preparation and packaging of solid process wastes and maintenance wastes from reactor operations. This function could also be housed in the Auxiliary Building.
Acct 217 Fuel Service Building: (If separate, otherwise in Account 215).
Acct 218A Control Building: Houses the control room, if the control room structure is not part of Account 212.
Acct 218B* Administration Building: Houses the offices for management, administrative, engineering, clerical, finance, and other support staff.
Acct 218C Operation and Maintenance Center: Houses the O&M staff plus equipment for repair and maintenance of small equipment. (If not in Account 215)
Acct 218E Steam Generator Storage Building: (For PWR concepts).
Acct 218K Pipe Tunnels
Acct 218L Electrical Tunnels
Acct 218N* Maintenance Shop: This structure includes maintenance and repair capability for large items, including a crane.
09/30/2005
- 136 -
Acct 218Q* Foundations for outside equipment and tanks
Acct 218R Balance of Plant Service Building (if not in Account 215).
Acct 218S* Wastewater treatment building
Acct 218T Emergency Power Generation Building: Houses the gas turbines or diesel engines need to provide power to safety systems in the event of a reactor shutdown and loss of off-site power.
Acct 218W*Warehouse
Acct 218X* Railroad tracks
Acct 218Y* Roads and paved areas
Acct 218Z Reactor Receiving and Assembly Building (for modular concepts)
Acct 219A* Training center
Acct 219K* Special material unloading facility Account 22 –Reactor Equipment: This category is most dependent on the reactor technology being
considered, since the sub-account descriptions and costs depend heavily on the coolant used and whether the subsystems are factory-produced or constructed on site. For today’s LWRs the entire NSSS can be purchased as a unit from a reactor vendor. The RM may have its own COA structure for all the NSSS components. The list below attempts to be as generic as possible. The initial and reload fuel cores are not included here. (Fuel is discussed in Chapter 8).
Acct 221 Reactor Equipment: Includes the reactor vessel and accessories, reactor supports, reactor vessel internals (non-fuel), transport to site, in core reactor control devices, and the control rod systems.
Acct 222 Main Heat Transport System: Includes the initial reactor coolant load, the pressurizing or cover gas system, steam generators (if applicable), the reactor coolant piping system, the fluid drive circulation system (including pumps), heat exchangers, and in-system diagnostic instrumentation and metering. Includes main steam piping to turbine control and isolation valves (Account 231), as well as feedwater piping from feed heating system (Account 234).
Acct 223 Safety Systems: Includes the residual heat removal system, the safety injection system, any containment spray system, the combustible gas control system, and any associated heat exchangers, valves, pumps, pipes, and instruments.
Acct 224 Radioactive Waste Processing Systems: Includes liquid waste processing, the fission gas distribution and process system, and the solid radioactive waste system.
Acct 225 Fuel Handling Systems: Includes fuel handling and storage equipment, including cranes, fuel handling tools, service platforms, and fuel cleaning and inspection equipment.
Acct 226 Other Reactor Plant Equipment: Includes the inert gas system, make-up coolant systems, coolant treatment system, the auxiliary cooling system, maintenance equipment, and sampling equipment.
Acct 227 Reactor Instrumentation and Control (I&C): Includes benchboards, panels, racks, process computers, monitoring systems, plant control and protection system, I&C tubing and fittings, instrumentation, and software.
Acct 228 Reactor Plant Miscellaneous Items: Includes painting, welder qualification, and reactor plant insulation.
09/30/2005
- 137 -
Account 23 – Turbine-Generator Equipment: This category assumes that electricity is the primary product. The categories below apply mostly to a steam-driven turbine; however, similar categories would exist for gas driven turbines, such as those in a MHTGR. These categories will be expanded to include other energy product production systems.
Acct 231 Turbine Generator(s): Includes turbine generator plus associated mountings, main steam control and isolation valves, lubrication system, gas systems, moisture separator, and drain system, excitation system and controls. Main steam piping with Account 222.
Acct 233 Condensing Systems: Includes condenser equipment, the condensate system, the gas removal system, and the turbine bypass system. Includes condenser cleaning system. Includes piping from condenser to feedwater heating system Account 234. Condensate polishing with Account 235.
Acct 234 Feed Heating Systems: Includes the feed heating system, feed-water heaters, the feed-water system piping, the extraction steam system, and the feed-water heater vent and drain system. Piping to steam generator continues with Account 222.
Acct 235 Other Turbine Plant Equipment: Includes piping system, turbine auxiliaries, closed cooling water system, demineralized water make-up system, chemical treatment system, and neutralization system. (The cooling towers are in Account 25.)
Acct 236 Instrumentation and control (I&C): Includes turbine generator control equipment, process computer, and BOP instrumentation and controls, including software, tubing, fittings, etc. Cables with Account 246.
Acct 237 Turbine Plant Miscellaneous Items: Includes painting, welder qualification, and turbine plant insulation.
Account 24 – Electrical Equipment: (Note: The IAEA account system normally puts all
Instrumentation and Control here. The EMWG decided to retain I&C within the accounts that require I&C equipment, mainly Acct 227 and 236.) Accounts 21-23 all have interfaces with the power plant electrical service system and its associated equipment. This equipment is located both inside and outside the main reactor/BOP buildings.
Acct 241 Switchgear: Includes switch gear for generator and station service (Typically to 10kV). Includes generator transformer, auxiliary transformer and connecting bus.
Acct 242 Station service equipment: Includes substations, auxiliary power sources, load centers, motor control centers, and station service and startup equipment, transformers and bus ducts. (Typically to 500V)
Acct 243 Switchboards: Includes control panels, and auxiliary power and signal boards. Includes batteries, DC equipment and non-interruptible power)
Acct 244 Protective systems equipment: Includes grounding systems, lightning protection, cathodic protection, heat tracing, freeze protection equipment, radiation monitoring, and environmental monitoring. Includes equipment, raceway, cable and connections. Excludes communication systems account 263 and building services such as lighting, HVAC, fire protection (with respective building accounts).
Acct 245 Electrical Raceway Systems: Includes Cable Tray, Exposed Conduits, Embedded conduits,
underground conduit and duct systems. Includes fittings, supports, covers, boxes, manholes, ducts and accessories for the scheduled cable systems. Raceway for protective systems with Account 244 and building services electrical systems with respective building accounts.
09/30/2005
- 138 -
Acct 246 Power and Control Cables and Wiring: Typically includes all scheduled cable systems. Excludes lighting, communication and other protection systems. Includes cable, straps, attachments, terminations, wire lugs, cable numbers, wire numbers, etc.
Account 25 - Heat Rejection System: This account includes heat rejection equipment, including
circulating water pumps, piping, valves and cooling towers. These may be required even if the plant does not produce electricity. (This is Account 26 in the original EEDB).
Acct 251 Structures: Includes structures for the makeup water and intake, the circulating water-pump house, the makeup water pretreatment building, and the cooling towers.
Acct 252 Mechanical equipment: Includes the heat rejection mechanical equipment, such as circulating water pumps, piping, valves, mechanical draft cooling towers, (Natural draft towers with Acct 251) water treatment plant, intake water pumps, screens, filters, etc. Condensers with Account 233.
Account 26 – Miscellaneous Equipment: Covers items not in the categories above. (This is
Account 25 in the original EEDB).
Acct 261 Transportation and lift equipment: Includes cranes and hoists. (Elevators with respective building accounts)
Acct 262 Air, Water, Plant Fuel Oil, and Steam Service systems
Acct 263 Communications Equipment: Includes telephones, radio, CCTV, strobe, public address, enunciator, and electronic access control and security systems.
Acct 264 Furnishing and Fixtures: Includes safety equipment, chemical laboratory, instrument shop equipment, maintenance shop equipment, office equipment and furnishings, change room, and dining facility equipment.
Account 27 - Special Materials: Covers non-fuel items such as heavy water, other special coolants,
salts, etc., needed before start-up.
Account 28 - Simulator(s): Generation IV systems will require the development and purchase of a new simulator for training operators.
Account 29 – Contingency –Direct Costs: An assessment of additional cost that is necessary to
achieve desired confidence level for the direct costs not to be exceeded. Contingency is usually applied at an aggregated level, although its determination may include
applying contingencies to individual high cost-impact items in the estimate. There are both deterministic and probabilistic methods for calculating its value. Deterministic methods require assessment of the maturity and complexity of the various aspects of the project and cost weighting of the base estimate. The probabilistic approach relies on statistical methods to determine uncertainty ranges for the key cost parameters affecting the base plus owner’s costs. Contingency must have a statistical level of confidence associated with it, e.g., an 80% chance that a total cost will not overrun the base plus contingency sum. Appendix A discusses the issues associated with contingency determination.
F.4 Indirect Costs
In the original EEDB COA structure the “ninety-X” series is reserved for the indirect costs of reactor construction. For the IAEA account system, it is the “thirty-X” and “forty-X” series. Nearly all these costs for the modified IAEA COA are associated with costs incurred by the
09/30/2005
- 139 -
architect/engineer/constructor firm that are not considered “hands-on” construction. In the U.S. the percentage of funding dedicated to this area has increased markedly for nuclear projects. More regulations and the need for more safety and quality assurance documentation have been the major contributors to this increase. For these accounts, the COA dictionary will be expressed at the two-digit (COA 3X and 4X) levels.
Account 3 – Capitalized Support Services Account 31 – Field Indirect Costs: This account includes cost of Construction equipment rental or
purchase, temporary buildings, shops, laydown areas, parking areas, tools, supplies, consumables, utilities, temporary construction, warehousing and other support services.
• Temporary construction facilities, such as site offices, warehouses, shops, trailers, portable
offices, portable restroom facilities, temporary worker housing, and tents. • Tools/heavy equipment used by craft workers, rented equipment, such as cranes,
bulldozers, graders, welders, etc. Typically equipment less than $1,000 is categorized as tools.
• Transport vehicles rented or allocated to the project, such as fuel trucks, flatbed trucks, large trucks, cement mixers, tanker trucks, official automobiles, buses, vans and light trucks.
• Expendable supplies, consumables and safety equipment. • Cost of utilities, office furnishings, office equipment, office supplies, radio
communications, mail service, phone service, construction insurance. • Construction support services, temporary installations, warehousing, material handling, site
cleanup, water delivery, road and parking areas maintenance, weather protection and repairs, snow clearing, maintenance of tools and equipment.
Account 32 - Construction supervision: This account covers the direct supervision of construction
(craft-performed) activities by the construction contractors or direct hire craft labor by the A/E contractor. The costs of the craft-laborers themselves are covered in the labor-hours component of the direct cost Accounts 21-28 or in Account 31 Field Indirect Costs. This account covers work done at the site in what are usually temporary or rented facilities. Includes non-manual staff for field engineering and supervision of construction activities performed by manual crafts. Other non-manual field staff is included with account 38 PM/CM Services on-site.
Account 33 - Commissioning and Start-up Costs: Includes costs incurred by the A/E, reactor
vendor, other equipment vendors and Owner or Owners representative for startup of plant. This account includes:
• Startup Procedure development. • Trial test run services (Account 37 under unmodified IAEA account system).
• Commissioning materials, consumables, tools, and equipment (Account 39 under unmodified IAEA account system).
• The utility’s (owner’s) pre-commissioning costs are covered elsewhere in the TCIC sum as a supplemental cost (Account 41).
•
09/30/2005
- 140 -
• Account 34 – Demonstration Test Run: All services necessary to perform the operation of the plant to demonstrate plant performance values and durations, including operations labor, consumables, spares and supplies.
Account 35 - Design Services Offsite: This account covers engineering, design, and layout work
that is not done at the reactor site, but at the architect/engineer/constructors’ home office and the equipment/reactor vendor’s home office. Often pre-construction design is included here. This project uses the IAEA format for standard plant (and equipment) design/construction/startup only, and not the FOAK design and certification effort. (FOAK work is in the one-time deployment phase of the project and not included in the standard plant direct costs. Design of the initial full size (FOAK) reactor, which will encompass multiple designs at several levels (pre-conceptual, conceptual, preliminary, etc.), will be a category of its own under FOAK cost and should be called out separately. Site-related engineering and engineering effort (project engineering) required during construction of particular systems which recur for all plants as well as Q/A costs related to design should be included here.
Account 36 – PM/CM Services Offsite: This account covers the costs for project management and management support on the above activities (Account 31) taking place at the reactor vendor, equipment suppliers’, and A/E’s home offices.
Account 37 – Design Services Onsite: These are the same items as in Account 35, except that they
are conducted at the plant site office or on-site temporary facilities instead of at offsite office. Additional services covered by the Account are purchasing and clerical services.
Account 38 - PM/CM Services Onsite: This account covers the costs for project management and
construction management support on the above activities (Account 33) taking place at the plant site. Includes staff for quality assurance, office administration, procurement, contract administration, HR department, labor relations, project control, medical and safety related activities.
Account 39 – Contingency – Support Services: An assessment of additional cost that is necessary
to achieve desired confidence level for the Support Services costs not to be exceeded. •
Account 4 – Capitalized Operations Cost •
Account 41 - Staff Recruitment and Training: This account should include costs for the recruitment and training of plant operators prior to plant start-up or commissioning activities (Account 37), or Demonstration Test Run (Account 38).
Account 42 – Staff Housing: Includes relocation costs, camps or permanent housing provided to
permanent plant operations and maintenance staff. Account 43 – Staff Salary Related Costs: Includes Taxes, Insurance, Fringes, Benefits, and any
other salary related costs. Account 44 – Other Owner Capitalized Costs:
• Account 49 – Contingency – Operations Costs: An assessment of additional costs that is necessary to achieve desired confidence level for the Operations costs not to be exceeded.
09/30/2005
- 141 -
Account 5 – Capitalized Supplementary Costs Account 51 – Shipping and Transportation Costs: Includes shipping and transportation costs for
major equipment or bulk shipments with freight forwarding. Account 52 – Spare Parts: Includes spare parts furnished by system suppliers for first year of
commercial operation. Excludes spares required for plant commissioning, startup or demonstration run. Account 53 – Taxes: Includes taxes associated with permanent plant such as property tax that is to
be capitalized with the plant. Account 54 – Insurance: Includes insurance costs associated with permanent plant that is to be
capitalized with the plant. Account 55 – Initial Core Load: This fuel is purchased by the utility before commissioning and is
assumed to be part of the TCIC. In the U.S. the initial core is not usually included in the design/construction (overnight) cost sum to which IDC (see below) is added. Since the first core, however, will likely have to be financed along with the design/construction/start-up costs, its cost is included in overnight costs in the present guidelines. The initial core cost is calculated with the formulas given in Chapter 8. This is a new account added to the modified IAEA account system.
Account 58 – Decommissioning Costs: Includes cost of decommissioning the plant at the end of
commercial operation if it is to be capitalized with the plant. Account 59 – Contingency – Supplementary Costs: An assessment of additional cost that is
necessary to achieve desired confidence level for the Capitalized Supplementary Costs not to be exceeded. The contingency for the Initial Core Load should not be applied to this item, since the contingency is already imbedded in the fuel cycle costs from the Fuel Cycle Model.
Account 6 – Capitalized Financial Costs Account 61 – Escalation: Typically excluded for a fixed year, constant dollar cost estimate. Account 62 – Fees: This account includes any fees or royalties applicable to plant that are to be
capitalized with the plant. Account 63 - Interest During Construction (IDC): This account is discussed in Chapter 6. IDC is
applied to the sum of all up-front costs, i.e., accounts: (1 through 5) base costs, including respective contingencies. These costs are incurred before commercial operation and are assumed to be financed by a “construction loan.” The IDC represents the “cost of the construction loan,” e.g., its interest.
Account 69 – Contingency – Capitalized Financial Costs: An assessment of additional cost that is
necessary to achieve desired confidence level for the Annualized O & M costs, including schedule, not to be exceeded.
Account 7 - Annualized O & M Cost: Account 71 Operations and Maintenance Staff: Salary costs of O&M Staff Account 72 Management Staff: Salary costs of Operations Management Staff
09/30/2005
- 142 -
Account 73 – Salary Related Costs: Includes Taxes, Insurance, Fringes, Benefits, and any other salary related costs.
Account 74 – Operations Chemicals, Lubricants and Radwaste Management: Account 75 – Spare Parts: Account 76 – Utilities, Supplies, Consumables and purchased services: Account 77 – Capital Upgrades: Account 78 – Taxes and Insurance: Account 79 – Contingency – Annualized O & M Costs: An assessment of additional costs that is
necessary to achieve desired confidence level for the Annualized O & M costs not to be exceeded. Account 8 – Annualized Fuel Cost Account 81 – Refueling Operations: Incremental costs associated with refueling operations that
are not included with regular O&M costs included with Account 7. Annualized costs from refueling cycles.
Account 84 – Nuclear Fuel: Annualized costs from refueling cycles. Account 86 – Fuel Reprocessing Charges: Includes costs associated with storage and reprocessing
charges for used fuel. Account 89 – Contingency – Annualized Fuel Costs: An assessment of additional cost that is
necessary to achieve desired confidence level for the Annualized Fuel Costs not to be exceeded. Account 9 – Annualized Financial Costs: Account 91 – Escalation: To be excluded from reported costs. Account 92 – Fees: Account 93 – Cost of Money: Account 99 – Contingency Annualized Financial Costs: An assessment of additional costs that is
necessary to achieve desired confidence level for the Annualized Financial Costs, including schedule, not to be exceeded.
F.5 Generalized Account Structure and Dictionary for Non-Reactor Capital Cost Estimates
It is recognized that most of the reactor fuels, fuel cycle services, and reactor components required for most Generation IV systems are not available today and are unlikely to be available in the next several years. There are also end use facilities for non-electric nuclear heat applications such as thermal hydrogen, desalination, and actinide partitioning facilities that also have not yet been designed. In the course of preparing the Generation IV economic models, however, cost estimates for new facilities designed to fulfill the above needs must be made. Below is the list of facilities for which life cycle (including TCIC) cost estimates will be needed.
09/30/2005
- 143 -
• New factories (or modifications to existing ones) to produce the reactors for modular concepts.
• Regional or national fuel cycle facilities that may serve many reactors of a given type: ü Aqueous fuel reprocessing plants ü MOX fuel fabrication plants (e.g., pelletized or vibropack fuel) ü MOX and U particle fuel fabrication plants (high-temperature reactors) ü Actinide partitioning facilities ü Spent fuel storage facilities ü High-level waste storage facilities
• Fuel cycle facilities that will serve only the reactors on the plant site: ü High-Pyrochemical reprocessing/re-fabrication facilities (e.g., for SFR/IFR) ü Waste packaging facilities ü On-site waste storage facilities ü In-line reprocessing facilities located within reactor area (e.g., for the MSR)
• Non-electric End Use Facilities associated with dedicated reactor(s): ü Thermochemical hydrogen production plant ü Electrolytic hydrogen production plant ü Water desalination facilities
At the 2-digit level the basic COA for these facilities can be nearly the same as for energy-
producing reactors. The biggest change would be in Accounts 22 and 23, which should now be called “Primary Process Equipment” as opposed to “Reactor Equipment.” and “Secondary Process Plant” as opposed to Turbine - Generator Equipment. Most other direct accounts (electrical, heat rejection/cooling, etc.) continue to support the basic process. The indirect accounts serve the same purpose for other processes as they do for the reactor.
As with the reactor, other life cycle costs must be calculated. For fuel cycle facilities it will be
necessary to calculate unit costs, such as $/kg heavy metal processed. Calculation of these unit costs requires distributing the capital and operating costs over a fixed number of reactors supported by the facility and its projected production lifetime. Chapter 8 discusses these fuel cycle costs. Similar unit cost calculations must also be done to obtain the costs of end-use commodities, such as hydrogen unit costs. Unit cost figures-of-merit for these end use facilities will be discussed in future EMWG documents.
Table F.1 Comparison of COA Structure for Reactor and Non-Reactor Facilities
(Capitalized Costs)
Acct A – REACTOR PLANT Acct B – FUEL FABRICATION PLANT A10 Capitalized Pre-construction Costs B10 Capitalized Pre-construction Costs A11 Land and Land Rights B11 Land and Land Rights A12 Site Permits B12 Site Permits A13 Plant Licensing B13 Plant Licensing A14 Plant Permits B14 Plant Permits A15 Plant Studies B15 Plant Studies A16 Plant Reports B16 Plant Reports A19 Contingency – Pre-Construction Cost B19 Contingency – Pre-Construction Cost A20 Capitalized Direct Costs B20 Capitalized Direct Costs A21 Structures and Improvements B21 Structures and Improvements A22 Reactor Equipment B22 Enrichment Plant A23 Turbine - Generator Equipment B23 Fuel Fabrication Plant
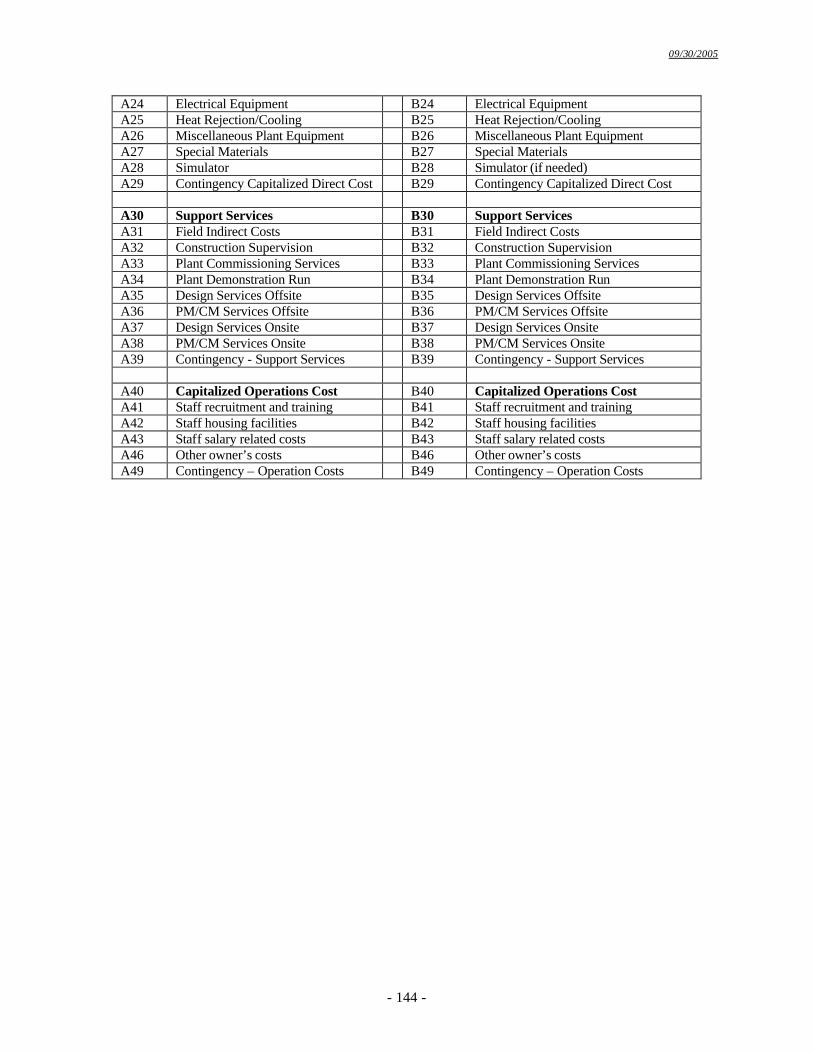
09/30/2005
- 144 -
A24 Electrical Equipment B24 Electrical Equipment A25 Heat Rejection/Cooling B25 Heat Rejection/Cooling A26 Miscellaneous Plant Equipment B26 Miscellaneous Plant Equipment A27 Special Materials B27 Special Materials A28 Simulator B28 Simulator (if needed) A29 Contingency Capitalized Direct Cost B29 Contingency Capitalized Direct Cost A30 Support Services B30 Support Services A31 Field Indirect Costs B31 Field Indirect Costs A32 Construction Supervision B32 Construction Supervision A33 Plant Commissioning Services B33 Plant Commissioning Services A34 Plant Demonstration Run B34 Plant Demonstration Run A35 Design Services Offsite B35 Design Services Offsite A36 PM/CM Services Offsite B36 PM/CM Services Offsite A37 Design Services Onsite B37 Design Services Onsite A38 PM/CM Services Onsite B38 PM/CM Services Onsite A39 Contingency - Support Services B39 Contingency - Support Services A40 Capitalized Operations Cost B40 Capitalized Operations Cost A41 Staff recruitment and training B41 Staff recruitment and training A42 Staff housing facilities B42 Staff housing facilities A43 Staff salary related costs B43 Staff salary related costs A46 Other owner’s costs B46 Other owner’s costs A49 Contingency – Operation Costs B49 Contingency – Operation Costs
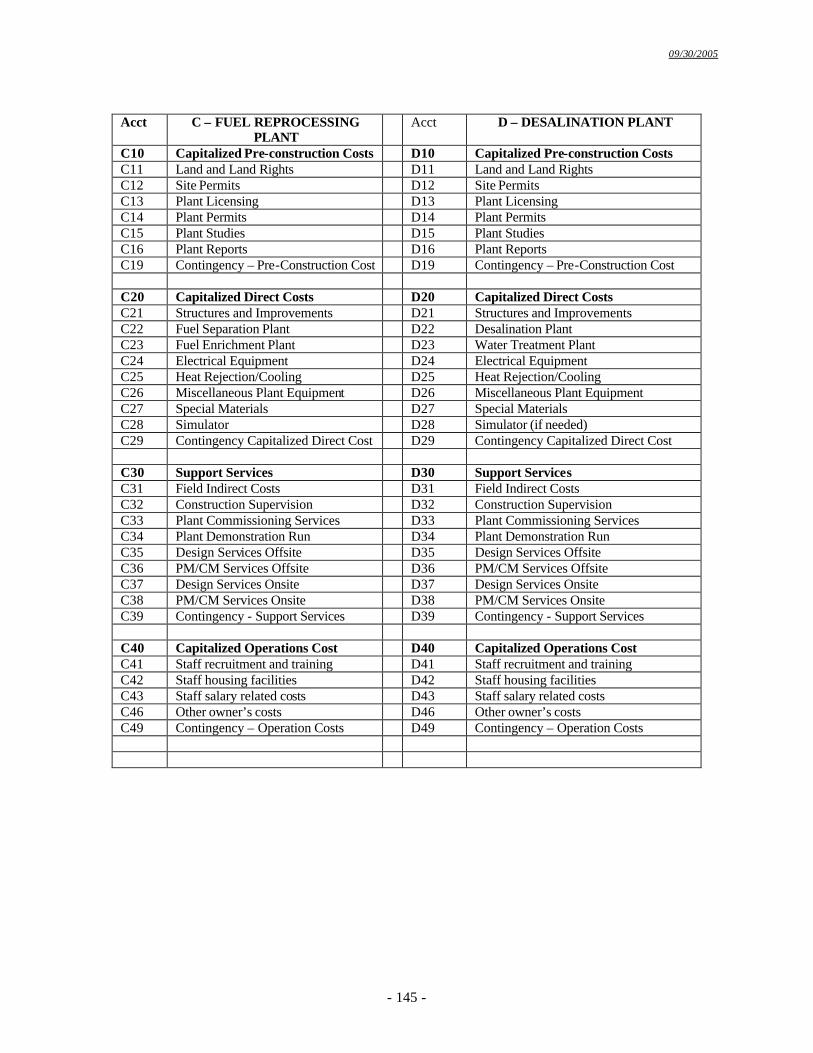
09/30/2005
- 145 -
Acct C – FUEL REPROCESSING
PLANT Acct D – DESALINATION PLANT
C10 Capitalized Pre-construction Costs D10 Capitalized Pre-construction Costs C11 Land and Land Rights D11 Land and Land Rights C12 Site Permits D12 Site Permits C13 Plant Licensing D13 Plant Licensing C14 Plant Permits D14 Plant Permits C15 Plant Studies D15 Plant Studies C16 Plant Reports D16 Plant Reports C19 Contingency – Pre-Construction Cost D19 Contingency – Pre-Construction Cost C20 Capitalized Direct Costs D20 Capitalized Direct Costs C21 Structures and Improvements D21 Structures and Improvements C22 Fuel Separation Plant D22 Desalination Plant C23 Fuel Enrichment Plant D23 Water Treatment Plant C24 Electrical Equipment D24 Electrical Equipment C25 Heat Rejection/Cooling D25 Heat Rejection/Cooling C26 Miscellaneous Plant Equipment D26 Miscellaneous Plant Equipment C27 Special Materials D27 Special Materials C28 Simulator D28 Simulator (if needed) C29 Contingency Capitalized Direct Cost D29 Contingency Capitalized Direct Cost C30 Support Services D30 Support Services C31 Field Indirect Costs D31 Field Indirect Costs C32 Construction Supervision D32 Construction Supervision C33 Plant Commissioning Services D33 Plant Commissioning Services C34 Plant Demonstration Run D34 Plant Demonstration Run C35 Design Services Offsite D35 Design Services Offsite C36 PM/CM Services Offsite D36 PM/CM Services Offsite C37 Design Services Onsite D37 Design Services Onsite C38 PM/CM Services Onsite D38 PM/CM Services Onsite C39 Contingency - Support Services D39 Contingency - Support Services C40 Capitalized Operations Cost D40 Capitalized Operations Cost C41 Staff recruitment and training D41 Staff recruitment and training C42 Staff housing facilities D42 Staff housing facilities C43 Staff salary related costs D43 Staff salary related costs C46 Other owner’s costs D46 Other owner’s costs C49 Contingency – Operation Costs D49 Contingency – Operation Costs
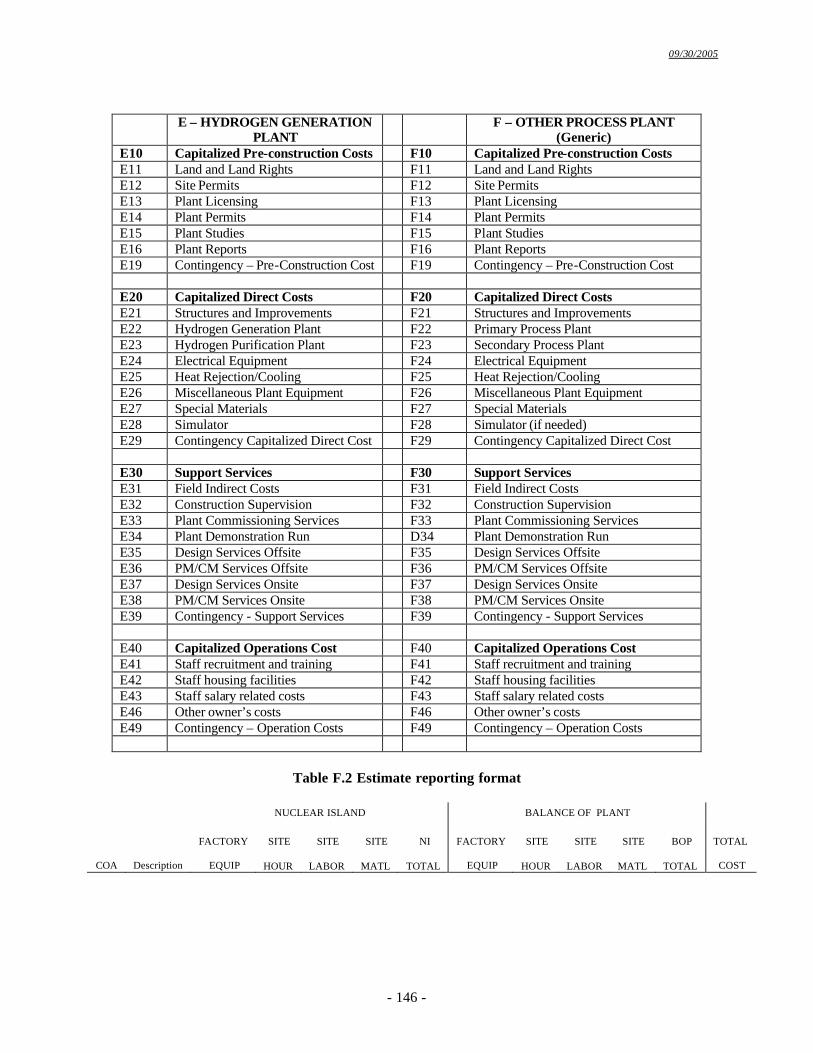
09/30/2005
- 146 -
E – HYDROGEN GENERATION
PLANT F – OTHER PROCESS PLANT
(Generic) E10 Capitalized Pre-construction Costs F10 Capitalized Pre-construction Costs E11 Land and Land Rights F11 Land and Land Rights E12 Site Permits F12 Site Permits E13 Plant Licensing F13 Plant Licensing E14 Plant Permits F14 Plant Permits E15 Plant Studies F15 Plant Studies E16 Plant Reports F16 Plant Reports E19 Contingency – Pre-Construction Cost F19 Contingency – Pre-Construction Cost E20 Capitalized Direct Costs F20 Capitalized Direct Costs E21 Structures and Improvements F21 Structures and Improvements E22 Hydrogen Generation Plant F22 Primary Process Plant E23 Hydrogen Purification Plant F23 Secondary Process Plant E24 Electrical Equipment F24 Electrical Equipment E25 Heat Rejection/Cooling F25 Heat Rejection/Cooling E26 Miscellaneous Plant Equipment F26 Miscellaneous Plant Equipment E27 Special Materials F27 Special Materials E28 Simulator F28 Simulator (if needed) E29 Contingency Capitalized Direct Cost F29 Contingency Capitalized Direct Cost E30 Support Services F30 Support Services E31 Field Indirect Costs F31 Field Indirect Costs E32 Construction Supervision F32 Construction Supervision E33 Plant Commissioning Services F33 Plant Commissioning Services E34 Plant Demonstration Run D34 Plant Demonstration Run E35 Design Services Offsite F35 Design Services Offsite E36 PM/CM Services Offsite F36 PM/CM Services Offsite E37 Design Services Onsite F37 Design Services Onsite E38 PM/CM Services Onsite F38 PM/CM Services Onsite E39 Contingency - Support Services F39 Contingency - Support Services E40 Capitalized Operations Cost F40 Capitalized Operations Cost E41 Staff recruitment and training F41 Staff recruitment and training E42 Staff housing facilities F42 Staff housing facilities E43 Staff salary related costs F43 Staff salary related costs E46 Other owner’s costs F46 Other owner’s costs E49 Contingency – Operation Costs F49 Contingency – Operation Costs
Table F.2 Estimate reporting format
NUCLEAR ISLAND BALANCE OF PLANT
FACTORY SITE SITE SITE NI
FACTORY SITE SITE SITE BOP
TOTAL
COA Description EQUIP
HOUR
LABOR
MATL
TOTAL EQUIP
HOUR
LABOR
MATL
TOTAL COST
09/30/2005
- 147 -
References Delene, J.G. and Hudson, C.R., 1993, Cost Estimate Guidelines for Advanced Nuclear Power Technologies; ORNL/TM-10071/R3, Oak Ridge National Laboratory, Oak ridge, TN, USA, May 1993. IAEA, 2000, Economic Evaluation of Bids for Nuclear Power Plants: 1999 Edition, Technical Reports Series No. 396, International Atomic Energy Agency; Vienna, Austria. ORNL, 1988, Technical Reference Book for the Energy Economic Data Base Program EEDB-IX (1987); DOE/NE-0092, Prepared by United Engineers and Constructors, Inc., Philadelphia, PA, under the direction of Oak Ridge National Laboratory, Oak Ridge, TN, USA, July 1988. Reed Business, 1992, Means Building Construction Cost Data, Reed Business Information Co. Whitman, Requardt, & Associates, 1992, The Handy-Whitman Index of Public Utility Construction Costs, Bulletin No. 154, Baltimore, MD, USA.