Embed Size (px)
Citation preview
5/30/2017
1
Cost-Modeling for CBO Services for Healthcare
Partnership Success
Sharon Fusco, M.A., Vice President–Business Services Group, Council on Aging of Southwestern
Ohio
Part of the Aging and Disability Business Institute Series- a collaboration of n4a and ASA
5/30/2017
2
The “Business Institute”
The mission of the Aging and Disability Business Institute (Business Institute) is to successfully build and strengthen partnerships between community-based organizations (CBOs) and the health care system so older adults and people with disabilities will have access to services and supports that will enable them to live with dignity and independence in their homes and communities as long as possible.
www.aginganddisabilitybusinessinstitute.org
Partners and Funders
Partners:
• National Association of Area Agencies on Aging
• Independent Living Research Utilization/National Center for Aging and Disability
• American Society on Aging
• Partners in Care Foundation
• Elder Services of the Merrimack Valley/Healthy Living Center of Excellence
Funders:
• Administration for Community Living
• The John A. Hartford Foundation
• The SCAN Foundation
• The Gary and Mary West Foundation
• The Colorado Health Foundation
• The Marin Community Foundation
5/30/2017
3
Today’s Objectives
• Comprehend the basics of various cost-and price-modeling strategies for CBOs;
• Understand how to translate their organization’s work into the elements of a price model; and,
• Explain why developing a price model can benefit a CBO in today’s integrated care environment.
Why construct Models?
5/30/2017
4
Why model?
We model to prepare for the future and know:
we are able to offer the highest quality services
at a competitive price
to maintain market share and profit margin (stay with
me here – I’ll come back to this point).
Bottom line: Can I afford to sell my products for the price the
market is willing to pay?
Why Model?
• Using models can answer the “what if” questions we have to
answer when determining what it will take to achieve
promised outcomes for a given price.
• What if I staff a program with an LSW instead of an RN?
• What if I increase case load sizes?
• What if the volume changes?
5/30/2017
5
Basic Definitions
Basic Definitions
• Cost -- the amount spent to produce a good or service.
Cost = the sum of the value of the inputs in production – labor, land, capital , etc.
• Price -- the amount of money that consumers have to give up to acquire a good or service; the sum of money asked or paid for a good or service.
5/30/2017
6
Basic Definitions
• Assumptions – Estimates based on experience and
research about how we conduct our business. Assumptions come from how we define our work and are used in “what if” scenarios.
Examples from our work:
• Caseloads will be 65 clients to 1 care manager.
• We will hire 1 case aid to support 15 care managers.
• We will hire only RNs.
• We will remain in the same facility.
• The volume of clients will increase by 5% annually.
Fixed vs. Variable Costs
• Fixed Cost – does not change as volumes increase.
• Example from our work: rent
• Variable Costs – Rises and falls as volume increases or decreases.
• Example from our work: the number of care managers we hire.
5/30/2017
7
Direct vs. Indirect Costs
• Direct Cost – Expensed or connected easily to providing the service
• Example from our work:
• Variable: Care Manager Salaries
• Fixed: Care Management Software System
• Indirect Cost – Not easily traced to providing the service
• Example from our work:
• Variable: Cost of providing IT support.
• Fixed: Rent, insurance
Contingency and Margin
• Contingency – Used to cover uncertainty. The more “conservative” (or certain) the model, the less contingency required.
May be added into the cost of item or included as a separate line item.
Margin – A ratio of profitability calculated as net income divided by revenues, or net profits divided by sales. It measures how much out of every dollar of sales a company actually keeps in earnings.
5/30/2017
8
Constructing Your Model
Step 1: Define the Service
• What is the service – precisely defined that the customer wants to buy?
• Services required to achieve an outcome?
• Functions required to perform the service?
• Time required to perform the function?
• Level of staff required to perform the function at level required to achieve outcome?
• Other resources required to perform the function to achieve the desired outcome?
• What special requirements might a customer want that will add cost to providing the service?
• What is the value add of the service – why will a customer buy this service?
“If not out front defining your vision, your opponent will spend gobs of money to define it for you.”
~Donna Brazile
5/30/2017
9
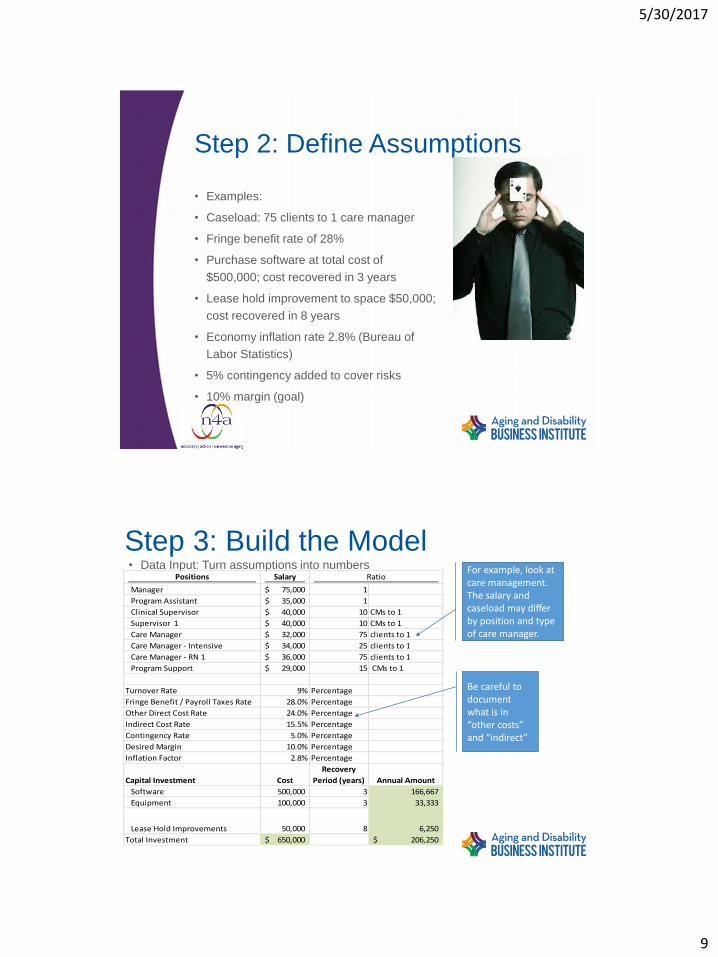
Step 2: Define Assumptions
• Examples:
• Caseload: 75 clients to 1 care manager
• Fringe benefit rate of 28%
• Purchase software at total cost of
$500,000; cost recovered in 3 years
• Lease hold improvement to space $50,000;
cost recovered in 8 years
• Economy inflation rate 2.8% (Bureau of
Labor Statistics)
• 5% contingency added to cover risks
• 10% margin (goal)
• Data Input: Turn assumptions into numbers
Step 3: Build the ModelPositions Salary
Manager 75,000$ 1
Program Assistant 35,000$ 1
Clinical Supervisor 40,000$ 10 CMs to 1
Supervisor 1 40,000$ 10 CMs to 1
Care Manager 32,000$ 75 clients to 1
Care Manager - Intensive 34,000$ 25 clients to 1
Care Manager - RN 1 36,000$ 75 clients to 1
Program Support 29,000$ 15 CMs to 1
Turnover Rate 9% Percentage
Fringe Benefit / Payroll Taxes Rate 28.0% Percentage
Other Direct Cost Rate 24.0% Percentage
Indirect Cost Rate 15.5% Percentage
Contingency Rate 5.0% Percentage
Desired Margin 10.0% Percentage
Inflation Factor 2.8% Percentage
Capital Investment Cost
Recovery
Period (years) Annual Amount
Software 500,000 3 166,667
Equipment 100,000 3 33,333
Lease Hold Improvements 50,000 8 6,250
Total Investment 650,000$ 206,250$
RatioFor example, look at care management. The salary and caseload may differ by position and type of care manager.
Be careful to document what is in “other costs” and “indirect”
5/30/2017
10
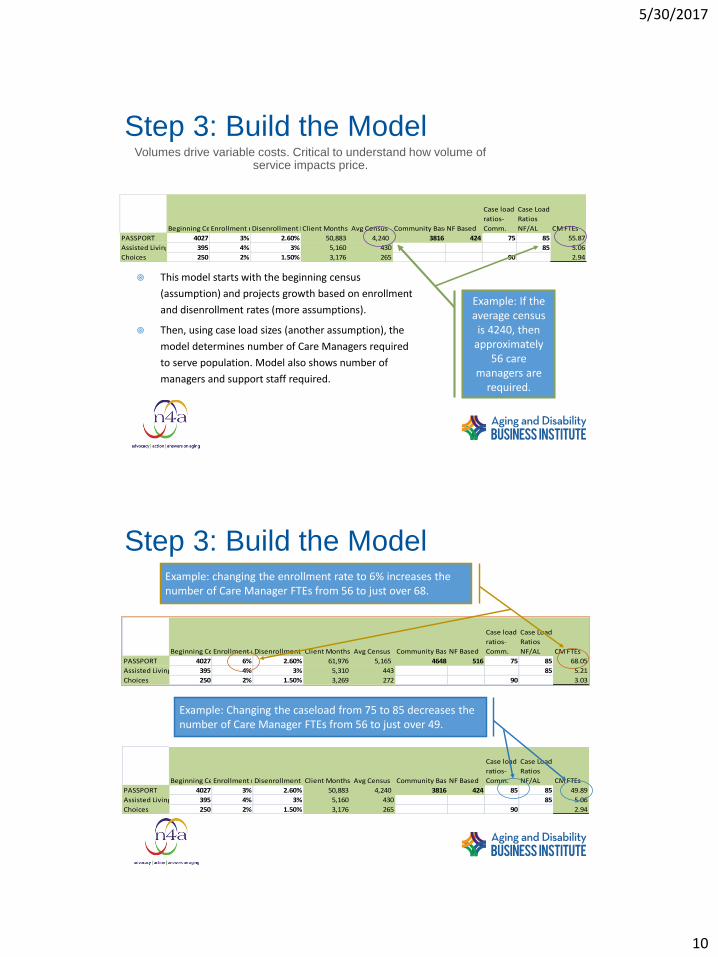
Step 3: Build the ModelVolumes drive variable costs. Critical to understand how volume of
service impacts price.
Beginning CensusEnrollment rateDisenrollment RateClient Months Avg Census Community BasedNF Based
Case load
ratios-
Comm.
Case Load
Ratios
NF/AL CM FTEs
PASSPORT 4027 3% 2.60% 50,883 4,240 3816 424 75 85 55.87
Assisted Living 395 4% 3% 5,160 430 85 5.06
Choices 250 2% 1.50% 3,176 265 90 2.94
This model starts with the beginning census
(assumption) and projects growth based on enrollment
and disenrollment rates (more assumptions).
Then, using case load sizes (another assumption), the
model determines number of Care Managers required
to serve population. Model also shows number of
managers and support staff required.
Example: If the average census
is 4240, then approximately
56 care managers are
required.
Step 3: Build the Model
Beginning CensusEnrollment rateDisenrollment RateClient Months Avg Census Community BasedNF Based
Case load
ratios-
Comm.
Case Load
Ratios
NF/AL CM FTEs
PASSPORT 4027 6% 2.60% 61,976 5,165 4648 516 75 85 68.05
Assisted Living 395 4% 3% 5,310 443 85 5.21
Choices 250 2% 1.50% 3,269 272 90 3.03
Beginning CensusEnrollment rateDisenrollment RateClient Months Avg Census Community BasedNF Based
Case load
ratios-
Comm.
Case Load
Ratios
NF/AL CM FTEs
PASSPORT 4027 3% 2.60% 50,883 4,240 3816 424 85 85 49.89
Assisted Living 395 4% 3% 5,160 430 85 5.06
Choices 250 2% 1.50% 3,176 265 90 2.94
Example: changing the enrollment rate to 6% increases the number of Care Manager FTEs from 56 to just over 68.
Example: Changing the caseload from 75 to 85 decreases the number of Care Manager FTEs from 56 to just over 49.
5/30/2017
11
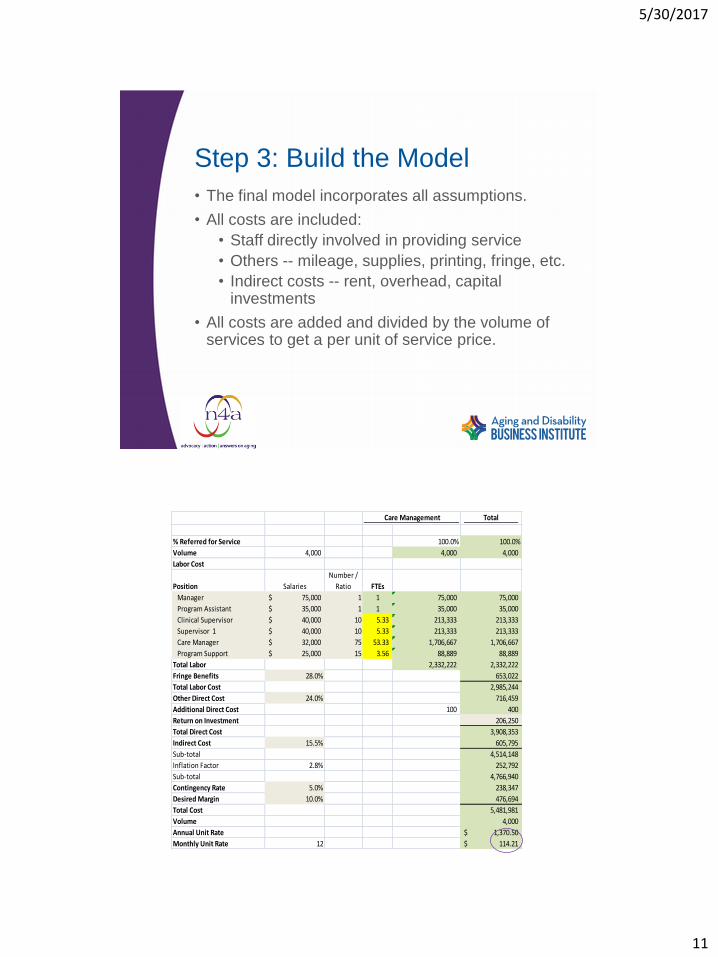
Step 3: Build the Model
• The final model incorporates all assumptions.
• All costs are included:
• Staff directly involved in providing service
• Others -- mileage, supplies, printing, fringe, etc.
• Indirect costs -- rent, overhead, capital investments
• All costs are added and divided by the volume of services to get a per unit of service price.
Total
% Referred for Service 100.0% 100.0%
Volume 4,000 4,000 4,000
Labor Cost
Position Salaries
Number /
Ratio FTEs
Manager 75,000$ 1 1 75,000 75,000
Program Assistant 35,000$ 1 1 35,000 35,000
Clinical Supervisor 40,000$ 10 5.33 213,333 213,333
Supervisor 1 40,000$ 10 5.33 213,333 213,333
Care Manager 32,000$ 75 53.33 1,706,667 1,706,667
Program Support 25,000$ 15 3.56 88,889 88,889
Total Labor 2,332,222 2,332,222
Fringe Benefits 28.0% 653,022
Total Labor Cost 2,985,244
Other Direct Cost 24.0% 716,459
Additional Direct Cost 100 400
Return on Investment 206,250
Total Direct Cost 3,908,353
Indirect Cost 15.5% 605,795
Sub-total 4,514,148
Inflation Factor 2.8% 252,792
Sub-total 4,766,940
Contingency Rate 5.0% 238,347
Desired Margin 10.0% 476,694
Total Cost 5,481,981
Volume 4,000
Annual Unit Rate 1,370.50$
Monthly Unit Rate 12 114.21$
Care Management
5/30/2017
12
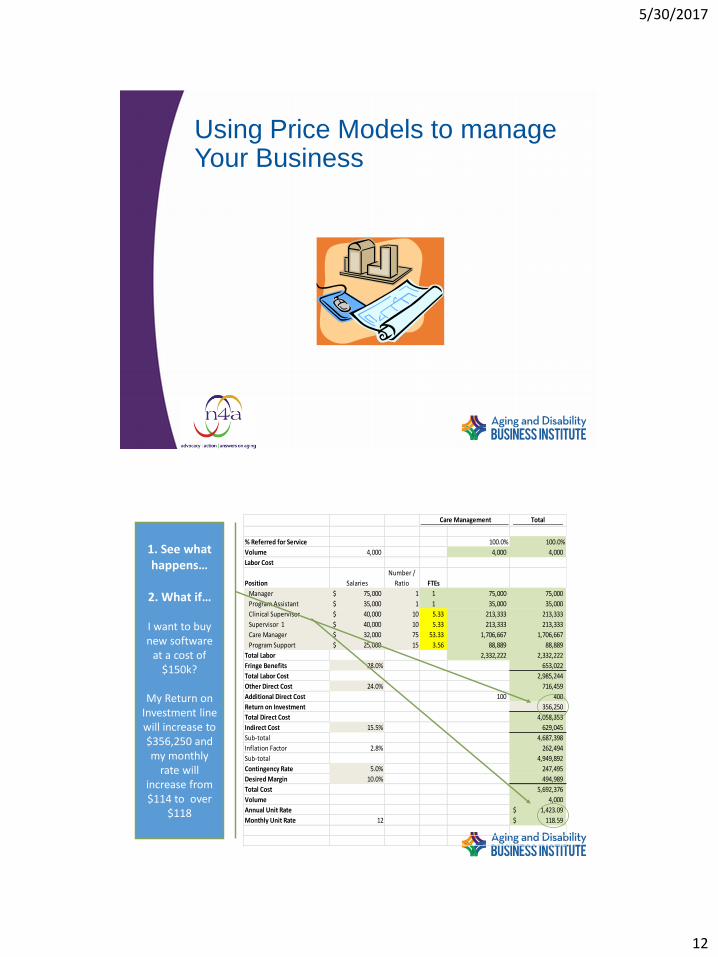
Using Price Models to manage Your Business
Total
% Referred for Service 100.0% 100.0%
Volume 4,000 4,000 4,000
Labor Cost
Position Salaries
Number /
Ratio FTEs
Manager 75,000$ 1 1 75,000 75,000
Program Assistant 35,000$ 1 1 35,000 35,000
Clinical Supervisor 40,000$ 10 5.33 213,333 213,333
Supervisor 1 40,000$ 10 5.33 213,333 213,333
Care Manager 32,000$ 75 53.33 1,706,667 1,706,667
Program Support 25,000$ 15 3.56 88,889 88,889
Total Labor 2,332,222 2,332,222
Fringe Benefits 28.0% 653,022
Total Labor Cost 2,985,244
Other Direct Cost 24.0% 716,459
Additional Direct Cost 100 400
Return on Investment 356,250
Total Direct Cost 4,058,353
Indirect Cost 15.5% 629,045
Sub-total 4,687,398
Inflation Factor 2.8% 262,494
Sub-total 4,949,892
Contingency Rate 5.0% 247,495
Desired Margin 10.0% 494,989
Total Cost 5,692,376
Volume 4,000
Annual Unit Rate 1,423.09$
Monthly Unit Rate 12 118.59$
Care Management
1. See what happens…
2. What if…
I want to buy new software
at a cost of $150k?
My Return on Investment line will increase to $356,250 and my monthly
rate will increase from $114 to over
$118
5/30/2017
13
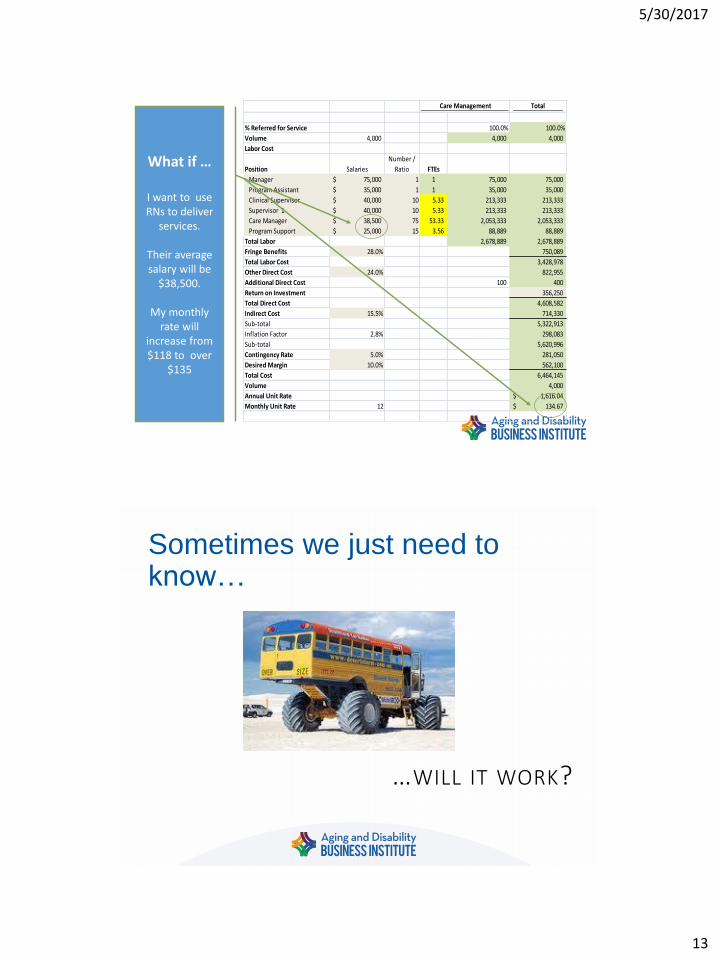
Total
% Referred for Service 100.0% 100.0%
Volume 4,000 4,000 4,000
Labor Cost
Position Salaries
Number /
Ratio FTEs
Manager 75,000$ 1 1 75,000 75,000
Program Assistant 35,000$ 1 1 35,000 35,000
Clinical Supervisor 40,000$ 10 5.33 213,333 213,333
Supervisor 1 40,000$ 10 5.33 213,333 213,333
Care Manager 38,500$ 75 53.33 2,053,333 2,053,333
Program Support 25,000$ 15 3.56 88,889 88,889
Total Labor 2,678,889 2,678,889
Fringe Benefits 28.0% 750,089
Total Labor Cost 3,428,978
Other Direct Cost 24.0% 822,955
Additional Direct Cost 100 400
Return on Investment 356,250
Total Direct Cost 4,608,582
Indirect Cost 15.5% 714,330
Sub-total 5,322,913
Inflation Factor 2.8% 298,083
Sub-total 5,620,996
Contingency Rate 5.0% 281,050
Desired Margin 10.0% 562,100
Total Cost 6,464,145
Volume 4,000
Annual Unit Rate 1,616.04$
Monthly Unit Rate 12 134.67$
Care Management
What if …
I want to use RNs to deliver
services.
Their average salary will be
$38,500.
My monthly rate will
increase from $118 to over
$135
Sometimes we just need to know…
…WILL IT WORK?
5/30/2017
14
Using models to Manage your business – concluding remarks
• A tool for making the business case of net benefit to the MCO or hospital client that results from the AAA’s service
• Fee or Price – Cost of Status Quo = Net Benefit to MCO
• Fees Paid by MCO to Receive AAA Service < Value to MCO
• Buy Net Benefit > Make Net Benefit
• What MCO or hospital will pay AAA is constrained by state Medicaid policy and budget decisions, sometimes Medicare
• AAA services delivered must result in financial benefit (profit) to the AAA organization
• A continuum of financial skills to be acquired before risk-based capitation; start with fee-for-service
Concluding wisdom –Wait a minute…
Earlier did you say “profit margin”?
• Yes.
• But we are non-profits, isn’t that illegal?
• No.
• Non-profits that earn revenue put their revenue back into programs and services to provide Better Service to More Clients.
Disclaimer to make the CFO’s happy: There is a bit more to it and there are a fewrules, but as long as they are followed, it’s okay for a nonprofit to bring in more thanit costs them to provide services.
5/30/2017
15
But wait, there’s more…
• We are nonprofits…
• Why should we be concerned about being “competitive” and having a “market share”?
• Because:
• Aging and disabilities is a hot market!
High and growing demand + low supply = profit potential.
• Others believe they can do it better.
• Others can do it at a lower cost.
• Others can do it and make money at it.
AND…
By Playing to Win…
…WE CAN CONTINUE TO SERVE OUR CLIENTS!

5/30/2017
16
Questions & Answers: Please Submit Using the “Questions”
Box
Questions about the Aging and Disability Business Institute?
Email us: