Embed Size (px)
Citation preview

Cost of Capital Study 2017Diverging markets – converging business models

Table of ContentsPreface 3
Summary of Findings 6
1 Introduction 8
2 Derivation of the Cash Flows 122.1 Preparation of the Financial Forecasts 132.2 Growth Expectations 182.3 Determination of the Expected Values 202.4 Consideration of Risks 212.5 Determination of the Sustainable Year 25
3 Determination of the Cost of Capital Parameters 26
3.1 WACC Overview 273.2 Risk-free Rate 313.3 Market Risk Premium 333.4 Beta Factor 363.5 Cost of Equity 403.6 Other Risk Premiums 413.7 Consideration of Risk in the
Cost of Capital 443.8 Cost of Debt and Debt Ratio 473.9 Sustainable Growth Rate 50
4 Impairment Test 524.1 Trigger and Results 534.2 Determination of the Recoverable
Amount 544.3 Plausibility 56
5 Relevance of Value and Enhancement of Value 60
5.1 Criteria for Investment Decisions 615.2 Monitoring the Enhancement of Value 625.3 Cost of Capital in the Capital Market
Communication 63
6 Online Industry Analyses 64
List of Abbreviations 69
Your Industry Specialists 70
This study is an empirical investigation with the aim of analyzing management practices. Information provided and explanations offered by the study do not offer a complete picture for deriving financial forecasts or costs of capital nor for proper actions or interpretation of the requirements for impairment tests, other accounting-related questions or business valuations.
© 2
018
KP
MG
Inte
rnat
iona
l Co
op
erat
ive
(“K
PM
G In
tern
atio
nal”
), a
Sw
iss
enti
ty. M
emb
er f
irm
s of
the
KP
MG
net
wor
k of
ind
epen
den
t fi
rms
ar
e af
filia
ted
wit
h K
PM
G In
tern
atio
nal.
All
righ
ts r
eser
ved
. The
KP
MG
nam
e an
d lo
go
are
regi
ster
ed
trad
emar
ks o
f K
PM
G In
tern
atio
nal.
Table of Contents
Summary Introduction Cash Flows
Cost of Capital Parameters
Impairment Test
Company Values
Online Industry Analyses
Industry Specialists
PrefaceDear readers,
It is our pleasure to present you with the results of the twelfth edition of our Cost of Capital Study. With 205 companies (compared to 196 companies in the previous year) – 26 of which are DAX-30 cor-porations – more companies than ever before par-ticipated in the study. We would like to express our heartfelt gratitude to all those companies who took part. The large number of participants demonstrates that the study has become a fixed component in your practical valuation work. We therefore hope that this year, once again, the study and the key topics will be of particular interest to you.
In the current issue, we examine the challenges of increasing macroeconomic uncertainties and microeconomic changes resulting from disruptive business models both with regard to the future per-formance of companies (financial forecast) as well as on their future risk profile (cost of capital).
Consequently, we chose the motto “Diverging mar-kets – converging business models” for this year’s Cost of Capital Study. Based on this motto, we focus on the following subjects:
– Macroeconomic uncertainties – part of financial forecasts
– Microeconomic change – predictability of disruptive business models
– Cost of capital – the challenges of low interest rates, populism, and new technologies (guest commentary by Stefan Hofrichter, Allianz Global Investors GmbH)
– Cost of capital – comparative measures in a world that increasingly defies comparison
– New valuation methods in disruptive times?
Due to the fact that the financial impacts of decisions also have to be objectively reflected in accounting, the collection of empirical information continues to be oriented on the Impairment Test of the International Financial Reporting Standards (IFRS), because it – and the valuation associated with it – is obligatory for every IFRS user. Our anal-yses do not, however, consist only of the compiling of forecasted cash flows and cost of capital para-meters, but also of the relevance of company values and their development in the decision-making and the capital market communication.
For the first time, we have also included analyses for family-owned businesses and non-family-owned businesses. Supplementary to the current study, we would like to direct you to the interactive oppor-tunities for analysis of the data on our website at www.kpmg.de/cost-of-capital. There you can compile the parameters relevant for your company and/or industry and therefore perform your own, tailor-made assessment.
We hope that this year’s Cost of Capital Study also meets your expectations and serves as interesting reading. We would gladly discuss the results with you in the framework of a personal appointment and are, of course, available for any questions and com-ments you may wish to offer.
With best regards,
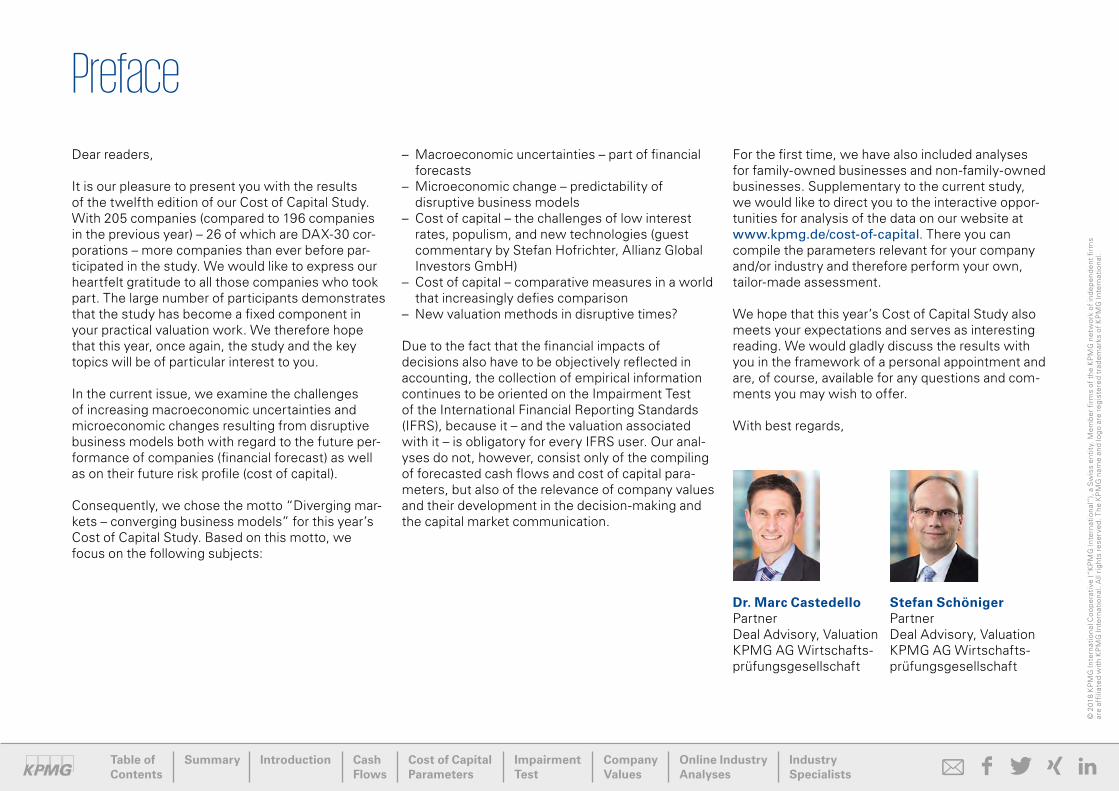
Dr. Marc CastedelloPartnerDeal Advisory, ValuationKPMG AG Wirtschafts- prüfungsgesellschaft
Stefan SchönigerPartnerDeal Advisory, ValuationKPMG AG Wirtschafts- prüfungsgesellschaft
© 2
018
KP
MG
Inte
rnat
iona
l Co
op
erat
ive
(“K
PM
G In
tern
atio
nal”
), a
Sw
iss
enti
ty. M
emb
er f
irm
s of
the
KP
MG
net
wor
k of
ind
epen
den
t fi
rms
ar
e af
filia
ted
wit
h K
PM
G In
tern
atio
nal.
All
righ
ts r
eser
ved
. The
KP
MG
nam
e an
d lo
go
are
regi
ster
ed
trad
emar
ks o
f K
PM
G In
tern
atio
nal.
Table of Contents
Summary Introduction Cash Flows
Cost of Capital Parameters
Impairment Test
Company Values
Online Industry Analyses
Industry Specialists
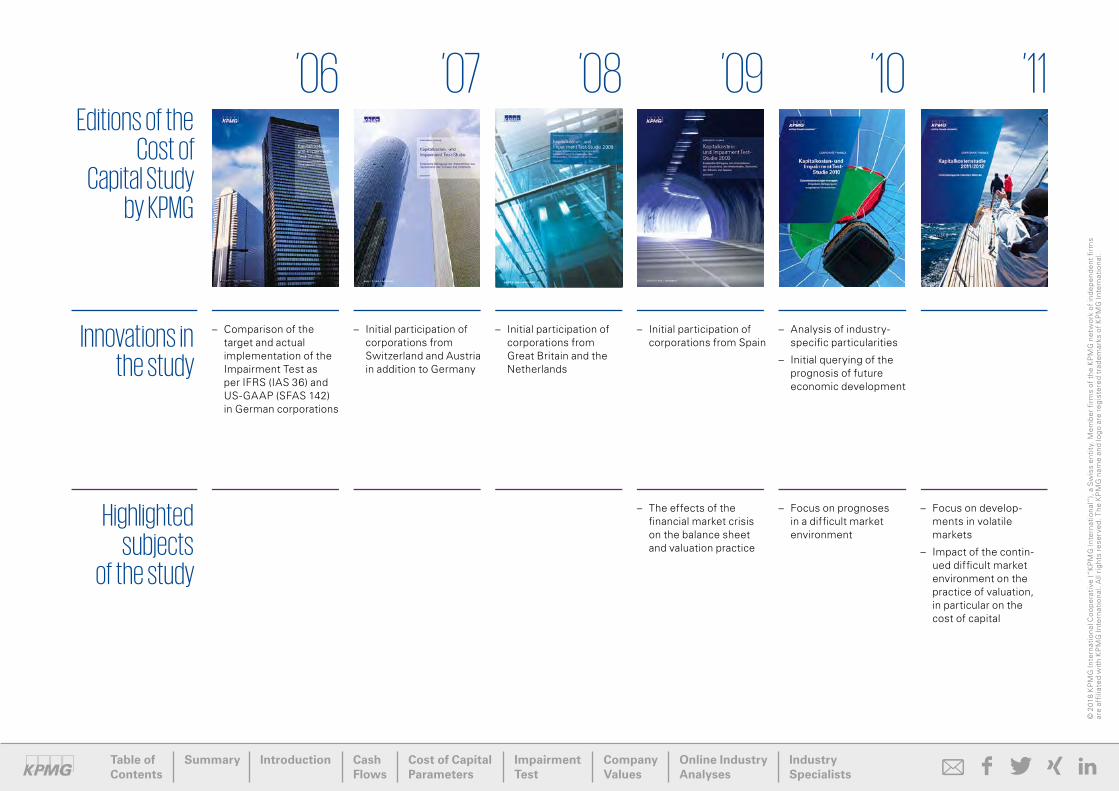
Editions of the Cost of
Capital Study by KPMG
Innovations in the study
Highlighted subjects
of the study
’06
– Comparison of the target and actual implementation of the Impairment Test as per IFRS (IAS 36) and US-GAAP (SFAS 142) in German corporations
’07
– Initial participation of corporations from Switzerland and Austria in addition to Germany
’08
– Initial participation of corporations from Great Britain and the Netherlands
’09
– Initial participation of corporations from Spain
– The effects of the financial market crisis on the balance sheet and valuation practice
’10
– Analysis of industry- specific particularities
– Initial querying of the prognosis of future economic development
– Focus on prognoses in a difficult market environment
’11
– Focus on develop-ments in volatile markets
– Impact of the contin-ued difficult market environment on the practice of valuation, in particular on the cost of capital
© 2
018
KP
MG
Inte
rnat
iona
l Co
op
erat
ive
(“K
PM
G In
tern
atio
nal”
), a
Sw
iss
enti
ty. M
emb
er f
irm
s of
the
KP
MG
net
wor
k of
ind
epen
den
t fi
rms
ar
e af
filia
ted
wit
h K
PM
G In
tern
atio
nal.
All
righ
ts r
eser
ved
. The
KP
MG
nam
e an
d lo
go
are
regi
ster
ed
trad
emar
ks o
f K
PM
G In
tern
atio
nal.
Table of Contents
Summary Introduction Cash Flows
Cost of Capital Parameters
Impairment Test
Company Values
Online Industry Analyses
Industry Specialists

’12Kapitalkostenstudie 2016Wertmessung – quo vadis ?
– Initial querying of the transaction behavior and intentions of companies
– Focus on managing uncertainty
’13
– First extensive industry analyses
– Impact of volatility on financial forecasts
– Interaction of risk-free rate and market risk premium
– Other risk premiums
– Sustainable growth rate
’14
– Detailed analyses for every industry
– Consideration of risk in the derivation of cash flows
– Risk equivalence in determining the cost of capital
– Small cap premium
– Debt beta: Sharing of risk between financiers
’15
– Study layout in tablet-friendly landscape format
– Possibility of individual analysis and data query with an Internet platform
– Corporate Economic Decision Assessment
– Consideration of performance and risk drivers
– Stress testing in times of higher volatility
– Quantification of operative risks
– Effects of the low-interest phase
– Paradigm shift in the determina-tion of the market risk premium
– Value enhancement as a decision-making metric
’16
– Significant expansion in the number of participating companies
– Expansion of the Internet-based opportunities for analysis
– New methods for value measurement?!
– Big data and business analytics tools
– Risk transparency and risk management
– Value-based management systems 2.0
’17
– Assessment by family and non-family-owned businesses
– Provision of extensive industry analyses with the online assessment tool
– Detailed analyses of the sectors consumer markets, chemicals & pharmaceuticals, financial services and media & telecom-munications
Kapitalkostenstudie 2017Divergierende Märkte – konvergierende Geschäftsmodelle
© 2
018
KP
MG
Inte
rnat
iona
l Co
op
erat
ive
(“K
PM
G In
tern
atio
nal”
), a
Sw
iss
enti
ty. M
emb
er f
irm
s of
the
KP
MG
net
wor
k of
ind
epen
den
t fi
rms
ar
e af
filia
ted
wit
h K
PM
G In
tern
atio
nal.
All
righ
ts r
eser
ved
. The
KP
MG
nam
e an
d lo
go
are
regi
ster
ed
trad
emar
ks o
f K
PM
G In
tern
atio
nal.
Table of Contents
Summary Introduction Cash Flows
Cost of Capital Parameters
Impairment Test
Company Values
Online Industry Analyses
Industry Specialists
– Macroeconomic uncertainties – part of financial forecasts
– Microeconomic change – predictability of disruptive business models
– Cost of capital – the challenges of low interest rates, populism, and new technologies
– Cost of capital – comparative measures in a world that increasingly defies comparison
– New valuation methods in disruptive times?

Summary of Findings
© 2
018
KP
MG
Inte
rnat
iona
l Co
op
erat
ive
(“K
PM
G In
tern
atio
nal”
), a
Sw
iss
enti
ty. M
emb
er f
irm
s of
the
KP
MG
net
wor
k of
ind
epen
den
t fi
rms
ar
e af
filia
ted
wit
h K
PM
G In
tern
atio
nal.
All
righ
ts r
eser
ved
. The
KP
MG
nam
e an
d lo
go
are
regi
ster
ed
trad
emar
ks o
f K
PM
G In
tern
atio
nal.
Table of Contents
Summary Introduction Cash Flows
Cost of Capital Parameters
Impairment Test
Company Values
Online Industry Analyses
Industry Specialists
Derivation of the Cash Flow
Planning uncertaintyAs a result of macroeconomic uncertainties and microeconomic change from disruptive business models, there is a significant degree of uncertainty in the future prognoses.
To date, economic risks (macroeconomic risks) or customer risks (microeconomic risks) have in particular been given consideration in financial forecasts.
Growth expectationsRegarding sales and EBIT, study participants from most of the industries are predicting more optimistic developments than in the previous year. By contrast, the sustainable growth rate decreased slightly compared to the previous year.
Cost of Capital
WACCThe average weighted cost of capital (WACC) was, after the horizontal development in the last two years, at 6.9 percent, slightly below the level of the previous years.
The highest WACC was applied in the technology sector with 8.6 percent. The lowest WACC was observed in the real estate sector with 4.4 percent.
Risk-free rateThe average risk-free rate applied continued to decline and decreased from 1.5 percent to 0.9 percent. It attained, for the first time since the Cost of Capital Study has been published, a level of less than one percent in all the participating countries.
Market risk premiumIn contrast to the decreasing risk-free rate, the market risk premium increased slightly to 6.6 percent in Germany and Austria and 5.9 percent in Switzerland.
Beta factorsJust as in the previous year, the highest unlevered beta factors were applied by the automotive and technology sectors; the lowest value for this survey period was in the transport & leisure sector.
Compared with the previous year, the unlevered beta factors observed in the individual industries remained for the most part unchanged. The largest increase was observed in technology, a decrease was observed only in automotive and transport & leisure.
Cost of debtThe average cost of debt applied also decreased less than the risk-free rate and is now 3.1 percent.

Impairment Test
ImpairmentThe percentage of companies that recognized an impairment on assets or goodwill is, at 56 percent, around the level of the previous year. However, the average amount of an impairment on assets almost doubled to 198 million euros. This increase is in particular attributable to especially high impairments in the sector energy & natural resources.
Values and Value Enhancement
© 2
018
KP
MG
Inte
rnat
iona
l Co
op
erat
ive
(“K
PM
G In
tern
atio
nal”
), a
Sw
iss
enti
ty. M
emb
er f
irm
s of
the
KP
MG
net
wor
k of
ind
epen
den
t fi
rms
ar
e af
filia
ted
wit
h K
PM
G In
tern
atio
nal.
All
righ
ts r
eser
ved
. The
KP
MG
nam
e an
d lo
go
are
regi
ster
ed
trad
emar
ks o
f K
PM
G In
tern
atio
nal.
Table of Contents
Summary Introduction Cash Flows
Cost of Capital Parameters
Impairment Test
Company Values
Online Industry Analyses
Industry Specialists
Investment decisionInvestment decisions continued to be made by the majority of participants based on both strategic as well as value-oriented objectives.
MonitoringThe major portion of participants continued to consider a value-based monitoring of the investment decision as important and observed in particular the change in performance more than the risk (cost of capital).
Capital market communicationThe cost of capital was, as in the previous years, less relevant in the capital market communication and was primarily used only for purposes of accounting and reporting.

1 Introduction
© 2
018
KP
MG
Inte
rnat
iona
l Co
op
erat
ive
(“K
PM
G In
tern
atio
nal”
), a
Sw
iss
enti
ty. M
emb
er f
irm
s of
the
KP
MG
net
wor
k of
ind
epen
den
t fi
rms
ar
e af
filia
ted
wit
h K
PM
G In
tern
atio
nal.
All
righ
ts r
eser
ved
. The
KP
MG
nam
e an
d lo
go
are
regi
ster
ed
trad
emar
ks o
f K
PM
G In
tern
atio
nal.
Table of Contents
Summary Introduction Cash Flows
Cost of Capital Parameters
Impairment Test
Company Values
Online Industry Analyses
Industry Specialists

Study participants
The total number of companies participating from Germany, Austria and Switzerland in this year’s Cost of Capital Study was 205 (previous year: 196 com-panies). Of the participating companies, 153 com-panies were in Germany, 18 in Austria and 34 in Switzerland. (Figure 01)
Compared to the previous year, the number of DAX-30 companies participating increased again to 26 companies, which corresponds to a ratio of 87 percent (previous year: 77 percent). In addition, 44 percent of the MDAX companies participated in the study (previous year: 46 percent). (Figure 02)
Survey period
The survey of the companies occurred between March and July 2017. The reporting dates of the con-solidated financial statements included in the study were between 31 March 2016 and 31 March 2017.
Note
When considering the following analyses, it should be noted that the company data presented here stems from companies from different countries, partially from different currencies and from varying points of time.
02 Participation rates in Germany (in percent)
100
80
60
40
20
0
DAX-30 FamDAXSDAXMDAXCDAX
87
39 44
24
40
Source: KPMG, 2017
01 Study participants by region Total
250
200
150
100
50
0
2012/2013 2016/20172015/20162014/20152013/2014
100
Source: KPMG, 2017
Switzerland Austria Germany
152130
148
196 205
17 17 19 181135 32 29 29 34
87102
148 153
© 2
018
KP
MG
Inte
rnat
iona
l Co
op
erat
ive
(“K
PM
G In
tern
atio
nal”
), a
Sw
iss
enti
ty. M
emb
er f
irm
s of
the
KP
MG
net
wor
k of
ind
epen
den
t fi
rms
ar
e af
filia
ted
wit
h K
PM
G In
tern
atio
nal.
All
righ
ts r
eser
ved
. The
KP
MG
nam
e an
d lo
go
are
regi
ster
ed
trad
emar
ks o
f K
PM
G In
tern
atio
nal.
Table of Contents
Summary Introduction Cash Flows
Cost of Capital Parameters
Impairment Test
Company Values
Online Industry Analyses
Industry Specialists

Source: KPMG, 2017
03 Study participants by industry Total (multiple choices possible)
Automotive Chemicals & Pharmaceuticals
Consumer Markets
Energy & Natural
Resources
Financial Services
Health Care Industrial Manufacturing
Media & Tele- communications
Real Estate Technology Transport & Leisure
50
40
30
20
10
0
1924
18
6
23 24
15
9
32 31
22
9
22 20
19
2832
28
4
15 13
12
38
47
32
15
2420
17
7 75
2 2311
27
19
14
5
15 14
12
2015/2016: All companies
2016/2017: Family-owned companies Non-family-owned companies
Analyses
As in the previous years, the participating compan-ies were requested to assign themselves to indus-tries in accordance with their business activities. The study therefore contains overviews of all the material financial forecast and cost of capital para-meters according to industries.
Family-owned company analyses
For the first time, the study also includes analyses for family-owned and non-family-owned businesses. On the basis of their own classification, 46 family-owned and 159 non-family-owned businesses took part in the study. (Figure 03)
© 2
018
KP
MG
Inte
rnat
iona
l Co
op
erat
ive
(“K
PM
G In
tern
atio
nal”
), a
Sw
iss
enti
ty. M
emb
er f
irm
s of
the
KP
MG
net
wor
k of
ind
epen
den
t fi
rms
ar
e af
filia
ted
wit
h K
PM
G In
tern
atio
nal.
All
righ
ts r
eser
ved
. The
KP
MG
nam
e an
d lo
go
are
regi
ster
ed
trad
emar
ks o
f K
PM
G In
tern
atio
nal.
Table of Contents
Summary Introduction Cash Flows
Cost of Capital Parameters
Impairment Test
Company Values
Online Industry Analyses
Industry Specialists

Online industry analyses
This year, for the first time, we are presenting all the industry-specific figures for the cost of capital para-meters on our website.
At www.kpmg.de/kapitalkostenstudie-tableau (only available in German) you will find the financial forecast and the cost of capital parameters from the current study as well as the results of the Cost of Capital Studies from the previous years in a clear, self-explanatory presentation.
In addition, we provide you there with an individual and interactive data analysis of the study results. Using your own search criteria, you can generate the data relevant for you and therefore better grasp the values and developments of the cost of capital parameters essential to you.
Sub-sector analysis
To further increase the degree of detail in the industry analyses, we have, for the first time, performed analyses for sub-sectors of consumer markets, chemicals & pharmaceuticals, financial services as well as media & telecommunications. For instance, we have broken down the financial service sector into banking and insurance as well as other financial services. (Figure 04)
Source: KPMG, 2017
04 Study participants by sub-sectors Total (multiple choices possible)
Chemicals & Pharmaceuticals Consumer Markets Financial Services Media & Telecommunications
25
20
15
10
5
0
Chemicals Retail Banking Media Tele- communications
Other Financial Services
InsuranceConsumer Markets
Other Chemicals &
Pharmaceuticals
Pharma- ceuticals
17
7
19
13
21
85
15
72
© 2
018
KP
MG
Inte
rnat
iona
l Co
op
erat
ive
(“K
PM
G In
tern
atio
nal”
), a
Sw
iss
enti
ty. M
emb
er f
irm
s of
the
KP
MG
net
wor
k of
ind
epen
den
t fi
rms
ar
e af
filia
ted
wit
h K
PM
G In
tern
atio
nal.
All
righ
ts r
eser
ved
. The
KP
MG
nam
e an
d lo
go
are
regi
ster
ed
trad
emar
ks o
f K
PM
G In
tern
atio
nal.
Table of Contents
Summary Introduction Cash Flows
Cost of Capital Parameters
Impairment Test
Company Values
Online Industry Analyses
Industry Specialists

2 Derivation of the Cash Flows
© 2
018
KP
MG
Inte
rnat
iona
l Co
op
erat
ive
(“K
PM
G In
tern
atio
nal”
), a
Sw
iss
enti
ty. M
emb
er f
irm
s of
the
KP
MG
net
wor
k of
ind
epen
den
t fi
rms
ar
e af
filia
ted
wit
h K
PM
G In
tern
atio
nal.
All
righ
ts r
eser
ved
. The
KP
MG
nam
e an
d lo
go
are
regi
ster
ed
trad
emar
ks o
f K
PM
G In
tern
atio
nal.
Table of Contents
Summary Introduction Cash Flows
Cost of Capital Parameters
Impairment Test
Company Values
Online Industry Analyses
Industry Specialists

2.1 Preparation of the Financial Forecasts
Financial profits cannot be predicted with certainty due to the uncertain future and must therefore be reflected with their expected values. Entrepreneur-ial engagement is always associated with risks and opportunities. Integrated and sufficiently detailed financial models are of primary importance for the systematic derivation of future expected values in the framework of business valuations – regardless of the reason. These models must be in a position to properly reflect the specific material drivers of performance and risk.
The ranges and distributions of the performance and risk drivers to be derived in the framework of the individual analyses form the basis for the transition of single-valued financial forecasts to multi-valued and simulation-based planning instruments.
Following on the heels of a contrasting development in the previous year’s survey, the increasing trend amongst the participants toward performing a com-pletely integrated planning continued once again (2014/2015: 61 percent; 2015/2016: 48 percent). By contrast, the percentage of participants that performed the planning of a profit and loss state-ment (P&L) as well as a planning of selected bal-ance sheet items decreased slightly (2016/2017: 32 percent; 2015/2016: 36 percent). With what now totaled 88 percent of the surveyed study partici- pants, the number of companies which, in our opin-ion, applied an appropriate planning structure for the derivation of the cash flow reached a record level. (Figure 05)
05 Degree of detail of the financial forecasts Total (in percent)
Forecast of a P&L and additionally
selected balance sheet items or
a complete balance sheet
32
Completely integrated (P&L,
balance sheet and cash flow)
56
Forecast only of a P&L
12
60
50
40
30
20
10
0
Source: KPMG, 2017
© 2
018
KP
MG
Inte
rnat
iona
l Co
op
erat
ive
(“K
PM
G In
tern
atio
nal”
), a
Sw
iss
enti
ty. M
emb
er f
irm
s of
the
KP
MG
net
wor
k of
ind
epen
den
t fi
rms
ar
e af
filia
ted
wit
h K
PM
G In
tern
atio
nal.
All
righ
ts r
eser
ved
. The
KP
MG
nam
e an
d lo
go
are
regi
ster
ed
trad
emar
ks o
f K
PM
G In
tern
atio
nal.
Table of Contents
Summary Introduction Cash Flows
Cost of Capital Parameters
Impairment Test
Company Values
Online Industry Analyses
Industry Specialists

Source: KPMG, 2017
06 Planning horizon – yearly comparison Total (in percent, multiple choices possible)
Three planning
years
3437
One budget year
88
Five planning
years
4646
Another number of
planning years
2017
2015/2016 2016/2017
50
40
30
20
10
0
It is once again apparent that in the financial ser- vices sector, with a percentage of 26, relatively few companies perform a completely integrated financial forecast. This is attributable to the industry- specific business model of banks and insurance companies. To be able to fulfill the regulatory re- quirements for maintaining equity and solvability ratios in financial forecasts, items relevant for the equity capital required, such as the volumes of loans and securities, capital investments, insurance-tech-nical provisions and equity, are planned and re -flected. In addition, liquidity and funding forecasts are regularly compiled so that overall the material items for the business activities are compiled in an integrated planning system.
© 2
018
KP
MG
Inte
rnat
iona
l Co
op
erat
ive
(“K
PM
G In
tern
atio
nal”
), a
Sw
iss
enti
ty. M
emb
er f
irm
s of
the
KP
MG
net
wor
k of
ind
epen
den
t fi
rms
ar
e af
filia
ted
wit
h K
PM
G In
tern
atio
nal.
All
righ
ts r
eser
ved
. The
KP
MG
nam
e an
d lo
go
are
regi
ster
ed
trad
emar
ks o
f K
PM
G In
tern
atio
nal.
Table of Contents
Summary Introduction Cash Flows
Cost of Capital Parameters
Impairment Test
Company Values
Online Industry Analyses
Industry Specialists
The choice of the planning period remains a mat-ter of some incongruity: A longer planning period means – in particular in view of the observable dynamic market particularities – a greater planning uncertainty, if the planning period is not accompa-nied by additional scenario and simulation analyses. A (too) short planning period, on the other hand, results in investment and product life cycles as well as long-term industry developments not being properly reflected in the financial forecast. This re-sults in incorrect valuations and subsequently in bad decisions.
The regulations of the International Accounting Standard (IAS) 36.33 (b) are also to be observed in the case of impairment tests with longer planning periods – with the application of the value-in-use concept. In such cases, the financial forecasts should in principle not exceed a period of five years, unless the company can prove that it is able to estimate the future cash flows over a longer period with sufficient accuracy.
The majority of the companies surveyed continue to apply a planning period of five (46 percent) or three (34 percent) years, whereby there was a slight shift toward shorter planning periods compared to the previous year. The average of the planning years for the companies that selected a different number of planning years was about six years (previous year: eight years). (Figure 06)

Almost two-thirds of the participating compan-ies (59 percent) considered sensitivity analyses in the framework of their planning. The majority of these participants (36 percent) examined both cash flow (including its parameters) as well as the cost of capital (including sustainable growth rate). Another 16 percent subjected exclusively the cash flow and 7 percent only the cost of capital to cor-responding analyses. Here, possible parameters for the sensitivity analysis of the cash flow consisted of sales, earnings before interest, taxes, depreci-ation and amortization (EBITDA) or earnings before interest and taxes (EBIT), amongst others. (Figure 07)
Companies in the financial services sector consider sensitivities in cash flow and the cost of capital signif - icantly more frequently. Furthermore, sensitivities to the cost of capital also impact on the cash flow, for instance with the expected long-term return on capital investments. In particular for life insurance companies, the precise analysis of effects from the development of the level of the interest rate is gen-erally a primary component of the planning process.
On average, family-owned businesses choose a shorter planning period and take sensitivities into consideration less often (50 percent) than do non-family-owned businesses (61 percent).
07 Consideration of sensitivities Total (in percent)
Source: KPMG, 2017
Cash flow (amongst others sales, EBITDA, EBIT)
Cost of capital (including sustainable growth rate)
Both No
36
41
16
7
“Family-owned businesses need the same transparency for the future development of the company or the business segments. For that reason, the extent of planning, the planning period and the planning structure should have the same quality as that of non-family-owned companies.”
Dr. Vera-Carina ElterPartner, Managing Partner for Family-Owned Businesses, KPMG in Germany
© 2
018
KP
MG
Inte
rnat
iona
l Co
op
erat
ive
(“K
PM
G In
tern
atio
nal”
), a
Sw
iss
enti
ty. M
emb
er f
irm
s of
the
KP
MG
net
wor
k of
ind
epen
den
t fi
rms
ar
e af
filia
ted
wit
h K
PM
G In
tern
atio
nal.
All
righ
ts r
eser
ved
. The
KP
MG
nam
e an
d lo
go
are
regi
ster
ed
trad
emar
ks o
f K
PM
G In
tern
atio
nal.
Table of Contents
Summary Introduction Cash Flows
Cost of Capital Parameters
Impairment Test
Company Values
Online Industry Analyses
Industry Specialists

Macroeconomic Uncertainties – Part of Financial ForecastsThere has been a noticeable increase in political risks for the global economy since the latest financial and debt crisis. Last year alone, fears of a slowing of China’s economic performance, the coup attempt in Turkey as well as the low price of oil sparked uncertainties in financial markets. In addition, the results of elections in the United States and Great Britain increased the volatility on the stock markets.
Even if the stock markets recovered quickly from the British decision, the consequences for the eco-nomy remain unforeseeable. More than a year after the elections, it is to be expected that Great Britain will leave the EU in the spring of 2019. The initial round of talks has already stalled and indicates there will be years of uncertainty. Companies do not, however, have the opportunity to wait for the re sults of EU talks. They have to prepare now for any eventualities. Financial institutions have already begun their preparations for transferring their em -ployees and business segments to other EU mem-ber states. In addition to that, the EU is currently confronted with the challenges arising from the refugee crisis, the disagreements with Poland and Hungary and the growing influence of populists in a number of European states – including Germany after the federal elections.
At the same time, the policies of President Donald Trump, since his inauguration at the beginning of 2017, have caused political and economic insecurity from the direction of the USA. Trump’s isolationist policy could have grave consequences for the global economy. Companies are especially concerned that both with the withdrawal of the US from the climate
protection agreement as well as changes in tariffs and taxes being discussed in the US, unfair com-petition and greater uncertainties may arise. Com-panies working internationally are also watching the developments in the Middle East, in Venezuela and North Korea with increasing concern, for these countries also bear major political risks for the global economy. For companies with business activities in Latin America, the situation in Venezuela is espe-cially risky, because if the conflict increases it could set off the largest wave of refugees in recent Latin American history. A mass exodus of millions of people could destabilize the region and result in un-foreseeable economic consequences for the region and beyond.
Our world is changing more quickly and more sur-prisingly than previously was the case; develop-ments are more complex and more difficult to interpret. The assessment of the impact of the continuously diverging macroeconomic environ-ment represents a major challenge for many com-panies. A term has been coined for this environ-ment, VUCA: volatility, uncertainty, complexity and ambiguity. The acronym VUCA accurately describes the changes in the basic conditions of our world in which organizations and people have to reorient themselves. Strategically, groundbreaking decisions come more frequently in a world of converging mar-kets and diverging business models. Bad or delayed decisions can endanger even major market players. Political events therefore cause increasing uncer-tainty and have a growing impact on the economic development of companies. Especially the inter-play and interaction of these events, as a result of the increasing globalization, make it more difficult
to perform corporate planning that sufficiently con-siders all the eventualities.
At the same time, investors are demanding that companies provide a high degree of transparency, better documentation and capital market commu-nication for the decision-making in the company. Companies are therefore faced with the challenge of identifying and appraising risks and opportunities from the macroeconomic environment at an early stage so as to make future-oriented decisions on the basis of this and then to communicate these to the shareholders. The traditional approaches of cor-porate steering and valuation were subject to rela-tively stable expectations and scenario analyses in fairly narrow bandwidths in which only a few macro as well as microeconomic parameters varied inde-pendently from one another. These approaches can only reflect the increasing complexity in today’s eco-nomic environment to a limited degree.
Companies then only have a valid basis for decisions if their planning models not only include their basic economic and competitive conditions, but also take into consideration the macroeconomic interdepend-encies. Single-valued planning models can, how-ever, only summarize the costs and sales. Risks, by contrast, cannot in general be summarized; they must be compiled by means of simulation-based planning methods and include macroeconomic and geopolitical big data. Only in this way is it possible to incorporate the economic environment and potential risks in the valuation of various strategic options as well, so that potential risks are identified and classi-fied according to their relevance.
© 2
018
KP
MG
Inte
rnat
iona
l Co
op
erat
ive
(“K
PM
G In
tern
atio
nal”
), a
Sw
iss
enti
ty. M
emb
er f
irm
s of
the
KP
MG
net
wor
k of
ind
epen
den
t fi
rms
ar
e af
filia
ted
wit
h K
PM
G In
tern
atio
nal.
All
righ
ts r
eser
ved
. The
KP
MG
nam
e an
d lo
go
are
regi
ster
ed
trad
emar
ks o
f K
PM
G In
tern
atio
nal.
Table of Contents
Summary Introduction Cash Flows
Cost of Capital Parameters
Impairment Test
Company Values
Online Industry Analyses
Industry Specialists
In view of these circumstances, KPMG developed CEDA (Corporate Economic Decision Assessment), a simulation-based planning and steering method that supports companies in adequately consider-ing all the company-specific and macroeconomic drivers relevant for decision-making in their finan-cial forecasts. Risks and opportunities and their con-crete influences on the development of the corpo-rate results are compiled consistently and provide the necessary transparency for quick decision-mak-ing. Consequently, corporate planning once again becomes a strategic steering element that fulfills the current demands.
“Previous, single-valued planning and steering models are not appropriate for the current economic environment. Because the dynamics of the economy and especially the macroeco-nomic uncertainties will continue to increase, companies’ planning, steering and valuation methods have to be further developed. Other-wise companies are in danger of not making strategic decisions optimally or even recogniz-ing existential threats too late.”
Karen FerdinandPartner, KPMG in Germany
© 2
018
KP
MG
Inte
rnat
iona
l Co
op
erat
ive
(“K
PM
G In
tern
atio
nal”
), a
Sw
iss
enti
ty. M
emb
er f
irm
s of
the
KP
MG
net
wor
k of
ind
epen
den
t fi
rms
ar
e af
filia
ted
wit
h K
PM
G In
tern
atio
nal.
All
righ
ts r
eser
ved
. The
KP
MG
nam
e an
d lo
go
are
regi
ster
ed
trad
emar
ks o
f K
PM
G In
tern
atio
nal.
Table of Contents
Summary Introduction Cash Flows
Cost of Capital Parameters
Impairment Test
Company Values
Online Industry Analyses
Industry Specialists

2.2 Growth Expectations
The expected development of sales as well as future achievable results, such as EBITDA or EBIT, are fundamental premises in compiling a financial forecast.
From the general economic perspective, the pre-dicted results are also influenced by the future general macroeconomic development. If at the beginning of the decade, with the financial and
Source: KPMG analyses on the basis of data from The Economist Intelligence Unit Limited, 11 August 2017
Germany Austria Switzerland
08 Economic forecast of real growth of the gross domestic product Total (in percent)
0.70.7 0.61.1
4.0
3.0
2.0
1.0
0
2016 20212014 20192013 2017 20182012 2020
1.8 1.8
0.1
2015
1.6 1.6
0.80.8 0.8
1.5
2.01.9
1.31.31.71.7 1.6 1.41.4
1.7 1.71.41.4
1.91.51.5
economic crisis of 2009, primarily economic issues were at the forefront, commencing with the sub-sequent 2012 sovereign debt crisis in Europe, polit-ically charged issues began to have a direct influ-ence on corporate developments. Amongst others, through the impact of Brexit, the new American pro-tectionism or the destabilizing developments in Tur-key, the economic forecasts for Germany and Aus-tria currently assume there will be a slight decline in growth rates. In Switzerland, by contrast, an increase in the growth trend is expected. (Figure 08)
As a result of these and other increasingly unfore-seeable macroeconomic developments, the planning of future results is becoming ever more difficult.
Following upon the downward trend of the previous years (2013/2014: 6.1 percent; 2014/2015: 4.9 per-cent; 2015/2016: 4.8 percent), the study partici- pants assume, along with the economic forecasts, that there will be a slight increase in the average sales growth.
2.0
© 2
018
KP
MG
Inte
rnat
iona
l Co
op
erat
ive
(“K
PM
G In
tern
atio
nal”
), a
Sw
iss
enti
ty. M
emb
er f
irm
s of
the
KP
MG
net
wor
k of
ind
epen
den
t fi
rms
ar
e af
filia
ted
wit
h K
PM
G In
tern
atio
nal.
All
righ
ts r
eser
ved
. The
KP
MG
nam
e an
d lo
go
are
regi
ster
ed
trad
emar
ks o
f K
PM
G In
tern
atio
nal.
Table of Contents
Summary Introduction Cash Flows
Cost of Capital Parameters
Impairment Test
Company Values
Online Industry Analyses
Industry Specialists

09 Forecasted sales growth by industry (in percent)
While the media & telecommunications sector expects, with 6.6 percent and an increase of 1.7 per-centage points, the highest sales growth compared to the previous year, companies in the transport & leisure sector assume a decrease in future growth and apply an annual growth rate of only 3.2 percent (previous year: 4.2 percent).
The study participants’ EBIT growth forecasts were, at 10.0 percent, not only clearly above the value of the previous year (8.8 percent), but also well above the expected sales growth. (Figure 09 and 10)
For non-family-owned businesses, the overall fore-casted growth of the EBIT was, at 10.2 percent, sig-nificantly above the expectations of family-owned businesses (9.3 percent).
2 5 761 43
4.66.1
5.36.3
5.45.2
6.05.0
2.4
3.7
3.7
3.1n/a
4.95.1
4.23.2
4.2
4.85.1
5.0
4.96.6
5.2
5.2
5.7
Source: KPMG, 2017
2016/2017 2015/2016
Automotive
Chemicals & Pharmaceuticals
Consumer Markets
Energy & Natural Resources
Financial Services
Health Care
Industrial Manufacturing
Media & Telecommunications
Real Estate
Technology
Transport & Leisure
Total
Family-owned businessesNon-family-owned businesses
4 10 14122 86
9.68.1
9.210.8
8.69.9
10.711.3
4.0n/a
n/mn/m
n/an/a
n/a
11.09.9
7.1
8.810.0
9.3
7.310.3
10.1
10.2
14.1
Source: KPMG, 2017
2016/2017 2015/2016
Automotive
Chemicals & Pharmaceuticals
Consumer Markets
Energy & Natural Resources
Financial Services
Health Care
Industrial Manufacturing
Media & Telecommunications
Real Estate
Technology
Transport & Leisure
Total
Family-owned businessesNon-family-owned businesses
10 Forecasted growth of EBIT by industry (in percent)
© 2
018
KP
MG
Inte
rnat
iona
l Co
op
erat
ive
(“K
PM
G In
tern
atio
nal”
), a
Sw
iss
enti
ty. M
emb
er f
irm
s of
the
KP
MG
net
wor
k of
ind
epen
den
t fi
rms
ar
e af
filia
ted
wit
h K
PM
G In
tern
atio
nal.
All
righ
ts r
eser
ved
. The
KP
MG
nam
e an
d lo
go
are
regi
ster
ed
trad
emar
ks o
f K
PM
G In
tern
atio
nal.
Table of Contents
Summary Introduction Cash Flows
Cost of Capital Parameters
Impairment Test
Company Values
Online Industry Analyses
Industry Specialists
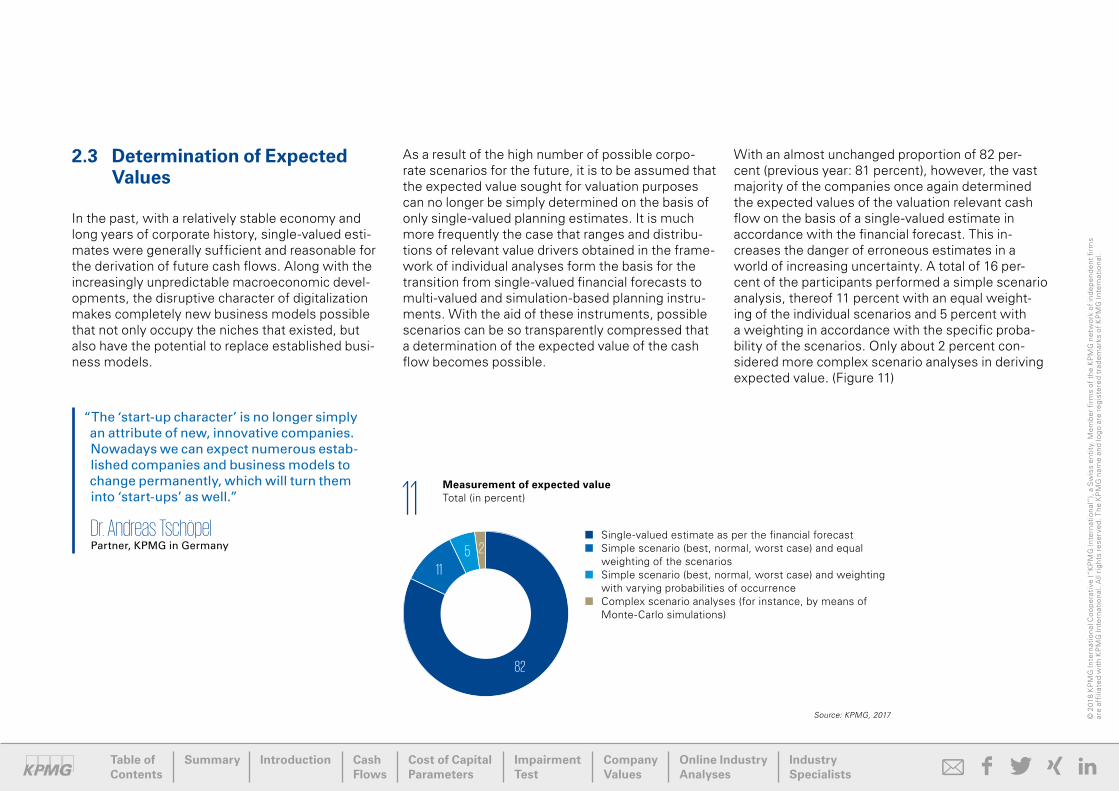
2.3 Determination of Expected Values
In the past, with a relatively stable economy and long years of corporate history, single-valued esti-mates were generally sufficient and reasonable for the derivation of future cash flows. Along with the increasingly unpredictable macroeconomic devel-opments, the disruptive character of digitalization makes completely new business models possible that not only occupy the niches that existed, but also have the potential to replace established busi-ness models.
As a result of the high number of possible corpo-ra te scenarios for the future, it is to be assumed that the expected value sought for valuation purposes can no longer be simply determined on the basis of only single-valued planning estimates. It is much more frequently the case that ranges and distribu-tions of relevant value drivers obtained in the frame-work of individual analyses form the basis for the transition from single-valued financial forecasts to multi-valued and simulation-based planning instru-ments. With the aid of these instruments, possible scenarios can be so transparently compressed that a determination of the expected value of the cash flow becomes possible.
With an almost unchanged proportion of 82 per-cent (previous year: 81 percent), however, the vast majority of the companies once again determined the expected values of the valuation relevant cash flow on the basis of a single-valued estimate in accordance with the financial forecast. This in -creases the danger of erroneous estimates in a world of increasing uncertainty. A total of 16 per-cent of the participants performed a simple scenario analysis, thereof 11 percent with an equal weight-ing of the individual scenarios and 5 percent with a weighting in accordance with the specific proba-bility of the scenarios. Only about 2 percent con-sidered more complex scenario analyses in deriving expected value. (Figure 11)
“The ‘start-up character’ is no longer simply an attribute of new, innovative companies. Nowadays we can expect numerous estab-lished companies and business models to change permanently, which will turn them into ‘start-ups’ as well.”
Dr. Andreas TschöpelPartner, KPMG in Germany
11 Measurement of expected value Total (in percent)
Source: KPMG, 2017
Single-valued estimate as per the financial forecast Simple scenario (best, normal, worst case) and equal
weighting of the scenarios Simple scenario (best, normal, worst case) and weighting
with varying probabilities of occurrence Complex scenario analyses (for instance, by means of
Monte-Carlo simulations)
82
11
5 2
© 2
018
KP
MG
Inte
rnat
iona
l Co
op
erat
ive
(“K
PM
G In
tern
atio
nal”
), a
Sw
iss
enti
ty. M
emb
er f
irm
s of
the
KP
MG
net
wor
k of
ind
epen
den
t fi
rms
ar
e af
filia
ted
wit
h K
PM
G In
tern
atio
nal.
All
righ
ts r
eser
ved
. The
KP
MG
nam
e an
d lo
go
are
regi
ster
ed
trad
emar
ks o
f K
PM
G In
tern
atio
nal.
Table of Contents
Summary Introduction Cash Flows
Cost of Capital Parameters
Impairment Test
Company Values
Online Industry Analyses
Industry Specialists

Companies in the financial services sector apply scenario analyses instead of single-valued esti-mates much more frequently for the determination of expected values. Due to the fact that insurance companies and banking institutions already reg-ularly report on the effects of adverse interest, currency and economic scenarios, scenario con-siderations are to be observed much more fre-quently. Here, both cross-company changes as well as industry-specific conditions are examined, for instance, a general economic slump with impacts on the rate of insolvencies and costs of risk for bank-ing institutions or technical developments in the automobile industry and their effects on loss ratios and insurance premiums.
The adjusted approach for the determination of expected values of cash flow in the financial services sector on the basis of scenario analyses is exemplary for the necessary reaction of this industry to the significant regulatory and market changes and the resulting risks and opportunities.
© 2
018
KP
MG
Inte
rnat
iona
l Co
op
erat
ive
(“K
PM
G In
tern
atio
nal”
), a
Sw
iss
enti
ty. M
emb
er f
irm
s of
the
KP
MG
net
wor
k of
ind
epen
den
t fi
rms
ar
e af
filia
ted
wit
h K
PM
G In
tern
atio
nal.
All
righ
ts r
eser
ved
. The
KP
MG
nam
e an
d lo
go
are
regi
ster
ed
trad
emar
ks o
f K
PM
G In
tern
atio
nal.
Table of Contents
Summary Introduction Cash Flows
Cost of Capital Parameters
Impairment Test
Company Values
Online Industry Analyses
Industry Specialists
“Because the future macro- and microeconomic conditions for almost all of the industries will be subjected to major changes, the implement-ation of planning models that can properly sim-ulate the relevant drivers of the business mod-els and in particular their variable attributes, is recommendable across every industry. In this connection, big data is resulting in an availabil-ity of additional analytic possibilities and oper-ative data that is significantly greater than was previously possible.”
Dr. Marc CastedelloPartner, KPMG in Germany
2.4 Consideration of Risks
Future cash flows are uncertain and must be reflec-ted with their expected value. For that reason, all the opportunities and risks associated with the business model must be completely considered when com-piling the financial forecast and deriving the cash flow. These risks may be macro- or microeconomic in nature.
In view of this, we asked companies this year for the first time to what extent macro- and microeconomic risks were considered in their strategic planning and therefore in the derivation of the cash flow.
On the macroeconomic level, with 75 percent, the majority of the companies reported that they included economic risks in their planning and in the derivation of relevant parameters. In addition, reg-ulatory and legal conditions (62 percent), currency risks (60 percent) as well as political risks such as protectionism (45 percent) were a component of the financial forecasts. (Figure 12, page 22)
It was striking that especially the financial forecasts in the financial services sector were impacted by macroeconomic risks. Generally in this industry interest, currency and economic scenarios are established as guidelines for volumes and earnings forecasts at the highest level. Maintaining regula-tory requirements in the planning period is a basic secondary condition. Digitalization and competi-tion from companies from the financial technology sector (FinTech companies) are, however, gaining ground in the financial forecasts of the industry.

Microeconomically, customer-side market and sales risks were, with 80 percent, the most frequently considered type of risk considered in the financial forecast. Furthermore, 61 percent of the companies considered risks from technological change and developments in digitalization as well as 57 percent potentially greater competition from the entry of new market participants. (Figure 13)
Family-owned businesses demonstrated a clear difference in that along with customer-side risks they especially saw new competitors as microeco-nomic risks (72 percent), while non-family-owned businesses considered these effects much less frequently in the financial forecast (53 percent).
In general, it was observed that macro- and micro- economic risks were reflected in the financial fore- cast. Unforeseeable developments such as the American tendency to protectionism, Brexit and dis-ruptive effects from digitalization constantly create new challenges at the corporate management level that make planning the future corporate develop-ment increasingly more complex and demand flex-ible planning instruments.
12 Consideration of risks in the financial forecast – macroeconomic risks Total (in percent, multiple choices possible)
Source: KPMG, 2017
Economic risks
75
62
Regulatory/ legal conditions
45
Political risks (for example
protectionism)
Other macroeconomic
risks
6
Currency risks
60
80
70
60
50
40
30
20
10
0
Source: KPMG, 2017
New competitors
57
42
Supply-side risks (for example
supplier networks)
80
Customer-side risks (for example market and sales
risks)
Other microeconomic
risks
5
New technologies/ digitalization
61
80
70
60
50
40
30
20
10
0
13 Consideration of risks in the financial forecast – microeconomic risks Total (in percent, multiple choices possible)
© 2
018
KP
MG
Inte
rnat
iona
l Co
op
erat
ive
(“K
PM
G In
tern
atio
nal”
), a
Sw
iss
enti
ty. M
emb
er f
irm
s of
the
KP
MG
net
wor
k of
ind
epen
den
t fi
rms
ar
e af
filia
ted
wit
h K
PM
G In
tern
atio
nal.
All
righ
ts r
eser
ved
. The
KP
MG
nam
e an
d lo
go
are
regi
ster
ed
trad
emar
ks o
f K
PM
G In
tern
atio
nal.
Table of Contents
Summary Introduction Cash Flows
Cost of Capital Parameters
Impairment Test
Company Values
Online Industry Analyses
Industry Specialists

Microeconomic Change – Predictability of Disruptive Business Models
No company is able to ignore the rapid changes currently taking place in the business world or that are also probably to be expected in the future. For established business models – such as the pro-duction of automobiles or the trade in consumer goods – digitalization offers significant advantages. At the same time, such business models are dis-ruptively threatened by completely new models because competitors (industry outsiders) are no longer only trying to break into an existing niche, but also have the potential to establish new busi-ness models that either completely replace the existing ones or force them into dependencies. The transformation and convergence of entire industries – practically unimaginable ten years ago – appears to be possible everywhere today. Compa-nies from the “old economy” have to face these new realities and also change dynamically. The “start-up character” is no longer just an attribute of new, innovative companies. It is rather to be ex - pected that the majority of companies will become “start-ups” with respect to new business models. Associated with this are in principle all the particu-larities connected with the cash flow prognosis of new business models and the decision-based valu-ation of innovative companies.
The value of an innovative business model is also – as with the valuation of any investment – deter-mined by two questions: How much risk am I will-ing to take on? And what performance may/must I expect in return? Planning methods for innovative business models must therefore be in the position to compile the material operative value drivers of
the business model, to transform them into financial parameters and to determine performance and risks equally well so as to form a suitable basis for the subsequent determination of value.
In the practice of valuating start-ups, “alternative” methods can frequently be observed that are far from the established planning and valuation approaches. Their application is regularly justified with start-up specific uncertainties as well as the existing limitations of the established methods. There is, however, some question as to whether “alternative” assessment methods are actually needed.
Our reply is a resounding “No”. After a more de-tailed review of these “alternative” methods it quickly becomes clear that they – consciously or unconsciously – accept great vagueness so as to reduce the doubtlessly significantly greater com-plexity of assessing new and relatively non-compar-able business models. Some methods, for instance, attempt to compensate for a lack of information regarding the business model of start-ups by refer-encing purely operative indicators (such as traffic on the website, click rates, likes).
Multiplier-based methods on the basis of purely fi -nancial indicators (for example, sales multipliers) try to avoid the start-up-specific problem of negative earnings in the initial loss phase. Results frequently demonstrate, however, that it is not the established method of corporate planning itself, but rather their inadequate design in the case of innovative busi-
ness models that is the reason for applying “alterna-tive” methods.
Furthermore, the argument of the need for reducing complexity should be viewed critically; it may only be accepted to the extent that it does not materially impact on the result of the valuation. Simplifying “alternative methods” may in no way replace estab-lished approaches to planning and valuation. The forecast of future returns (such as the basis for a discounted cash flow method) therefore plays just as important a role in the corporate planning of start-ups as in the valuation of established business models.
Established companies enjoy the advantage over start-ups in the assessment of innovative business models in that they are generally familiar with clas-sical planning methods. They need only to consist-ently integrate the changing conditions, business models and operative drivers in the existing instru-ments so as to avoid the disadvantages of simpli-fying “alternative methods”. The frequently men-tioned challenge that at the beginning there is a lack of information for the forecast of cash flow is, in most cases, rapidly relativized if an initial focus on the “real” drivers is performed by means of a more intensive examination of the operative business model. Any valuation should build on the operative business model and not simply on the resulting fi- nancial indicators. That was frequently ignored in the past when planning established business mod-els or it was justified with the assumption that established companies are reflected in long-term ©
201
8 K
PM
G In
tern
atio
nal C
oo
per
ativ
e (“
KP
MG
Inte
rnat
iona
l”),
a S
wis
s en
tity
. Mem
ber
fir
ms
of t
he K
PM
G n
etw
ork
of in
dep
end
ent
firm
s
are
affi
liate
d w
ith
KP
MG
Inte
rnat
iona
l. A
ll ri
ghts
res
erve
d. T
he K
PM
G n
ame
and
log
o ar
e re
gist
ere
d tr
adem
arks
of
KP
MG
Inte
rnat
iona
l.
Table of Contents
Summary Introduction Cash Flows
Cost of Capital Parameters
Impairment Test
Company Values
Online Industry Analyses
Industry Specialists
stable figures. The forecast of cash flows for start-ups results, due to a lack of corporate history, in an intense examination of the operative business model. This then comes round full circle to the “alternative“ methods, for they frequently orient themselves on the observable operative drivers, for lack of a positive corporate performance. The estab-lished methods for predicting cash flow, however, transport the operative business model into a – comprehensible and increasingly successively com-plex – financial model.
With big data and the increasing availability of oper-ative indicators, it is not only possible to obtain a direct connection between the development of the operative drivers of a business model and its finan-cial performance. More importantly, it is also pos-sible to consistently compile the value-relevant risks of a start-up. Due to the fact that a purely financial performance orientation with start-ups provides only limited information as a result of initial losses, the assessment of the risk development is partic-ularly important. It is precisely innovative business models that are subject to significant changes in the operative risk at the beginning of their lifecycle –which contributes significantly to the company value development, especially in the early periods. It can therefore be shown that the high probability of failure in young companies, especially in the early lifecycle phases, decreases dramatically and the expected returns required decrease with declining risks. Only when the risks in the cash flow forecast are correctly compiled and measured, is it possible to appropriately reflect these risks in their compara-tive measures – the cost of capital (see Cost of Cap-
ital – Comparative Measures in a World that Increas-ingly Defies Comparison, page 45).
With CEDA (Corporate Economic Decision Assessment), KPMG possesses a value-oriented decision-making and steering method for the valu-ation of start-ups and innovative business models that transparently fulfills the special requirements and expectations for start-up forecasts.
“Comprehensive cash flow forecasts are not uniformly applied in the start-up environment. The unavoidable focus on the operative drivers does, however, provide – in contrast to the frequently applied valuation practice – ideal conditions for the consistent application of established planning procedures.”
Dr. Marc CastedelloPartner, KPMG in Germany
© 2
018
KP
MG
Inte
rnat
iona
l Co
op
erat
ive
(“K
PM
G In
tern
atio
nal”
), a
Sw
iss
enti
ty. M
emb
er f
irm
s of
the
KP
MG
net
wor
k of
ind
epen
den
t fi
rms
ar
e af
filia
ted
wit
h K
PM
G In
tern
atio
nal.
All
righ
ts r
eser
ved
. The
KP
MG
nam
e an
d lo
go
are
regi
ster
ed
trad
emar
ks o
f K
PM
G In
tern
atio
nal.
Table of Contents
Summary Introduction Cash Flows
Cost of Capital Parameters
Impairment Test
Company Values
Online Industry Analyses
Industry Specialists

2.5 Determination of the Sustainable Year
The determination of the terminal value is of mate-rial importance in establishing the value of the company. Prerequisite to and the starting point for deriving the terminal value is that the company has reached the “steady state”.
“In view of the significant relevance of the value of the terminal value as well as the necessity of expected values, the determination of the sustainable year should be performed on the basis of scenarios. Simulation-based methods such as the Monte-Carlo simulations are avail-able to that end.“
Stefan SchönigerPartner, KPMG in Germany
Source: KPMG, 2017
Last planning year and top-down
adjustment
11
48
Average of the planning years (and the past, if necessary)
Other
7
Last planning year (unadjusted)
42
50
40
30
20
10
0
14 Determination of the terminal value Total (in percent, multiple choices possible)
© 2
018
KP
MG
Inte
rnat
iona
l Co
op
erat
ive
(“K
PM
G In
tern
atio
nal”
), a
Sw
iss
enti
ty. M
emb
er f
irm
s of
the
KP
MG
net
wor
k of
ind
epen
den
t fi
rms
ar
e af
filia
ted
wit
h K
PM
G In
tern
atio
nal.
All
righ
ts r
eser
ved
. The
KP
MG
nam
e an
d lo
go
are
regi
ster
ed
trad
emar
ks o
f K
PM
G In
tern
atio
nal.
Table of Contents
Summary Introduction Cash Flows
Cost of Capital Parameters
Impairment Test
Company Values
Online Industry Analyses
Industry Specialists
As in the previous years, the majority of the study participants determined the terminal value on the basis of the last detailed budget year with the pos-sible consideration of top-down adjustments. With 48 percent (previous year: 40 percent), signifi-cantly more companies performed an adjustment of the forecasting results for determining the terminal value. Only 7 percent (previous year: 11 percent) of the participating companies applied an average of the planning years (and the past, if necessary) to determine the terminal value. (Figure 14)

3 Determination of the Cost of Capital Parameters
© 2
018
KP
MG
Inte
rnat
iona
l Co
op
erat
ive
(“K
PM
G In
tern
atio
nal”
), a
Sw
iss
enti
ty. M
emb
er f
irm
s of
the
KP
MG
net
wor
k of
ind
epen
den
t fi
rms
ar
e af
filia
ted
wit
h K
PM
G In
tern
atio
nal.
All
righ
ts r
eser
ved
. The
KP
MG
nam
e an
d lo
go
are
regi
ster
ed
trad
emar
ks o
f K
PM
G In
tern
atio
nal.
Table of Contents
Summary Introduction Cash Flows
Cost of Capital Parameters
Impairment Test
Company Values
Online Industry Analyses
Industry Specialists

3.1 WACC Overview
Determining the WACC requires a weighting of the cost of equity with the equity ratio (at market val-ues) and the cost of debt with the debt ratio (at mar-ket values).
Following an almost constant value of 7.1 percent in the last two years, the average WACC applied declined this year and reached, with 6.9 percent, the lowest value since the first publication of the Cost of Capital Study. The downward trend of the last few years continued and was essentially driven by a dramatically declining risk-free rate, which
could not be completely compensated with the cor-responding increase of the market risk premiums. (Figure 15)
The decrease in the WACC was not, however, found to be uniform across all the industries. While the average WACC applied decreased slightly overall, it increased, by contrast, in nearly half of the indus-tries. The strongest increases, with 0.8 and 0.7 per-centage points, were found in the sectors health care and technology to 7.7 percent and 8.6 per-cent, respectively. The strongest decline in WACC, with 0.7 percentage points, was in the chemicals & pharmaceuticals sector to 6.6 percent. (Figure 16)
Source: KPMG, 2017
10
8
6
4
2
0
15 WACC (after corporate taxes) Total (in percent)
2015/ 2016
2016/ 2017
7.1 6.9
2014/ 2015
7.1
2013/ 2014
7.8
2007/ 2008
8.2
2009/ 2010
8.2
2011/ 2012
7.9
2006/ 2007
8.1
2008/ 2009
8.0
2010/ 2011
7.9
2012/ 2013
7.7
2005/ 2006
8.1
2 4 6 108
6.6
7.2
5.9
7.7
7.4
n/m
7.2
7.3
7.2
6.3
6.9
7.6
n/a
n/m
7.37.2
4.4
8.67.9
6.9
6.97.1
6.86.9
7.37.6
16 WACC (after corporate taxes) by industry (in percent)
Source: KPMG, 2017
2016/2017 2015/2016
Family-owned businessesNon-family-owned businesses
Automotive
Chemicals & Pharmaceuticals
Consumer Markets
Energy & Natural Resources
Financial Services
Health Care
Industrial Manufacturing
Media & Telecommunications
Real Estate
Technology
Transport & Leisure
Total
© 2
018
KP
MG
Inte
rnat
iona
l Co
op
erat
ive
(“K
PM
G In
tern
atio
nal”
), a
Sw
iss
enti
ty. M
emb
er f
irm
s of
the
KP
MG
net
wor
k of
ind
epen
den
t fi
rms
ar
e af
filia
ted
wit
h K
PM
G In
tern
atio
nal.
All
righ
ts r
eser
ved
. The
KP
MG
nam
e an
d lo
go
are
regi
ster
ed
trad
emar
ks o
f K
PM
G In
tern
atio
nal.
Table of Contents
Summary Introduction Cash Flows
Cost of Capital Parameters
Impairment Test
Company Values
Online Industry Analyses
Industry Specialists

There were particularly differences within the indus-tries themselves, especially in the sectors con-sumer markets and media & telecommunications. More precisely, the WACC in the sub-sectors con-sumer markets and retail was applied at 7.6 percent and 6.4 percent, respectively, in the sub-sectors media and telecommunications at 7.8 percent and 5.7 percent, respectively.
With regard to the WACC applied, there were no significant differences between family-owned and non-family-owned businesses.
Study results in the past have demonstrated that the study participants applied various costs of cap-ital for differing types of valuations. In principle, the cost of capital derived should at least be based on consistent concepts. Nevertheless, only 58 percent performed a reconciliation between the impairment test and M&A transactions/investment decisions (previous year: 62 percent). A reconciliation with the cost of capital for fiscal valuations was only per-formed by 34 percent of the companies (previous year: 40 percent). (Figure 17 and 18)
Source: KPMG, 2017
Lower cost of capital for
impairment test
42
26
No difference Not compared
25
Higher cost of capital for
impairment test
Lower cost of capital for
impairment test
No difference Not compared Higher cost of capital for
impairment test
11
50
40
30
20
10
0
17 Deviation of the cost of capital in M&A transactions and investment decisions Total (in percent, multiple choices possible)
Source: KPMG, 2017
66
2
30
3
70
60
50
40
30
20
10
0
18 Deviation of cost of capital for fiscal valuations Total (in percent, multiple choices possible)
© 2
018
KP
MG
Inte
rnat
iona
l Co
op
erat
ive
(“K
PM
G In
tern
atio
nal”
), a
Sw
iss
enti
ty. M
emb
er f
irm
s of
the
KP
MG
net
wor
k of
ind
epen
den
t fi
rms
ar
e af
filia
ted
wit
h K
PM
G In
tern
atio
nal.
All
righ
ts r
eser
ved
. The
KP
MG
nam
e an
d lo
go
are
regi
ster
ed
trad
emar
ks o
f K
PM
G In
tern
atio
nal.
Table of Contents
Summary Introduction Cash Flows
Cost of Capital Parameters
Impairment Test
Company Values
Online Industry Analyses
Industry Specialists

GUEST COMMENTARY
Cost of Capital – The Challenges of Low Interest Rates, Populism, and New Technologies “Market prices are usually wrong. Generally, we just don’t know the extent of the erroneous valuation; in some cases we don’t even know whether it is plus or minus.” This quote from an unknown investor reflects the difficulty in determining the fair value of companies, especially in times of low interest, increasing political uncertainty and rapid technolog-ical change.
In the current interest environment, traditional dis-counting methods reach their limits: The calcu-lated fair value for stocks (markets) is too high if the application of the current low market interest for a risk-free investment is not accompanied by corres-pondingly low expectations for future cash flows. This is absolutely necessary due to the fact that a low-interest environment is, amongst other things, the flip-side of the low-growth environment coin. But even then there are difficulties in valuations; if the monetary policy of the central banks is too expansive, i.e. the interest for a risk-free invest-ment is too low, investors’ appetite for risk and stock prices overshoot the long-term fair value, for instance as seen in the cycle-adjusted average price-earnings multiples with simultaneously low volatility. From our perspective, this is currently the case, especially in the USA, while European stocks continue to show a reasonable valuation compared to the long-term history. Just the same, the differ-ence between stock returns and the risk-free rate appears to be outstandingly high not only for US stocks, but for European stocks as well. This does not necessarily mean, in our opinion, that investors
demand a higher risk premium. It is much more a sign of an interest level that is distortedly low. As empirical analyses have demonstrated, the connec-
tion between stock market and bond market returns is unstable, especially in low-interest periods.
19 Central bank interest rates relative to “neutral” level 1
Quelle: Allianz GI, Datastream1 Difference calculated as the difference between Fed Funds Target Rate or Repo Rate of the
European Central Bank and the individually adjusted trend growth
3
2
1
0
– 1
– 2
– 3
– 4
– 5
Q1/1988 Q1/1993 Q1/1998 Q1/2003 Q1/2008 Q1/2013
USA Eurozone
© 2
018
KP
MG
Inte
rnat
iona
l Co
op
erat
ive
(“K
PM
G In
tern
atio
nal”
), a
Sw
iss
enti
ty. M
emb
er f
irm
s of
the
KP
MG
net
wor
k of
ind
epen
den
t fi
rms
ar
e af
filia
ted
wit
h K
PM
G In
tern
atio
nal.
All
righ
ts r
eser
ved
. The
KP
MG
nam
e an
d lo
go
are
regi
ster
ed
trad
emar
ks o
f K
PM
G In
tern
atio
nal.
Table of Contents
Summary Introduction Cash Flows
Cost of Capital Parameters
Impairment Test
Company Values
Online Industry Analyses
Industry Specialists

Figure 19 on the previous page illustrates the differ-ence between the individual central bank interest rates for the USA and the Eurozone, Fed Funds Tar-get Rate (USA) or Repo Rate (Eurozone), and indi-vidually adjusted trend growth. Empirically, the cen-tral bank interest rate is on average slightly below the trend growth, in accordance with the results of the neoclassical growth theory. The trend growth is estimated on the basis of long-term average growth rates.
With regard to the coming quarters, the above-men-tioned valuation problem will wane; in view of the improving economic conditions, we expect a nor-malization of the monetary policy on both sides of the Atlantic. Consequently, the interest for risk-free investments will once again slowly increase.
The undeniable increase in political uncertainty, above all, the attraction to populist parties around the world makes the valuations of stocks (markets) more difficult, also because their economic impli-cations are so often very difficult to appraise. In our opinion, the risk of deglobalization, i.e. the potential increase in trade and immigration barriers, deserves the greatest attention. Deglobalization inhibits growth because it has a negative impact on the international division of labor and therefore on the growth of productivity. To that extent, the valuation effect would be negative. A decline in international trade would also increase inflation. On the one hand, due to the lower growth in productivity the gap between aggregate supply and demand closes more quickly and, on the other hand, directly, due to increased prices in the form of tariffs. The impact on the discount rate is therefore ex ante ambiguous.
The real interest rate would decline, the inflation premium would, however, climb.
In the end, it is not clear what the impact of the increasing rate of technological innovations is on the valuation of equity. The “creative power of disrup-tion” results in winners and losers among individual securities. Because these are difficult to identify in a quickly changing environment, one could argue that a higher risk premium would be justified. Should the currently indicated fourth industrial revolution re sult in aggregate gains in productivity, it would have a positive impact on discounting models at the total market level by means of an increase of the ex -pected cash flows. The effect on the discount rate (higher real interest, lower inflation premium) would be ex ante unclear. Currently, and for some surpris-ingly, there is to date, however, no sign of a struc-tural increase in the aggregate productivity growth.
“In view of the current challenges – low interest rates, political uncertainties, technological change – comparisons with historical valuation multiples maintain their role as important valuation anchors, at least for being able to correctly estimate whether erroneous esti-mates are plus or minus.”
Stefan HofrichterManaging Director, Head of Global Economics & Strategy,Allianz Global Investors GmbH
© 2
018
KP
MG
Inte
rnat
iona
l Co
op
erat
ive
(“K
PM
G In
tern
atio
nal”
), a
Sw
iss
enti
ty. M
emb
er f
irm
s of
the
KP
MG
net
wor
k of
ind
epen
den
t fi
rms
ar
e af
filia
ted
wit
h K
PM
G In
tern
atio
nal.
All
righ
ts r
eser
ved
. The
KP
MG
nam
e an
d lo
go
are
regi
ster
ed
trad
emar
ks o
f K
PM
G In
tern
atio
nal.
Table of Contents
Summary Introduction Cash Flows
Cost of Capital Parameters
Impairment Test
Company Values
Online Industry Analyses
Industry Specialists

3.2 Risk-free Rate
The downward trend of the average long-term risk-free rate continued this year. The average risk-free rate applied by the study participants in Germany, Austria and Switzerland decreased to what is now 0.9 percent and therefore reached, for the first time since the Cost of Capital Study has been published, a level below one percent (2015/2016: 1.5 percent). (Figure 20)
Yield curves in the Eurozone as well as in Switzer-land continued to decline and the level of interest rates in Europe declined for the fourth year to a new historical low level. There was, however, at the time the study was being written, a slight increase of the long-term interest rates.
Driven by the declining yield curves, the risk-free rate applied by companies in Germany and Austria decreased by 0.6 percentage points to 0.9 percent. In Switzerland, the decrease was 0.5 percentage points to only 0.8 percent.
As a result of the sharp decline of the average risk-free rate applied in Germany and Austria, the interest rate difference between the two currencies decreased further and is now 0.1 percent (previous year: 0.2 percent). (Figure 21; Figure 22, page 32)
Source: KPMG, 2017
20 Average risk-free rate applied Total (in percent)
2015/ 2016
2016/ 2017
2014/ 2015
2013/ 2014
2007/ 2008
2009/ 2010
2011/ 2012
2006/ 2007
2008/ 2009
2010/ 2011
2012/ 2013
2005/ 2006
4.94.4 4.3 4.3
3.9
3.3 3.1
2.32.6
1.81.5
0.9
5
4
3
2
1
0
Source: KPMG analyses on the basis of data from the European Central Bank and Swiss Nationalbank
20172016201520142008 2010 20122007 2009 2011 2013
5.0
4.5
4.0
3.5
3.0
2.5
2.0
1.5
1.0
0.5
0
21 Yield curve European Central Bank versus Swiss Nationalbank (in percent)
EUR risk-free rate on the basis of the European Central Bank yield curve (AAA sample, three- month average)
EUR risk-free rate as per the annual Cost of Capital Study
CHF risk-free rate on the basis of the Swiss Nationalbank yield curve (three-month average)
CHF risk-free rate as per the annual Cost of Capital Study
© 2
018
KP
MG
Inte
rnat
iona
l Co
op
erat
ive
(“K
PM
G In
tern
atio
nal”
), a
Sw
iss
enti
ty. M
emb
er f
irm
s of
the
KP
MG
net
wor
k of
ind
epen
den
t fi
rms
ar
e af
filia
ted
wit
h K
PM
G In
tern
atio
nal.
All
righ
ts r
eser
ved
. The
KP
MG
nam
e an
d lo
go
are
regi
ster
ed
trad
emar
ks o
f K
PM
G In
tern
atio
nal.
Table of Contents
Summary Introduction Cash Flows
Cost of Capital Parameters
Impairment Test
Company Values
Online Industry Analyses
Industry Specialists

23 Determination of risk-free rate in Germany
and Austria Total (in percent)
Source: KPMG, 2017
Up to 10 years More than 10 and less
than 30 years 30 years and more
19
2655
24 Determination of risk-free rate in Switzerland Total (in percent)
Source: KPMG, 2017
Up to 10 years More than 10 and less
than 30 years 30 years and more
64
23
13
When analyzing the risk-free rates applied, espe-cially the different maturities of the government bonds/yield curves used also have to be considered. In view of the generally existing premises of the going concern and the resultant infinite timeframe of business valuations, a longest-term interest rate is preferred to guarantee the term equivalence and therefore the application of long-term yield curves.
This principle was adhered to by just about half of all the study participants (48 percent) in the observa-
Source: KPMG, 2017
22 Average risk-free rate applied Germany / Austria versus Switzerland (in percent)
2010/2011 2011/2012 2012/2013 2015/2016 2016/20172014/20152013/2014
3.5
3.0
2.5
2.0
1.5
1.0
0.5
0
3.5 3.4
2.52.7
1.9
2.7
1.8
1.2
1.9
1.4 1.51.3
0.9 0.8
Germany/Austria Switzerland
© 2
018
KP
MG
Inte
rnat
iona
l Co
op
erat
ive
(“K
PM
G In
tern
atio
nal”
), a
Sw
iss
enti
ty. M
emb
er f
irm
s of
the
KP
MG
net
wor
k of
ind
epen
den
t fi
rms
ar
e af
filia
ted
wit
h K
PM
G In
tern
atio
nal.
All
righ
ts r
eser
ved
. The
KP
MG
nam
e an
d lo
go
are
regi
ster
ed
trad
emar
ks o
f K
PM
G In
tern
atio
nal.
Table of Contents
Summary Introduction Cash Flows
Cost of Capital Parameters
Impairment Test
Company Values
Online Industry Analyses
Industry Specialists
tion period (previous year: 45 percent) and applied to determine the risk-free rate of government bonds and yield curves with a term of 30 years or more. In Germany and Austria, this procedure was applied most frequently with a ratio of 55 percent. In Switzerland, by contrast, the participating com-panies continue to apply government bonds/yield curves with a maximum term of ten years. With a value of 59 percent in the previous year, the portion of Swiss companies using this method increased this year to 64 percent. (Figure 23 and 24)

Return for the latest German bonds with a term of 10 years
Return for the latest German bonds with a term of 30 years
Interest for Swiss bonds with an agreed term of 10 years
Interest for Swiss bonds with an agreed term of 30 years
Source: KPMG analyses on the basis of data from the European Central Bank and Swiss Nationalbank
2016 2017201520142008 2010 201220072006200520042003 2009 2011 2013
6,0
5,5
5,0
4,5
4,0
3,5
3,0
2,5
2,0
1,5
1,0
0,5
0
-0,5
-1,0
25 10-year versus 30-year bonds Germany versus Switzerland (in percent)
Figure 25 shows the average difference in returns for bonds from Germany and Switzerland, which result due to the use of ten-year bonds compared to thirty-year bonds.
3.3 Market Risk Premium
In principle, the determination of the market risk premium requires the pricing of the capital mar-ket participants. It is to be assumed that investors see an additional risk in the financial investment in companies compared to risk-free investments. The market risk premium describes returns demanded by an investor above the risk-free rate for holding a market portfolio containing risky securities. It is a component of the investor’s total return which is explained with the aid of capital market pricing mod-els (CAPM, Capital Asset Pricing Model).
The capital-market-oriented market risk premium is calculated by the difference in returns between investments in a representative market portfolio – consisting of risky securities (stocks) – and risk-free investments and can be based on both histor-ical as well as future-oriented data. The market risk premium is therefore not a parameter that can be directly observed in the capital market.
Historically, the average market risk premium of the company fluctuated in a relatively stable corridor of 5.0 to 5.2 percent until 2011/2012. As a result of the economic and financial crisis of that time as well as the sovereign debt crisis of 2012 and the associated increase in risk aversion, the risk premiums required after 2012/2013 increased.
© 2
018
KP
MG
Inte
rnat
iona
l Co
op
erat
ive
(“K
PM
G In
tern
atio
nal”
), a
Sw
iss
enti
ty. M
emb
er f
irm
s of
the
KP
MG
net
wor
k of
ind
epen
den
t fi
rms
ar
e af
filia
ted
wit
h K
PM
G In
tern
atio
nal.
All
righ
ts r
eser
ved
. The
KP
MG
nam
e an
d lo
go
are
regi
ster
ed
trad
emar
ks o
f K
PM
G In
tern
atio
nal.
Table of Contents
Summary Introduction Cash Flows
Cost of Capital Parameters
Impairment Test
Company Values
Online Industry Analyses
Industry Specialists

26 Average market risk premium Total (in percent)
Source: KPMG, 2017
2005/ 2006
5.0
2006/ 2007
4.7
2007/ 2008
5.0
2008/ 2009
5.1
2009/ 2010
5.1
2010/ 2011
5.1
2011/ 2012
5.2
2012/ 2013
5.8
2013/ 2014
5.8
2014/ 2015
6.1
2015/ 2016
2016/ 2017
6.3 6.5
7
6
5
4
3
2
1
0
27 Change in expected returns in Germany (in percent)
Market risk premium Risk-free rate
Implicit returns FAUB range
10
9
8
7
6
5
4
3
2
1
0
12/2
013
01/2
014
02/2
014
03/
2014
04
/201
4
05/
2014
06
/201
4
07/2
014
08
/201
4
09/
2014
10/2
014
11/2
014
12/2
014
01/2
015
02/2
015
03/
2015
04
/201
5
05/
2015
06
/201
5
07/2
015
08
/201
5
09/
2015
10/2
015
11/2
015
12/2
015
01/2
016
02/2
016
03/
2016
04
/201
6
05/
2016
06
/201
6
07/2
016
08
/201
6
09/
2016
10/2
016
11/2
016
12/2
016
01/2
017
02/2
017
03/
2017
04
/201
7
05/
2017
06
/201
7
07/2
017
Source: KPMG analysis on the basis of data from S&P Capital IQ
10
9
8
7
6
5
4
3
2
1
0
Ris
k-fr
ee r
ate
Yie
lds
and
mar
ket
risk
prem
ium
In this connection, the Technical Committee for Business Valuation and Economics (FAUB, Fachausschuss für Unternehmensbewertung) of the Institute of Public Auditors in Germany (IDW, Institut der Wirtschaftsprüfer) published the “Comments of the FAUB regarding the consid-eration of the financial market crisis for the determ-ination of the discount rate in the valuation of com-panies” on 19 September 2012. In the framework of this publication, the committee recommended applying a market risk premium before personal taxes of between 5.5 percent and 7.0 percent. Based on the range recommended by the FAUB, own analyses for the determination of the market risk premium should always be performed.
© 2
018
KP
MG
Inte
rnat
iona
l Co
op
erat
ive
(“K
PM
G In
tern
atio
nal”
), a
Sw
iss
enti
ty. M
emb
er f
irm
s of
the
KP
MG
net
wor
k of
ind
epen
den
t fi
rms
ar
e af
filia
ted
wit
h K
PM
G In
tern
atio
nal.
All
righ
ts r
eser
ved
. The
KP
MG
nam
e an
d lo
go
are
regi
ster
ed
trad
emar
ks o
f K
PM
G In
tern
atio
nal.
Table of Contents
Summary Introduction Cash Flows
Cost of Capital Parameters
Impairment Test
Company Values
Online Industry Analyses
Industry Specialists

In view of this, the participants, assuming the rel-evant overall returns, considered once again a subsequent increase of the market risk premium by 0.2 percentage points, resulting in an average applied market risk premium of 6.5 percent that would at least partially compensate the decrease in the risk-free rate. (Figure 26, page 34)
This development also coincides with the implicit returns observed for listed corporations in Germany. While the level of interest in Europe has persisted at a historically low level for six years now, the mar-ket risk premium as the difference between stock returns and the risk-free rate remains at a high level above long-term historical averages. (Figure 27, page 34)
28 Average market risk premium Germany versus Austria versus Switzerland (in percent)
7
6
5
4
3
2
1
0
2009/2010 2010/2011 2011/2012 2013/2014 2014/2015 2015/2016 2016/20172012/2013
5.0 5.0 5.26.0 6.0 6.3
5.0
6.0 6.06.4
5.4
n/a n/a
5.1 5.0 5.3 5.3
6.4 6.45.7
6.6 6.65.9
Source: KPMG, 2017 Germany Austria Switzerland
5.5
29 Average market risk premium by industry (in percent)
2 4 6 8
6.6
6.6
6.5
6.4
6.3
6.4
6.46.3
6.66.4
6.46.1
6.4
6.56.5
6.5
6.56.4
6.2
6.2
6.56.3
6.56.5
6.76.5
Source: KPMG, 2017
2016/2017 2015/2016
Family-owned businessesNon-family-owned businesses
Automotive
Chemicals & Pharmaceuticals
Consumer Markets
Energy & Natural Resources
Financial Services
Health Care
Industrial Manufacturing
Media & Telecommunications
Real Estate
Technology
Transport & Leisure
Total
“Implicit market risk premiums represent an appropriate method for specifying ranges that are derived from historical analyses of the market risk premium. They are an essential element for fulfilling the postulate of forward- looking parameters in the determination of all cost of capital parameters.“
Stefan SchönigerPartner, KPMG in Germany
© 2
018
KP
MG
Inte
rnat
iona
l Co
op
erat
ive
(“K
PM
G In
tern
atio
nal”
), a
Sw
iss
enti
ty. M
emb
er f
irm
s of
the
KP
MG
net
wor
k of
ind
epen
den
t fi
rms
ar
e af
filia
ted
wit
h K
PM
G In
tern
atio
nal.
All
righ
ts r
eser
ved
. The
KP
MG
nam
e an
d lo
go
are
regi
ster
ed
trad
emar
ks o
f K
PM
G In
tern
atio
nal.
Table of Contents
Summary Introduction Cash Flows
Cost of Capital Parameters
Impairment Test
Company Values
Online Industry Analyses
Industry Specialists

30 Distribution of the market risk premiums of German companies (in percent)
Source: KPMG, 2017
0 17
43
24
17
8
Below 6.0 percent
6.01 to 6.25 percent
6.26 to 6.5 percent
6.76 to 7.0 percent
7.01 to 7.25 percent
Above 7.25 percent
6.51 to 6.75 percent
45
40
35
30
25
20
15
10
5
0
The increase of the average market risk premium applied could be observed equally in all three coun-tries. It increased in each case by 0.2 percentage points and was in Germany and Austria 6.6 percent (previous year: 6.4 percent), in Switzerland 5.9 per-cent (previous year: 5.7 percent). (Figure 28, page 35)
Because of the definition of the market risk premium as an industry-independent parameter, there should not be any recognizable material differences be- tween the individual industries. Accordingly, the market risk premiums applied by the study partici- pants were in a narrow range of 6.4 to 6.7 percent,
© 2
018
KP
MG
Inte
rnat
iona
l Co
op
erat
ive
(“K
PM
G In
tern
atio
nal”
), a
Sw
iss
enti
ty. M
emb
er f
irm
s of
the
KP
MG
net
wor
k of
ind
epen
den
t fi
rms
ar
e af
filia
ted
wit
h K
PM
G In
tern
atio
nal.
All
righ
ts r
eser
ved
. The
KP
MG
nam
e an
d lo
go
are
regi
ster
ed
trad
emar
ks o
f K
PM
G In
tern
atio
nal.
Table of Contents
Summary Introduction Cash Flows
Cost of Capital Parameters
Impairment Test
Company Values
Online Industry Analyses
Industry Specialists
whereby automotive was the highest, the sectors financial services, energy & natural resources as well as transport & leisure, starting from a lower level, formed the lower end of the spectrum. (Figure 29, page 35)
Overall, this year 82 percent of the German study participants reported that they applied a market risk premium of 6.01 to 7.00 percent, whereby the majority of these companies applied a market risk premium between 6.75 and 7.00 percent. (Figure 30)
3.4 Beta Factor
The beta factor is another important element in the determination of the costs of equity. In accordance with the CAPM, it is formed – along with the risk-free rate – by the risk premium to be considered from the general market risk premium and the com-pany-specific beta factor.
The beta factor expresses how much an individual title fluctuates in relation to a comparable market portfolio. It therefore represents the valuation-rele-vant company-specific risk in relation to the general market risk.
The difficulty in determining the future beta factor can be attributed to the following aspects: In prac-tice, beta factors are generally determined on the basis of historical returns from which the future-ori-ented beta factor is derived for valuation purposes. Furthermore, there are various hurdles in the com-piling of historical beta factors – for example, that cash generating units (CGUs), as units to be valu-ated in the framework of the impairment test, are in principle not listed companies. Consequently, no beta factors can be directly determined for the CGU from the capital market. For that reason, in practice a group of comparable, listed companies – a so-called peer group – is used, together with its capital market data on the valuation date, to deter-mine the company-specific risk of the CGU as best as possible.

If the individual CGUs are subjected to different operative risks, a separate peer group should be applied for every CGU so as to adequately reflect the differing risk profile of the individual CGUs.
The derivation of the beta factor from a peer group is implicitly required for the determination of the fair value less costs of disposal and the value in use, so as to take into account the necessary market per-spective.
Overall, the percentage of the study participants that applied a peer group to derive a risk-adequate beta factor was at 93 percent (fair value less costs of disposal) and 86 percent (value in use) and ranged with slight variations on the level of the previous year (93 and 83 percent).
In addition to using a peer group, alternative approaches can be considered that are suitable for simulating the operative risk of CGUs directly from market and company data (Please refer to the key topics from the current and last year’s study). Such methods are being applied increasingly in valuation practice.
The application of beta factors from the group/com-pany compiling the balance sheet is only then appro-priate for the impairment test of the CGU if the oper-ative risk of the CGU coincides with the operative risk of the group. For listed companies, the price of the shares of the company should not be subject to any significant fluctuations that are not associated with the company’s risk profile. According to the study results this year, the beta factor of the com-pany compiling the balance sheet was, with 12 per-cent (value in use) and 4 percent (fair value less costs of disposal), about the same as that of parti-cipating companies in the previous year.
Industry beta factors still were applied rarely. Over-all, this approach formed the basis for 2 percent for the derivation of the value in use and 3 percent for fair value less costs of disposal (previous year: 4 and 3 percent). (Figure 31)
31 Basis of the beta factor Total (in percent)
Company beta factor
100
80
60
40
20
0
Value in use Fair value less costs of disposal Source: KPMG, 2017
2
Beta factor by industry
12 4
Peer group beta factor
8693
3
Unlevered beta factors
The unlevered beta factor reflects the operative risk in determining the cost of capital. Compared to the previous year, the unlevered beta factor increased slightly to 0.86 (2015/2016: 0.85). (Figure 33, page 38)
While a moderate increase was seen in most indus-tries, the unlevered beta factor applied in the tech-nology sector increased by 0.07 to 1.03 and was therefore the highest value applied in the industry comparison. The reason for this could be in the spe-cial challenges of the companies caused by digital-ization.
By contrast, in automotive and transport & leisure, there was a decline in the unlevered beta factors by 0.02 to 0.99 and 0.76, respectively. (Figure 32, page 38)
A differentiation was to be seen within the indus-tries, especially in the media & telecommunica-tions sector. While the entire sector showed an unlevered beta factor of 0.87, in the sub-sectors media and telecommunications values averaged 0.94 and 0.67, respectively.
© 2
018
KP
MG
Inte
rnat
iona
l Co
op
erat
ive
(“K
PM
G In
tern
atio
nal”
), a
Sw
iss
enti
ty. M
emb
er f
irm
s of
the
KP
MG
net
wor
k of
ind
epen
den
t fi
rms
ar
e af
filia
ted
wit
h K
PM
G In
tern
atio
nal.
All
righ
ts r
eser
ved
. The
KP
MG
nam
e an
d lo
go
are
regi
ster
ed
trad
emar
ks o
f K
PM
G In
tern
atio
nal.
Table of Contents
Summary Introduction Cash Flows
Cost of Capital Parameters
Impairment Test
Company Values
Online Industry Analyses
Industry Specialists

32 Average unlevered beta factors by industry
0.84
0.85
0.80
0.85
0.91
n/m
0.76
0.83
0.83
0.76
0.79
0.91
n/a
n/m
0.870.84
0.42
1.030.96
0.78
0.860.85
0.890.86
0.991.01
Source: KPMG, 2017
2016/2017 2015/2016
Family-owned businessesNon-family-owned businesses
Automotive
Chemicals & Pharmaceuticals
Consumer Markets
Energy & Natural Resources
Financial Services
Health Care
Industrial Manufacturing
Media & Telecommunications
Real Estate
Technology
Transport & Leisure
Total
Source: KPMG, 2017
1.0
0.8
0.6
0.4
0.2
0
33 Average unlevered beta factors Total
0.900.97
0.890.80
0.86 0.85 0.890.83 0.85 0.85 0.86
2015/ 2016
2016/ 2017
2014/ 2015
2013/ 2014
2007/ 2008
2009/ 2010
2011/ 2012
2006/ 2007
2008/ 2009
2010/ 2011
2012/ 2013
“The higher unlevered beta factor in family- owned businesses is in particular attributable to the deviating industry mix in family-owned and non-family-owned businesses. An above- average number of participating family-owned businesses are active in the automotive and industrial manufacturing sector.“
Dr. Vera-Carina ElterPartner, Managing Partner for Family-Owned Businesses, KPMG in Germany
0.40.2 0.6 0.8 1.0 1.2
© 2
018
KP
MG
Inte
rnat
iona
l Co
op
erat
ive
(“K
PM
G In
tern
atio
nal”
), a
Sw
iss
enti
ty. M
emb
er f
irm
s of
the
KP
MG
net
wor
k of
ind
epen
den
t fi
rms
ar
e af
filia
ted
wit
h K
PM
G In
tern
atio
nal.
All
righ
ts r
eser
ved
. The
KP
MG
nam
e an
d lo
go
are
regi
ster
ed
trad
emar
ks o
f K
PM
G In
tern
atio
nal.
Table of Contents
Summary Introduction Cash Flows
Cost of Capital Parameters
Impairment Test
Company Values
Online Industry Analyses
Industry Specialists
Levered beta factors
The levered beta factor serves as a metric for the equity provider’s systematic risk under consider-ation of the capital structure risk from debt. This year the participants applied a levered beta factor of 1.03 (previous year: 0.99). With a slightly reduced debt ratio, the increase is attributable to the higher unlevered beta factor as well as the decrease in the cost of debt. (Figure 34, page 39)
Due to the fact that the beta factor is a relative measure of risk, the average of all the market levered beta factors should have a value of 1.00. As in the previous years, the data collected clearly ranges around this theoretically correct value. The empirical data of this study therefore sufficiently

Source: KPMG, 2017
2015/ 2016
2016/ 2017
2014/ 2015
2013/ 2014
2007/ 2008
2009/ 2010
2011/ 2012
2006/ 2007
2008/ 2009
2010/ 2011
2012/ 2013
34 Average levered beta factors Total
1.10 1.08 1.04 1.02 1.02 1.05 1.050.99 1.03 0.99 1.03
1.2
1.0
0.8
0.6
0.4
0.2
0
35 Average levered beta factors by industry
0.99
1.00
1.08
1.13
0.99
0.95
1.010.89
1.071.03
0.880.90
1.11
n/a
1.120.95
0.70
1.311.12
0.97
1.030.99
0.981.04
1.141.15
Source: KPMG, 2017
2016/2017 2015/2016
Family-owned businessesNon-family-owned businesses
Automotive
Chemicals & Pharmaceuticals
Consumer Markets
Energy & Natural Resources
Financial Services
Health Care
Industrial Manufacturing
Media & Telecommunications
Real Estate
Technology
Transport & Leisure
Total
represent the whole market. This demonstrates that at least in the average of the impairment test, there are no systematic errors in the estimation of the beta factor and therefore the systematic risk.
Within the industries there was, for the most part, an increase of the levered beta factor. The largest growth, with a climb of 0.19 to 1.31, was in the tech-nology sector, which now has the highest levered beta factor. The lowest value this year was 0.88 in health care. (Figure 35)
Within the financial services sector, the sub-sector banking showed an increase in the levered beta factor of 1.02 compared to 1.09 for the previous year. In the sub-sector insurance, there was even an increase from 1.03 to 1.13. The lower levered beta factor of 1.07 in the financial services industry resulted from companies in the sub-sector other financial services, which applied lower values.
While the unlevered beta factor applied by family- owned businesses was above that used by non-family-owned businesses, the opposite was true for the levered beta factor. The reason for this was in particular the much lower amount of debt used by family-owned businesses (see page 49).
0.25 0.5 0.75 1.0 1.25 1.5
© 2
018
KP
MG
Inte
rnat
iona
l Co
op
erat
ive
(“K
PM
G In
tern
atio
nal”
), a
Sw
iss
enti
ty. M
emb
er f
irm
s of
the
KP
MG
net
wor
k of
ind
epen
den
t fi
rms
ar
e af
filia
ted
wit
h K
PM
G In
tern
atio
nal.
All
righ
ts r
eser
ved
. The
KP
MG
nam
e an
d lo
go
are
regi
ster
ed
trad
emar
ks o
f K
PM
G In
tern
atio
nal.
Table of Contents
Summary Introduction Cash Flows
Cost of Capital Parameters
Impairment Test
Company Values
Online Industry Analyses
Industry Specialists

3.5 Cost of Equity
In accordance with the CAPM, the levered cost of equity results from the risk-free rate, the market risk premium and the levered beta factor.
The average levered cost of equity of the participat-ing companies sank again compared to the previous year and is at an historical low of 8.0 percent (pre-vious year: 8.2 percent). This decline resulted from the changes in the individual parameters described in the previous pages. The continued decrease in the risk-free rate was only partially compensated for
by the increase of the market risk premium and the levered beta factor, so that in the end cost-of-equity decreasing effects resulted. (Figure 36)
The industry-specific cost of equity showed a het-erogeneous development. There was a clear down-ward trend to be seen in the sectors transport & leisure, technology, media & telecommunica-tions as well as the financial services sectors. In energy & natural resources and health care, by contrast, there was an increase in the cost of equity. Only in the consumer markets sector did the cost of equity remain constant. (Figure 37, page 41)
36 Average levered cost of equity Total (in percent)
Source: KPMG, 2017
2015/ 2016
2016/ 2017
2014/ 2015
2013/ 2014
2007/ 2008
2009/ 2010
2011/ 2012
2005/ 2006
2006/ 2007
2008/ 2009
2010/ 2011
2012/ 2013
10.19.5 9.5 9.9 9.8
9.1 9.3 8.9 8.7 8.2 8.08.4
12
10
8
6
4
2
0
No significant difference could be seen in the cost of equity applied by family-owned businesses and non-family-owned businesses. In the end, this is also due to the fact that both groups of businesses for the most part determine the cost of capital on the basis of comparable listed companies.
The average levered cost of equity applied by com-panies in Germany as well as Austria and Switzer-land was, with 8.0 percent and 8.4 percent, also slightly below the level of the previous year. (Figure 38, page 41)
“The to date dominant valuation practice of historically derived risks is especially promi-nent in the applied cost of equity by industries. In particular, those industries in which the greatest changes can be expected in their busi-ness models currently apply the lowest cost of equity. This demonstrates that risks should not be historically derived, but rather derived pro-spectively on the basis of financial forecasts.”
Dr. Marc CastedelloPartner, KPMG in Germany
© 2
018
KP
MG
Inte
rnat
iona
l Co
op
erat
ive
(“K
PM
G In
tern
atio
nal”
), a
Sw
iss
enti
ty. M
emb
er f
irm
s of
the
KP
MG
net
wor
k of
ind
epen
den
t fi
rms
ar
e af
filia
ted
wit
h K
PM
G In
tern
atio
nal.
All
righ
ts r
eser
ved
. The
KP
MG
nam
e an
d lo
go
are
regi
ster
ed
trad
emar
ks o
f K
PM
G In
tern
atio
nal.
Table of Contents
Summary Introduction Cash Flows
Cost of Capital Parameters
Impairment Test
Company Values
Online Industry Analyses
Industry Specialists

7.7
7.8
7.7
8.0
8.3
8.6
8.7
7.3
8.2
7.9
7.8
7.3
8.4
7.6
8.7
8.07.5
6.0
9.1
7.9
8.0
8.68.8
37 Average levered cost of equity by industry (in percent)
Automotive
Chemicals & Pharmaceuticals
Consumer Markets
Energy & Natural Resources
Financial Services
Health Care
Industrial Manufacturing
Media & Telecommunications
Real Estate
Technology
Transport & Leisure
Total
Source: KPMG, 2017
2016/2017 2015/2016
20 4 6 108
8.18.0
Family-owned businessesNon-family-owned businesses
n/a
Germany / Austria Switzerland
Source: KPMG, 2017
38 Average levered cost of equity Germany / Austria versus Switzerland
(in percent)
10
8
6
4
2
0
8.0 8.48.68.1
2015/2016 2016/2017
3.6 Other Risk Premiums
With 59 percent in this year’s study, significantly more companies reported applying other risk premi-ums in determining the cost of capital than in the previous year (52 percent).
The number of participants which applied a coun-try risk premium grew by 6.5 percentage points to 46.8 percent. The country risk premium once again represents the most frequently considered risk premium. The reason for the more frequent use could be, on the one hand, that globalization and the activities of companies worldwide continue to increase and, on the other hand, the impression has been gained that there are political risks in more and more countries.
The small size company premium, with 6.8 percent (previous year: 6.1 percent) this year, gained slightly in importance, but played a minor role – similar to premiums for planning uncertainties and financial risks – in the overall picture of possible risk premi-ums. (Figure 39, page 42)
However, there continue to be wide-ranging devi-ations in the application at the country level and therefore in the associated relevance of individual risk premiums.
© 2
018
KP
MG
Inte
rnat
iona
l Co
op
erat
ive
(“K
PM
G In
tern
atio
nal”
), a
Sw
iss
enti
ty. M
emb
er f
irm
s of
the
KP
MG
net
wor
k of
ind
epen
den
t fi
rms
ar
e af
filia
ted
wit
h K
PM
G In
tern
atio
nal.
All
righ
ts r
eser
ved
. The
KP
MG
nam
e an
d lo
go
are
regi
ster
ed
trad
emar
ks o
f K
PM
G In
tern
atio
nal.
Table of Contents
Summary Introduction Cash Flows
Cost of Capital Parameters
Impairment Test
Company Values
Online Industry Analyses
Industry Specialists

Source: KPMG, 2017
40 Other risk premiums 2016/2017 Switzerland (in percent, multiple choices possible)
32.4
11.817.6
32.4
2.9 0.0 2.9
50
40
30
20
10
0
Country risk premium
Flat rate premium
on the cost of capital
Implicit with the increase of the market risk premium
Small size company premium
Risk premium for planning
uncertainties
Risk premium for insolvency
risks
Risk premium for financial
risks
Other No additional risk premiums
8.8
26.5
0.5
Source: KPMG, 2017
50
40
30
20
10
0
Country risk premium
Flat rate premium on the cost of capital
Implicit with the increase of the
market risk premium
Small size company premium
Risk premium for planning
uncertainties
Risk premium for insolvency
risks
Risk premium for financial risks
Other No additional risk premiums
39 Other risk premiums 2015/2016 versus 2016/2017 Total (in percent, multiple choices possible)
6.1 14.610.7
41.0
48.046.840.3
1.52.05.95.1 5.4
0.0 1.53.1
2015 / 2016 2016 / 2017
“In Switzerland, following the international valuation practice, other risk premiums are widespread. With a comparison of the Swiss cost of capital to those of Germany and Austria, these risk premiums should also be considered.”
Johannes PostPartner, KPMG in Switzerland
6.8 6.1
© 2
018
KP
MG
Inte
rnat
iona
l Co
op
erat
ive
(“K
PM
G In
tern
atio
nal”
), a
Sw
iss
enti
ty. M
emb
er f
irm
s of
the
KP
MG
net
wor
k of
ind
epen
den
t fi
rms
ar
e af
filia
ted
wit
h K
PM
G In
tern
atio
nal.
All
righ
ts r
eser
ved
. The
KP
MG
nam
e an
d lo
go
are
regi
ster
ed
trad
emar
ks o
f K
PM
G In
tern
atio
nal.
Table of Contents
Summary Introduction Cash Flows
Cost of Capital Parameters
Impairment Test
Company Values
Online Industry Analyses
Industry Specialists

In Germany, 45.1 percent of the participants did not apply any other risk premiums in terms of the CAPM in the framework of determining their cost of capital (previous year: 52 percent).
While companies in Germany and Austria, with 2.6 percent and 5.6 percent, respectively, only rarely considered a small size company premium, the per-centage in Switzerland, at 26.5 percent, was ten times that of Germany (previous year: 24.1 percent). Companies from Austria, with 66.7 percent, applied the country risk premiums most frequently (previ-ous year: 68.4 percent). (Figure 40, page 42, as well as figures 41 and 42)
Source: KPMG, 2017
41 Other risk premiums 2016/2017 Germany (in percent, multiple choices possible)
47.7
13.7
45.1
0.05.9
2.6 4.60.0 0.7
50
40
30
20
10
0
Country risk premium
Flat rate premium
on the cost of capital
Implicit with the increase of the market risk premium
Small size company premium
Risk premium for planning
uncertainties
Risk premium for insolvency
risks
Risk premium for financial
risks
Other No additional risk premiums
Source: KPMG, 2017
42 Other risk premiums 2016/2017 Austria (in percent, multiple choices possible)
0.0 0.0
70
60
50
40
30
20
10
0
Country risk premium
Flat rate premium
on the cost of capital
Implicit with the increase of the market risk premium
Small size company premium
Risk premium for planning
uncertainties
Risk premium for insolvency
risks
Risk premium for financial
risks
Other No additional risk premiums
0.0
66.7
16.722.2
5.65.611.1
© 2
018
KP
MG
Inte
rnat
iona
l Co
op
erat
ive
(“K
PM
G In
tern
atio
nal”
), a
Sw
iss
enti
ty. M
emb
er f
irm
s of
the
KP
MG
net
wor
k of
ind
epen
den
t fi
rms
ar
e af
filia
ted
wit
h K
PM
G In
tern
atio
nal.
All
righ
ts r
eser
ved
. The
KP
MG
nam
e an
d lo
go
are
regi
ster
ed
trad
emar
ks o
f K
PM
G In
tern
atio
nal.
Table of Contents
Summary Introduction Cash Flows
Cost of Capital Parameters
Impairment Test
Company Values
Online Industry Analyses
Industry Specialists

43 Company-specific risks in the costs of capital Total (in percent, multiple choices possible)
Source: KPMG, 2017
Yes, the determined cost of capital reflects the company-specific risk
No No, due to the general economic risks No, due to the special business model No, for other reasons
5
95
1
2
2
3.7 Consideration of Risk in the Cost of Capital
As presented in the previous chapters, the proper derivation of the operative risk in the cost of capital is of major importance in the valuation of compa-nies. The future cash flows are uncertain and must therefore be considered with their expected value. At the same time, the operative risk of the cash flow is reflected in the cost of capital. It attempts by means of established methods on the basis of com-parable peer groups to take the operative risks into “general” consideration in the valuation. The oper-ative business models within the individual indus-tries are, however, extremely different; not least of all digitalization is allowing for completely new busi-ness models and is leading to completely new risk profiles for the affected companies.
© 2
018
KP
MG
Inte
rnat
iona
l Co
op
erat
ive
(“K
PM
G In
tern
atio
nal”
), a
Sw
iss
enti
ty. M
emb
er f
irm
s of
the
KP
MG
net
wor
k of
ind
epen
den
t fi
rms
ar
e af
filia
ted
wit
h K
PM
G In
tern
atio
nal.
All
righ
ts r
eser
ved
. The
KP
MG
nam
e an
d lo
go
are
regi
ster
ed
trad
emar
ks o
f K
PM
G In
tern
atio
nal.
Table of Contents
Summary Introduction Cash Flows
Cost of Capital Parameters
Impairment Test
Company Values
Online Industry Analyses
Industry Specialists
The question of whether the determined cost of capital sufficiently reflects the company-specific risk was, however, answered positively by 95 per-cent of the companies participating in this year’s Cost of Capital Study. Of the remaining 5 percent, 1 percent explained the inadequately calculated cost of capital as being due to general economic risks that could not be completely reflected. Another 2 percent referred to their specific business model. The remaining 2 percent indicated other reasons for the incomplete reflection of risk in the cost of capital parameters. (Figure 43)
“Even if 95 percent of the participating com-panies reported that the cost of capital suffi - ciently reflected the company-specific risks, the question remains whether, in view of the macro economic uncertainties and the ever-faster paced change of business models, that will continue to be so in the future.“
Dr. Klaus MittermairPartner, KPMG in Austria

Cost of Capital – Comparative Measures in a World that Increasingly Defies Comparison “Valuating means comparing.”2 This basic prin-ciple of (business) valuations holds true especially in the current business environment that is char-acterized by a high degree of dynamics and volatil-ity as well as a strong trend towards disruption. To transfer the (known) price of a company to another company with an unknown price, both the compa-nies must be subject to comparable risks (risk equi-valence principle). The risk equivalence principle is one of the primary, if not the primary, principles of valuation and is generally accepted in both theory and practice. To properly implement it requires that the operative risks of companies and business mod-els be comparable to one another. For the valuation of established business models, it is generally the case that capital market data of a peer group are applied in the practice of valuation. The selection of the peer group is performed on the basis of quali-tative characteristics (for instance, industry, region, sales and customer base) and is frequently the sub-ject of controversial discussion due to the fact that to date a uniform approach for quantifying operative corporate risks has been lacking.
The peer group approach can generally be con-sidered as suitable for the assessment of estab-lished business models. Regardless of that, the left side of Figure 44 on page 46 shows that vagueness may result in the framework of methods used to date. It is therefore common in the course of cash flow forecasts to perform a plausibility check of the
expected corporate performance using benchmark data of the peer group and to position the com-pany within the range of the peer group by means of company-specific characteristics. Such a posi-tioning within a peer-group range has not, however, to date succeeded with the corresponding com-pany risks due to a lack of practical methods. In this regard a simple average or very simplified weight-ings frequently rule the day, which holds the danger of the risks for the valuation-relevant cash flow not being equivalent to the risks implicitly considered in the cost of capital. If methods are lacking for con-sistently combining cash flow and cost of capital with one another, it is also possible that the result-ing violations of the risk equivalence principle may not be quantified. For established business models and companies, these dangers in the valuation prac-tice are taken into account by the parallel application of differing valuation methods (present-value- and multiplier-oriented methods) that are based on long-term empirical values.
It is generally not possible to fall back on empirical values in the assessment of innovative new busi-ness models and start-ups. Even established com-panies have to critically review the valuation meth-ods they have used to date. The dynamics of change and the growing disruptive effects – for instance through digitalization effects – with increasingly converging markets, reduces the comparability of companies. Against this backdrop, peer-group approaches become questionable. In addition to that, there is the problem that the capital market data applied to date appears only to be of limited
value as a starting point for future expectations when one considers the fundamental crises in the recent past, political events as well as economic changes (digitalization and industry 4.0).
Consequently, new, practical approaches are required that reflect the company-specific risk of a valuation object in its cost of capital. With CEDA (Corporate Economic Decision Assessment), KPMG has developed a practicable approach that takes the operative risk of a company to be assessed into consideration equally with regard to the cash flow and the cost of capital (see Figure 44, page 46, right side).
The determination and plausibility of the future cash flow are then performed as in the past on the basis of the company-specific financial forecasts and taking into consideration the specific market and competitive situation. Because these are a matter of future-based data, the valuation-relevant drivers included in the assessment are generally not single-valued parameters. By considering expect-able ranges in combination with the business model to be valuated, the expected value of cash flows required for valuation purposes can be determined and, for instance, tested for plausibility with peer group benchmarks. Even this frequently represents a further development of former methods that were only characterized by the assumption that the finan-cial forecasts reflect previous expected values and sought to adjust the obviously ambitious financial forecasts with the blanket approach of so-called alpha factors as a premium to the cost of capital.
2 A. Moxter, Grundsätze ordnungsmäßiger Unternehmensbewertung, 2nd Edition, Wiesbaden 1983, p. 123 ©
201
8 K
PM
G In
tern
atio
nal C
oo
per
ativ
e (“
KP
MG
Inte
rnat
iona
l”),
a S
wis
s en
tity
. Mem
ber
fir
ms
of t
he K
PM
G n
etw
ork
of in
dep
end
ent
firm
s
are
affi
liate
d w
ith
KP
MG
Inte
rnat
iona
l. A
ll ri
ghts
res
erve
d. T
he K
PM
G n
ame
and
log
o ar
e re
gist
ere
d tr
adem
arks
of
KP
MG
Inte
rnat
iona
l.
Table of Contents
Summary Introduction Cash Flows
Cost of Capital Parameters
Impairment Test
Company Values
Online Industry Analyses
Industry Specialists

The same information about the future operative drivers of the business model are then applied to directly determine the cost of capital. Here, the expected ranges of fluctuation of the financial fore-casts play a role, as do the relationship of these fluctuations to those of the capital market. Within a company, however, the risk-diversifying effects, for example, between business segments or regions, must be explicitly considered. The result is directly determined company-specific costs of capital that are then – analogously to the procedure for cash flows – tested for plausibility using market and comparative data and can be classified in the comparative range of a peer group.
“The valuation by means of CEDA consistently follows the risk equivalence principle and allows for the actual quantification and compar-ability of operative company risks. It resolves the growing problem that company valuation is becoming ever more difficult in practice in a world that increasingly defies comparison. If the valuer loses the direct comparative meas-ures, then they must rely on more advanced approaches and methods.”
Dr. Andreas TschöpelPartner, KPMG in Germany
44 New methods for determining the risk equivalence
Source: KPMG, 2017
Performance positioningto the peer group
Risk profileof the peer group
Transfer
1
3
Risk
?
Benchmarkingand analysis
Risk
Perfo
rmance
Perfo
rmance
Perfo
rmance
Perfo
rmance
Risk
Benchmarkingand analysis
Performance positioningto the peer group andidentification of risk drivers
Risk
Performance positioningto the peer group
1
3
Previous method New method
Plausibility
2
Cost of capital
Cash flows
Equivalence ?!
?
2
© 2
018
KP
MG
Inte
rnat
iona
l Co
op
erat
ive
(“K
PM
G In
tern
atio
nal”
), a
Sw
iss
enti
ty. M
emb
er f
irm
s of
the
KP
MG
net
wor
k of
ind
epen
den
t fi
rms
ar
e af
filia
ted
wit
h K
PM
G In
tern
atio
nal.
All
righ
ts r
eser
ved
. The
KP
MG
nam
e an
d lo
go
are
regi
ster
ed
trad
emar
ks o
f K
PM
G In
tern
atio
nal.
Table of Contents
Summary Introduction Cash Flows
Cost of Capital Parameters
Impairment Test
Company Values
Online Industry Analyses
Industry Specialists

46 Average cost of debt Total (in percent)
Source: KPMG, 2017
2015/ 2016
2016/ 2017
2014/ 2015
2013/ 2014
2007/ 2008
2009/ 2010
2011/ 2012
2006/ 2007
2008/ 2009
2010/ 2011
2012/ 2013
7
6
5
4
3
2
1
0
5.8 5.6
6.46.0
5.2 5.4
4.4 4.6
3.4 3.13.4
3.8 Cost of Debt and Debt Ratio
Cost of debt
Along with the cost of equity, the cost of debt rep-resents the second important parameter for the derivation of the weighted average cost of capital (WACC).
Source: KPMG, 2017
45 Determination of capital structure and cost of debt Total (in percent, multiple choices possible)
70
60
50
40
30
20
10
0
Value in use Fair value less costs of disposal
Current capital structure at market values and cost of debt of the group/
CGU
20 17
Target capital structure at market values and target
cost of debt of the group/CGU
11
Derivation of the capital structure and cost of debt
from a peer group
69
79
Other
3 5 2
© 2
018
KP
MG
Inte
rnat
iona
l Co
op
erat
ive
(“K
PM
G In
tern
atio
nal”
), a
Sw
iss
enti
ty. M
emb
er f
irm
s of
the
KP
MG
net
wor
k of
ind
epen
den
t fi
rms
ar
e af
filia
ted
wit
h K
PM
G In
tern
atio
nal.
All
righ
ts r
eser
ved
. The
KP
MG
nam
e an
d lo
go
are
regi
ster
ed
trad
emar
ks o
f K
PM
G In
tern
atio
nal.
Table of Contents
Summary Introduction Cash Flows
Cost of Capital Parameters
Impairment Test
Company Values
Online Industry Analyses
Industry Specialists
Primarily the three methods shown in Figure 45 are applied to determine the cost of debt and the debt ratio. The market perspective required by the IFRS is only fulfilled if the capital structure and the cost of debt are determined on the basis of peer-group data. As in the previous years, the majority of the companies surveyed met this IFRS requirement. Here, significantly more study participants used the peer group parameter in the current survey period to
determine the capital structure and the cost of debt. The portion that based their calculations on value in use was 69 percent (previous year: 61 percent); with the determination of the fair value less costs of disposal there was even an increase of 20 per-centage points over the previous year (59 percent) to 79 percent. The other two methods were used at about the same level as in the past year. (Figure 45)

47 Average cost of debt by industry (in percent)
Automotive
Chemicals & Pharmaceuticals
Consumer Markets
Energy & Natural Resources
Financial Services
Health Care
Industrial Manufacturing
Media & Telecommunications
Real Estate
Technology
Transport & Leisure
Total
Family-owned businessesNon-family-owned businesses
2.5
2.5
2.5
3.4
3.4
3.1
3.73.7
4.0
3.03.1
3.9
3.2
3.5
3.5
4.03.7
3.2
2.9
2.9
3.13.4
3.13.0
2.12.5
1 2 3 4
Source: KPMG, 2017
2016/2017 2015/2016
The cost of debt applied by the companies sank by 0.3 percentage points to 3.1 percent. This develop-ment was once again less than the decrease in the risk-free rate and can therefore be explained by an increase of the risk premiums for debt (so-called credit spreads). (Figure 46, page 47)
The decrease in the cost of debt was visible in almost every industry. The greatest decreases were observed in the sectors chemicals & pharmaceut-icals by 0.9 percentage points to 2.5 percent and real estate by 0.7 percentage points to 2.5 percent. Only in transport & leisure was there, with 4.0 per-cent, an increase in the cost of debt compared to the previous year (3.7 percent). (Figure 47)
At the country level, the participants in Switzerland continued to have the highest financing costs for debt. It is remarkable that it was even 0.2 percent-age points above the value for the previous year (2016/2017: 3.7 percent; 2015/2016: 3.5 percent). The increase of the risk premiums for debt even overcompensated the decline in the risk-free rate.
By contrast, in Germany and Austria the cost of debt decreased by 0.5 percentage points to 2.9 percent. (Figure 48)
Germany / Austria Switzerland
Source: KPMG, 2017
48 Average cost of debt Germany / Austria versus Switzerland
(in percent)
4.0
3.0
2.0
1.0
0
2.9
3.73.53.4
2015/2016 2016/2017
Debt ratio
The debt ratio is calculated using the ratio of the market value of the (net) debt to the market value of the total capital.
This year’s study results show that the average debt ratio for the companies was, at 25.2 percent, almost at the same level as the previous year. (Figure 49, page 49)
© 2
018
KP
MG
Inte
rnat
iona
l Co
op
erat
ive
(“K
PM
G In
tern
atio
nal”
), a
Sw
iss
enti
ty. M
emb
er f
irm
s of
the
KP
MG
net
wor
k of
ind
epen
den
t fi
rms
ar
e af
filia
ted
wit
h K
PM
G In
tern
atio
nal.
All
righ
ts r
eser
ved
. The
KP
MG
nam
e an
d lo
go
are
regi
ster
ed
trad
emar
ks o
f K
PM
G In
tern
atio
nal.
Table of Contents
Summary Introduction Cash Flows
Cost of Capital Parameters
Impairment Test
Company Values
Online Industry Analyses
Industry Specialists

This slight decrease can primarily be attributed to the participating companies in Austria. They showed a decline in the debt ratio of 4.1 percentage points to 30.1 percent (previous year: 34.2 percent).
In Germany and Switzerland, by contrast, there was a slight increase of 0.3 percentage points and 1.4 percentage points to 25.0 percent and 23.6 per-cent, respectively. The participating companies from Switzerland continued to have the lowest debt ratio and simultaneously higher financing costs.
In the direct industry comparison, real estate, with 43.9 percent, had the highest debt ratio, followed closely by transport & leisure with 42.1 percent. The lowest debt ratio was to be found in chemicals & pharmaceuticals with 17.8 percent. (Figure 50)
The debt ratio of the surveyed family-owned busi-nesses was, in particular due to the deviating industry mix, much lower at 19.5 percent than that of non-family-owned businesses with 26.7 percent.
Source: KPMG, 2017
2015/ 2016
2016/ 2017
2014/ 2015
2013/ 2014
2007/ 2008
2009/ 2010
2011/ 2012
2006/ 2007
2008/ 2009
2010/ 2011
2012/ 2013
40
35
30
25
20
15
10
5
0
49 Average debt ratio Total (in percent)
32.8
39.936.7
32.9 32.0 30.928.8
26.228.6
25.3 25.2
19.7
Source: KPMG, 2017
Automotive
Chemicals & Pharmaceuticals
Consumer Markets
Energy & Natural Resources
Financial Services
Health Care
Industrial Manufacturing
Media & Telecommunications
Real Estate
Technology
Transport & Leisure
Total
50 Average debt ratio by industry (in percent)
10 20 30 40 50 60
20.2
40.639.3
19.119.7
17.818.1
27.4
33.0
24.113.8
25.225.3
21.128.1
43.954.9
25.423.0
n/mn/m
18.4
42.1
19.526.7
2016/2017 2015/2016
Family-owned businessesNon-family-owned businesses
© 2
018
KP
MG
Inte
rnat
iona
l Co
op
erat
ive
(“K
PM
G In
tern
atio
nal”
), a
Sw
iss
enti
ty. M
emb
er f
irm
s of
the
KP
MG
net
wor
k of
ind
epen
den
t fi
rms
ar
e af
filia
ted
wit
h K
PM
G In
tern
atio
nal.
All
righ
ts r
eser
ved
. The
KP
MG
nam
e an
d lo
go
are
regi
ster
ed
trad
emar
ks o
f K
PM
G In
tern
atio
nal.
Table of Contents
Summary Introduction Cash Flows
Cost of Capital Parameters
Impairment Test
Company Values
Online Industry Analyses
Industry Specialists
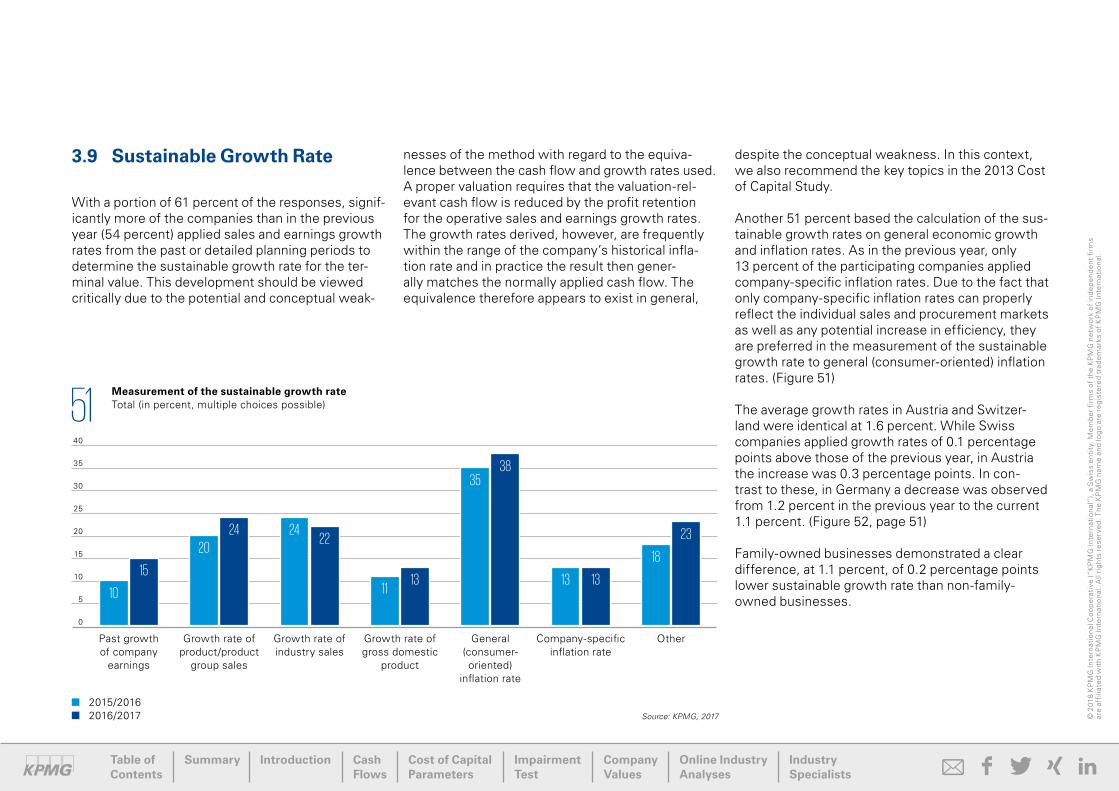
3.9 Sustainable Growth Rate
With a portion of 61 percent of the responses, signif - icantly more of the companies than in the previous year (54 percent) applied sales and earnings growth rates from the past or detailed planning periods to determine the sustainable growth rate for the ter-minal value. This development should be viewed critically due to the potential and conceptual weak-
nesses of the method with regard to the equiva-lence between the cash flow and growth rates used. A proper valuation requires that the valuation-rel-evant cash flow is reduced by the profit retention for the operative sales and earnings growth rates. The growth rates derived, however, are frequently within the range of the company’s historical infla-tion rate and in practice the result then gener-ally matches the normally applied cash flow. The equivalence therefore appears to exist in general,
de spite the conceptual weakness. In this context, we also recommend the key topics in the 2013 Cost of Capital Study.
Another 51 percent based the calculation of the sus-tainable growth rates on general economic growth and inflation rates. As in the previous year, only 13 percent of the participating companies applied company-specific inflation rates. Due to the fact that only company-specific inflation rates can properly reflect the individual sales and procurement markets as well as any potential increase in efficiency, they are preferred in the measurement of the sustainable growth rate to general (consumer-oriented) inflation rates. (Figure 51)
The average growth rates in Austria and Switzer-land were identical at 1.6 percent. While Swiss companies applied growth rates of 0.1 percentage points above those of the previous year, in Austria the increase was 0.3 percentage points. In con-trast to these, in Germany a decrease was observed from 1.2 percent in the previous year to the current 1.1 percent. (Figure 52, page 51)
Family-owned businesses demonstrated a clear difference, at 1.1 percent, of 0.2 percentage points lower sustainable growth rate than non-family-owned businesses.10
15
3538
13 1311
1313
18
2320
2422
24
Past growth of company
earnings
Growth rate of product/product
group sales
Growth rate of industry sales
Growth rate of gross domestic
product
General (consumer- oriented)
inflation rate
Company-specific inflation rate
Other
Source: KPMG, 2017
51 Measurement of the sustainable growth rate Total (in percent, multiple choices possible)
40
35
30
25
20
15
10
5
0
2015/2016 2016/2017 © 2
018
KP
MG
Inte
rnat
iona
l Co
op
erat
ive
(“K
PM
G In
tern
atio
nal”
), a
Sw
iss
enti
ty. M
emb
er f
irm
s of
the
KP
MG
net
wor
k of
ind
epen
den
t fi
rms
ar
e af
filia
ted
wit
h K
PM
G In
tern
atio
nal.
All
righ
ts r
eser
ved
. The
KP
MG
nam
e an
d lo
go
are
regi
ster
ed
trad
emar
ks o
f K
PM
G In
tern
atio
nal.
Table of Contents
Summary Introduction Cash Flows
Cost of Capital Parameters
Impairment Test
Company Values
Online Industry Analyses
Industry Specialists

The average sustainable growth rate for all parti-cipants sank slightly to 1.2 percent (previous year: 1.3 percent). The growth rate does not depend on the planning horizon.
The average data also failed to reflect the very dif-ferent developments of the individual industries.
The clearest increase of the sustainable growth rate observed was 0.3 percentage points in consumer markets. The greatest decline was 0.4 percent-age points in transport & leisure. The sustainable growth rate in this sector was, at 0.9 percent (previ-ous year: 1.3 percent), also the lowest in the various industries. The highest sustainable growth rates this year were found in consumer markets and health care with 1.6 percent. (Figure 53)
Within the industries, differences were particularly to be found in the sectors media & telecommuni- cations and chemicals & pharmaceuticals. Differ-ences of 0.5 percentage points were observed in the sustainable growth rate between the sub-sectors media (1.3 percent) and telecommunications (0.8 percent) as well as 0.4 percentage points in the sub-sectors chemicals (1.2 percent) and pharma-ceuticals (0.8 percent).
52 Average sustainable growth rate Germany versus Austria versus Switzerland (in percent)
Source: KPMG, 2017
1.8
1.5
1.2
0.9
0.6
0.3
0
1.11.2
Germany
1.6 1.6
1.3
Austria
1.5
Switzerland
2015/2016 2016/2017
53 Average sustainable growth rate by industry (in percent)
1.1
1.6
1.2
1.4
1.6
1.3
0.9
1.2
1.2
1.3
1.1
1.3
1.4
1.4
1.11.1
0.91.0
1.21.4
1.3
1.3
1.11.1
Automotive
Chemicals & Pharmaceuticals
Consumer Markets
Energy & Natural Resources
Financial Services
Health Care
Industrial Manufacturing
Media & Telecommunications
Real Estate
Technology
Transport & Leisure
Total
Source: KPMG, 2017
2016/2017 2015/2016
0.3 0.6 0.9 1.81.51.2
1.11.3
Family-owned businessesNon-family-owned businesses
© 2
018
KP
MG
Inte
rnat
iona
l Co
op
erat
ive
(“K
PM
G In
tern
atio
nal”
), a
Sw
iss
enti
ty. M
emb
er f
irm
s of
the
KP
MG
net
wor
k of
ind
epen
den
t fi
rms
ar
e af
filia
ted
wit
h K
PM
G In
tern
atio
nal.
All
righ
ts r
eser
ved
. The
KP
MG
nam
e an
d lo
go
are
regi
ster
ed
trad
emar
ks o
f K
PM
G In
tern
atio
nal.
Table of Contents
Summary Introduction Cash Flows
Cost of Capital Parameters
Impairment Test
Company Values
Online Industry Analyses
Industry Specialists

4 Impairment Test
© 2
018
KP
MG
Inte
rnat
iona
l Co
op
erat
ive
(“K
PM
G In
tern
atio
nal”
), a
Sw
iss
enti
ty. M
emb
er f
irm
s of
the
KP
MG
net
wor
k of
ind
epen
den
t fi
rms
ar
e af
filia
ted
wit
h K
PM
G In
tern
atio
nal.
All
righ
ts r
eser
ved
. The
KP
MG
nam
e an
d lo
go
are
regi
ster
ed
trad
emar
ks o
f K
PM
G In
tern
atio
nal.
Table of Contents
Summary Introduction Cash Flows
Cost of Capital Parameters
Impairment Test
Company Values
Online Industry Analyses
Industry Specialists

4.1 Trigger and Results
According to the results of this year’s study, an im - pairment of goodwill or assets on the basis of an impairment test was recognized by 56 percent of all study participants. (Figure 54)
The portion of companies that only recognized a write-down on assets was, at 33 percent, on the same level as the previous years. Both asset as well as goodwill impairments were recognized in the cur-rent observation period by 17 percent of those sur-veyed and therefore 2 percentage points more than in 2015/2016. Only 6 percent of the participat ing
companies reported having recognized an impair-ment on goodwill alone (previous year: 8 percent). (Figure 55)
The average amount of asset impairments was 198 million euros and was therefore almost twice as high as the value for the previous year of 102 mil-lion euros. This result can be attributed to especially high extraordinary impairments in the energy & natural resources sector. In comparison to that, the average impairment on goodwill increased only by 22 percent to 84 million euros (previous year: 69 million euros). Here, on average the highest impairments were to be found in the real estate sector.
Source: KPMG, 2017
2015/ 2016
2016/ 2017
2014/ 2015
2013/ 2014
2009/ 2010
2011/ 2012
2008/ 2009
2010/ 2011
2012/ 2013
54 Recognition of an impairment Total (in percent)
6055
5159 61
57 59 5655
70
60
50
40
30
20
10
0
55 Recognition of an impairment Total (in percent)
Source: KPMG, 2017
Asset impairment Goodwill impairment Both No impairment
33
6
17
44
56 Triggering event Total (in percent)
Source: KPMG, 2017
30
10
12
48
Triggering event for assets
Triggering event for goodwill
Both Impairment test
without indicator
© 2
018
KP
MG
Inte
rnat
iona
l Co
op
erat
ive
(“K
PM
G In
tern
atio
nal”
), a
Sw
iss
enti
ty. M
emb
er f
irm
s of
the
KP
MG
net
wor
k of
ind
epen
den
t fi
rms
ar
e af
filia
ted
wit
h K
PM
G In
tern
atio
nal.
All
righ
ts r
eser
ved
. The
KP
MG
nam
e an
d lo
go
are
regi
ster
ed
trad
emar
ks o
f K
PM
G In
tern
atio
nal.
Table of Contents
Summary Introduction Cash Flows
Cost of Capital Parameters
Impairment Test
Company Values
Online Industry Analyses
Industry Specialists

An extraordinary impairment test on the basis of a so-called triggering event, i.e. an indicator of an impairment, was performed by 52 percent of the companies (previous year: 49 percent). (Figure 56, page 53)
Similar to the prior years, the most frequent trigger-ing events were, with 65 percent of the participants, poorer long-term expectations. For 17 percent, a decline in prices was the cause for impairment tests. Only 6 percent of the surveyed companies reported the cost of capital as the triggering event for an impairment. (Figure 57)
A correlation between the level of the cost of capital and an impairment and the amount of the impair-ment does not exist. In particular, it could not be found that companies with high costs of capital recognized impairments more frequently than aver-age or have above-average amount of impairments.
70
60
50
40
30
20
10
0
57 Cause of the triggering event Total (in percent, multiple choices possible)
Price decline Lower long-term expectations
Cost of capital OtherDecrease in orders
9
17
65
6
44
Source: KPMG, 2017
4.2 Determination of the Recoverable Amount
The recoverable amount is defined as per IAS 36.6 and IAS 36.18 as the higher of either the fair value less costs of disposal or value in use.
This year’s study results were for the most part identical to those of the previous year. Once again 21 percent of all study participants determined both the value in use as well as the fair value less costs of disposal. Also the majority of companies only considered the value in use as the valuation concept
58 Method for determining the recoverable amount Total (in percent)
Value in use Fair value less costs of
disposal
Both
70
60
50
40
30
20
10
0
2015/2016 2016/2017 Source: KPMG, 2017
6162
18172121
© 2
018
KP
MG
Inte
rnat
iona
l Co
op
erat
ive
(“K
PM
G In
tern
atio
nal”
), a
Sw
iss
enti
ty. M
emb
er f
irm
s of
the
KP
MG
net
wor
k of
ind
epen
den
t fi
rms
ar
e af
filia
ted
wit
h K
PM
G In
tern
atio
nal.
All
righ
ts r
eser
ved
. The
KP
MG
nam
e an
d lo
go
are
regi
ster
ed
trad
emar
ks o
f K
PM
G In
tern
atio
nal.
Table of Contents
Summary Introduction Cash Flows
Cost of Capital Parameters
Impairment Test
Company Values
Online Industry Analyses
Industry Specialists

(2016/2017: 61 percent; previous year: 62 percent). Exclusively fair value less costs of disposal was cal-culated by 18 percent (previous year: 17 percent) of the participants. (Figure 58, page 54)
The analysis of the Cost of Capital Study accord-ing to the location of the company showed that the value-in-use approach was applied most frequently, but that regional differences did occur. While in Germany the portion of companies that only deter-mined the value in use was 57 percent (previous year: 56 percent), this valuation approach was applied by 67 percent (previous year: 79 percent)
in Switzerland and even 82 percent (previous year: 72 percent) in Austria. (Figure 59)
For family-owned businesses as well, at 74 percent, the vast majority used only the value-in-use method to determine the recoverable amount; 10 percent preferred the fair value less costs of disposal. A similar picture could be found by non-family-owned businesses. Here, too, the most frequent approach was the value-in-use method (58 percent), although at 20 percent the fair value less costs of disposal was applied relatively frequently.
59 Method for determining the recoverable amount Germany versus Austria versus Switzerland (in percent)
Source: KPMG, 2017
Value in use Fair value less costs of disposal Both
Germany Austria Switzerland
5718
25
82
12 6
67
18
15
In determining the fair value less costs of disposal, the discounted cash flow method (DCF method) con-tinued to be the most-used valuation method. Of the companies surveyed, 71 percent determined the recoverable amount using this present-value-oriented method. The reason for this is the lack of compa-rab le CGU market data for a market-oriented valuation method. Despite the continued dominance of the DCF method, the percentage of users sank by 15 per-centage points compared to the previous year (86 per-cent). By contrast, the portion of companies that applied only the market- oriented method increased (by 5 percentage points to 15 percent) as did those that applied a market as well as a present-value-ori-ented method (by 10 percentage points to 14 per-cent). (Figure 60)
60 Valuation method for the determination of the fair value less costs of disposal Total (in percent)
Source: KPMG, 2017
DCF method Market-oriented method Both
14
71
15
© 2
018
KP
MG
Inte
rnat
iona
l Co
op
erat
ive
(“K
PM
G In
tern
atio
nal”
), a
Sw
iss
enti
ty. M
emb
er f
irm
s of
the
KP
MG
net
wor
k of
ind
epen
den
t fi
rms
ar
e af
filia
ted
wit
h K
PM
G In
tern
atio
nal.
All
righ
ts r
eser
ved
. The
KP
MG
nam
e an
d lo
go
are
regi
ster
ed
trad
emar
ks o
f K
PM
G In
tern
atio
nal.
Table of Contents
Summary Introduction Cash Flows
Cost of Capital Parameters
Impairment Test
Company Values
Online Industry Analyses
Industry Specialists

Along with the DCF method (60 percent), at 30 per-cent, especially family-owned businesses found the market-oriented valuation method (multiplier method) to be important, while non-family-owned businesses applied the DCF method much more frequently (73 percent) than the overall average.
“Market-oriented valuation methods such as the multiplier approach form an initial orienta-tion point in the valuation of companies. Pre-requisite to their use, however, is that the com-panies used for comparison are comparable to the valuation object, especially with regard to performance and risk. More than ever, nowadays this requires qualified analyses.”
Stefan SchönigerPartner, KPMG in Germany
3
61 Plausibility of valuation results Listed companies Total (in percent, multiple choices possible)
Source: KPMG, 2017
Yes Yes, with the market capitalization of the group Yes, with multiples Yes, with analysts’ target price or analysts’
sum-of-the-parts valuations Yes, on the basis of other factors
No
34
66
31
17
15
4.3 Plausibility
Due to the fact that the fair value less costs of dis-posal method concept is a matter of the exit price and therefore primarily a matter of the estimate of the potential purchasers, the IFRS, especially for this concept, foresees a plausibility test of the main parameters with the expected values of the mar-ket participants. To assure the risk equivalence of the cost of capital, we recommend also perform-ing a comparison with the market expectations when calculating the value in use. This allows for divergences between the market and management expectations to be scrutinized and, if necessary, for adjustments to be made in the cost of capital.
A plausibility test of the valuation results in the observation period was performed by a total of 66 percent of the listed study participants, the same percentage as the previous year. For the plausibil-ity test of the valuation results of these companies, it is always recommended that the market capital-ization be compared with the sum of the recover-able amount of all CGUs. At the level of the previ-ous year, 31 percent (previous year: 30 percent) of the companies tested the plausibility of their valu-ation results on the basis of market capitalization of the group, while 17 percent (previous year: 15 per-cent) used multipliers and 15 percent (previous year: 16 percent) analysts’ target prices or analysts’ sum-of-the-parts valuations. (Figure 61)
© 2
018
KP
MG
Inte
rnat
iona
l Co
op
erat
ive
(“K
PM
G In
tern
atio
nal”
), a
Sw
iss
enti
ty. M
emb
er f
irm
s of
the
KP
MG
net
wor
k of
ind
epen
den
t fi
rms
ar
e af
filia
ted
wit
h K
PM
G In
tern
atio
nal.
All
righ
ts r
eser
ved
. The
KP
MG
nam
e an
d lo
go
are
regi
ster
ed
trad
emar
ks o
f K
PM
G In
tern
atio
nal.
Table of Contents
Summary Introduction Cash Flows
Cost of Capital Parameters
Impairment Test
Company Values
Online Industry Analyses
Industry Specialists

Due to the fact that market capitalization only reflects to a limited degree the control or a signifi-cant influence on the company – because of the frequently low number of shares traded – it may be recommendable within the reconciliation to con-sider a control premium. Furthermore, in a compar-ison of the values obtained according to the value in use method with the market capitalization, the valu-ation perspective and the information available to the capital market could play a role. Therefore, along with the market capitalization of the group, the industry and analysts’ reports as well as multiples should always be used for the plausibility test.
An above-average percentage of companies that are listed on the DAX-30 performed a plausibility test of the values derived (2016/2017: 85 percent, previous year: 83 percent).
The portion of companies that performed a compar-ison of the market capitalization and the fair value less costs of disposal sank by 3 percentage points to 30 percent. Here, in 15 percent (previous year: 9 percent) of the companies the fair value was at least 10 percent below and in 5 percent of the com-panies at least 10 percent above the market capi-talization (previous year: 11 percent). The portion of companies that made a comparison with the mar-ket capitalization of the group in value in use also decreased by 5 percentage points to 52 percent. (Figure 62 and 63)
62 Comparison of market capitalization to fair value
less costs of disposal Listed companies (in percent)
Source: KPMG, 2017
Less than half as high Much lower
(less than 10 percent to maximum half as high)
About the same (plus/minus 10 percent)
Much higher (more than 10 percent to maximum twice as high)
More than twice as high
Not considered
7
16
13
124
48
63 Comparison of market capitalization to value in use Listed companies (in percent)
Source: KPMG, 2017
Less than half as high Much lower
(less than 10 percent to maximum half as high)
About the same (plus/minus 10 percent)
Much higher (more than 10 percent to maximum twice as high)
More than twice as high
Not considered
69
10
4
170
© 2
018
KP
MG
Inte
rnat
iona
l Co
op
erat
ive
(“K
PM
G In
tern
atio
nal”
), a
Sw
iss
enti
ty. M
emb
er f
irm
s of
the
KP
MG
net
wor
k of
ind
epen
den
t fi
rms
ar
e af
filia
ted
wit
h K
PM
G In
tern
atio
nal.
All
righ
ts r
eser
ved
. The
KP
MG
nam
e an
d lo
go
are
regi
ster
ed
trad
emar
ks o
f K
PM
G In
tern
atio
nal.
Table of Contents
Summary Introduction Cash Flows
Cost of Capital Parameters
Impairment Test
Company Values
Online Industry Analyses
Industry Specialists

New Valuation Methods in Disruptive Times ?What impact increasing macroeconomic uncertain-ties as well as microeconomic changes from dis-ruptive business models have on established com-panies and their future performance and risk profile was described in the sections on deriving cash flow and the cost of capital. As companies are sub-jected to a permanent process of change, this will become the new normal and result in changes in decision-making and valuation. Precisely the assessment of new, frequently disruptive business models is becoming particularly important. In the following five points we have summarized the material aspects that, in our opinion, established companies should take into consideration:
“The transfer of alternative valuation methods, for instance from the start-up environment, to innovative business models is not recom-mendable. The reason for their application is frequently not primarily the increased uncer-tainty of innovative business models, but rather much more so in the start-up-specific partic-ularities, which do not apply for established companies. On that basis, simulation-based dynamic valuation methods remain the primary decision-making instrument for deriving performance and risk and a proper determination of value.”
Dr. Andreas TschöpelPartner, KPMG in Germany
1 Established decision-making methods have their limitations
Company decisions about corporate strategy, the associated volume of the required investments as well as the correct time for the decision are taking on a new dimension. Established decision-making mechanisms frequently no longer provide a straight-forward recommendation. They are, as a rule, too static, are frequently based on “stable” risks and generally do not allow for a consistent, quick com-parison of the options. Nowadays, decisions have to be made with a much greater degree of uncer-tainty about the forecasts for future developments. In view of the dwindling comparability of macroe-conomic conditions and changing business models, reverting to (stable) historical parameters appears to be increasingly less suitable; the number of oppor-tunities, on the other hand, increases dramatically and constantly.
2 The application of alternative valuation methods, for instance in the start-up environment, is not only based in the uncertainty of the business models
For the assessment of business models, for instance of start-ups, the valuation practice fre-quently applies alternative – albeit dramatically simplified – valuation methods and regularly justi-fies their application with the high degree of uncer-tainty for start-ups. High uncertainty describes the operative business model as well as the basic man-agement skills of the founders with regard to the implementation of the innovative ideas as well as the transparent reflection in established forecast-ing methods. In addition, there are financial limita-tions at start-ups where they focus on the operative business in the early phases to the detriment of the development of controlling and financial competen-ces. Furthermore, as a result of the high number of valuations required in innumerable rounds of finan-cing, simple, standardized assessment methods are needed. Along with the high degree of uncertainty of future business models itself, there are a number of other start-up specific characteristics that justify the application of alternative valuation methods.
© 2
018
KP
MG
Inte
rnat
iona
l Co
op
erat
ive
(“K
PM
G In
tern
atio
nal”
), a
Sw
iss
enti
ty. M
emb
er f
irm
s of
the
KP
MG
net
wor
k of
ind
epen
den
t fi
rms
ar
e af
filia
ted
wit
h K
PM
G In
tern
atio
nal.
All
righ
ts r
eser
ved
. The
KP
MG
nam
e an
d lo
go
are
regi
ster
ed
trad
emar
ks o
f K
PM
G In
tern
atio
nal.
Table of Contents
Summary Introduction Cash Flows
Cost of Capital Parameters
Impairment Test
Company Values
Online Industry Analyses
Industry Specialists

3 Cash-flow-oriented valuation methods remain the first choice for established companies
For established companies, management and con-trolling competences, default risks or growth lim-itations as a result of a lack of financial strength in connection with their decisions about innovative business models generally play a subordinate role. Instead, the focus is clearly on uncertainty and the lack of comparability of such business models. In view of this, and due to the financial consequences associated with such decisions, an application of simplified, alternative valuation methods is in prin-ciple not recommended. Established, cash-flow-oriented valuation methods (like the DCF method) continue to form the best conceptual foundation for meeting the new, increased requirements for the assessment of alternative options in times of diverg ing markets and converging business models as well. Established companies are also in principle familiar with such decision-making and valuation methods.
4 Cash-flow-oriented methods have to be adapted to the changed conditions
Cash-flow-oriented valuation methods do, how-ever, have to be adapted to the new conditions and expanded by new approaches to consistently include performance and risk. This succeeds only if planning methods already reflect the specific busi-ness model at the operative level and transform the known integrated financial-indicator-based finan-cial forecasts. At the same time, the problem of the increasingly incomparability of business models in the determination of the risk equivalent cost of cap-ital must be solved. The risk equivalence between the valuation object and the comparative investment frequently assumed in the past with “stable” uncer-tainties can no longer be maintained in the future. Cash flows and the cost of capital must be based on the same information and assumptions and derived in parallel and consistently with one another. The much wider scope of big data available in the future will provide the necessary base of content for this.
5 It is precisely disruptive times that require clear, value-oriented decision-making
The expected value of future cash flow (perform-ance) and the cost of capital (risk) must be deter-mined simultaneously on the basis of flexible and dynamic simulation and planning models. This not only allows the increasing weaknesses of former – only partially applied – decision-making models to be overcome, it also assures the conceptually cor-rect derivation of value on the basis of the equiva-lence criteria required. After all, it is the value that is the basis for the correct decision and makes stra-tegic options comparable. Wrong values lead to bad decisions.
CEDA (Corporate Economic Decision Assessment), a decision-making method developed by KPMG, consistently links the uncertain cash flow required for a proper valuation with their individual cost of capital. Based on established valuation methods, this transparent comparison of innovative business models succeeds in not only considering the expec-ted performance, but rather also includes the spe-cific risk profile.
© 2
018
KP
MG
Inte
rnat
iona
l Co
op
erat
ive
(“K
PM
G In
tern
atio
nal”
), a
Sw
iss
enti
ty. M
emb
er f
irm
s of
the
KP
MG
net
wor
k of
ind
epen
den
t fi
rms
ar
e af
filia
ted
wit
h K
PM
G In
tern
atio
nal.
All
righ
ts r
eser
ved
. The
KP
MG
nam
e an
d lo
go
are
regi
ster
ed
trad
emar
ks o
f K
PM
G In
tern
atio
nal.
Table of Contents
Summary Introduction Cash Flows
Cost of Capital Parameters
Impairment Test
Company Values
Online Industry Analyses
Industry Specialists

5 Relevance of Value and Enhancement of Value
© 2
018
KP
MG
Inte
rnat
iona
l Co
op
erat
ive
(“K
PM
G In
tern
atio
nal”
), a
Sw
iss
enti
ty. M
emb
er f
irm
s of
the
KP
MG
net
wor
k of
ind
epen
den
t fi
rms
ar
e af
filia
ted
wit
h K
PM
G In
tern
atio
nal.
All
righ
ts r
eser
ved
. The
KP
MG
nam
e an
d lo
go
are
regi
ster
ed
trad
emar
ks o
f K
PM
G In
tern
atio
nal.
Table of Contents
Summary Introduction Cash Flows
Cost of Capital Parameters
Impairment Test
Company Values
Online Industry Analyses
Industry Specialists

5.1 Criteria for Investment Decisions
First of all, the objectives must be stipulated in the framework of investment decisions. Here, the company primarily orients itself on strategic and value-oriented targets.
In the orientation of strategic objectives, investment decisions are performed on the basis of strategic-ally qualitative (for example, regional coverage) and/or quantitative (for example, sales or margin) objec-tives. The focus of these perspectives is on opera-tive parameters and the resultant cash flow.
In addition, companies also prepare their invest-ment decisions by means of ostensibly value-ori-ented targets such as the so-called EVA (eco-nomic value added) or the ROCE (return on capital employed). The core of such approaches is that the return required by the investors is taken into con-sideration in the course of the investment decision so as to make decisions that increase the value of the company. Frequently, the actual return expecta-tions are, however, replaced by hurdle rate data that generally do not consider the individual risk profile of the specific investment. This includes the danger that “excessively” profitable investments will be made that might involve inordinately high risks whereas “low return” investments are rejected, although they are only associated with very minor risks. The challenge is therefore to not only deter-mine the proper cash flow, but also to consider the proper risk-equivalent costs of capital for the invest-ments under consideration.
Investment decisions are, as a rule, for long-term periods of time. In times of macroeconomic uncer-tainties and microeconomic changes from disrupt-ive business models, companies are faced with con-stantly new challenges to properly considering the valuation-relevant risks in the assessment of invest-ment decisions. Furthermore, the continuing low interest, associated with favorable or readily access-ible financing opportunities, may result in the under-estimation of the risks that are associated with the target returns of investments and not reflecting them completely in the decision-making process.
In the course of this year’s study about two-thirds of the companies reported that they considered strategic and value-oriented objectives equally in the decision-making process (previous year: 67 per-cent). The remaining study participants (34 percent) applied, at 7 percent (previous year: 6 percent) only value-oriented criteria, 27 percent, identical to the previous year, applied primarily strategic objectives. (Figure 64)
In family-owned businesses even 71 percent of the participants reported using both strategic as well as value-oriented targets.
Special attention should be given to the considera-tion of expected economic value added within the framework of assessing investment alternatives. As shown above, these simplifying classical pro-cedures may only to a limited degree meet the chal-lenges and expectations of a modern decision- making criterion in the current and future market environment.
64 Criteria in investment decisions Total (in percent)
Source: KPMG, 2017
7
27
66
4
8
15
Primarily value-oriented objectives (EVA, ROCE) Primarily strategic objectives
Primarily qualitative strategic objectives (for instance, regional coverage)
Primarily quantitative strategic objectives (for instance, sales or margin targets)
Qualitative and quantitative strategic objectives equally Strategic and value-oriented objectives equally
© 2
018
KP
MG
Inte
rnat
iona
l Co
op
erat
ive
(“K
PM
G In
tern
atio
nal”
), a
Sw
iss
enti
ty. M
emb
er f
irm
s of
the
KP
MG
net
wor
k of
ind
epen
den
t fi
rms
ar
e af
filia
ted
wit
h K
PM
G In
tern
atio
nal.
All
righ
ts r
eser
ved
. The
KP
MG
nam
e an
d lo
go
are
regi
ster
ed
trad
emar
ks o
f K
PM
G In
tern
atio
nal.
Table of Contents
Summary Introduction Cash Flows
Cost of Capital Parameters
Impairment Test
Company Values
Online Industry Analyses
Industry Specialists

Particular attention should be given to the fact that more static models such as EVA and ROCE gener-ally compile valuation-relevant information of a com-pany only partially and that not even consistently. Their strong reliance on the past, the orientation on accounting parameters as well as the lack or very limited equivalent consideration of risk may also restrict the information provided by these methods. We therefore recommend modern approaches that are based on multi-valued financial forecasts includ-ing simulation and scenario analyses and consist-ently compile performance and risk effects and consider these in the valuation calculation. Value and risk drivers of an investment project can then be presented transparently at an early date and considered appropriately in the decision-making process.
5.2 Monitoring the Enhancement of Value
Investment decisions concluded must be continu-ally monitored with regard to their actual value enhancement so as to be able to react to changes in the market environment quickly and in a targeted manner.
When questioned about the relevance of a value- oriented monitoring, 84 percent (previous year: 82 percent) of the participants reported that monit-oring the value enhancement of an investment was an important aspect for decision-making and steer-ing purposes. For the remaining 16 percent, the instrument was less important for controlling per-formance and did not play any role in the steering processes. (Figure 65, page 63)
A total of 62 percent (2015/2016: 56 percent) of the companies that performed a value-oriented mon-itoring focused on the change of performance and in particular on simplified key performance indica-tors (KPIs) as, for instance, sales, EBITDA, EBIT or ROCE. In addition to the development of per-formance, 38 percent (previous year: 43 percent) considered changes in risk on the basis of key risk indicators (KRIs). Here, however, the surveyed com-panies frequently focused only on the change of general market risks such as they are reflected in the market risk premium. (Figure 66, page 63)
In particular family-owned businesses monitored enhancement of value primarily only through the change of performance (73 percent), while only 59 percent of the non-family-owned companies observed changes in performance exclusively.
“Changes in value can only be transparently attributed to their causes, if the value drivers identified in the framework of the decision- making process are continuously monitored with regard to their impact on the company performance and the company risk. In this manner it is possible to detect poor develop-ments at an early stage and to take appropriate counter-measures. Furthermore, the know-ledge gained can be transferred to future pro-jects and investments and therefore improve the decision-making basis as well as the cor-porate communication.”
Dr. Marc CastedelloPartner, KPMG in Germany
© 2
018
KP
MG
Inte
rnat
iona
l Co
op
erat
ive
(“K
PM
G In
tern
atio
nal”
), a
Sw
iss
enti
ty. M
emb
er f
irm
s of
the
KP
MG
net
wor
k of
ind
epen
den
t fi
rms
ar
e af
filia
ted
wit
h K
PM
G In
tern
atio
nal.
All
righ
ts r
eser
ved
. The
KP
MG
nam
e an
d lo
go
are
regi
ster
ed
trad
emar
ks o
f K
PM
G In
tern
atio
nal.
Table of Contents
Summary Introduction Cash Flows
Cost of Capital Parameters
Impairment Test
Company Values
Online Industry Analyses
Industry Specialists

Source: KPMG, 2017
65 Relevance of monitoring the value enhancement Total (in percent)
Important Not important
84
16
Source: KPMG, 2017
66 Monitoring of the value enhancement Total (in percent)
Change of performance Change of performance
and risk
62
38
5.3 Cost of Capital in the Capital Market Communication
As in the previous year’s results, the cost of capital and their development do not play a role in the cap-ital market communication for 72 percent (previous year: 78 percent) of the participants. The company values determined – for instance for the purpose of an impairment test – were only applied for account-ing purposes and for the reporting associated with that. A small portion of the companies considered the cost of capital determined in the framework of an impairment test as internal benchmark and steer-ing parameters and reconcile these regularly with analysts and investors (2016/2017: 9 percent; pre-vious year: 8 percent). With the discussion of these parameters, the companies increase their trans-parency for their investors and gain insights into divergences between management and market perspectives. This is, on the one hand, necessary to fulfill the partial market perspective required by IFRS and, on the other hand, contributes to includ-ing investor expectations in the observations right from the start.
Another 9 percent (previous year: 10 percent) of the surveyed companies used the cost of capital and company values from value-oriented steering con-cepts – for example, EVA – in the framework of the capital market communication. (Figure 67)
67 Communication and use of the cost of capital Total (in percent)
Source: KPMG, 2017
Cost of capital plays a major role. It is the internal benchmark and steering parameter and is regularly discussed with investors and analysts
We use cost of capital and company values from steering concepts such as EVA for capital market communication
Other Cost of capital does
not play a role. It is used exclusively for accounting purposes and the associated reporting
99
10
72
“The development of the cost of capital should, just as the development of operative and financial indicators, be a component of the regular communication of the company to the capital market. Only if the shareholders know the development of the performance and risk indicators can they assess the development of the company value.“
Karen FerdinandPartner, KPMG in Germany ©
201
8 K
PM
G In
tern
atio
nal C
oo
per
ativ
e (“
KP
MG
Inte
rnat
iona
l”),
a S
wis
s en
tity
. Mem
ber
fir
ms
of t
he K
PM
G n
etw
ork
of in
dep
end
ent
firm
s
are
affi
liate
d w
ith
KP
MG
Inte
rnat
iona
l. A
ll ri
ghts
res
erve
d. T
he K
PM
G n
ame
and
log
o ar
e re
gist
ere
d tr
adem
arks
of
KP
MG
Inte
rnat
iona
l.
Table of Contents
Summary Introduction Cash Flows
Cost of Capital Parameters
Impairment Test
Company Values
Online Industry Analyses
Industry Specialists

6 Online Industry Analyses
© 2
018
KP
MG
Inte
rnat
iona
l Co
op
erat
ive
(“K
PM
G In
tern
atio
nal”
), a
Sw
iss
enti
ty. M
emb
er f
irm
s of
the
KP
MG
net
wor
k of
ind
epen
den
t fi
rms
ar
e af
filia
ted
wit
h K
PM
G In
tern
atio
nal.
All
righ
ts r
eser
ved
. The
KP
MG
nam
e an
d lo
go
are
regi
ster
ed
trad
emar
ks o
f K
PM
G In
tern
atio
nal.
Table of Contents
Summary Introduction Cash Flows
Cost of Capital Parameters
Impairment Test
Company Values
Online Industry Analyses
Industry Specialists

1
2
3
5
7
8
4
KPMG-Kapitalkostenstudie 2017
6
PARAMETER GEFILTERT
PARAMETER GESAMT zeigt die Entwicklung des Parameters auf Basis aller Teilnehmer auf
zeigt die Entwicklung des Parameters auf Basis der gewählten Filterung(en) auf
ALLGEMEINE HINWEISE FILTERUNG 1. Pro Filter (Land, Bereich, Familien- unternehmen) ist nur eine Auswahl möglich. 2. Die Filter sind kombinierbar (zum Beispiel Deutschland + Automotive). 3. Eine separate Auswertung erfolgt erst ab einer Anzahl von 5 Antworten.
Wir weisen darauf hin, dass die in der Studie und in den interaktiven Auswertungen ausgewiesenen Werte grundsätzlich gerundet ausgewiesen werden. Da die Berechnungen tatsächlich mit exakten Werten erfolgen, kann die Addition bzw. Subtraktion von Grafikwerten zu Abweichungen bei den ausgewiesenen Zwischen- und Gesamtsummen auch zwischen Studie und interaktiven Auswertungen führen.
ANALYSIERTER PARAMETER gibt den auf dieser Seite analysierten Parameter an FILTER DAX-30
zeigt die Entwicklung des Parameters ausschließlich auf Basis der DAX-30-Teilnehmer aus Deutschland auf FILTER FAMILIENUNTERNEHMEN zeigt die Entwicklung des Parameters ausschließlich auf Basis der Teilnehmer, die sich als Familienunternehmen oder nicht als Familienunternehmen eingeordnet haben FILTER NACH LAND zeigt die Entwicklung des Parameters ausschließlich auf Basis der Teilnehmer des ausgewählten Landes auf FILTER NACH BEREICH zeigt die Entwicklung des Parameters ausschließlich auf Basis der ausgewählten Branche auf ANZAHL ANTWORTEN gibt die Anzahl der Antworten an, auf der die Durchschnittsberechnung basiert
Überblick Ableitung der Plan-Cashflows
Ableitung der Kapitalkosten-parameter
Impairment Test Relevanz von Unternehmens-werten
Branchen-auswertung
Ansprechpartner Bitte ohne Navigationsleiste
68 Instructions for KPMG Cost of Capital Study 2017 interactive
This year, for the first time, we provide all the industry-specific figures for the cost of capital para-meters on our website.
At www.kpmg.de/kapitalkostenstudie-tableau (only available in German) you will find both the forecasting as well as the cost of capital parameters from the current study as well as the results of all the Cost of Capital Studies from previous years in readily viewable graphs.
There you have the opportunity to apply your own search criteria to display the industry and/or coun-try-specific parameters that are relevant for you and to select their development over time.
Beyond that, you can also increase the degree of detail for the industry assessments. Interested read-ers have, for the first time, the opportunity to select sub-sector assessments for the sectors consumer markets, chemicals & pharmaceuticals, financial services as well as media & telecommunications.
As in the previous year, we have performed sepa-rate assessments of sectors/sub-sectors for which we had responses from at least five participants.
Instructions for the use of the interactive online industry analyses as well as sample analyses are shown in the following.
Source: KPMG, 2017
© 2
018
KP
MG
Inte
rnat
iona
l Co
op
erat
ive
(“K
PM
G In
tern
atio
nal”
), a
Sw
iss
enti
ty. M
emb
er f
irm
s of
the
KP
MG
net
wor
k of
ind
epen
den
t fi
rms
ar
e af
filia
ted
wit
h K
PM
G In
tern
atio
nal.
All
righ
ts r
eser
ved
. The
KP
MG
nam
e an
d lo
go
are
regi
ster
ed
trad
emar
ks o
f K
PM
G In
tern
atio
nal.
Table of Contents
Summary Introduction Cash Flows
Cost of Capital Parameters
Impairment Test
Company Values
Online Industry Analyses
Industry Specialists

KPMG-Kapitalkostenstudie 2017
Überblick Ableitung der Plan-Cashflows
Ableitung der Kapitalkosten-parameter
Impairment Test Relevanz von Unternehmens-werten
Branchen-auswertung
Ansprechpartner Bitte ohne Navigationsleiste
Individualisierte Auswertung Detaillierungsgrad der Planungsrechnung
Planung ausschließlich einer GuV Planung einer GuV und zusätzlich ausgewählter Bilanzposten oder einer vollständigen Bilanz
Planung vollständig integriert (GuV, Bilanz und Cashflow)
0%
20%
40%
60%
17% 22%
61%
AUTOMOTIVE
CHEMICALS & PHARMACEUTICALS
CONSUMER MARKETS
ENERGY & NATURAL RESOURCES
FINANCIAL SERVICES
HEALTH CARE
INDUSTRIAL MANUFACTURING
MEDIA & TELECOMMUNICATIONS
REAL ESTATE
TECHNOLOGY
TRANSPORT & LEISURE
MEDIA TELECOMMUNICATIONS
CONSUMER MARKETS
RETAIL
BANKING
INSURANCE
CHEMICALS
PHARMACEUTICALS
D
CH AT
DAX-30
FU
Nicht-FU
Detaillierungsgrad der Planungsrechnung
CONSUMER MARKETS CONSUMER MARKETS
2016/2017
61%
2016/ 2017
n = 18
69 KPMG Cost of Capital Study 2017 interactive – evaluation by (sub-)sectors
Source: KPMG, 2017 © 2
018
KP
MG
Inte
rnat
iona
l Co
op
erat
ive
(“K
PM
G In
tern
atio
nal”
), a
Sw
iss
enti
ty. M
emb
er f
irm
s of
the
KP
MG
net
wor
k of
ind
epen
den
t fi
rms
ar
e af
filia
ted
wit
h K
PM
G In
tern
atio
nal.
All
righ
ts r
eser
ved
. The
KP
MG
nam
e an
d lo
go
are
regi
ster
ed
trad
emar
ks o
f K
PM
G In
tern
atio
nal.
Table of Contents
Summary Introduction Cash Flows
Cost of Capital Parameters
Impairment Test
Company Values
Online Industry Analyses
Industry Specialists

KPMG-Kapitalkostenstudie 2017
Überblick Ableitung der Plan-Cashflows
Ableitung der Kapitalkosten-parameter
Impairment Test Relevanz von Unternehmens-werten
Branchen-auswertung
Ansprechpartner Bitte ohne Navigationsleiste
Individualisierte Auswertung Fremdkapitalkosten AUTOMOTIVE
CHEMICALS & PHARMACEUTICALS
CONSUMER MARKETS
ENERGY & NATURAL RESOURCES
FINANCIAL SERVICES
HEALTH CARE
INDUSTRIAL MANUFACTURING
MEDIA & TELECOMMUNICATIONS
REAL ESTATE
TECHNOLOGY
TRANSPORT & LEISURE
CHEMICALS
PHARMACEUTICALS
CONSUMER MARKETS
RETAIL
BANKING
INSURANCE
MEDIA
TELECOMMUNICATIONS
Fremdkapitalkosten
D
CH AT
DAX-30
FU
Nicht-FU
Die durchschnittlichen Fremdkapitalkosten sind aufgrund des gesunkenen Basiszinssatzes im Vergleich zum Vorjahr ebenfalls gesunken.
2009/ 2010
2010/ 2011
2011/ 2012
2012/ 2013
2013/ 2014
2014/ 2015
2015/ 2016
2016/ 2017
2,0%
0,0%
4,0%
6,0% 6,0%
5,2% 5,4%
4,4% 4,6%
3,4% 3,4% 3,1%
2009/ 2010
2010/ 2011
2011/ 2012
2012/ 2013
2013/ 2014
2014/ 2015
2015/ 2016
2016/ 2017
0,0%
1,0%
2,0%
3,0%
3,4%
2016/ 2017
n = 20
70 KPMG Cost of Capital Study 2017 interactive – evaluation by region and family-owned businesses
Source: KPMG, 2017 © 2
018
KP
MG
Inte
rnat
iona
l Co
op
erat
ive
(“K
PM
G In
tern
atio
nal”
), a
Sw
iss
enti
ty. M
emb
er f
irm
s of
the
KP
MG
net
wor
k of
ind
epen
den
t fi
rms
ar
e af
filia
ted
wit
h K
PM
G In
tern
atio
nal.
All
righ
ts r
eser
ved
. The
KP
MG
nam
e an
d lo
go
are
regi
ster
ed
trad
emar
ks o
f K
PM
G In
tern
atio
nal.
Table of Contents
Summary Introduction Cash Flows
Cost of Capital Parameters
Impairment Test
Company Values
Online Industry Analyses
Industry Specialists

KPMG-Kapitalkostenstudie 2017
Überblick Ableitung der Plan-Cashflows
Ableitung der Kapitalkosten-parameter
Impairment Test Relevanz von Unternehmens-werten
Branchen-auswertung
Ansprechpartner Bitte ohne Navigationsleiste
Branchenauswertungen Corporates
Gesamt
(Teil-)Bereich
Auswahl Bereich CHEMICALS PHARMACEUTICALS
6,1%
5,1% 4,9% 4,8% 5,4% 5,1% 5,2%
Durchschnittlich verwendetes Umsatzwachstum Gesamt versus Chemicals & Pharmaceuticals
7,8% 8,0% 7,1% 6,8% 7,1% 7,3%
6,9% 6,6%
Durchschnittlich verwendeter WACC Gesamt versus Chemicals & Pharmaceuticals
0,83 0,93
0,85 0,85 0,82 0,83 0,84 0,86
2013/2014 2014/2015 2015/2016 2016/2017
Durchschnittlich verwendeter unverschuldeter Betafaktor Gesamt versus Chemicals & Pharmaceuticals
26,2%
22,2%
28,6% 26,9%
25,3%
18,1%
25,2%
17,8%
2013/2014 2014/2015 2015/2016 2016/2017
Durchschnittlich verwendete Fremdkapitalquote Gesamt versus Chemicals & Pharmaceuticals
2013/2014 2014/2015 2015/2016 2016/2017 2013/2014 2014/2015 2015/2016 2016/2017
4,1%
71 KPMG Cost of Capital Study 2017 interactive – individual industry evaluation
Source: KPMG, 2017 © 2
018
KP
MG
Inte
rnat
iona
l Co
op
erat
ive
(“K
PM
G In
tern
atio
nal”
), a
Sw
iss
enti
ty. M
emb
er f
irm
s of
the
KP
MG
net
wor
k of
ind
epen
den
t fi
rms
ar
e af
filia
ted
wit
h K
PM
G In
tern
atio
nal.
All
righ
ts r
eser
ved
. The
KP
MG
nam
e an
d lo
go
are
regi
ster
ed
trad
emar
ks o
f K
PM
G In
tern
atio
nal.
Table of Contents
Summary Introduction Cash Flows
Cost of Capital Parameters
Impairment Test
Company Values
Online Industry Analyses
Industry Specialists

List of AbbreviationsCAPM Capital Asset Pricing Model
CDAX All German stocks listed on the German stock exchange in the general standard and prime standard
CEDA Corporate Economic Decision Assessment
CGU Cash Generating Unit
CVA Cash Value Added
DAX Main German Stock Exchange
DAX-30 The 30 largest blue chips on the main German Stock Exchange
DCF Discounted Cash Flow
EBIT Earnings Before Interest and Taxes
EBITDA Earnings Before Interest, Taxes, Depreciation and Amortization
EVA Economic Value Added
FamDAX DAXplus Family 30 Index, consists of the 30 largest and most liquid family-owned businesses (founding family holds at least 25 percent of the voting rights or seat in the management board of advisory board and 5 percent of the voting rights) in the Prime Standard of the German Stock Exchange
FAUB “Fachausschuss für Unternehmensbewertung und Betriebswirtschaft des IDW”: Technical Committee for Business Valuation and Economics of the IDW
FinTech Financial Technology
IAS International Accounting Standards
IDW “Institut der Wirtschaftsprüfer in Deutschland e. V.”, Institute of Public Auditors in Germany, Incorporated Association
IFRS International Financial Reporting Standards
KPI Key Performance Indicator
KRI Key Risk Indicator
M&A Mergers & Acquisitions
MDAX German Mid Caps Stock Index
n/a Not available
n/m Not meaningful
P&L Profit & Loss Statement
ROCE Return on Capital Employed
S&P Standard & Poor’s
SDAX Small Caps, the companies following the MDAX with market capitalization and exchange turnover
SFAS Statement of Financial Accounting Standards
US-GAAP United States Generally Accepted Accounting Principles
VUKA Acronym for volatility, uncertainty, complexity and ambiguity
WACC Weighted Average Cost of Capital
© 2
018
KP
MG
Inte
rnat
iona
l Co
op
erat
ive
(“K
PM
G In
tern
atio
nal”
), a
Sw
iss
enti
ty. M
emb
er f
irm
s of
the
KP
MG
net
wor
k of
ind
epen
den
t fi
rms
ar
e af
filia
ted
wit
h K
PM
G In
tern
atio
nal.
All
righ
ts r
eser
ved
. The
KP
MG
nam
e an
d lo
go
are
regi
ster
ed
trad
emar
ks o
f K
PM
G In
tern
atio
nal.
Table of Contents
Summary Introduction Cash Flows
Cost of Capital Parameters
Impairment Test
Company Values
Online Industry Analyses
Industry Specialists

Your Industry SpecialistsKPMG in Germany
AutomotiveDr. Marc CastedelloPartnerDeal Advisory, Head of Valuation GermanyT +49 89 9282-1145 [email protected]
MediaEnergy & Natural ResourcesDr. Vera-Carina ElterPartnerManaging Partner for Family-Owned BusinessesT +49 211 475-7505 [email protected]
Energy & Natural Resources Industrial ManufacturingAndreas EmmertDirectorT +49 911 5973-3933 [email protected]
Consumer MarketsRetailKaren FerdinandPartnerT +49 69 9587-6500 [email protected]
RetailConsumer MarketsStephan FetschPartnerT +49 221 2073-5534 [email protected]
Building & ConstructionMichael HahnDirectorT +49 711 9060-41163 [email protected]
Financial ServicesGudrun HoppenburgDirectorT +49 69 9587-2640 [email protected]
Energy & Natural ResourcesMichael KillischDirectorT +49 211 475-6325 [email protected]
© 2
018
KP
MG
Inte
rnat
iona
l Co
op
erat
ive
(“K
PM
G In
tern
atio
nal”
), a
Sw
iss
enti
ty. M
emb
er f
irm
s of
the
KP
MG
net
wor
k of
ind
epen
den
t fi
rms
ar
e af
filia
ted
wit
h K
PM
G In
tern
atio
nal.
All
righ
ts r
eser
ved
. The
KP
MG
nam
e an
d lo
go
are
regi
ster
ed
trad
emar
ks o
f K
PM
G In
tern
atio
nal.
Table of Contents
Summary Introduction Cash Flows
Cost of Capital Parameters
Impairment Test
Company Values
Online Industry Analyses
Industry Specialists
Chemicals & PharmaceuticalsHealth CareChristian KlingbeilPartnerT +49 89 9282-1284 [email protected]
Chemicals & PharmaceuticalsHealth CarePatrick KlingshirnDirectorT +49 89 9282-4594 [email protected]
TechnologyMedia & TelecommunicationsDr. Gunner LangerDirectorT +49 69 9587-2830 [email protected]
Real EstateGunther LiermannPartnerT +49 69 9587-4023 [email protected]

Real EstateAndreas LohnerDirectorT +49 89 9282-4926 [email protected]
Financial ServicesRudolf MaurerDirectorT +49 89 9282-1348 [email protected]
Energy & Natural ResourcesMichael SalcherPartnerT +49 89 9282-1239 [email protected]
Consumer MarketsTelecommunicationsStefan SchönigerPartnerT +49 40 32015-5690 [email protected]
Industrial ManufacturingDr. Jakob SchröderPartnerT +49 211 475-8200 [email protected]
Financial ServicesTimo SchuckPartnerT +49 69 9587-1699 [email protected]
AutomotiveOlaf TheinPartnerT +49 89 9282-1579 [email protected]
Transport & LeisureHealth CareDr. Andreas TschöpelPartnerT +49 30 2068-1488 [email protected]
AutomotiveIndustrial ManufacturingRalf WeimerDirectorT +49 89 9282-1150 [email protected]
KPMG in Austria
Dr. Klaus MittermairPartnerHead of Deal Advisory AustriaT +43 732 6938-2151 [email protected]
KPMG in Switzerland
Johannes PostPartnerDeal Advisory, EMA Head of ValuationT +41 58 249-3592 [email protected]
© 2
018
KP
MG
Inte
rnat
iona
l Co
op
erat
ive
(“K
PM
G In
tern
atio
nal”
), a
Sw
iss
enti
ty. M
emb
er f
irm
s of
the
KP
MG
net
wor
k of
ind
epen
den
t fi
rms
ar
e af
filia
ted
wit
h K
PM
G In
tern
atio
nal.
All
righ
ts r
eser
ved
. The
KP
MG
nam
e an
d lo
go
are
regi
ster
ed
trad
emar
ks o
f K
PM
G In
tern
atio
nal.
Table of Contents
Summary Introduction Cash Flows
Cost of Capital Parameters
Impairment Test
Company Values
Online Industry Analyses
Industry Specialists

Contact
Germany
Overall responsibilityStefan SchönigerPartnerDeal Advisory, ValuationKPMG AG WirtschaftsprüfungsgesellschaftLudwig-Erhard-Strasse 11 – 1720459 HamburgT +49 40 [email protected]
Technical coordinationDr. Marc CastedelloPartnerDeal Advisory, Head of Valuation GermanyKPMG AG WirtschaftsprüfungsgesellschaftGanghoferstrasse 2980339 MunichT +49 89 [email protected]
Austria
Dr. Klaus MittermairPartnerHead of Deal Advisory AustriaKPMG Alpen-Treuhand GmbHKudlichstrasse 414020 LinzT +43 732 6938 [email protected]
Switzerland
Johannes PostPartnerDeal Advisory, EMA Head of ValuationKPMG Holding AGBadenerstrasse 1728026 ZurichT +41 58 [email protected]
Picture credits: © iStock/Ig0rZh (S. 1), © iStock/lucky-photographer (S. 8), © iStock/abzee (S. 12), © iStock/Lysogor (S. 26), © iStock/JohnCrux (S. 52), © iStock/michaelbwood (S. 60), © iStock/agaliza (S. 64)
www.kpmg.de
www.kpmg.de/socialmedia
© 2
018
KP
MG
Inte
rnat
iona
l Co
op
erat
ive
(“K
PM
G In
tern
atio
nal”
), a
Sw
iss
enti
ty. M
emb
er f
irm
s of
the
KP
MG
net
wor
k of
ind
epen
den
t fi
rms
ar
e af
filia
ted
wit
h K
PM
G In
tern
atio
nal.
All
righ
ts r
eser
ved
. The
KP
MG
nam
e an
d lo
go
are
regi
ster
ed
trad
emar
ks o
f K
PM
G In
tern
atio
nal.
Table of Contents
Summary Introduction Cash Flows
Cost of Capital Parameters
Impairment Test
Company Values
Online Industry Analyses
Industry Specialists
The information contained herein is of a general nature and is not intended to address the circumstances of any particular individual or entity. Although we endeavor to provide accurate and timely information, there can be no guarantee that such information is accurate as of the date it is received or that it will continue to be accurate in the future. No one should act on such information without appropriate professional advice after a thorough examination of the particular situation.
© 2018 KPMG International Cooperative (“KPMG International”), a Swiss entity. Member firms of the KPMG network of independent firms are affiliated with KPMG International. KPMG International provides no client services. No member firm has any authority to obligate or bind KPMG International or any other member firm vis-à-vis third parties, nor does KPMG International have any such authority to obligate or bind any member firm. All rights reserved. The KPMG name and logo are registered trademarks of KPMG International.