Embed Size (px)
Citation preview
cost of carbon 0699PPT A. MURPHY– CLIMATE CHANGE
Aidan MurphyAidan MurphyShell International - LondonShell International - London
Investing in a carbon constrained future. Investing in a carbon constrained future.
WEC Gold Medal Colloquium
cost of carbon 0699PPT A. MURPHY– CLIMATE CHANGE
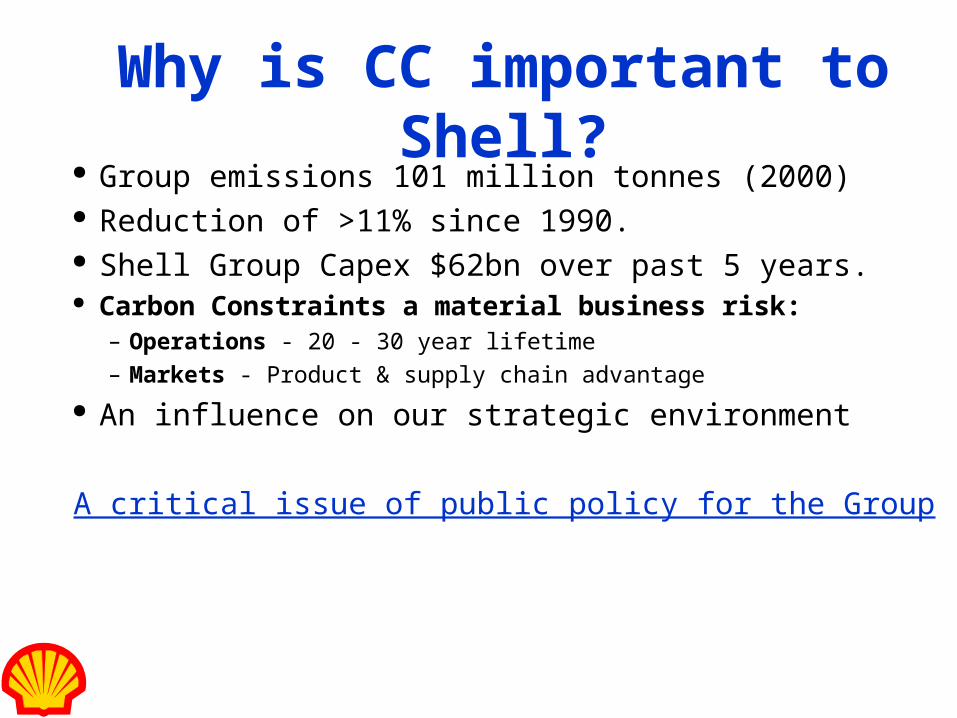
Why is CC important to Shell?
Group emissions 101 million tonnes (2000) Reduction of >11% since 1990. Shell Group Capex $62bn over past 5 years. Carbon Constraints a material business risk:
– Operations - 20 - 30 year lifetime– Markets - Product & supply chain advantage
An influence on our strategic environment
A critical issue of public policy for the Group
cost of carbon 0699PPT A. MURPHY– CLIMATE CHANGE
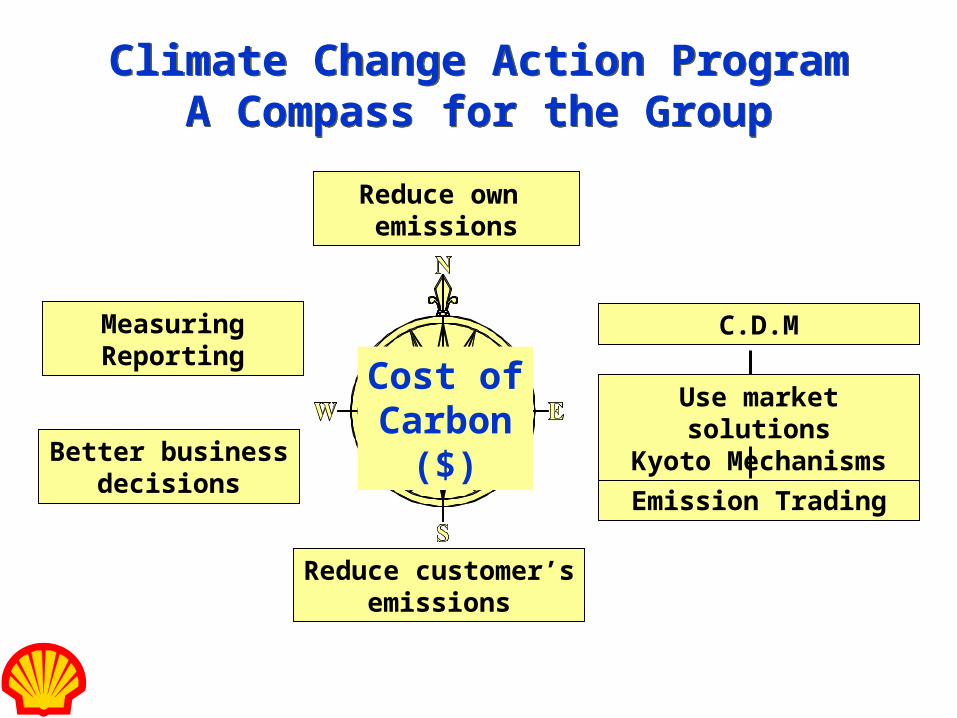
Climate Change Action ProgramA Compass for the Group
Climate Change Action ProgramA Compass for the Group
Cost ofCarbon
($)
Reduce own emissions
Reduce customer’semissions
Emission Trading
Better businessdecisions
MeasuringReporting
Use market solutions
Kyoto Mechanisms
C.D.M
cost of carbon 0699PPT A. MURPHY– CLIMATE CHANGE
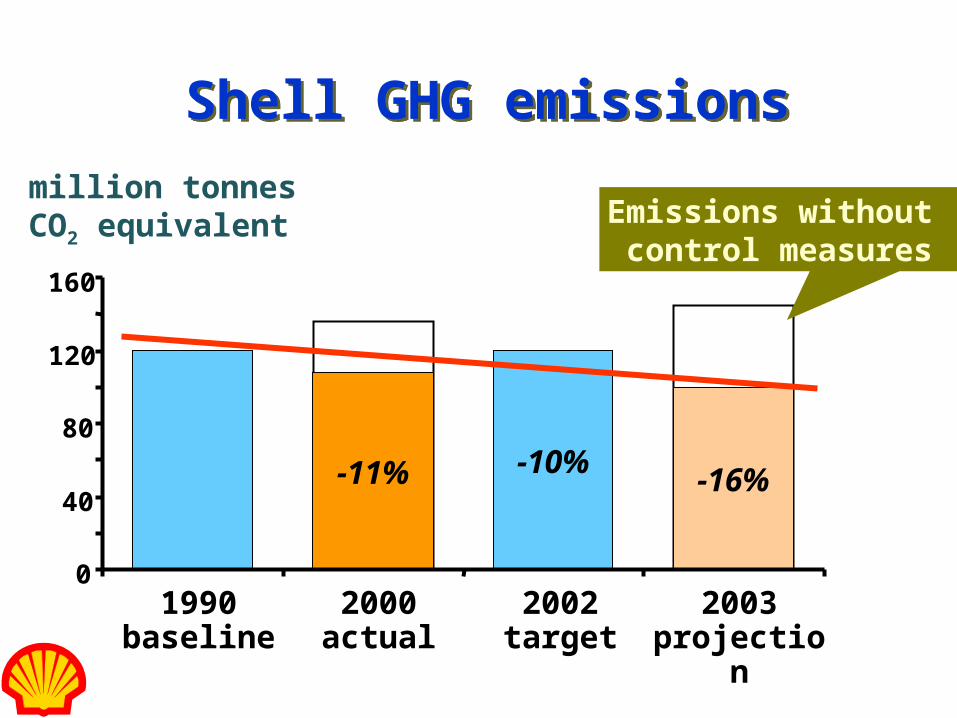
Shell GHG emissionsShell GHG emissions
-11% -10%-16%
0
40
80
120
160
1990 baseline
2000 actual
2002 target
2003 projection
million tonnesCO2 equivalent Emissions without
control measures
cost of carbon 0699PPT A. MURPHY– CLIMATE CHANGE
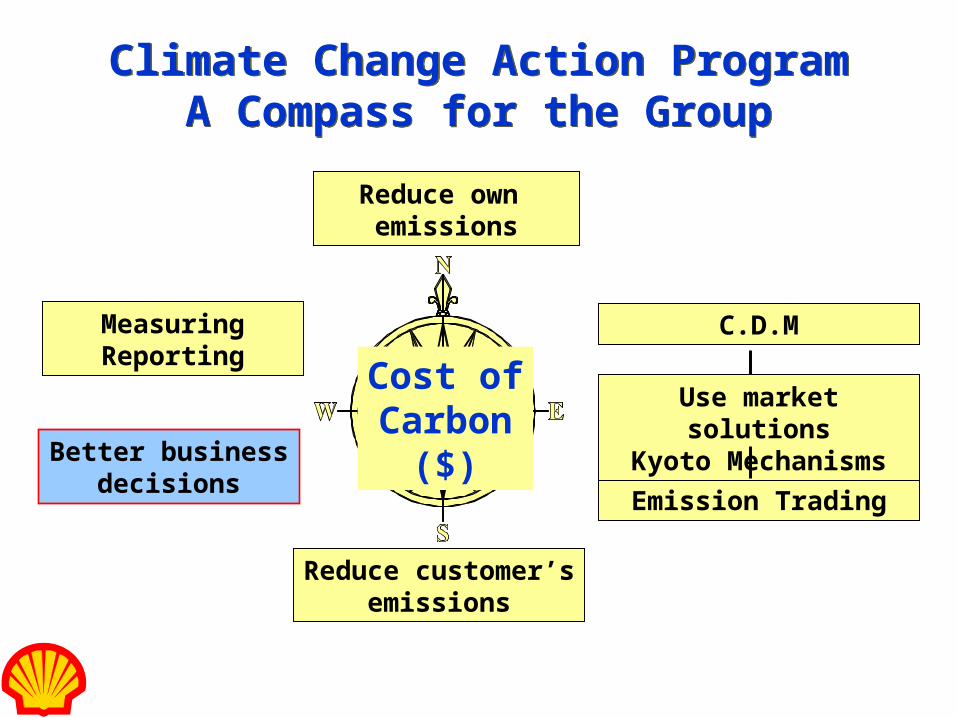
Climate Change Action ProgramA Compass for the Group
Climate Change Action ProgramA Compass for the Group
Cost ofCarbon
($)
Reduce own emissions
Reduce customer’semissions
Emission Trading
Better businessdecisions
MeasuringReporting
Use market solutions
Kyoto Mechanisms
C.D.M
cost of carbon 0699PPT A. MURPHY– CLIMATE CHANGE
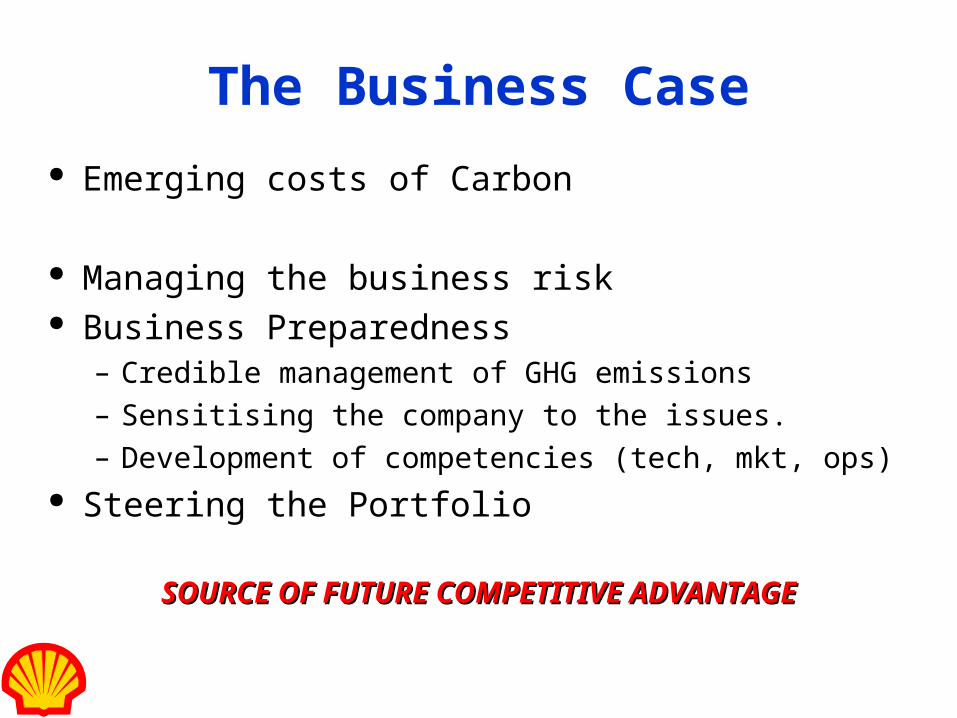
The Business Case
Emerging costs of Carbon
Managing the business risk Business Preparedness
– Credible management of GHG emissions– Sensitising the company to the issues.– Development of competencies (tech, mkt, ops)
Steering the Portfolio
SOURCE OF FUTURE COMPETITIVE ADVANTAGESOURCE OF FUTURE COMPETITIVE ADVANTAGE
cost of carbon 0699PPT A. MURPHY– CLIMATE CHANGE
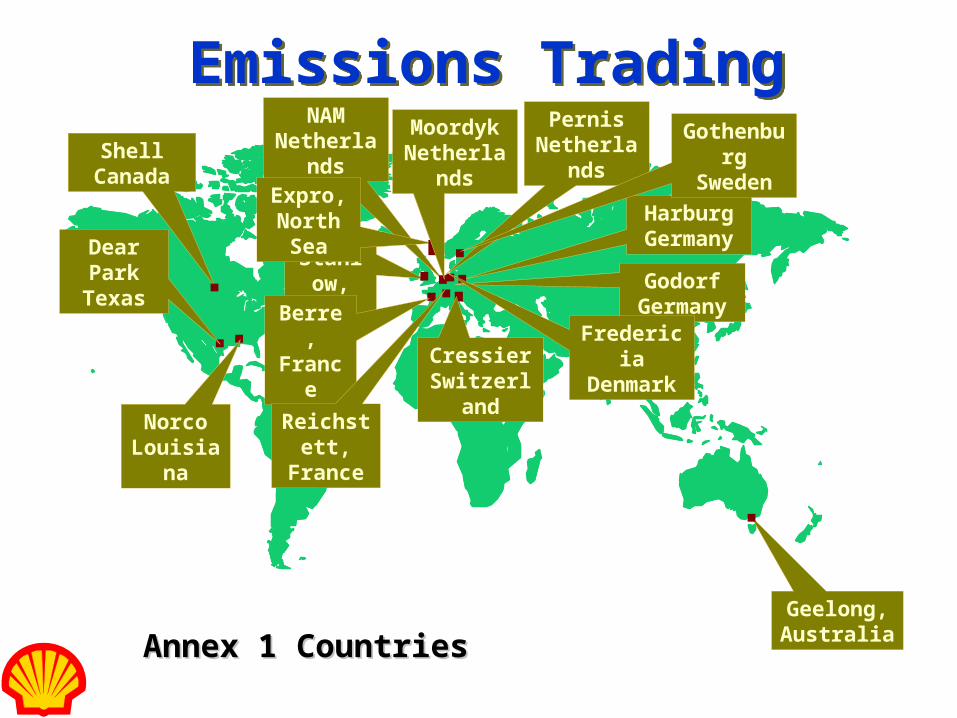
Emissions TradingEmissions Trading
Geelong,Australia
NAMNetherlands
Stanlow,UK
Dear ParkTexas
Expro,North Sea
MoordykNetherlands
Berre,France
NorcoLouisiana
CressierSwitzerland
Annex 1 CountriesAnnex 1 Countries
Shell Canada
PernisNetherlands
GodorfGermany
HarburgGermany
GothenburgSweden
Reichstett,France
FredericiaDenmark
cost of carbon 0699PPT A. MURPHY– CLIMATE CHANGE
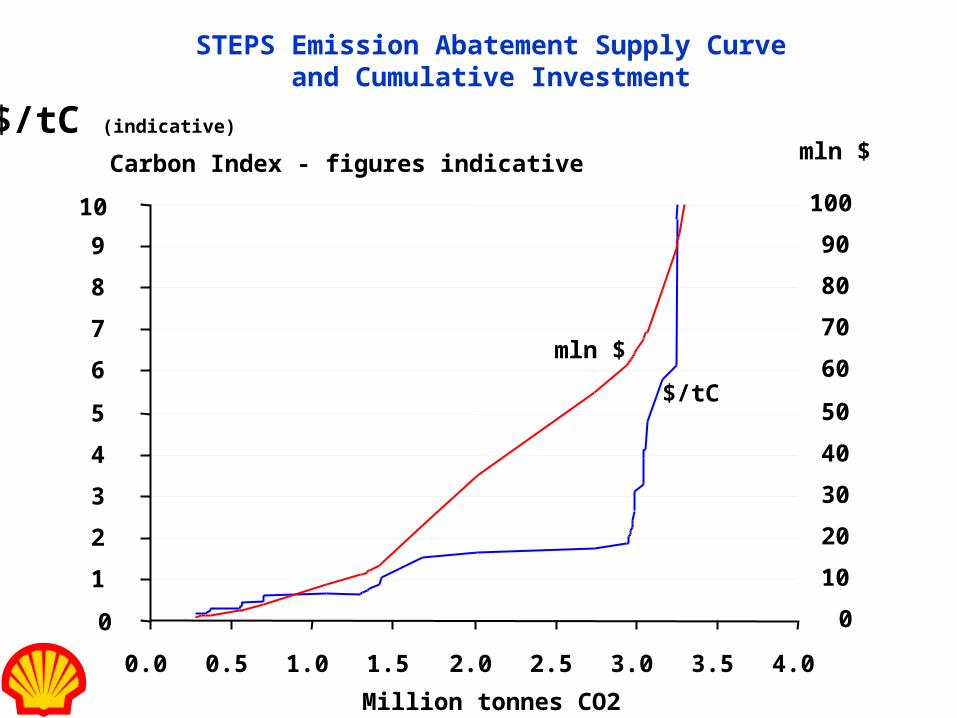
STEPS Emission Abatement Supply Curveand Cumulative Investment
Million tonnes CO2
$/tC (indicative)
mln $
$/tC
mln $
0
1
2
3
4
5
6
7
8
9
10
0.0 0.5 1.0 1.5 2.0 2.5 3.0 3.5 4.0
0
10
20
30
40
50
60
70
80
90
100
Carbon Index - figures indicative
cost of carbon 0699PPT A. MURPHY– CLIMATE CHANGE
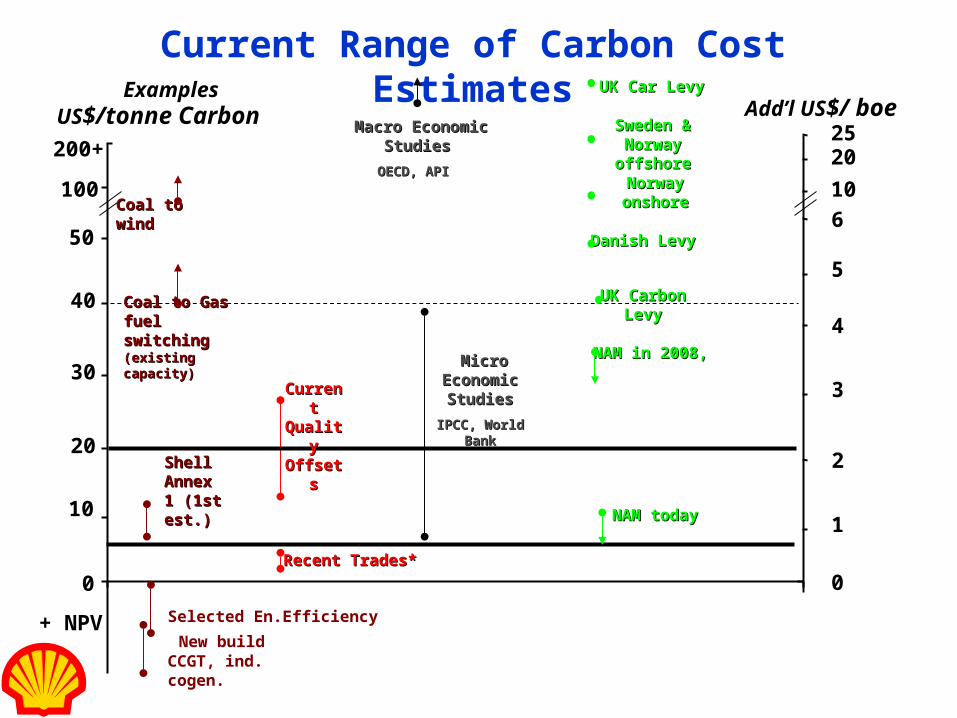
Current Range of Carbon Cost Estimates
+ NPV
0
100
200+
US$/tonne Carbon
10
20
30
40
50
New build CCGT, ind. cogen.
Selected En.Efficiency
NAM in 2008, NAM in 2008,
Recent Trades*Recent Trades*
0
1
2
3
4
5
6
10
2025
Shell Shell Annex 1 Annex 1 (1st (1st est.)est.)
UK Carbon UK Carbon LevyLevy
NAM todayNAM today
Add’l US$/ boe
Coal to Gas Coal to Gas fuel switching fuel switching (existing capacity)(existing capacity) Micro Micro
Economic Economic StudiesStudies
IPCC, World IPCC, World BankBank
Coal to wind Coal to wind
UK Car LevyUK Car Levy
Current Current Quality Quality OffsetsOffsets
Macro Economic Macro Economic StudiesStudies
OECD, APIOECD, API
Danish LevyDanish Levy
Norway onshoreNorway onshore
Sweden & Sweden & Norway offshoreNorway offshore
Examples
cost of carbon 0699PPT A. MURPHY– CLIMATE CHANGE
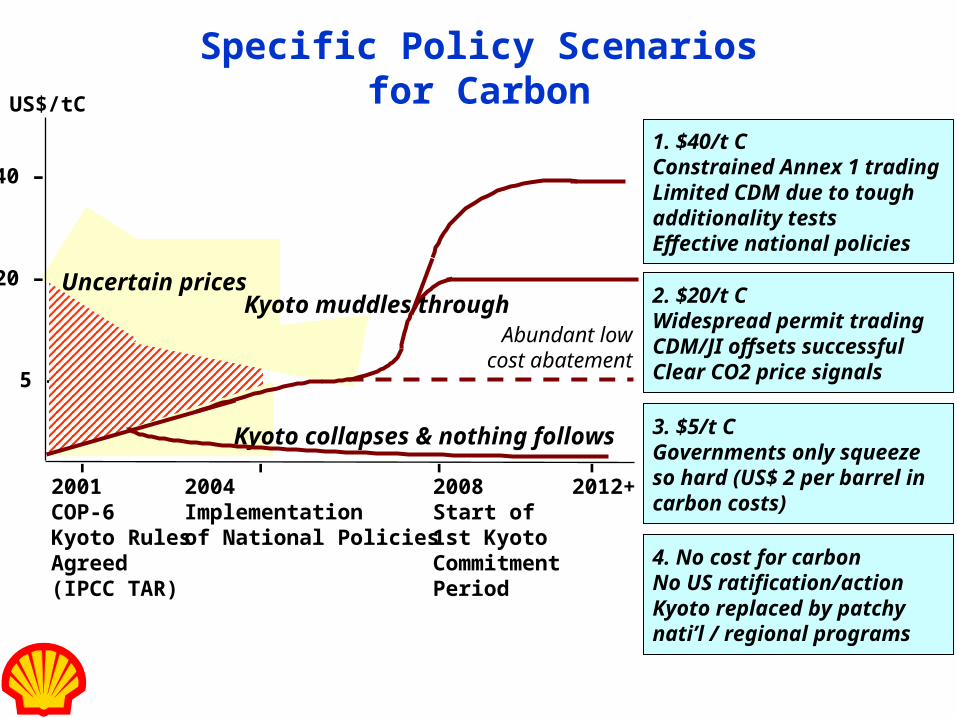
Specific Policy Scenariosfor Carbon
1. $40/t CConstrained Annex 1 tradingLimited CDM due to toughadditionality testsEffective national policies
2. $20/t CWidespread permit tradingCDM/JI offsets successfulClear CO2 price signals
3. $5/t CGovernments only squeezeso hard (US$ 2 per barrel incarbon costs)
4. No cost for carbonNo US ratification/actionKyoto replaced by patchynati’l / regional programs
US$/tC
40 –
20 –
5 –
2001COP-6Kyoto RulesAgreed(IPCC TAR)
2004Implementationof National Policies
2008Start of1st KyotoCommitmentPeriod
2012+
––––
Uncertain pricesKyoto muddles through
Kyoto collapses & nothing follows
Abundant lowcost abatement
cost of carbon 0699PPT A. MURPHY– CLIMATE CHANGE
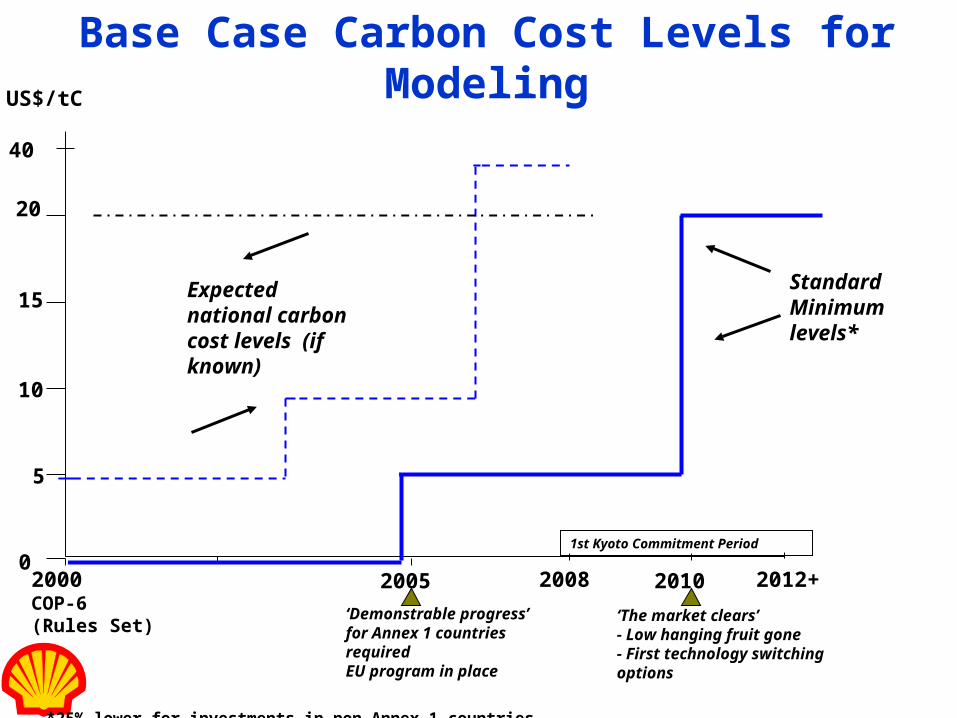
Base Case Carbon Cost Levels for Modeling
*25% lower for investments in non-Annex 1 countries.
2000COP-6(Rules Set)
2008 2010
20
5
US$/tC
2012+
1st Kyoto Commitment Period
2005
‘Demonstrable progress’ for Annex 1 countries requiredEU program in place
0
10
15Standard Minimum levels*
Expected national carbon cost levels (if known)
‘The market clears’- Low hanging fruit gone - First technology switching options
40
cost of carbon 0699PPT A. MURPHY– CLIMATE CHANGE
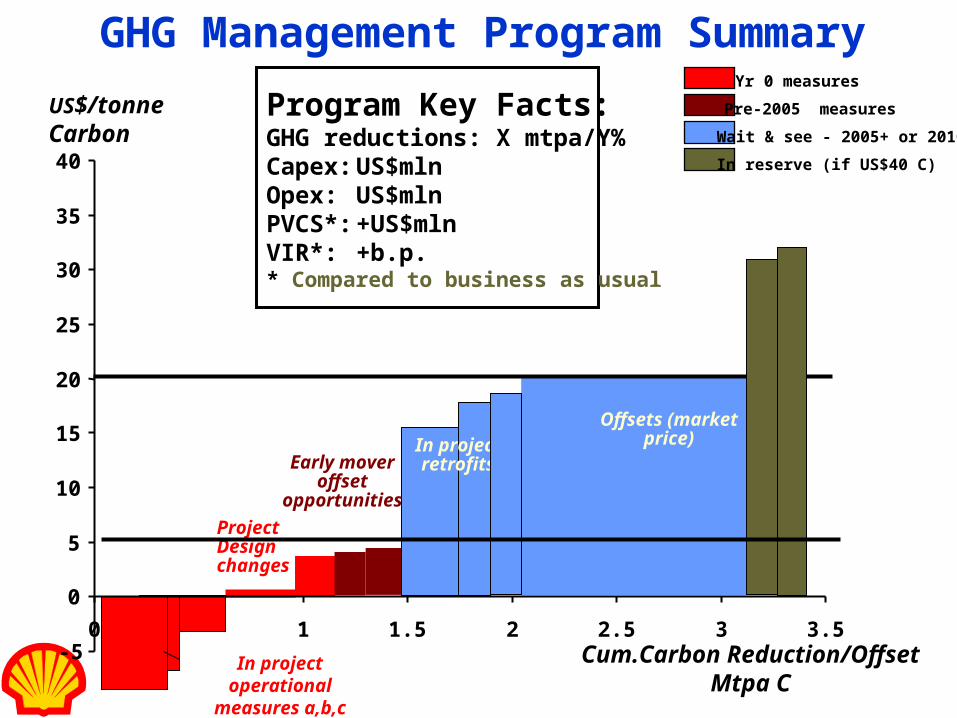
GHG Management Program Summary
-5
0
5
10
15
20
25
30
35
40
0 1 1.5 2 2.5 3 3.5Cum.Carbon Reduction/Offset
Mtpa C
Project Design changes
US$/tonne Carbon
Early mover offset
opportunities
In project operational
measures a,b,c
eg. Alternative
Energy
Offsets (market price)
Program Key Facts:GHG reductions: X mtpa/Y%Capex: US$mln Opex: US$mlnPVCS*: +US$mlnVIR*: +b.p.* Compared to business as usual
Yr 0 measures
Pre-2005 measures
Wait & see - 2005+ or 2010+
In reserve (if US$40 C)
In project retrofits
cost of carbon 0699PPT A. MURPHY– CLIMATE CHANGE
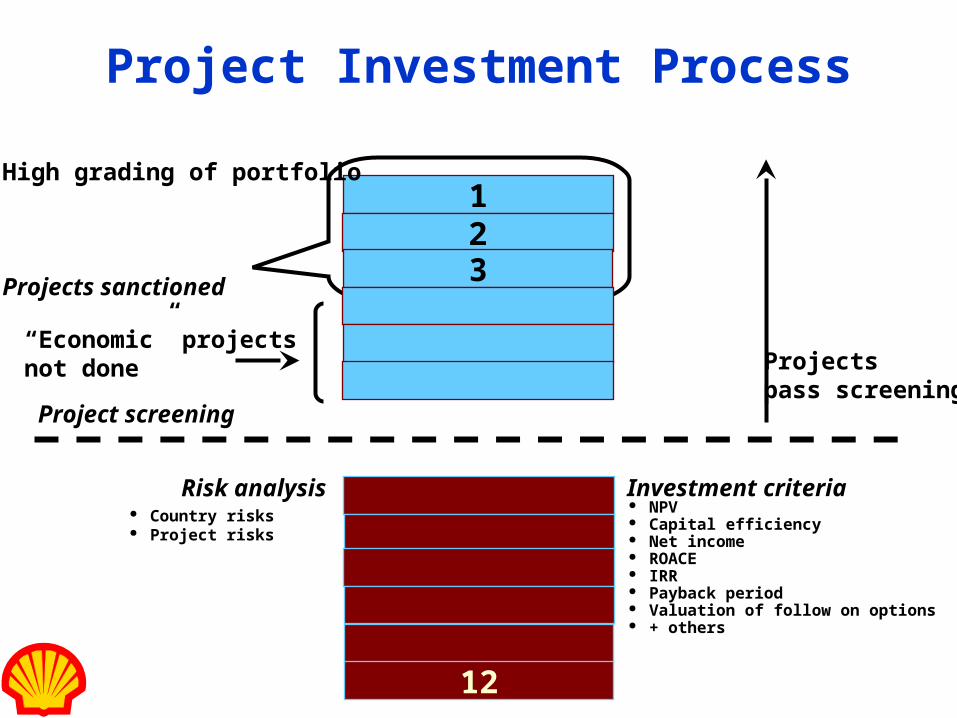
Country risks Project risks
Project Investment Process
Investment criteria NPV Capital efficiency Net income ROACE IRR Payback period Valuation of follow on options + others
Project screening
123
12
High grading of portfolio
Projects sanctioned
“Economic” projectsnot done
Risk analysis
Projectspass screening
Project investment options
cost of carbon 0699PPT A. MURPHY– CLIMATE CHANGE
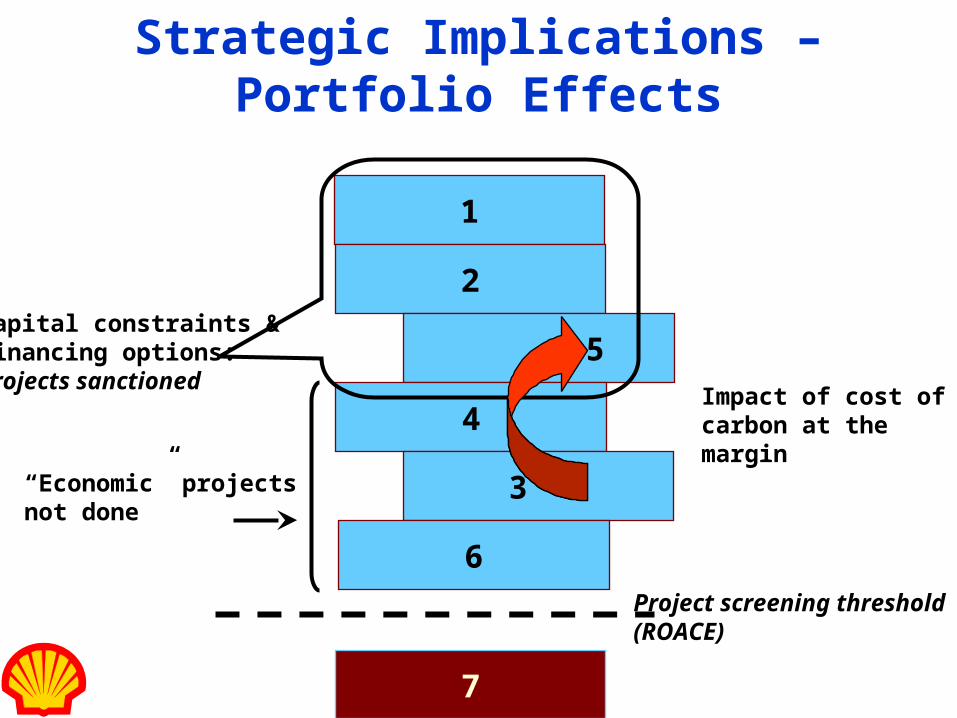
Strategic Implications – Portfolio Effects
1
2
5
4
3
6
7
Capital constraints &financing options:projects sanctioned
“Economic” projectsnot done
Impact of cost ofcarbon at themargin
Project screening threshold(ROACE)


![Wec Pwc Report[1]](https://img.pdfslide.net/doc/110x75/577d21341a28ab4e1e94b091/wec-pwc-report1.jpg)