Embed Size (px)
Citation preview
8/3/2019 Cost of Living Strategy
http://slidepdf.com/reader/full/cost-of-living-strategy 1/88
A Cost of Living Strategyfor TasmaniaOCTOBER 2011
PROFESSOR DAVID ADAMS
SOCIAL INCLUSION COMMISSIONER
8/3/2019 Cost of Living Strategy
http://slidepdf.com/reader/full/cost-of-living-strategy 2/88
Foreword
This is a strategy to give guidance on how a State Government can best tackle a publicpolicy issue of growing concern, the rising cost of living. The whole point of strategy is not to rush to simplistic solutions but to take the time to understand the nature of the issue athand and therefore where and how to best use scarce public resources to make adifference. This is the first attempt by any jurisdiction in Australia to develop a Cost of Living Strategy and I have focussed on a strategy for Tasmania not a strategy solely for thegovernment of the day. This is such an important issue, I would hope that the ideas I haveraised here will be canvassed by the Parliament. What I have provided here is a structuredway to both think about and act on cost of living.
Particularly in tight economic times it is important to focus on new ideas, more efficientways of allocating scarce resources and ensuring that we have a better evidence base towhat we do. Most importantly in tight economic times we should not be taking actions thatmake the most vulnerable relatively worse off than the rest of us. The strategy points to a
range of ideas and actions some that could be adopted immediately and others whichwould take more time. All are variously designed to take the lid off the pressure cooker,increase control over household costs and create better pathways to resilience.
We do not have a solid evidence base in Tasmania for understanding the effectiveness of much of what we do at present, especially with our concessions system. The concessionssystem is useful as a means of bolstering an inadequate income support system but it’s notclear how well it is targeted at those most at risk and the transaction costs of changes areoften very high (refer Interim Report March 2011).
Since there are several processes underway examining the electricity industry and electricity
pricing, I have not entered into this debate other than to note that actions to ‘cap’ priceincreases are usually poorly targeted, very expensive, can distort behaviours and are rarely maintained by governments. I have suggested a range of more sustainable strategies andactions. Strategies to increase contestability in the energy supply industry are worthy of examination to ensure just how and when the most vulnerable will benefit. As with many ideas to tackle cost of living the devil is often in the detail.
Many people contributed to the development of this strategy. Staff at the Social InclusionUnit provided intelligent advice, first class research and demonstrated both patience andperseverance. The Expert Advisory Group similarly provided many valuable insights andcritical commentary along the way.
This is the first cost of living strategy in Australia and presents a range of data (such as by household and place) which previously did not exist. It highlights the importance of understanding the specific circumstances of each household type and place rather than a‘one size fits all’ approach.
Tackling cost of living won’t be easy for this or any other government but by taking effort tounderstand the issues and possible strategic responses, Tasmania is at least one step aheadof all other jurisdictions.
Professor David Adams
Social Inclusion Commissioner for Tasmania
8/3/2019 Cost of Living Strategy
http://slidepdf.com/reader/full/cost-of-living-strategy 3/88
3
SummaryFor many Tasmanians the rising cost of living is the top issue facing an increasing number of
people who are concerned about the cost of power, water and fuel1. Some cost pressures
are linked to government policy choices (eg the gradual erosion of the value of the ’social
wage’2 from a low base and exacerbated by regressive user pays policies3), some to markets
(eg fuel prices) some to nature (eg grocery prices as a result of the Queensland floods) andsome as a result of our consumerist lifestyles (eg increasing household debt). Coping with
the challenges of life, like making ends meet, is more difficult so people are turning to
governments to offer solutions or at least show more interest in the issue.
The most powerful evidence about the importance of cost of living comes from the many Tasmanians who make three points (as documented in the voices of low incomeTasmanians in the Anglicare Tasmania report The Price of Poverty 4):
1. Costs are increasing at a greater rate than income for many essential services.
2. More and more individuals and families feel pushed to the edge and sometimes into crisis
and behaviours that lower health, education and economic participation rates.3. No one seems to take responsibility or care about the daily struggle of increasing costs of
living for low income households.
In this report I explain in more detail why the rising cost of living has become such animportant issue for so many Tasmanians, and propose a Strategy to deal with it.
The key elements of the Strategy are:
1. A framework to explain why cost of living is an issue of importance.
2. A focus on households and places so we can understand who is most at risk and why.
3. Key areas for strategic intervention and principles to guide action.
4. Actions within the strategic areas.
5. A focus on leadership and new forms of planning and service delivery.
For most Tasmanians rising costs may be offset by increasing income levels from wages and
salaries, from lower prices for some goods and services, by adjusting lifestyle expectations
and, by drawing on savings. Whilst rising costs are impacting on the lifestyle and
consumption choices of middle to high income households, these households are not facing
a crisis in affordability for the basics of life.
But this is not the story for around 40% of Tasmanians 5 who may face a growing gap
between their incomes and their costs, especially costs for essential services. The profiles of
1 The latest social and economic snapshot of Tasmania shows half the population is struggling with cost of living issues. TheTasmania Together report included a phone survey of 1 000 people, and written or online questionnaire responses fromanother 2 198 people between September and December last year. Respondents listed cost of living issues as a toppriority as well as job security, interest rates and housing prices.2 The social wage represents the benefits such as Medicare, superannuation, child care and family payments, includingmaternity allowance. Public health, housing, education and transport can also be referred to as social wage investments.3 These are policies where taxes and charges impose a greater burden on low-income people than those on high-incomesdue to these charges being the same regardless of income level and capacity to pay.4 See attachment to Cost of Living in Tasmania Companion Report 2 athttp://www.dpac.tas.gov.au/divisions/siu/strategy/cost_of_living 5 44% of Tasmanian households receive 20-100% of their income from Government benefits and allowances. While not all
of these will be under pressure, pressure is considered greatest for low income households of which 33% or more than67 000 households rely on benefits and allowances as the principal source of income. Some mid-level income householdscan also experience cost of living pressures where they face multiple risk factors e.g. associated with poor health.
8/3/2019 Cost of Living Strategy
http://slidepdf.com/reader/full/cost-of-living-strategy 4/88
4
these individuals and families and their experience of cost of living stress are outlined in this
Strategy. In addition there are some low to middle income households which face
particular cost of living stress at particular life stages including:
‘Family formation’ households (eg young people planning a family and a home)
Older Tasmanians (eg who may have assets but low incomes)
Small family businesses (eg self employed and starting out/newly established)Households with significant health or other shocks and life stressors
Households in communities facing significant change (eg newly unemployed as aresult of industrial change)
Whilst we can estimate how many households are likely to be under pressure, we do not
have a good handle on how many are in crisis or at risk of crisis. Although there are
particular measures of crisis in some areas, (such as housing stress where over 30% of
income spent on rent is an agreed threshold) we do not have any aggregate measure of a
cost of living crisis. What we do have is a range of indicators such as access to emergency
relief, energy disconnections and decline in health, including mental health status and
employment participation and so on. These indicators can be correlated both directly and
indirectly with the cumulative impact of cost of living pressures.
Importantly, I have found that we only have limited data on the take up rates and
effectiveness of many of our existing concessions and subsidies across government. As
these are specifically designed to assist people to avoid cost of living pressure, this is data
that we should have.
What are the explanations and solutions to cost of living pressures?
There are two types of basic starting points:
1. Explanations that focus on (a) the inadequacy of income support, (b) the
regressive nature of the tax system and (c) the general demise of the
‘welfare state’.
Solutions here are about reinvesting in the welfare state, stop blaming
the poor, progressive taxation and creating the right incentives for labour
market participation.
In this view governments are interventionist, redistributive and focussed
on equity and social justice.
2. Explanations that focus on (a) the inability of individuals and households
to adjust to tighter economic times and reset lifestyle expectations, or (b)
government inefficiency.
Solutions here are about efficient markets, personal responsibility,
consumer awareness and a basic safety net for the most vulnerable.
In this view governments are small, protectors of individual choice and
focussed on the wealth creation that will trickle down to the more
vulnerable.
8/3/2019 Cost of Living Strategy
http://slidepdf.com/reader/full/cost-of-living-strategy 5/88
5
This Strategy was commissioned by the State Government but it only has some of the
policy levers to tackle cost of living. Income support is a Australian Government matter as
are most of the macroeconomic levers influencing the cost of living. Also taxation revenues
are dominated by the Australian Government, and state taxation accounts for only a small
proportion of total government revenues. Nevertheless there are goods and services over
which the State Government has some control of pricing policy.
Within these constraints, the Strategy focuses on feasible options for the State Government
to pursue. The aim is to identify a framework and set of actions that can be delivered in
the context of an already tight State Budget. This is especially important given that the
State's revenue base is already largely regressive, that is the poor pay relatively more. In
times of fiscal constraint where State Government departments and Government Business
Enterprises (GBEs) are to find savings, they often turn to strategies, which are also
regressive. In recent months we have witnessed an array of responses by departments and
GBEs designed in part to improve their bottom lines. These responses include increases to
user charges such as public housing rents and adult education fees, proposed increases to
fines, administrative changes that reduce payment flexibility such as removal of timepayments options from TT line and warnings of new fees and charges likely to be
introduced such as for water. As with electricity, the risk of restriction of water service will
become a reality for some Tasmanians.
There are eight principles Tasmanians should adopt to guide strategy and action on cost of
living:
1. Policy decisions which increase prices or reduce subsidies should be progressive notregressive (precautionary principle).
2. Planning and decision making about cost of living should be made as close as possible to
the people and places most affected (subsidiarity principle).3. Those most at risk of crisis should be assisted first (immediacy principle).
4. Before making decisions that increase the cost of living burden, governments should talk directly with those people and places likely to be affected the most (consultation principle).
5. Many individuals and families will need support to take greater responsibility for cost of living risks and to manage reduced expectations (personal responsibility principle).
6. Cost of living risks can only be managed through partnerships between governments andwith the community sector and businesses (partnerships principle).
7. Strategies and actions should have a clear evidence base as to how and when and for whom the costs of living will be reduced (evidence principle).
8.
Investment in prevention is better than investment in crisis responses (prevention principle).I have opted for strategic interventions for which there is likely to be broad agreement
across the political spectrum namely:
1. Immediate support for people and places: The need for a basic safety net for those incrisis to provide immediate support for people and places.
2. Capacity building: Increased emphasis on the role of individual, family and community capacity building to manage current and future shocks and costs.
3. Effective institutions and leadership: Shared responsibility for action betweenfamilies/communities, markets and governments to create effective institutions andleadership.
8/3/2019 Cost of Living Strategy
http://slidepdf.com/reader/full/cost-of-living-strategy 6/88
6
Thirteen actions across the three key areas for strategic intervention are:
Immediate support for people and places
1. Increase the level of financial and organisational support, including adequate indexation, to community sector agencies dealing with individuals and families in crisis to manage demand growth and the increasing complexity of cases.
2. Review Community Service Obligations (CSOs) to assess social outcomes required from all companies providingessential services (Government Business Enterprises, State Owned Companies and Water Corporations)including the adequacy of funding provided to deliver CSOs and appropriate performance measures to assessCSO outcomes.
3. Implement a bill smoothing or progressive payment policy across all State Departments and GovernmentBusiness Enterprises to allow Tasmanians to better cope with large bills for electricity and other essential servicesand fees such as motor vehicle registration.
4. Review Concessions to better target those households most at risk.
5. Improve understanding and collection of information regarding the under-reporting of hardship related electricity ‘self disconnections’.
6. Improve promotion by service providers of existing hardship provisions to increase awareness and access. Thiscould be triggered by much earlier identification of at risk households and promotion of support servicesavailable.
Capacity building
7. Develop peer support and volunteer networks in community houses and/or local councils to broker access to:
o Emergency Assistance funds
o Concessions
o Financial literacy and micro-finance
o Energy efficiency
o Community networks
o Complaints mechanisms and redress
8. Reintroduce ‘home economics’, including financial literacy and life skills in schools, adult education and community settings
9. Support local social cooperatives, micro generation, energy efficiency policies and group buying especially regarding food.
10. Implement economic development policies that encourage local employment, procurement, social enterprisefacilitation and targeted employment generation programs.
Effective institutions and leadership
11. Rebuild the social wage and advocate with the Commonwealth for adequate income support payments and a
more progressive taxation system.12. Appoint an Essential Services Commission embedded in legislation, including cross sectoral representation and
potential appropriate volunteer membership. Commission would review planned price increases and oversightprice movements, potential price shocks and cumulative risk.
13. Establish a Parliamentary Committee or other public mechanism to inquire into:
o the effectiveness of the current concessions system and related services, including social tariffs;
o alternative models of planning and service delivery of concessions including the option of ‘bundling concessions’ through a ‘smart card system’;
o regressive legislation such as the Monetary Penalties Enforcements Act 2005 and providerecommendations;
o the impact of taxation policies on costs of living; ando the likely impacts of increased contestability policies on reducing cost of living pressures.
8/3/2019 Cost of Living Strategy
http://slidepdf.com/reader/full/cost-of-living-strategy 7/88
7
Many of the mainstream activities of the State Government directly and indirectly help
reduce cost of living pressures or increase the capacity of all Tasmanians to mitigate the
associated risks. The traditional social wage (eg public health, housing, education and
transport) is still the best response to cost of living for the majority of people. Significant
increased investment to the social wage may be difficult in the current economic
circumstances. Nevertheless, this Strategy provides the evidence base for such investments,
better targeting to areas of need (by place and household) and consideration of new planning and service delivery approaches. The community sector in Tasmania is a key to
addressing cost of living risks. The sector is often more in touch with those households and
places most at risk, has the potential to intervene early and has a capacity to shape services
to best meet specific needs. It is of some concern that the community sector continues to
face pressure and uncertainty from governments on current and future funding levels.
In the longer term, while a more educated, skilled and productive Tasmania would be
better equipped to deal with cost of living pressures, there will always be households who,
for unforseen reasons such as temporary unemployment or a sudden increase in the price
of essentials, will need and deserve support. At present no one person or entity ingovernment has overall responsibility for considering the cumulative impact of increasing
prices and charges.
There is no coordinated mechanism within Tasmania for any oversight of the cumulative
impact of changes to government pricing and policy settings on the wellbeing of the most
vulnerable.
Given the importance of the issue for Tasmania and the substantial policy and fiscal
implications for any State Government in taking on a greater responsibility for managing
(and not exacerbating) cost of living pressures, a Parliamentary Committee or alternative
public mechanism could examine the issues outlined in area for action 13 and put a clear
value proposition to Tasmanians on what can be done.
The impact of financial stress on individuals, families and communities is devastating. Parents
and children go without food to keep a roof over their head and whole families go to bed
early because it is too cold to stay up. These are the hard choices being made daily in
Tasmania. All of this paints a worrying picture that challenges our long held sense of a state
with the best quality of life and lifestyle in the nation.
Yet there is action that government can take. In the Strategy, I present the accumulated
research and data that supports well reasoned actions that a government of any political
persuasion, determined to build a Tasmania committed to supporting the most vulnerable,
will be able to acknowledge as sensible and necessary steps.
Individual price rises usually have a sensible industry rationale and words
like ‘contestability’ and ‘competition’ are invoked with fervour on all
sides of politics, but these do not guarantee that the least well off can
participate in our community. It means very little to a pensioner sitting
in the cold eating cold food, waiting for the market ‘trickle down’ effect
to provide comfort.
8/3/2019 Cost of Living Strategy
http://slidepdf.com/reader/full/cost-of-living-strategy 8/88
8
Since this is a strategy document not a fully costed plan of action, I have mostly avoided
budget estimates. However, if there was to be one immediate action to advocate it would
be to provide additional local staffing capability (for example across all 34 Community
Houses in Tasmania or through local councils) plus increased levels of flexible support funds
(eg for financial literacy and micro finance, emergency assistance, concessions, complaints
redress, agency costs and community networks) so those households facing crisis could be
better supported locally and a little earlier. The per annum costs of this would be in theorder of $5 million.
8/3/2019 Cost of Living Strategy
http://slidepdf.com/reader/full/cost-of-living-strategy 9/88
9
Key facts and findingsTasmanian prices
Tasmania has experienced lower price increases across all essential goods and serviceswhen compared to the Australian average. However, over the past five years the followingprices6 have increased:
Housing (including rents) by 25%
Electricity by 49%
Health by 24%
Food by 22%
Education by 22%
Tasmanian households are affected by the individual ‘price shocks’ as well as the cumulativeimpact of these price increases.
Tasmanian incomes
Tasmanian incomes are below the national average:
A third of households are reliant on government pensions and allowances as their principal source of income7 and another 10-15% are the ‘working poor’8.
More than one third of the Tasmanian workforce is part-time and underemploymenthas almost doubled over the past four years9.
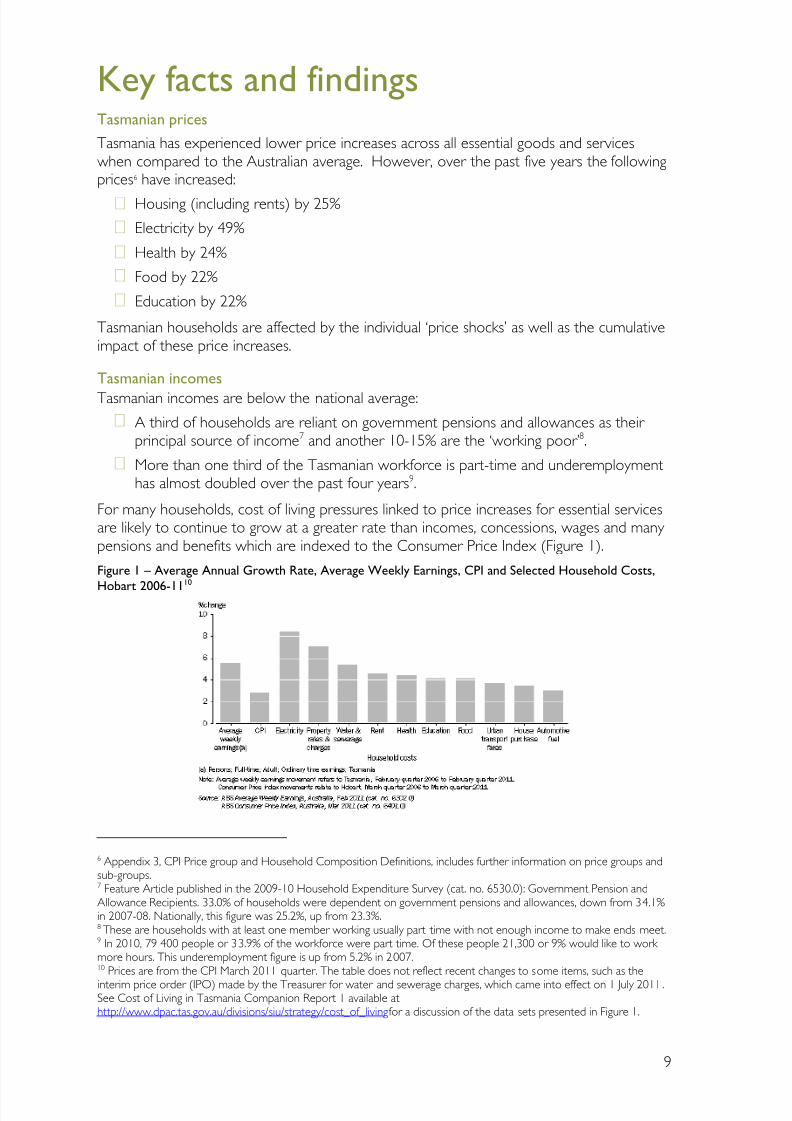
For many households, cost of living pressures linked to price increases for essential servicesare likely to continue to grow at a greater rate than incomes, concessions, wages and many pensions and benefits which are indexed to the Consumer Price Index (Figure 1).
Figure 1 – Average Annual Growth Rate, Average Weekly Earnings, CPI and Selected Household Costs,
Hobart 2006-1110
6 Appendix 3, CPI Price group and Household Composition Definitions, includes further information on price groups andsub-groups. 7 Feature Article published in the 2009-10 Household Expenditure Survey (cat. no. 6530.0): Government Pension andAllowance Recipients. 33.0% of households were dependent on government pensions and allowances, down from 34.1%in 2007-08. Nationally, this figure was 25.2%, up from 23.3%. 8 These are households with at least one member working usually part time with not enough income to make ends meet.9 In 2010, 79 400 people or 33.9% of the workforce were part time. Of these people 21,300 or 9% would like to work more hours. This underemployment figure is up from 5.2% in 2007.10 Prices are from the CPI March 2011 quarter. The table does not reflect recent changes to some items, such as the
interim price order (IPO) made by the Treasurer for water and sewerage charges, which came into effect on 1 July 2011 .See Cost of Living in Tasmania Companion Report 1 available athttp://www.dpac.tas.gov.au/divisions/siu/strategy/cost_of_living for a discussion of the data sets presented in Figure 1.
8/3/2019 Cost of Living Strategy
http://slidepdf.com/reader/full/cost-of-living-strategy 10/88
10
Adequate income is an essential resource to cope with cost of living. Non-financialresources such as supportive family and community networks, life skills and knowledge arealso important.
What is the problem?
The evidence base for the Strategy shows multiple cumulative price rises simultaneously occurring alongside decreasing resources for many individuals, households and places. Thegap between incomes and cost of living is expected to continue into the future as a resultof our changing demographics (eg ageing population) and the related increasingdependency ratio.
There are seven specific concerns:
1. For some households there is a widening gap between household resources and the costof goods and services. When the resources (financial and other) available to individualsand households are not increasing at the same rate as the cost of essential goods andservices, people find themselves less able to manage the cost pressures and still have adecent life.
2. For many people who were already struggling to meet living costs, recent increases havenot meant cost of living pressures, rather cost of living crisis.
3. Cost of living pressures are extending to more Tasmanians, not just the traditional‘disadvantaged’ populations and places11.
4. For an increasing number of Tasmanians there are fewer avenues to turn to for support,and less savings to draw on12.
5. Increases are often occurring as ‘shocks’, ie large and unexpected.
6. These shocks appear to be more frequent with impacts compounding over time.
7. The value of concessions and other ‘social wage’ investments of governments are muchless than the price increases.
No one person or entity in government has overall responsibility for considering thecumulative and disproportionate impacts of increasing prices and charges on Tasmanianhouseholds. Nor is anyone accountable for the regressive distributional impacts on themost vulnerable Tasmanians. This is reflected in, and contributes to:
A lack of quality data;
A complex concessions system;
Limited capacity to plan, forecast and mitigate cost of living risk associated with priceincreases and other policy decisions;
An inability to schedule and manage price increases which would enable people toplan ahead and minimise ‘shocks’;
The views of those most affected by cost of living decisions have no single point of contact within government.
11 Gallet, W, 2010 Perceptions of poverty: an insight into the nature and impact of poverty in Australia , The Salvation Army,Access Economics, 2008 The impact of the Global Financial Crisis on social services in Australia. 12 Kelly, S, and Gong, H, 2010 Saving tomorrow – the savings and spending patterns of Australians. AMP.NATSEM Incomeand Wealth Report, Issue 25, page 6. Between 1990 and 2005 there was a decline in the proportion of disposable
income that Australian households saved, and by June 2005 the ratio of savings to income had fallen to -1.4%. Compared to other States and Territories, Tasmania has the lowest median savings, reflecting its lower average incomes, labour forceparticipation rate, and higher number of couples and individuals over 65 years of age.
8/3/2019 Cost of Living Strategy
http://slidepdf.com/reader/full/cost-of-living-strategy 11/88
11
How does it impact on Tasmanians?
Tasmanians are facing financial difficulty as a result of cumulative cost of living impacts13. Asa consequence, people adopt one or more ‘coping’ strategies such as:
Substitution (eg eating food which requires less energy to prepare);
Rationing (eg reducing heating levels and times in the home);
Seeking increased resources through personal, family or community actions (eg sellingpossessions, students increasing paid work hours);
Accessing the welfare safety net (eg emergency relief services); and/or
Simply going without the basics (eg going without food, not getting a medicalprescription filled, not keeping warm when it is cold).
The levels of rationing and substitution in Tasmania are of concern because households aregoing without to the extent that they do not have a decent standard of living and thisaffects their health and wellbeing14. Latest data indicates that the buying power of key low-income households in Tasmania has reduced between 2003-04 and 2009-10 15.
Over the past 12 months more than 22 000 Tasmanians sought emergency relief supportfrom welfare organisations and over the past five years there has been a 750% increase inpeople seeking help for the first time.16 Cost of living pressures are likely to push moreTasmanians into emergency relief in the future.
A common argument is that people bring cost of living pressures on themselves by notbudgeting properly and running up big debts they cannot pay off. There is little evidence tosupport the view that people on low incomes are more likely than high income earners tobe poor managers of finances. For many low income households it is simply that there isnot enough for essentials in the first place, and if something goes wrong they have fewer resources to draw upon.
Who is most impacted and where are they?
The research demonstrates that cost of living pressures vary in impact between populationgroups and places and policy responses need to be sensitive to these differingcircumstances.
13 Companion Report 2 Cost of Living in Tasmania – The community impacts and the associated Anglicare Report Theprice of poverty provides a current picture of the impacts of current cost of living pressures for Tasmanian low incomehouseholds. 14 See Anglicare report The price of poverty attachment to Companion Report 2 available athttp://www.dpac.tas.gov.au/divisions/siu/strategy/cost_of_living 15 Australian Bureau of Statistics 2011, Household Expenditure Survey, Australia: summary of results, 2009-10, cat no 6530.0.16 Over the past 12 months the number of Tasmanians accessing emergency relief services increased by 52% to more than22 000. Over the same period, there were more than 8 000 people seeking emergency relief for the first time, anincrease of more than 44%. Since the collection of data in 2004-05 to 2009-10, there has been a 150% increase in thenumber of people seeking emergency relief to more than 22 000. The number of first time clients increased more than750% from 1 000 to 8 500. Appendix 2 outlines the spatial distribution of emergency relief clients and Tasmaniancommunities facing the greatest impacts. Typical forms of Emergency Relief includes food, chemist and transport vouchers,
payments to help with rent/accommodation, help towards the cost of bills, material to help such as food hampers or clothing, help with basic budgeting, and referring clients to other service to help address underlying causes of financialcrises.
8/3/2019 Cost of Living Strategy
http://slidepdf.com/reader/full/cost-of-living-strategy 12/88
12
Households most at risk of cost of living pressures are17:
Workers with income support (receiving 50-90% income support)
Single parents (with one or two children)
Lone person
Pensioners (includes aged and disability support pensions)Unemployed (includes Newstart and youth allowance)
Local Government Areas with the highest proportional mix of low income, single parents,lone person, pensioner and unemployed households in Tasmania include18:
Break O’ Day
Brighton
Central Highlands
George Town
The population modelling also demonstrates that although in 2011 the Tasman LocalGovernment Area has high proportions of pensioner and unemployed households, by 2016,it is projected to have high proportions of low income, single parents, lone person,pensioner and unemployed household types.
Some areas in Tasmania are also currently, or at risk of becoming, ‘food deserts’19. The key characteristics of a food desert are a place where:
Access to food is difficult (eg limited transport options)
Quality of food is low (eg the available food is not fresh, nutritious, culturally appropriate etc)
Quantity/range is restricted (ie limited choice)
Food is not affordable (prices higher than average).
What can be done about it?
Many of the main levers to address cost of living are the responsibility of the AustralianGovernment such as the tax and transfer system. However, many of the price increasesrelate to essential services provided by the State Government or for which the StateGovernment has a policy responsibility. Poor policy settings contribute to increased costs.The State Government can:
provide better immediate responses to people in crisis;
increase the resourcefulness of individuals, families and communities;
show leadership20 and implement new forms of planning and service delivery.
17 The households are based on an analysis of expenditure on essential items (food, housing (including utilities) health, transport and education). The methodology for identifying these households is contained in this Strategy. The householdsare defined in Appendix 3. Detailed household information is available in Companion Report 1 – Cost of Living inTasmania – The data. Although these are the groups most at risk, people not in these categories can also experience costpressures. Community sector research indicates that particular population groups experience more cost of l iving risk thanothers. These include people with disabilities and their carers, Aboriginal people and humanitarian entrants. CompanionReport 2 Cost of living in Tasmania – Community Impacts provides more detail regarding these population groups. 18 Refer National Centre for Social and Economic Modelling 2011, Population distribution in Tasmania 19 More detailed information available in Companion Report 2 – Cost of Living in Tasmania – Impacts and Responses20 No Government has a Minister for Cost of Living, although the early signs are underway with Tasmania appointing aParliamentary secretary and Victoria and Tasmania having shadow portfolio members.
8/3/2019 Cost of Living Strategy
http://slidepdf.com/reader/full/cost-of-living-strategy 13/88
13
What happens if there is no change to current policy?
As people go without essential goods and services, there are significant personal, family,community and business costs. Many of these costs are known for specific risk factors suchas poverty, homelessness, chronic disease and mental health. Implementing actions thataddress cost of living risk can help reduce the public or social costs, which are generally:
Reduced ability to contribute through employment and other means;
Additional burden on health systems (includes mental health);
Resources lost because of lack of educational attainment;
Increases in costs associated with policing and justice;
Costs associated with increased levels of program support from the government andcommunity sectors.
The disproportionate and cumulative impacts on some of the most vulnerable Tasmaniansmay mean deterioration of an already sub-standard of living for many. Pressure on thegovernment and community safety net services may increase, causing resources to bestretched. In the community sector those resources are being stretched further by policies that reduce indexation levels and the uncertainty about funding for the Community ServicesAward. Families and communities will miss out and intergenerational disadvantage may beexacerbated. Tasmania has some of the lowest incomes and highest levels of disadvantagein the nation. The current cost of living crisis for many households and places threatens tocause the State to fall further behind.
8/3/2019 Cost of Living Strategy
http://slidepdf.com/reader/full/cost-of-living-strategy 14/88
14
Table of contentsForeword ............................................................................................................................. 2
Summary .............................................................................................................................. 3
Key facts and findings ..................................................................................................... 9
Background ...................................................................................................................... 16
Introduction ..................................................................................................................... 19
A policy framework for cost of living ................................................................. 27
Cost of living issues for Tasmania ........................................................................ 30
Responses and areas for action ............................................................................ 44
Conclusion ........................................................................................................................ 64
AppendicesAppendix 1 Terms of Reference Cost of Living Strategy
Appendix 2 Supporting maps
Appendix 3 Household composition definitions
8/3/2019 Cost of Living Strategy
http://slidepdf.com/reader/full/cost-of-living-strategy 15/88
15
Companion Reports
Report 1 Cost of Living in Tasmania – The Data
Also Department of Premier and Cabinet, Social Inclusion Unit commissioned work:
Dufty, G, and MacMillan, I, 2011 The Relative Price Index, The CPI and theimplications of changing cost pressures on various household groups. Unpublishedcompanion report
National Centre for Social and Economic Modelling, 2011 Cost of living indicatorsfor Tasmania
National Centre for Social and Economic Modelling, 2011 Estimating the SpatialDistribution and Characteristics of Households in Tasmania
Report 2 Cost of Living in Tasmania – The Impacts and Responses
Also Department of Premier and Cabinet, Social Inclusion Unit commissioned work:
Flanagan, J and Flanagan, K, 2011 The price of poverty: cost of living pressures andlow income earners, Hobart: Anglicare Tasmania
Fudge, M. 2011 Local voices: enquiry into community assets in Circular Head,Tasmania. Hobart: Relationships Australia Tasmania
Dare, M, Kimber, J, and Schirmer, J, 2011 Tasmanian Drought Evaluation Project ,
Hobart: University of Tasmania and JS Consulting
Community Inclusion Workers, Child and Family Centres Project 2011Community consultation report for the Social Inclusion Unit, Department of Premier and Cabinet
Council on the Ageing Tasmania, 2011 A sense of belonging: social inclusion issuesfor older people in Tasmania
A Cost of Living Strategy for Tasmania , Appendices, Companion Reports 1 and 2 and
associated documents are available at:http://www.dpac.tas.gov.au/divisions/siu/strategy/cost_of_living
8/3/2019 Cost of Living Strategy
http://slidepdf.com/reader/full/cost-of-living-strategy 16/88
16
Background In recent years, cost of living issues have gained prominence in Tasmania and nationally,particularly cost pressures associated with essential goods and services such as electricity,water and food.
In 2010, Australians elevated the cost of living to be the second most important issue they
face21. Whilst occasionally markets attract attention (for example fuel prices and grocery prices) the role of governments, especially state governments, in managing these risks hasbecome the focus of attention because people expect their government to look after thewellbeing of its citizens.
There can be no greater priority for Tasmania than to ensure that currentand future generations live in our State without hunger, poverty, stigma or discrimination and with access to the resources and relationships they need to participate in civic, economic and social life.
The Government’s Preliminary Response to the Social Inclusion Strategy 22
Cost of living was also the most commonly raised issue during Tasmania Together ‘s 10 Year Review 23. Tasmanians raised concerns about rising general household expenses includingelectricity, water and sewerage, food, public transport, council rates, childcare and petrol.They also raised concerns about increasing house costs (interest rates, house purchaseprices and rental costs), medical bills, the cost of private health insurance and the high priceof ‘gap’ payments, education costs (school fees, uniforms and additiona l curriculumactivities), and higher education costs (HECS-HELP fees).
A community consultation by the Social Inclusion Unit in April and May 2010 confirmed that communities across Tasmania are concerned about the pressures on individuals andfamilies and their capacity to meet the rising costs of living24.
Had to freeze most of winter and only ate once a day. Too dear tocook, heater 2 hours a day, bed at 5pm25.
Female, 55-69, postcode 7000
In July 2010 the State Government asked me to develop a Cost of Living Strategy for Tasmania which would provide an accurate picture of cost of living in Tasmania and identify current activity, resources and options to address cost of living pressures experienced by various income groups, population groups, household types and places at risk of socialexclusion26.
21 Ipsos-Eureka Social Research Institute Issues Monitor , (November 2010) survey found that healthcare/hospitals ranked48% and cost of living 29%. Cost of living is more important for younger Australians, with 39% of 18-29 year-oldsnominating it as one of the most important issues. In comparison just over one-third (35%) of people aged 30-49 and one-fifth (20%) aged 50+ selected it as one of the most important issues. The December 2010 Issues Monitor reported anincrease in the proportion of Australians (33%) who believe inflation/cost of living is a top issue facing the nation .22 Social Inclusion Unit, 2009 A Social Inclusion Strategy for Tasmania: preliminary response, Hobart: Department of Premier and Cabinet, p. 4.23 Tasmania Together Progress Board, 2011 Speak today, shape tomorrow: what the community said, Hobart: TasmaniaTogether p.9.The consultation phase for the 10 year review of Tasmania Together was undertaken between September and December 2010.24 Department of Premier and Cabinet 2010, Social Inclusion community consultation: community priorities for a Social Inclusion
Strategy for Tasmania, Appendix A, pp. 16-23.25 Tasmania Together Progress Board, 2011 p.9.26 See Appendix 1 – The Terms of Reference for the Cost of Living Strategy.
8/3/2019 Cost of Living Strategy
http://slidepdf.com/reader/full/cost-of-living-strategy 17/88
17
In October 2010, the Tasmanian House of Assembly further requested that I consider aproposal to introduce a two-part electricity concession for Tasmanian households andprovide my advice to the Premier in an interim cost of living report.
The Cost of Living in Tasmania: Interim Report 27 (Interim Report) was tabled in Parliament on8 March 2011, and provided comment on the proposed electricity concession in thecontext of an emerging broader cost of living strategy. The Interim Report alsorecommended a package of measures to provide immediate relief from cost of livingpressures in particular areas such as those relating to utilities, as well as strategic andsustainable change to increase the capacity of individuals, households and places to better manage cost of living risks.
A Cost of Living Strategy for Tasmania (the Strategy) and its associated Companion Reports28 incorporate and expand on the advice contained in the Interim Report. The Strategy drawson a comprehensive data analysis of cost pressures for Tasmanians and further explores themedium to longer term policy responses and investment options that can be considered by governments, individuals, markets and communities.
The Strategy relies on data from the Australian Bureau of Statistics (ABS) Consumer Price
Index (CPI), the Household Expenditure Survey (HES)
29
, Survey of Income and Housing andpopulation projections. As most of these surveys are limited to capital city or balance of state data, the Strategy also supplements this information with survey work commissionedacross rural and regional communities in Tasmania.
This information is contained in the attachments to the Strategy’s Companion Report 2 Cost of Living in Tasmania – Impacts and Responses, which include: the Anglicare report The priceof poverty 30; the Relationships Australia report Local voices: enquiry into community assets inCircular Head, Tasmania31, and the Tasmanian Drought Evaluation Project Report32. TheCommunity Inclusion Workers operating out of the Children and Family Centres statewidealso collected input from urban and regional communities33.
The Strategy has been informed by advice provided by a Cost of Living Expert Advisory Group comprised of Ms Ann Hughes, Mr Gavin Dufty, Ms Kathleen Flanagan, Professor David Hayward and Dr Paul Blacklow.
The Expert Advisory Group was supported by a State Government Interagency WorkingGroup comprising officers from the Departments of Premier and Cabinet; Treasury andFinance; Justice; Education; Health and Human Services; Infrastructure, Energy andResources; Primary Industries, Parks, Water and Environment; and Economic Development,Tourism and the Arts. A Commonwealth Interagency Group also provided data and policy information to assist the Expert Advisory Group in its considerations.
Members of the Expert Advisory Group provided particular expertise and policy
perspectives that informed my consideration of cost of living issues in Tasmania. It is
27 Adams, D. 2011. Cost of Living in Tasmania: Interim Report , Department of Premier and Cabinet: Hobart. Available athttp://www.dpac.tas.gov.au/divisions/siu 28 Refer Companion Report 1 – Cost of Living in Tasmania – The Data and Companion Report 2 Cost of Living in Tasmania – Impacts and Responses both available at http://www.dpac.tas.gov.au/divisions/siu 29 The strategy and associated companion reports incorporate the 1988-89 and 2004-04 HES. On 7 September 2011 the2009-10 HES was released by the Australian Bureau of Statistics. The summary HES data is available at www. abs.gov.au 30 Flanagan, J, and Flanagan, K, 2011 The price of poverty: cost of living pressures and low income Tasmanians, Hobart:Anglicare Tasmania.31 Fudge, M, 2011 Local voices: enquiry into community assets in Circular Head, Tasmania. Hobart: Relationships AustraliaTasmania.32 Dare, M, Kimber, J and Schirmer, J, 2011 Tasmanian Drought Evaluation Project , Hobart: University of Tasmania and JSConsulting.33 Community Inclusion Workers, 2011 Community Consultation Report, Cost of Living Companion Report 2 Appendices
8/3/2019 Cost of Living Strategy
http://slidepdf.com/reader/full/cost-of-living-strategy 18/88
18
important to note that A Cost of Living Strategy for Tasmania does not necessarily reflectindividual views of members.
The Social Inclusion Unit, Department of Premier and Cabinet supported me in theStrategy preparation, including research to inform the evidence base about the distributionof cost of living pressures experienced by various income groups, population groups andhousehold types as well as places at risk of social exclusion in Tasmania. This research iscontained in the Strategy and its Companion Reports and associated commissionedresearch attachments, including the Relative Price Index for Hobart 34, Cost of Living Indicatorsfor Tasmania35 and Tasmanian Population Estimates36. The Social Inclusion Unit also secondedan officer from the ABS to prepare information papers on key cost drivers in Tasmania 37 with assistance from the Cost of Living Interagency Working Groups.
34 Dufty, G, and MacMillan, I, 2011 The Relative Price Index, Hobart 2011: the CPI and the implications of changing cost pressures on various household types and income groups. 35 National Centre for Social and Economic Modelling, 2011 Cost of living indicators for Tasmania36 National Centre for Social and Economic Modelling, 2011 Population distribution in Tasmania37 These information papers form part of Companion Report 1 to the Cost of Living Strategy in Tasmania, and include
Incomes in Tasmania, The Cost of Utilities in Tasmania, The Cost of Housing in Tasmania, The Cost of Transport inTasmania, The Cost of Education in Tasmania, The Cost of Health & Leisure in Tasmania, and The Cumulative Impact of Cost of Living in Tasmania.
8/3/2019 Cost of Living Strategy
http://slidepdf.com/reader/full/cost-of-living-strategy 19/88
19
IntroductionThis Strategy provides evidence for Tasmania on the distribution of cost of living pressures.It examines which households are most affected, which communities are most affected andwhat can be done to ease those pressures.
The focus is on the disproportionate and cumulative impacts experienced by individuals and
households for the following cost items:
Utilities – electricity, water and sewerage;
Housing – rent, mortgage costs and rates;
Transport – public transport and private vehicle costs;
Health – food, alcohol and tobacco, recreation, medical, pharmaceutical and dentalservices; and
Education – private and public schooling.
Tasmanians are generally more vulnerable to cost of living pressures because of therelatively low income base as compared with other Australians38. Those on low incomes – particularly pensioners, the unemployed, workers who receive government benefits andallowances, single parents and lone person households – are hardest hit by the rising costsfor essential goods and services. Appendix 2 contains maps of the spatial distribution of incomes in Tasmania.
There are also a range of specific population groups who are at relatively higher risk fromcost of living pressures, including people with disabilities and their carers, seniors on the fullpension and renting, Aboriginals, and refugees.39
38 See Cost of Living Issues for Tasmania on page 30 and detailed discussion in Cost of Living in Tasmania Companion Report 1 – The Data and associated Analysis of ABS data Appendix.39 These groups are referenced in Cost of Living in Tasmania - Companion Report 2 and throughout the Strategy.
What is ‘at risk’?
In the Strategy, people are considered to be ‘at risk’ if, because of rising living
costs, they are vulnerable to or actually experiencing:
electricity disconnection,
housing eviction and homelessness,
food insecurity,
ill health due to an inability to afford health services,
debt and financial pressures, and
presentation to emergency relief services.
Households ‘at risk’ may be households:
without financial and non-financial resources and support,
experiencing intergenerational disadvantage,
in transition, for example employment to unemployment, and
experiencing multiple disadvantages, for example low income with
physical or mental health issues and no family supports.
8/3/2019 Cost of Living Strategy
http://slidepdf.com/reader/full/cost-of-living-strategy 20/88
20
The first section of the Strategy defines cost of living, the policy framework developed for the Strategy and summarises Companion Report 1 Cost of Living in Tasmania: the Data. Itdetails the major expenditure pressures facing Tasmanian households outlining who is mostimpacted and where they are in the state. The second part of the Strategy draws on theevidence presented in Companion Report 2 Cost of Living in Tasmania: Impacts and Responses to outline responses to cost of living that can be undertaken by communities, individuals,markets and governments.
WHAT IS COST OF LIVING?
Over the past 100 years, the key elements of cost of living and the pressure on individualsand households has remained relatively unchanged. However, who takes responsibility for the risks faced by individuals, families and communities in managing cost of living pressureshas changed.
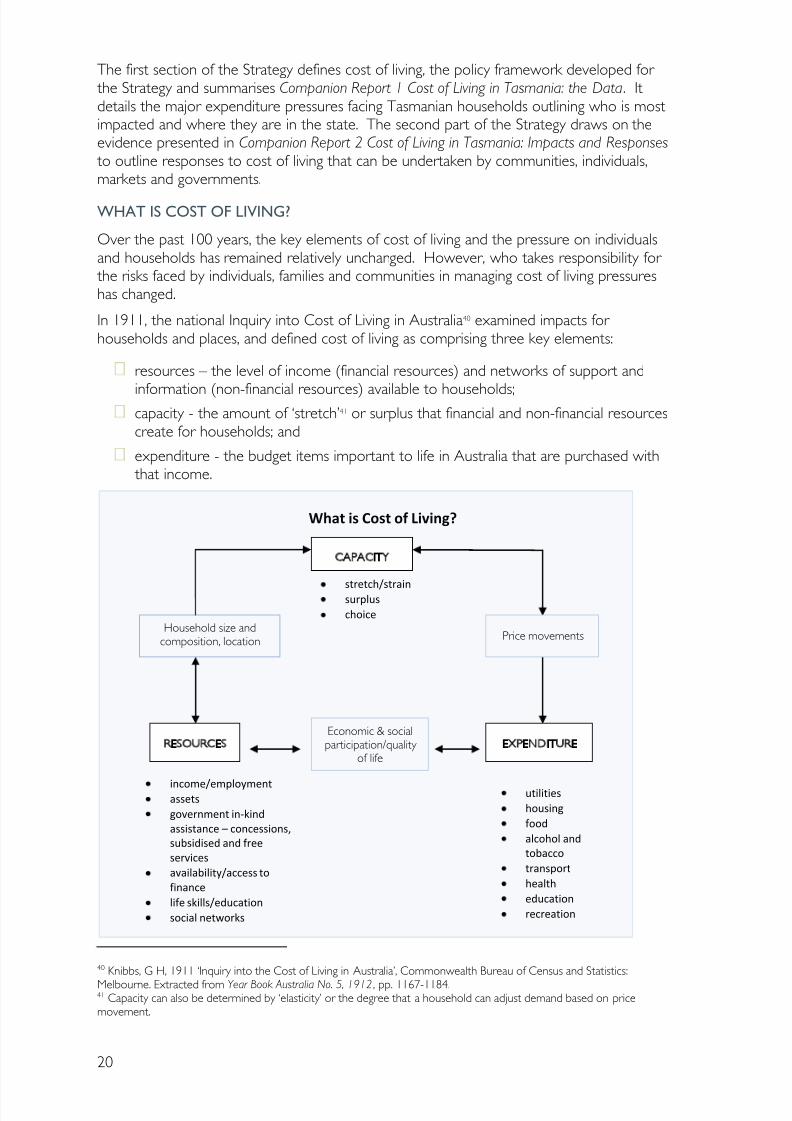
In 1911, the national Inquiry into Cost of Living in Australia40 examined impacts for households and places, and defined cost of living as comprising three key elements:
resources – the level of income (financial resources) and networks of support and
information (non-financial resources) available to households;capacity - the amount of ‘stretch’41 or surplus that financial and non-financial resourcescreate for households; and
expenditure - the budget items important to life in Australia that are purchased with that income.
40 Knibbs, G H, 1911 ‘Inquiry into the Cost of Living in Australia’, Commonwealth Bureau of Census and Statistics:
Melbourne. Extracted from Year Book Australia No. 5, 1912, pp. 1167-1184.41 Capacity can also be determined by ‘elasticity’ or the degree that a household can adjust demand based on pricemovement.
What is Cost of Living?
Household size andcomposition, location
income/employmentassets
government in-kind
assistance – concessions,
subsidised and free
services
availability/access to
finance
life skills/education
social networks
RESOURCES
stretch/strainsurplus
choice
CAPACITY
utilities
housing
food
alcohol and
tobacco
transport
health
education
recreation
EXPENDITUREEconomic & socialparticipation/quality
of life
Price movements
8/3/2019 Cost of Living Strategy
http://slidepdf.com/reader/full/cost-of-living-strategy 21/88
21
The 1911 Inquiry also noted that the level of income combined with the size of thehousehold significantly impacted on the capacity of households to purchase goods andservices across the budget items identified as important for achieving a decent quality of life.Where this capacity was under strain, households were constrained in their expenditurechoices and this resulted in ‘frugality’. That is, households purchased less discretionary itemsand used rationing and substitution when buying essentials – for example, buying lower quality food (substitution) in smaller quantities (rationing). By contrast, where there was
surplus capacity, households made ‘luxury’ expenditure choices unconstrained by need.These households bought discretionary and non-discretionary items of higher quality and inlarger quantities.
In Tasmania in 2011, these elements remain fundamental to how cost of living is defined:
Cost of living continues to play out in households and places, with some householdsand places being more impacted than others.
Cost of living continues to comprise three key elements – income, capacity (stretchor elasticity of a household budget to manage cost pressures), and expenditure (thebudget items purchased).
Cost of living pressures continue to result in people having constrained expenditurechoices – rationing, substitution and going without.
One hundred years later, the items of expenditure identified as important in 1911 aresimilar items now – food, housing, fuel and light, clothing, transport, rates and taxes,insurance, education, medical, alcohol and tobacco, and sport and amusements. Thevulnerability to cost of living pressures for families with young children continues to be anissue.
The order of importance for these cost items, however, has altered over time in line withdifferential price movements and changes in pricing policy. For example, the cost of
utilities in 2011 has become a far more significant issue for consumers. This has occurredas pricing policy has changed from building significant cross-subsidies into the charges(especially for rural areas) to a policy of privatisation and commercialisation which has led to prices increasing at a faster pace and higher rate than overall inflation42.
WHO HAS RESPONSIBILITY FOR COST OF LIVING?
At the time of the 1911 Inquiry Australia was a society in transition. Between 1904 and1907, the Commonwealth Government legislated to establish the minimum wage – thusbeginning the transfer of some responsibility for building cost of living capacity from theindividual and charitable institutions/community sector to the government and the market.
At the turn of the century there was no social security system in Australia. Risks were‘managed’ by the community sector. Charitable relief was provided by churches,voluntary organisations, in some cases with the assistance of government grants. Thepeople receiving charitable assistance were the 'sick poor', neglected children, old peoplewho were destitute and women who had been deserted or who had 'fallen' pregnant.The unemployed were assisted by grants of wages, or rations, in return for relief work provided by the government.43
42 Refer Cost of Living in Tasmania Companion Report 1 – The Data ‘Disproportionate impact of price’ where this isdiscussed in more detail.43 Australian Bureau of Statistics, ‘History of pensions and other benefits’ in Year Book Australia 1988, Cat 1301.0.
8/3/2019 Cost of Living Strategy
http://slidepdf.com/reader/full/cost-of-living-strategy 22/88
22
Between 1908 and 1910, the Commonwealth Government introduced means-tested'flat-rate' age and invalid pensions44 in recognition of the need for an alternative incomesource for people not able to work for a living. Subsequently, after concerns that thebasic wage45 was not enough for a married man with a large family, the Commonwealthintroduced a lump sum cash grant payable to a mother on the birth of a child in 1912,and a national system of child endowment46 in1940. The major extension of the socialsecurity system came in 1945 with the introduction of Commonwealth unemployment
and sickness benefits.47 After the Great Depression and Second World War, the term‘social security’ was coined to represent full employment with a safety net to guaranteeminimum social standards for all.
These income support payments further socialised the risks associated with cost of living – such as poverty, unemployment or sickness – and assisted households to participate in thesocial and economic life of their community. More responsibility for cost of livingcapability was transferred to government in a shared arrangement with individuals (or families) as well as charitable enterprises. Rather than being borne solely by individuals, the cost of living risks were effectively amortised across society 48.
In the 1960s and 1970s, social policy was reshaped around ‘social justice’ as a response to
the proceeds of the post-war economic boom. Governments assumed greater responsibility for building cost of living capability through increased provision of the socialwage (such as subsidised or free health, education, child care and transport services, aswell as a range of concessions). The provision of the social wage helped increase thecapacity of household incomes to purchase a decent quality of life.
Through the 1980s and 1990s the responsibility for cost of living began to shift again. Ina constrained economic environment, the Accord49 ushered in a new era of wagerestraint and economic management intended to transfer more of the risk back toindividuals and markets. Policy effort galvanised around enterprise bargaining, individualworkplace agreements, mutual obligation and welfare to work along with notions of
44 These pensions superseded State age pension schemes which had been introduced in New South Wales (1900),Victoria (1900) and Queensland (1908) and an invalid pension scheme introduced in New South Wales (1908).45 The Conciliation and Arbitration Court was established by the Federal Government in 1904 to resolve disagreementsbetween employers and employees. A particular feature of industrial arbitration in Australia is the fixing of a ‘basic or minimum wage’ for industries that are subject to awards of the Commonwealth or State Arbitration Courts. The 1907The Harvester judgement legitimated this notion in Australian public policy. Australian social democracy was realised by the wage arbitration system modifying market outcomes to ensure that workers and their families had sufficient resources to manage their own ‘risks’.46 Australian Bureau of Statistics, ‘History of Pensions and other Benefits in Australia’ Year Book Australia 1988, Cat. No.1301.0. The Child Endowment was a weekly payment for each child in the family under the age of sixteen. In effect the
basic wage became the minimum wage for the unskilled worker, his wife, and one child, with the incomes for all marriedworkers with more than one child being raised.47These were introduced in the form of flat-rate payments financed from general revenue and subject to an income test.The Full Employment (White Paper 1945) linked important initiatives in social security, education, post-war settlement andplans for regional development.48 Rosanvallon, P, 1981 (transl. in 2000) La crise de l'etat-providence (The new social question: rethinking the welfare state),Princeton University Press.49The Accord sought wage restraint through the indexation of wage rises linked to the Consumer Price Index. It sought torestore full employment with lowered inflation to create the fiscal capacity for more generous expenditure on health,education, social security, environment, housing and regional development. However it failed to re-establish fullemployment or deliver on its promise of an improved social wage, with the only significant social wage investment of this time being Medicare.Note: The CPI provides a general measure of price inflation and is used by the Reserve Bank of Australia as the officialmeasure of inflation for evaluating monetary policy. Although the CPI is often referred to as an indicator of cost of living, the Australian Bureau of Statistics (ABS) does not prefer this interpretation. The purchasing power or a cost -of-living
index, in an economic context, is not strictly interchangeable with a measure of price inflation. Their measurement wouldrequire separate, purpose built indexes analysing expenditure patterns of specific households within the region they werelocated.
8/3/2019 Cost of Living Strategy
http://slidepdf.com/reader/full/cost-of-living-strategy 23/88
23
‘conditional’ welfare. 50 Economic reforms designed to improve productivity included agreater emphasis on the user pays principle, with cost shifts from the public purse to theprivate pocket and market competition to drive down costs.
Throughout the last 100 years, Australian governments have accepted varying degreesof responsibility for cost of living. This can be seen with the provision of utilities andpricing oversight, wage setting up until the 1990s, the provision of public housing,education, transport and hospitals all designed to be accessible and affordable. This hasshifted dramatically over the past 20 years. Privatisation, the transfer of activities likewage setting to the Commonwealth, and the commercialisation and corporatisation of government services (including moves to full cost recovery for utilities) have rendered the states much less willing and able to help manage cost of living pressures than ever before.
Through the first decade of the 21st century, outsourcing social support to not-for-profit organisations and the volunteering sector has led to a further sharing of thisresponsibility with the community. The current focus on the transfer of welfareadministration through formal contractual arrangements with the community sector ispart of shifting responsibility for cost of living risk back to charitable and community
sector organisations, but this time with a more developed government safety net thanexisted in the 1900s.
Recent constrained economic environments have put new pressure on the capacity of the safety net with budget cuts to essential services. This environment has alsoincreased uncertainty for households with unexpected job losses as a result of persistenteconomic restructuring. In recent years the social investment and household stimulusresponse to the Global Financial Crisis is an example of the government placing a strongemphasis on the economic aspects of social inclusion and a recognition that positivesocial regulation and coordination of markets is necessary.51
Australian social policy values were built on the importance of work and wages as the basis
for welfare and the assumption that governments could intervene to ensure everyone whowanted a job could get one at a reasonable wage. By keeping tariffs high more productscould be manufactured here, and through centralised wage fixing and arbitration, wageswould stay high. The welfare state and social provisioning could therefore be kept at low levels compared particularly to Europe. Over the last 20 years, these views have been jettisoned and social policy institutions have undergone drastic change. Tariffs have all butdisappeared and centralised wage fixing is a thing of the past. Higher levels of unemployment than were previously deemed acceptable have become the norm. Pensionsand benefits have become more targeted and in many cases contingent on a willingness of the recipient to engage in education, training and – in the case of the unemployed, thedisabled and single parents – be active job seekers in order to continue to receivepayments.
Welfare institutions have been turned upside down, rebranded and redefined in an unevenand often quite volatile way. The picture is by no means all bleak, for along with cutbacks
50 1994 Working Nation saw the subordination of welfare policies to economic policies. It focussed on moving the long term unemployed to work for increased economic competitiveness, growth and standard of living. The 2000 McClure
report focus was on a system requiring participation for support and promoting individual ‘rights’ and responsibilities. 51 Smyth, P. 2010 In or out?:building an inclusive nation. The Australian Collaboration in collaboration with the Brotherhoodof St Laurence. Accessed at http://www.bsl.org.au/pdfs/Smyth_In_or_out_building_an_inclusive_nation.pdf
8/3/2019 Cost of Living Strategy
http://slidepdf.com/reader/full/cost-of-living-strategy 24/88
24
have come important innovations. Most recently is the potential move into a new phase of social protection with the development of the National Disability Insurance Scheme52.
Over the last 100 years, the balance of responsibility between community, individuals,market and government has changed in response to changing economic, social and politicalcircumstances. In the current market economy, it is important that individuals andhouseholds adopt sustainable consumption and lifestyle patterns in response to cost of living pressures. Equally important is a continued focus by governments on providing astrong system of essential public goods and services that are accessible and affordable,protecting consumer rights and assisting those individuals and households most at risk of financial hardship.
WHY A COST OF LIVING STRATEGY IS IMPORTANT
As already noted, increases in the costs of essential goods and services have occurred at apace and rate of change that has become a consistent and growing concern for Tasmaniancommunities. This needs to be understood in the context of what Australians consider tobe an adequate standard of living53. Deprivation occurs when a lack of resources preventspeople from accessing the goods and services that are generally accepted by society asessential54. Recent research on poverty in modern Australia has found that the majority of Australians consider the following items to be essential for a decent life – ie that no-one inAustralia should have to go without:
Warm clothes and bedding, if it’s cold; a substantial meal at least once a day;computer skills; a decent and secure home; a roof and gutters that do not leak; securelocks on doors and windows; heating in at least one room of the house; furniture inreasonable condition; a washing machine; a television; up to $500 in savings for anemergency; home contents insurance; comprehensive motor vehicle insurance;regular social contact with other people; a telephone; presents for family or friendseach year; a week’s holiday away from home each year; medical treatment if needed;able to buy prescribed medicines; dental treatment if needed; children can participatein school activities and outings; an annual dental check-up for children; a hobby or leisure activity for children; new schoolbooks and school clothes; a separate bed for each child; and a separate bedroom for children aged 10 and over.55
However, multiple cumulative price rises are occurring simultaneously alongside decreasingresources for many individuals, households and places putting at risk a ‘decent life’ for many .These pressures are extending to more Tasmanians, not just the traditional ‘disadvantaged’
52 Department of Families, Housing, Community Services and Indigenous Affairs, 2011. Productivity Commission’s Inquiry intoa national disability long-term care and support scheme, National Disability Insurance Scheme Fact Sheet accessed at<http://www.fahcsia.gov.au/sa/disability/progserv/govtint/Documents/ndis_factsheet.pdf>53 The debate about adequate living standards generally occurs with reference to concepts such as ‘absolute poverty’ and‘relative poverty’ . Absolute poverty refers to a minimum standard below which no one anywhere in the world should ever fall and which is the same in all countries and does not change over time. Relative poverty refers to a standard which isdefined in terms of the society in which an individual lives and which therefore differs between countries and over time – minimum standards can rise and fall if and as a country becomes richer.http://www.poverty.org.uk/summary/social%20exclusion.shtml 54 Saunders, P., Naidoo, Y. and Griffiths, M. 2007. Towards New Indicators of Disadvantage: Deprivation and Social Exclusion in Australia. Social Policy Research Centre: Sydney, page viii.55 Saunders, P. & Wong, M. 2009, Still Doing It Tough: An Update on Deprivation and Social Exclusion among Welfare ServiceClients, p.10.
Further research undertaken in 2010 confirmed these items remain important to people’s understanding of what areessential. See Saunders, P. and Wong, M. 2011 Social Impact of the Global Financial Crisis , Newsletter No. 108, Social Policy Research Centre: Sydney, page 6.
8/3/2019 Cost of Living Strategy
http://slidepdf.com/reader/full/cost-of-living-strategy 25/88
25
populations and places56. As well as this, for an increasing number of Tasmanians there arefewer avenues to turn to for support, such as less savings on which to draw 57.
A Social Inclusion Strategy for Tasmania58 recognises that for Tasmania to have a fairer future,all Tasmanians should have the opportunity to access the resources and relations that makelife healthy, happy and productive. This includes having the capacity to meet the essentialcosts of living necessary for a decent life, such as having enough to eat, having adequatehousing, and being able to pay to heat the home.
GOAL
The overall goal of the Strategy is that all Tasmanians have access to the resources andrelationships which enable them to manage cost of living pressures and participate in civic,social and economic life.
PRINCIPLES FOR ACTION ON COST OF LIVING
Any response to cost of living must recognise that a person’s capacity to respond to cost of living pressures is a combination of their individual characteristics and the social context
which enables them to lead the kind of life they value59. Too often the focus is on what aperson can or cannot do without recognising that the social context in which they operateand factors outside their control can significantly constrain the consumption choices they make. For example, concentrating only on the skills a person has to manage their household budget may overlook the fact that their income may be too low to stretch far enough, or their educational opportunities have left them with marginal employmentchoices and low earnings. A person may be exercising excellent budgeting skills but still bestruggling to purchase essential goods and services. People can also have variedcommitments that affect their budget such as caring for others, for example, children or elderly parents.
The principles which underpin the Strategy focus on people and places, and are consistentwith those of A Social Inclusion Strategy for Tasmania60. The principles view individuals,
56 Gallet, W. 2010. Perceptions of Poverty: an Insight into the Nature and Impact of Poverty in Australia. Salvation Army.Access Economics, 2008. The Impact of the Global Financial Crisis on Social Services in Australia,57 Kelly, S & Gong, H. 2010 Saving Tomorrow – The savings and spending patterns of Australians. AMP.NATSEM Income andWealth Report, Issue 25, page 6. Between 1990 and 2005 there was a decline in the proportion of disposable income that Australian households saved, and by June 2005 the ratio of savings to income had fallen to -1.4%”. Compared toother States and Territories, Tasmania has the lowest median savings, reflecting its lower average incomes, labour forceparticipation rate, and higher number of couples and individuals over 65 years of age.58 Adams, D. 2009, A Social Inclusion Strategy for Tasmania. Department of Premier and Cabinet: Hobart.59
Sen, A. 2010 The Idea of Justice. Belknap Press of Harvard University Press:: Cambridge, Massachusetts.See alsoNussbaum, M. 2011 Creating Capabilities: The Human Development ApproachMitchell, A. & Shillington, R. 2002, Poverty, Inequality and Social Inclusion, Laidlaw Foundation: Toronto, p. 4Landvogt, K. 2008, Money, dignity and Inclusion: The role of financial capability . Good Shepherd Youth and Family Service:Collingwood, pp. 18-19, 20, 29-30, 77-78.Sen, A. 1999 Commodities and Capabilities. Oxford University Press: New Delhi.60 Adams, D. 2009 A Social Inclusion Strategy for Tasmania, pages 18, 19 & 23The Social Inclusion Strategy proposed 5 organising principles:
Community driven solutions – social inclusion is everyone’s responsibility (partnerships and individual responsibility)Enterprise not welfare – a hand up not a hand out (focus on assets, risk and protective factors, a strengths basedapproach)Family centred communities – think family (families in their many forms are an appropriate focus for building resilience to life’s many challenges) Address the basics as well as tackling structural causes (action across the spectrum is required if long term change is
to be achieved)Prevention and early intervention – start early (put more effort into preparing and supporting individuals, families andcommunities to avoid or manage the potholes of life)
8/3/2019 Cost of Living Strategy
http://slidepdf.com/reader/full/cost-of-living-strategy 26/88
26
families and communities through the lens of potential strengths rather than deficits, andrecognise that the combination of personal characteristics with the political, social andeconomic environment creates the opportunities for civic, social and economicparticipation.
There are eight principles to guide action on cost of living:
1. The Precautionary Principle Policy decisions which increase prices or reduce subsidies should be progressivenot regressive.
2. The Subsidiarity Principle
Planning and decision making about cost of living should be made as close aspossible to the people and places most affected.
3. The Immediacy Principle
Those most at risk of crisis should be assisted first.
4. The Consultation Principle
Before making decisions that increase the cost of living burden, governmentsshould talk directly with those people and places most likely to be affected.
5. The Personal Responsibility Principle
Many individuals and families will need support to take greater responsibility for cost of living risks and to manage reduced expectations.
6. The Partnerships Principle
Cost of living risks can only be managed through partnerships betweengovernments and with the community sector and businesses.
7. The Evidence Principle
Strategies and actions should have a clear evidence base as to how and when
and for whom the costs of living will be reduced.
8. The Prevention Principle
Investment in prevention is better that investment in crisis responses.
Because cost living pressures vary in impact between population groups and places, policy responses must also be sensitive to these differing circumstances. Currently governmentpolicy settings are not sophisticated enough to account for and respond to this. There areconcessions and other responses, but these are not always appropriately targeted or nuanced, resulting in an unknown number of winners and losers.
This Strategy provides the framework to guide the development and implementation of
these policy settings. It sets out the above overarching goal and set of principles tounderpin a range of short, medium and long-term actions to address cost of living inTasmania.
8/3/2019 Cost of Living Strategy
http://slidepdf.com/reader/full/cost-of-living-strategy 27/88
27
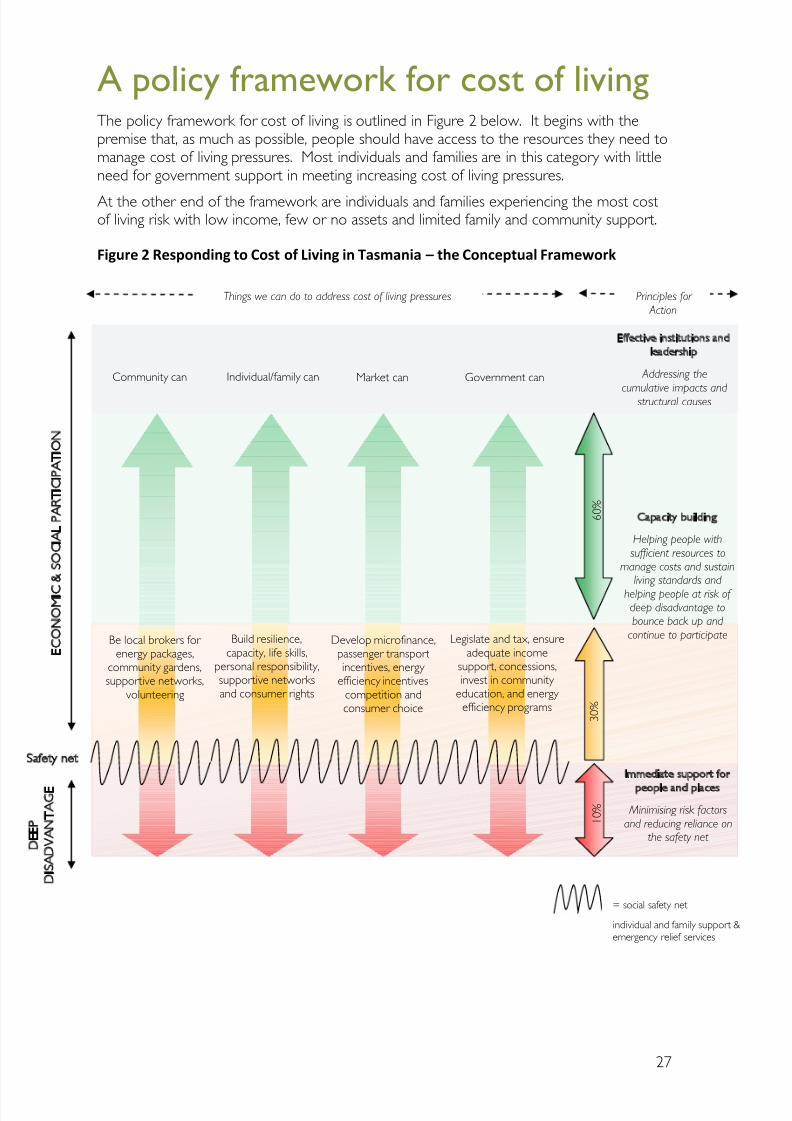
A policy framework for cost of livingThe policy framework for cost of living is outlined in Figure 2 below. It begins with thepremise that, as much as possible, people should have access to the resources they need tomanage cost of living pressures. Most individuals and families are in this category with littleneed for government support in meeting increasing cost of living pressures.
At the other end of the framework are individuals and families experiencing the most costof living risk with low income, few or no assets and limited family and community support.
Figure 2 Responding to Cost of Living in Tasmania – the Conceptual Framework
Government canIndividual/family canCommunity can Market can
ECONOMIC&SOCAPACPAON
DDSADANA
Safety net
Be local brokers for energy packages,
community gardens,supportive networks,
volunteering
Build resilience,capacity, life skills,
personal responsibility,supportive networksand consumer rights
Effective institutions andleadership
Addressing the
cumulative impacts andstructural causes
Capacity building
Helping people withsufficient resources to
manage costs and sustainliving standards and
helping people at risk of deep disadvantage tobounce back up and
continue to participate
Immediate support for
people and places
Minimising risk factorsand reducing reliance on
the safety net
6 0 %
Things we can do to address cost of living pressures Principles for Action
= social safety net
individual and family support &emergency relief services
Develop microfinance,passenger transportincentives, energy
efficiency incentivescompetition andconsumer choice
3 0 %
Legislate and tax, ensureadequate income
support, concessions,invest in community
education, and energy efficiency programs
1 0 %
8/3/2019 Cost of Living Strategy
http://slidepdf.com/reader/full/cost-of-living-strategy 28/88
28
To help prevent individuals and families from deep disadvantage, governments have over time established various services often described as a ‘safety net’. The core to theAustralian safety net is the income support system (an Australian Governmentresponsibility) supported by a raft of other service systems from all levels of government.At state government level the concessions system and public housing are two of the key safety net mechanisms. Traditionally the safety net has been seen as a support for morevulnerable individuals and families.
In addition to the specific mechanisms of the safety net there are many other moreuniversal services (such as public education, public transport and health) designed tosupport individuals and families and promote civic, social and economic participation. Asnoted in this Strategy, the reason that the cost of living is becoming a major public policy issue is partly due to the expansion of risk to individuals and families who are not in the traditional ‘welfare’ categories; the corresponding capacity of the safety net to respond togreater demand; and questions of adequacy of the safety net in the first place.
Civic, social and economic participation depends on the level of resources (including cashand non-cash) available to help people manage costs and sustain a decent quality of life61.
Households in the ‘red’ are the most disadvantaged in terms of resources andcapacity and find it difficult to make ends meet without assistance from the socialsafety net. They face the greatest risk of reliance on emergency relief, electricity disconnection, food insecurity, insecure housing, financial insolvency and socialisolation. Arguably, as they are in the ‘red’ the safety net may have failed thesehouseholds.
The limited capacity of ‘amber’ households constrains their purchase of the goods andservices that contribute to a decent quality of life (especially the essential non-discretionary items). They have some resilience to manage their cost of livingpressures, but they are also at risk of limited social and economic participation which
can move them into deep disadvantage.
Households in the ‘green’ part of the diagram have some level of surplus capacity andfreedom of choice in their expenditure options, enabling them to fully participate incivic, social and economic life. The intention of the ‘wage earners welfare state’ was to keep households in the ‘green’ by enabling workers and their families to havesufficient resources of their own to manage their cost of living risks/pressures62.
While most people are affected by cost of living changes, it is appropriate that policy attention focuses on the most vulnerable – particularly for those individuals and householdshighlighted in Figure 2 as being either in the red, or at risk of being in the red, regarding their capacity to manage cost of living pressures and sustain a decent quality of life.
The impact of economic transitions and rising cost of living will continue to be significantissues for Tasmania in the next few years. While the framework recognises thatcommunities, individuals, markets and governments can all help to either mitigate or exacerbate cost of living pressures, its focus is particularly on the policy settingsgovernments can use to manage these issues.
61 Saunders, P. and Wong, M. 2009 Still Doing It Tough: An Update on Deprivation and Social Exclusion among WelfareService Clients.Saunders, P. and Wong, M. 2011 Social Impact of the Global Financial Crisis, Newsletter No. 108, Social Policy ResearchCentre: Sydney.62 Frank Castles (1985) in Wilson, Thompson and McMahon The Australian Welfare State. The Australian tradition is tomanage risk through a commitment to full employment and wage regulation supplemented by a social safety net for thosefalling outside the workforce. This has been termed the ‘wage earners welfare state’.
8/3/2019 Cost of Living Strategy
http://slidepdf.com/reader/full/cost-of-living-strategy 29/88
29
Through these new policy settings governments can:
Ease cost pressures on individuals, households and communities;
Build capacity for resilience, choice and civic, social and economic participation; and
Show leadership in boosting local economies, reinvest in local communities anddevelop strong social infrastructure that better equips Tasmanians to deal with cost of living pressures.
The key to this framework is to recognise that responses to cost of living pressures involvepartnerships between communities, businesses and governments. Effort is needed inprevention, in immediate relief and in new forms of planning and service delivery. Thateffort is needed simultaneously.
8/3/2019 Cost of Living Strategy
http://slidepdf.com/reader/full/cost-of-living-strategy 30/88
30
Cost of living issues for TasmaniaThe following discussion summarises the analysis of cost of living pressures for householdsin Tasmania as contained in Companion Report 1 Cost of Living in Tasmania – the Data. Itoutlines the methodology and results of expenditure, price and population analysis. Startingwith a summary of expenditure trends from the most recent ABS Housing Expenditure
Survey, it goes on to investigate cost of living issues in Tasmania by examining:The CPI and its reference and use as a cost of living measure;
Household cost and differences between Tasmania and Australia;
The financial resources available to Tasmanians; and
How this plays out across Tasmania.
A summary of the most recent data63 indicates the following trends:
27.1% of households were ‘low -income’ households in 2009-10 (which meant they fell into the second and third deciles for mean equivalised disposable household
income64). This was up from 25.7% in 2007-08. Nationally, 21.2% of householdswere low-income households in 2009-10, up from 19.7% in 2007-08.
For low-income households in Tasmania, the level of expenditure on essentials as aproportion of income rose considerably between 2002 and 2009, peaking in 2007 65.
In 2009-10, Tasmanians had lower incomes (on average) than other states/territories($708 per week compared with $848 nationally)66, and a higher proportion of households in receipt of government pensions and allowances (33% compared with25.2% nationally). Income for low-income households rose from $359 in 2007-08 to$39567.
In 2009-10, Tasmanians also had lower average weekly expenditure than other states/territories ($1 064 per week compared with $1 236 nationally)68. Other government transfer recipient households69, senior households, lone personhouseholds and public housing tenants spent even less ($486, $560, $537 and $524
63 Updated to the ABS 2009-10 summary Household Expenditure Survey results released on 7 September 2011.64 Mean equivalised disposable household income is a measure of after-tax household income that has been adjusted for household size and composition. It is based on the assumption that while income is usually received by individuals, it isnormally shared between members of a household. Even when there is no transfer of income between members of ahousehold, or provision of free or cheap accommodation, members are still likely to benefit from the economies of scale that arise from the sharing of dwellings. This indicator also takes into account that larger households normally require a
greater level of income to maintain the same material standard of living as smaller households, and the needs of adults arenormally greater than the needs of children. 1301.0 - Year Book Australia, 2009 – 10 accessed 23 September ,http://www.abs.gov.au/ausstats/[email protected]/0/4EABC33B47FEE100CA25773700169C75?opendocument> 65 The decline seen from 2007 appears to be due to a methodology change and a specific initiative in the sampledmunicipality. Refer Tasmania Together Indicator 1.1.1: The cost of food, electricity, housing, transport and health as aproportion of income for low income households - see www.ttbenchmarks.com.au 66 All household’s mean equivalised disposable income. Australian Bureau of Statistics 2011, Household Income and IncomeDistribution, Australia, 2009-10, cat no 6523.0, Table 17.67 Australian Bureau of Statistics 2011, Household Income and Income Distribution, Australia, 2009-10, cat no 6523.0, Table17. Data is also presented in Tasmania Together Indicator 1.1.2: Proportion of households where primary source of income is government pensions or allowances.68 Australian Bureau of Statistics 2011, Household Expenditure Survey, Australia: Summary of Results, 2009-10, cat no6530.0, Australian data table download, table 27.69 ‘Other government transfer’ recipient households are those households whose principal source of income is agovernment pension or benefit other than the age and disability pensions (including veterans affairs pensions),
unemployment and family support payments. This includes Overseas pensions and benefits, Wife Pension, Widow Allowance, War Widows Pension, Special Benefit, Sickness Allowance, Seniors Supplement, Partner Allowance and Other allowances.
8/3/2019 Cost of Living Strategy
http://slidepdf.com/reader/full/cost-of-living-strategy 31/88
31
per week respectively)70. Nearly two thirds (61.9%) of the weekly expenditure wenton essential items71.
Compared to other states/territories, Tasmanian households spent proportionally thehighest across Australia on domestic fuel and power (3.6% compared with 2.6%nationally), food (17.8% compared with 16.5% nationally), transport (16.8% comparedwith 15.6% nationally), and lower than the Australian average on housing (15.5%compared with 18.0% nationally) and medical care and health expenses (4.7%compared with 5.3% nationally)72.
Between 2001-02 and 2007-08, the Tasmanian house price to income ratio rosefrom 1:3.4 to 1:5.4, meaning that by 2007-08 it cost 5.4 times the median annualhousehold income to purchase a house at the median annual sale price73. Thepercentage of private renters in housing stress74 increased between 2002 and 2009,from 21.9% to 33.6%75.
Needing to purchase electricity and food are consistently the key cause of householdfinancial crisis in Tasmania76.
In the most recent ABS General Social Survey (2006) Tasmanian and Australian
households reported similar levels of financial stress77
. However, certain households inTasmania had a disproportionately higher risk of financial stress, with 59.5% of joblesssole parent households, 38.8% of jobless couple households, 38.3% of public housing tenants, and 46.4% of the unemployed, experiencing at least one cash flow problemin the last 12 months78.
Latest data indicates that Tasmania has higher proportional percentages of thepopulation in financial stress than the Australian average79. 19.4% of Tasmanianhouseholds experienced four or more stress indicators in the last 12 months, which
70 Australian Bureau of Statistics 2011, Household Expenditure Survey, Australia: Summary of Results, 2009-10, cat no6523.0, Tasmania data table download, Tables, 21, 17 and 15 respectively.71 Australian Bureau of Statistics 2011, Household Expenditure Survey, Australia: Summary of Results, 2009-10, cat no
6530.0, Australian data table download, table 27. Includes HES items of current housing costs (selected dwelling), domesticfuel and power, food and non-alcoholic beverages, clothing and footwear, medical care and health expenses, and transport.72 Australian Bureau of Statistics 2011, Household Expenditure Survey, Australia: Summary of Results, 2009-10, cat no
6530.0, Australian data table download, table 27. 73 Tasmania Together Indicator 1.1.5: Tasmanian house price to income ratio - see www.ttbenchmarks.com.au74 People in housing stress are those with household incomes between the bottom 10% and bottom 40% of the
distribution of equivalised disposable household income, and living in households where housing costs are more than 30%of the household's gross income. Refer: Australian Bureau of Statistics 2009, Housing Occupancy and Costs, Australia,2007-08, cat no 4130.075 Tasmania Together Indicator 1.1.4: Housing stress experienced by low-income earners in the private rental market - seewww.ttbenchmarks.com.au 76 Madden, Kelly, Anglicare, 2002.Regional Incomes and the Cost of Living for Low Income Households: How does Tasmania Compare?http://www.anglicare-tas.org.au/index.php?option=com_docman&task=cat_view&gid=58&Itemid=12777 Financial stress is determined by three measures aimed at identifying households that may have been constrained in their activities because of shortage of money: the ability to raise 'emergency money’, whether they had cash flow problems andwhether they had taken dissaving actions. In 2006, 12.9% of Tasmanian households reported that they could not raise$2 000 in an emergency compared with 13.1% nationally, 15.6% had experienced cash flow problems compared with17.7% nationally, while 17.5% took a dissaving action compared with 18.7% nationally. Note: Types of dissaving actions caninclude: reduced home loan repayments; drew on accumulated savings or term deposits; increased the balance owing oncredit cards by $1 000 or more; entered into a loan agreement with family or friends; took out a personal loan; soldhousehold goods or jewellery; sold shares, stocks or bonds; sold other assets. Refer Australian Bureau of Statistics 2007,
General Social Survey, Australia, 2006: Glossary, cat no 4159.078 Australian Bureau of Statistics 2007, General Social Survey, Tasmania, 2006, cat no 4159.6.55.00179 When comparing households experiencing four or more stress indicators in the last 12 months.
8/3/2019 Cost of Living Strategy
http://slidepdf.com/reader/full/cost-of-living-strategy 32/88
32
was 3.1% higher than the Australian average. Stress is again greatest in low-incomehouseholds80.
The recently released 2009-10 Household Expenditure Survey (HES) data shows that littlehas changed in average expenditure patterns for Tasmania since the 2003-04 HES.81 Whencomparisons between the two HES surveys are viewed in real terms82 the all householdsgroup (representing the average expenditure) is purchasing 22.1% more across essentials
and 13.2% more across discretionary items.33% of households in Tasmania have government pensions or allowances contributing to their gross income.
Households that receive 20%-49% of their income through income support arepurchasing 2.8% less on essentials, and 7.6% less on discretionary items.
Households receiving 50%-89% of their income through income support arepurchasing 5.7% more on essentials and 14.6% less on discretionary items.
Households receiving 90%-100% of their income through income support arepurchasing 9.3% less on essentials and 21.8% less on discretionary items.
Other standout households with reductions in purchasing when compared to the allhouseholds group are families where the eldest child is 15 to 24 (-7.9% on essentials, +5.2%on discretionary items), and households where the reference person is 15 – 24 years of age(+1.1% on essentials, -3.2% on discretionary items).
CPI AS A COST OF LIVING MEASURE
The CPI provides a general measure of the change in prices of goods and servicespurchased by Australian households and therefore the rate of inflation. The CPI measuresaverage price movements for all households across a range of goods and services, referred
to as the ‘basket’83
. Designed to monitor price movement, the CPI cannot reflect how changes in price impact on various income groups and households due to their differentspending patterns. Importantly, it does not reflect the disproportionate effect of price risesin essentials for low-income consumers. For different households in different stages of thelifecycle, these cost pressures can be considerable.
80 Tasmanians experienced proportionally higher levels of stress than the Australian average at low income quintiles.
Increases and decreased across income quintiles were: lowest quintile +1.5%, second quintile +2.6%, third quintile -2.0%,fourth quintile -4.2%, highest quintile +3.0%, and second and third deciles +5.8% Australian Bureau of Statistics 2011,Household Expenditure Survey, Australia: Summary of Results, 2009-10, cat no 6530.0. 81 Average expenditure on essentials in nominal terms has increased by 1.8% and discretionary spending decreased by 1.7%, reflecting an almost even transfer.82 The contribution of the increasing value of money is removed by deducting the movement of inflation over the twosurvey periods. This allows the observation of changes in the quantities of goods and services that households purchase.There are limitations to this approach. Rationing and substitutions are causes of expenditure change and using the HobartCPI (instead of specific indexes that concord to the HES price groups) for expressing expenditure in real terms only givesa broad indication of the change in quantities that can be purchased. Since release of the Strategy, the data in this sectionhas been amended using a more appropriate methodology, which was: Real terms = Pricet2 x (CPIt1/CPIt2). WhereCPIt1 is the CPI quarter of June 2004, to align to 2003-04 HES dollars and CPIt2 is the CPI quarter of June 2010, to align to the 2009-10 HES dollars.83 The ABS uses the term ‘basket’ to represent the goods and services that households purchase and which are monitoredfor price movement through the CPI quarterly surveys. The basket consists of many items aggregated at the highest level
into price groups, which are Food, Alcohol and tobacco, Clothing and footwear, Housing, Household contents andservices, Health, Transportation, Communication, Recreation, Education, and Financial and insurance services. These itemsare disaggregated into more expansive sub-groups and expenditure classes.
8/3/2019 Cost of Living Strategy
http://slidepdf.com/reader/full/cost-of-living-strategy 33/88
33
The CPI is built to reflect national and capital city price movements, so it:
Is an average of prices across Australian capital cities;
Does not have representation from regional cities and towns;
Has a bias towards the larger capital cities; and
Does not account for expenditure variations by household and location.84
Many Australian and state government income support payments and concessions areincreased in line with the CPI 85. Inflation and cost of living indicators are separate and theformer does not match the impact that price and expenditure have on households for which income support and concession payments aim to assist86.
HOUSEHOLD LIVING COSTS
The analysis helps to explain why some households are affected more by the same priceincrease than others. Household living costs are determined by the amount of goods andservices a household purchases, and the prices it pays for these. Measuring household livingcosts is therefore done by comparing the result of multiplying the amount of a product or
service purchased by its price, and reviewing changes to the result over time. Three maindatasets that contribute to understanding costs are the CPI, the Household ExpenditureSurvey (HES) and indexes that combine these two together, such as the Analytical LivingCost Indexes for Selected Australian Household Types87 (ALCI), or the Relative Price Index(RPI), developed by Dufty and Macmillan88. The RPI is used in this analysis.89
Different households have different expenditure patterns (expenditure) and differentcapacities to absorb price increases. To explain this further, price and expenditure areseparated and discussed below.
Price
Over the past five years, the prices of some items in the CPI basket of goods and serviceshave been flat or falling, while others have been rising. Market factors, such as the highimportation of manufactured goods and Australia’s foreign exchange rate, have meant thatitems such as new cars, furniture, TVs, computers, and clothing have increased in price at alower rate than the CPI. These items are often non-essential and therefore up to thehousehold’s discretion to purchase. Other items, such as essential services, are increasing inprice.90
84 The CPI sets variation in the quantity component of the expenditure equation and applies these as averages for all of
Australia.85 Information from http://www.centrelink.gov.au/internet/internet.nsf/payments/pay_cpi.htm, accessed on 25 February 2011: “Most payments are adjusted in line with the Consumer Price Index (CPI) but other payments are adjusted by changes in legislation. At the same time the maximum rate of payment is changed, the single rate of pension payments isalso checked. If necessary, the single payment rate is increased to make sure it does not fall below 27.7% of the Male TotalAverage Weekly Earnings (MTAWE) figure.“ 86 The ABS prefers that the CPI not be referred to as a cost of living indicator as determining purchasing power or a costof living index, in an economic context, is not strictly interchangeable with the CPI – a measure of price movement.Measuring purchasing power requires separate, purpose built indexes analysing expenditure patterns of specific householdswithin the region they were located.87 ABS, 2011, Analytical Living Cost Indexes for Selected Australian Household Types, Dec 2010 (cat. no. 6463.0)88 Dufty, G & MacMillan, I. 2011. The Relative Price Index, The CPI and the implications of changing cost pressures on varioushousehold groups 89 ibid. Also refer to the complete RPI analysis in Companion Report 1 Cost of Living in Tasmania – The Data. 90 When these discretionary and essential items are combined in the CPI, an average rate of price increase is seen (the
rate of inflation). This average rate masks the price increases for essential services, which is a particular issue when trying tounderstand how prices might be impacting on households that have the least amount of money to spend on discretionary items and challenges in spending on essentials.
8/3/2019 Cost of Living Strategy
http://slidepdf.com/reader/full/cost-of-living-strategy 34/88
34
The extent to which cost of living pressures become a significant issue for people can alsodepend on how quickly prices increase over time. Household budgets can be stretched by price increases that outstrip the rate of increase of household economic resources (incomeand any major assets such as housing value for house owners/purchasers). Price shocks canoccur when the increase is so rapid that there is no time or economic resources for households to adjust budgets.
The pace of change has been phenomenal, giving families little time to readjust their budgets91.
Gavin Dufty
Cumulative pressures are the greatest when there are high price increases occurring at thesame time. For example household bills are rising quickly and arrive at the same time, or emergency events such as cyclone, flood and bushfire occur, pushing prices and expenditurebeyond household budgets.
If I get one unexpected bill we will go under and cannot feed ourselves.
Geeveston community consultation
Expenditure
Households have different expenditure patterns based on the number of members, where they are in the lifecycle92, location and financial resources. Public debate on poverty,deprivation and the cost of living includes subjective judgements about what is and what isnot ‘essential’93. Community expectations have helped define what is acceptable for amodern standard of living.
People can make do with a second hand car or can put off the purchase of anew TV or computer for a year or two, but they can’t stop buying food or paying rent.94
This analysis looks at expenditure on the main groups of prices in the CPI basket (pricegroups), focussing on food and the price groups that governments have an oversight role inor directly deliver – housing, health, transport and education. These five price groups arereferred to as essential services95.
91 Gavin Dufty, Manager of policy and research at the St Vincent de Paul Society cited in Horin A, 28 March 2011.Charities feel pressure as prices soar, Sydney Morning Herald. Accessed at http://www.smh.com.au/national/charities-feel-pressure-as-prices-soar-20110327-1cc13.htm 92 A household in which there are children, for example, will have different expenditure requirements to one with a retiredcouple who has paid off the mortgage and whose children have long since left home.93
Although resource intensive and complex to implement, there are methodologies which can provide an indication of adequacy. One example is the Indicative Budget Standards benchmarks developed in the late 1990s, which covered nineareas of expenditure, two different living standards and 12 different family types, with varying levels of labour forceattachment and differing housing tenures. Another example is the modelling work undertaken by the National Centre for Economic Modelling in regard to the public and private costs of children in Australia. This work developed a ‘basic goodsestimator of food at home, fuel and power, household non-durables for use inside the home, postal and telecommunication charges, and personal care products. For a recent review of the Indicative Budget Standards see Pech, J.2011. Relative living standards and needs of low-paid employees: definition and measurement , Research Report 2/2011. Fair Work Australia: Canberra, pages 33-40. For further information, see Saunders, P., Chalmers, J., McHugh, M., Murray, C.Bittman, M. and Bradbury, B. 1998. Development of Indicative Budget Standards for Australia, Research Paper No. 74.Commonwealth of Australia: Canberra. Accessed athttp://www.fahcsia.gov.au/about/publicationsarticles/research/dss/Policy_Research_Series/Documents/policyresearchpaperno74.pdf For further information on the public and private costs of children, see Percival, R, and Harding, A, 2000 The public andprivate costs of children in Australia 1993-94, Discussion Paper, no. 48, Canberra: NATSEM. 94 Queensland Council of Social Service, 2011 Cost of living report , Issue No 1, May 2011, p. 2.95 Other price groups of alcohol and tobacco, clothing and footwear, household contents and services, communication,recreation, and financial and insurance services are covered in the companion reports.
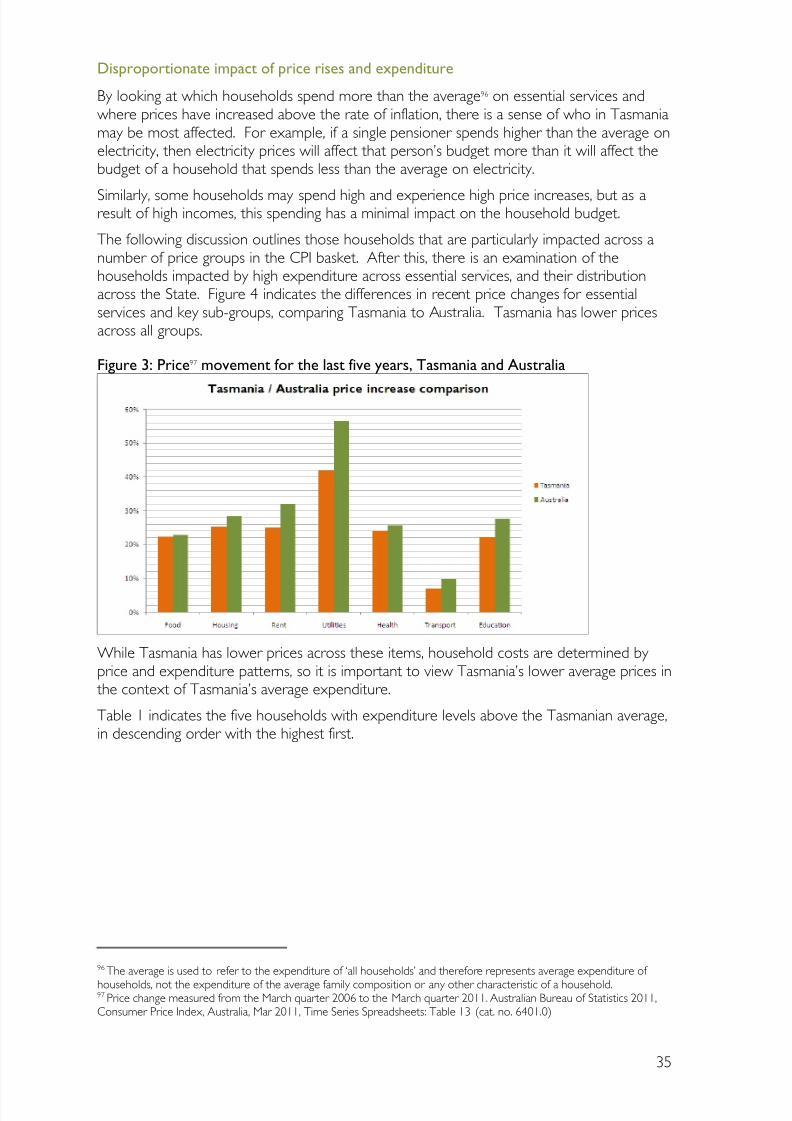
8/3/2019 Cost of Living Strategy
http://slidepdf.com/reader/full/cost-of-living-strategy 35/88
35
Disproportionate impact of price rises and expenditure
By looking at which households spend more than the average96 on essential services andwhere prices have increased above the rate of inflation, there is a sense of who in Tasmaniamay be most affected. For example, if a single pensioner spends higher than the average onelectricity, then electricity prices will affect that person’s budget more than it will affect thebudget of a household that spends less than the average on electricity.
Similarly, some households may spend high and experience high price increases, but as aresult of high incomes, this spending has a minimal impact on the household budget.
The following discussion outlines those households that are particularly impacted across anumber of price groups in the CPI basket. After this, there is an examination of thehouseholds impacted by high expenditure across essential services, and their distributionacross the State. Figure 4 indicates the differences in recent price changes for essentialservices and key sub-groups, comparing Tasmania to Australia. Tasmania has lower pricesacross all groups.
Figure 3: Price97 movement for the last five years, Tasmania and Australia
While Tasmania has lower prices across these items, household costs are determined by price and expenditure patterns, so it is important to view Tasmania’s lower average prices in the context of Tasmania’s average expenditure.
Table 1 indicates the five households with expenditure levels above the Tasmanian average,in descending order with the highest first.
96 The average is used to refer to the expenditure of ‘all households’ and therefor e represents average expenditure of
households, not the expenditure of the average family composition or any other characteristic of a household.97 Price change measured from the March quarter 2006 to the March quarter 2011. Australian Bureau of Statistics 2011,Consumer Price Index, Australia, Mar 2011, Time Series Spreadsheets: Table 13 (cat. no. 6401.0)
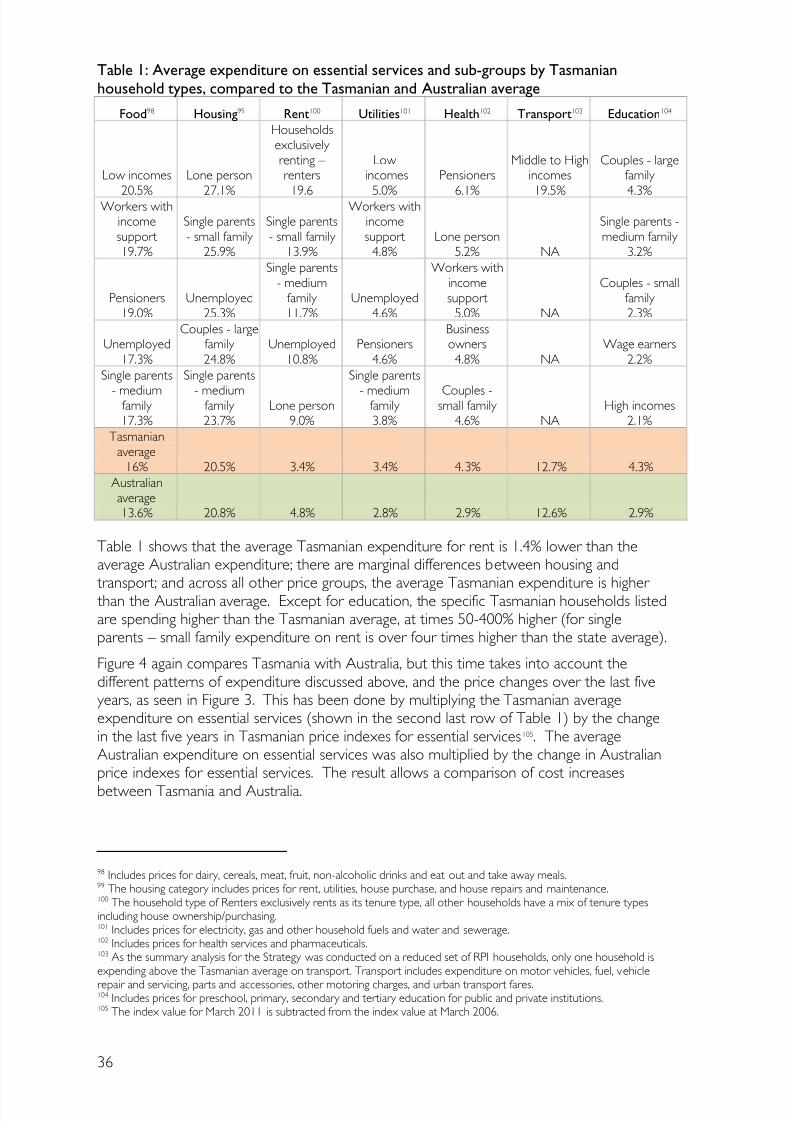
8/3/2019 Cost of Living Strategy
http://slidepdf.com/reader/full/cost-of-living-strategy 36/88
36
Table 1: Average expenditure on essential services and sub-groups by Tasmanianhousehold types, compared to the Tasmanian and Australian average
Food98 Housing99 Rent100 Utilities101 Health102 Transport103 Education104
Low incomes
20.5%
Lone person
27.1%
Householdsexclusively renting – renters
19.6
Low incomes
5.0%
Pensioners
6.1%
Middle to Highincomes
19.5%
Couples - largefamily
4.3%Workers withincomesupport19.7%
Single parents- small family
25.9%
Single parents- small family
13.9%
Workers withincomesupport
4.8%Lone person
5.2% NA
Single parents -medium family
3.2%
Pensioners19.0%
Unemployed25.3%
Single parents- medium
family 11.7%
Unemployed4.6%
Workers withincomesupport
5.0% NA
Couples - smallfamily 2.3%
Unemployed17.3%
Couples - largefamily 24.8%
Unemployed10.8%
Pensioners4.6%
Businessowners4.8% NA
Wage earners2.2%
Single parents
- mediumfamily 17.3%
Single parents
- mediumfamily 23.7%
Lone person9.0%
Single parents
- mediumfamily 3.8%
Couples -small family
4.6% NAHigh incomes
2.1%Tasmanian
average16% 20.5% 3.4% 3.4% 4.3% 12.7% 4.3%
Australianaverage13.6% 20.8% 4.8% 2.8% 2.9% 12.6% 2.9%
Table 1 shows that the average Tasmanian expenditure for rent is 1.4% lower than theaverage Australian expenditure; there are marginal differences between housing and
transport; and across all other price groups, the average Tasmanian expenditure is higher than the Australian average. Except for education, the specific Tasmanian households listedare spending higher than the Tasmanian average, at times 50-400% higher (for singleparents – small family expenditure on rent is over four times higher than the state average).
Figure 4 again compares Tasmania with Australia, but this time takes into account thedifferent patterns of expenditure discussed above, and the price changes over the last fiveyears, as seen in Figure 3. This has been done by multiplying the Tasmanian averageexpenditure on essential services (shown in the second last row of Table 1) by the changein the last five years in Tasmanian price indexes for essential services105. The averageAustralian expenditure on essential services was also multiplied by the change in Australianprice indexes for essential services. The result allows a comparison of cost increases
between Tasmania and Australia.
98 Includes prices for dairy, cereals, meat, fruit, non-alcoholic drinks and eat out and take away meals.99 The housing category includes prices for rent, utilities, house purchase, and house repairs and maintenance.100 The household type of Renters exclusively rents as its tenure type, all other households have a mix of tenure typesincluding house ownership/purchasing.101 Includes prices for electricity, gas and other household fuels and water and sewerage.102 Includes prices for health services and pharmaceuticals.103 As the summary analysis for the Strategy was conducted on a reduced set of RPI households, only one household isexpending above the Tasmanian average on transport. Transport includes expenditure on motor vehicles, fuel, vehicle
repair and servicing, parts and accessories, other motoring charges, and urban transport fares.104 Includes prices for preschool, primary, secondary and tertiary education for public and private institutions.105 The index value for March 2011 is subtracted from the index value at March 2006.
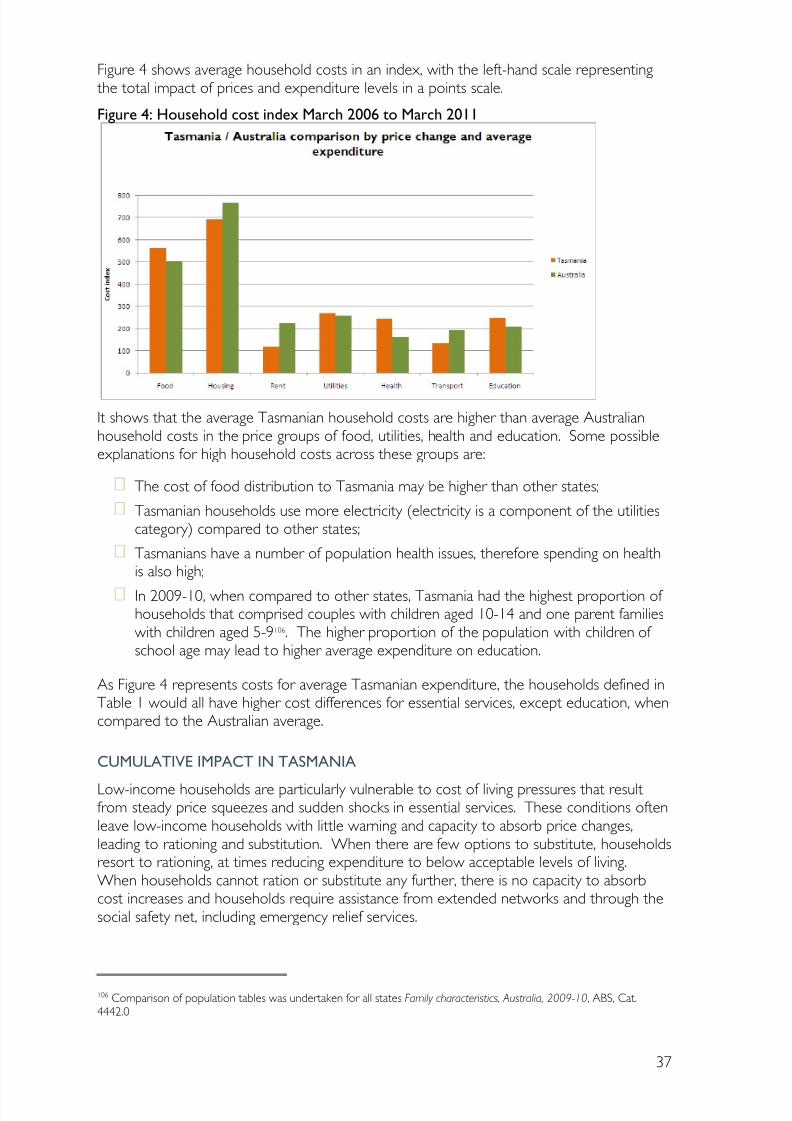
8/3/2019 Cost of Living Strategy
http://slidepdf.com/reader/full/cost-of-living-strategy 37/88
37
Figure 4 shows average household costs in an index, with the left-hand scale representing the total impact of prices and expenditure levels in a points scale.
Figure 4: Household cost index March 2006 to March 2011
It shows that the average Tasmanian household costs are higher than average Australianhousehold costs in the price groups of food, utilities, health and education. Some possibleexplanations for high household costs across these groups are:
The cost of food distribution to Tasmania may be higher than other states;
Tasmanian households use more electricity (electricity is a component of the utilitiescategory) compared to other states;
Tasmanians have a number of population health issues, therefore spending on healthis also high;
In 2009-10, when compared to other states, Tasmania had the highest proportion of households that comprised couples with children aged 10-14 and one parent familieswith children aged 5-9106. The higher proportion of the population with children of school age may lead to higher average expenditure on education.
As Figure 4 represents costs for average Tasmanian expenditure, the households defined inTable 1 would all have higher cost differences for essential services, except education, whencompared to the Australian average.
CUMULATIVE IMPACT IN TASMANIA
Low-income households are particularly vulnerable to cost of living pressures that resultfrom steady price squeezes and sudden shocks in essential services. These conditions oftenleave low-income households with little warning and capacity to absorb price changes,leading to rationing and substitution. When there are few options to substitute, householdsresort to rationing, at times reducing expenditure to below acceptable levels of living.When households cannot ration or substitute any further, there is no capacity to absorbcost increases and households require assistance from extended networks and through thesocial safety net, including emergency relief services.
106 Comparison of population tables was undertaken for all states Family characteristics, Australia, 2009-10, ABS, Cat.4442.0
8/3/2019 Cost of Living Strategy
http://slidepdf.com/reader/full/cost-of-living-strategy 38/88
38
Government income support, concessions and regulated pricing regimes do not adequately take into account that households are disproportionately impacted by costs. Householdbased analysis by location can help uncover the scale and scope of hardship faced in
Tasmanian communities, as well as inform the design of policy responses.
The research shows which Tasmanian households are most impacted by high expenditureand prices across the essential services of food, housing, health, transport and education107.Table 2 lists the households that have the highest cumulative costs across these essentialservices, indicating expenditure in percentage and dollar terms.
As in Table 1, expenditure in percentage terms shows how much households spend onessential services as a proportion of their total expenditure across the whole basket.Expenditure in dollar terms (as average weekly household expenditure - AWHE)108 shows the cost of essential services to households. Table 2 has households sorted by their totalexpenditure on all essential services, from highest to lowest. The total is shown in the
second far right column. The table highlights the three households with the highestexpenditure on an individual essential service. Although an approximation, dollar figures areafter tax and concessions, therefore represent actual expenses to households.
107 Households expending above the average were determined by comparing the total expenditure percentage across theessential services to that of the total average expenditure average for Tasmania, which represents expenditure for allhouseholds. Australian average (all households expenditure) figures are included for comparison.108 The Average Weekly Household Expenditure indicates in nominal dollar terms the amount that the households would
spend per week if prices were inflated to March 2011 CPI quarter prices. These are approximate and were calculated through inflating expenditure dollars from 2005 HES data (concorded to CPI price groups) by the change in the relevantCPI price indexes.
What are households in transition?
The costs of living disproportionately impact certain households andcommunities. However, people and places are not static and cost of living risk can change over time as people move in and out of places andhouseholds.
Changing personal circumstances can mean, for example, thathouseholds move from unemployed to employed, employed to retired,low income to middle income, couple to family, lone person to couple.
Actions recommended in the Strategy can support households in transition to manage changes in their cost of living risk and to continueparticipating in civic, social and economic life.
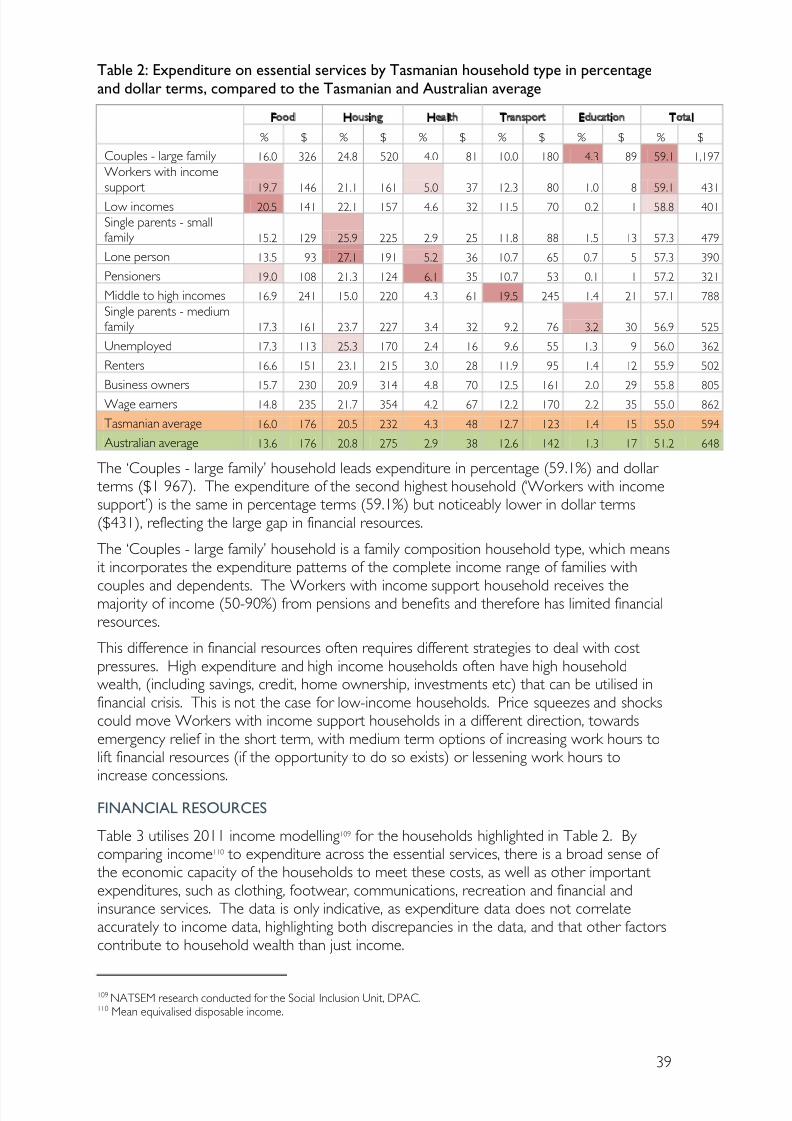
8/3/2019 Cost of Living Strategy
http://slidepdf.com/reader/full/cost-of-living-strategy 39/88
39
Table 2: Expenditure on essential services by Tasmanian household type in percentageand dollar terms, compared to the Tasmanian and Australian average
Food Housing Health Transport Education Total
% $ % $ % $ % $ % $ % $
Couples - large family 16.0 326 24.8 520 4.0 81 10.0 180 4.3 89 59.1 1,197
Workers with incomesupport 19.7 146 21.1 161 5.0 37 12.3 80 1.0 8 59.1 431
Low incomes 20.5 141 22.1 157 4.6 32 11.5 70 0.2 1 58.8 401
Single parents - smallfamily 15.2 129 25.9 225 2.9 25 11.8 88 1.5 13 57.3 479
Lone person 13.5 93 27.1 191 5.2 36 10.7 65 0.7 5 57.3 390
Pensioners 19.0 108 21.3 124 6.1 35 10.7 53 0.1 1 57.2 321
Middle to high incomes 16.9 241 15.0 220 4.3 61 19.5 245 1.4 21 57.1 788
Single parents - mediumfamily 17.3 161 23.7 227 3.4 32 9.2 76 3.2 30 56.9 525
Unemployed 17.3 113 25.3 170 2.4 16 9.6 55 1.3 9 56.0 362
Renters 16.6 151 23.1 215 3.0 28 11.9 95 1.4 12 55.9 502
Business owners 15.7 230 20.9 314 4.8 70 12.5 161 2.0 29 55.8 805
Wage earners 14.8 235 21.7 354 4.2 67 12.2 170 2.2 35 55.0 862
Tasmanian average 16.0 176 20.5 232 4.3 48 12.7 123 1.4 15 55.0 594
Australian average 13.6 176 20.8 275 2.9 38 12.6 142 1.3 17 51.2 648
The ‘Couples - large family ’ household leads expenditure in percentage (59.1%) and dollar terms ($1 967). The expenditure of the second highest household (‘Workers with incomesupport’) is the same in percentage terms (59.1%) but noticeably lower in dollar terms($431), reflecting the large gap in financial resources.
The ‘Couples - large family ’ household is a family composition household type, which meansit incorporates the expenditure patterns of the complete income range of families with
couples and dependents. The Workers with income support household receives themajority of income (50-90%) from pensions and benefits and therefore has limited financialresources.
This difference in financial resources often requires different strategies to deal with costpressures. High expenditure and high income households often have high householdwealth, (including savings, credit, home ownership, investments etc) that can be utilised infinancial crisis. This is not the case for low-income households. Price squeezes and shockscould move Workers with income support households in a different direction, towardsemergency relief in the short term, with medium term options of increasing work hours tolift financial resources (if the opportunity to do so exists) or lessening work hours toincrease concessions.
FINANCIAL RESOURCES
Table 3 utilises 2011 income modelling109 for the households highlighted in Table 2. By comparing income110 to expenditure across the essential services, there is a broad sense of the economic capacity of the households to meet these costs, as well as other importantexpenditures, such as clothing, footwear, communications, recreation and financial andinsurance services. The data is only indicative, as expenditure data does not correlateaccurately to income data, highlighting both discrepancies in the data, and that other factorscontribute to household wealth than just income.
109 NATSEM research conducted for the Social Inclusion Unit, DPAC.110 Mean equivalised disposable income.
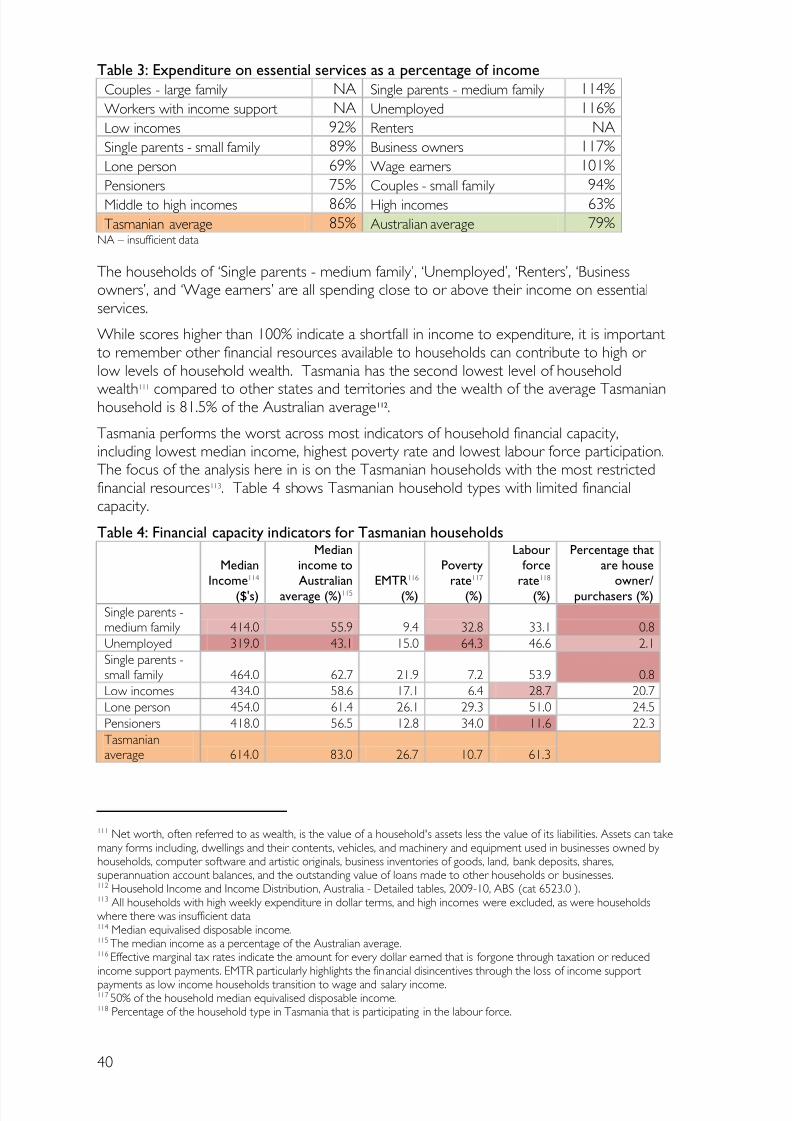
8/3/2019 Cost of Living Strategy
http://slidepdf.com/reader/full/cost-of-living-strategy 40/88
40
Table 3: Expenditure on essential services as a percentage of income
Couples - large family NA Single parents - medium family 114%
Workers with income support NA Unemployed 116%
Low incomes 92% Renters NA
Single parents - small family 89% Business owners 117%
Lone person 69% Wage earners 101%
Pensioners 75% Couples - small family 94%
Middle to high incomes 86% High incomes 63%
Tasmanian average 85% Australian average 79% NA – insufficient data
The households of ‘Single parents - medium family ’, ‘Unemployed’, ‘Renters’, ‘Businessowners’, and ‘Wage earners’ are all spending close to or above their income on essentialservices.
While scores higher than 100% indicate a shortfall in income to expenditure, it is important to remember other financial resources available to households can contribute to high or low levels of household wealth. Tasmania has the second lowest level of household
wealth111
compared to other states and territories and the wealth of the average Tasmanianhousehold is 81.5% of the Australian average112.
Tasmania performs the worst across most indicators of household financial capacity,including lowest median income, highest poverty rate and lowest labour force participation.The focus of the analysis here in is on the Tasmanian households with the most restrictedfinancial resources113. Table 4 shows Tasmanian household types with limited financialcapacity.
Table 4: Financial capacity indicators for Tasmanian households
MedianIncome114
($'s)
Medianincome toAustralian
average (%)115 EMTR116
(%)
Povertyrate117
(%)
Labourforce
rate118 (%)
Percentage thatare house
owner/purchasers (%)
Single parents -medium family 414.0 55.9 9.4 32.8 33.1 0.8
Unemployed 319.0 43.1 15.0 64.3 46.6 2.1
Single parents -small family 464.0 62.7 21.9 7.2 53.9 0.8
Low incomes 434.0 58.6 17.1 6.4 28.7 20.7
Lone person 454.0 61.4 26.1 29.3 51.0 24.5
Pensioners 418.0 56.5 12.8 34.0 11.6 22.3
Tasmanianaverage 614.0 83.0 26.7 10.7 61.3
111 Net worth, often referred to as wealth, is the value of a household's assets less the value of its liabilities. Assets can takemany forms including, dwellings and their contents, vehicles, and machinery and equipment used in businesses owned by households, computer software and artistic originals, business inventories of goods, land, bank deposits, shares,superannuation account balances, and the outstanding value of loans made to other households or businesses.112 Household Income and Income Distribution, Australia - Detailed tables, 2009-10, ABS (cat 6523.0 ).113 All households with high weekly expenditure in dollar terms, and high incomes were excluded, as were householdswhere there was insufficient data
114 Median equivalised disposable income.115 The median income as a percentage of the Australian average.116 Effective marginal tax rates indicate the amount for every dollar earned that is forgone through taxation or reducedincome support payments. EMTR particularly highlights the financial disincentives through the loss of income support
payments as low income households transition to wage and salary income.117 50% of the household median equivalised disposable income.118 Percentage of the household type in Tasmania that is participating in the labour force.
8/3/2019 Cost of Living Strategy
http://slidepdf.com/reader/full/cost-of-living-strategy 41/88
41
‘Single parents’ and ‘Unemployed’ households feature across the indicators. Importantly,both single parent household types have very low house ownership levels (0.8%), which is arisk if cash is required to cope with financial issues such as high mortgage stress.
So far, micro-economic factors such as specific household expenditure patterns, pricechanges across essential services and incomes have been analysed to build a picture of whatis occurring underneath macro-economic indicators such as the CPI.
It is clear that households spending more than the average face a greater cost pressure,particularly when prices increase rapidly, and that this is a critical point of debate when there are cost pressures for low-income households across essential services.
It is worth returning to the CPI with this analysis, by comparing the CPI to householdexpenditure across the complete basket of goods and services (all price groups), not justessential services. This can be achieved by building separate price indexes for householdcosts over time, which is methodology used for the creation of the RPIs.
The annual change in the CPI is referred to as the rate of inflation119, which shows thechange in price for purchasing a fixed basket of goods and services. The rate of inflation is areflection of the change in the value of money within Australia. For example, increases in
inflation reflect a decrease in the value of money, as more money is required to purchase the same amount of goods and services. In general terms, the CPI shows changes in costs to all households when purchasing the basket of goods and services.
By comparison, the household based RPIs use the same basket of goods and services as theCPI and the same price data for these goods and services. However, the RPI uses differentquantities of goods and services than the CPI, instead taking quantity data from the ABS’sHousehold Expenditure Survey. This means the RPI incorporates the CPI price changes,and reflects changes in spending patterns (quantities) as prices increase or decrease over time. In general terms, the RPI shows changes in costs for a specific household whenpurchasing the CPI basket of goods and services.
Figure 6 shows the households that have been identified through the analysis so far as at-risk to high cost pressures.
119 According to Reserve Bank objectives, the desirable medium term CPI rate of inflation should be between 2% and 3%.Average annual movements in the CPI for both Hobart and the weighted average of eight capital cities have been broadly
in line with this aim over the past five years. Rises in inflation can reduce the purchasing power of money and causepressure for wage increases as households struggle to meet the rising cost of living. See Australian Bureau of Statistics2010, Measur es of Australia’s Progress, Sep 2010: Inflation (cat. no.1370.0) for more information.
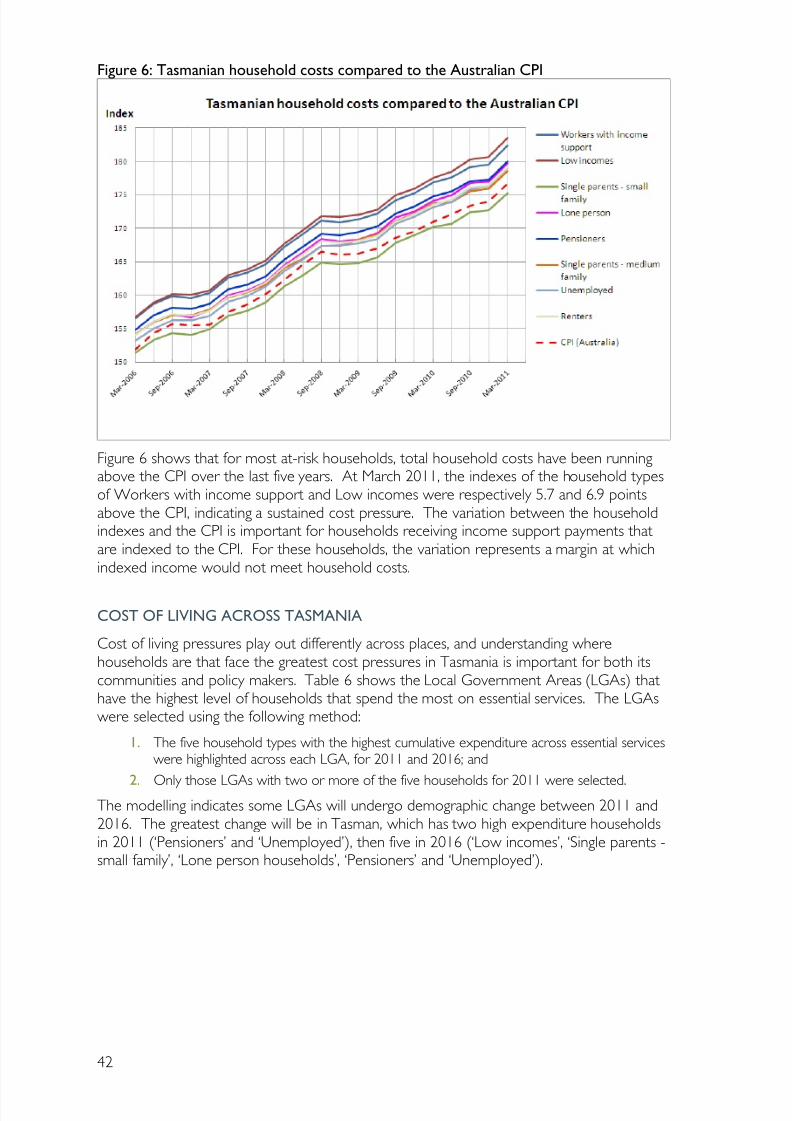
8/3/2019 Cost of Living Strategy
http://slidepdf.com/reader/full/cost-of-living-strategy 42/88
42
Figure 6: Tasmanian household costs compared to the Australian CPI
Figure 6 shows that for most at-risk households, total household costs have been runningabove the CPI over the last five years. At March 2011, the indexes of the household typesof Workers with income support and Low incomes were respectively 5.7 and 6.9 pointsabove the CPI, indicating a sustained cost pressure. The variation between the householdindexes and the CPI is important for households receiving income support payments thatare indexed to the CPI. For these households, the variation represents a margin at whichindexed income would not meet household costs.
COST OF LIVING ACROSS TASMANIA
Cost of living pressures play out differently across places, and understanding wherehouseholds are that face the greatest cost pressures in Tasmania is important for both itscommunities and policy makers. Table 6 shows the Local Government Areas (LGAs) thathave the highest level of households that spend the most on essential services. The LGAswere selected using the following method:
1. The five household types with the highest cumulative expenditure across essential serviceswere highlighted across each LGA, for 2011 and 2016; and
2.
Only those LGAs with two or more of the five households for 2011 were selected.The modelling indicates some LGAs will undergo demographic change between 2011 and2016. The greatest change will be in Tasman, which has two high expenditure householdsin 2011 (‘Pensioners’ and ‘Unemployed’), then five in 2016 (‘Low incomes’, ‘Single parents -small family ’, ‘Lone person households’, ‘Pensioners’ and ‘Unemployed’).
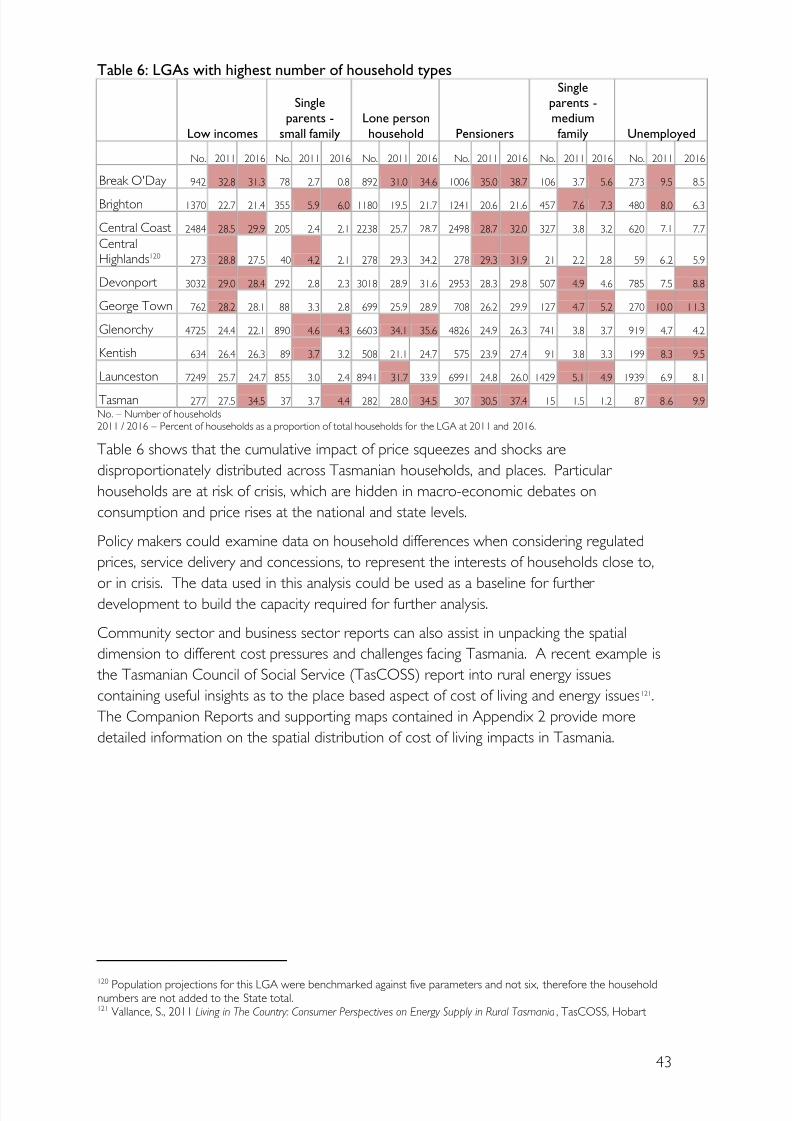
8/3/2019 Cost of Living Strategy
http://slidepdf.com/reader/full/cost-of-living-strategy 43/88
43
Table 6: LGAs with highest number of household types
Low incomes
Singleparents -
small familyLone personhousehold Pensioners
Singleparents -mediumfamily Unemployed
No. 2011 2016 No. 2011 2016 No. 2011 2016 No. 2011 2016 No. 2011 2016 No. 2011 2016
Break O'Day 942 32.8 31.3 78 2.7 0.8 892 31.0 34.6 1006 35.0 38.7 106 3.7 5.6 273 9.5 8.5
Brighton 1370 22.7 21.4 355 5.9 6.0 1180 19.5 21.7 1241 20.6 21.6 457 7.6 7.3 480 8.0 6.3
Central Coast 2484 28.5 29.9 205 2.4 2.1 2238 25.7 28.7 2498 28.7 32.0 327 3.8 3.2 620 7.1 7.7
CentralHighlands120 273 28.8 27.5 40 4.2 2.1 278 29.3 34.2 278 29.3 31.9 21 2.2 2.8 59 6.2 5.9
Devonport 3032 29.0 28.4 292 2.8 2.3 3018 28.9 31.6 2953 28.3 29.8 507 4.9 4.6 785 7.5 8.8
George Town 762 28.2 28.1 88 3.3 2.8 699 25.9 28.9 708 26.2 29.9 127 4.7 5.2 270 10.0 11.3
Glenorchy 4725 24.4 22.1 890 4.6 4.3 6603 34.1 35.6 4826 24.9 26.3 741 3.8 3.7 919 4.7 4.2
Kentish 634 26.4 26.3 89 3.7 3.2 508 21.1 24.7 575 23.9 27.4 91 3.8 3.3 199 8.3 9.5
Launceston 7249 25.7 24.7 855 3.0 2.4 8941 31.7 33.9 6991 24.8 26.0 1429 5.1 4.9 1939 6.9 8.1
Tasman 277 27.5 34.5 37 3.7 4.4 282 28.0 34.5 307 30.5 37.4 15 1.5 1.2 87 8.6 9.9No. – Number of households2011 / 2016 – Percent of households as a proportion of total households for the LGA at 2011 and 2016.
Table 6 shows that the cumulative impact of price squeezes and shocks are
disproportionately distributed across Tasmanian households, and places. Particular
households are at risk of crisis, which are hidden in macro-economic debates on
consumption and price rises at the national and state levels.
Policy makers could examine data on household differences when considering regulated
prices, service delivery and concessions, to represent the interests of households close to,
or in crisis. The data used in this analysis could be used as a baseline for further development to build the capacity required for further analysis.
Community sector and business sector reports can also assist in unpacking the spatial
dimension to different cost pressures and challenges facing Tasmania. A recent example is
the Tasmanian Council of Social Service (TasCOSS) report into rural energy issues
containing useful insights as to the place based aspect of cost of living and energy issues121.
The Companion Reports and supporting maps contained in Appendix 2 provide more
detailed information on the spatial distribution of cost of living impacts in Tasmania.
120 Population projections for this LGA were benchmarked against five parameters and not six, therefore the householdnumbers are not added to the State total.121 Vallance, S., 2011 Living in The Country: Consumer Perspectives on Energy Supply in Rural Tasmania , TasCOSS, Hobart
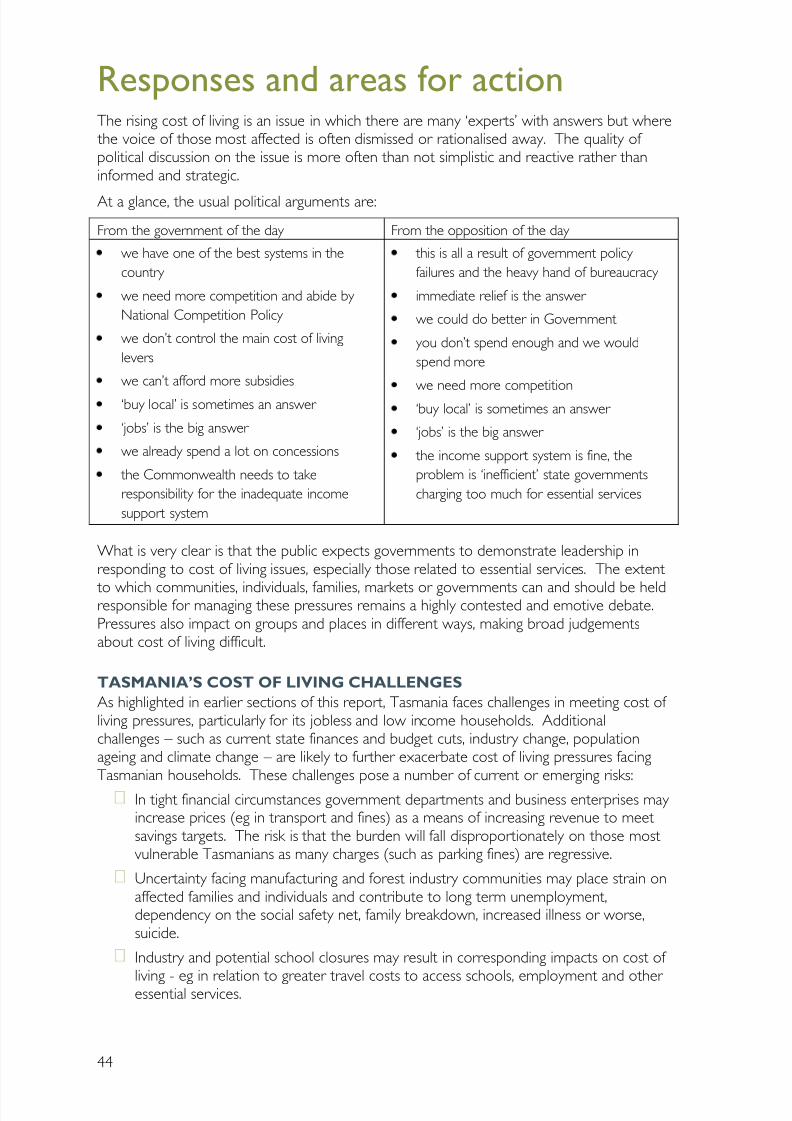
8/3/2019 Cost of Living Strategy
http://slidepdf.com/reader/full/cost-of-living-strategy 44/88
44
Responses and areas for action
The rising cost of living is an issue in which there are many ‘experts’ with answers but where the voice of those most affected is often dismissed or rationalised away. The quality of political discussion on the issue is more often than not simplistic and reactive rather thaninformed and strategic.
At a glance, the usual political arguments are:
From the government of the day From the opposition of the day
we have one of the best systems in the
country
we need more competition and abide by
National Competition Policy
we don’t control the main cost of living
levers
we can’t afford more subsidies
‘buy local’ is sometimes an answer
‘jobs’ is the big answer
we already spend a lot on concessions
the Commonwealth needs to take
responsibility for the inadequate income
support system
this is all a result of government policy
failures and the heavy hand of bureaucracy
immediate relief is the answer
we could do better in Government
you don’t spend enough and we would
spend more
we need more competition‘buy local’ is sometimes an answer
‘jobs’ is the big answer
the income support system is fine, the
problem is ‘inefficient’ state governments
charging too much for essential services
What is very clear is that the public expects governments to demonstrate leadership inresponding to cost of living issues, especially those related to essential services. The extent
to which communities, individuals, families, markets or governments can and should be heldresponsible for managing these pressures remains a highly contested and emotive debate.Pressures also impact on groups and places in different ways, making broad judgementsabout cost of living difficult.
TASMANIA’S COST OF LIVING CHALLENGES
As highlighted in earlier sections of this report, Tasmania faces challenges in meeting cost of living pressures, particularly for its jobless and low income households. Additionalchallenges – such as current state finances and budget cuts, industry change, populationageing and climate change – are likely to further exacerbate cost of living pressures facingTasmanian households. These challenges pose a number of current or emerging risks:
In tight financial circumstances government departments and business enterprises may increase prices (eg in transport and fines) as a means of increasing revenue to meetsavings targets. The risk is that the burden will fall disproportionately on those mostvulnerable Tasmanians as many charges (such as parking fines) are regressive.
Uncertainty facing manufacturing and forest industry communities may place strain onaffected families and individuals and contribute to long term unemployment,dependency on the social safety net, family breakdown, increased illness or worse,suicide.
Industry and potential school closures may result in corresponding impacts on cost of
living - eg in relation to greater travel costs to access schools, employment and other essential services.
8/3/2019 Cost of Living Strategy
http://slidepdf.com/reader/full/cost-of-living-strategy 45/88
45
Population ageing and the increasing dependency ratio mean that older Tasmaniansare some of the most at risk to cost of living pressures.
Increases in water charges and the flow on effects of the carbon tax may result insome households being worse off.
Responding to the above challenges requires an understanding of the cumulative impacts of
changes and differing needs for Tasmanian households and places. Strong transitionalemployment strategies, a Tasmanian population settlement strategy and planning reformsare all important policy responses to these challenges.
Land use planning is a key to mitigating current and future cost of living risks. The cost of building homes; the location of homes relative to transport, services, education and jobs and the capacity for local self sufficiency are all linked to planning decisions. Historically poor planning decisions locating large social housing estates on the fringes of cities (away fromservice and jobs) exacerbate cost of living risks.
Ongoing investments in affordable and accessible housing, health, transport and educationremain important in assisting individuals, families and communities to manage cost of living
risk. The Economic Development Plan and continued investment in policies to increaselabour market participation, improve productivity of the state and build resilientcommunities will also help. Infrastructure spending, incentives for private investments inregional enterprises and social enterprises and smart use of the NBN platform all contribute to Tasmania’s cost of living capacity.
KEY AREAS FOR STRATEGIC INTERVENTION
The policy framework for cost of living (explained previously at Figure 2) illustrates threekey areas for strategic intervention:
Immediate support for people in crisis;Capacity building for at risk people and places to help manage costs, sustain livingstandards, support participation and prevent disadvantage; and
Effective institutions and leadership that addresses the cumulative impacts andstructural causes of cost of living risk.
The framework recognises that markets, communities, individuals and governments can alldevelop responses according to these three approaches122. However, much of the debatefocuses on what governments can do to assist and protect Tasmanians facing costpressures, usually in regard to income support and taxation systems on the one hand and
State concessions and pricing policies on the other. For any cost of living strategy tosucceed there needs to be concerted effort across the four interdependent domainsoutlined in the policy framework and within all three of the above key areas for strategicintervention.
THE INCOME SUPPORT AND TAXATION SYSTEMS
The income support and taxation systems, by determining income levels for many people,have a significant impact on the ability of individuals and households to manage cost of living
122 Companion Report 2 Cost of Living in Tasmania – Impacts and Responses provides policy detail regarding the maincost of living responses across the community, market, individual and government domains.
8/3/2019 Cost of Living Strategy
http://slidepdf.com/reader/full/cost-of-living-strategy 46/88
46
pressures. The Australian Government determines both the levels of income supportpayments and personal taxation rates.
A wave of largely progressive tax reforms in the 1980s has since been watered down by subsequent reforms including the introduction of the largely regressive Goods and ServicesTax (GST). The introduction of the Carbon Tax, while including compensationarrangements for low income households may result in some households being worse off and/or incurring a net cost123.
The level of government benefits many people receive is inadequate to cover the basicssuch as food, rent, electricity, clothing, health care, petrol and other transport costs 124. Many low income households are very effective at managing what they have, but it is simply notenough to cover the cost of essentials125. Definitions of adequacy are contested126. TheHenry Tax Review referred to a ‘minimum adequate standard of living’, and ‘prevailingcommunity standards’127. While it did not undertake a detailed review of the adequacy of income support, the Henry Tax Review noted that, “payment adequacy, structure andincentives could be improved128 in particular, recommending that the design of the incomesupport system should take into account effects on incentives to work and save.129
For decades, community sector reports based on consultation with Tasmanians havecaptured the particular cost pressure impacts experienced by low income households130.The sector has argued for a re-assessment of income support levels so that these do not lagbehind increases in costs of living and wages131. Clearly, a major response to address cost of living challenges is income adequacy and this lies in the domain of the AustralianGovernment. There are other shared responsibilities, such as concessions and emergency relief that are joint responses that can also be improved.
123 Early analysis indicates that the carbon price compensation is based on changes to the tax and transfer system, notconsumption. This may mean that vulnerable sections of the community may be adversely impacted.Changes to the transfer system include a 1.7% increase to Commonwealth pensions and allowances which will be indexed
to the CPI. However, income support payments require increases in addition to 1.7% to approximate current living cost.Households compensated lower than expenditure levels through Commonwealth benefits and allowances are studentsreceiving Youth Allowance, Austudy and Abstudy, job seekers receiving Newstart Allowance, Aged Pensioners, andDisability Support Pensioners.The modelling on the carbon price compensation is also based on national averages and does not consider the distributionof impacts across States and Territories or the patterns of expenditure within different households in Tasmania.Households compensated less than 100% of the price impact through taxation changes, earning $50 000 or over, and thatalso expend higher than the national average on electricity are lone person households, single parents with one or twodependants:, and single income couples with one, two or three dependants, aged <5 and two aged 5-12.124 Tasmanian Council of Social Service, 2009. Just Scraping By: Conversations with Tasmanians living on low incomes.125 Flanagan, K. 2009. Hard Times: Tasmanians in Financial Crisis, pages 199-200. See also Anglicare Tasmania Inc. The Priceof Poverty attachment to Companion Report 2 Cost of Living in Tasmania – Impacts and Responses.126 Approaches include tracking levels of income support relative to the poverty line, or considering adequacy relative tobasic community standards.127
Commonwealth of Australia, 2010. Australia’s Future Tax System, Chapter F: The Transfer System. “The primary purpose of government assistance payments is to ensure a minimum adequate standard of living, taking into accountindividual circumstances and prevailing community standards”.128 Commonwealth of Australia, 2010. Australia’s Future Tax System, Chapter F: The Transfer System.. In addition the Organisation for Economic Cooperation and Development (OECD), in its consideration of income supportlevels, recently recommended that “the adequacy of Newstart Allowance should be examined, taking into account bothfiscal constraints and community expectations. An option would be to increase the Newstart Allowance for the initialperiod of unemployment to provide a more adequate safety net.” OECD, 2010 Economic Survey of Australia, page 19.129 Commonwealth of Australia, 2010. Australia’s Future Tax System, Chapter F: The Transfer System.130 This includes submissions to the Social Inclusion Community Consultation in 2008 and 2009, submissions to the 2008Review of Tasmanian State Government Concessions, submissions to the Government through the yearly community sector budget submissions process, and a range of research and policy papers that are available on the websites of individual organisations. Of particular note are the papers available on the websites of TasCOSS,( www.tascoss.org.au) and Anglicare Tasmania (www.anglicare-tas.org.au). Companion Report 2 Cost of Living in Tasmania: Impacts and Responses summarises some of the community sector concerns.131 Flanagan, J. 2010. ‘Trouble Rarely Travels Alone’, In From the Edge: State of the Family Report, page 7. “A significantproblem with the [income support] system is that most payments are not linked to basic living costs and many of them arenot indexed to wages so they never keep up with improvements in standard of living in the community”.
8/3/2019 Cost of Living Strategy
http://slidepdf.com/reader/full/cost-of-living-strategy 47/88
47
IMMEDIATE SUPPORT FOR PEOPLE AND PLACES:
CONCESSIONS, SOCIAL TARIFFS, COMMUNITY SERVICE OBLIGATIONS,
EMERGENCY RELIEF AND CONSUMER PROTECTION
Concessions
Along with the tax and transfer system, concessions are the main response governments
adopt to address cost of living issues. The Cost of Living in Tasmania Companion Report 2 provides an inter-jurisdictional comparison of concessions and illustrates the complexity of concessions systems and administration.
As an important part of Tasmania’s response to cost of living risks for vulnerableTasmanians, the concessions system should be comprehensively and separately reviewedfor the following reasons:
Concessions are hard to introduce and even harder to remove upon review andrenewal;
Concessions can be complex to administer with high transaction costs for clients and
the administering agency 132
;Concessions take the edge off price increases but they never match the full increase(even after indexation);
Concessions focus on immediate financial assistance rather than capacity building, andoften create perverse incentives;
The equity and efficiency of the current concessions system is at best unclear 133; and
Because the provision of concessions is shared between Australian andState/Territory Governments, it is important roles and responsibilities are dividedappropriately.
Where possible, concessions need to be targeted to the households and places facing themost cost of living risk 134.
A concessions review can consider a number of challenges associated with household basedconcessions135, including:
Some households will need the concession more than others (primarily an equity issue);
132 House Standing Committee on Family and Community Affairs, 1997. Concessions - Who Benefits?: A Report OnConcession Card Availability And Eligibility For Concessions . Commonwealth of Australia: Canberra.133 It is difficult to measure the equity and efficiency of the current concessions system, and the extent to whichconcessions are actually targeted to those at risk. For instance, land tax exemptions are included in the Concessionsbooklet, despite the fact that these are arguably not as targeted to those in need as many other concessions.134 In the 2008 Review of Tasmanian State Government Concessions134 the Government identified efficiency, equity,simplicity, consistency and appropriateness as five guiding principles that should underpin existing and future concessions.Equity: concessions should ensure that those in similar circumstances are treated equally;Simplicity: concessions must be simple and easy to access, and as transparent as possible to ensure that people are awareof what they are entitled to and the value of the concession;Consistency: concessions should be broadly consistent with the Government’s strategic policy and social objectives; Appropriateness: after consideration of other options, the provision of a concession should be the mosteffective/desirable way to deliver assistance to the targeted recipient.Department of Treasury & Finance, 2008 Review of Tasmanian State Government Concessions.135 These are concessions that are administered with eligibility based on the composition of a household and consumptionlevels rather than -or in addition to -a concession card system. For further discussion see the Cost of Living in Tasmania:Interim report available at http://www.dpac.tas.gov.au/divisions/siu/strategy/cost_of_living
8/3/2019 Cost of Living Strategy
http://slidepdf.com/reader/full/cost-of-living-strategy 48/88
48
Administration costs can be very high (primarily an efficiency issue)136;
Few existing data sets enable ready identification of household types (primarily apublic administration issue) 137;
Household composition can change quickly (primarily a targeting issue);
Disclosure of information (primarily a privacy and confidentiality issue); and
Volume or consumption based concessions can distort consumer behaviour.
A comprehensive policy review of our concessions system could assess whether it is fair and equitable, administratively efficient, appropriately targeted, accessible and respectful of people’s rights to privacy and confidentiality. There are a number of methods used topublicise concessions which can be examined for whether they are reaching those whoneed to know about their entitlements.138 The costs and benefits of centralising concessionsadministration in one agency 139 as well as comparisons of administration in other places140 and evaluating models of alternative concessions delivery could also be examined. Oneexample may be storing the concessional value for eligible Tasmanians on a ‘smart card’ toprovide more choice and ‘empowerment’ around total scarce resources rather than being
locked into specific concessions.
Social Tariffs
Social tariffs are generally applied to goods and services that have a social value141. They canform part of a package of policy measures to ensure that at risk individuals and householdsare able to afford an adequate supply of essential goods and services.
Essential services such as electricity, water, and telecommunications used to be supplied by governments as public goods, but are now provided by the market, government enterprisesor state companies with appropriate regulatory oversight from government bodies 142. Theprovision of social tariffs addresses the tension between the objectives of cost recovery for
producers and maintaining the living standards for households most at risk from cost of living pressures. The recent Anglicare Tasmania report The Price of Poverty: the cost of living for low income earners highlighted the importance of lifeline tariffs as a last resort to protectpeople from disconnection.
136 Department of Treasury and Finance, 2010. Costing Report: Costing of Policy Proposal – Extension of Electricity ConcessionScheme. In evaluating the costs of establishing a household based two-part electricity concession, this report estimated that the proposed policy would incur an additional cost to Government of between 59.4 million and $46.7 million over 4 years.The estimated costs in the first year included the development of new systems for administering the proposedarrangements and verifying eligibility for the concession.137 In response to the proposed two-part electricity concession, the Cost of Living in Tasmania: Interim Report noted that
most agencies and utility retailers (such as Aurora) would not currently collect household demographic information, thatfamily composition and living arrangements are not static, and that households change over time and require intensivemonitoring and verification processes. It further noted that for some clients this level of scrutiny in itself createsdisincentives to seek support.138 For example, almost half of the adult population have significant problems with reading and writing (47% of adultTasmanians do not have what the ABS defines as ‘functional literacy’. Australian Bureau of Statistics, 2008 Adult Literacy andLife Skills Survey, Summary Results, Australia 2006 (Reissue), cat no 4228.0). As already noted, Tasmania’s population isageing at a faster rate than the rest of Australia and as this continues, it may also be appropriate to conduct research about the particular cost pressures on older Tasmanians to examine their behavioural responses, and determine the extent towhich the current concessions system is meeting their needs.139 A centralised administration system may allow for a better understanding of the overall impact, extent, andeffectiveness and a whole-of-government approach to the review and evolution of concessions.140 The Cost of Living in Tasmania Companion Report 2 contains an inter-jurisdictional Comparison of Concessions. 141 Le Blanc, D. 2008. A Framework for Analysing Tariffs and Subsidies in Water Provision to Urban Households in Developing Countries, DESA Working Paper No, 63. United Nations Department of Economic and Social Affairs: New York.142 Monash Centre for Regulatory Studies, 2009. Literature Review: International Experience with Electricity Block Tariffs,Foundation for Effective Markets and Governance Project accessed atwww.advocacypanel.com.au/documents/ProgressReportSeptember09.pdf
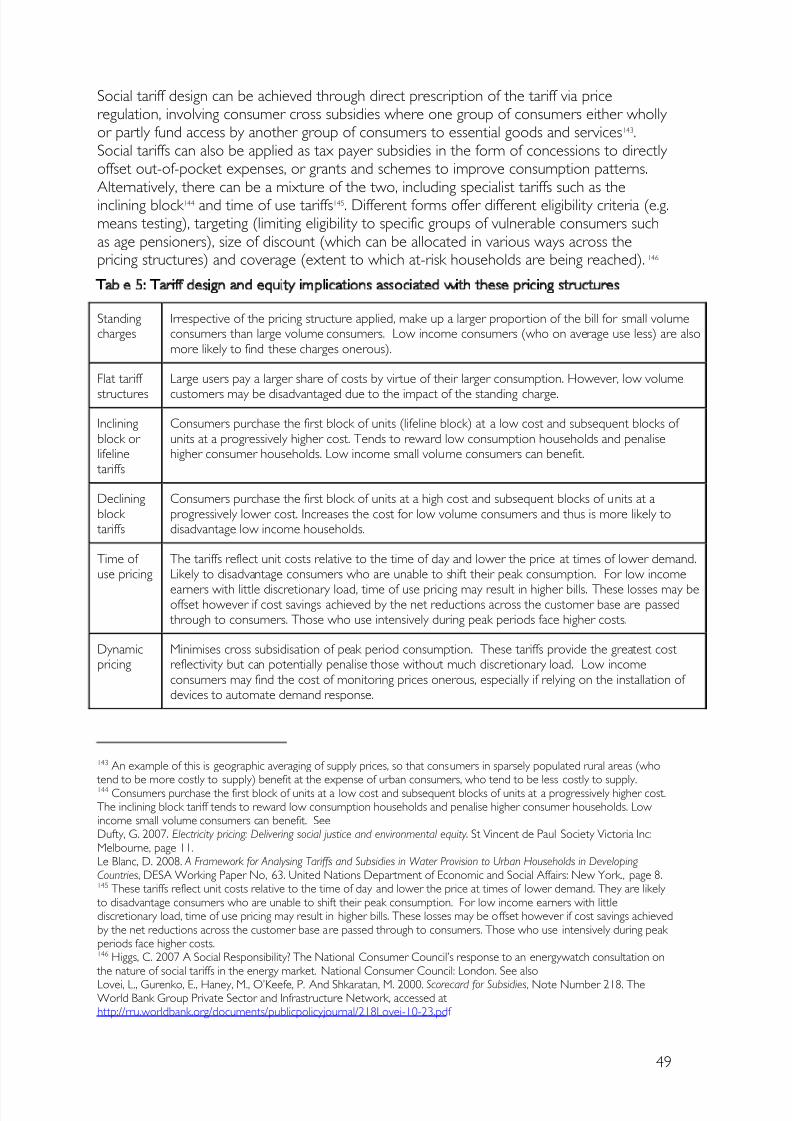
8/3/2019 Cost of Living Strategy
http://slidepdf.com/reader/full/cost-of-living-strategy 49/88
49
Social tariff design can be achieved through direct prescription of the tariff via priceregulation, involving consumer cross subsidies where one group of consumers either wholly or partly fund access by another group of consumers to essential goods and services143.Social tariffs can also be applied as tax payer subsidies in the form of concessions to directly offset out-of-pocket expenses, or grants and schemes to improve consumption patterns.Alternatively, there can be a mixture of the two, including specialist tariffs such as theinclining block 144 and time of use tariffs145. Different forms offer different eligibility criteria (e.g.means testing), targeting (limiting eligibility to specific groups of vulnerable consumers suchas age pensioners), size of discount (which can be allocated in various ways across thepricing structures) and coverage (extent to which at-risk households are being reached). 146
Table 5: Tariff design and equity implications associated with these pricing structures
Standingcharges
Irrespective of the pricing structure applied, make up a larger proportion of the bill for small volumeconsumers than large volume consumers. Low income consumers (who on average use less) are alsomore likely to find these charges onerous).
Flat tariff
structures
Large users pay a larger share of costs by virtue of their larger consumption. However, low volume
customers may be disadvantaged due to the impact of the standing charge.
Incliningblock or lifeline tariffs
Consumers purchase the first block of units (lifeline block) at a low cost and subsequent blocks of units at a progressively higher cost. Tends to reward low consumption households and penalisehigher consumer households. Low income small volume consumers can benefit.
Decliningblock tariffs
Consumers purchase the first block of units at a high cost and subsequent blocks of units at aprogressively lower cost. Increases the cost for low volume consumers and thus is more likely todisadvantage low income households.
Time of use pricing
The tariffs reflect unit costs relative to the time of day and lower the price at times of lower demand.Likely to disadvantage consumers who are unable to shift their peak consumption. For low income
earners with little discretionary load, time of use pricing may result in higher bills. These losses may beoffset however if cost savings achieved by the net reductions across the customer base are passed through to consumers. Those who use intensively during peak periods face higher costs.
Dynamicpricing
Minimises cross subsidisation of peak period consumption. These tariffs provide the greatest costreflectivity but can potentially penalise those without much discretionary load. Low incomeconsumers may find the cost of monitoring prices onerous, especially if relying on the installation of devices to automate demand response.
143 An example of this is geographic averaging of supply prices, so that consumers in sparsely populated rural areas (who
tend to be more costly to supply) benefit at the expense of urban consumers, who tend to be less costly to supply.144 Consumers purchase the first block of units at a low cost and subsequent blocks of units at a progressively higher cost.The inclining block tariff tends to reward low consumption households and penalise higher consumer households. Low income small volume consumers can benefit. SeeDufty, G. 2007. Electricity pricing: Delivering social justice and environmental equity . St Vincent de Paul Society Victoria Inc:Melbourne, page 11.Le Blanc, D. 2008. A Framework for Analysing Tariffs and Subsidies in Water Provision to Urban Households in Developing Countries, DESA Working Paper No, 63. United Nations Department of Economic and Social Affairs: New York., page 8.145 These tariffs reflect unit costs relative to the time of day and lower the price at times of lower demand. They are likely to disadvantage consumers who are unable to shift their peak consumption. For low income earners with littlediscretionary load, time of use pricing may result in higher bills. These losses may be offset however if cost savings achievedby the net reductions across the customer base are passed through to consumers. Those who use intensively during peak periods face higher costs.146 Higgs, C. 2007 A Social Responsibility? The National Consumer Council’s response to an energywatch consultation on the nature of social tariffs in the energy market. National Consumer Council: London. See also
Lovei, L., Gurenko, E., Haney, M., O’Keefe, P. And Shkaratan, M. 2000. Scorecard for Subsidies, Note Number 218. TheWorld Bank Group Private Sector and Infrastructure Network, accessed athttp://rru.worldbank.org/documents/publicpolicyjournal/218Lovei-10-23.pdf
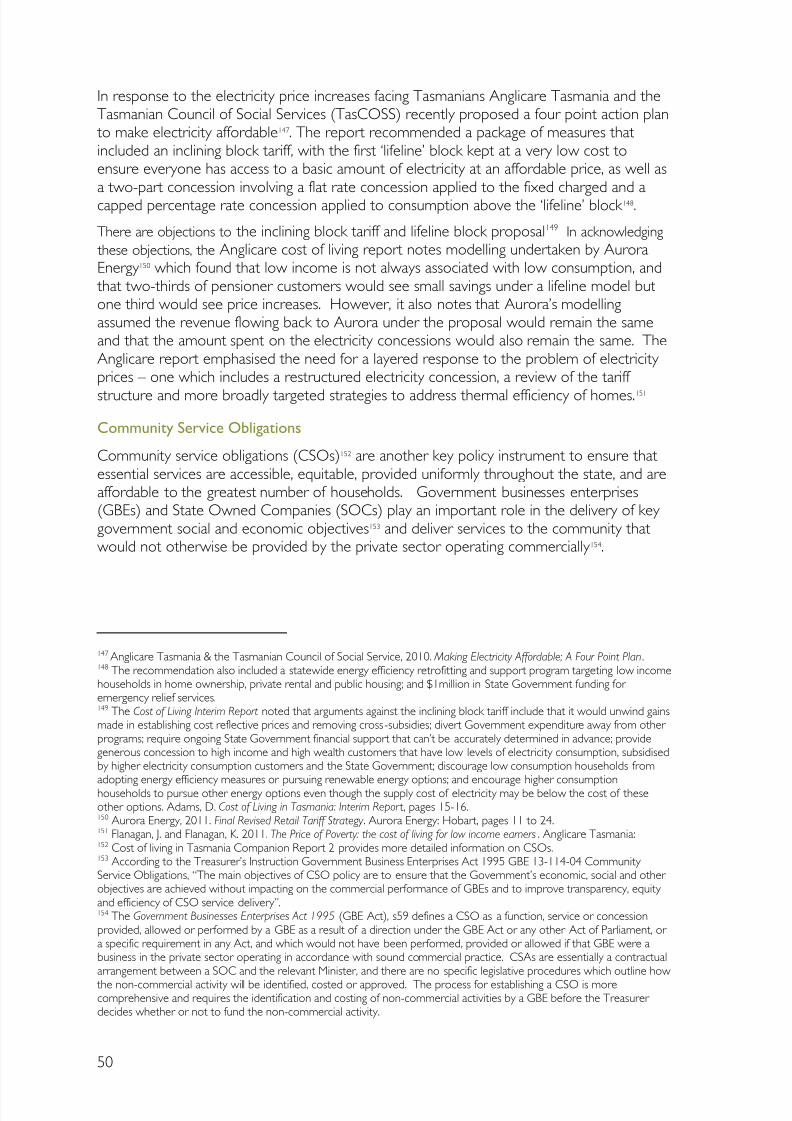
8/3/2019 Cost of Living Strategy
http://slidepdf.com/reader/full/cost-of-living-strategy 50/88
50
In response to the electricity price increases facing Tasmanians Anglicare Tasmania and theTasmanian Council of Social Services (TasCOSS) recently proposed a four point action plan to make electricity affordable147. The report recommended a package of measures thatincluded an inclining block tariff, with the first ‘lifeline’ block kept at a very low cost toensure everyone has access to a basic amount of electricity at an affordable price, as well asa two-part concession involving a flat rate concession applied to the fixed charged and acapped percentage rate concession applied to consumption above the ‘lifeline’ block 148.
There are objections to the inclining block tariff and lifeline block proposal149 In acknowledging
these objections, the Anglicare cost of living report notes modelling undertaken by AuroraEnergy 150 which found that low income is not always associated with low consumption, and that two-thirds of pensioner customers would see small savings under a lifeline model butone third would see price increases. However, it also notes that Aurora’s modellingassumed the revenue flowing back to Aurora under the proposal would remain the sameand that the amount spent on the electricity concessions would also remain the same. TheAnglicare report emphasised the need for a layered response to the problem of electricity prices – one which includes a restructured electricity concession, a review of the tariff
structure and more broadly targeted strategies to address thermal efficiency of homes. 151
Community Service Obligations
Community service obligations (CSOs)152 are another key policy instrument to ensure thatessential services are accessible, equitable, provided uniformly throughout the state, and areaffordable to the greatest number of households. Government businesses enterprises(GBEs) and State Owned Companies (SOCs) play an important role in the delivery of key government social and economic objectives153 and deliver services to the community thatwould not otherwise be provided by the private sector operating commercially 154.
147 Anglicare Tasmania & the Tasmanian Council of Social Service, 2010. Making Electricity Affordable; A Four Point Plan .148 The recommendation also included a statewide energy efficiency retrofitting and support program targeting low incomehouseholds in home ownership, private rental and public housing; and $1million in State Government funding for emergency relief services. 149 The Cost of Living Interim Report noted that arguments against the inclining block tariff include that it would unwind gainsmade in establishing cost reflective prices and removing cross-subsidies; divert Government expenditure away from other programs; require ongoing Sta te Government financial support that can’t be accurately determined in advance; providegenerous concession to high income and high wealth customers that have low levels of electricity consumption, subsidisedby higher electricity consumption customers and the State Government; discourage low consumption households from
adopting energy efficiency measures or pursuing renewable energy options; and encourage higher consumptionhouseholds to pursue other energy options even though the supply cost of electricity may be below the cost of theseother options. Adams, D. Cost of Living in Tasmania: Interim Repor t, pages 15-16.150 Aurora Energy, 2011. Final Revised Retail Tariff Strategy . Aurora Energy: Hobart, pages 11 to 24.151 Flanagan, J. and Flanagan, K. 2011. The Price of Poverty: the cost of living for low income earners . Anglicare Tasmania:152 Cost of living in Tasmania Companion Report 2 provides more detailed information on CSOs.153 According to the Treasurer’s Instruction Government Business Enterprises Act 1995 GBE 13-114-04 Community Service Obligations, “The main objectives of CSO policy are to ensure that the Government’s economic, social and other objectives are achieved without impacting on the commercial performance of GBEs and to improve transparency, equity and efficiency of CSO service delivery”.154 The Government Businesses Enterprises Act 1995 (GBE Act), s59 defines a CSO as a function, service or concessionprovided, allowed or performed by a GBE as a result of a direction under the GBE Act or any other Act of Parliament, or a specific requirement in any Act, and which would not have been performed, provided or allowed if that GBE were abusiness in the private sector operating in accordance with sound commercial practice. CSAs are essentially a contractualarrangement between a SOC and the relevant Minister, and there are no specific legislative procedures which outline how
the non-commercial activity will be identified, costed or approved. The process for establishing a CSO is morecomprehensive and requires the identification and costing of non-commercial activities by a GBE before the Treasurer decides whether or not to fund the non-commercial activity.
8/3/2019 Cost of Living Strategy
http://slidepdf.com/reader/full/cost-of-living-strategy 51/88
51
GBEs and SOCs are ultimately accountable to the Parliament and the Tasmaniancommunity 155. As cost of living pressures increase, Government responses can includereviewing the products offered by GBEs such as Aurora and the water corporations.
Despite all the mechanisms in place to establish CSOs their impact is unclear. GBEs andSOCs meet their CSOs largely by offering concessions that are both direct (e.g. the
discount for pensioners and low and fixed income earners on electricity bills) and indirect(e.g. the passenger transport subsidy to Metro in addition to user concessions). However,establishing or offering a concession is a first step. Promotion and take-up of initiatives iswhat achieves results and delivers real benefits to those who are struggling with cost of living pressures. There is also opportunity to explore requiring Government businesses togo further with the CSOs they offer, e.g. enforcing mandatory promotion of payment plansand ‘bill smoothing’ options with a view to these becoming part of standard businesspractice. The establishment of performance measures or targets to assess CSO outcomescan further enhance the ‘value for money’ the Government receives from the CSOs itfunds.
155 As stated in the Guidelines for Tasmanian Government Businesses Corporate Governance Principles, available athttp://www.treasury.tas.gov.au
What is competition and contestability?
The operation of Government Business Enterprises often means that theseinstitutions are not subject to the same competitive pressures that private
market operators are subjected to. This may result in both limited product
development in conjunction with unnecessary price rises. In these cases it is
important that government is vigilant in ensuring that GBEs are pricing
efficiently and focused on consumer need.
As government transitions to competitive markets it must be mindful that
these take many years to develop and require effective regulative structures
to protect consumer interests and ensure markets do not become highly
congested, with few market participants.
According to economic theory, the transition to effective competition has the
potential to deliver many benefits to consumers, including diversity in
products and service but also the ability to keep prices at a minimum. In
addition it facilitates the demand side to organise and leverage their
purchasing power to seek better prices, products and services.
8/3/2019 Cost of Living Strategy
http://slidepdf.com/reader/full/cost-of-living-strategy 52/88
52
Alternatives to CSOs, such as retail codes can also be strengthened.156 Tasmania has anelectricity retail code, a gas retail code and a water and sewerage customer service code that cover retail issues. There may be improvements to be made to all three.
Progressive approaches to price setting and redistribution to address regressive cost of livingimpacts are critical to address the electricity crisis facing Tasmanian households. CSOs canbe the mechanism by which new funds that may become available from hydro carbon taxcredits are redistributed to Tasmanian households facing the greatest cost of living risk.Further investigation is also warranted of social tariff options or other structural mechanism to ensure Tasmanian households can access a level of electricity supply that is required for abasic minimum adequate standard of living.
The underreporting of electricity disconnection is also an issue for investigation inTasmania.157 The recent Anglicare Tasmania report on cost of living noted the incidence of households self disconnecting their Aurora PAYG meter to conserve last credit and rationpower consumption. These households will not show up in the disconnection statistics. It isimportant to seek to quantify this problem and seek to address it by assisting affectedhouseholds.
156 For example, energy retail codes specify the terms and conditions required in a contract for the supply or sale of energy, establishing minimum retail standards for all residential electricity customers, including the rights and obligations of retailers and their customers with respect to billing and payment, customer information, complaints handling and
disconnection for non-payment of accounts. 157 Only a small proportion of APAYG meters can pick up a self-disconnection (~2000 meters according to OTTER), therefore reporting refers to the number of customers ‘detected as self-disconnected’. Options to better understand the
issue of self disconnection could include increasing the number of meters that are able to record self-disconnection andonce a self-disconnection is identified, contacting the customer to establish and document the reasons, including inability topay to better understand under reporting of hardship related disconnections.
What is bill smoothing?
One issue for households struggling to make ends meet is being able to cope
with several large bills that need to be paid at the same time. Although many
of these bills are regular and can be anticipated as part of a household’s cash
flow management, the ‘lumpiness’ of large bills can be problematic and
stressful.
Bill smoothing is an approach to consumer payments to help reduce thelumpiness of large bills and the cost pressures these cause. The approach is
criticised as it doesn’t reduce the cost of the bill. It can only help reduce the
shock of large bills by enabling these to be paid in smaller manageable
amounts over a period of time.
Billers can assist by adjusting the timing of a bill to take account of seasonal
peaks and help reduce the impact of large bills for example around Christmas
time or ‘back to school’. Through options such as B-pay and direct debit,
individual consumers can set the frequency of bill payments to suit their
household cash flow, in anticipation of the total potential charge at the end of
the service period. Governments can assist in aligning concessions with billing
options and hardship policies to help reduce the cost of bills for those on low
incomes or facing financial hardship.
To smooth cost of living shocks it is important that billers are aware of who is
being billed, when and where in the State and that people are aware of the
range of available payment options, hardship arrangements and concessions.
8/3/2019 Cost of Living Strategy
http://slidepdf.com/reader/full/cost-of-living-strategy 53/88
53
Emergency relief
The Australian and Tasmanian governments158 both provide short term critical support toindividuals and families experiencing a financial emergency or a crisis. A growing number of Tasmanians including middle as well as low income households are presenting to emergency relief (ER) services for assistance. As already noted, more than 22 000 Tasmanians accessassistance, an increase of 52% in the past 12 months and 150% over the past 5 years. Over the same period, there has been a 750% increase in people seeking help for the first time(from 1 000 to 8 500 Tasmanians).
ER can be provided in a number of ways159:
1. Anonymously – without people having to disclose their personal details or go through aneligibility process – e.g. Food Vans model
2. Basic transaction – such as a voucher system e.g. vouchers (or gift cards) to use insupermarket
3. Case management – where the service develops a longer term relationship with a person to address some of the underlying causes of financial crisis e.g. asking about why there isno money for food and offering advice and assistance.
4.
Empowerment/capacity building – where people are given a chance to build skills anddevelop support networks – e.g. financial literacy, budgeting, meal planning andpreparation.
Unfortunately, one of the only responses available to people for assistance with cost of living pressures is ER. It is not appropriate that we expect Tasmanians (and a growingnumber of Tasmanians) to go to a charity as a matter of routine. ER is important andongoing commitment from Australian and State governments is critical. However, as muchas possible, it is important that assistance is provided directly to households in ways thatmaintain dignity, are non-stigmatising and encourage self-reliance. Alongside the immediateresponse to financial crisis (1 and 2 above), it is more important to have a range of preventative and strengths based measures that build capacity for individuals and families to
meet current and future price shocks (3 and 4 above).
Consumer protection
In addition to a strong ER system, it is important to invest in programs that strengthenconsumer rights and improve knowledge of where to get support when in hardship.
Australia’s transition to competitive market arrangements can provide consumers with agreater diversity of goods and services and cost reflexive pricing that is as close as possible to the minimum cost required to make that product available to consumers. However, italso presents significant risks due to the pace of change and increased complexity of products available to consumers160. On the one hand markets can offer consumers a
158 The Department of Family, Housing, Community Services and Indigenous Affairs (FaHCSIA) administers theCommonwealth Government’s ER Program, which provides $1.8 million in funding to 18 service providers to provide ER services in 40 outlets around Tasmania. In 2008 the Tasmanian Government contributed $1 million to the CommonwealthER fund. In 2011, it renewed its commitment to ER with a further $2 million over two years, provided directly to existingER providers including support to expand emergency food relief initiatives, enable Tasmanians on low incomes to purchaseenergy saving whitegoods and heaters, micro emergency financial assistance to people in need through the TasmanianAssociation of Community Houses159 TasCOSS The Intersection of Emergency Food Relief and Food Security, November 2010160 Organisation for Economic Cooperation and Development, 2010. Consumer Policy Toolkit . OECD: online atwww.oecd.org/publishing/corrigenda, page 17.Consumers who once were accustomed to buying a standard good or service provided by a regulated monopoly firmnow function in a market environment that requires careful analysis and assessment of what they are buying, from whom
they are buying it and the length of the contract commitment. Greater choice in a deregulated market sometimesrequires consumers to deal with complex information since they must now make decisions that will affect their welfareand finances, often in markets in which they have limited experience and expertise.
8/3/2019 Cost of Living Strategy
http://slidepdf.com/reader/full/cost-of-living-strategy 54/88
54
bewildering array of information, and on the other hand may not provide enoughinformation to help them make purchasing decisions that are in their best interests161. If information is incomplete, misleading, overly complex or too voluminous, consumers cannotmake well informed decisions. Therefore, consumer protection is a necessary complement to competition policy.
There are various policy responses that can help protect consumers, including:
Consumer empowerment (e.g. enhancing the quality or type of information providedfor products and ensuring consumer contracts are not unfair) and
Modifying market behaviour (e.g. mandating product standards or encouraging thedevelopment of codes of conduct).
In 2009 a national consumer policy framework was introduced to improve consumer wellbeing through consumer empowerment and protection, to foster effective competitionand to enable the confident participation of consumers in markets in which both consumersand suppliers trade fairly 162. On 1 January 2011 the Australian Consumer Law (ACL)commenced163, giving consumers the same rights across Australia, no matter where they live,
where they buy goods or services or where a supplier is located164
.
There are particular consumer protection issues for low income Tasmanians, who aresubject to an additional cost in money, time or health which they incur in their attempts topurchase basic goods and services165. Competitive markets can deliver variety, choice andgood value for people, including those on limited and fixed budgets. However, somemarket trends are not always in the interests of low income consumers. Issues include166:
Poor quality information;
Lack of effective competition;
Inability to access basic goods and services because these are unaffordable;
Discrimination which excludes low income earners from certain markets;
Lesser quality products developed for disadvantaged consumers;
161 Organisation for Economic Cooperation and Development, 2010. Consumer Policy Toolkit . OECD: online atwww.oecd.org/publishing/corrigenda, page 52Consumers incur a loss in economic welfare if they are misled into making purchases of goods and services which they would not otherwise have made or if they may more for purchases than they would if they had been better informed.These losses are commonly referred to as consumer detriment. Consumer detriment can take various forms: structural or personal; apparent to consumers or hidden; financial or non-financial. It can affect certain societal groups more heavily thanothers.162 Council of Australian Governments, 2009. Intergovernmental Agreement for the Australian Consumer Law . Accessed athttp://www.consumerlaw.gov.au/content/the_acl/downloads/acl_iga.pdf 163 http://www.consumerlaw.gov.au/content/Content.aspx?doc=home.htm164 http://www.consumerlaw.gov.au The ACL was designed to make it easier for consumers to understand and enforce their rights because these are the sameacross Australia. It includes new national laws that focus on ensuring consumers are sufficiently well‐informed to benefitfrom and stimulate effective competition; goods and services are safe and fit for the purposes for which they were sold; the prevention of practices that are unfair; the needs are met of those consumers who are most vulnerable or are at thegreatest disadvantage; accessible and timely redress where consumer detriment has occurred; and the promotion of proportionate, risk ‐based enforcement165 Flanagan, J. and Flanagan, K. 2011. The Price of Poverty; The cost of living for low income earners . Anglicare Tasmania:Hobart, page 1.See alsoMendoza, R. U, 2008 ‘Why do the poor pay more? Exploring the poverty penalty concept, in Journal of International
Development , 23, 1-28 (2011) accessed at http://onlinelibrary.wiley.com/doi/10.1002/jid.1504/pdf 166 Flanagan, J. and Flanagan, K. 2011. The Price of Poverty; the cost of living for low income earners . Anglicare Tasmania:Hobart, pages 52-57.
8/3/2019 Cost of Living Strategy
http://slidepdf.com/reader/full/cost-of-living-strategy 55/88
55
Adaptation of products for low income purchasers who do not offer the samerevenue stream and regularity of payment;
Limited capacity of low income earners to absorb increasing costs;
Complex consumer choices that require a high level of skill to make effectively.
It is important that responses to cost of living build individual capacity and resilience to
financial implications of particular goods and services, such as Aurora PAYG meters, creditcard debt and fraud, insurance protection, payday lenders, and other financial products. It isequally important to address the reasons why people choose to use more expensiveproducts (that they may already know are more expensive) in the first place. For example,a person may choose to seek credit from a payday lender at a high interest rate to pay their car registration because they need to keep their car on the road because public transportmay be limited where they live. In the absence of an incremental payment option for car registration, or increased public transport to the area, it would be important for that person to be aware of their ability to access, if eligible, the recent State Government extension of the No Interest Loans Scheme. This extension allows loans for a wider range of items andbills, such as car registration. At a minimum the person could be made aware of terms and
conditions and greater expense of payday lender loans. Greater consumer advice andinformation is also required regarding the availability of concessions and entitlements, adviceand enforcement of the Residential Tenancy Act 1997, and protection for consumers facingunreasonable rent rises.
AREAS FOR ACTION: IMMEDIATE RELIEF FOR PEOPLE AND PLACES
A number of areas for action have been highlighted throughout the strategic area of immediate relief for people and places. These have included:
1. Increase the level of financial and organisational support, including adequate indexation, tocommunity sector agencies dealing with individuals and families in crisis to manage demand
growth and the increasing complexity of cases2. Review of Community Service Obligations (CSOs) to assess social outcomes required from all
companies providing essential services (Government Business Enterprises, State OwnedCompanies and Water Corporations) including the adequacy of funding provided to deliver CSOs and appropriate performance measures to assess CSO outcomes
3. Implement a bill smoothing or progressive payment policy across all State Departments andGovernment Business Enterprises to allow Tasmanians to better cope with large bills for electricity and other essential services and fees such as motor vehicle registration. 167
4. Reviews of Concessions to better target at those households most at risk
5. Improve understanding and collection of information regarding the under-reporting of hardshiprelated electricity ‘self disconnections’
6. Better promotion by service providers of existing hardship provisions to increase awarenessand access. This could be triggered at a much earlier identification of at risk households andpromotion of support services available. 168
167 See Anglicare Tasmania The Price of Poverty: The Cost of Living for Low Income Earners Recommendation 14: That theTasmanian Government implement a ‘bill smoothing’ policy to allow Tasmanians to better cope with large bills for electricity and other essential services 168 See Anglicare Tasmania The Price of Poverty: The Cost of Living for Low Income Earners Recommendation 18: That the
Tasmanian Government and Aurora Energy fund a free, impartial, widely available financial information and support servicefor people living on low incomes with capacity to also provide group information sessions for people living on low incomes.
8/3/2019 Cost of Living Strategy
http://slidepdf.com/reader/full/cost-of-living-strategy 56/88
56
CAPACITY BUILDING:
LOCAL SUPPORT NETWORKS, EDUCATION, SKILL BUILDING AND
COOPERATIVES AND SOCIAL ENTERPRISES
Local Support Networks
There is a strong link between positive social networks and being able to meet the rising
costs of living169
. Supportive local networks – the organisations and social relationships through which people form friendships, work and exchange information – can strengthenindividuals and families to take action and find innovative ways to manage cost pressures.These networks can help maintain stability and prevent, as well as respond to, crises by providing people with resources such emergency child care, gifts of time (eg. with movinghouse or mending a broken appliance), or gifts of food, clothing or cash.
Peer support and community volunteer programs have proven successful models for generating community designed responses to risks that achieve sustainable change170. Peoplewho live locally understand local needs and people trust the information that comes frompeople who understand them and their community. Peer supporters based in localcommunity organisations such as Neighbourhood Houses and/or Tasmania’s Child andFamily Centres, are well placed to help people better understand their entitlements asconsumers and support them to access these. They can provide information back to serviceproviders and decision makers about cost of living issues and the barriers that exist in localcommunities, as well as how community members think these could be tackled171.
Many Tasmanian people and places face uncertain futures (e.g. school closures and businessclosures) as a result of changing ‘demographics’ and markets. In these circumstances, peopleworking voluntarily together in their communities can help Tasmania withstand theupheavals of change. Establishing and maintaining an effective network of locally basedorganisations with local people who are committed and knowledgeable about their community, and through which people can become connected and involved is an important
community based response to cost of living risks. However, community based organisationsalso need appropriate levels of resources (including money, time and support) for them tobe effective.
Education and skills building
Foundation skills for social and economic participation – life and work skills – are developedfrom early childhood throughout the school years. Investment in the early years, as well aseducation (including adult education) and vocational training systems, is critical as aprevention and early intervention strategy for building cost of living capacity in Tasmania.
The incidence of all forms of financial stress declines consistently with higher levels of
employment and people in casual or insecure employment are the most at risk of poor outcomes172. Employment is therefore a key to addressing cost of living pressures inTasmania. However, the proportion of Tasmania’s working age population either working
169 Ahsan, N. 2007 Social Networks Make a Difference: Family Economic Success. Annie E. Casey Foundation: Baltimore.170 Rural Alive and Well is a good example of this in Tasmania and the model is also discussed in the Tasmanian Institute of Agricultural Science, University of Tasmania 2011 Tasmanian Drought Evaluation Project and the Council on the AgeingTasmania’s, A sense of belonging: social inclusion issues for older people in Tasmania. 171 As an example, the Social Inclusion community officers with the Child and Family Centres recently consulted withcommunity members and prepared a report identifying key cost of living issues and how communities believed these could
be addressed. This report is quoted in and has been used to inform the strategy.172 Pech, J. 2011. Relative Living Standards and needs of low-paid employees: definition and measurement , Research Report2/2011. Commonwealth of Australia: Canberra, page iii.
8/3/2019 Cost of Living Strategy
http://slidepdf.com/reader/full/cost-of-living-strategy 57/88
57
or actively seeking employment is consistently below the national rate173.Underemployment174 in Tasmania has also increased over recent years175 and is higher inTasmania than any other state or territory.
Joblessness is a growing issue for many individuals, families and communities particularly incommunities where industries (such as forestry) are in transition and associated jobs are indecline. Although some workers have skills and education levels that let them move intoemployment in other sectors, other workers are less able to do this due to limitededucation and formal skills176.
Transitional employment strategies enable people to move from reliance on governmentbenefits and payments as their principal source of income to paid employment, subject to jobs being available. The creation of employment opportunities is an important response toincreasing household resilience to cost of living. Tasmania’s productivity can be vastly increased with job opportunities for long term unemployed Tasmanians as well as moresecure work for people struggling on low incomes due to part-time or casual employment.Skills training and employment assistance programs that emphasise working with employers to overcome barriers to employment and support for people to stay in work are alsoimportant.
Some Tasmanians are not job ready and their cost of living struggle is deepened because they do not have the supportive networks or life skills enabling financial independence andcapability 177. Skills in financial literacy and economic participation are learned early. One of the best mechanisms for reintroducing this commitment to life skills and capacity building isby revisiting ‘home economics’ and life skills in schools and in adult education. Already anumber of excellent courses are offered throughout neighbourhood houses and community sector organisations and it is important that these are continued and strengthened. Peoplewith low financial capability also experience a range of difficulties associated with meetingcost of living pressures, including limited access to credit, insurance and financialinformation178.
173 Labour force statistics and gross state product statistics cited in Demographic Change Advisory Council, 2007. Who isnot participating in Tasmania’s labour force? Department of Treasury & Finance: Hobart, pages 7 to 8.See also, Bureau of Infrastructure, Transport and Regional Economics, 2008. A regional economy: a case study of Tasmania,Commonwealth of Australia: Canberra.174 Underemployment in this instance is defined as the number of part-time workers who would prefer more hours. For more detailed data on underemployment in Tasmania, see Companion Document No. #175 Australian Bureau of Statistics 2010, Australian Social Trends, Dec 2009; Work Data Cube: table 2.6 (cat. no. 4102.0).
In 2010, the proportion of underemployed was 7.2%, up from 5.2% in 2007.176 Schiller, J. 2011. Unpublished powerpoint presentation: ‘Socio-economic impacts of forest industry change’.The Demographic Change Advisory Council has also noted that the skill of the working age population is a key factor indetermining workforce participation, and that Tasmania has a skill base which is lower than the national average.177 Financial capability refers to people’s financial literacy and capacity to access the financial products and educational tools they need to achieve financial stability and build and maintain assets. Sledge, J., Tescher, J. & Gordon, S. 2010. FromFinancial Education to Financial Capability: Opportunities for Innovation. Centre for Financial Services Innovation:cfsinnovation.com 178 The ANZ Survey of Adult Financial Literacy found that people with low levels of financial literacy were less aware of their rights and responsibilities, for example in relation to insurance policies and making insurance claims, repaying consumer debts, and making complaints against a bank or other financial institution. They were also more at risk of financial loss due to lower use of insurance and being less likely to obtain financial information that would help them purchase less expensivefinancial products. It found that people more likely to have low financial literacy included young people (18-24 years) andolder people (70 years and over), people whose formal education did not go beyond year 10, those living in areas of highsocio-economic disadvantage, those who were unemployed, those working in blue collar occupations, those whose main
source of income was a government benefit or allowance, and those whose household income was less than $25,000.Social Research Centre, 2008. ANZ Survey of Adult Financial Literacy in Australia. Accessed athttp://www.anz.com/Documents/AU/Aboutanz/AN_5654_Adult_Fin_Lit_Report_08_Web_Report_full.pdf,
8/3/2019 Cost of Living Strategy
http://slidepdf.com/reader/full/cost-of-living-strategy 58/88
58
People on low incomes keep track of their expenditures and there is nothing systematically ‘wrong’ with the way they manage their finance, when compared with wealthier families179.What is different is that for the low-income and disadvantaged groups, the consequences of a lack of knowledge or a mistake in planning can be devastating. Their lack of access tofinancial safety nets and support, mean that they can face long-lasting negative effects in afinancial crisis. It is this higher vulnerability that must underpin financial literacy responses tocost of living for at risk households rather than preconceptions about their attitude towards
money management180. Also, no matter how good a budgeter a person is, if income isinadequate to cover essential expenditure items at the end of the day, it is inadequate.
Local social cooperatives and enterprises
Local agencies – public, community and private - are the frontline for responding to cost of living risks in communities, and are where many people first turn for support. Local councilsand community sector agencies are key examples. They act as catalysts for local jobcreation, volunteering, and local sponsorship opportunities. They bring together peoplefrom different demographic, socioeconomic and cultural groups, supporting social networksand providing coping mechanisms at times of economic hardship181.
Employment opportunities and community capacity can also be developed throughlocalised economic development, such as fostering micro-businesses, community businesspartnerships and social enterprise. These approaches begin with assets and potential of people and places, not deficits. They recognise that the knowledge, abilities and energy of people and communities – including those described as ‘poor’ and ‘disadvantaged’ – are anenormous resource. Social enterprises foster innovation and confidence. They can be apathway to skills, employment and independence.
Another form of social enterprise is the consumer cooperative, which is owned by consumers and operates as a form of mutual aid, oriented toward service rather thanprofit182. The purpose is to provide goods and services at the lowest cost to the consumer.Although some cooperatives rely on some form of government assistance or needassistance at the start-up, they can go on to operate as financially sustainable enterprises,with income being derived from the provision of services to members183. The cooperativemodel can provide viable options for the delivery of goods and services in many areas184.Consumer cooperatives are often formed as responses to food security 185.
179 Landvogt, K. 2008. Money, dignity and Inclusion: The role of financial capability . Good Shepherd Youth and Family Service:Collingwood.180 Arashiro, Z Financial Inclusion in Australia: Towards transformative policy , Social Policy working Paper No.13, August 2010,Brotherhood of St Laurence: Melbourne.181
Gibson, C and Stewart, A, 2009 Reinventing Rural Places: The Extent and Impact of Festivals in Rural and RegionalAustralia, University of Wollongong, Wollongong182 McQueen, M. & Lyons, M. 2001 The Missing Link: Mutual Forms of Organisation, Social Capital and Community Regeneration in Regional Australia. ACCORD Paper No. 5. Australian Centre for Cooperative Research and Development:Sydney.Australia has a long history of mutual organisations that have been formed to provide a collective organised response to acrisis, the threat of a crisis, or simply to need. They are associated with innovation, flexibility, loyalty and ‘bonding’ linkages;where people feel disenfranchised and powerless they provide a sense of ownership and control; they enhance acommunity’s capacity to organise and lead to communities being better able to adapt to economic challenges.183 Social Traders Ltd. 2009 Cooperative Social Enterprises Info Brief .http://www.socialtraders.com.au/sites/www.socialtraders.com.au/184 Cooperatives Australia, 2009 Cooperatives Australia Statement: Public Policy and Co-operatives.http://www.cooperativeswa.org.au/Co-operatives%20Australia%20Statement.pdf 185 Flanagan, J. and Flanagan, K. 2011 The Price of Poverty: The Cost of Living for Low Income Earners . Anglicare Tasmania:Hobart, pages18-19, 22-23, 25-26, 32-33, 40-41, 49-50 and 57.
Food security refers to the ability of individuals, households and communities to acquire food that is sufficient, reliable,nutritious, safe, acceptable and sustainable. Food insecurity is the experience of not having enough food or having very limited food options, or of relying on emergency relief.
8/3/2019 Cost of Living Strategy
http://slidepdf.com/reader/full/cost-of-living-strategy 59/88
59
Food can be the most compromised item in the household budget, because it is one part of the budget that is not fixed – unlike rent or direct deductions for electricity bills. Support tolow income purchasers to effectively ‘band together’ through cooperative purchasingarrangements to boost their purchasing power and take advantage of bulk discounts can bean important response to cost of living pressures.
The Tasmanian Food Security Fund has recently supported eight initiatives involving over forty organisations in partnership. The early evaluations of the initiatives indicate that localfood production and distribution networks can be very successful in increasing family andcommunity resources around access to a choice of low cost, high quality fresh food. Theassociated ‘at a glance’ document for this strategy provides an example of one of thesuccessful alliances involving seven local organisations working with six local schools.
AREAS FOR ACTION: CAPACITY BUILDING
A number of areas for action have been highlighted throughout the strategic area of capacity building for current and future cost of living shocks and costs. These have included:
7. Developing peer support and volunteer networks in community houses and/or Local Councils to broker access to:
o Emergency Assistance fundso Concessionso Financial literacy o Energy efficiency o Community networkso Complaints mechanisms and redress.
8. Reintroducing home economics, including financial literacy and life skills in schools, adulteducation and community settings.
9. Supporting local social cooperatives, micro generation, energy efficiency policies and groupbuying especially regarding food.
10. Economic development policies to encourage local employment, procurement, social
enterprise facilitation and targeted employment generation programs186.
EFFECTIVE INSTITUTIONS AND LEADERSHIP:
LEADERSHIP, MONITORING COST OF LIVING AND COMMUNITY AND
PARLIAMENTARY PROCESSES
Leadership
All three levels of government are involved in shaping cost of living capability. Given thatcost of living is an issue of national significance, intergovernmental consideration, such as via
the Council of Australian Governments (COAG), is important. There is a long andinglorious history of jurisdictions pointing the finger at each other over responsibility for costof living. Whilst various existing Ministerial Councils and other intergovernmental entitiesdeal with components of the cost of living picture, there is no overall process to plan for or assess cost of living capability. The key matters in scope for and consistent with the brief for COAG would be:
186 See Anglicare Tasmania The Price of Poverty: The Cost of Living for Low Income Earners Recommendation 5: That the
Tasmanian Government work with employers to pursue targeted employment generation programs, with a focus on long term unemployed people and those facing particular disadvantages that impose barriers when looking for work, such as amental illness, disability, or the risk of racial discrimination.
8/3/2019 Cost of Living Strategy
http://slidepdf.com/reader/full/cost-of-living-strategy 60/88
60
The role and capacity of governments to plan for and mitigate cost of living pressuresfor Australians;
The adequacy of Australian Government income support payments
A reassessment of the National Competition Policy to ensure risks and opportunitiesfor vulnerable groups and communities are appropriately considered;
The impact of national reforms on household incomes, especially families andindividuals on low income; and
The efficiency of the current concessions system and opportunities to move to more‘client empowerment’ approaches.
A key way that the State Government can show leadership is to advocate for incomesupport adequacy with the Australian Government. This could also involve identifying andaddressing in partnership with the Australian Government areas in which Tasmania isparticularly vulnerable to changes in Commonwealth policies (especially regarding theincome support and taxation system). An example is the forestry communities identifiedunder the recent Intergovernmental Agreement.
While the tax and transfer system is outside of the direct control of the State Government,many of the price increases facing Tasmanians relate to essential services provided by theState Government or for which it has a policy responsibility. This raises some key leadership challenges, including:
Examining policy settings/changes from the perspective of the client, household andcommunity to minimise detrimental cost of living outcomes;
Providing coordinated monitoring and collection of administrative data on price/costimpacts for individuals and households, particularly in regard to the pace and rate of price change and consumer behaviours in response to these (such as rationing and
substitution);Planning/scheduling price increases to consistently and appropriately mitigate theassociated risks to vulnerable Tasmanians; and
Creating public sector responses that reduce government inefficiencies and removepoor policy settings which contribute to increases in the cost of living through higher costs for government provided services.
Monitoring and ‘regulating’ cost of living
Many jurisdictions have entities that advise governments on setting prices in relation togovernment monopolies. In Tasmania the Economic Regulator undertakes this function. The
primary role is one of ensuring that consumers generally are not disadvantaged through lack of competition especially in relation to essential utilities. Under the current legislation, theEconomic Regulator is not required to consider affordability when setting prices. The exactscope and powers of such functions varies from jurisdiction to jurisdiction but generally thefunctions do not include public goods and services where there is contestability andgenerally the functions do not include assessment of the impact of pricing movements on the cost of living capability of particular groups or places.

8/3/2019 Cost of Living Strategy
http://slidepdf.com/reader/full/cost-of-living-strategy 61/88
61
There are additional functions around essential services and cost of living impacts that canbe considered either within the existing legislation by the Regulator or in parallel by analternative ‘Essential Services Commissioner’ function. These include:
Monitoring the application of the principles in this strategy to essential services pricing;The impact of price movements on the cost of living capability of Tasmanians withparticular reference to vulnerable Tasmanians;
The adequacy and capacity of existing concessions and other government subsidiesand policies to mitigate price movements and, the costs of this;
The extension of ‘in scope’ goods and services to include at a minimum transport,health, housing , education and local government goods and services;
The ongoing arrangements for the indexation of concessions to maintain the ‘real’value of the concessions;
The collection of relevant data to monitor cost of living capability, including data thatcan be spatially mapped to highlight critical cost-of- living ‘hot spots’ in communities that may reach trend proportions requiring direct intervention such as socialenterprise options or collaborative business models in isolated rural areas;
The current and potential role of jurisdictions in planning for cost of living capability and mitigating cost of living risks; and
A national approach to essential service pricing policies and hardship policies in thepublic and private sectors.
To be effective, the role should have a legislative base, akin to the Economic Regulator with the requisite authority and mandate to implement recommendations.
What is the Victorian Essential Services Commission?
The Essential Services Commission Act 2001 is an example of legislation that
can be used to address cost of living.
Under this Act, the Essential Services Commission promotes the long term
interests of Victorian consumers with regard to the price, quality and
reliability of essential services, including:
Energy (electricity and gas)
Water and sewerage
Ports
Transport (rail and other transport related matters).
The Commission undertakes a range of regulatory functions that are similar to
those undertaken by the Tasmanian Economic Regulator.
In relation to cost of living risk, the Commission;
Ensures that users and consumers (including low income or
vulnerable customers) benefit from the gains from competition
and efficiency
Provides consumer information and advice
Undertakes formal reviews and consultations
Reports on performance trends.
8/3/2019 Cost of Living Strategy
http://slidepdf.com/reader/full/cost-of-living-strategy 62/88
62
Community and Parliamentary processes
In weighing up all potential responses to cost of living pressures faced by Tasmanianhouseholds it is important that the views of Tasmanians are incorporated in service designand response implementation187. Cost of living is a public issue and many Tasmanians havestrong views about its impacts and potential responses. Cost of Living in Tasmania,Companion Report 2 and associated attached reports outline much community sentimentand consultation that has already been undertaken on the issue. Due to the publicimportance of the issue in addition to immediate action, ongoing dialogue with citizens and their elected representatives is critical.
A Parliamentary Committee or alternative public mechanism could broadly examine theequity, efficiency and adequacy of current responses to mitigating cost of living risk. For example the Committee could examine:
The impact of the current concessions system on mitigating cost of living risks tovulnerable Tasmanians in terms of administration, eligibility and alternativeapproaches188;
Regressive legislation such as the Monetary Penalties Enforcements Act 2005189. Matters of
inequity regarding this and other regressive policies could be investigated andreported back to the Parliament with recommendations on amendments to currentlegislation and policies;
Potential introduction of progressive taxes fees and fines in Tasmania; and
Other matters to exacerbate or mitigate cost of living in Tasmania.
187 Organisation for Economic Cooperation and Development, 2009. Focus on Citizens: Public Engagement for Better Policy and Services. OECD, accessed at http://www.oecd.org/dataoecd/20/3/42658029.pdf 188 Alternative approaches to the structure and delivery of concessions including ‘stored value cards’ (holding a concessionvalue for discretionary spending) which increase choice and responsibility for the 74 concessions currently available topeople living in Tasmania189 Government agencies refer non-payment to the Monetary Penalties Enforcement agencies. Non payment can result inloss of entitlements such as Drivers Licence; loss of positions, incarceration, and naming and shaming on a public website.
The Act is regressive because the administration fees and fines in addition to the unpaid charge put significant impost onalready struggling Tasmanians and the people most impacted by this legislation are people least able to pursue disputes on these matters. The Act impacts on Tasmanians facing the most cost of living risk.
8/3/2019 Cost of Living Strategy
http://slidepdf.com/reader/full/cost-of-living-strategy 63/88
63
AREAS FOR ACTION: EFFECTIVE INSITITUTIONS AND LEADERSHIP
A number of suggested areas for action have been highlighted throughout the strategic areaof ensuring effective institutions and leadership. These have included:
11. Rebuild the social wage and advocate for adequate income support payments and a moreprogressive taxation system with the Commonwealth.190
12. Essential Services Commission embedded in legislation, including cross sectoral representationand potential appropriate volunteer membership. Commission to review planned priceincreases and oversight price movements, potential price shocks and cumulative risk.
13. Parliamentary Committee or other public mechanism to inquire into:
The effectiveness of the current concessions system and related services, including social tariffs
Alternative models of planning and service delivery of concessions including the optionof ‘bundling concessions’ through a ‘smart card system’.
Review and provide recommendations on regressive legislation such as the Monetary Penalties Enforcements Act 2005
The impact of taxation policies on costs of living
The likely impacts of increased contestability policies on reducing cost of living pressures.
190 See Anglicare Tasmania The Price of Poverty: The Cost of Living for Low Income Earners Recommendation 2: That the
Tasmanian Government, through the Council of Australian Governments, urge the Australian Government to review thelevel of income support payments with a view to ensuring they are set at a level adequate for an acceptable minimumstandard of living for all recipients.
What are progressive taxes, fees and fines?
Australia has a progressive income-tax system where those with greater
capacity to pay contribute more and those with less capacity pay less. This
principle of progressive taxation is also reflected in Tasmania’s land tax,
payroll tax and stamp duty systems. Land tax increases with the value of
property, stamp duty increases with the value of assets transferred; and
payroll tax is only paid by large employers.
This progressive approach to taxation could also be applied to fines and
monetary penalties as has been applied in other jurisdictions, including
Germany, Sweden, and France particularly in relation to traffic offences. This
approach is consistent with sentencing principles within our justice system
that sanctions should vary according to both the seriousness of the offence
and the circumstances of the individual committing the offence.
The impact of a $100 speeding fine is clearly very different for someone
receiving $243 per week (approximate income for single Newstart Allowance
recipient) compared to the impact for someone receiving $708 per week
(approximate average disposable weekly earnings for Tasmanians).
The impact of disproportionately high fines for low income earners is that
they must forego essentials to make even instalment payments and many of
these fines can never be paid. Tasmania currently has approximately $68m in
unpaid fines.
8/3/2019 Cost of Living Strategy
http://slidepdf.com/reader/full/cost-of-living-strategy 64/88
64
ConclusionAll the evidence indicates that cost of living will continue to be an important issue for many Tasmanians because it is about the basics of being able to live a decent life and the role of governments in creating the conditions for a decent standard of living for all. Whilst much of the core business of State Governments (health, education, housing, safety) is about
improving people’s capacity to manage cost of living risks, there is a growing gap betweenpressures and resources to respond, especially for the most vulnerable Tasmanians.
The policy framework for the cost of living strategy is provided to enable a more structuredand strategic discussion across the political spectrum. The advice on action across the threekey areas for strategic intervention provides practical guidance on what can be doneimmediately as well as the medium to long term to respond to rising cost of living pressuresin Tasmania.
The time has come to question long established ways of doing business, rather thanaccepting that it’s just the way it is. Public sector reform to change the functionalorganisation of departments and reduce transaction costs of coordination might be required to reinvest savings in communities. There may be better ways of organising our concessionssystem to provide greater flexibility and control to cardholders, progressive taxationmeasures or changes to government fines to enable opportunities for variable chargingschemes and community service and volunteering payment options. As raised in the InterimReport there are options to ‘bundle up’ concessions with a ‘smart card’ system that couldgive people greater choice over how to best target their overall concessional value.
Given that cost of living pressures usually play out very locally and given that many strategiesare about access to better local services Tasmania could look in more detail at the option of new forms of localised planning and service delivery through local councils and thecommunity sector. All of these suggestions are likely to be controversial but no less so than
cutting public sector jobs, putting people on unemployment queues and greater pressure oncost of living and already stretched welfare organisations.
Since many of the matters raised in the Strategy have substantial policy, fiscal and legislativeimplications it is important that there is an informed public debate on these matters. AParliamentary Committee or alternative public mechanism could engage with the issues.
Tasmania is at a crossroads. The state can progress the suggested actions in this report anddo what it can to respond to current and future cost of living risks facing Tasmaniancommunities or it can accept the costs of inaction.
For Tasmanians, cost of living inaction may play out as greater levels of family breakdownresulting from an increased incidence of financial and social stress, corresponding healthimpacts and perhaps for some, longer periods in need of government income support. For governments, it may play out as greater demand on health, support and emergency services.Citizens may also feel that governments are not adequately responding to a major community concern and this may have electoral implications. For businesses it plays out asincreased operating costs, reduced levels of spending and consumer confidence and thepotential for increased job losses and levels of crime. For the community sector it is likely we will see an even greater strain on what are already overstretched social services. InTasmania the demand for many services such as housing, homelessness and family relationship services already exceeds the capacity for community sector organisations toprovide help.
We have already seen a dramatic escalation of emergency relief numbers in recent years. Aclear risk of inaction will be more and more people accessing emergency relief. More will
8/3/2019 Cost of Living Strategy
http://slidepdf.com/reader/full/cost-of-living-strategy 65/88
65
miss out or be left out. This will have effects on children and families with increasedchildhood disadvantage exacerbating intergenerational impacts.
Within our Westminster system of government those most important public policy functions and issues tend to have specific ministerial portfolios – for example health andeducation and justice. The lack of a central policy focus on cost of living means that noparticular Minister or department has overall responsibility for the cumulative impact of cost
of living risks on Tasmanians.
Given the importance of the issue for Tasmania and the substantial policy and fiscalimplications for the State Government in taking on a greater responsibility for managing(and not exacerbating) cost of living pressures, a Parliamentary Committee or alternativepublic mechanism could examine the issues outlined in action 13 and other associatedareas. This is no substitution however for immediate action for Tasmanian households andplaces facing the greatest cost of living risk.
8/3/2019 Cost of Living Strategy
http://slidepdf.com/reader/full/cost-of-living-strategy 66/88
Appendix 1
66
TASMANIAN COST OF LIVING STRATEGY TERMS OF REFERENCE
21 SEPTEMBER 2010
Background
Objectives
Reporting Requirements
Budget and Expenditure
Other Resources
Governance
Stakeholder management and communication
Related projects
Background
A Social Inclusion Strategy for Tasmania (2009)191 recognises that for Tasmania to have a fairer
future, all Tasmanians should have the opportunity to access the resources and relations
that make life healthy, happy and productive. This means making sure that no-one goes
without the basics of life such as access to food, shelter and security. The data underpinning
the Social Inclusion Strategy shows that not all people who live in Tasmania are able to
make ends meet, particularly those who live on Australian Government pensions and
allowances.
Many are finding it tough to stretch their incomes to provide the necessities
of life. When the family budget cannot stretch enough, research shows that people often go without food (especially expensive fresh fruit and
vegetables, electricity for periods of time, adequate heating, new clothing,
insurance, social contact, entertainment, transport, holidays, medical and
dental care).
A Social Inclusion Strategy for Tasmania
Research shows that the cost of basic items such as food, electricity, transport and fuel,
education and health items have risen considerably in recent years, and these increases have
impacted more heavily on low income households which spend proportionally more of
their income on the basics. It also shows that nothing undermines social inclusion more than financial hardship.
The Tasmanian Government’s preliminary response to the Social Inclusion Strategy included
immediate action to help Tasmanians meet the basics through food security, emergency
relief and micro finance; increasing the capacity of individuals and organisations through
micro-credit and the development of social enterprise in Tasmania; improving access to
affordable transport through the Cars for Communities program; and building supportive
networks and community capacity through volunteering, social infrastructure and
community grants.
191 Adams, D.A. 2009. A Social Inclusion Strategy for Tasmania.
8/3/2019 Cost of Living Strategy
http://slidepdf.com/reader/full/cost-of-living-strategy 67/88
67
When the Social Inclusion Unit, Department of Premier and Cabinet (the Unit), consulted
with Tasmanian communities from November 2008 to February 2009 and again during
April and May 2010, a consistent concern raised by communities was having access to the
basics and addressing cost of living pressures. Community concerns included access to
emergency relief, affordable nutritious food, transport, childcare, crisis accommodation,
private and public housing rental, cost of home heating and electricity, affordability of school
uniforms, financial literacy training, and affordability of sport and recreation for young
people.
The Tasmania Together benchmark on the cost of living for low income family households
indicates that the cost of essentials makes up almost 94% of their welfare entitlement,
leaving very little room for emergency expenses or savings192. A recent report by Anglicare
Tasmania193 found that households experiencing financial hardship had been unable to pay
their electricity or phone or gas bill, been unable to pay their rent or home loan, pawned or
sold something, gone without meals, been unable to heat their home, had the phone
disconnected or had the power turned off. The groups that experienced the greatest
difficulty were home buyers, people with two or more children, people aged 35-44, and
people on the Disability Support Pension. The underlying issues most associated with
hardship and financial difficulties were eviction, chronic debt and legal problems. For people
facing this pressure every day, it can be relentless and lead to physical and mental problems.
The Social Inclusion Strategy also noted social challenges specific to the Tasmanian context
which are relevant to cost of living, and are related to productivity factors such as the high
proportion of Tasmanians receiving government benefits, as well as experiencing
employment, education and skill challenges.
Emergency relief services are reporting that the number of people seeking assistance hasincreased, and now includes working people who previously have not accessed these
services. Increasingly, the accumulation of costs for a range of basic goods and services is
pushing people into financial crisis. There is concern that the personal, family and
community resources that help people cope with unanticipated shocks in life, are
increasingly insufficient for individuals and families.
As part of the 2010-11 Budget, the Government has renewed its commitment to
supporting the most isolated and disadvantaged Tasmanians by funding the development of
a Cost of Living Strategy for Tasmania.
Objectives
The objectives of the Cost of Living Strategy are to:
1.1 Provide an accurate picture of cost of living in Tasmania, including productivity challenges
in the Tasmanian context, jurisdictional comparisons of cost of living data, and analysis
of the distribution of cost of living pressures experienced by various income groups,
192 Tasmania Together Indicator 1.1 ‘The cost of food, electricity, housing, transport and health as a proportion of incomefor low income households’, see www.ttbenchmarks.com.au 193 Flanagan, K. 2009. Hard Times: Tasmanians in Financial Crisis, Anglicare Tasmania.
8/3/2019 Cost of Living Strategy
http://slidepdf.com/reader/full/cost-of-living-strategy 68/88
68
population groups and household types as well as places at risk of social exclusion in
Tasmania.
The Cost of Living Strategy will:
develop an evidence base of relevant data including consumer price index data,housing price data, retail price data, pensioner and living cost indices, income data, the Tasmania Together benchmark on cost of living, and qualitative research about
the experience of income groups, population groups, household types and places that struggle to meet cost of living pressures; and
identify the capacity of various income groups, population groups, household typesand places who are disproportionately impacted by certain changes in prices of goods and services, and as a result are ‘falling behind’.
1.2 Identify current activity, resources and options to address cost of living pressures
experienced by various income groups, population groups, household types and places
at risk of social exclusion in Tasmania.
The Cost of Living Strategy will:recognise policy levers outside the control of the Tasmanian Government , inparticular the role of the Australian Government in setting payment levels for pensions and allowances as well as marginal/effective taxation rates; and
outline the range of current policy responses being implemented by theTasmanian Government that help alleviate cost of living pressures for Tasmaniansat risk of social exclusion, such as legislative and regulatory arrangements, theeffectiveness of concessions policy, and in-kind assistance provided by theGovernment; and
identify policy options for the Government, as well as individual, market and
community responses appropriate to the Tasmanian context.
Reporting Requirements
The Social Inclusion Commissioner, Professor David Adams, will report to the
Tasmanian Government on the Cost of Living Strategy by June 2011.
Budget & Expenditure
The 2010-11 Budget allocated $75 000 to the Department of Premier and Cabinet
(DPAC)’s Social Inclusion Unit to deliver the Cost of Living Str ategy. The allocation will be
used for:
technical consultancies required to help meet the objectives of the cost of livingstrategy;
administrative costs associated with the Cost of Living Expert Advisory Group and the Cost of Living Interagency Working Group; and
printing the report and promotional material.
Other Resources
An Australian Bureau of Statistics (ABS) officer will be seconded to the Social Inclusion Unit
to develop the evidence base of relevant data as per Objective 2.2, in particular the cross-
jurisdictional analysis of cost of living data, the drivers for cost of living in Tasmania, andemerging trends in cost of living.
8/3/2019 Cost of Living Strategy
http://slidepdf.com/reader/full/cost-of-living-strategy 69/88
69
Staff from the Social Inclusion Unit, with input from other members of the Cost of Living
Interagency Working Group, will undertake the analysis of:
policy context and policy options for the Tasmanian Government as per objective2.3; and
individual, market and community actions.
Governance
.The Premier, David Bartlett, has appointed Professor David Adams, Social Inclusion
Commissioner, to lead the development of the Cost of Living Strategy.
Professor Adams will Chair the Cost of Living Expert Advisory Group in his role as the
Social Inclusion Commissioner for Tasmania. Professor Adams will also provide briefings asrequired on the Cost of Living Strategy to Members of Parliament and State Government
Heads of Agency.
The role of the Expert Advisory Group will be to oversight the development of, and
endorse, the Tasmanian Cost of Living Strategy. The Expert Advisory Group will ensure the
Cost of Living Strategy addresses all the objectives of the Terms of Reference; provide the
Social Inclusion Unit with guidance on cost of living issues arising during the development of
the Strategy; reconcile differences in opinion and approach that may emerge.
The Expert Advisory Group shall meet as often as required, at the discretion of the Chair.
It will comprise up to five members with high level expertise in economics and cost of livingresearch and analysis.
Premier
Social Inclusion Unit, DPAC
Interagency Working Group
Treasury
DPAC
Other relevant stategovernment agencies
Social Inclusion Commissioner Chair, Cost of Living
Expert Advisory Group
Cost of Living
Expert Advisory Group
Deputy Secretary
8/3/2019 Cost of Living Strategy
http://slidepdf.com/reader/full/cost-of-living-strategy 70/88
70
The Social Inclusion Unit, at the direction of the Social Inclusion Commissioner and the
Expert Advisory Group, will be responsible for producing the Cost of Living Strategy. The
Unit will manage the budget expenditure and other resources necessary to produce the
Strategy. It will also provide the Secretariat support to the Expert Advisory Group,
coordinate the Cost of Living Interagency Working Group, and manage any consultancies
associated with developing the Strategy. The Unit will also keep DPAC’s Deputy Secretary
Policy informed of progress.
The Cost of Living Interagency Working Group will undertake the components of work
required to meet the objectives of the Terms of Reference. The Working Group will
comprise officers from the Department of Treasury and Finance (Treasury), DPAC, and
other relevant State Government agencies.
The Advisory Group and Working Group will be time and task specific, concluding by June
2011.
Stakeholder Management & Communication
The Interagency Working Group will develop a communications strategy that identifies key stakeholders and outlines a framework through which to engage with the stakeholders.
Related Projects
Review of Electricity Pricing in Tasmania
Cross-Party State Taxation Review
Water and sewerage reforms
Tasmanians Concession Guide
Tasmanian Food Security Council
Community Development Finance Fund
Tasmanian Homelessness Plan
Community Capacity Building Grants Program
Tasmanian Economic Development Plan
Tasmanian Innovation Strategy
8/3/2019 Cost of Living Strategy
http://slidepdf.com/reader/full/cost-of-living-strategy 71/88
Appendix 2
71
SUPPORTING MAPS
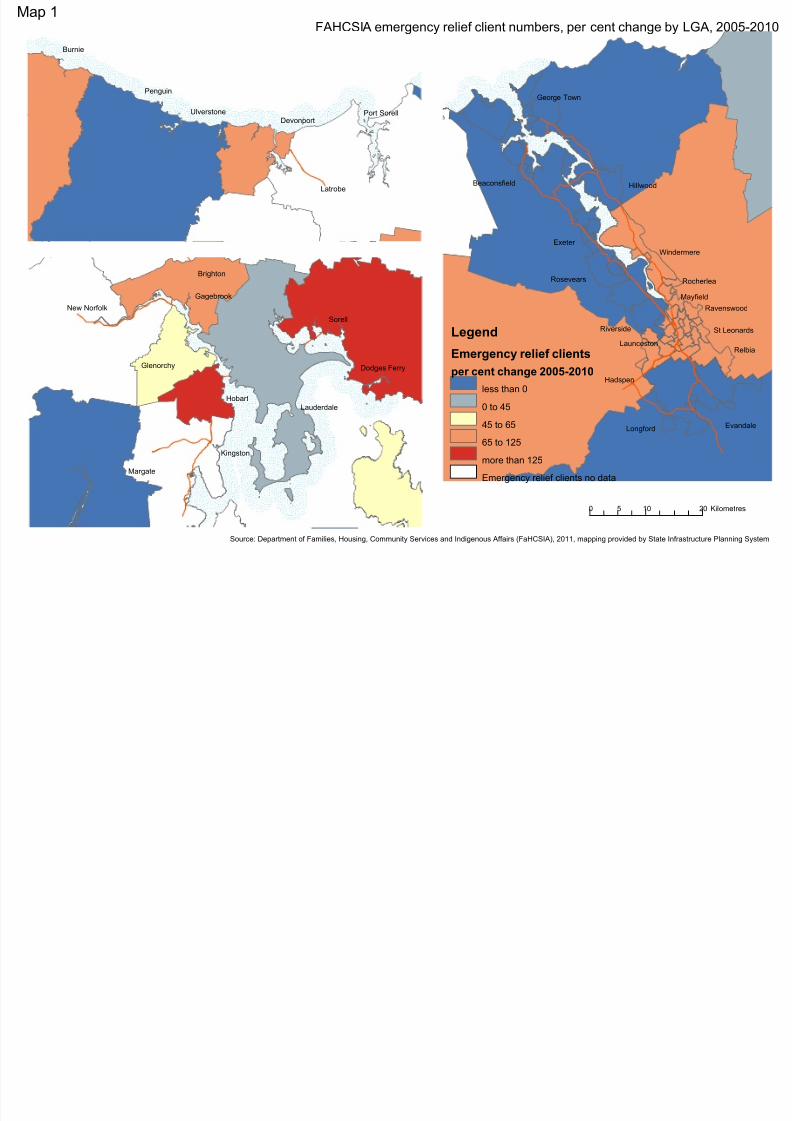
8/3/2019 Cost of Living Strategy
http://slidepdf.com/reader/full/cost-of-living-strategy 72/88
Relbia
Exeter
Hadspen
Mayfield
Hillwood
Longford Evandale
Rosevears
Riverside
Rocherlea
Launceston
Windermere
Ravenswood
St Leonards
George Town
Beaconsfield
Burnie
Latrobe
Penguin
Devonport
Ulverstone Port Sorell
Sorell
Hobart
Margate
Brighton
Kingston
Gagebrook
Glenorchy
Lauderdale
New Norfolk
Dodges Ferry
FAHCSIA emergency relief client numbers, per cent change by LGA, 2005-2010
0 10 205 Kilometres
Source: Department of Families, Housing, Community Services and Indigenous Affairs (FaHCSIA), 2011, mapping provided by State Infrastructure Planning System
Legend
Emergency relief clients
per cent change 2005-2010
less than 00 to 45
45 to 65
65 to 125
more than 125
Emergency relief clients no data
Map 1
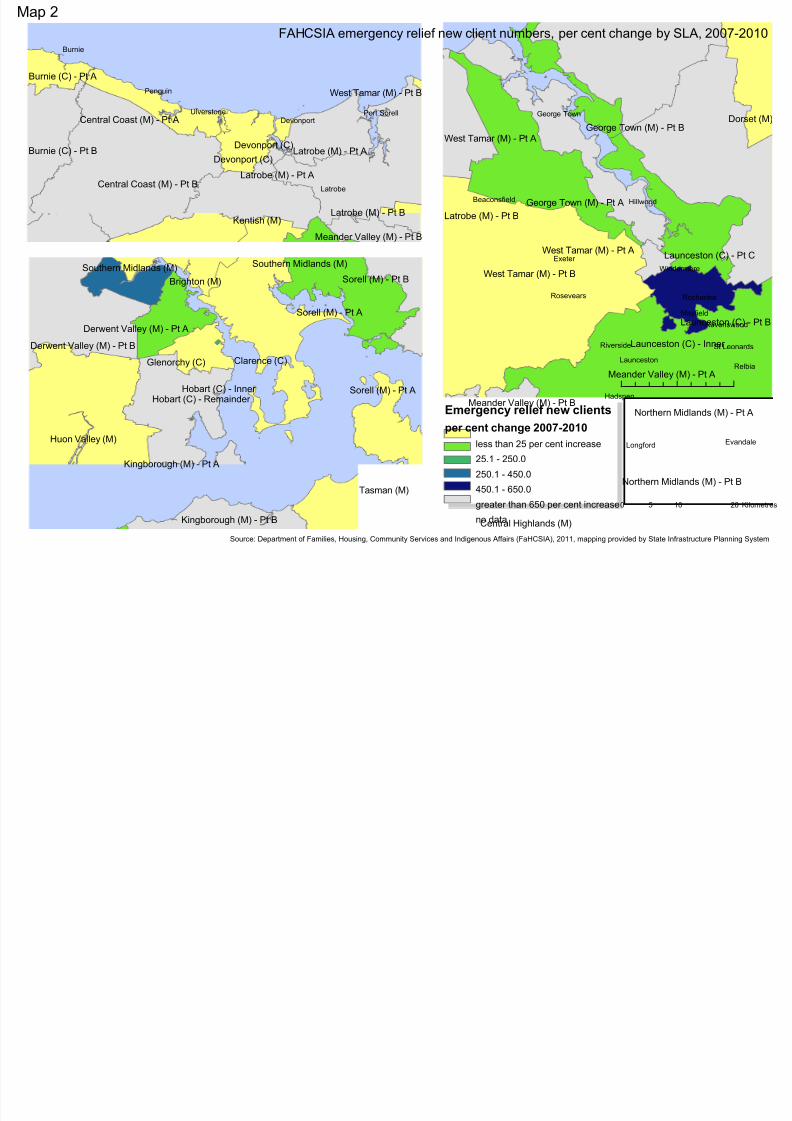
8/3/2019 Cost of Living Strategy
http://slidepdf.com/reader/full/cost-of-living-strategy 73/88
Meander Valley (M) - Pt B
Launceston (C) - Pt C
Dorset (M)George Town (M) - Pt B
Northern Midlands (M) - Pt B
West Tamar (M) - Pt B
Launceston (C) - Pt B
West Tamar (M) - Pt A
Latrobe (M) - Pt B
Northern Midlands (M) - Pt A
George Town (M) - Pt A
West Tamar (M) - Pt A
Meander Valley (M) - Pt A
Central Highlands (M)
Launceston (C) - Inner
Relbia
Hadspen
Hillwood
Longford Evandale
Rosevears Rocherlea
Launceston
Windermere
George Town
Beaconsfield
Exeter
Mayfield
Riverside
Ravenswood
St Leonards
Central Coast (M) - Pt B
Latrobe (M) - Pt BKentish (M)
Latrobe (M) - Pt ABurnie (C) - Pt BDevonport (C)
Central Coast (M) - Pt A
Burnie (C) - Pt A
Devonport (C)
Latrobe (M) - Pt A
Meander Valley (M) - Pt B
West Tamar (M) - Pt B
Burnie
Latrobe
Penguin
Devonport
Ulverstone Port Sorell
Clarence (C)
Huon Valley (M)
Sorell (M) - Pt A
Derwent Valley (M) - Pt B
Brighton (M)
Tasman (M)
Sorell (M) - Pt B
Glenorchy (C)
Kingborough (M) - Pt A
Derwent Valley (M) - Pt A
Hobart (C) - Remainder
Southern Midlands (M) Southern Midlands (M)
Sorell (M) - Pt A
Kingborough (M) - Pt B
Hobart (C) - Inner
FAHCSIA emergency relief new client numbers, per cent change by SLA, 2007-2010
0 10 205 Kilometres
Source: Department of Families, Housing, Community Services and Indigenous Affairs (FaHCSIA), 2011, mapping provided by State Infrastructure Planning System
Emergency relief new clients
per cent change 2007-2010
less than 25 per cent increase
25.1 - 250.0
250.1 - 450.0
450.1 - 650.0
greater than 650 per cent increase
no data
Map 2

8/3/2019 Cost of Living Strategy
http://slidepdf.com/reader/full/cost-of-living-strategy 74/88
West Coast (M)
Central Highlands (M)
Huon Valley (M)
Dorset (M)
Circular Head (M)
Northern Midlands (M)
Derwent Valley (M)
Break O'Day (M)
Meander Valley (M)
Waratah/Wynyard (M)
Southern Midlands (M)
Flinders (M)
Kentish (M)
Glamorgan/Spring Bay (M)
Launceston (C)
Sorell (M)
Burnie (C)
Tasman (M)
Central Coast (M)
Latrobe (M)West Tamar (M)
George Town (M)
Clarence (C)
Kingborough (M)
Brighton (M)
Glenorchy (C)Hobart (C)
Devonport (C)
King Island (M)
0 25 50 7512.5
Kilometres
Household composition, 2011
Legend
Single parents, one child
per cent of households
less than 1 %
1 - 2 %
2 - 3 %
3 - 4 %
4 - 5 %
more than 5 %
West Coast (M)
Central Highlands (M)
Huon Valley (M)
Dorset (M)
Circular Head (M)
Northern Midlands (M)
Derwent Valley (M)
Break O'Day (M)
Meander Valley (M)
Waratah/Wynyard (M)
Southern Midlands (M)
Flinders (M)
Kentish (M)
Glamorgan/Spring Bay (M)
Launceston (C)
Sorell (M)
Burnie (C)
Tasman (M)
Central Coast (M)
Latrobe (M)West Tamar (M)
George Town (M)
Clarence (C)
Kingborough (M)
Brighton (M)
Glenorchy (C)Hobart (C)
Devonport (C)
Source: NATSEM 2011, maps prepared by SIU through S IPS
King Island (M)
Legend
Single parents, two children
per cent of households
less than 2 %
2 - 3 %
3 - 4 %
4 - 5 %
5 - 6 %
more than 6 %
Single parent householdswith one dependant child
Single parent householdswith two dependant children
Map 3
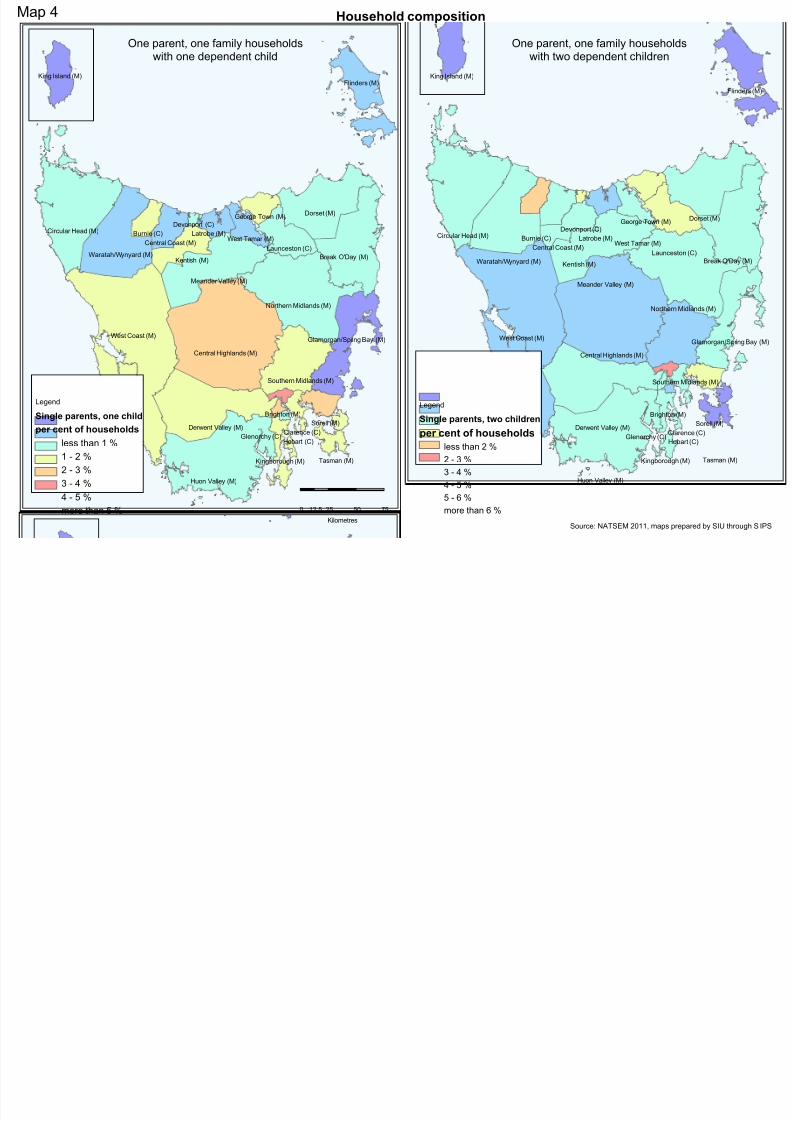
8/3/2019 Cost of Living Strategy
http://slidepdf.com/reader/full/cost-of-living-strategy 75/88
West Coast (M)
Central Highlands (M)
Huon Valley (M)
Dorset (M)
Circular Head (M)
Northern Midlands (M)
Derwent Valley (M)
Break O'Day (M)
Meander Valley (M)
Waratah/Wynyard (M)
Southern Midlands (M)
Flinders (M)
Kentish (M)
Glamorgan/Spring Bay (M)
Launceston (C)
Sorell (M)
Burnie (C)
Tasman (M)
Central Coast (M)
Latrobe (M)West Tamar (M)
George Town (M)
Clarence (C)
Kingborough (M)
Brighton (M)
Glenorchy (C)Hobart (C)
Devonport (C)
King Island (M)
0 25 50 7512.5
Kilometres
Household composition
Legend
Single parents, one child
per cent of households
less than 1 %
1 - 2 %
2 - 3 %
3 - 4 %
4 - 5 %
more than 5 %
West Coast (M)
Central Highlands (M)
Huon Valley (M)
Dorset (M)
Circular Head (M)
Northern Midlands (M)
Derwent Valley (M)
Break O'Day (M)
Meander Valley (M)
Waratah/Wynyard (M)
Southern Midlands (M)
Flinders (M)
Kentish (M)
Glamorgan/Spring Bay (M)
Launceston (C)
Sorell (M)
Burnie (C)
Tasman (M)
Central Coast (M)
Latrobe (M)West Tamar (M)
George Town (M)
Clarence (C)
Kingborough (M)
Brighton (M)
Glenorchy (C)Hobart (C)
Devonport (C)
Source: NATSEM 2011, maps prepared by SIU through S IPS
King Island (M)
One parent, one family householdswith one dependent child
Legend
Single parents, two children
per cent of households
less than 2 %
2 - 3 %
3 - 4 %
4 - 5 %
5 - 6 %
more than 6 %
One parent, one family householdswith two dependent children
Map 4
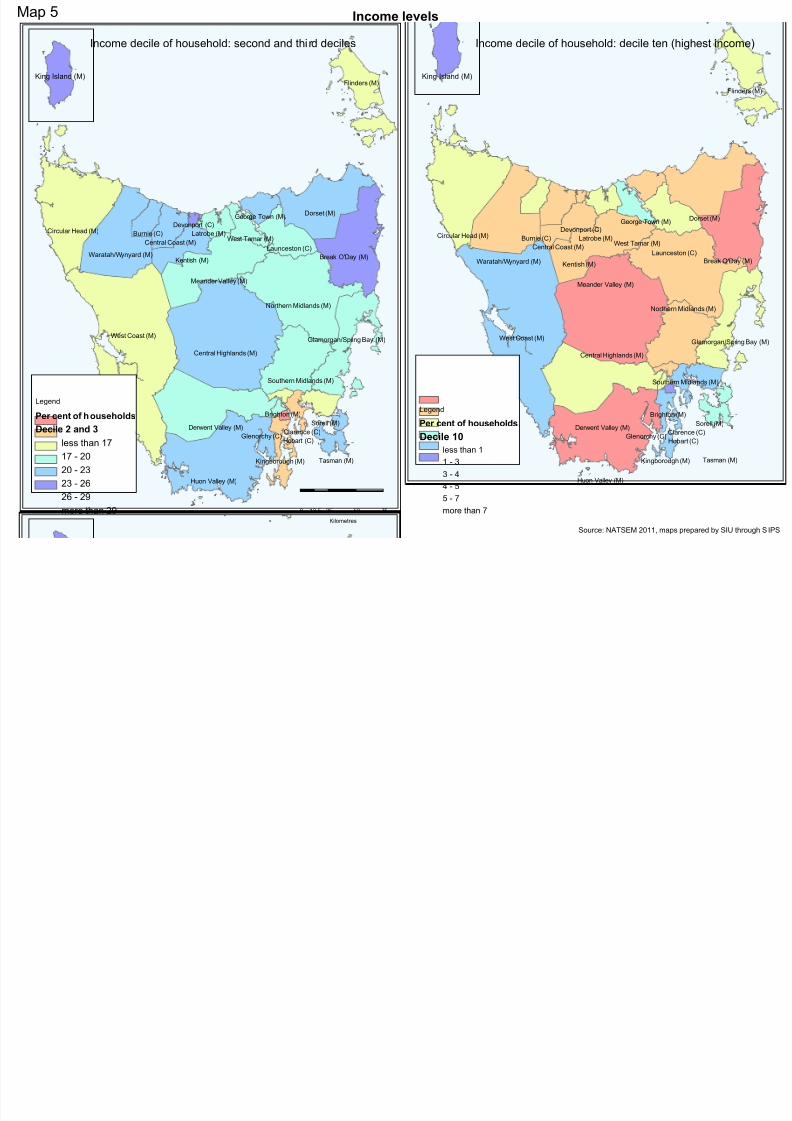
8/3/2019 Cost of Living Strategy
http://slidepdf.com/reader/full/cost-of-living-strategy 76/88
West Coast (M)
Central Highlands (M)
Huon Valley (M)
Dorset (M)
Circular Head (M)
Northern Midlands (M)
Derwent Valley (M)
Break O'Day (M)
Meander Valley (M)
Waratah/Wynyard (M)
Southern Midlands (M)
Flinders (M)
Kentish (M)
Glamorgan/Spring Bay (M)
Launceston (C)
Sorell (M)
Burnie (C)
Tasman (M)
Central Coast (M)
Latrobe (M)West Tamar (M)
George Town (M)
Clarence (C)
Kingborough (M)
Brighton (M)
Glenorchy (C)Hobart (C)
Devonport (C)
King Island (M)
0 25 50 7512.5
Kilometres
Income levels
Legend
Per cent of households
Decile 2 and 3
less than 17
17 - 20
20 - 23
23 - 26
26 - 29
more than 29
West Coast (M)
Central Highlands (M)
Huon Valley (M)
Dorset (M)
Circular Head (M)
Northern Midlands (M)
Derwent Valley (M)
Break O'Day (M)
Meander Valley (M)
Waratah/Wynyard (M)
Southern Midlands (M)
Flinders (M)
Kentish (M)
Glamorgan/Spring Bay (M)
Launceston (C)
Sorell (M)
Burnie (C)
Tasman (M)
Central Coast (M)
Latrobe (M)West Tamar (M)
George Town (M)
Clarence (C)
Kingborough (M)
Brighton (M)
Glenorchy (C)Hobart (C)
Devonport (C)
Source: NATSEM 2011, maps prepared by SIU through S IPS
King Island (M)
Income decile of household: second and thi rd deciles Income decile of household: decile ten (highest income)
Legend
Per cent of households
Decile 10
less than 1
1 - 3
3 - 4
4 - 5
5 - 7
more than 7
Map 5
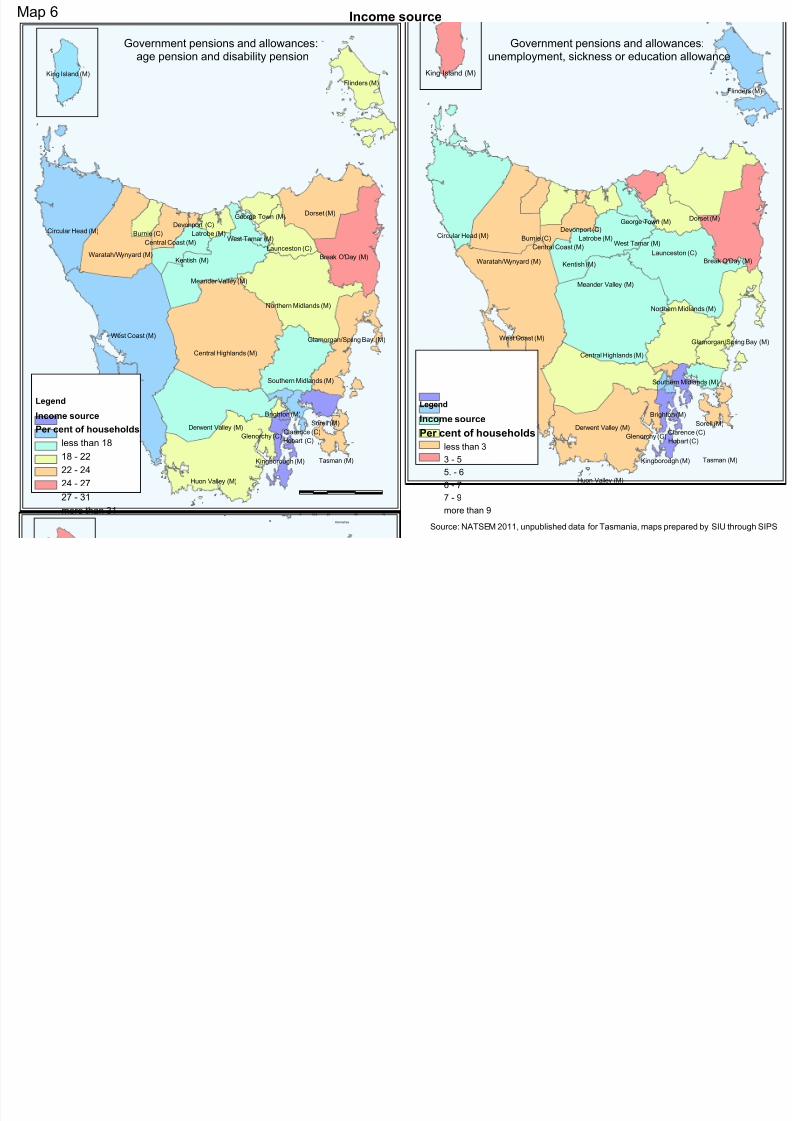
8/3/2019 Cost of Living Strategy
http://slidepdf.com/reader/full/cost-of-living-strategy 77/88
West Coast (M)
Central Highlands (M)
Huon Valley (M)
Dorset (M)
Circular Head (M)
Northern Midlands (M)
Derwent Valley (M)
Break O'Day (M)
Meander Valley (M)
Waratah/Wynyard (M)
Southern Midlands (M)
Flinders (M)
Kentish (M)
Glamorgan/Spring Bay (M)
Launceston (C)
Sorell (M)
Burnie (C)
Tasman (M)
Central Coast (M)
Latrobe (M)West Tamar (M)
George Town (M)
Clarence (C)
Kingborough (M)
Brighton (M)
Glenorchy (C)Hobart (C)
Devonport (C)
King Island (M)
0 25 50 7512.5
Kilometres
Income source
Legend
Income source
Per cent of households
less than 18
18 - 22
22 - 24
24 - 27
27 - 31
more than 31
West Coast (M)
Central Highlands (M)
Huon Valley (M)
Dorset (M)
Circular Head (M)
Northern Midlands (M)
Derwent Valley (M)
Break O'Day (M)
Meander Valley (M)
Waratah/Wynyard (M)
Southern Midlands (M)
Flinders (M)
Kentish (M)
Glamorgan/Spring Bay (M)
Launceston (C)
Sorell (M)
Burnie (C)
Tasman (M)
Central Coast (M)
Latrobe (M)West Tamar (M)
George Town (M)
Clarence (C)
Kingborough (M)
Brighton (M)
Glenorchy (C)Hobart (C)
Devonport (C)
Source: NATSEM 2011, unpublished data for Tasmania, maps prepared by SIU through SIPS
King Island (M)
Government pensions and allowances:age pension and disability pension
Government pensions and allowances:unemployment, sickness or education allowance
Legend
Income source
Per cent of households
less than 3
3 - 5
5. - 6
6 - 7
7 - 9
more than 9
Map 6
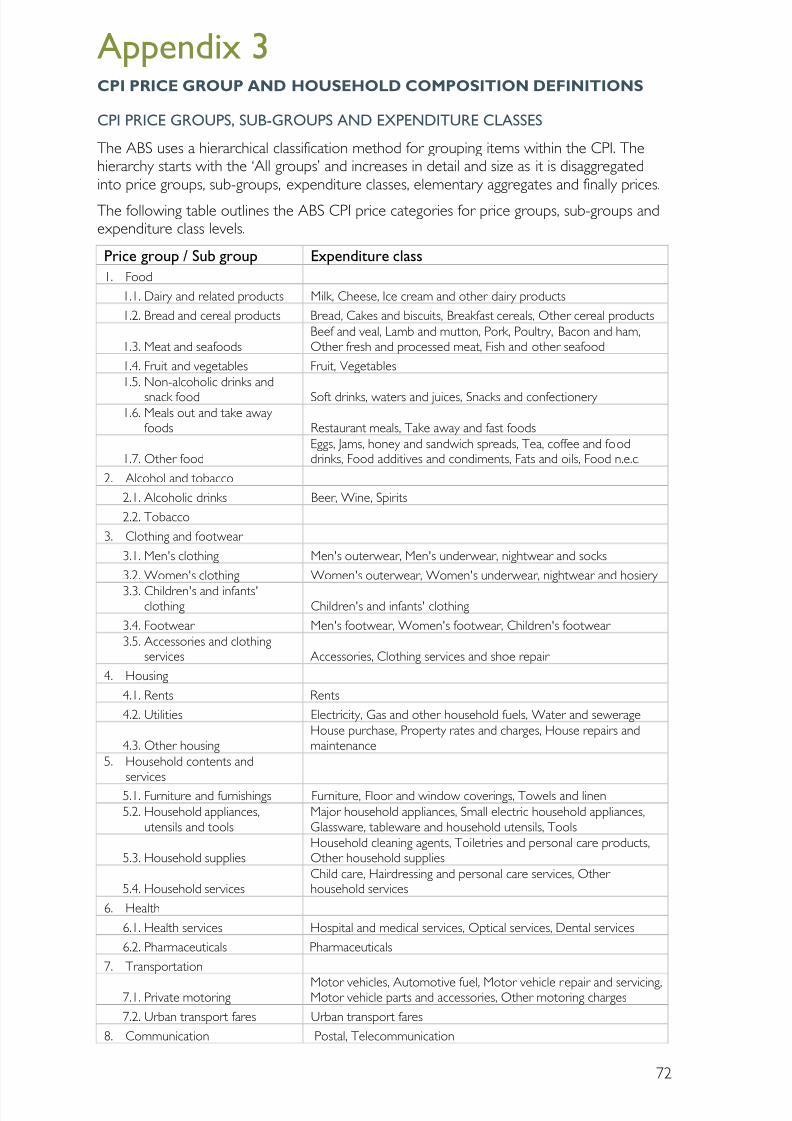
8/3/2019 Cost of Living Strategy
http://slidepdf.com/reader/full/cost-of-living-strategy 78/88
Appendix 3
72
CPI PRICE GROUP AND HOUSEHOLD COMPOSITION DEFINITIONS
CPI PRICE GROUPS, SUB-GROUPS AND EXPENDITURE CLASSES
The ABS uses a hierarchical classification method for grouping items within the CPI. Thehierarchy starts with the ‘All groups’ and increases in detail and size as it is disaggregatedinto price groups, sub-groups, expenditure classes, elementary aggregates and finally prices.
The following table outlines the ABS CPI price categories for price groups, sub-groups andexpenditure class levels.
Price group / Sub group Expenditure class
1. Food
1.1. Dairy and related products Milk, Cheese, Ice cream and other dairy products
1.2. Bread and cereal products Bread, Cakes and biscuits, Breakfast cereals, Other cereal products
1.3. Meat and seafoodsBeef and veal, Lamb and mutton, Pork, Poultry, Bacon and ham,Other fresh and processed meat, Fish and other seafood
1.4. Fruit and vegetables Fruit, Vegetables1.5. Non-alcoholic drinks and
snack food Soft drinks, waters and juices, Snacks and confectionery 1.6. Meals out and take away
foods Restaurant meals, Take away and fast foods
1.7. Other foodEggs, Jams, honey and sandwich spreads, Tea, coffee and fooddrinks, Food additives and condiments, Fats and oils, Food n.e.c.
2. Alcohol and tobacco
2.1. Alcoholic drinks Beer, Wine, Spirits
2.2. Tobacco
3. Clothing and footwear
3.1. Men's clothing Men's outerwear, Men's underwear, nightwear and socks
3.2. Women's clothing Women's outerwear, Women's underwear, nightwear and hosiery
3.3. Children's and infants'clothing Children's and infants' clothing
3.4. Footwear Men's footwear, Women's footwear, Children's footwear 3.5. Accessories and clothing
services Accessories, Clothing services and shoe repair
4. Housing
4.1. Rents Rents
4.2. Utilities Electricity, Gas and other household fuels, Water and sewerage
4.3. Other housingHouse purchase, Property rates and charges, House repairs andmaintenance
5. Household contents andservices
5.1. Furniture and furnishings Furniture, Floor and window coverings, Towels and linen5.2. Household appliances,
utensils and toolsMajor household appliances, Small electric household appliances,Glassware, tableware and household utensils, Tools
5.3. Household suppliesHousehold cleaning agents, Toiletries and personal care products,Other household supplies
5.4. Household servicesChild care, Hairdressing and personal care services, Other household services
6. Health
6.1. Health services Hospital and medical services, Optical services, Dental services
6.2. Pharmaceuticals Pharmaceuticals
7. Transportation
7.1. Private motoringMotor vehicles, Automotive fuel, Motor vehicle repair and servicing,Motor vehicle parts and accessories, Other motoring charges
7.2. Urban transport fares Urban transport fares
8. Communication Postal, Telecommunication
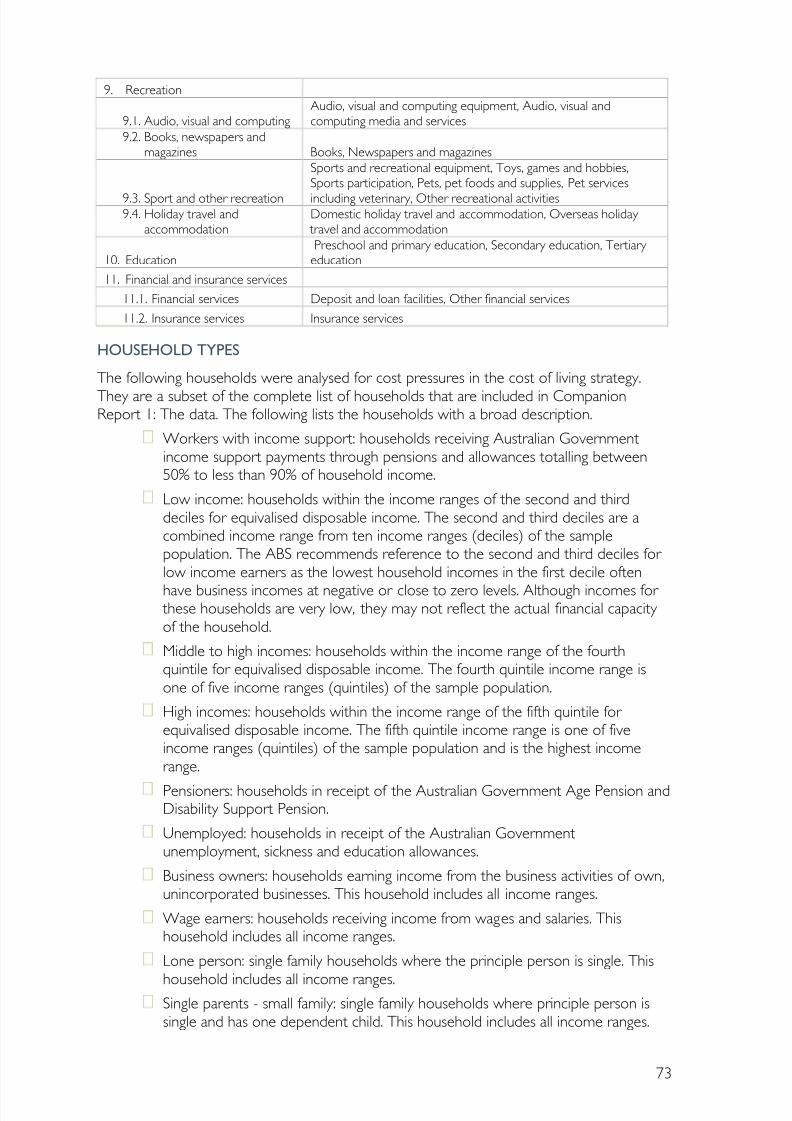
8/3/2019 Cost of Living Strategy
http://slidepdf.com/reader/full/cost-of-living-strategy 79/88
73
9. Recreation
9.1. Audio, visual and computingAudio, visual and computing equipment, Audio, visual andcomputing media and services
9.2. Books, newspapers andmagazines Books, Newspapers and magazines
9.3. Sport and other recreation
Sports and recreational equipment, Toys, games and hobbies,Sports participation, Pets, pet foods and supplies, Pet services
including veterinary, Other recreational activities9.4. Holiday travel and
accommodationDomestic holiday travel and accommodation, Overseas holiday travel and accommodation
10. EducationPreschool and primary education, Secondary education, Tertiary education
11. Financial and insurance services
11.1. Financial services Deposit and loan facilities, Other financial services
11.2. Insurance services Insurance services
HOUSEHOLD TYPES
The following households were analysed for cost pressures in the cost of living strategy.
They are a subset of the complete list of households that are included in CompanionReport 1: The data. The following lists the households with a broad description.
Workers with income support: households receiving Australian Governmentincome support payments through pensions and allowances totalling between50% to less than 90% of household income.
Low income: households within the income ranges of the second and thirddeciles for equivalised disposable income. The second and third deciles are acombined income range from ten income ranges (deciles) of the samplepopulation. The ABS recommends reference to the second and third deciles for low income earners as the lowest household incomes in the first decile often
have business incomes at negative or close to zero levels. Although incomes for these households are very low, they may not reflect the actual financial capacity of the household.
Middle to high incomes: households within the income range of the fourthquintile for equivalised disposable income. The fourth quintile income range isone of five income ranges (quintiles) of the sample population.
High incomes: households within the income range of the fifth quintile for equivalised disposable income. The fifth quintile income range is one of fiveincome ranges (quintiles) of the sample population and is the highest incomerange.
Pensioners: households in receipt of the Australian Government Age Pension andDisability Support Pension.
Unemployed: households in receipt of the Australian Governmentunemployment, sickness and education allowances.
Business owners: households earning income from the business activities of own,unincorporated businesses. This household includes all income ranges.
Wage earners: households receiving income from wages and salaries. Thishousehold includes all income ranges.
Lone person: single family households where the principle person is single. This
household includes all income ranges.Single parents - small family: single family households where principle person issingle and has one dependent child. This household includes all income ranges.
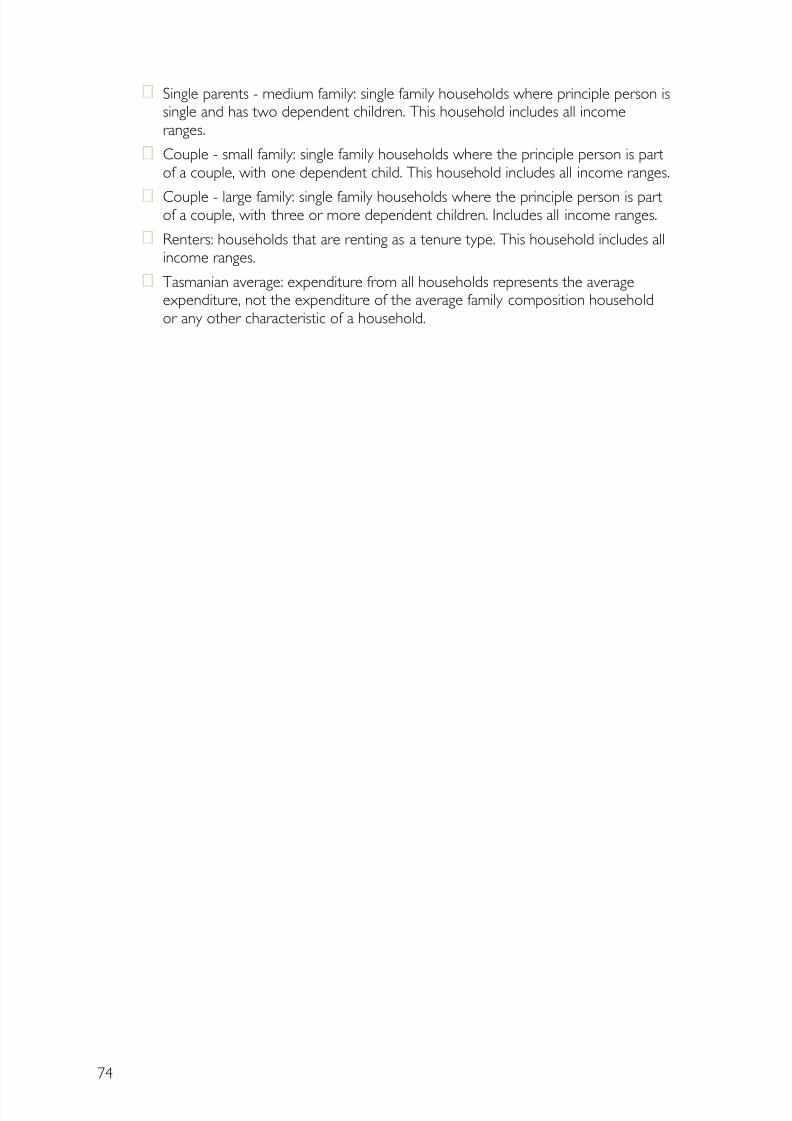
8/3/2019 Cost of Living Strategy
http://slidepdf.com/reader/full/cost-of-living-strategy 80/88
74
Single parents - medium family: single family households where principle person issingle and has two dependent children. This household includes all incomeranges.
Couple - small family: single family households where the principle person is partof a couple, with one dependent child. This household includes all income ranges.
Couple - large family: single family households where the principle person is partof a couple, with three or more dependent children. Includes all income ranges.
Renters: households that are renting as a tenure type. This household includes allincome ranges.
Tasmanian average: expenditure from all households represents the averageexpenditure, not the expenditure of the average family composition householdor any other characteristic of a household.
8/3/2019 Cost of Living Strategy
http://slidepdf.com/reader/full/cost-of-living-strategy 81/88
BIBLIOGRAPHY
75
ABC News Online, 2011 ‘Cost of living struggle deepens’ ABC News Online, online posting,4 August 2011, accessed 7 September 2011, <http://www.abc.net.au/news/2011-08-04/20110804-cost-of-living-struggle-deepens/2824500>.
Access Economics, 2008 The impact of the Global Financial Crisis on social services inAustralia, issues paper November 2008, accessed 7 September 2011,<http://catholicsocialservices.org.au/files/2008-11-issues-paper.pdf >.
Adams, D, 2011 Cost of Living in Tasmania: Interim Report, February 2011, accessed7 September 2011,http://www.dpac.tas.gov.au/divisions/siu/strategy/cost_of_living/cost_of_living_in_tasmania_- _interim_report
Adams, D, 2009 A Social Inclusion Strategy for Tasmania . Hobart: Department of Premier andCabinet.
Ahsan, N, 2007 Social Networks Make a Difference: Family Economic Success. Baltimore:Annie E. Casey Foundation.
Arashiro, Z, 2011 Money matters in times of change: Financial vulnerability through the lifecourse. Brunswick: Brotherhood of St Laurence.
Aurora Energy, 2011. Final Revised Retail Tariff Strategy . Aurora Energy: Hobart, pages 11 to24.
Australia. Bureau of Infrastructure, Transport and Regional Economics, 2008 A regionaleconomy: a case study of Tasmania, Report 116. Canberra: Commonwealth of Australia.
Australia. 1945, Full Employment in Australia, Canberra: Australian Government Printer.
Australia. Department of Families, Housing, Community Services and Indigenous Affairs,2011. Productivity Commission’s Inquiry into a national disability long -term care and support scheme, National Disability Insurance Scheme Fact Sheet accessed at<http://www.fahcsia.gov.au/sa/disability/progserv/govtint/Documents/ndis_factsheet.pdf>
Australia. Department of Social Security 1988 ‘History of Pensions and other benefits inAustralia’, in Year Book Australia 1988. Cat No 1301.0, Canberra: ABS, accessed8 September 2011,<http://www.abs.gov.au/ausstats/[email protected]/94713ad445ff1425ca25682000192af2/8e72c4526a94aaedca2569de00296978!OpenDocument>.
Australia. Industry Commission, 1997 Community Service Obligations: Policies and practices of Australian governments. Information Paper, accessed 7 September 2011,<http://www.pc.gov.au/__data/assets/pdf_file/0003/8886/cso.pdf >.
Australia. Parliament. House of Representatives. Standing Committee on Family andCommunity Affairs 1997 Concessions: Who benefits? , accessed 7 September 2011,<http://www.aph.gov.au/house/committee/fca/Concard/Concardindex.htm>.
Australia. Parliament. House of Representatives Standing Committee on Economics, 2010Inquiry into raising the productivity growth rate in the Australian economy , Canberra:Commonwealth of Australia.
Australia. Productivity Commission 2008 Review of Australia’s consumer policy framework ,Productivity Commission Inquiry Report, Canberra: Commonwealth of Australia.
8/3/2019 Cost of Living Strategy
http://slidepdf.com/reader/full/cost-of-living-strategy 82/88
76
Australia. Australian Securities and Investments Commission, 2011 National financial literacy strategy , Report 229. Commonwealth of Australia: ASIC, accessed 8 September 2011<http://www.financialliteracy.gov.au/media/218312/national-financial-literacy-strategy.pdf >.
Australia. Steering Committee on National Performance Monitoring of Government TradingEnterprises, 1994 Community Service Obligations: Some definitional, costing and funding issues,accessed 6 September 2011,<http://www.pc.gov.au/__data/assets/pdf_file/0004/8959/cso.pdf >.
Australia. Department of Treasury, 2010 Australia’s Future Tax System, Parkes, A.C.T:Department of Treasury.
Australian Bureau of Statistics 2011, Analytical Living Cost Indexes for Selected AustralianHousehold Types, Dec 2010, Cat No 6463.0, Canberra: ABS.
Australian Bureau of Statistics, 2010 Australian Social Trends, Dec 2009, Work Data Cube:Table 2.6, Cat No 4102.0, Canberra: ABS.
Australian Bureau of Statistics, 2010 Australian Social Trends, Mar 2010, 'Health and socio-economic disadvantage' Cat No 4102.0, Canberra: ABS.
Australian Bureau of Statistics, 2008 Australian Social Trends, Data Cube, Family andCommunity Indicators, Cat No 4102.0, Canberra: ABS.
Australian Bureau of Statistics, 2011 Family Characteristics, Australia, 2009-10, ABS, Cat.4442.0
Australian Bureau of Statistics, 2007 General Social Survey, Australia, 2006, Cat No 4159.0,Canberra: ABS.
Australian Bureau of Statistics General Social Survey, Tasmania, 2006, Table 20, Cat No4159.6.55.001, Canberra: ABS.
Australian Bureau of Statistics, 2006 A Guide to the Consumer Price Index, 15th Series, 2005,Cat No 6440.0, Canberra: ABS.
Australian Bureau of Statistics 2010 Health Services: Patient Experiences in Australia, 2009;Barriers to selected health services Data Cube: Tables 2.1, 2.2 and 2.3 Cat No 4839.0.55.001,Canberra: ABS.
Australian Bureau of Statistics 2006 Household Expenditure Survey, Australia: Summary of Results, 2003-04 (Reissue), Cat No 6530.0, Canberra: ABS.
Australian Bureau of Statistics 2009 Household Income and Income Distribution, Australia,2007-08, Cat No 6523.0, Canberra: ABS.
Australian Bureau of Statistics 2011 Labour Force, Australia, Aug 2011, Cat No 6202.0,Canberra: ABS.
Australian Bureau of Statistics 2010 Measures of Australia’s Progress, Household EconomicWellbeing , Cat No 1370.0, Canberra: ABS.
Australian Bureau of Statistics, 2007-08 Regional Wage and Salary Earner Statistics, Australia,Cat No 5673.0.55.003, Canberra: ABS.
Australian Bureau of Statistics 2011 ‘Tasmanian State and Regional Indicators’ , sourced fromLabour Force, Australia Cat No 6202.0, Canberra: ABS.
8/3/2019 Cost of Living Strategy
http://slidepdf.com/reader/full/cost-of-living-strategy 83/88
77
Australian Bureau of Statistics 2011 Underemployed Workers, Australia, Sep 2010: Table 8Cat No 6265.0, Canberra: ABS.
Australian Council of Social Service (ACOSS) 2008, Who is missing out? ACOSS InformationPaper, December 2008 accessed 8 September 2011<http://acoss.org.au/images/uploads/5389__Info_Paper_missing_out.pdf >.
Ben-Galim, D, and Lanning, T, 2010 Strengths against shocks: low-income families and debt, London: Institute for Public Policy Research.
Billing and payment preferences in Australian residential supply, Market Report Finder 2011,accessed 18 July 2011<http://marketreportfinder.com/report/industry/energy_natural_resources/billing_and_payment_preferences_in_australian_residential_supply15c_5_2e.html>.
Brighton Better Services Together Steering Committee, [2006] Brighton Better Services Together: report on provision of services for children, young people and families living in theBrighton municipality , Brighton Better Services Together (Tas.)
Brotherhood of St Laurence and ANZ, 2009 Progress Loans towards affordable credit for low income Australians, report accessed 8 September 2011,<http://www.bsl.org.au/pdfs/Vawser_Progress_Loans_towards_affordable_credit_for_low-income_Australians_2009.pdf >.
Brown, D, 2011, ‘Bid to smooth out bills’, posted 9 March 2011, The Mercury Online,accessed on 18 July 2011<http://prelive.themercury.com.au/article/2011/03/09/213015_tasmania-news.html>.
Castles, F, in Wilson, J, J. Thomson and A. McMahon, eds. 1996, The Australian welfare state:key documents and themes.
Citibank, January 2011, Media Release ‘GFC Teaches Australians a Few Valuable lessons: resultsfrom the latest Citi Fin-Q Survey’ , accessed 7 September 2011<http://www.citi.com.au/citigroup/pdf/Citi_Fin_Q_2009_launch.pdf >.
Citibank, February 2011, Media Release ‘ Australians less optimistic about financial future:lowest score for financial well-being in Asia Pacific’ , accessed 7 September 2011http://www.citi.com.au/citigroup/pdf/Citi_Fin_Q_Survey_Overall_Findings.pdf
Commonwealth Bank of Australia, 2010 Viewpoint: Economic Vitality Report , Issue 2.Commonwealth Bank of Australia, accessed 8 September 2011<http://www.commbank.com.au/about-us/our-company/viewpoint/pdfs/Viewpoint_Issue_2.pdf >.
Commonwealth Bank of Australia, 2011 Economic Vitality Report , Issue 3, accessed 8September 2011 http://www.commbank.com.au/about-us/our-company/viewpoint/pdfs/Viewpoint-Issue-Three.pdf >.
Community Inclusion Workers, 2011 Community consultation report for the Social InclusionUnit, Department of Premier and Cabinet , companion reporthttp://www.dpac.tas.gov.au/divisions/siu/strategy/cost_of_living
Connolly C, Georgouras M, Hems L and Wolfson L, 2011 Measuring Financial Exclusion in Australia, Centre for Social Impact (CSI) – University of New South Wales, for NationalAustralia Bank accessed 8 September 2011<http://www.csi.edu.au/assets/assetdoc/3c1698bd3334ed55/NAB-Financial-Exclusion-
Report_Final.pdf >.
8/3/2019 Cost of Living Strategy
http://slidepdf.com/reader/full/cost-of-living-strategy 84/88
78
“Consumer cooperative” Wikipedia, accessed 8 September 2011<http://en.wikipedia.org/wiki/Consumer_cooperative>.
Consumer Financial Education Body, 2010 Transforming Financial Behaviour: A summary .Report, accessed 8 September 2011http://www.fairbanking.org.uk/20100709_transforming_financial_behaviour_summary.pdf .
Cooperatives Australia, 2009 Cooperatives Australia statement: Public policy and co-operatives.Paper. Accessed 8 September 2011 <http://www.cooperativeswa.org.au/Co-operatives%20Australia%20Statement.pdf >.
Dare, M, Kimber, J and Schirmer, J, 2011 Tasmanian Drought Evaluation Project , Hobart:University of Tasmania and JS Consulting.
Demographic Change Advisory Council, 2008 Demographic change in Tasmania: Strategiesfor addressing challenges and opportunities. Hobart: Department of Treasury and Finance.
Demographic Change Advisory Council, 2008 Tasmania’s Workforce: health impacts onparticipation and productivity in the face of an ageing population, Hobart: Department of
Treasury and Finance.
Demographic Change Advisory Council, 2007 Who is not participating in Tasmania’s labour force? Hobart: Department of Treasury and Finance.
Dufty, G, and MacMillan, I, 2011 The Relative Price Index, The CPI and the implications of changing cost pressures on various household groups.
Enterprise Marketing and Research Service (EMRS), 2010 ‘Tasmania in Focus’, media releaseDecember 2010, accessed 8 September 2011<http://www.emrs.com.au/pdfs/EMRS%20Media%20Release%20-%20Tasmania%20in%20Focus%20December%202010.pdf >.
Financial Literacy Foundation, 2007 Financial Literacy: Australians understanding money .Canberra: Commonwealth of Australia.
Flanagan, J, 2010 ‘Trouble rarely travels alone’, in Anglicare Australia, From the edge: state of the family report.
Flanagan, J and Flanagan, K, 2011 The price of poverty: cost of living pressures and low incomeearners, Hobart: Anglicare Tasmania.
Flanagan, K, 2009 Hard Times: Tasmanians in Financial Crisis. Hobart: Anglicare Tasmania.
Fudge, M. 2011 Local Voices: enquiry into community assets in Circular Head, Tasmania.Hobart: Relationships Australia Tasmania.
Gallet, W, 2010 Perceptions of poverty: an insight into the nature and impact of poverty in Australia, The Salvation Army accessed 8 September 2011<http://www.salvationarmy.org.au/salvwr/_assets/main/documents/reports/poverty_report_small_2010.pdf >.
Gibson, C and Stewart, A, 2009 Reinventing Rural Places: The extent and impact of festivalsin rural and regional Australia, Wollongong: University of Wollongong.
Headey, B, 2006 A Framework for assessing poverty, disadvantage and low capabilities in Australia, Melbourne Institute Report No. 6. Melbourne: Melbourne Institute of AppliedEconomics and Social Research.
8/3/2019 Cost of Living Strategy
http://slidepdf.com/reader/full/cost-of-living-strategy 85/88
79
Henry, K, 2009 ‘How much inequity should we allow?’ Speech at Australian Council of Social Service (ACOSS) National Conference, 3 April 2009 accessed 8 September 2011<http://taxreview.treasury.gov.au/content/Content.aspx?doc=html/speeches/05.htm>
Henry K, 2009 Australia’s Future Tax System, Canberra: Commonwealth of Australia.
Herbert, A. and Short, L. 2001 Economic wellbeing In Tasmania: Healthy Communities Survey 1998-99, Strategic Development Series Report No. 9. Hobart: Department of Health andHuman Services.
Hess, M and Mouse, M, Innovation in public management: The role and function of community knowledge, The Innovation Journal, 12, (1) pp. 1-20.
Heymann, J 2006, Forgotten families: Ending the growing crisis confronting children and working parents in the global economy, Oxford University Press.
Hinton, T, 2006 My life as a budget item: Disability, budget priorities and poverty in Tasmania,Hobart: Anglicare Tasmania.
Hocking, B, 2011 Mental health care and poverty – intersections and policy Implications,Australian Council of Social Service (ACOSS) National Conference 2011 accessed 8September 2011 http://www.acoss.org.au/images/uploads/barbara_hocking-poverty_mentalillness.pdf .>.
Ipsos-Eureka Social Research Institute, 2010 Issues Monitor accessed 7 September 2011,<http://www.ipsos.com.au/ISRI/lib/IpsosEureka_IssuesMonitor.pdf >.
Keane, B, ‘Cost of Consumer Choices’, Crikey
Kelly, S, and Gong, H, 2010 Saving tomorrow – The savings and spending patterns of Australians. AMP and NATSEM accessed 8 September 2011,<http://melbourneinstitute.com/downloads/hilda/Bibliography/AMP.NATSEM_Saving_Tomo
rrow_Report.pdf>.
Knibbs, G H, 1911 ‘Inquiry into the Cost of Living in Australia’, Melbourne: CommonwealthBureau of Census and Statistics. Extracted from Year Book Australia No. 5, 1912, accessed 7September 2011,<http://www.ausstats.abs.gov.au/ausstats/free.nsf/LookupAttach/1301.0Publication01.01.11280/$File/13010_1912_CostOfLiving.pdf >.
Landvogt, K 2008 Financial capability: a view from the margins of the ‘money system’ ,Brotherhood of St Laurence Lunchtime Seminar 18 September 2008, accessed 8September 2011http://www.bsl.org.au/pdfs/Kathy_Landvogt_Financial_capability_18Sept08.pdf >.
Landvogt, K, 2008 Money, dignity and Inclusion: The role of financial capability , Collingwood:Good Shepherd Youth and Family Service.
Lifeline Community Care Queensland, 2010 Our financial wellbeing: a report on financialstress in Queensland accessed 8 September 2011<http://www.uccommunity.org.au/files/Our%20Financial%20Wellbeing%20-%20A%20report%20on%20financial%20stress%20in%20QLD_0.pdf >.
Livingstone, C, Bruce, E, Kotnik, E, and King, S [2009] Comparing Australian and InternationalSystems to Address Consumer Financial Stress. Monash University, accessed 8 September 2011
<http://www.financialcounsellingaustralia.org.au/discussion%20documents/Comparing%20Au
8/3/2019 Cost of Living Strategy
http://slidepdf.com/reader/full/cost-of-living-strategy 86/88
80
stralian%20and%20International%20Systems%20to%20Address%20Consumer%20Financial%20Stress-1.pdf >.
McQueen, M and Lyons, M, 2001 The missing link: mutual forms of organisation, social capitaland community regeneration in regional Australia, ACCORD Paper No 5, Sydney: AustralianCentre for Cooperative Research and Development.
Madden, K, 2003, Bread and board: when the basics break the budget , Hobart: AnglicareTasmania.
Masterman-Smith, H, May, R, and Pocock, B, 2006 Living low paid: Some experiences of Australian childcare workers and cleaners, CWL Discussion Paper 1/06, Centre for Work +Life: University of South Australia.
Mendoza, R U, 2008 ‘Why do the poor pay more? Exploring the poverty penalty concept’,in Journal of International Development , 23, 1-28 (2011) accessed 7 September 2011<http://onlinelibrary.wiley.com/doi/10.1002/jid.1504/pdf >
Mental Health Community Coalition ACT, 2010 ‘Daily bread income and living with mental
illness’, submission to the National Advisory Council on Mental Health Inquiry.
Mitchell, A, and Shillington, R, 2002 Poverty, inequality and social inclusion, Toronto: Laidlaw Foundation.
Nussbaum, M, 2011 Creating capabilities: The human development approach, Boston: HarvardUniversity Press.
Murphy, J, [2011] Risk, welfare and work , Melbourne: Melbourne University Press.
Organisation for Economic Co-operation and Development (OECD), 2010 Economic Survey of Australia 2010, Paris: OECD.
Organisation for Economic Cooperation and Development, 2009. Focus on Citizens: PublicEngagement for Better Policy and Services. OECD, accessed athttp://www.oecd.org/dataoecd/20/3/42658029.pdf
Nelms, L and Tsingas, C, 2010 Literature review on social inclusion and its relationship tominimum wages and workforce participation, Research Report 2/2010, Canberra: Fair Work Australia.
Payne, A. 2009, ‘Working poor in Australia: An analysis of poverty among households inwhich a member is employed’ , Family Matters No. 8, Australian Institute of Family Studies.
Pech, J, 2011 Relative living standards and needs of low-paid employees: definition andmeasurement , Research report 2/2011. Canberra: Commonwealth of Australia.
Percival, R, and Harding, A, 2000 The Public and private costs of children in Australia 1993-94,Discussion Paper, no. 48. Canberra: NATSEM.
The Poverty Site http://www.poverty.org.uk/summary/social%20exclusion.shtml
Queensland Council of Social Service (QCOSS) 2011 The cost of living report, Issue 1 May 2011, QCOSS accessed 8 September 2011 <http://www.qcoss.org.au/content/cost-living-report-issue-1-may-2011>.
Reference Group on Welfare Reform, 2000 Participation support for a more equitablesociety: final report of the Reference Group on Welfare Reform, Canberra: Department of Family and Community Services.
Relationships Australia, 2011 Local Voices: Enquiry into community assets in Circular HeadTasmania, companion report <>
8/3/2019 Cost of Living Strategy
http://slidepdf.com/reader/full/cost-of-living-strategy 87/88
81
Saunders, P, 2005 The Poverty Wars, reconnecting research with reality, University of New South Wales Press.
Saunders, P., Naidoo, Y. and Griffiths, M. 2007. Towards New Indicators of Disadvantage:Deprivation and Social Exclusion in Australia. Social Policy Research Centre: Sydney
Saunders, P, and Wong, M, 2009 Still doing it tough: An update on deprivation and socialexclusion among welfare service clients, Sydney: Social Policy Research Centre.
Saunders, P, and Wong, M, 2011 Social impact of the Global Financial Crisis, Newsletter No.108, Sydney: Social Policy Research Centre.
Schiller, J. 2011. Unpublished powerpoint presentation: ‘Socio-economic impacts of forestindustry change’.
Schirmer, J, Dunn, C, Loxton, E and Dare, M, 2011 Socio-economic impacts of forest industry change: a baseline study of the Tasmanian forest industry, Technical Report 214: Interimreport, CRC for Forestry, accessed 8 September 2011,<http://www.crcforestry.com.au/publications/downloads/TR214_Schirmer_Socioeconomic-
impacts-interim-compiled.pdf >.
Scutella, R, Wilkins, R and Kostenko, W, Estimates of Poverty and Social Exclusion in Australia: A Multidimensional Approach, Melbourne Institute Working Paper Series Working Paper No.26/09 Dec 2009, Melbourne Institute of Applied Economic and Social Research, TheUniversity of Melbourne and Brotherhood of St Laurence.
Sen, A, 2010 The idea of justice, Cambridge, Massachusetts: Belknap Press of HarvardUniversity Press.
Sen, A, 1999 Commodities and capabilities, New Delhi: Oxford University Press.
Sledge, J, Tescher, J and Gordon, S, 2010 From financial education to financial capability:
Opportunities for innovation. Centre for Financial Services Innovation accessed 8 September 2011,<http://cfsinnovation.com/system/files/Research_Paper_Financial_Capability_Mar2010.pdf >.
Smyth, P, 2010 In or out?: Building an inclusive nation, the Australian Collaboration accessed 7September 2011,http://www.bsl.org.au/pdfs/Smyth_In_or_out_building_an_inclusive_nation.pdf
Social Research Centre, 2008 ANZ Survey of adult financial literacy in Australia, accessed 8September 2011<http://www.anz.com/Documents/AU/Aboutanz/AN_5654_Adult_Fin_Lit_Report_08_Web_Report_full.pdf >.
Social Traders Ltd, 2009 Cooperative social enterprises: what are they? Cooperative SocialEnterprises Info Brief <http://www.socialtraders.com.au/sites/www.socialtraders.com.au/files/Cooperative%20Social%20Enterprises%20Info%20Brief.pdf >.
Suncorp, 2010 The Suncorp Life Confidence Index: Australians feel they are on shaky ground ,accessed 7 September 2011,<http://www.suncorplifetv.com.au/files/SuncorpConfidenceIndexReportFINAL210910.pdf >.
Tasmania. Department of Premier and Cabinet, Social Inclusion Unit, 2009 A Social InclusionStrategy for Tasmania: Preliminary Response.
Tasmania. Department of Premier and Cabinet, Social Inclusion Unit, 2010 Community Consultation: Community Priorities for a Social Inclusion Strategy for Tasmania.
8/3/2019 Cost of Living Strategy
http://slidepdf.com/reader/full/cost-of-living-strategy 88/88
Tasmania. Department of Premier and Cabinet, ‘Bill Smoothing - Environmental Scan’,unpublished paper, July 2011.
Tasmania. Department of Treasury and Finance, 2008 Guidelines for Tasmanian Government Businesses: Corporate Governance Principles, accessed 8 September 2011<http://www.treasury.tas.gov.au/domino/dtf/dtf.nsf/LookupFiles/Corporate-Governance-
Principles.pdf/$file/Corporate-Governance-Principles.pdf >.
Tasmania. Department of Treasury and Finance, 2008 Review of Tasmanian StateGovernment Concessions.
Tasmania. Department of Treasury and Finance State tax review discussion paper, Dec 2010.
Tasmania. Office of the Tasmanian Economic Regulator, 2011, Tasmanian Energy Supply Industry Performance Report 2009-10.
Tasmania Together Progress Board 2011, Tasmania Together 10 Year Review Speak today,shape tomorrow: What the community said, accessed 7 September 2011,http://www.tasmaniatogether.tas.gov.au/10_year_review/
Tasmanian Council of Social Service (TasCOSS), 2009 Just Scraping By? Conversations withTasmanians living on low incomes. Hobart: TasCOSS.
TasCOSS The Intersection of Emergency Food Relief and Food Security, November 2010
Vallance, S, 2011 Living in the country: Consumer perspectives on energy supply in ruralTasmania, Hobart: TasCOSS.
Volunteering Tasmania, 2011 Response to the Interim Report on Cost of Living inTasmania, unpublished paper.
Webb, M, 2010 State of Volunteering Report: Tasmania 2010, Hobart: VolunteeringTasmania.
Volunteering Australia, 2006 Survey on the Real Cost of Volunteering http://www.volunteeringaustralia.org/files/98E283PN6H/Costs%20of%20Volunteering%20Research%20Bulletin.pdf
Wilkins, R, Warren, D, Hahn, M, and Houng, B 2010 Families, incomes and jobs, volume 5: Astatistical report on waves 1 to 7 of the household, income and labour dynamics survey ,Melbourne Institute of Applied Economic and Social Research: University of Melbourne.