Embed Size (px)
Citation preview

COST OF SERVICE COST OF SERVICE STUDIESSTUDIES
COST OF SERVICE COST OF SERVICE STUDIESSTUDIES
Carryn Lee
Manager-Water & Sewer Rate Design BranchAssistant Director-Financial Analysis Division
KENTUCKY PUBLIC SERVICE COMMISSIONKENTUCKY PUBLIC SERVICE COMMISSION
MUNICIPAL WATER SEMINAR
MARCH 28, 2001

Water is a rising cost industry:
Utility Plant Investment is increasing
Water Industry is More Capital Intensive
Residential Customers -
Usage Prices
Regulation is increasing

Total 20-Year Need by Category In Billions of January 1995 Dollars
Total Need: $138.4 Billion
Transmission and
Distribution $77.2 (56%)
Other $1.9 (1%)
Storage $12.1 (9%)
Treatment $36.2 (26%)
Source$11.0 (8%)

“As water costs continue to increase, it becomes imperative that water utilities know the actual cost of providing water service to their different types of customers.”

Revenue Requirement
Operating and Maintenance Expenses
Taxes/Transfer Payments
Debt Service/Depreciation
Capital Project Funding/Rate of Return______________________________________________________________________________________________________________________
= Total Revenue Requirement

Cost of Service Study
ALLOCATES all costs of providing water service to various types of customers.
RECOVERS those costs through a rate structure that is fair, just, and reasonable.
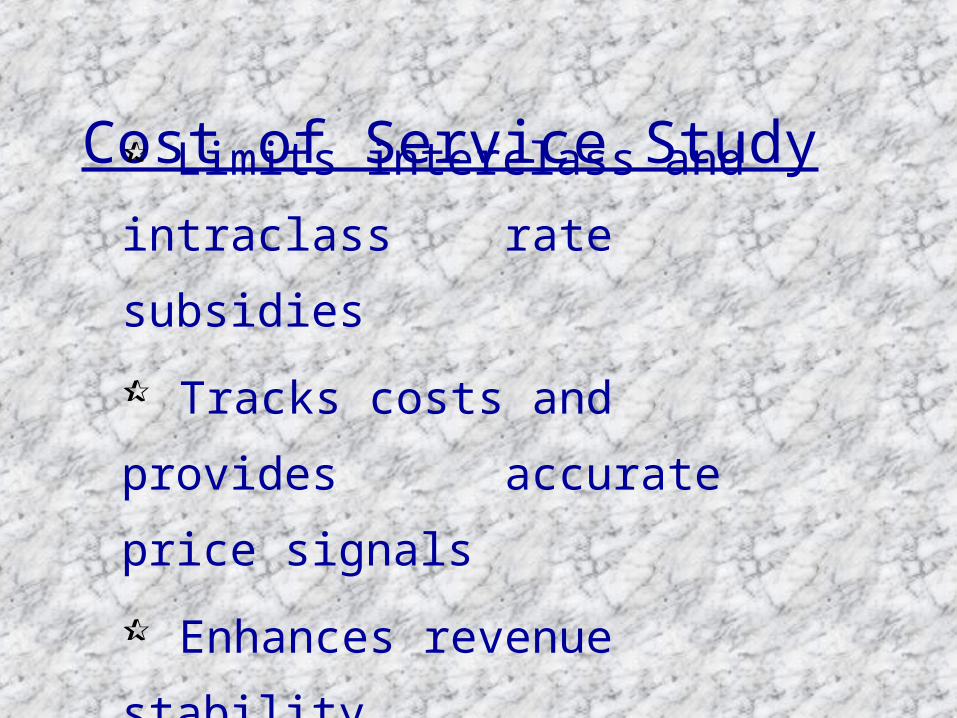
Cost of Service Study
Limits interclass and
intraclass rate subsidies
Tracks costs and provides
accurate price signals
Enhances revenue stability

Cost of Service Study
Promotes adequate cash flow
Establishes a range of
reasonableness
NEVER takes into consideration the
ability to pay

5 Steps
Load Forecast
O & M and Capital Budget
Revenue Requirement
Cost of Service Study
Rates

Billing Analysis Summarization of customer
bills-by meter size
-customer classification
Determines test year revenue
Show customer usage
patterns

Major Functions
Source of Supply
Pumping
Transmission
Distribution
Customer
Administrative and General
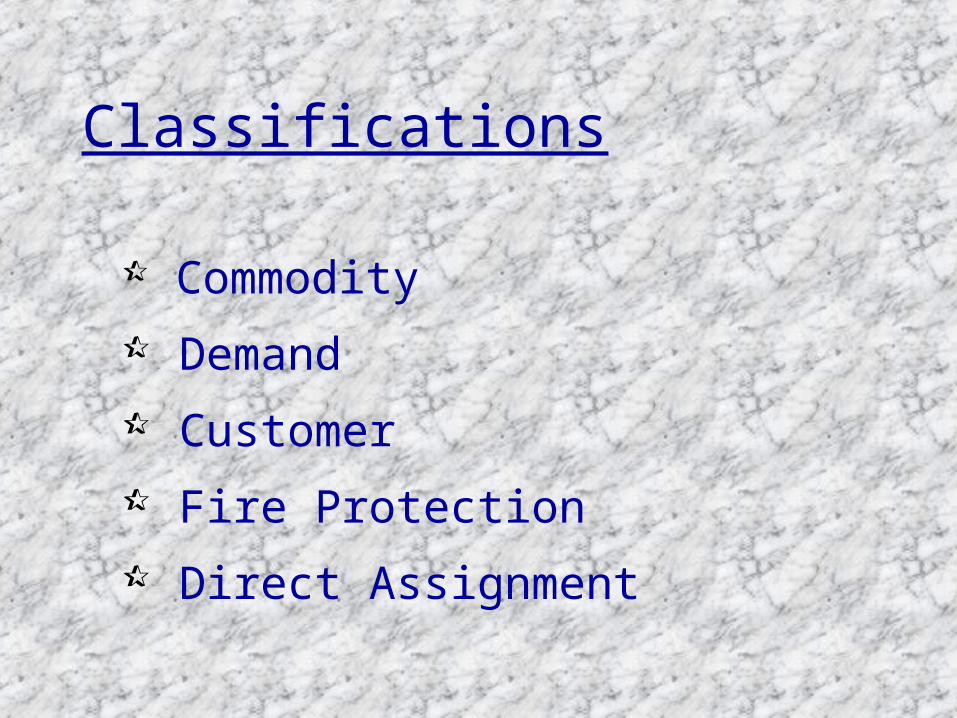
Classifications
Commodity
Demand
Customer
Fire Protection
Direct Assignment

Commodity Costs
Costs that vary with the amount of water treated
-power for pumping-chemicals-purchased water
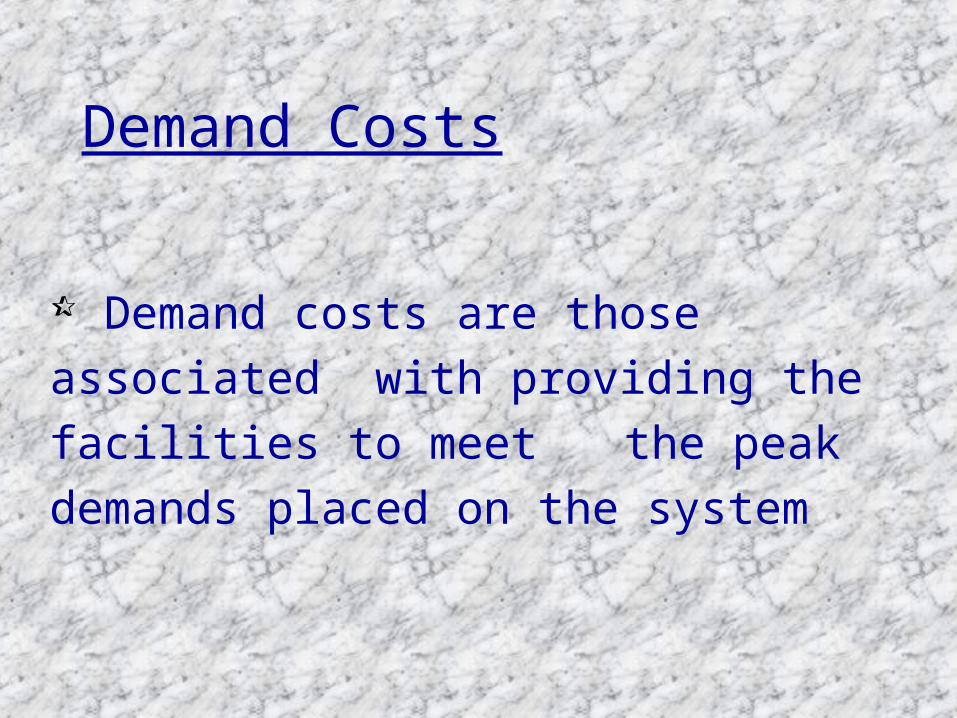
Demand Costs
Demand costs are those associated with providing the facilities to meetthe peak demands placed on the system
0
20
40
60
80
100
12am 2a
m4a
m6a
m8a
m10
am12
pm2p
m4p
m6p
m8p
m10
pm
TIME OF DAY
TH
OU
SAN
DS
OF
GA
LL
ON
SResidential Industrial

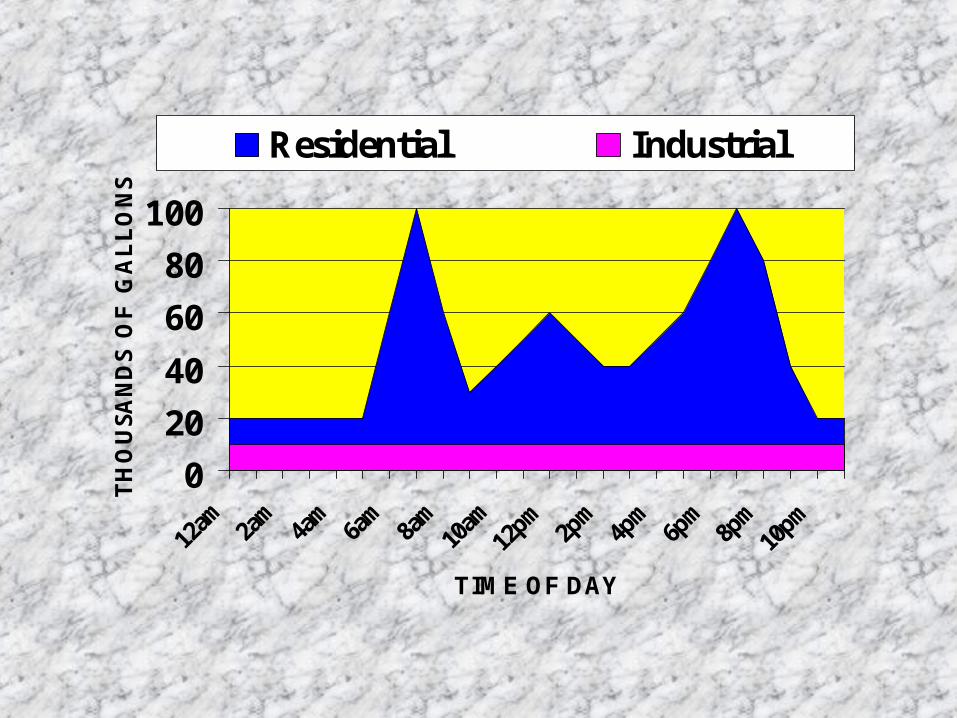
Peak Demand Problems Your plant must be sized to meet peak demands.
But you only generate revenue when plant is being used.
Idle plant is very expensive to utilities because you have spent money for plant that is not generating revenue.
Which customers cause you to have idle plant during non-peak times?
In many cases, large usage customers may not contribute to peak day demands.
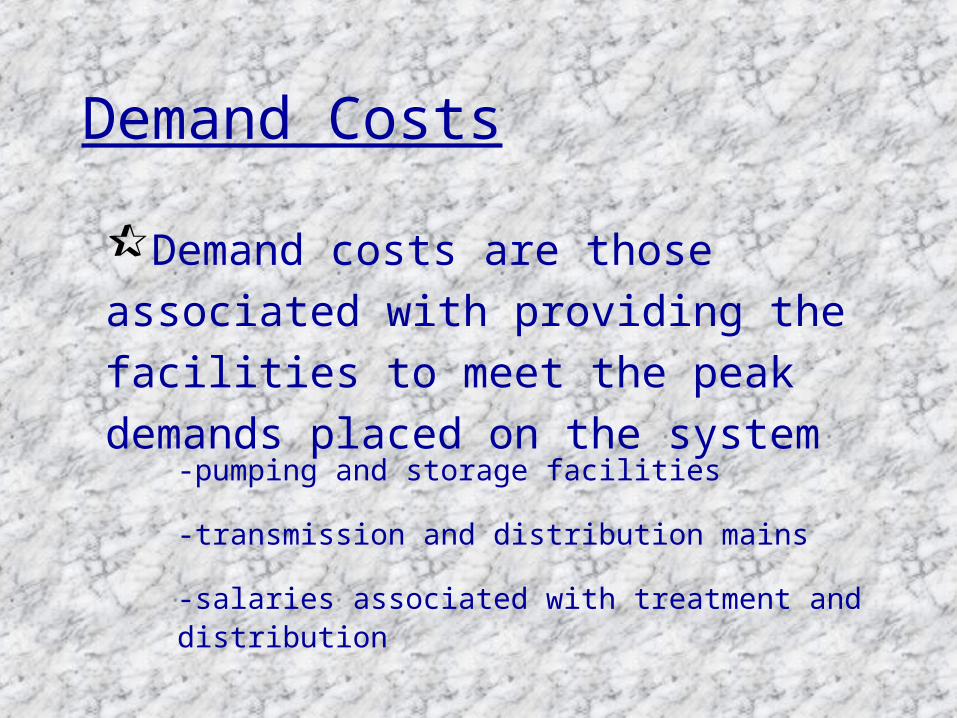
Demand Costs
-pumping and storage facilities
-transmission and distribution mains
-salaries associated with treatment and distribution
Demand costs are those associated with providing the facilities to meet the peak demands placed on the system

Customer Costs Costs incurred to serve customers without regard to usage
-meter reading
-billing and collections
-meters and service lines

Fire Protection
Generally not a major function for the small utilities that are regulated by the PSC.

Direct Assignment or Wholesale Customers
Costs directly associated with serving a particular customer.
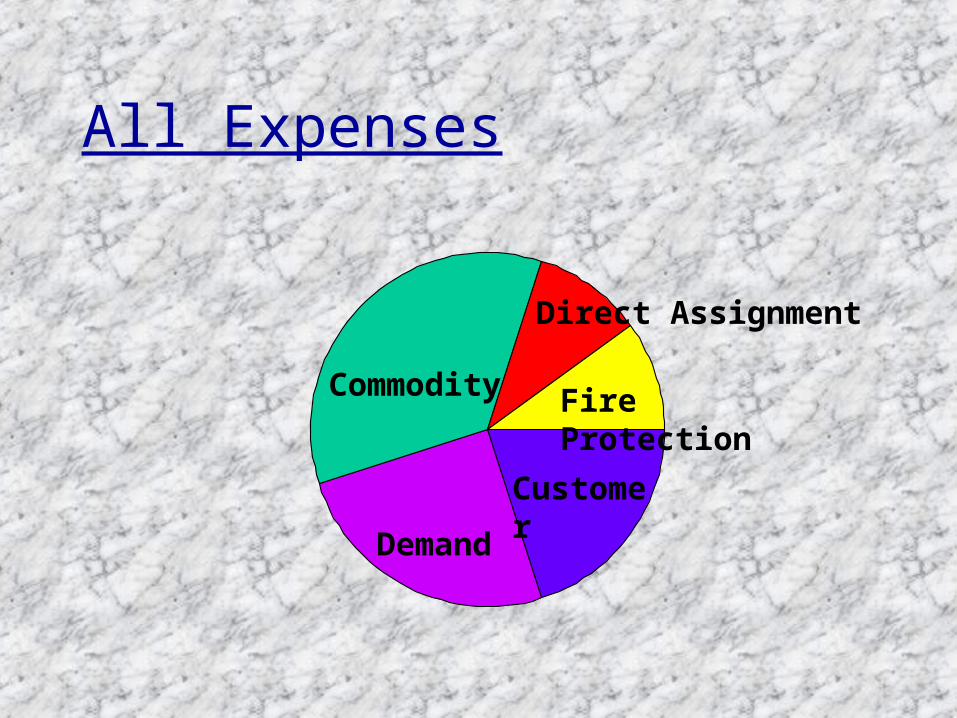
All Expenses
Demand
Direct Assignment
Fire Protection
Customer
Commodity

Total Allocation Factor Wholesale Retail
Salaries
Transmission/Distribution 167,177 0.0030 $502 $166,675
Customer Accounts 62,354 0.0000 $0 $62,354
Purchased Water 426,223 $8,798 417,425
Purchased Power
Transmission/Distribution 13,420 0.0211 $283 13,137
Customer Accounts 600 0.0000 $0 600
Materials & Supplies
Transmission/Distribution 47,447 0.0030 $142 47,305
Administrative/General 13,025 0.0030 $39 12,986
Contract Services 7,969 0.0030 $24 7,945
Transportation Expense
Transmission/Distribution 2,855 0.0030 $9 2,846
Customer Accounts 2,855 0.0000 $0 2,855
Insurance-General Liability $0
Transmission/Distribution 4,541 0.0030 $14 4,527
Customer Accounts 4,540 0.0000 $0 4,540
Insurance-Workers Comp
Transmission/Distribution 3,275 0.0030 $10 3,265
Customer Accounts 1,513 0.0000 $0 1,513
Bad Debt Expense 3,307 0.0000 $0 3,307
Total Operation/Maintenance 761,101
Depreciation
Retail-only 29,795 0.0000 $0 29,795
Shared Depreciation
Shared Trans/Dist 55,041 0.0030 $165 54,876
Shared Source of Supply 10,053 0.0211 $212 9,841
Taxes other than Income 13,989 0.0030 $42 13,947
Debt Service
Retail Only $25,025 0.0000 $0 25,025
Shared Debt Service $86,127 0.0211 $1,817 84,310
Total - Utility Req Revenue $981,131 $12,057 $969,074
Rate to Wholesale Wholesale gallons 6,306,000 $1.91 per 1,000 gallons
ALLOCATION OF OPERATION AND MAINTENANCE EXPENSES

Total Allocation Factor Wholesale Retail
Salaries
Transmission/Distribution 167,177 0.0030 $502 $166,675
Customer Accounts 62,354 0.0000 $0 $62,354
Purchased Water 426,223 $8,798 417,425
Purchased Power
Transmission/Distribution 13,420 0.0211 $283 13,137
Customer Accounts 600 0.0000 $0 600
Materials & Supplies
Transmission/Distribution 47,447 0.0030 $142 47,305
Administrative/General 13,025 0.0030 $39 12,986
ALLOCATION OF OPERATION AND MAINTENANCE EXPENSES

Total Allocation Factor Wholesale Retail
Contract Services 7,969 0.0030 $24 7,945
Transportation Expense
Transmission/Distribution 2,855 0.0030 $9 2,846
Customer Accounts 2,855 0.0000 $0 2,855
Insurance-General Liability $0
Transmission/Distribution 4,541 0.0030 $14 4,527
Customer Accounts 4,540 0.0000 $0 4,540
Insurance-Workers Comp
Transmission/Distribution 3,275 0.0030 $10 3,265
Customer Accounts 1,513 0.0000 $0 1,513
Bad Debt Expense 3,307 0.0000 $0 3,307
Total Operation/Maintenance 761,101

Total Allocation Factor Wholesale Retail
Depreciation
Retail-only 29,795 0.0000 $0 29,795
Shared Depreciation
Shared Trans/Dist 55,041 0.0030 $165 54,876
Shared Source of Supply 10,053 0.0211 $212 9,841
Taxes other than Income 13,989 0.0030 $42 13,947
Debt Service
Retail Only $25,025 0.0000 $0 25,025
Shared Debt Service $86,127 0.0211 $1,817 84,310
Total - Utility Req Revenue $981,131 $12,057 $969,074
Rate to Wholesale Wholesale gallons 6,306,000 $1.91 per 1,000 gallons

Total Commodity Demand CustomerSalaries Transmission/Distribution 112,773 $112,773 Customer Accounts 60,600 60,600Purchased Water 417,425 417,425Purchased Power Transmission/Distribution 12,549 12,549 Customer Accounts 600 600Materials & Supplies Transmission/Distribution 47,305 47,305Transportation Expense Transmission/Distribution 2,846 2,846 Customer Accounts 2,855 2,855Insurance-General Liability Transmission/Distribution 4,527 4,527 Customer Accounts 4,540 4,540Insurance-Workers Comp Transmission/Distribution 2,281 2,281 Customer Accounts 1,208 1,208Bad Debt Expense 3,307 3,307Miscellaneous Expense Transmission/Distribution 6,862 6,862 Customer Accounts 1,754 1,754Subtotal $681,432 $429,974 $176,594 $74,864 Less Commodity (429,974)Total $251,458 Percentages 70.23% 29.77%Administrative & General Salaries/Officers/Comm $42,544 $29,879 $12,665 Purchased Power 587 412 175 Materials & Supplies 12,986 9,120 3,866 Contract Services 4,363 3,064 1,299Insurance 984 691 293Rentals 3,582 2,516 1,066Advertising 305 214 91Miscellaneous Expense 4,496 3,158 1,338Taxes other than Income 13,947 9,795 4,152Subtotal $83,794 $58,849 $24,945
Total O & M Expenses $765,226 $429,974 $235,443 $99,809Depreciation Retail-only 29,795 $23,204 6,591 Shared Depreciation 64,717 $50,402 14,315Debt Service 109,335 $86,167 23,168
Total $969,073 $429,974 $395,216 $143,883
ALLOCATION OF RETAIL OPERATION AND MAINTENANCE EXPENSES

Total Commodity Demand CustomerSalaries Transmission/Distribution 166,675 $166,675 Customer Accounts 62,354 62,354Purchased Water 417,425 417,425Purchased Power Transmission/Distribution 13,137 13,137 Customer Accounts 600 600Materials & Supplies Transmission/Distribution 47,305 47,305Transportation Expense Transmission/Distribution 2,846 2,846
ALLOCATION OF RETAIL OPERATION AND MAINTENANCE EXPENSES

Total Commodity Demand CustomerTransportation Expense Transmission/Distribution 2,846 2,846 Customer Accounts 2,855 2,855Insurance-General Liability Transmission/Distribution 4,527 4,527 Customer Accounts 4,540 4,540Insurance-Workers Comp Transmission/Distribution 3,265 3,265 Customer Accounts 1,513 1,513Bad Debt Expense 3,307 3,307Subtotal $730,349 $430,562 $224,618 $75,169 Less Commodity (430,562)Total $299,787 Percentages 74.93% 25.07%
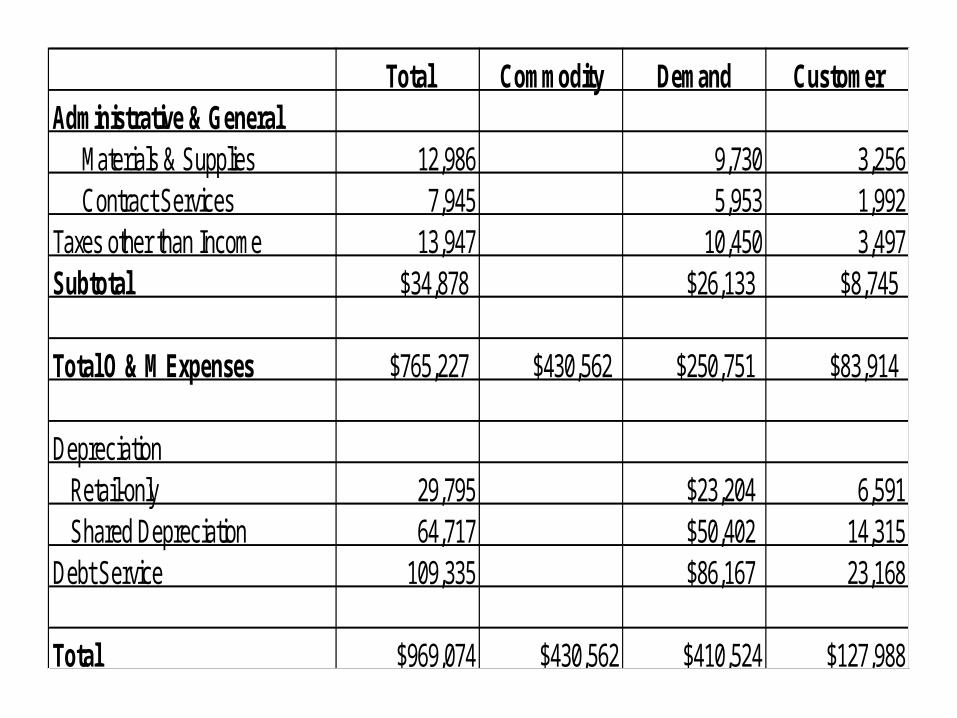
Total Commodity Demand CustomerAdministrative & General Materials & Supplies 12,986 9,730 3,256 Contract Services 7,945 5,953 1,992Taxes other than Income 13,947 10,450 3,497Subtotal $34,878 $26,133 $8,745
Total O & M Expenses $765,227 $430,562 $250,751 $83,914
Depreciation Retail-only 29,795 $23,204 6,591 Shared Depreciation 64,717 $50,402 14,315Debt Service 109,335 $86,167 23,168
Total $969,074 $430,562 $410,524 $127,988

Total First 2000 Over 2000
Actual Water Sales: Thousand Gallons 201,560,000 84,672,000 116,888,000
100.00% 42.01% 57.99%
Weighted Sales for Demand: Thousand Gallons 286,232,000 169,344,000 116,888,000 Percent 100.00% 59.16% 40.84%
Allocation of Volumetric Costs: Commodity $430,562 $180,872 $249,690 Demand 410,524 242,879 167,645 Customer 127,988 127,988Total $969,074 $551,739 $417,335
Number of Bills 42,336
Proposed Rates $13.03 $3.57
CALCULATION OF RETAIL WATER RATES

Summary

Things to Think About

Fresh Water will become a national security issue in the 21st Century.

Worldwide water consumption is rising twice as fast as the world’s population.
Nearly 85% of water is used for agricultural and industrial purposes.

Nearly 80% of diseases in developing countries are water borne.

Over 300,000,000 people live in areas where there are severe water shortages.

Over 9,500 children worldwide die daily from lack of water or diseases caused by polluted water.
Common GoalCommon Goal
“We all want adequate and reliable water service at affordable prices for the consumer, and to help achieve it……

….We must all look for opportunities to find creative solutions to the water problems in this state and work together to create policies that best serve the public.”

Web Resources
Other state commissioners and water companies
NARUC Committee and Subcommittee on Water
NRRI, NAWC, and AWWA

CARRYN LEECARRYN LEE
PPUBLICUBLIC
SSERVICEERVICE
CCOMMISSIONOMMISSION
[email protected](502) 564-3940 EXT. 248
MANAGERWATER & SEWER RATE DESIGN BRANCH
ASSISTANT DIRECTORFINANCIAL ANALYSIS DIVISION