Embed Size (px)
Citation preview

Agricultural Economics Report No. 361 August 1996
COST SAVINGS FROM CONSOLIDATINGNORTH DAKOTA’S COUNTIES
Mark A. Krause
Department of Agricultural Economics !! Agricultural Experiment StationNorth Dakota State University !! Fargo, ND 58105-5636

COST SAVINGS FROM CONSOLIDATINGNORTH DAKOTA’S COUNTIES
Mark A. Krause
Department of Agricultural EconomicsNorth Dakota State University
Fargo, ND 58105-5636
The analyses and views reported in this paper are those of the author. They are not necessarilyendorsed by the Department of Agriculture or by North Dakota State University.
North Dakota State University is committed to the policy that all persons shall have equal access toits programs, and employment without regard to race, color, creed, religion, national origin, sex, age,marital status, disability, public assistance status, veteran status, or sexual orientation.
Information on other titles in this series may be obtained from: Department of AgriculturalEconomics, North Dakota State University, P.O. Box 5636, Fargo, ND 58105. Telephone: 701-231-7441, Fax: 701-231-7400, or e-mail: [email protected].
Copyright © 1996 by Mark A. Krause. All rights reserved. Readers may make verbatim copies ofthis document for non-commercial purposes by any means, provided that this copyright noticeappears on all such copies.

COST SAVINGS FROM CONSOLIDATINGNORTH DAKOTA’S COUNTIES
Mark A. Krause
Abstract
Consolidation of county government services is often proposed as a way to reduce costs. A bill was proposed in the 1993 North Dakota Legislative Assembly to merge North Dakota's 53counties into 15 "super counties." This study estimates county expenditure functions for fourcategories of services: (1) general government, (2) public safety, (3) roads and highways, and (4)health and welfare. The statistical results were used to estimate expenditures for the 15consolidated counties and a 26-county alternative. The results indicate that the 15-countyproposal would have achieved cost savings of 4.9 percent for the four service categories. Costsof road and highway, general government, and health and welfare services could be reduced 3, 10,and 15 percent, respectively, under the 15-county proposal, but public safety expenditures wouldincrease 25 percent. The 26-county alternative would provide less total cost savings, but alsofewer cases of cost increases. Consolidation of some, but not all, county government servicesprovides the greatest cost savings.
Key Words: Consolidation, County Government, Economies of Size, Nonlinear Regression,Population

ACKNOWLEDGMENTS
The author wishes to thank several persons and state government offices that contributedto this analysis and report. The assistance of the North Dakota State Auditor's office, TaxCommissioner's office, State Archives and Historical Library, and Census Data Center inproviding data was essential. Jay Leitch and Dean Bangsund shared additional data from anearlier study of county government expenditures. Mike Bloomgren entered the data on thecomputer and reconciled expenditure data from different sources. Jay Leitch, Larry Leistritz,Richard Rathge, and anonymous referees for the Journal of the Community Development Societyprovided valuable comments on an earlier draft of this report. Donna Adam prepared themanuscript for publication. Funding for this study was provided by the North Dakota RuralDevelopment Center.

Table of Contents
Page
List of Tables. . . . . . . . . . . . . . . . . . . . . . . . . . . . . . . . . . . . . . . . . . . . . . . . . . . . . . . . . . . . . . . ii
List of Figures. . . . . . . . . . . . . . . . . . . . . . . . . . . . . . . . . . . . . . . . . . . . . . . . . . . . . . . . . . . . . . ii
Abstract and Key Words. . . . . . . . . . . . . . . . . . . . . . . . . . . . . . . . . . . . . . . . . . . . . . . . . . . . . iii
Highlights . . . . . . . . . . . . . . . . . . . . . . . . . . . . . . . . . . . . . . . . . . . . . . . . . . . . . . . . . . . . . . . . iv
Introduction . . . . . . . . . . . . . . . . . . . . . . . . . . . . . . . . . . . . . . . . . . . . . . . . . . . . . . . . . . . . . . . 1
Methodology. . . . . . . . . . . . . . . . . . . . . . . . . . . . . . . . . . . . . . . . . . . . . . . . . . . . . . . . . . . . . . . 3
Statistical Results. . . . . . . . . . . . . . . . . . . . . . . . . . . . . . . . . . . . . . . . . . . . . . . . . . . . . . . . . . . 7
Cost Reduction Estimates. . . . . . . . . . . . . . . . . . . . . . . . . . . . . . . . . . . . . . . . . . . . . . . . . . . . 11
Discussion. . . . . . . . . . . . . . . . . . . . . . . . . . . . . . . . . . . . . . . . . . . . . . . . . . . . . . . . . . . . . . . . 13
Conclusions. . . . . . . . . . . . . . . . . . . . . . . . . . . . . . . . . . . . . . . . . . . . . . . . . . . . . . . . . . . . . . . 15
References. . . . . . . . . . . . . . . . . . . . . . . . . . . . . . . . . . . . . . . . . . . . . . . . . . . . . . . . . . . . . . . . 16

ii
List of Tables
Table Page
1 Populations in 1992 for the 15 Super-county Districts. . . . . . . . . . . . . . . . . . . . . . . . . . 5
2 Populations in 1992 for 26 Consolidated Counties. . . . . . . . . . . . . . . . . . . . . . . . . . . . . 6
3 Box-Cox Estimates of Total Expenditure Parameters. . . . . . . . . . . . . . . . . . . . . . . . . . . 8
4 Estimated Percent Cost Savings for 15-County Proposal. . . . . . . . . . . . . . . . . . . . . . . 12
5 Estimated Percent Cost Savings for 26-County Alternative. . . . . . . . . . . . . . . . . . . . . 14
List of Figures
Figure Page
1 Proposed Multicounty Districts in North Dakota. . . . . . . . . . . . . . . . . . . . . . . . . . . . . . 1
2 General Government Expenditures Per Capita in North Dakota Counties. . . . . . . . . . . . 9
3 Road and Highway Expenditures Per Capita in North Dakota Counties. . . . . . . . . . . . . 9
4 Health and Welfare Expenditures Per Capita in North Dakota Counties. . . . . . . . . . . . 10
5 Public Safety Expenditures Per Capita in North Dakota Counties. . . . . . . . . . . . . . . . . 11

iii
Abstract
Consolidation of county government services is often proposed as a way to reduce costs. A bill was proposed in the 1993 North Dakota Legislative Assembly to merge North Dakota's 53counties into 15 "super counties." This study estimates county expenditure functions for fourcategories of services: (1) general government, (2) public safety, (3) roads and highways, and (4)health and welfare. The statistical results were used to estimate expenditures for the 15consolidated counties and a 26-county alternative. The results indicate that the 15-countyproposal would have achieved cost savings of 4.9 percent for the four service categories. Costsof road and highway, general government, and health and welfare services could be reduced 3, 10,and 15 percent, respectively, under the 15-county proposal, but public safety expenditures wouldincrease 25 percent. The 26-county alternative would provide less total cost savings, but alsofewer cases of cost increases. Consolidation of some, but not all, county government servicesprovides the greatest cost savings.
Key Words: Consolidation, County Government, Economies of Size, Nonlinear Regression,Population

iv
Highlights
Consolidation of county government services has often been proposed as a way to reducethe cost to taxpayers. In 1993, North Dakota State Senator Jay Lindgren proposed mergingNorth Dakota's 53 counties into 15 "super counties." He estimated that $3.9 million would besaved from salaries alone. The super-county proposal was defeated, but consolidation of specificcounty government services continues in North Dakota.
This study estimates to what extent consolidation of county government services in NorthDakota would reduce expenditures and thereby reduce the burden on taxpayers. Four majorcategories of county government services were evaluated: (1) general government, (2) publicsafety, (3) roads and highways, and (4) health and welfare. Based on 1983-92 data, countyexpenditures were statistically estimated as a function of population, average wage, a travel-costvariable, year, oil extraction, and coal extraction. The travel-cost variable equals the total miles ofstreets, roads, and highways in each county multiplied by the average gasoline price for NorthDakota. The statistical results were used to estimate expenditures for the 15 consolidated supercounties and an intermediate, 26-county alternative created by the author for comparison.
The results indicated that the 15-county proposal would have achieved cost savings of 4.9percent, or about $12 million in 1992 dollars, for the four categories of county governmentservices. However, the cost of public safety services would have increased in each of the 15super-county districts 25 percent for the state. Cost savings for road and highway services ineastern and southwestern North Dakota would be largely offset by cost increases in northwesternNorth Dakota, resulting in only a 3.5 percent cost reduction for county-level road and highwayservices in the state. The results suggest that consolidation of general government and health andwelfare services would have achieved substantial cost savings of 10 percent and 15 percent,respectively. The 26-county alternative would achieve savings of approximately 3 percent for thefour categories of service. Public safety expenditures would be about 11 percent higher than for53 counties.
The results suggest that consolidating of counties is not the answer for reducing the costsof county government services in North Dakota. Substantial cost savings could be achieved forsome services, in some regions of North Dakota, but not for other services and regions. Furthermore, this analysis does not consider the adjustment costs of consolidating counties. Thecost estimates also does not consider the lower quality of services, reduced local control overservices, and effects of lost jobs and local business in current county seats that would result fromconsolidation. Consolidation should be undertaken only for specific services after careful study ofprobable cost savings, adjustment costs, and reduced quality of services.

Former assistant professor, Department of Agricultural Economics, North Dakota*
University, Fargo.
COST SAVINGS FROM CONSOLIDATINGNORTH DAKOTA’S COUNTIES
Mark A. Krause*
Introduction
Declining populations, taxable incomes, and property values, combined with decliningstate government contributions, have made it difficult for many rural counties in North Dakota tomaintain traditional county government services. Increasing tax rates to maintain levels of countygovernment services is generally not a politically viable option. Consolidation of counties or ofindividual services provided by county governments has been proposed to reduce costs. In 1993,the North Dakota State Legislature debated a bill that would have consolidated North Dakota's 53counties into 15 "super-counties." The bill's sponsor, Jay Lindgren, claimed that it wouldeliminate the jobs of about 400 county officeholders and save $3.9 million in salaries alone(Wetzel, 1993). However, his estimate and the subsequent debate appeared to be based more onspeculation than on economic analysis. This study presents statistical analysis and estimated costsavings for four categories of county government services in North Dakota under the 15-countyproposal and a 26-county alternative compared to costs for the current 53 counties (Figure 1). The statistical method is described and could easily be used to evaluate whether consolidationcould reduce costs of providing local government services in other states.
Figure 1. Proposed Multicounty Districts in North Dakota

2
The challenges of maintaining local government services while per capita tax revenues andfiscal aid from federal and state governments are declining have been reported throughout theUnited States (Dimeo, 1991; Boroughs, Black, and Collins, 1991; Hinds, 1991; Johnson et al.,1995; Rubin, 1996). Local governments began reporting budget deficits in 1986 (Rubin), whichbecame increasingly severe by 1991 and 1992. In 1991, the director of research for the NationalAssociation of Counties stated, "Nearly all of the nation's 425 counties with populations over100,000 are also looking to reduce services or raise taxes or both" (Hinds, 1991). Three quartersof these large counties have a legal cap on the property taxes they can raise, and 78 percent ofthem had reached this limit by 1991 (Boroughs, Black, and Collins, 1991). However, fiscalburden, as defined by Johnson et al. (1995), has been even higher in non-metropolitan counties,particularly in the West and Great Plains regions of the United States.
It has been argued since the 1930s that the county governments established in the 19thcentury in the Great Plains are smaller than needed to provide high-quality services and smallerthan the most cost-efficient size. Complete elimination of some local government units in sparselysettled regions of the Great Plains was advocated by a Great Plains Committee report published in1936 (Rose, 1971). The same report argued that county boundaries that were determined by thedistance a horse could travel in a day are inappropriate when more modern means oftransportation are available and that substantial reductions in fiscal burdens could be obtainedthrough consolidation.
One important obstacle to consolidation of local government units has been a lack of clearempirical documentation of economies of size for local government services. Fox (1980) discusses the difficulties in measuring costs, input usage, input prices, technology, and outputwhen estimating cost functions for government services. Another difficulty is separating theeffects of demand changes on expenditures from the effects of supply-side production costs. Most of these difficulties have been assumed away in the empirical studies. Furthermore, mostempirical studies have pre-determined the functional form of the cost function. Largely as a resultof the different model specifications and measurement problems in the data, empirical studies ofeconomies of size in local government services have produced mixed results (Fox, 1980).
Anecdotal evidence for achieving economies of size through local governmentconsolidation also has been mixed. Consolidation of city with county government servicesappears to have achieved cost savings in Lexington-Fayette County, Kentucky; Indianapolis-Marion County, Indiana; and St. Louis-St. Louis County, Missouri (Ward, 1992); but has notachieved cost savings in Athens-Clarke County, Georgia (Condrey, 1994). An ex ante analysis byBunch and Strauss (1992) indicates that seven of nine municipalities in western Pennsylvaniawould reduce their per capita revenue burdens after consolidation. Bunch and Strauss alsosuggest that local governments with relatively low overhead costs and relatively low wages andfringe benefits are most likely to increase costs after consolidation, largely due to equalization ofwages and taxes with relatively free-spending neighbors.

3
Consolidation of local government units also has been slowed by concerns over access toservices, local control over the quality of service, loss of community identity, and the economicimpact of lost jobs (Thompson, 1992; Ward, 1992; Lemov, 1993; Mahtesian, 1995). Mostconsolidation of services has been small scale because consolidation of major services is politicallycontroversial (Lemov, 1993; Mahtesian, 1995). Efficiency is not the only economic goal in theprovision of local government services. Estimated economies of size must therefore be largeenough to offset negative impacts on equitable access to services, local control, and thepreservation of rural communities before consolidation will be politically popular.
Consolidation of counties also would result in substantial adjustment costs, includingmoving expenses and the expansion of existing courthouses or building of new ones. The LoganCounty auditor, Blanche Schumacher, suggested that the cost of building a new districtcourthouse in Wishek, North Dakota, would far outweigh any cost savings due to economies ofsize (Reiger, 1993). The long-term cost savings would need to be substantial for the presentvalue of consolidation benefits to exceed the present value of the adjustment costs.
Methodology
This study estimates economies of size for four categories of county government services:general government, public safety, health and welfare, and road and highway. The categories aredefined by the North Dakota State Auditor's office, from which the expenditure data wereobtained. General government expenditures include those for the County Board, County Auditor,County Treasurer, States Attorney, County Court, Register of Deeds, plus general supplies,utilities, and maintenance. Public safety expenditures include those for the Sheriff's office, CountyJail, and Civil Defense. Health and Welfare expenditures include those for SocialServices/Welfare, County Poor, Veterans Service, Social Security, County Health Unit, Board ofHealth, senior citizen programs, and mental health programs. Highway and Road expendituresinclude County Road and Bridge expenditures, Farm to Market Road expenditures, andexpenditures from the North Dakota Highway Tax Distribution Fund. The data cover 1983-92for most of the counties, for a total of 506 observations.
Total annual expenditures for each category are estimated as a function of population,average wage, a transportation cost variable, a time trend, oil extraction, and coal extraction. Population is the primary variable of interest because this study focuses on the relationshipbetween per capita costs and population. The average wage and transportation cost variables areincluded to capture the influence of higher wages and the costs of traveling greater distances insome counties and some years than in others. The year is included to account for policy,economic, and technology trends. Oil and coal extraction effects are included because theyprovide North Dakota counties with large extraction tax revenues, which encourage spending andincrease demands for county government services.

4
Fox (1980) and Deller, Chicoine, and Walser (1988) have criticized models whichcombine supply and demand variables and use expenditures as a dependent variable. However,the data required for this model are relatively easy to obtain, so the model could be estimated forother states with less time and expense than the models advocated by Fox and Deller, Chicoine,and Walser.
The average county wage data were taken from the REIS data set (Bureau of EconomicAnalysis, Department of Commerce). The transportation cost variable equaled the product oftotal street, road, and highway miles in the county (Bangsund and Leitch, 1990) multiplied by thestate average gasoline price (Energy Information Administration, various years). Oil and coalextraction data were obtained from the North Dakota tax commissioner. All monetary data wereconverted to 1992 dollars using the Consumer Price Index.
A Box-Cox non-linear transformation of the data was used to avoid imposing a particularfunctional form on the expenditure relationships. The Box-Cox estimates were obtained using theLIMDEP econometrics software package (Greene, 1992). Separate transformation parametersfor the dependent and independent variables were estimated. Oil and coal extraction wereincluded as linear effects and were not transformed, due to the many zero observations for whichthe Box-Cox transformation is not defined. The standard deviation of the residuals was calculatedfrom the predicted expenditure values.
Predicted expenditures were calculated for North Dakota's 53 counties, the 15 proposedsuper counties, and a 26-county alternative. Consolidated county definitions and populations arepresented in Tables 1 and 2. The 26-county alternative was created to provide cost-savingsestimates for an intermediate level of consolidation. The criteria used to create the alternative 26consolidated counties were a combined population of at least 10,000 (three exceptions wereallowed) and local trade centers included in as many consolidated counties as possible. Localtrade centers were identified by Bangsund et al. (1991).
The predicted expenditure values for 1992, or the most recent year for which data wereavailable, provided the baseline for the estimation of cost-savings from consolidation. Population,travel cost, oil extraction, and coal extraction data were summed for each of the consolidatedcounties. The average wage for each consolidated county was calculated as an average, weightedby county population, of the county average wage data. Predicted expenditure values were thencalculated for the consolidated counties, based on the estimated Box-Cox parameters. Finally, thepredicted expenditures were summed and compared for North Dakota's current 53 counties, the15 proposed super-counties, and the 26-county alternative.
5
Table 1. Populations in 1992 for the 15 Super-county Districts
District Counties PopulationCombined
1 Divide, Williams, Burke, Moutrail 32,928
2 Ward, Renville, McHenry, Bottineau 74,287
3 Rolette, Pierce, Benson, Towner, Ramsey 40,528
4 Cavalier, Pembina, Walsh 27,844
5 Grand Forks, Nelson 75,027
6 Cass, Traill 115,121
7 Griggs, Steele, Barnes 17,647
8 Richland, Ransom, Sargent 28,023
9 Emmons, Logan, McIntosh, LaMoure, Dickey 22,241
10 Eddy, Foster, Stutsman, Wells 34,021
11 Burleigh, Kidder, Sheridan 67,693
12 Dunn, Mercer, McLean, Oliver 25,484
13 Grant, Morton, Sioux 30,794
14 Adams, Bowman, Hettinger, Slope, Stark 33,277
15 Billings, Golden Valley, McKenzie 9,116

6
Table 2. Populations in 1992 for 26 Consolidated Counties
Counties PopulationCombined
1. Divide, Williams 23,475
2. Burke, Mountrail 9,453
3. Renville, Ward 60,466
4. Bottineau, McHenry 13,821
5. Rolette, Towner 16,416
6. Pierce, Benson 11,649
7. Ramsey, Nelson 16,641
8. Cavalier, Pembina 14,653
9. Walsh 13,191
10. Grand Forks 70,849
11. Griggs, Steele, Traill 14,004
12. Barnes 12,205
13. Cass 106,559
14. Ransom, Sargent 10,181
15. Richland 17,842
16. LaMoure, Dickey 11,113
17. Emmons, Logan, McIntosh 11,128
18. Eddy, Foster 6,638
19. Stutsman 21,838
20. Sheridan, Wells 7,590
21. Burleigh, Kidder 65,648
22. McLean, Mercer, Oliver 21,600
23. Morton, Grant, Sioux 30,794
24. Slope, Hettinger, Bowman, Adams 10,468
25. Dunn, Stark 26,693
26. Golden Valley, Billings, McKenzie 9,116

(1) Exp ' [ (2"%1)%2$1P8
&18
%2$2W8
&18
%2$3T 8&18
%2$4Y8&18
%2$5O%2$6C]&2 ,
7
Readers who wish to apply this method to other cases should note that the predictedvalues are calculated as non-linear functions of the estimated Box-Cox parameters. The formulafor calculating the predicted expenditure values is
where Exp is the predicted expenditure, 1 is the estimated theta parameter, 8 is the estimatedlambda parameter, " is the estimated constant, P is population, W is average wage, T istransportation cost, Y is year, O is oil extraction, C is coal extraction, and $ through $ are the1 6
estimated parameters for population, wage, transportation cost, year, oil extraction, and coalextraction, respectively. The calculations can easily be in a computer spreadsheet.
Statistical Results
Population has the expected positive and highly significant influence on total costs for allfour service categories (Table 3). The year has a statistically significant, positive influence ontotal costs for every category except roads and highways, for which it has a statisticallysignificant, negative influence. Oil and coal extraction have a highly significant, positive influenceon every service category except health and welfare. Oil and coal extraction have a statisticallysignificant, negative effect on health and welfare expenditures, probably reflecting less demand forsocial services in times of economic expansion. Similarly, wages have a positive effect on totalcosts for general government and public safety, but a negative influence on health and welfareexpenditures, although none of these effects are statistically significant. The transportation costvariable has a statistically significant, positive influence on county road and highway expenditures.
The coefficients of determination, or R coefficients in Table 3, suggest that most of the2
variance in expenditures is explained by the models. The R coefficients range from 0.652 for2
road and highway expenditures to 0.943 for health and welfare expenditures. However, the R2
coefficients are inflated by the large number of observations and exaggerate the predictive powerof the model. A better indication of the model's predictive power can be obtained by comparingthe standard deviation of the residuals to the mean expenditures (Table 3). The standarddeviation of residuals for general government and health and welfare are around 30 percent oftheir mean values, but the standard deviation of residuals for the other two categories are around53 percent of their mean values. This comparison suggests that many other variables influenceexpenditure levels than have been included in the statistical model.
When all variables except population are held constant at their means, estimated per capitacosts show large economies of size throughout the range of North Dakota county populations forgeneral government (Figure 2) and road and highway services (Figure 3). Estimated per capitacosts for general government services are 2.2 times as high for a population of 5,000 as for apopulation of 25,000. Estimated per capita costs for road and highway services are 2.6 times ashigh for a population of 5,000 as for a population of 25,000. Consolidation of at least some

8
general government and road and highway services would therefore be expected to result insubstantial per capita cost savings.
Estimated costs for road and highway services per mile of streets, roads, and highwaysalso decline with additional miles over the range observed in North Dakota counties. Doublingthe miles from the average of 2,157, while holding population constant at the mean, reducesestimated road and highway expenditures 41 percent, which is consistent with the approximately50 percent reduction for rural townships estimated by Deller, Chicoine, and Walzer (1988), Dellerand Nelson (1991), and Deller and Halstead (1994).
Table 3. Box-Cox Estimates of Total Expenditure Parameters1
Independent Variable Health & Welfare HighwaysGeneral Government Public Safety Roads &
Constant 15.78 16.67 43.02 -12.53(3.44) (3.50) (3.98) (1.19)
Population 0.522 0.940 2.863 0.531(3.42) (6.04) (5.10) (2.70)
Wage 0.302 0.976 0.770 0.227(2.69) (5.09) (2.32) (1.25)
Transportation Cost 0.184 0.250 -0.035 0.227(3.39) (3.90) (0.26) (2.59)
Year 1.252 8.785 18.045 -12.530(2.75) (3.04) (3.23) (1.19)
Oil 0.726E-3 0.177E-2 -0.147E-2 0.733E-2(2.90) (4.91) (3.34) (2.82)
Coal 0.116E-4 0.256E-4 -0.136E-3 0.204E-3(0.86) (1.04) (2.76) (2.48)
Lambda 0.195 0.224 0.124 0.3952
(4.79) (6.02) (3.90) (5.80)
Theta 0.070 0.120 0.230 0.1803
(1.45) (3.82) (6.31) (3.88)
R 0.871 0.873 0.943 0.6522
Mean 860.3 380.6 728.2 1,374.0
Standard Deviation of 274.9 203.5 210.6 720.9Residuals
The variables in parentheses are t-statistics. (All data were divided by 1,000).1
Lambda was used to transform the dependent variables.2
Theta was used to transform the dependent variables.3

9
Figure 2. General Government Expenditures Per Capita in North Dakota Counties
Figure 3. Road and Highway Expenditures Per Capita in North Dakota Counties
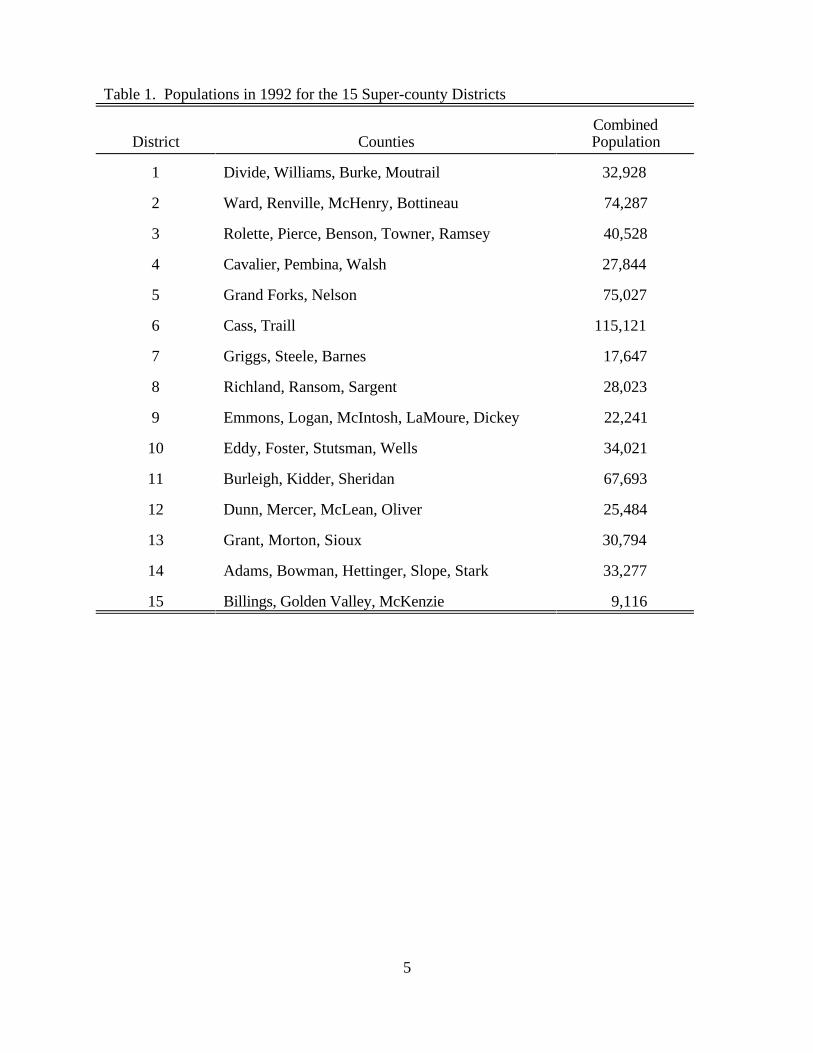
Estimated per capita costs show small economies of size for health and welfare services(Figure 4) and small diseconomies of size beyond a population of 70,000 for public safety services(Figure 5). The ratios of estimated per capita costs for a population of 5,000 to those for a
10
population of 25,000 are only 1.4 for public safety and 1.3 for health and human services. Sinceaccess to health, welfare, and public safety services is vital for many people, it is doubtful whetherthe potential cost savings from consolidating the units providing these services would offset theeconomic costs of reduced access.
However, transportation costs increase as counties are consolidated, so increasing populations by combining counties may increase the costs of government services rather thanreduce them. In addition, because the relationships are nonlinear, dividing one county's oil or coalextraction evenly among it and three other counties that have no extraction often results insubstantially higher (or lower in the case of health and welfare) estimated costs for the combinedfour counties than the sum of estimated costs in the four separate counties. As counties areconsolidated, the effects of transportation costs and summation of nonlinear relationshipssometimes increase per capita costs more than the increased population reduces per capita costs.
Figure 4. Health and Welfare Expenditures Per Capita in North Dakota Counties

11
Figure 5. Public Safety Expenditures Per Capita in North Dakota Counties
Cost Reduction Estimates
Estimates of total expenditures in North Dakota for the four categories of countygovernment services are 2.5 percent lower under the 15-county proposal than for the current 53counties. The reduction is equivalent to about $4 million in 1992. Assuming that the real socialdiscount rate is 5 percent (adjusted for inflation) and that the $2 million cost savings increase atthe inflation rate, the present value of cost savings from the 15-county consolidation will bepositive if the initial adjustment costs are less than $80 million.
However, costs for public safety services are estimated to increase in each of the15 super-county districts and costs for other service categories increase in five of the super-county districts (Table 4). Cost increases for public safety in the super-county districts rangefrom 6 percent to 130 percent. General government costs range from 33 percent lower to21 percent higher than before consolidation in the 15 super-county districts. Health and welfarecosts range from 50 percent lower to 2 percent higher than before consolidation. Road andhighway costs range from 42 percent lower to 54 percent higher than before consolidation. Forthe entire state, general government costs are reduced 8.3 percent, public safety costs increase34.9 percent, health and welfare costs decline 14.1 percent, and road and highway costs decline2.4 percent under the 15-county proposal.
Table 4. Estimated Percent Cost Savings for 15-County Proposal

12
Super HealthCounty General Public & Roads &District Counties Government Safety Welfare Highways
1 Divide, William, Burke, Mandrel 7.5 -43.5 23.3 -4.9
2 Ward, Renville, McHenry, -21.3 130.0 6.7 -11.2Bottineau
3 Rolette, Pierce, Benson, Towner, 2.2 -71.0 -2.3 14.8Ramsey
4 Cavalier, Pembina, Walsh 21.2 -12.0 19.8 27.5
5 Grand Forks, Nelson 0.0 -12.0 3.3 7.8
6 Cass, Traill 2.4 -8.6 7.6 4.5
7 Griggs, Steele, Barnes 22.9 -5.9 14.0 32.0
8 Richland, Ransom, Sargent 21.4 -7.1 18.0 28.7
9 Emmons, Logan, McIntosh, 32.9 -19.2 42.3 23.6LaMoure, Dickey
10 Eddy, Foster, Stutsman, Wells 22.4 -13.7 18.9 31.8
11 Burleigh, Kidder, Sheridan 2.7 -18.0 7.7 11.2
12 Dunn, Mercer, McLean, Oliver 9.6 -45.4 49.7 -54.3
13 Grant, Morton, Sioux 14.3 -15.3 11.4 26.2
14 Adams, Bowman, Hettinger, Slope, 19.1 -31.8 22.3 20.0Stark
15 Billings, Golden Valley, McKenzie 4.9 -54.5 27.9 -50.8
Regional differences in the benefits and costs of consolidation are apparent. Public safetycosts increase the most in northwestern and north-central North Dakota (super-county districts 1, 2,3, 12, and 15) under the 15-county proposal. Each of these super-county districts except district 3combine counties with widely different average salaries. Each of these super-county districts exceptdistrict 15 also have relatively high transportation costs. Road and highway costs only increase innorthwestern North Dakota (super-county districts 1, 2, 12, and 15). Again, each of these super-county districts combine counties with a wide range of average salaries. The least cost savings forgeneral government services occur when the most populated counties (Cass, Grand Forks, Burleigh,and Ward) are combined with lightly populated counties. Health and welfare cost savings aregreatest where counties with large amounts of oil and coal extraction are combined with countiesthat have little or no extraction.

13
Total cost savings are slightly greater for the 26-county alternative than for the 15-countyproposal (Table 5). Estimated expenditures in North Dakota for the four categories of services are3.2 percent lower for the 26-county alternative than for the current 53 counties. This reduction isequivalent to about $5 million in 1992. Although consolidation increases estimated public safetycosts in all but one case, the 26-county alternative reduces general government and health and welfare expenditures in every case. Road and highway expenditures are increased by consolidationin only three cases. Cost savings relative to the current 53 counties (excluding cases of noconsolidation) range from 1.2 percent to 31 percent for general government and from 2.8 percent to44 percent for health and welfare services. Changes in costs for public safety range from a0.8 percent reduction to a 55 percent increase. Changes in road and highway costs range from a36 percent reduction to a 51 percent increase. For the entire state, general government costs arereduced 7.0 percent, public safety costs increase 10.6 percent, health and welfare costs decline6.8 percent, and road and highway costs decline 2.2 percent under the 26-county proposal.
Discussion
The cost savings estimates strongly suggest that selective consolidation of some countygovernment services in some regions will reduce costs more than large-scale consolidation of allservices throughout the state. In particular, it appears that consolidating the public safety services ofone or more adjacent counties would generally increase rather than reduce costs. It appears that amoderate amount (e.g., the 26-county alternative) of consolidating general government and healthand welfare services in adjacent counties would provide positive cost savings throughout the state. Consolidation of road and highway services in one or more adjacent counties also appears to providecost savings in all but northwestern North Dakota.
An important implication is that at least the county sheriff's office (generally the largest publicsafety item) should be kept in all of the counties. Consolidation of public safety offices appears toincrease costs and reduces the quality of public safety services. Quality of public safety services islargely based on the quickness of response to threats and emergencies, the prevention of problemsthrough education and frequent patrols, and responsiveness to community preferences regarding howservices are provided. These quality factors would be reduced for the residents who are locatedfurther away from consolidated public safety offices than from the current county seats.
Since there is a strong economic argument for keeping public safety services in the currentcounty seats, the other categories of service should be examined in greater detail to see whetherother services should continue to be provided in the county seats. Quickness of response is alsoimportant for snow removal (a major road and highway activity) and some health and welfareservices. Access and local control over the quality of services are important for many generalgovernment (e.g., county clerk) and health and welfare services.

14
Table 5. Estimated Percent Cost Savings for 26-County Alternative
Public Health & Roads &Counties General Government Safety Welfare Highways
1. Divide, Williams 4.8 -14.3 8.5 -0.9
2. Burke, Mountrail 3.6 -16.1 2.8 -14.3
3. Renville, Ward 1.2 -12.0 5.9 0.3
4. Bottineau, McHenry 10.3 -15.6 6.8 17.4
5. Rolette, Towner 13.3 -7.4 9.4 20.7
6. Pierce, Benson 17.9 -3.3 11.1 24.1
7. Ramsey, Nelson 12.4 -9.7 7.0 22.3
8. Cavalier, Pembina 16.0 -5.1 11.9 21.8
9. Walsh n/a n/a n/a n/a
10. Grand Forks n/a n/a n/a n/a
11. Griggs, Steele, Traill 25.6 -5.0 14.7 35.2
12. Barnes n/a n/a n/a n/a
13. Cass n/a n/a n/a n/a
14. Ransom, Sargent 19.4 0.8 11.4 26.4
15. Richland n/a n/a n/a n/a
16. LaMoure, Dickey 18.1 -4.2 10.9 24.4
17. Emmons, Logan, McIntosh 26.1 -13.2 13.3 35.7
18. Eddy, Foster 19.2 -2.9 5.5 30.31
19. Stutsman n/a n/a n/a n./a
20. Sheridan, Wells 18.3 -1.8 7.7 25.5
21. Burleigh, Kidder 0.4 -11.5 4.8 5.7
22. McLean, Mercer, Oliver 8.3 -31.1 43.7 -39.3
23. Morton, Grant, Sioux 14.3 -15.3 11.4 26.2
24. Slope, Hettinger, Bowman, Adams 30.6 -12.1 19.1 35.0
25. Dunn, Stark 5.5 -18.0 10.1 3.4
26. Golden Valley, Billings, McKenzie 4.9 -54.5 27.9 -50.8

15
Selective consolidation of these services is already occurring in North Dakota. Countycourts (general government) have been merged into district courts. Adjacent counties share someof the more specialized health and welfare services staff. County road and highway services nowprovide much of their maintenance and construction work through contracts with privatecompanies that are large enough to achieve many economies of size.
The large ranges of cost savings from county consolidations under either the 15-countyproposal or the 26-county alternative suggest that more than population and geography need tobe examined in deciding where consolidation may reduce costs of services. Increasedtransportation costs are the largest reason for the increased cost of public safety services underboth the 15-county proposal and the 26-county alternative. Nonlinear relationships betweenexpenditures and the explanatory variables also cause costs to rise in many cases as counties arecombined. Furthermore, the assumption that wages would be averaged as counties areconsolidated is questionable. Employees may be able to resist any wage reductions, resulting inwages being set at the maximum of wages in the consolidated counties. If so, total cost savingsfor the 15-county proposal would decline from 4.9 percent to 3.0 percent and public safety costswould increase 31 percent rather than 25 percent.
Conclusions
The results of this analysis provide a preliminary indication of the pitfalls that would beencountered in consolidating county government services. Due to the broad categories ofservices and reliance on secondary data for the statistical analysis, much of the variation inexpenditures for county government services still has not been explained. Further research shouldestimate economies of size for more specific services using additional explanatory variables andprimary data. Adjustment costs and economic impacts from reduced quality of services afterconsolidation also need to be estimated. However, the results demonstrate that consolidationsometimes increases rather than reduces costs of county government services and needs to becarefully evaluated before it is proposed.

16
References
Bangsund, Dean A., and Jay A. Leitch. 1990. Costs of Government Services in North DakotaCounties. Agricultural Economics Report No. 253. Dept. of Agricultural Economics,North Dakota State University, Fargo.
Bangsund, Dean A., F. Larry Leistritz, Janet K. Wanzek, Dale Zetocha, and Holly E. Bastow-Shoop. 1991. North Dakota Trade Areas: An Overview. Agricultural Economics ReportNo. 265. Dept. of Agricultural Economics, North Dakota State University, Fargo.
Boroughs, Don L., Robert F. Black, and Sara Collins. 1991. "Counties in Crisis." U.S. News &World Report 11(22):52-55. November 25, 1991.
Bunch, Beverly S., and Robert P. Strauss. 1992. "Municipal Consolidation: An Analysis of theFinancial Benefits for Fiscally Distressed Small Municipalities." Urban Affairs Quarterly27(4):615-29.
Bureau of Economic Analysis, Department of Commerce, Washington, DC.
Bureau of Labor Statistics, Department of Labor, Washington, DC. Consumer Price Index.
Condrey, Stephen E. 1994. "Organizational and Personnel Impacts on Local GovernmentConsolidation: Athens-Clarke County, Georgia." Journal of Urban Affairs 16(4):371-83.
Deller, Steven C., David L. Chicoine, and Norman Walzer. 1988. "Economies of Size and Scopein Rural Low-Volume Roads." The Review of Economics and Statistics 70 (3):459-65.
Deller, Steven C., and Charles H. Nelson. 1991. "Measuring the Economic Efficiency ofProducing Rural Road Services." American Journal of Agricultural Economics 72(1):194-201.
Deller, Steven C., and John M. Halstead. 1994. "Efficiency in the Production of Rural RoadServices: The Case of New England Towns." Land Economics 70(2):247-59.
Dimeo, Jean. 1991. "More Bankruptcies Ahead for Localities." American City & County106(9):12.
Energy Information Administration. 1984-93. State Energy Price and Expenditure Report. U.S.Dept. of Energy, Washington, DC.
Fox, William F. 1980. Size Economies in Local Government Services: A Review. RuralDevelopment Research Report No. 22. U.S. Department of Agriculture, Washington,DC, August 1980.

17
Greene, W. H. 1992. LIMDEP: User's Manual and Reference Guide, Version 6.0. Bellport,NY: Econometric Software, Inc.
Hinds, Michael deCourcy. 1991. "Cash Crises Force Localities in U.S. to Slash Services;Hardship is Widespread; Aid Cutbacks and Recession Cause Cities and Counties toRedefine Missions." The New York Times 140(June 3, 1991):A1,B6.
Johnson, Kenneth M., John P. Pelissero, David B. Holian, and Michael T. Maly. 1995. "LocalGovernment Fiscal Burden in Nonmetropolitan America." Rural Sociology 60(3):381-98.
Lemov, Penelope. 1993. "In Hard Times, Even Governments Must Share." Governing6(12):27-27.
Mahtesian, Charles. 1995. "The Civic Therapist." Governing 8(12):26-27.
North Dakota Tax Commissioner, personal communication, September, 1993
Office of State Auditor. 1983-92. State of North Dakota. Audit Report, various counties.
Reiger, Anjanette. 1993. "Super County Proposal Starts People Thinking About Costs ofGovernment Service Delivery." Jamestown Sun, January 25, 1993. pp. 1-2.
Rose, Gordon D. 1971. "Local Government Reorganization Revisited." Supplying andFinancing State and Local Public Services in the Great Plains States, Everett E. Peterson,editor. Great Plains Agr. Council Publication No. 53. Dept. of Agr. Economics,University of Nebraska, Lincoln. pp. 15-23.
Rubin, Laura S. 1996. "The Fiscal Position of the State and Local Government Sector:Developments in the 1990s." Federal Reserve Bulletin 82(4):302-11.
Thompson, Stephanie. 1992. "Spotting a Trend: Fire Department Consolidation." AmericanCity & County 107(5):24-30.
Ward, Janet. 1992. "Can Two Live as Cheaply as One?" American City & County 107(2):30-36.
Wetzel, Dale. 1993. "It's a Bird, It's a Plane, It's N.D.'s “Super Counties.” Fargo Forum. January 11, 1993. p. A6.