Embed Size (px)
Citation preview
CostBenefit Analysis of Photovoltaic Solar Energy Use in an “Average” US Commercial Building
Elvin Bora Wu Hao
Nathan Mariano Deniz Ozensoy Eduardo Zulueta
Abstract
The potentially drastic effects of climate change call for reduction of greenhouse gas emissions, a major source of which is energy consumption by buildings in the commercial sector. Solar energy is an especially promising renewable energy source for such buildings. Previous analyses have attempted to assess the economic viability of solar energy for buildings on a large regional scale or have looked at the potential benefits for specific buildings or neighborhoods; few have addressed the cost/benefit profile presented to an “average” building owner considering installation of solar panels. In this analysis, we compare the costs of solar powered energy to the costs of traditionally sourced energy for a building over a 28year period. The results show that at current prices and rates of energy usage, solar panels are marginally zmore beneficial than traditional sources of the extended time period, suggesting that new building owners should seriously consider installation of solar panels in their individual cases. This study presents valuable insight into the economic situation facing individual building owners and by extension, the commercial building sector of the United States as a whole.
1. Introduction
Climate change resulting from anthropogenic greenhouse gas (GHG) emissions is widely
agreed to be one of the most severe problems facing mankind (IPCC, 2014). If global
temperatures increase by more than 2 degrees Celsius above preIndustrial level (a mostly
agreedupon limit for the maximum acceptable increase; Priddle, 2014), the consequences could
be devastatingpotentially including species going extinct, coastal cities underwater, and
increasingly severe and frequent extreme weather events (storms, drought, wildfires, etc.).
Greenhouse gas emissions have continued to increase despite of international policy efforts to
curb such emissions, such as the Kyoto Protocol (Olivier et al., 2014). The energy sector
represents roughly twothirds of all GHG emissions worldwide (Priddle, 2014), and within the
United States, 41% of total energy consumption was in residential and commercial buildings in
Page 2
2014 (“How much energy…”, 2015). Thus, improving the energy efficiency of buildings could
potentially yield significant reductions in GHG emissions.
Solar photovoltaic (PV) technology is perhaps the best renewable energy technology with
which this could be achieved. It has the least negative impact on the environment (Solangi et al.,
2011) and has a number of other advantages, such as silent energy generation, avoidance of
transmission losses due to the generation of energy at the place of usage, and lower costs when
compared to other renewable energy methods (Brito et al., 2011). Given its modular nature, it is
also uniquely suited to integration with building construction.
There is a robust literature that has explored the potential for use of solar panels to
generate energy for buildings. Hestnes (2000) was perhaps the first to provide a comprehensive
look at the possibilities, whereas Henning (2007) assessed the feasibility of using solar panels for
air conditioning specifically. A number of papers have used 2D modeling (Brito, 2010;
Winginton, 2010) and 3D modeling (Santos et al., 2014; Redweik, Catita, and Brito, 2013; Catita
et al., 2014) to assess the potential energy yield of specific buildings and neighborhoods with
installation of solar panels. However, in focusing only on where solar panel installation would be
most efficient, these studies have tended to neglect the costbenefit aspect of the problem, instead
assuming that solar is a worthwhile investment and attempting to develop methods to identify the
places where it would be most effective. Even if a place is particularly suited for solar energy,
the panels would only actually be installed if the they were more economically efficient than the
alternative options (assuming that building owners would not install the panels for altruistic
reasons). For a long time, installation costs for PV solar panels were prohibitively high, leading
to limited implementation, but improvements in technology and implementation of government
Page 3
incentive policies mean that the question of costeffectiveness of solar panels is one that can
legitimately be addressed.
On this subject, there is also a fairly robust literature. Authors have performed
costbenefit analyses of PV energy generation when used in a number of settings, including Italy,
Spain, India, Canada, island nations, and desert climates (Orioli and Di Gangi, 2013;
FernándezMembrive, LastraBarro, and TolónBecerra, 2015; Kohle, Kohle, and Joshi, 2002;
Branker, Pathak, and Pearce, 2011; Kaldellis et al., 2008; Shaahid and Elhadidy, 2006). Different
authors have approached the problem of costbenefit analyses of PV from various angles, with
some focusing on the effects of a state’s policy incentives on the profitability of solar systems
(Spertino, Di Leo, and Cocina, 2013; FernándezMembrive, LastraBarro, and TolónBecerra,
2015), others assessing the costs and benefits of specific variants of PV technology (Azzopardi et
al., 2011; Emmott, Urbina, and Nelson, 2011; Roes et al., 2009; Powell et al., 2012), and others
comparing costs between different regions (Mateus and Oliveira, 2008; Peters et al., 2011). The
level of analysis also varies from case studies of specific buildings (Zhai et al., 2006; Desideri,
Proietti, and Sdringola, 2009) to assessments of the potential of PV systems to service entire
regions (Fthenakis, Mason, and Zweibel, 2008; Branker, Pathak, and Pearce, 2011).
Yet, upon review, it emerges that few studies have attempted to draw general conclusions
about the economic viability of solar PV from the perspective of owners of individual buildings
in a given region. As mentioned, studies have tended to neglect the costbenefit analysis by
looking only at ways to model the potential energy yield of a given building, assessed the
viability of solar PV at a regional level, or have performed costbenefit analyses on specific
buildings, not attempting to draw general conclusions. Furthermore, the studies that have
Page 4
attempted to assess whether solar panels installed on individual buildings could prove
costeffective for owners in a specific region (Orioli and Di Gangi, 2013; Ramadhan and Naseeb,
2010; Mateus and Oliveira, 2008; Ren et al., 2009; Li, Boyle and Reynolds, 2011) have not
looked at the case of the United States. Orioli and Di Gangi (2013) comprehensively assess the
economic viability of solar PV in a southern Italian city, whereas Ramadhan and Naseeb (2010)
take a similar approach for Kuwait. Ren, Gao, and Ruan (2008) and Li, Boyle, and Reynolds
(2011) analyze the economic viability of solar PV installed in residential properties in Japan and
Ireland, respectively. MartinezCesena, Azzopardi, and Mutale (2012) propose a general
methodology for assessment of domestic PV systems and use the United Kingdom as their case
study. Chong et al. (2011) assess the viability windsolar hybrids in urban highrises around the
world, while Mateus and Oliveira (2008) compare PV economics in buildings for Rome, Berlin,
and Lisbon.
In this study, we attempt to address this problem by performing a costbenefit analysis of
a solar PV system installed on a commercial building in the United States. Using nationallevel
projections of solar PV costs and energy prices, we assess the economic viability of a
commercial building using solar panels as its energy source over a 28year period. This analysis
is intended to provide broader insights into the status of solar PV as a potential energy source for
buildings in the US than a study of a particular building or neighborhood would provide. Our
analysis suggests that for the average building in the United States, solar PV prices are now low
enough that solar constitutes a viable longterm investment. For individual cases, this means that
buildings in conditions favorable to solar panels (low energy usage, high irradiation, etc.) should
find solar PV to be an especially attractive option.
Page 5
The first section outlines the methodology of the costbenefit analysis and the data used.
Then, we discuss the results and discuss potential costs and benefits that were not considered in
our model. Finally, we examine policy implications and draw conclusions.
2. Methodology and Data
To assess the economic viability of solar cell PV technology over the lifetime of
commercial sector buildings, we conducted a costbenefit analysis on an average commercial
building having its energy provided by solar panels. This entailed calculating the total costs
incurred through installation and maintenance of a solar energy system over a given time period
and comparing these costs to those of energy provided by traditional fossil fuel sources. The net
result (benefits minus costs), which can be negative, yields the results for an individual building.
Even though the median lifespan of a building in the commercial sector is between 50
and 60 years (D&R International, Ltd, 2012), we have limited the time span of our analysis to 28
years due to data restrictions. Commercial sector buildings are any building that provides
services in education, food sales, food service, health care, lodging, mercantile, office space,
public assembly, public order and safety, religious worship, warehouse and storage, as well as
other service (besides food and retail) (D&R International, Ltd, 2012). In our analysis of the
average agent, we use the median size for a building in the commercial sector: 2500 sq feet
(D&R International, Ltd, 2012). To calculate the building’s energy consumption, we use the
commercial sector average energy consumption per square foot as projected by the Annual
Energy Outlook 2015. We also assume that the energy consumption of the average building in
the commercial sector lasts for 12 uninterrupted hours per day. We use this assumption to
Page 6
calculate the rate at which energy is consumed per day (our data provides us with absolute
quantities of energy consumed annually), which allows us to estimate the approximate amount of
photovoltaic cells that need to be installed to provide the necessary flow of energy. Given the
amount of energy consumed per day, we estimate the price of generating this energy through
solar power with pricing data from the US Department of Energy SunShot program, which
include yearly projections over the period of analysis. These data account for nationwide solar
prices, which includes regional variations in financial incentives and local market prices. A more
refined study would also consider annual fluctuations in day light received by the photovoltaic
cells based on season and location to more precisely pinpoint the production capacity required by
the photovoltaic cell farm.
The data consist of projections through 2040 of energy prices for the commercial
sector(coal, natural gas, distilled fuel, electricity), commercial sector energy usage information,
and carbon emissions provided by the Annual Energy Outlook 2015, which is published by the
United States Energy Information Administration (U.S Energy Information Association, 2015).
We also use data provided by the US Department of Energy SunShot program to provide
estimations of current and future prices of PV solar systems. Finally, we employ a technical
support document on the Social Cost of Carbon for Regulatory Impact Analysis 2013 to calculate
commercial sector wide impact of carbon emissions on the US economy (Interagency Working
Group on Social Cost of Carbon, United States Government, 2013). Since all prices were
reported in 2013 dollars in the Annual Energy Outlook 2015 report, we also report our findings
in 2013 dollars. Where prices were stated in a different year’s values, we converted the prices to
their 2013 equivalents using actual inflation values.
Page 7
There are a number of assumptions made for the analysis. First, we assume that PV
module costs are going to stabilize in the near future, as predicted by the SunShot program
(Feldman, et al., 2014). Unless soft costs associated with installation of PV systems such as labor
costs change significantly, the overall price of PV systems will also be stable, which is what we
ultimately assume. We also assumed that the PV cells will have to be renewed every 20 years (an
expectation below industry expectation), and will produce 1% less energy per year (Center for
Alternative Technology, n.d.). Furthermore, we assumed that the current PV cell technology is
advanced enough to provide the energy demands of any new building in the commercial sector.
This assumption is justified by the wide variety of “zero energy” buildings that already meet all
their energy needs from renewable sources, mainly solar power. Examples of such buildings in
the United States are the Environmental Tech Center at Sonoma State University and the Adam
Joseph Lewis Centre for Environmental Studies at the Oberlin College (U.S. Department of
Energy Energy Efficiency and Renewable Energy, 2008). The Sun Ship is another prominent
example of a zero energy commercial building, located in Freiburg, Germany (Heinze & Voss,
2009).
It is debatable whether an alreadyconstructed building could be retrofitted to be
completely solar powered, given that a significant portion of energy savings in the zero energy
buildings are achieved by using thicker windows and otherwise better isolation that reduces heat
loss. However, we do not consider retrofitting costs, which are difficult to specify on average.
We are also primarily concerned with new building construction. Similarly, we do not compare
any differences in construction expenses that might be necessary for zero energy buildings, such
as improved insulation (Hernandez & Kenny, 2009). The primary intent is to focus on how solar
Page 8
energy costs compared to fossil fuel costs; thus, the analysis would be unnecessarily complicated
by consideration of other energysaving measures that could be used in conjunction with either
energy source.
The saving reported are not discounted for factors such as how much a given agent
discounts future expenditures. Furthermore, since there are no reliable projections for inflation
over the middle to longterm time future, we assume that the economy performs close to the
FED goal of 2% inflation per year in calculating the projected value of savings and costs (Board
of Governors of the Federal Reserve System, 2015).
4. Results
Our costbenefit analysis of the average agent presented on the appendix shows that a
median sized commercial building that operates at the sector average energy intensity cuts even
in terms of lifetime operational energy expenditure. In other words, theoretically powering a
typical commercial building solely using distributed photovoltaic solar power costs roughly the
same as powering that building with traditional sources of energy. However, this does not
include the economic value of the reduced carbon emissions achieved by the agent. Some plots
describing our findings are presented below; please refer to Appendix 1 for the full results.
Page 9
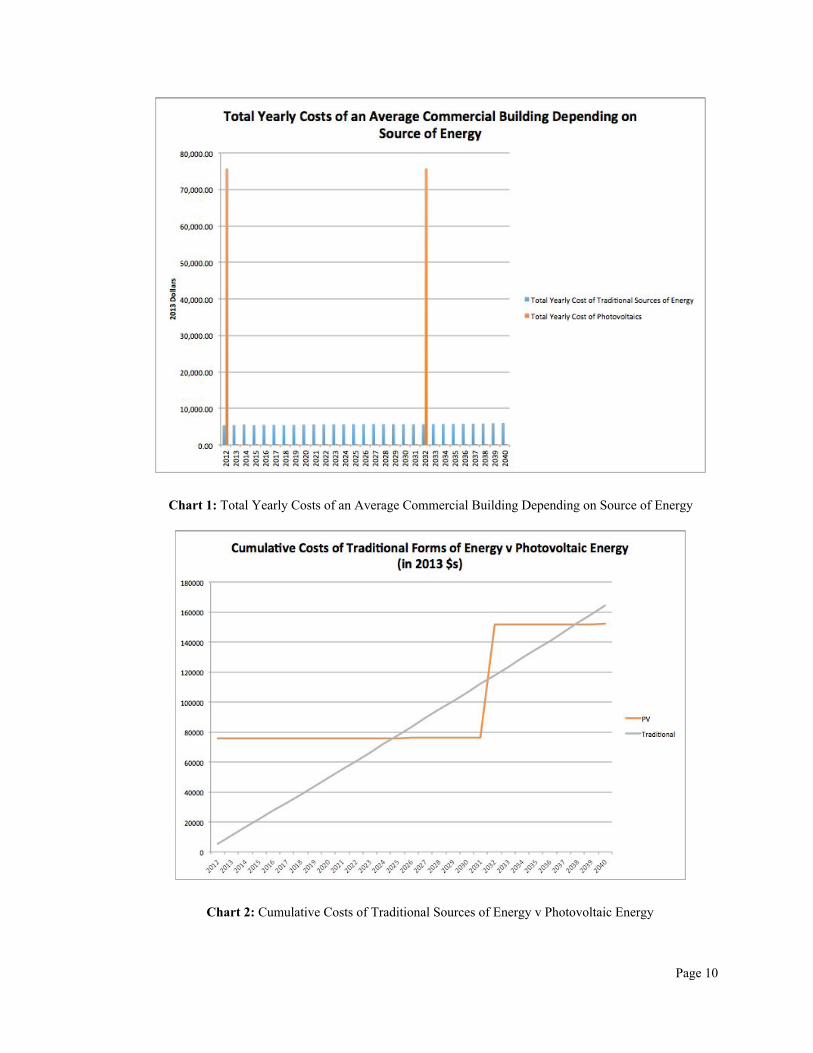
Chart 1: Total Yearly Costs of an Average Commercial Building Depending on Source of Energy
Chart 2: Cumulative Costs of Traditional Sources of Energy v Photovoltaic Energy
Page 10
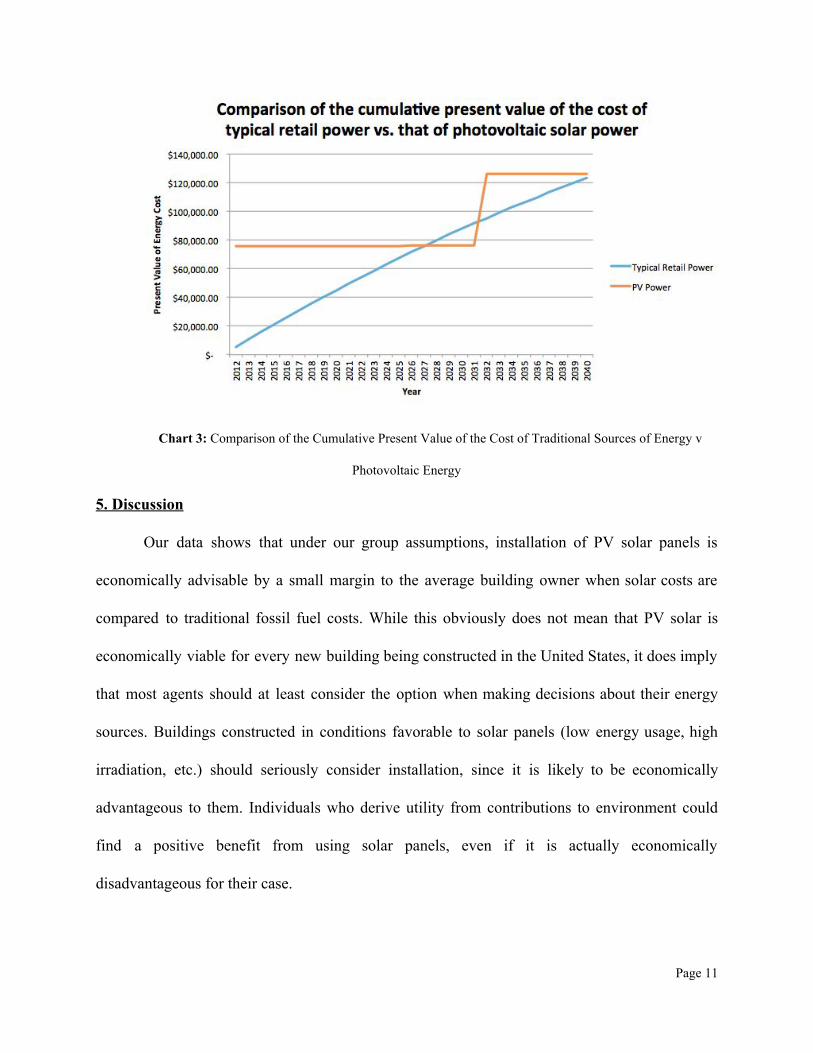
Chart 3: Comparison of the Cumulative Present Value of the Cost of Traditional Sources of Energy v
Photovoltaic Energy
5. Discussion
Our data shows that under our group assumptions, installation of PV solar panels is
economically advisable by a small margin to the average building owner when solar costs are
compared to traditional fossil fuel costs. While this obviously does not mean that PV solar is
economically viable for every new building being constructed in the United States, it does imply
that most agents should at least consider the option when making decisions about their energy
sources. Buildings constructed in conditions favorable to solar panels (low energy usage, high
irradiation, etc.) should seriously consider installation, since it is likely to be economically
advantageous to them. Individuals who derive utility from contributions to environment could
find a positive benefit from using solar panels, even if it is actually economically
disadvantageous for their case.
Page 11
On this subject, there are a number of potentially relevant factors that do not enter into
our costbenefit analysis. If we extrapolate this finding to the commercial sector, this implies that
solar panels could be tremendously advantageous for the sector as a whole. On a scale this large,
installation of solar panels could yield significant noneconomic benefits in the form of avoided
carbon costs. A private owner of an individual building is unlikely to internalize these benefits in
their costbenefit calculation since they are of a public nature, but they are definitely relevant to
consider when looking at potential adoption of solar panels on a large scale. Solar energy also
avoids additional GHG emissions produced in the transferral of fossil fuel energy from source to
destination. The data show that almost twice the amount of traditionally sourced electrical energy
provided to the commercial sector is lost in the transfer of the energy from the source to its
destination (U.S Energy Information Association, 2015). We calculated the potential economic
cost of continued carbon emissions by the commercial building sector in terms of dollars per
metric ton, using the emissions data from the 2015 Annual Energy Outlook (Interagency
Working Group on Social Cost of Carbon, United States Government, 2013; see Appendix 2 for
calculations). The analysis showed carbon emissions would cause $932 billion dollars in
damages to the economy nation wide over the 28 year period of analysis. If we were to include
this estimated cost under the savings associated with transitioning to photovoltaic cell
technology, then the nationwide cost of using PV cells to supply energy is only 77% of the
projected energy costs with the current composition of the energy market.
Furthermore, installers of solar panels benefit from improved property values, since
future owners would benefit from the avoided costs of traditionally sourced energy. Thus, the
owner could potentially recuperate some of the costs of installations if the building were to be
Page 12
sold. Using solar as a building’s source of energy also reduces dependence on volatile fuel
prices, which fluctuate greatly from year to year and impact the profitability of the building. In
this way, solar energy reduces future uncertainty. Lastly, in many states, business owners are
allowed to apply accelerated depreciation accounting to their solar power investments,
effectively resulting in additional tax credits.
However, there are several reasons why rates of adoption of solar panels are currently
low and may continue to be low into the near future. These reasons can also be thought of as
costs that are not considered by in our costbenefit analysis. Though we have showed that the
investment in solar panels is marginally beneficial over a 28 year period, discounting of future
benefits in favor of avoiding present costs might mean that agents would be unwilling to incur
the large upfront costs necessary for installation of solar panels. The relatively small, but
ongoing payments incurred by fossil fuel energy might be more appealing, even if they are
higher than the costs of solar panels in the longterm. This can be alleviated by the increasing the
availability of payment schemes that distributes over time the installation costs. This can likely
be accomplished by the market through the agency of financial intermediaries such as banks.
However, given the substantial benefit to the US economy as large, a central solution with active
involvement of government agencies to encourage the adoption of PV technologies should be
strongly considered.
Furthermore, over the last couple years, oil prices have surprisingly plummeted. This
was due to technological developments such as fracking, making previously unreachable or
otherwise uneconomical to excavate oil sources economically feasible to exploit, and the recent
softening of US policies that hindered the export of US oil. As a result of these changesone
Page 13
technological, the other policydriveninternational supply of oil suddenly increased and prices
crashed. Even though the model used by the EIA in the Annual Energy Outlook 2015 expects oil
prices to recover immediately and increase a great deal before 2040, this may not actually occur,
given that oil prices are still falling. Furthermore, technological innovations that replace, or
increase the efficiency with which we use fossil fuels may also keep the downward pressure on
fossil fuel prices. In the case that fossil fuel prices do not increase as estimated, then energy
prices will be lower than the model estimates, and PV cells would be relatively costlier.
Path dependence could also play a role. This refers to the idea that it is less costly to for
an individual to continue with the status quo than it is to acquire the information and resources
necessary to implement a new systemin this case, PV solar panels for one’s building. Though
these are onetime costs, when combined with the large upfront economic cost of solar panels, it
can make for a very costly transition.
6. Policy Implications
Some of the costs impeding adoption of solar panels could potentially be offset by quality
policymaking. There are a number of potential policy options that the US government has
available to encourage investment in commercial solar PV systems. In this section, we focus on
three policy areas that directly affect the total cost of commercial PV systems and the impact of
high startup costs on the solar market.
One of the most important issues surrounding distributed solar in the United States is the
regulatory support of the Third Party PPA model of solar panel ownership and use. This
ownership model allows buildingowners to purchase electricity at prices lower than retail levels
Page 14
while avoiding the large initial capital expenditures needed to buy and install the solar panels
(Solar Power Purchase Agreements, 2011). The model is set up as follows: a building owner
interested in utilizing roof space to generate solar powered electricity, but who does not want to
spend the large upfront costs needed to install the panels, will sign a power purchasing
agreement with a solar project developer who builds, owns, and operates the solar panels on the
customer’s building. The developer would then sell the electricity back to the customer at the
rate stipulated by the PPA, which is generally at or lower than retail prices (Solar Power
Purchase Agreements, 2011).
PPA contracts address one of the largest barriers to entry associated with commercial
solar PV system investments: high startup costs. As our costbenefit analysis illustrated, the
high cost of buying the solar panels and installing them vastly outweighs the costs of maintaining
the equipment. Thus, while our calculated present value of the total cost of a PV system is
approximately equal to that of a typical retailpowered building, buying typical retail power
offers the additional advantage of spreading out costs over time and may thus disincentivize
potential investors who do not have access to cheaper sources of capital. By taking on a PPA
agreement, building owners do not have to deal with the huge startup costs because they would
essentially replicate the cost of energy they would be paying per year if they chose to pay for
typical retail power. The payments that the enduser (buildingowner) would make are typically
less than or equal to typical retail rates with slight price increases related to inflation and
decreases in the efficiency of the PV equipment. Thus, in a typical PPA contract made today, the
building owner would be paying roughly similar amounts to the solar power provider, as they
would have paid to typical utilities.
Page 15
As of 2010, 25 states have imposed the same regulations on third party developers of
solar panels as on utility companies, effectively making PPA contracts unprofitable due to the
increased administration costs associated with the regulations. (Kollins, Speer, and Cory, 2010).
Although running a thorough costbenefit analysis of deregulating PPA contracts is outside the
scope of our study, state governments who have currently not deregulated the businesses of solar
power third party developers should strongly consider doing so because of the tremendous
startup costs related to illustrated by our costbenefit analysis. As solar power has reached
similar cost levels to gridbacked energy over a longterm investment, the most pressing concern
for potential investors is no longer overall lifetime cost but solar PV’s high startup costs, and
policies that may spread out lifetime investment costs should be supported.
Another key policy issue surrounding distributed generation is the mechanism by which
commercial and residential owners of PV systems can sell electricity generated by panels back to
utility providers. The main systems currently in place around the world are feedintariffs (FIT)
and net metering. In a net metering system, which is the main system in place in the USA, an
electric meter records the excess electricity produced by the PV systems. If the amount of PV
generation is larger than consumption at the end of a billing period, the household or building
owner is paid for the excess PVgenerated electricity at retail electricity prices or with an
equivalent credit. If the amount of electricity consumed is higher than amount of electricity
generated, then the building owner is billed at retail prices (“Net Metering”, 2011).
In a feedin tariff system, the government mandates electric utilities and grid companies
to purchase all electricity produced by PV system owners at a set rate. The building owner then
purchases all of the electricity they consume at standard electricity rates, which are lower than
Page 16

the rates at which the electricity was originally sold (Yamamoto, 2012). The difference between
these two rates yields profits for solar energy producers (subsidized by the utilities companies),
with further profits made if the building produces more electricity than it consumes.
Feedintariff systems have not caught on in the US, with only 6 states having adopted FIT
policies as of 2013, but are the most widely used renewable energy policy in the world (“Feedin
Tariffs”, 2014).
Governments considering a change in their metering systems should understand how
these policies affect the energy costs of commercial PV system owners. Thus, we have modeled
out the net energy costs of a commercial building owner under a net metering system vs. those
costs under a FIT system. The graph is shown below:
Chart 4: Comparison of net Energy Cost of PV with Net Metering policy, Feed in Tariffs policy, and market prices
The costs under a net metering system are identical to the previous graph showing the
cost of PV because in our model, we assume that the building produces as much energy as it
Page 17
consumes; if it produced excess energy, the building would accrue profits. A feedin tariff results
in gradually declining energy costs as the building owner profits by selling their energy to utility
owners at aboveretail prices. Here, we modeled a FIT that results in payments of 10% above the
retail electricity price, leading to a lower cost of solar energy over a 28year period based on
current prices versus retail prices. As we see by the gradual decline of net energy costs, this
system is best understood as a subsidy incentivizing production once the system is installed. The
main drawback with FIT versus other policies is that they do not directly address high startup
costs. High startup costs could be argued to be more pressing than merely reducing the total net
energy cost over the life of the investment, especially now, since current systems under net
metering are already just as cheap on average as retail energy payments. On the other hand, FIT
schemes encourage cheaper financing and so indirectly deal with high startup costs as well.
The final policy we discuss in this section is the 30% investment tax credit that is
scheduled to reduce to 10% after 2016. Since no subsidies are incorporated into the original
analysis, the orange line on the previous graph represents the costs associated with a solar PV
system without the tax credit. Below, we show the effect of an extended 30% tax credit,
assuming that the installation costs all fall under property eligible for the tax credit:
Page 18
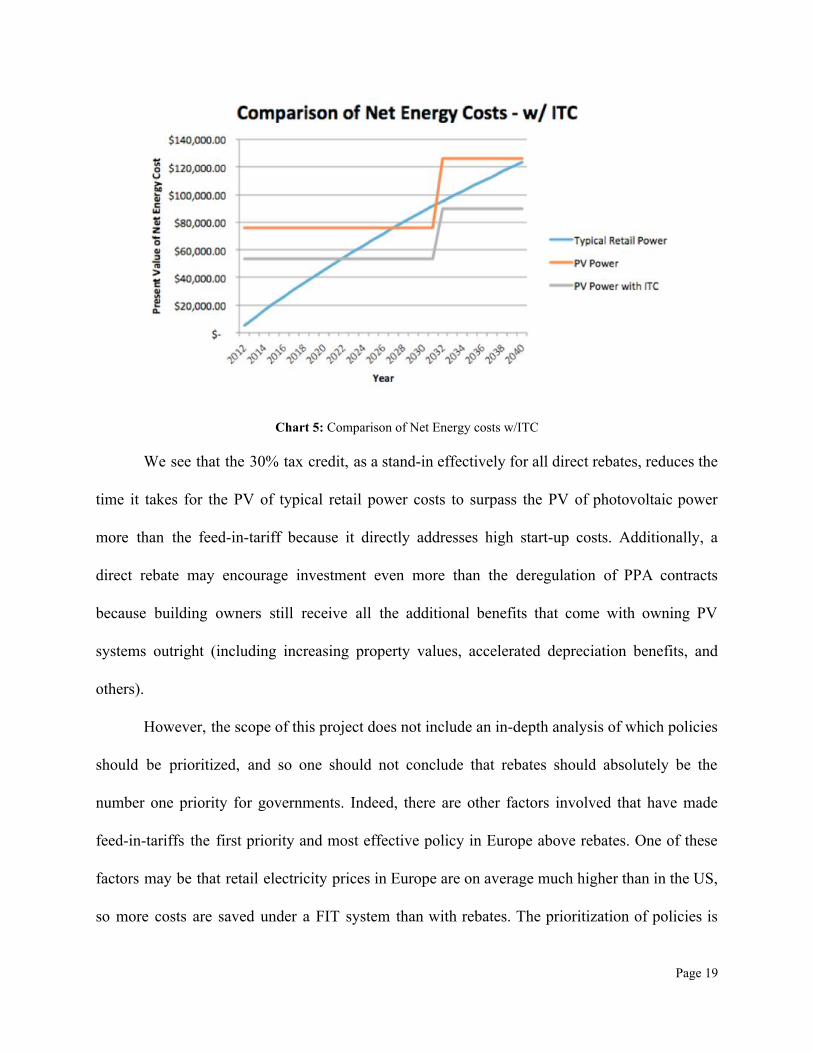
Chart 5: Comparison of Net Energy costs w/ITC
We see that the 30% tax credit, as a standin effectively for all direct rebates, reduces the
time it takes for the PV of typical retail power costs to surpass the PV of photovoltaic power
more than the feedintariff because it directly addresses high startup costs. Additionally, a
direct rebate may encourage investment even more than the deregulation of PPA contracts
because building owners still receive all the additional benefits that come with owning PV
systems outright (including increasing property values, accelerated depreciation benefits, and
others).
However, the scope of this project does not include an indepth analysis of which policies
should be prioritized, and so one should not conclude that rebates should absolutely be the
number one priority for governments. Indeed, there are other factors involved that have made
feedintariffs the first priority and most effective policy in Europe above rebates. One of these
factors may be that retail electricity prices in Europe are on average much higher than in the US,
so more costs are saved under a FIT system than with rebates. The prioritization of policies is
Page 19
also heavily dependent based on what type of commercial buildings is being considered
(highenergy vs. lowenergy) and the retail prices in each state.
7. Conclusion
Current retail energy prices in the US and the recordlow cost of solar PV power have
made it so that PV power is a realistic option for many commercial building owners even without
large subsidies or feedintariffs. This information suggests that the most pressing matter to
commercial solar investors is the large startup costs associated with these investments, and that
an extension of the ITC and deregulation of PPA contracts may prove helpful with this issue.
However, in states with low retail electricity prices, feedintariffs may be necessary to further
promote investment in solar energy nationwide. Studies that should be considered to expound
upon our findings include: analyses of investors’ prioritization of startup costs vs. total cost over
the life of a PV system, the potential negative effects of deregulating PPA contracts, and what
specific areas in the US would most benefit from a feedintariff based on retail energy prices.
Page 20
Bibliography
Azzopardi, B., Emmott, C. M., Urbina, A., Krebs, F., Mutale, J., & Nelson, J. (2011). Economic
assessment of solar electricity production from organicbased photovoltaic modules in a
domestic environment. Energy And Environmental Science,4(10), 37413753.
Board of Governors of the Federal Reserve System. (2015, January 26). FRB: Why does the
Federal Reserve aim for 2 percent inflation over time? Retrieved from Board of
Governors of the Federal Reserve System:
http://www.federalreserve.gov/faqs/economy_14400.htm
Branker, K., Pathak, M., & Pearce, J. (2011). A review of solar photovoltaic levelized cost of
electricity. Renewable And Sustainable Energy Reviews, 1544704482.
doi:10.1016/j.rser.2011.07.104
Brito, M., Gomes, N., Santos, T., & Tenedório, J. (2012). Photovoltaic potential in a Lisbon
suburb using LiDAR data. Solar Energy,86283288. doi:10.1016/j.solener.2011.09.031
Carlson, D. E., Wronski, C. R. (1976). Amorphous silicon solar cell. Appl. Phys. Lett. 28, 671.
Carr, G. (2012), Sunny uplands: alternative energy will no longer be alternatives,The Economist.
Retrieved on 20121228.
Catita, C., Redweik, P., Pereira, J., & Brito, M. (2014). Extending solar potential analysis in
buildings to vertical facades. Computers And Geosciences, 66112.
doi:10.1016/j.cageo.2014.01.002
Center for Alternative Technology. (n.d.). How long do solar electric PV panels last? | CAT
Information Service. Retrieved November 2015, from Center for Alternative Technology:
http://info.cat.org.uk/questions/pv/lifeexpectancysolarPVpanels
Page 21
Cheng, Y. J., Yang, S. H. & Hsu, C. S. (2009). Synthesis of conjugated polymers for organic
solar cell applications. Chemical Reviews, 109(11), 58685923.
Chong, W., Naghavi, M., Poh, S., Mahlia, T., & Pan, K. (2011). Technoeconomic analysis of a
wind–solar hybrid renewable energy system with rainwater collection feature for urban
highrise application. Applied Energy, 8840674077. doi:10.1016/j.apenergy.2011.04.042
Couture, T and Cory, K. (2009, May). State Clean Energy Policies Analysis Project: An Analysis
of Renewable Energy FeedinTariffs in the United States. National Renewable Energy
Laboratory.
Collins, R. W.; Ferlauto, A. S.; Ferreira, G. M.; Chen, C.; Koh, J.; Koval, R. J.; Lee, Y.; Pearce,
J. M.; Wronski, C. R. (2003). "Evolution of microstructure and phase in amorphous,
protocrystalline, and microcrystalline silicon studied by real time spectroscopic
ellipsometry". Solar Energy Materials and Solar Cells 78: 143.
Desideri, U., Proietti, S., & Sdringola, P. (2009). Solarpowered cooling systems: Technical and
economic analysis on industrial refrigeration and airconditioning applications. Applied
Energy,8613761386. doi:10.1016/j.apenergy.2009.01.011
D&R International, Ltd. (2012, March). 2011 Buildings Energy Data Book. Retrieved November
2015, from Buildings Energy Data Book:
http://buildingsdatabook.eren.doe.gov/docs/DataBooks/2011_BEDB.pdf
Emmott, C. J., Urbina, A., & Nelson, J. (2012). Environmental and economic assessment of
ITOfree electrodes for organic solar cells. Solar Energy Materials And Solar Cells,
97(Dedicated to the Global Organic Photovoltaics (GOPV) conference in Hangzhou,
China), 1421. doi:10.1016/j.solmat.2011.09.024
Page 22
Energy Star. (n.d.). The difference between source and site energy | ENERGY STAR Buildings
and Plants | ENERGY STAR. Retrieved November 2015
FeedIn Tariffs. (2014, September 8). Retrieved November 19, 2015, from
http://www.nrel.gov/tech_deployment/state_local_governments/basics_tariffs.html
FeldMan, D., Rovert Margolis, Barbose, G., Margolis, R., Bolinger, M., Chung, D., . . . Wiser,
R. (2014, September 22). SunShot. Retrieved from energy.gov:
http://www.nrel.gov/docs/fy14osti/62558.pdf
FernándezMembrive, V. J., LastraBravo, X. B., & TolónBecerra, A. (2015). Costbenefit
analysis of changes in energy in building technology in Southeast Spain. Energy &
Buildings, 1032937. doi:10.1016/j.enbuild.2015.06.026
Fthenakis, V., Mason, J. E., & Zweibel, K. (2009). The technical, geographical, and economic
feasibility for solar energy to supply the energy needs of the US. Energy Policy,
37387399. doi:10.1016/j.enpol.2008.08.011
Heinze, M., & Voss, K. (2009, Fall). Goal: Zero Energy Building Exemplary Experience Based
on the Solar Estate Solarsiedlung Freiburg am Schlierberg, Germany. Journal of Green
Building, 4, 93100.
Henning, H. (2007). Solar assisted air conditioning of buildings – an overview. Applied Thermal
Engineering, 2717341749. doi:10.1016/j.applthermaleng.2006.07.021
Henry, J. S. Perovskites: the emergence of a new era for lowcost, highefficiency solar cells.
The Journal of Physical Chemistry Letters, 4, 36233630.
Hernandez, P., & Kenny, P. (2009). From net energy to zero energy buildings: Defining life
cycle zero energy buildings (LCZEB). Elsevier, 815821.
Page 23
Hestnes, A. G. (1999). Building Integration Of Solar Energy Systems.Solar Energy, 67181187.
doi:10.1016/S0038092X(00)000657
How extending the investment tax credit would affect US solar build. (2015, September 15).
Bloomberg New Energy Finance. Retrieved November 27, 2015, from
http://www.seia.org/sites/default/files/resources/BNEF_SEIA%20Solar%20Forecast_15
%20September%202015.pdf
How much energy is consumed in residential and commercial buildings in the United States?
(2015, April 3). Retrieved December 1, 2015, from U.S. Energy Information
Administration website: http://www.eia.gov/tools/faqs/faq.cfm?id=86&t=1
Interagency Working Group on Social Cost of Carbon, United States Government. (2013, May).
Technical Support Document: Technical Update on the Social Cost of Carbon for
Regulatory Impact Analysis Under Executive Order 12866 . Retrieved from
https://www.whitehouse.gov/sites/default/files/omb/inforeg/social_cost_of_carbon_for_ri
a_2013_update.pdf
IPCC, 2014: Climate Change 2014: Synthesis Report. Contribution of Working Groups I, II and
III to the Fifth Assessment Report of the Intergovernmental Panel on Climate Change
[Core Writing Team, R.K. Pachauri and L.A. Meyer (eds.)]. IPCC, Geneva, Switzerland,
151 pp.
Kaldellis, J., Zafirakis, D., Kaldelli, E., & Kavadias, K. (2009). Cost benefit analysis of a
photovoltaicenergy storage electrification solution for remote islands. Renewable
Energy, 3412991311. doi:10.1016/j.renene.2008.09.014
Page 24
Kolhe, M., Kolhe, S., & Joshi, J. (2002). Economic viability of standalone solar photovoltaic
system in comparison with dieselpowered system for India. Energy Economics,
24155165. doi:10.1016/S01409883(01)000950
Kollins, Speer, and Cory. (2010, February). Solar PV Project Financing: Regulatory and
Legislative Challenges for Third Party PPA System Owners. National Renewable Energy
Laboratory.
Li Z, Boyle F, Reynolds A. Domestic application of solar PV systems in Ireland: the reality of
their economic viability. Energy 2011;36:5865–76.
Jayawarena, K. D. G., Rozanski, L. J., Mills, C. A., Beliatis, M. J., Nismy, N. A. & Silva, S. R.
(2013), “InorganicsinOrganics”: recent developments and outlook for 4G polymer solar
cells, Nanoscale, 5, 84118427.
MartinezCesena, E. A., Azzopardi, B., & Mutale, J. (2013). Assessment of domestic
photovoltaic systems based on real options theory. Progress In Photovoltaics, 21(2),
250262. doi:10.1002/pip.2208
Mateus, T., & Oliveira, A. C. (2009). Energy and economic analysis of an integrated solar
absorption cooling and heating system in different building types and climates. Applied
Energy, 86949957. doi:10.1016/j.apenergy.2008.09.005
Net Metering. (2011, February 7). Retrieved December 1, 2015, from
http://www.seia.org/policy/distributedsolar/netmetering
Olivier, J. G.J., Muntean, M., JanssensMaenhout, G., & Peters, J. A. (2014). Trends in Global
CO2 Emissions. The Hague, Netherlands: PBL Netherlands Environmental Assessment
Agency.
Page 25
Orioli, A., & Di Gangi, A. (2014). Review of the energy and economic parameters involved in
the effectiveness of gridconnected PV systems installed in multistorey buildings.
Applied Energy,113955969. doi:10.1016/j.apenergy.2013.08.014
Peters, M., Schmidt, T. S., Wiederkehr, D., & Schneider, M. (2011). Shedding light on solar
technologies—A technoeconomic assessment and its policy implications. Energy
Policy,39(Sustainability of biofuels), 64226439. doi:10.1016/j.enpol.2011.07.045
Photovoltaic cell conversion efficiency basics”, U.S. Department of Energy. Retrieved 6 Sep
2014.
Powell, D. M., Winkler, M. T., Choi, H. J., Simmons, C. B., Needleman, D. B., & Buonassisi, T.
(2012). Crystalline silicon photovoltaics: a cost analysis framework for determining
technology pathways to reach baseload electricity costs. Energy And Environmental
Science, 5(3), 58745883.
Price per watt. In wikipedia. Retrieved August 16, 2015, from https://en.wikipedia.org
/wiki/Price_per_watt#cite_note3.
Priddle, R. (Ed.). (2015). Energy and Climate Change: World Energy Outlook Special Report.
Paris, France: International Energy Agency.
Ramadhan, M., & Naseeb, A. (2011). The cost benefit analysis of implementing photovoltaic
solar system in the state of Kuwait.Renewable Energy, 3612721276.
doi:10.1016/j.renene.2010.10.004
Redweik, P., Catita, C., & Brito, M. (2013). Solar energy potential on roofs and facades in an
urban landscape. Solar Energy, 97332341. doi:10.1016/j.solener.2013.08.036
Page 26

Ren, H., Gao, W., & Ruan, Y. (2009). Economic optimization and sensitivity analysis of
photovoltaic system in residential buildings. Renewable Energy: An International
Journal, 34(3), 883889. doi:10.1016/j.renene.2008.06.011
Roes, A. L., Alsema, E. A., Blok, K., & Patel, M. K. (2009). Exante environmental and
economic evaluation of polymer photovoltaics. Progress In Photovoltaics, 17(6),
372393. doi:10.1002/pip.891
Santos, T., Gomes, N., Freire, S., Brito, M., Santos, L., & Tenedório, J. (2014). Applications of
solar mapping in the urban environment.Applied Geography, 514857.
doi:10.1016/j.apgeog.2014.03.008
Shaahid, S., & Elhadidy, M. (2007). Technical and economic assessment of gridindependent
hybrid photovoltaic–diesel–battery power systems for commercial loads in desert
environments. Renewable And Sustainable Energy Reviews,1117941810.
doi:10.1016/j.rser.2006.03.001
Solangi, K., Islam, M., Saidur, R., Rahim, N., & Fayaz, H. (2011). A review on global solar
energy policy. Renewable And Sustainable Energy Reviews, 1521492163.
doi:10.1016/j.rser.2011.01.007
Solar Power Purchase Agreements. (2011, March). United States Environmental Protection
Agency. Retrieved November 25, 2015, from
http://www.seia.org/policy/distributedsolar/netmetering
Spertino, F., Di Leo, P., & Cocina, V. (2013). Economic analysis of investment in the rooftop
photovoltaic systems: A longterm research in the two main markets. Renewable And
Sustainable Energy Reviews, 28531540. doi:10.1016/j.rser.2013.08.024
Page 27
U.S Energy Information Association. (2015). Annual Energy Outlook 2015 with projections to
2040.
U.S. Department of Energy Energy Efficiency and Renewable Energy. (2008, 06 28). Zero
Energy Buildings: Zero Energy Buildings Database. Retrieved November 2015, from
U.S. Department of Energy Energy Efficiency and Renewable Energy:
zeb.buildinggreen.com
Vincenzi D, Busato A, Stefancich M & Marthinell G. (2008). Concentrating PV system based on
spectral separation of solar radiation. Physica Status Solidi A, 206, 375378.
Wiginton, L., Nguyen, H., & Pearce, J. (2010). Quantifying rooftop solar photovoltaic potential
for regional renewable energy policy.Computers, Environment And Urban Systems,
34(Geospatial Cyberinfrastructure), 345357. doi:10.1016/j.compenvurbsys.2010.01.001
Yamamoto, Y. (2012). Pricing electricity from residential photovoltaic systems: A comparison of
feedin tariffs, net metering, and net purchase and sale. Solar Energy, 86(9), 26782685.
doi:10.1016/j.solener.2012.06.001
Zhai, X., Wang, R., Dai, Y., Wu, J., Xu, Y., & Ma, Q. (2007). Solar integrated energy system for
a green building. Energy & Buildings, 39985993. doi:10.1016/j.enbuild.2006.11.010
Page 28
APPENDIX 1: Cost-Benefit Analysis for an Average Commercial Building
TAB1:
Average Commercial Building Energy Consumption
TAB2: Commercial Sector Energy Consumption by Source
TAB3:
Average Commercial Building Energy Consumption by Source
TAB4: Cost of Energy for the Average Building
TAB5:
Average Commercial Building Lost Electricity
TAB6: Cost of PV Installation
TAB7:
Results of the Analysis
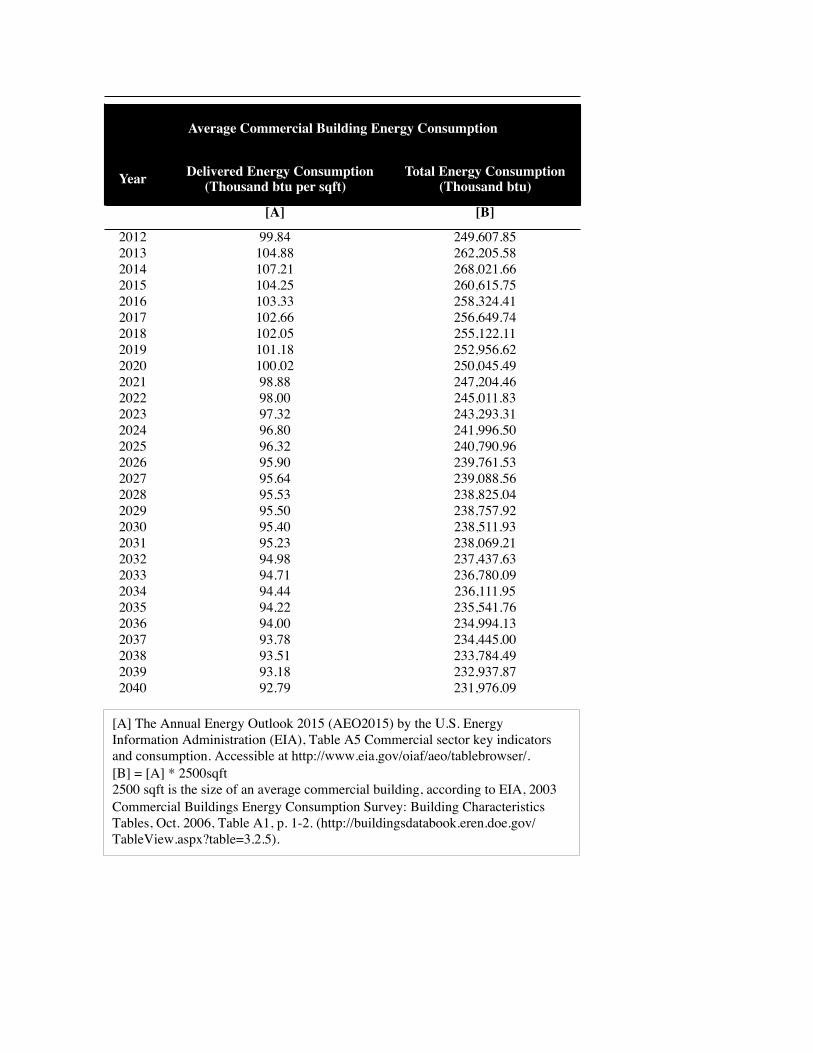
Year Delivered Energy Consumption (Thousand btu per sqft)
Total Energy Consumption (Thousand btu)
[A] [B]
2012 99.84 249,607.852013 104.88 262,205.582014 107.21 268,021.662015 104.25 260,615.752016 103.33 258,324.412017 102.66 256,649.742018 102.05 255,122.112019 101.18 252,956.622020 100.02 250,045.492021 98.88 247,204.462022 98.00 245,011.832023 97.32 243,293.312024 96.80 241,996.502025 96.32 240,790.962026 95.90 239,761.532027 95.64 239,088.562028 95.53 238,825.042029 95.50 238,757.922030 95.40 238,511.932031 95.23 238,069.212032 94.98 237,437.632033 94.71 236,780.092034 94.44 236,111.952035 94.22 235,541.762036 94.00 234,994.132037 93.78 234,445.002038 93.51 233,784.492039 93.18 232,937.872040 92.79 231,976.09
Average Commercial Building Energy Consumption
[A] The Annual Energy Outlook 2015 (AEO2015) by the U.S. Energy Information Administration (EIA), Table A5 Commercial sector key indicators and consumption. Accessible at http://www.eia.gov/oiaf/aeo/tablebrowser/. [B] = [A] * 2500sqft 2500 sqft is the size of an average commercial building, according to EIA, 2003 Commercial Buildings Energy Consumption Survey: Building Characteristics Tables, Oct. 2006, Table A1, p. 1-2. (http://buildingsdatabook.eren.doe.gov/TableView.aspx?table=3.2.5).
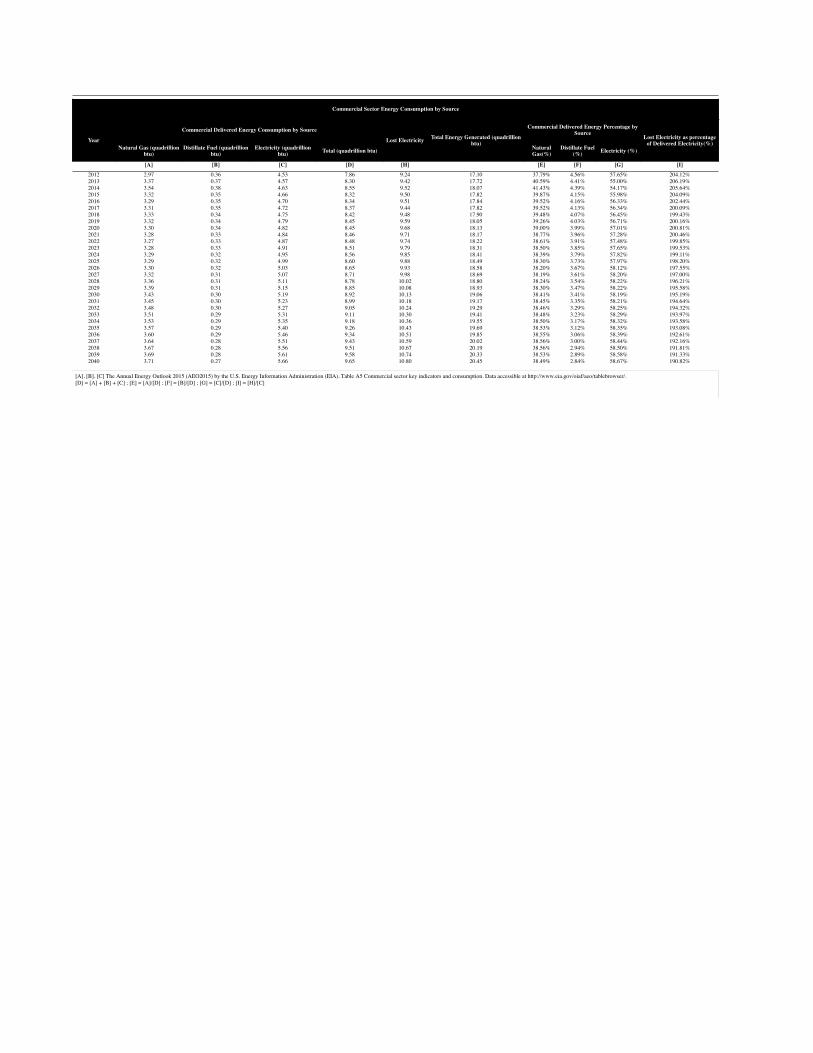
Natural Gas (quadrillion btu)
Distillate Fuel (quadrillion btu)
Electricity (quadrillion btu) Total (quadrillion btu) Natural
Gas(%)Distillate Fuel
(%) Electricity (%)
[A] [B] [C] [D] [H] [E] [F] [G] [I]2012 2.97 0.36 4.53 7.86 9.24 17.10 37.79% 4.56% 57.65% 204.12%2013 3.37 0.37 4.57 8.30 9.42 17.72 40.59% 4.41% 55.00% 206.19%2014 3.54 0.38 4.63 8.55 9.52 18.07 41.43% 4.39% 54.17% 205.64%2015 3.32 0.35 4.66 8.32 9.50 17.82 39.87% 4.15% 55.98% 204.09%2016 3.29 0.35 4.70 8.34 9.51 17.84 39.52% 4.16% 56.33% 202.44%2017 3.31 0.35 4.72 8.37 9.44 17.82 39.52% 4.13% 56.34% 200.09%2018 3.33 0.34 4.75 8.42 9.48 17.90 39.48% 4.07% 56.45% 199.43%2019 3.32 0.34 4.79 8.45 9.59 18.05 39.26% 4.03% 56.71% 200.16%2020 3.30 0.34 4.82 8.45 9.68 18.13 39.00% 3.99% 57.01% 200.81%2021 3.28 0.33 4.84 8.46 9.71 18.17 38.77% 3.96% 57.28% 200.46%2022 3.27 0.33 4.87 8.48 9.74 18.22 38.61% 3.91% 57.48% 199.85%2023 3.28 0.33 4.91 8.51 9.79 18.31 38.50% 3.85% 57.65% 199.53%2024 3.29 0.32 4.95 8.56 9.85 18.41 38.39% 3.79% 57.82% 199.11%2025 3.29 0.32 4.99 8.60 9.88 18.49 38.30% 3.73% 57.97% 198.20%2026 3.30 0.32 5.03 8.65 9.93 18.58 38.20% 3.67% 58.12% 197.55%2027 3.32 0.31 5.07 8.71 9.98 18.69 38.19% 3.61% 58.20% 197.00%2028 3.36 0.31 5.11 8.78 10.02 18.80 38.24% 3.54% 58.22% 196.21%2029 3.39 0.31 5.15 8.85 10.08 18.93 38.30% 3.47% 58.22% 195.58%2030 3.43 0.30 5.19 8.92 10.13 19.06 38.41% 3.41% 58.19% 195.19%2031 3.45 0.30 5.23 8.99 10.18 19.17 38.45% 3.35% 58.21% 194.64%2032 3.48 0.30 5.27 9.05 10.24 19.29 38.46% 3.29% 58.25% 194.32%2033 3.51 0.29 5.31 9.11 10.30 19.41 38.48% 3.23% 58.29% 193.97%2034 3.53 0.29 5.35 9.18 10.36 19.55 38.50% 3.17% 58.32% 193.58%2035 3.57 0.29 5.40 9.26 10.43 19.69 38.53% 3.12% 58.35% 193.08%2036 3.60 0.29 5.46 9.34 10.51 19.85 38.55% 3.06% 58.39% 192.61%2037 3.64 0.28 5.51 9.43 10.59 20.02 38.56% 3.00% 58.44% 192.16%2038 3.67 0.28 5.56 9.51 10.67 20.19 38.56% 2.94% 58.50% 191.81%2039 3.69 0.28 5.61 9.58 10.74 20.33 38.53% 2.89% 58.58% 191.33%2040 3.71 0.27 5.66 9.65 10.80 20.45 38.49% 2.84% 58.67% 190.82%
Commercial Delivered Energy Consumption by Source
Year
Commercial Delivered Energy Percentage by Source
Commercial Sector Energy Consumption by Source
Lost Electricity Total Energy Generated (quadrillion btu)
Lost Electricity as percentage of Delivered Electricity(%)
[A], [B], [C] The Annual Energy Outlook 2015 (AEO2015) by the U.S. Energy Information Administration (EIA), Table A5 Commercial sector key indicators and consumption. Data accessible at http://www.eia.gov/oiaf/aeo/tablebrowser/. [D] = [A] + [B] + [C] ; [E] = [A]/[D] ; [F] = [B]/[D] ; [G] = [C]/[D] ; [I] = [H]/[C]
Natural Gas(%) Distillate Fuel (%) Electricity (%) Natural Gas (million btu)
Distillate Fuel (million btu)
Electricity (million btu) Total
[A] [C] [D] [E] [F] [G] [H][B1] [B2] [B3]
2012 249,607.85 37.79% 4.56% 57.65% 94.33 11.38 143.89 249.61 204.12% 293.722013 262,205.58 40.59% 4.41% 55.00% 106.43 11.57 144.20 262.21 206.19% 297.342014 268,021.66 41.43% 4.39% 54.17% 111.05 11.78 145.20 268.02 205.64% 298.582015 260,615.75 39.87% 4.15% 55.98% 103.91 10.82 145.88 260.62 204.09% 297.722016 258,324.41 39.52% 4.16% 56.33% 102.08 10.74 145.50 258.32 202.44% 294.562017 256,649.74 39.52% 4.13% 56.34% 101.44 10.61 144.60 256.65 200.09% 289.332018 255,122.11 39.48% 4.07% 56.45% 100.73 10.38 144.01 255.12 199.43% 287.192019 252,956.62 39.26% 4.03% 56.71% 99.32 10.19 143.45 252.96 200.16% 287.122020 250,045.49 39.00% 3.99% 57.01% 97.51 9.99 142.55 250.05 200.81% 286.252021 247,204.46 38.77% 3.96% 57.28% 95.84 9.78 141.59 247.20 200.46% 283.822022 245,011.83 38.61% 3.91% 57.48% 94.61 9.57 140.84 245.01 199.85% 281.462023 243,293.31 38.50% 3.85% 57.65% 93.67 9.37 140.26 243.29 199.53% 279.852024 241,996.50 38.39% 3.79% 57.82% 92.90 9.17 139.93 242.00 199.11% 278.602025 240,790.96 38.30% 3.73% 57.97% 92.22 8.99 139.59 240.79 198.20% 276.662026 239,761.53 38.20% 3.67% 58.12% 91.60 8.80 139.36 239.76 197.55% 275.312027 239,088.56 38.19% 3.61% 58.20% 91.30 8.63 139.16 239.09 197.00% 274.152028 238,825.04 38.24% 3.54% 58.22% 91.33 8.46 139.03 238.83 196.21% 272.802029 238,757.92 38.30% 3.47% 58.22% 91.45 8.29 139.01 238.76 195.58% 271.882030 238,511.93 38.41% 3.41% 58.19% 91.60 8.13 138.78 238.51 195.19% 270.892031 238,069.21 38.45% 3.35% 58.21% 91.53 7.97 138.57 238.07 194.64% 269.712032 237,437.63 38.46% 3.29% 58.25% 91.31 7.81 138.31 237.44 194.32% 268.772033 236,780.09 38.48% 3.23% 58.29% 91.11 7.65 138.01 236.78 193.97% 267.702034 236,111.95 38.50% 3.17% 58.32% 90.91 7.50 137.71 236.11 193.58% 266.572035 235,541.76 38.53% 3.12% 58.35% 90.76 7.34 137.44 235.54 193.08% 265.372036 234,994.13 38.55% 3.06% 58.39% 90.60 7.18 137.21 234.99 192.61% 264.282037 234,445.00 38.56% 3.00% 58.44% 90.41 7.03 137.01 234.45 192.16% 263.272038 233,784.49 38.56% 2.94% 58.50% 90.15 6.88 136.76 233.78 191.81% 262.322039 232,937.87 38.53% 2.89% 58.58% 89.74 6.73 136.46 232.94 191.33% 261.102040 231,976.09 38.49% 2.84% 58.67% 89.29 6.59 136.10 231.98 190.82% 259.69
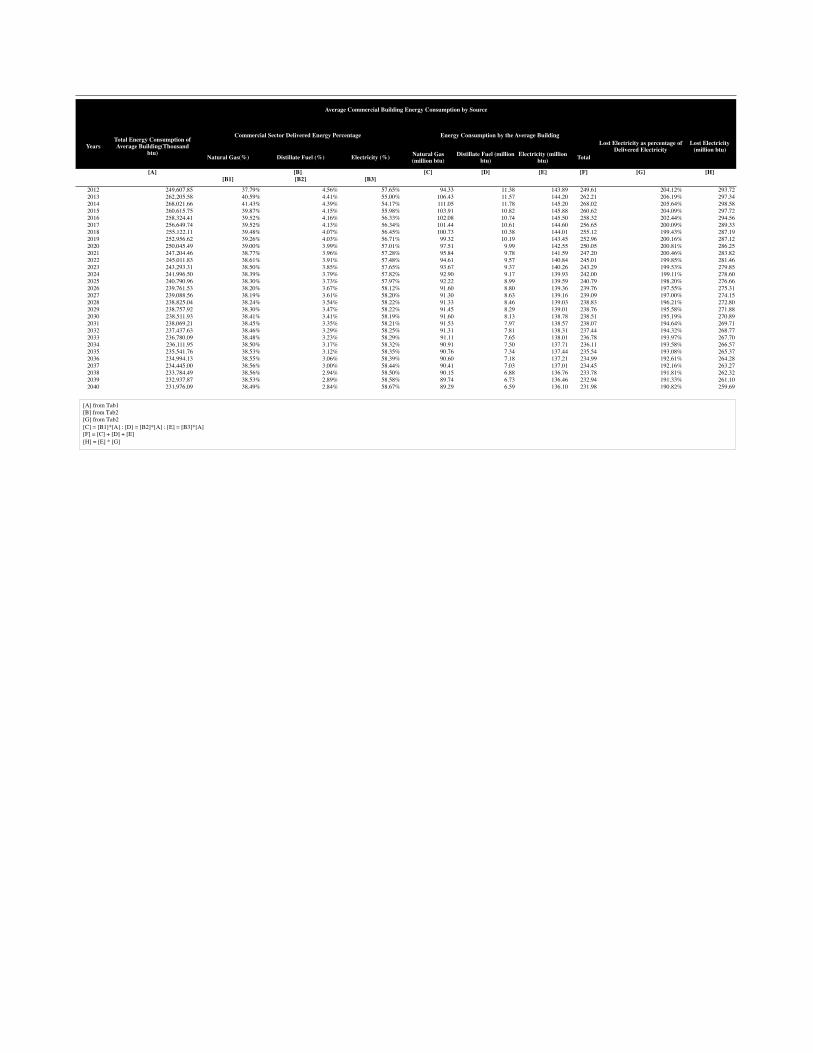
Commercial Sector Delivered Energy Percentage Energy Consumption by the Average Building
[B]
Average Commercial Building Energy Consumption by Source
YearsTotal Energy Consumption of Average Building(Thousand
btu)Lost Electricity as percentage of
Delivered Electricity Lost Electricity
(million btu)
[A] from Tab1 [B] from Tab2 [G] from Tab2 [C] = [B1]*[A] ; [D] = [B2]*[A] ; [E] = [B3]*[A] [F] = [C] + [D] + [E] [H] = [E] * [G]
Natural Gas Distillate Fuel Electricity Natural Gas Distillate Fuel Electricity Total Natural Gas Distillate Fuel Electricity Total
[E]
2012 8.16 26.75 29.99 94.33 11.38 143.89 249.61 769.50 304.56 4,315.89 5,389.94 5,389.942013 8.12 26.68 29.72 106.43 11.57 144.20 262.21 864.48 308.59 4,285.54 5,458.61 5,349.442014 8.58 25.66 30.02 111.05 11.78 145.20 268.02 952.51 302.20 4,358.20 5,612.91 5,390.632015 8.49 18.37 29.76 103.91 10.82 145.88 260.62 882.63 198.81 4,341.45 5,422.88 5,103.982016 8.52 20.09 30.36 102.08 10.74 145.50 258.32 869.54 215.79 4,417.52 5,502.85 5,075.652017 8.53 20.33 30.51 101.44 10.61 144.60 256.65 865.27 215.66 4,411.80 5,492.72 4,964.992018 8.57 20.38 30.32 100.73 10.38 144.01 255.12 863.53 211.59 4,365.58 5,440.71 4,819.612019 9.06 20.67 30.59 99.32 10.19 143.45 252.96 900.13 210.53 4,388.31 5,498.97 4,773.802020 9.55 20.97 31.14 97.51 9.99 142.55 250.05 931.29 209.34 4,438.84 5,579.47 4,746.812021 9.88 21.36 31.69 95.84 9.78 141.59 247.20 946.56 208.92 4,486.60 5,642.08 4,704.072022 10.05 21.86 31.90 94.61 9.57 140.84 245.01 951.19 209.18 4,493.21 5,653.59 4,619.392023 10.24 22.30 32.16 93.67 9.37 140.26 243.29 959.07 208.84 4,510.68 5,678.60 4,547.032024 10.38 22.75 32.16 92.90 9.17 139.93 242.00 963.87 208.62 4,499.65 5,672.14 4,451.032025 10.54 23.22 32.49 92.22 8.99 139.59 240.79 971.96 208.65 4,534.69 5,715.29 4,395.192026 10.69 23.72 32.57 91.60 8.80 139.36 239.76 978.95 208.80 4,539.56 5,727.31 4,316.342027 10.63 24.23 32.70 91.30 8.63 139.16 239.09 970.62 209.07 4,550.60 5,730.29 4,232.222028 10.51 24.76 32.78 91.33 8.46 139.03 238.83 959.78 209.44 4,557.03 5,726.24 4,144.642029 10.46 25.29 32.62 91.45 8.29 139.01 238.76 956.62 209.74 4,534.39 5,700.74 4,043.662030 10.40 25.84 32.59 91.60 8.13 138.78 238.51 952.28 210.11 4,522.35 5,684.74 3,951.662031 10.53 26.42 32.58 91.53 7.97 138.57 238.07 964.17 210.59 4,514.74 5,689.50 3,875.882032 10.68 27.00 32.71 91.31 7.81 138.31 237.44 974.85 210.92 4,524.85 5,710.62 3,812.452033 10.83 27.64 32.88 91.11 7.65 138.01 236.78 986.72 211.52 4,538.28 5,736.52 3,753.152034 10.96 28.27 33.00 90.91 7.50 137.71 236.11 996.72 211.90 4,544.78 5,753.39 3,688.912035 11.12 28.91 33.14 90.76 7.34 137.44 235.54 1,009.67 212.19 4,554.18 5,776.04 3,629.362036 11.31 29.58 33.22 90.60 7.18 137.21 234.99 1,024.32 212.42 4,558.21 5,794.96 3,568.422037 11.52 30.26 33.41 90.41 7.03 137.01 234.45 1,041.18 212.69 4,577.47 5,831.34 3,519.012038 11.80 31.02 33.75 90.15 6.88 136.76 233.78 1,063.88 213.34 4,615.56 5,892.78 3,484.962039 12.21 31.75 34.12 89.74 6.73 136.46 232.94 1,095.45 213.64 4,656.25 5,965.34 3,457.322040 12.62 32.45 34.52 89.29 6.59 136.10 231.98 1,126.97 213.84 4,697.90 6,038.72 3,429.85
TOTAL: 164,519.31 125,239.39
Year
[B][A] [C]
Commercial Sector Energy Prices by Source (in 2013$/million btu) Energy Consumption by the Average Building (in million btu) Cost of Energy for the Average Building (in 2013$s)
Present Value of Cost of Energy
[A] The Annual Energy Outlook 2015 (AEO2015) by the U.S. Energy Information Administration (EIA), Table A3 Energy Prices by Sector and Source, United States. All prices are in 2013 dollars. Data accessible at http://www.eia.gov/oiaf/aeo/tablebrowser/. [B] from Tab3 [E] For PV, used discount rate as 0.98: http://www.federalreserve.gov/faqs/economy_14400.htm [C] = [A] * [B] for each source
YearCommercial Sector electricity prices (in
2013$s/million btu)Lost Electricity
(million btu)Cost of Lost Electricity
(2013$s)PV of Cost of Lost
Electricity
[A] [B] [C] [D]
2012 29.99 293.72 8,809.70 8,809.702013 29.72 297.34 8,836.46 8,659.732014 30.02 298.58 8,961.99 8,607.102015 29.76 297.72 8,860.32 8,339.262016 30.36 294.56 8,942.76 8,248.522017 30.51 289.33 8,827.44 7,979.312018 30.32 287.19 8,706.15 7,712.282019 30.59 287.12 8,783.45 7,625.142020 31.14 286.25 8,913.60 7,583.362021 31.69 283.82 8,993.69 7,498.472022 31.90 281.46 8,979.72 7,337.092023 32.16 279.85 9,000.02 7,206.602024 32.16 278.60 8,959.12 7,030.372025 32.49 276.66 8,987.60 6,911.672026 32.57 275.31 8,968.10 6,758.742027 32.70 274.15 8,964.62 6,620.992028 32.78 272.80 8,941.40 6,471.762029 32.62 271.88 8,868.26 6,290.452030 32.59 270.89 8,827.39 6,136.232031 32.58 269.71 8,787.43 5,986.292032 32.71 268.77 8,792.71 5,870.092033 32.88 267.70 8,802.74 5,759.242034 33.00 266.57 8,797.81 5,640.902035 33.14 265.37 8,793.44 5,525.332036 33.22 264.28 8,779.51 5,406.252037 33.41 263.27 8,795.91 5,308.022038 33.75 262.32 8,853.12 5,235.702039 34.12 261.10 8,908.86 5,163.292040 34.52 259.69 8,964.38 5,091.55
TOTAL: 257,407.71 196,813.40
Average Commercial Building Lost Electricity
[A] from Tab4[B] from Tab4[C] = [A] * [B]
Pricing for PV installations of large commercial systems ($/kw) [A] 3,890Number of Hours of Energy Consumption [B] 4,380
Energy Demanded at Installation (kwh) 87,000.00Energy Demanded at Installation (kw) 19.86
Installation Costs (2014 $) [A] 77,267.12Installation Cost(2013 $) 75,721.78
Yearly Maintenance Cost ($) [C] 19.00
YearYearly Energy
Consumption by Average Building (million btu)
Yearly Energy Consumption by Average
Building (kw)
Yearly Energy Consumption Divided by Working Hours of
PV (kw/h)Total Cost (Installation +
Maintenance) Present Value of Total Costs
2012 249.61 73,152.83 16.70 75,740.78 75,740.782013 262.21 76,844.86 17.54 19.00 18.622014 268.02 78,549.39 17.93 19.00 18.252015 260.62 76,378.93 17.44 19.00 17.882016 258.32 75,707.40 17.28 19.00 17.522017 256.65 75,216.61 17.17 19.00 17.172018 255.12 74,768.90 17.07 19.00 16.832019 252.96 74,134.26 16.93 19.00 16.492020 250.05 73,281.09 16.73 19.00 16.162021 247.20 72,448.47 16.54 19.00 15.842022 245.01 71,805.87 16.39 19.00 15.522023 243.29 71,302.22 16.28 19.00 15.212024 242.00 70,922.16 16.19 19.00 14.912025 240.79 70,568.86 16.11 19.00 14.612026 239.76 70,267.16 16.04 19.00 14.322027 239.09 70,069.93 16.00 19.00 14.032028 238.83 69,992.70 15.98 19.00 13.752029 238.76 69,973.03 15.98 19.00 13.482030 238.51 69,900.94 15.96 19.00 13.212031 238.07 69,771.19 15.93 19.00 12.942032 237.44 69,586.09 15.89 75,740.78 50,565.152033 236.78 69,393.39 15.84 19.00 12.432034 236.11 69,197.57 15.80 19.00 12.182035 235.54 69,030.47 15.76 19.00 11.942036 234.99 68,869.97 15.72 19.00 11.702037 234.45 68,709.04 15.69 19.00 11.472038 233.78 68,515.46 15.64 19.00 11.242039 232.94 68,267.34 15.59 19.00 11.012040 231.98 67,985.47 15.52 19.00 10.79
TOTAL: 151,994.56 126,695.46
Cost of PV Installation
[A] U.S. Department of Energy SunShot Initiative 2014 Photovoltaic System Pricing Trends NREL/PR-6A20-62558; http://www.nrel.gov/docs/fy14osti/62558.pdf [B] We assume 12 hour work days 1million btu = 293.07103866 kW [C] http://www.nrel.gov/analysis/tech_lcoe_re_cost_est.html Other assumptions: PV system will change once every 20 years, prices will be more or less stable in the long run (U.S. Department of Energy SunShot Initiative 2014). Therefore, a second installation cost is calculated for 2032.

Present Value of Cost of Energy for an Average Commercial Building from 2012-2040 (in 2013 dollars) 125,239.39Present Value of Cost of PV system for an Average Commercial Building from 2012-2040 (in 2013 dolars) 126,695.46
Results of the Analysis

APPENDIX 2: Economic Impact of Carbon Emissions
Years 5.0% avg 3.0%avg 2.5% avg2012 9.79 31.15 48.95 932.57 29,049.66 29,049.662013 9.79 32.04 49.84 968.00 31,014.78 30,394.492014 9.79 32.93 50.73 990.87 32,629.50 31,337.372015 10.68 33.82 51.62 972.72 32,897.52 30,962.882016 10.68 34.71 53.40 958.26 33,261.24 30,679.112017 10.68 35.60 54.29 952.45 33,907.27 30,649.492018 10.68 36.49 55.18 955.91 34,881.23 30,899.272019 10.68 37.38 56.07 970.63 36,282.30 31,497.592020 10.68 38.27 57.85 978.89 37,462.22 31,871.472021 11.57 39.16 58.74 979.02 38,338.32 31,964.492022 11.57 40.05 59.63 981.69 39,316.50 32,124.442023 11.57 40.94 60.52 986.66 40,394.01 32,344.752024 12.46 41.83 61.41 992.23 41,504.80 32,569.512025 12.46 42.72 62.30 994.19 42,471.71 32,661.692026 13.35 43.61 63.19 997.86 43,516.76 32,796.052027 13.35 43.61 64.08 1,002.50 43,718.89 32,289.422028 13.35 44.50 64.97 1,006.91 44,807.29 32,431.412029 14.24 45.39 65.86 1,011.96 45,932.92 32,581.222030 14.24 46.28 67.64 1,016.47 47,042.26 32,700.732031 15.13 47.17 68.53 1,019.02 48,067.07 32,744.862032 15.13 48.06 69.42 1,022.64 49,147.90 32,811.532033 16.02 48.95 70.31 1,026.28 50,236.21 32,867.332034 16.02 49.84 71.20 1,030.65 51,367.38 32,935.262035 16.91 50.73 72.09 1,036.71 52,592.20 33,046.172036 16.91 51.62 72.98 1,042.96 53,837.84 33,152.282037 17.80 52.51 74.76 1,047.44 55,001.05 33,191.202038 17.80 53.40 75.65 1,051.90 56,171.66 33,219.662039 18.69 54.29 76.54 1,054.19 57,232.20 33,169.922040 18.69 55.18 77.43 1,056.70 58,308.61 33,117.90
TOTAL: 1,260,391.27 932,061.15
Annual SCC values: 2010 - 2050 (2013$ per metric ton of C02)
Carbon emissions (million
metric tons)
Economic worth of Carbon emissions
reduced (million $'s using 3.0% discount rate)
Present Value of Economic worth of Carbon emissions reduced (million
$'s using 3.0% discount rate)
Economic Impact of Carbon Emissions